colorado state university-pueblo is ratio, and state-of-the-art technology for an ever-changing...
TRANSCRIPT

Colorado State University-Pueblo 2012-2013
4 | P a g e
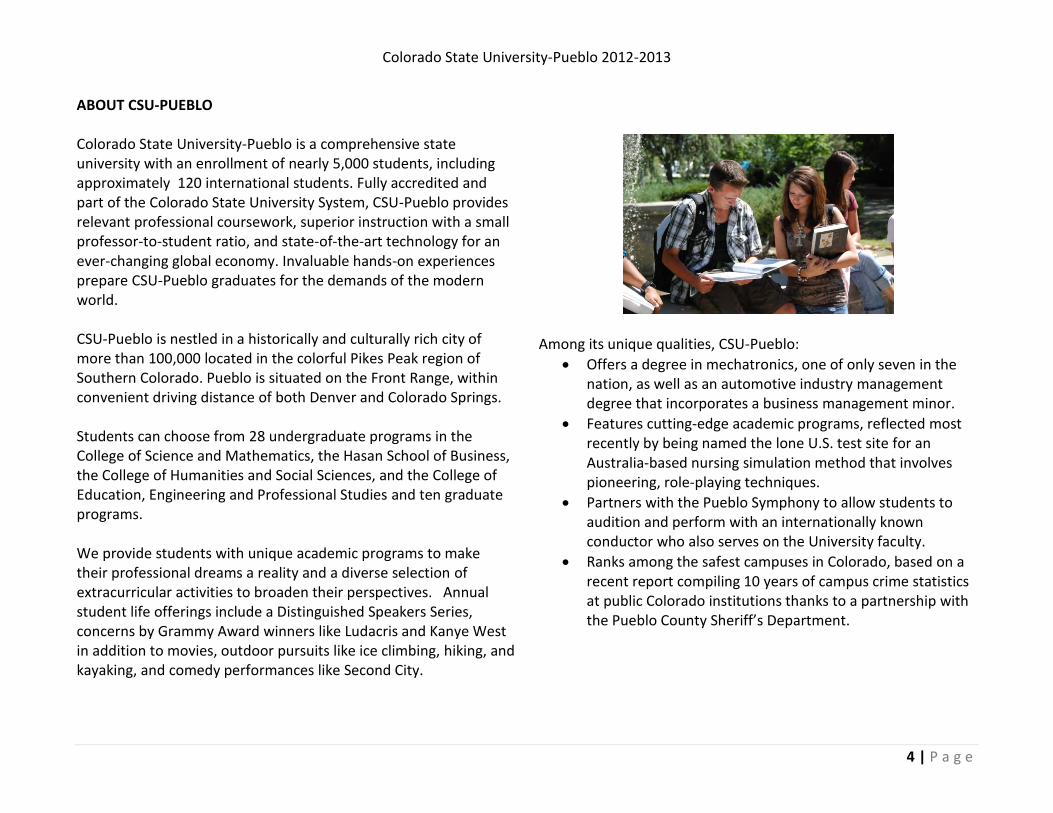
ABOUT CSU-PUEBLO Colorado State University-Pueblo is a comprehensive state university with an enrollment of nearly 5,000 students, including approximately 120 international students. Fully accredited and part of the Colorado State University System, CSU-Pueblo provides relevant professional coursework, superior instruction with a small professor-to-student ratio, and state-of-the-art technology for an ever-changing global economy. Invaluable hands-on experiences prepare CSU-Pueblo graduates for the demands of the modern world. CSU-Pueblo is nestled in a historically and culturally rich city of more than 100,000 located in the colorful Pikes Peak region of Southern Colorado. Pueblo is situated on the Front Range, within convenient driving distance of both Denver and Colorado Springs. Students can choose from 28 undergraduate programs in the College of Science and Mathematics, the Hasan School of Business, the College of Humanities and Social Sciences, and the College of Education, Engineering and Professional Studies and ten graduate programs. We provide students with unique academic programs to make their professional dreams a reality and a diverse selection of extracurricular activities to broaden their perspectives. Annual student life offerings include a Distinguished Speakers Series, concerns by Grammy Award winners like Ludacris and Kanye West in addition to movies, outdoor pursuits like ice climbing, hiking, and kayaking, and comedy performances like Second City.
Among its unique qualities, CSU-Pueblo:
Offers a degree in mechatronics, one of only seven in the nation, as well as an automotive industry management degree that incorporates a business management minor.
Features cutting-edge academic programs, reflected most recently by being named the lone U.S. test site for an Australia-based nursing simulation method that involves pioneering, role-playing techniques.
Partners with the Pueblo Symphony to allow students to audition and perform with an internationally known conductor who also serves on the University faculty.
Ranks among the safest campuses in Colorado, based on a recent report compiling 10 years of campus crime statistics at public Colorado institutions thanks to a partnership with the Pueblo County Sheriff’s Department.

Colorado State University-Pueblo 2012-2013
5 | P a g e
Offers its students unique experiences near and far, from ice climbing and kayaking adventures to alternative, service-based spring break trips, summer study abroad excursions and performance tours by the University’s Chamber and Concert Choirs.
CSU-Pueblo is proud of its athletic history and continues a tradition of excellence, competing at the NCAA Division II level as a member of the Rocky Mountain Athletic Conference. In addition to offering 16 varsity intercollegiate sports, CSU-Pueblo also has active intramural and club sports teams that allow students to get involved in campus life, meet new people, and stay in great shape.
CSU-Pueblo’s Department of Athletics has hosted three national championship events in recent years, generating more than $3 million in economic impact from nearly more than 1,500 visiting student athletes. We invite you to continue your exploration of CSU-Pueblo. Click here, http://www.colostate-pueblo.edu, to view additional information about the University.

Colorado State University-Pueblo 2012-2013
6 | P a g e
FAST FACTS On-Campus* Enrollment Fall 2012 Fall 2013 Census Undergraduate: 4,609 4,387 Graduate: 259 282 Total Enrollment: 4,868 4,669 Fast Facts
Founded in 1933
Public, four-year university
Located in Pueblo, Colorado
Campus: 20 buildings, 279 acres
President: Dr. Lesley Di Mare
Operating budget: $ 45 million (E&G)
Annual payroll: $34,551,003 million
Academic programs: 28 undergraduate, 10 graduate **
Known alumni of record: 40,000
404,760 volumes of cataloged books, bound serials, government documents, ebooks, AV materials, and microform units
Student housing capacity: 1438
Undergraduate resident full-time tuition per semester: $2,749.92
Undergraduate non-resident full-time tuition per semester: $7,908.00
Graduate resident full-time tuition: $2,114.82
Graduate non-residence full-time tuition per semester: $6,287.49
Athletics: 11 women’s and 11 men’s varsity sports
Degrees Conferred: (FY 2012-2013) § Bachelors: 889 Masters: 102 Total: 991 Full-Time Employees (FY 2012-2013)*** Full-time faculty: 196 Full-time classified: 144 Administrative/Professional staff: 164 Total: 504 Part-Time Employees (FY 2012-2013)*** Part-time faculty: 238 Part-time classified: 2 Administrative/Professional staff: 11 Graduate assistants: 43 Total: 294 Colleges College of Education, Engineering, and Professional Studies (CEEPS) College of Humanities and Social Sciences (CHASS) College of Science and Mathematics (CSM) Hasan School of Business (HSB)
* On-Campus enrollment does not include Extended Studies or continuing education programs, and is applied to the whole document. ** 10 graduate programs as of Fall 2013 *** Source: Fall 2012 HR Employee Data freeze of full and part-time employees (part-time means .5 FTE or above except includes all adjuncts) § Data taken from the Degrees Granted File (a standard CDHE file)
Colorado State University-Pueblo 2012-2013
7 | P a g e
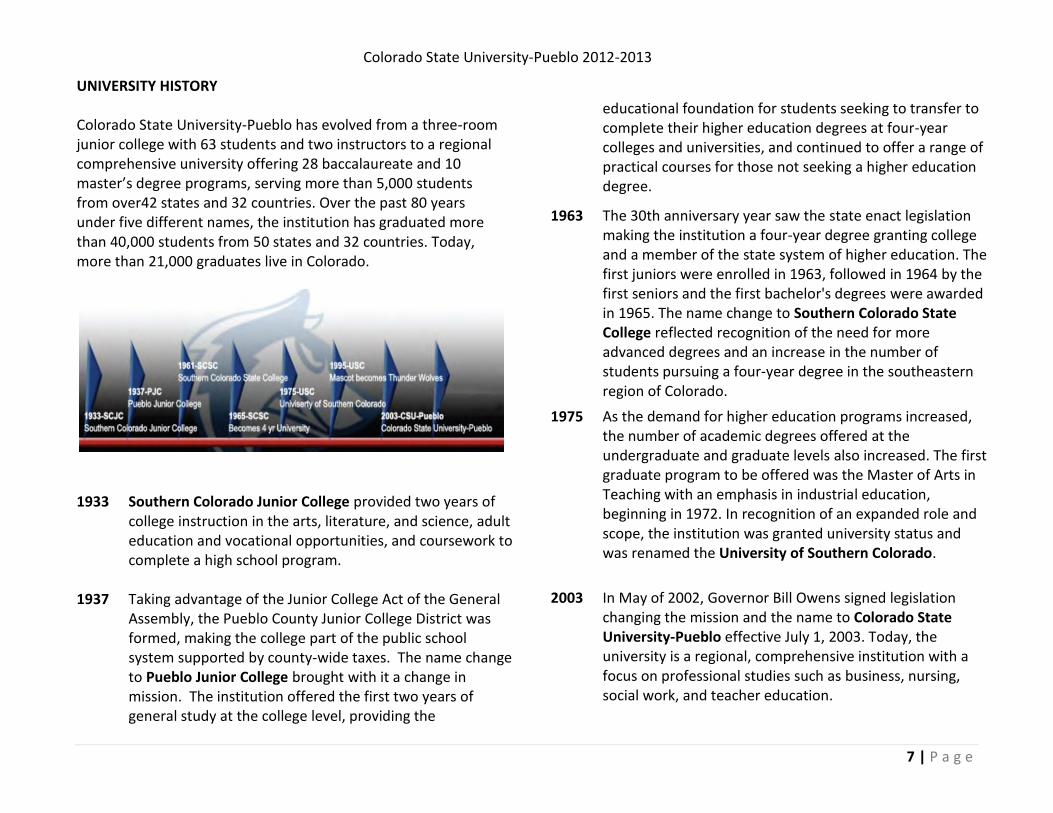
UNIVERSITY HISTORY Colorado State University-Pueblo has evolved from a three-room junior college with 63 students and two instructors to a regional comprehensive university offering 28 baccalaureate and 10 master’s degree programs, serving more than 5,000 students from over42 states and 32 countries. Over the past 80 years under five different names, the institution has graduated more than 40,000 students from 50 states and 32 countries. Today, more than 21,000 graduates live in Colorado.
1933 1937
Southern Colorado Junior College provided two years of college instruction in the arts, literature, and science, adult education and vocational opportunities, and coursework to complete a high school program. Taking advantage of the Junior College Act of the General Assembly, the Pueblo County Junior College District was formed, making the college part of the public school system supported by county-wide taxes. The name change to Pueblo Junior College brought with it a change in mission. The institution offered the first two years of general study at the college level, providing the
educational foundation for students seeking to transfer to complete their higher education degrees at four-year colleges and universities, and continued to offer a range of practical courses for those not seeking a higher education degree.
1963
The 30th anniversary year saw the state enact legislation making the institution a four-year degree granting college and a member of the state system of higher education. The first juniors were enrolled in 1963, followed in 1964 by the first seniors and the first bachelor's degrees were awarded in 1965. The name change to Southern Colorado State College reflected recognition of the need for more advanced degrees and an increase in the number of students pursuing a four-year degree in the southeastern region of Colorado.
1975
As the demand for higher education programs increased, the number of academic degrees offered at the undergraduate and graduate levels also increased. The first graduate program to be offered was the Master of Arts in Teaching with an emphasis in industrial education, beginning in 1972. In recognition of an expanded role and scope, the institution was granted university status and was renamed the University of Southern Colorado.
2003
In May of 2002, Governor Bill Owens signed legislation changing the mission and the name to Colorado State University-Pueblo effective July 1, 2003. Today, the university is a regional, comprehensive institution with a focus on professional studies such as business, nursing, social work, and teacher education.
Colorado State University-Pueblo 2012-2013
8 | P a g e
UNIVERSITY PRESIDENTS
President Lesley Di Mare
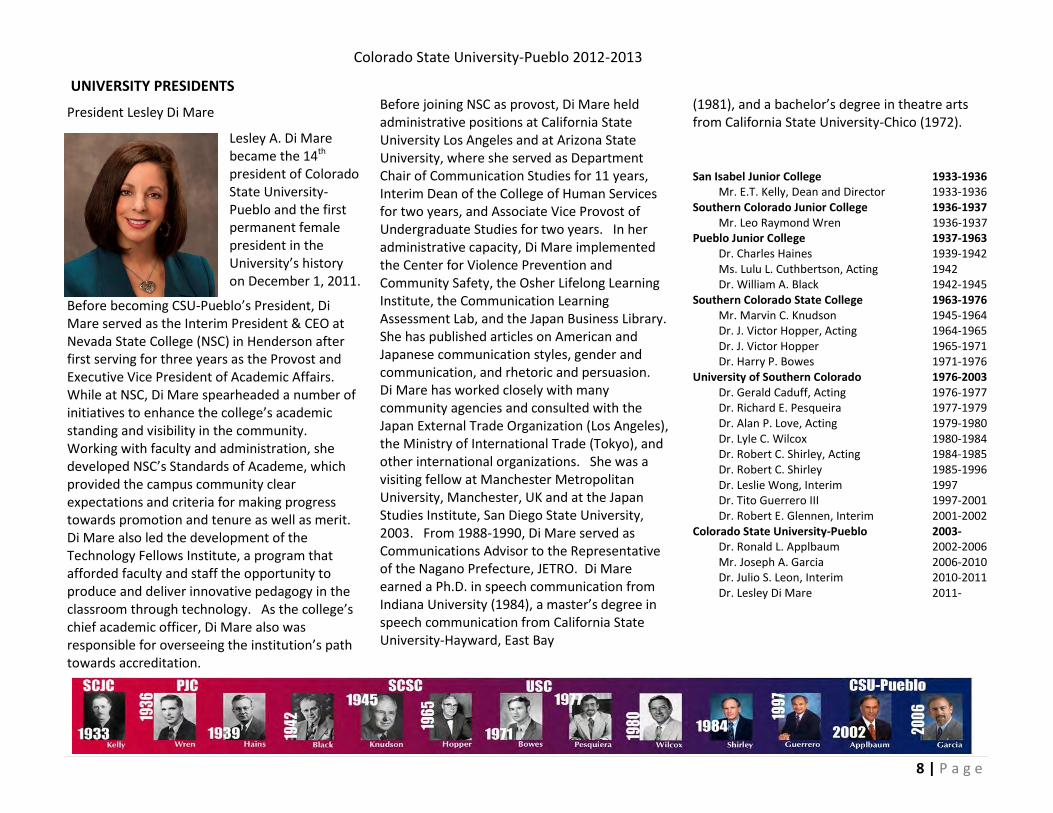
Lesley A. Di Mare became the 14th president of Colorado State University-Pueblo and the first permanent female president in the University’s history on December 1, 2011.
Before becoming CSU-Pueblo’s President, Di Mare served as the Interim President & CEO at Nevada State College (NSC) in Henderson after first serving for three years as the Provost and Executive Vice President of Academic Affairs. While at NSC, Di Mare spearheaded a number of initiatives to enhance the college’s academic standing and visibility in the community. Working with faculty and administration, she developed NSC’s Standards of Academe, which provided the campus community clear expectations and criteria for making progress towards promotion and tenure as well as merit. Di Mare also led the development of the Technology Fellows Institute, a program that afforded faculty and staff the opportunity to produce and deliver innovative pedagogy in the classroom through technology. As the college’s chief academic officer, Di Mare also was responsible for overseeing the institution’s path towards accreditation.
Before joining NSC as provost, Di Mare held administrative positions at California State University Los Angeles and at Arizona State University, where she served as Department Chair of Communication Studies for 11 years, Interim Dean of the College of Human Services for two years, and Associate Vice Provost of Undergraduate Studies for two years. In her administrative capacity, Di Mare implemented the Center for Violence Prevention and Community Safety, the Osher Lifelong Learning Institute, the Communication Learning Assessment Lab, and the Japan Business Library. She has published articles on American and Japanese communication styles, gender and communication, and rhetoric and persuasion. Di Mare has worked closely with many community agencies and consulted with the Japan External Trade Organization (Los Angeles), the Ministry of International Trade (Tokyo), and other international organizations. She was a visiting fellow at Manchester Metropolitan University, Manchester, UK and at the Japan Studies Institute, San Diego State University, 2003. From 1988-1990, Di Mare served as Communications Advisor to the Representative of the Nagano Prefecture, JETRO. Di Mare earned a Ph.D. in speech communication from Indiana University (1984), a master’s degree in speech communication from California State University-Hayward, East Bay
(1981), and a bachelor’s degree in theatre arts from California State University-Chico (1972).
San Isabel Junior College 1933-1936 Mr. E.T. Kelly, Dean and Director 1933-1936 Southern Colorado Junior College 1936-1937 Mr. Leo Raymond Wren 1936-1937 Pueblo Junior College 1937-1963 Dr. Charles Haines 1939-1942 Ms. Lulu L. Cuthbertson, Acting 1942 Dr. William A. Black 1942-1945 Southern Colorado State College 1963-1976 Mr. Marvin C. Knudson 1945-1964 Dr. J. Victor Hopper, Acting 1964-1965 Dr. J. Victor Hopper 1965-1971 Dr. Harry P. Bowes 1971-1976 University of Southern Colorado 1976-2003 Dr. Gerald Caduff, Acting 1976-1977 Dr. Richard E. Pesqueira 1977-1979 Dr. Alan P. Love, Acting 1979-1980 Dr. Lyle C. Wilcox 1980-1984 Dr. Robert C. Shirley, Acting 1984-1985 Dr. Robert C. Shirley 1985-1996 Dr. Leslie Wong, Interim 1997 Dr. Tito Guerrero III 1997-2001 Dr. Robert E. Glennen, Interim 2001-2002 Colorado State University-Pueblo 2003- Dr. Ronald L. Applbaum 2002-2006 Mr. Joseph A. Garcia 2006-2010 Dr. Julio S. Leon, Interim 2010-2011 Dr. Lesley Di Mare 2011-
Colorado State University-Pueblo 2012-2013
9 | P a g e
The Board of Governors of the Colorado State University System represents the people of Colorado, assuring effective management, accountability, and responsible leadership of all the CSU System campuses: CSU-Fort Collins, CSU-Pueblo, and CSU-Global Campus. Board members come from across the state and from many different fields, yet all share a strong commitment to quality, innovation, and student success. Faculty and students also serve on the board, representing their individual institutions. The Board of Governors sets a standard of excellence for all the campuses that carry the Colorado State name through the establishment of a bold vision coupled with ambitious stretch goals. Each campus’ learning environment focuses on a high-quality student experience that prepares graduates for fulfilling careers and rewarding lives. The Board believes that the CSU System can and should be the best in the country, and they are working to make that vision real.
www.csusystem.edu
Dorothy Horrell, Chair William Mosher, Vice Chair
Dennis Flores, Treasurer Scott Johnson, Secretary
Ed Haselden, Voting Member Mark Gustafson, Voting Member
Mary Lou Makepeace, Voting Member Demetri “Rico” Munn, Voting Member
Joseph Zimlich, Voting Member Frank Zizza, CSU-Pueblo Faculty Representative
Alexandra Bernasek, CSU-Ft. Collins Faculty Representative Ann Claesson, CSU-Global Representative
Vanessa Emerson, CSU-Pueblo Student Representative Nigel Daniels, CSU-Ft. Collins Student Representative
Jerry Purvis, CSU-Global Student Representative
Michael Martin, Chancellor Lesley Di Mare, President, CSU-Pueblo Tony Frank, President, CSU-Ft. Collins Becky Takeda-Tinker, CSU-Global
Fall 2013 BOARD of GOVERNORS of the Colorado State University System
Colorado State University-Pueblo 2012-2013
10 | P a g e
ACCREDITATION
Colorado State University-Pueblo is accredited by the Higher Learning Commission, a Commission of the North Central Association of Colleges and Schools, 30 N. LaSalle St., Suite 2400, Chicago, IL, 60602-2501, Phone (800) 621-7440.
Individual programs approved by specialized accreditation agencies include:
Commission on Accreditation of Athletic Training Education (Athletic Training)
American Chemical Society (Chemistry)
Technology Accreditation Commission of the Accreditation Board for Engineering and Technology (Civil, Electronics, and Mechanical Engineering Technology)
Engineering Accreditation Commission of Accreditation Board for Engineering and Technology (Industrial Engineering)
Colorado State Board of Education and the Teacher Education Accreditation Council (Education)
National Association of the Schools of Music (Music)
National League for Nursing Accrediting Commission (Nursing)
Council of Social Work Education (Social Work)
Association to Advance Collegiate Schools of Business (AACSB) International (Hasan School of Business)

Colorado State University-Pueblo 2012-2013
11 | P a g e
MISSION As a regional, comprehensive university, Colorado State University-Pueblo has moderately selective admission standards. The University offers a broad array of baccalaureate programs with a strong professional focus and a firm grounding in the liberal arts and sciences. The University also offers selected graduate programs. From the beginning, CSU-Pueblo has focused on being student-centered by featuring small, personalized, and participative classes, combined with competent, qualified, and supportive faculty, staff, and administrators. People of the region look to the University for career preparation and development opportunities, major undergraduate and graduate specialties, outreach services, cultural and athletic activities, and economic and business development. As the core mission of the University, student learning is CSU-Pueblo’s primary focus. This requires the faculty to be active scholars who have a lasting interest in their disciplines and in teaching and learning. The research activities improve us as teachers and expose our students to methods of inquiry. In addition, the focus on learning requires that the curriculum be dynamic and ever-changing to meet the needs and expectations of the people in our service region. CSU-Pueblo empowers its students to attain the highest standards of academic achievement, public and professional service, personal development, and ethical conduct.
CSU-Pueblo is equally committed to serving the diverse population of the region; this emphasis is reflected in the demographic characteristics of the student body. The University serves both traditional and non-traditional students, campus-based and community-based students, students from Colorado, other states, and other countries, first-year and transfer students, recent high school graduates, and students who work to support families, Caucasian students and students of color—especially Hispanic students. Because more than 25 percent of our students are Hispanic, the Federal Government has designated CSU-Pueblo a Hispanic Serving Institution. Besides reflecting our commitment to serve this critically important and rapidly-growing segment of the student population, that designation also allows the University to compete for certain federal grant funds to support its ability to better serve all students. The University also seeks to provide a rich and diverse cultural environment that allows freedom of expression within a spirit of civility and mutual respect. The public service expected of all members of our community benefits our society—local and global—and builds our sense of citizenship.

Colorado State University-Pueblo 2012-2013
12 | P a g e
LEGISLATIVE AUTHORITY The state of Colorado established and continues to recognize the University through state statutes:
There is hereby established a University at Pueblo, to be known as Colorado State University-Pueblo, which shall be a regional, comprehensive university with moderately selective admissions standards. The University shall offer a broad array of baccalaureate programs with a strong professional focus and a firm grounding in the liberal arts and sciences. The University shall also offer a limited number of graduate programs. (Colorado Statutes 23-55-101)
In April 2005, the Board of Governors of the Colorado State University System adopted a complementary, focused mission statement for the University that stresses its distinctiveness and central commitments:
Colorado State University-Pueblo is committed to excellence, setting the standard for regional comprehensive universities in teaching, research and service by providing leadership and access for its region while maintaining its commitment to diversity.
Both of these statements guide the University in all that it does.
VALUES: In addition to the new mission statement, the Colorado State University System Board of Governors adopted a new set of values to be shared by CSU-Pueblo and its sister schools, Colorado State University in Fort Collins and Colorado State University Global Campus. These values are as follows:
Be ACCOUNTABLE Promote CIVIC RESPONSIBILITY Employ a CUSTOMER FOCUS Promote FREEDOM OF EXPRESSION Demonstrate INCLUSIVENESS and DIVERSITY Encourage and reward INNOVATION Act with INTEGRITY and MUTUAL RESPECT Provide OPPORTUNITY and ACCESS Support EXCELLENCE in TEACHING and RESEARCH
CSU Board of Governors Web page: www.csusystem.edu

Colorado State University-Pueblo 2012-2013
13 | P a g e
ORGANIZATIONAL CHART – Fall 2012
Colorado State University-Pueblo 2012-2013
14 | P a g e
STRATEGIC INITIATIVES INITIATIVE ONE: ACADEMIC EXCELLENCE
Colorado State University-Pueblo is committed to continuous improvement and innovation in all aspects of academic programming, teaching and learning, scholarly and creative work, and campus and community service.
INITIATIVE TWO: STUDENT ACCESS AND SUCCESS
Colorado State University-Pueblo will strive to create an environment that promotes student academic, social, and personal development.
INITIATIVE THREE: DIVERSITY
Colorado State University-Pueblo is committed to maintaining a learning, living, and working environment that is inclusive, equitable, and respectful of
differences in people and their ideas, histories, and practices. The University will promote more sophisticated understandings of differences and challenge manifestations of closed-mindedness, incivility, stereotyping, and discrimination.
INITIATIVE FOUR: IMAGE BUILDING
Colorado State University-Pueblo will improve its perceived identity, visibility, and reputation by increasing the positive regard afforded the University by students, alumni, faculty, staff, administration, and the general public.
INITIATIVE FIVE: COMMUNITY ENGAGEMENT
Colorado State University-Pueblo will strengthen its involvement with the community through intellectual,
economic, social, and cultural collaborations that are mutually beneficial to the University and its many external constituents.
INITIATIVE SIX: RESOURCE MANAGEMENT
Colorado State University-Pueblo will enhance its human, programmatic, and capital assets by effectively and efficiently managing its human, technological, and physical resources.
INITIATIVE SEVEN: SHARED GOVERNANCE
Colorado State University-Pueblo is committed to the ideal that the governance of institutions of higher education is an activity shared by the faculty, the staff, and the administration.
Colorado State University-Pueblo 2012-2013
15 | P a g e
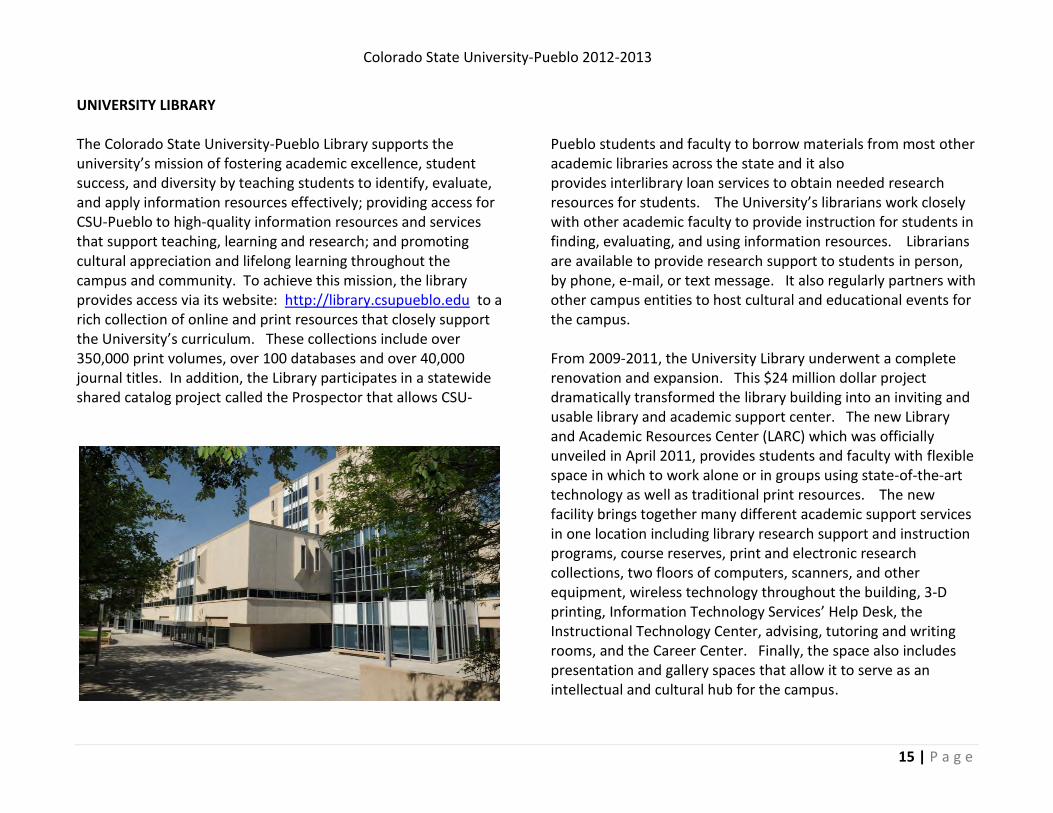
UNIVERSITY LIBRARY The Colorado State University-Pueblo Library supports the university’s mission of fostering academic excellence, student success, and diversity by teaching students to identify, evaluate, and apply information resources effectively; providing access for CSU-Pueblo to high-quality information resources and services that support teaching, learning and research; and promoting cultural appreciation and lifelong learning throughout the campus and community. To achieve this mission, the library provides access via its website: http://library.csupueblo.edu to a rich collection of online and print resources that closely support the University’s curriculum. These collections include over 350,000 print volumes, over 100 databases and over 40,000 journal titles. In addition, the Library participates in a statewide shared catalog project called the Prospector that allows CSU-
Pueblo students and faculty to borrow materials from most other academic libraries across the state and it also provides interlibrary loan services to obtain needed research resources for students. The University’s librarians work closely with other academic faculty to provide instruction for students in finding, evaluating, and using information resources. Librarians are available to provide research support to students in person, by phone, e-mail, or text message. It also regularly partners with other campus entities to host cultural and educational events for the campus. From 2009-2011, the University Library underwent a complete renovation and expansion. This $24 million dollar project dramatically transformed the library building into an inviting and usable library and academic support center. The new Library and Academic Resources Center (LARC) which was officially unveiled in April 2011, provides students and faculty with flexible space in which to work alone or in groups using state-of-the-art technology as well as traditional print resources. The new facility brings together many different academic support services in one location including library research support and instruction programs, course reserves, print and electronic research collections, two floors of computers, scanners, and other equipment, wireless technology throughout the building, 3-D printing, Information Technology Services’ Help Desk, the Instructional Technology Center, advising, tutoring and writing rooms, and the Career Center. Finally, the space also includes presentation and gallery spaces that allow it to serve as an intellectual and cultural hub for the campus.
Colorado State University-Pueblo 2012-2013
16 | P a g e
INFORMATION TECHNOLOGY
The explosion of technology at the University, both in the functions it performs and the scope of its use, has necessitated fundamental changes in the way technology is implemented and maintained. CSU-Pueblo has responded to these changes by providing the following:
Student Computers 850
Student Computer Labs 59
PC per Student ratio 1 to 6
Classrooms equipped with technology 95%
Multimedia (Smart) Classrooms 115
Blackboard Courses 70%
The following are some of the services and/or units within ITS.
Help Desk - CSU-Pueblo Information Technology Services Help Desk consists of the central call center located in Library and Academic Resource Center room 129 that takes all calls for services/information for - Computer Hardware Problems or Installation, Computer Software Problems or Installation, locations/schedule for Computer Labs, Application for E-Mail, Network, Blackboard Accounts, and AIS accounts, assistance with E-Mail, Network, Blackboard, and AIS issues, audio/visual equipment scheduling, and electronic classroom locations.
Instructional Technology Center (ITC) –
The CSU-Pueblo Instructional Technology Center offers a variety of classes about using technology in education. Classes are offered for users of Blackboard and Microsoft products. One-on-one instruction is also available. Visit ITC site (http://www.colostate-pueblo.edu/ITC ), call 549-2024 or e-mail [email protected] for a full list of services.
The ITC was established to be the centralized teaching facility that trains, assists, and provides support to all faculty for the integration of technology into the learning processes of the academic curriculum; increasing student access to learning materials, providing a richer presentation of curriculum, better accommodating diverse learning styles, enhancing student success, and encouraging the development of lifelong learning skills.
Telecommunication Services - Telecommunications Services installs, maintains, and administers all telephone equipment, voice mail, cabling, jacks, and related hardware and software, and also installs network and cable television cabling and jacks. Telecommunications Services is located in the Administration Building room 111, and can be contacted by telephone at 719.549.2566 or by e-mail at [email protected]
Colorado State University-Pueblo 2012-2013
17 | P a g e
INTERCOLLEGIATE ATHLETICS PROGRAM
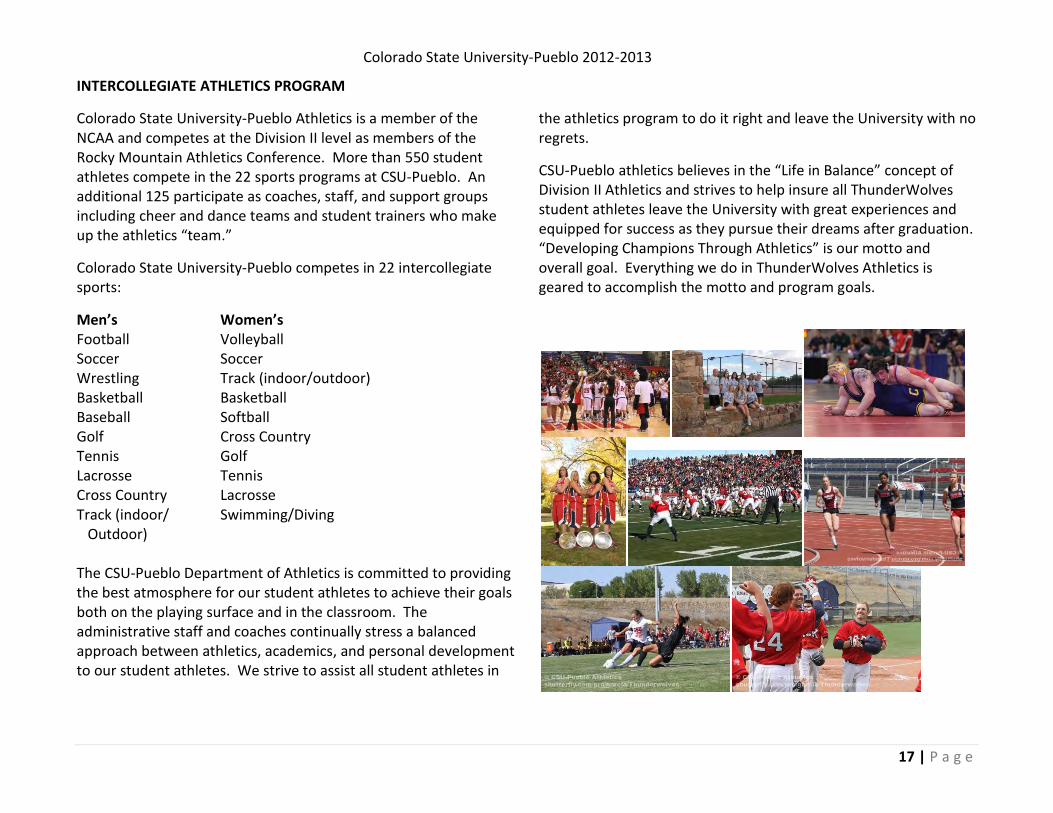
Colorado State University-Pueblo Athletics is a member of the NCAA and competes at the Division II level as members of the Rocky Mountain Athletics Conference. More than 550 student athletes compete in the 22 sports programs at CSU-Pueblo. An additional 125 participate as coaches, staff, and support groups including cheer and dance teams and student trainers who make up the athletics “team.”
Colorado State University-Pueblo competes in 22 intercollegiate sports:
Men’s Women’s Football Volleyball Soccer Soccer Wrestling Track (indoor/outdoor) Basketball Basketball Baseball Softball Golf Cross Country Tennis Golf Lacrosse Tennis Cross Country Lacrosse Track (indoor/ Swimming/Diving Outdoor) The CSU-Pueblo Department of Athletics is committed to providing the best atmosphere for our student athletes to achieve their goals both on the playing surface and in the classroom. The administrative staff and coaches continually stress a balanced approach between athletics, academics, and personal development to our student athletes. We strive to assist all student athletes in
the athletics program to do it right and leave the University with no regrets.
CSU-Pueblo athletics believes in the “Life in Balance” concept of Division II Athletics and strives to help insure all ThunderWolves student athletes leave the University with great experiences and equipped for success as they pursue their dreams after graduation. “Developing Champions Through Athletics” is our motto and overall goal. Everything we do in ThunderWolves Athletics is geared to accomplish the motto and program goals.
Colorado State University-Pueblo 2012-2013
18 | P a g e
UNIVERSITY PEER GROUP List of peers approved by CSU System Board of Governors (December 2011)
Augusta State University Augusta GA California State University, Stanislaus Turlock CA Emporia State University Emporia KS Midwestern State University Wichita Falls TX Missouri Western State University Saint Joseph MO University of Colorado at Colorado Springs Colorado Springs CO University of Michigan-Flint Flint MI University of South Carolina Upstate Spartanburg SC University of Tennessee at Martin Martin TN University of Texas at Tyler Tyler TX Washburn University Topeka KS

Colorado State University-Pueblo 2012-2013
19 | P a g e
CAMPUS MAP
Colorado State University-Pueblo 2012-2013
20 | P a g e
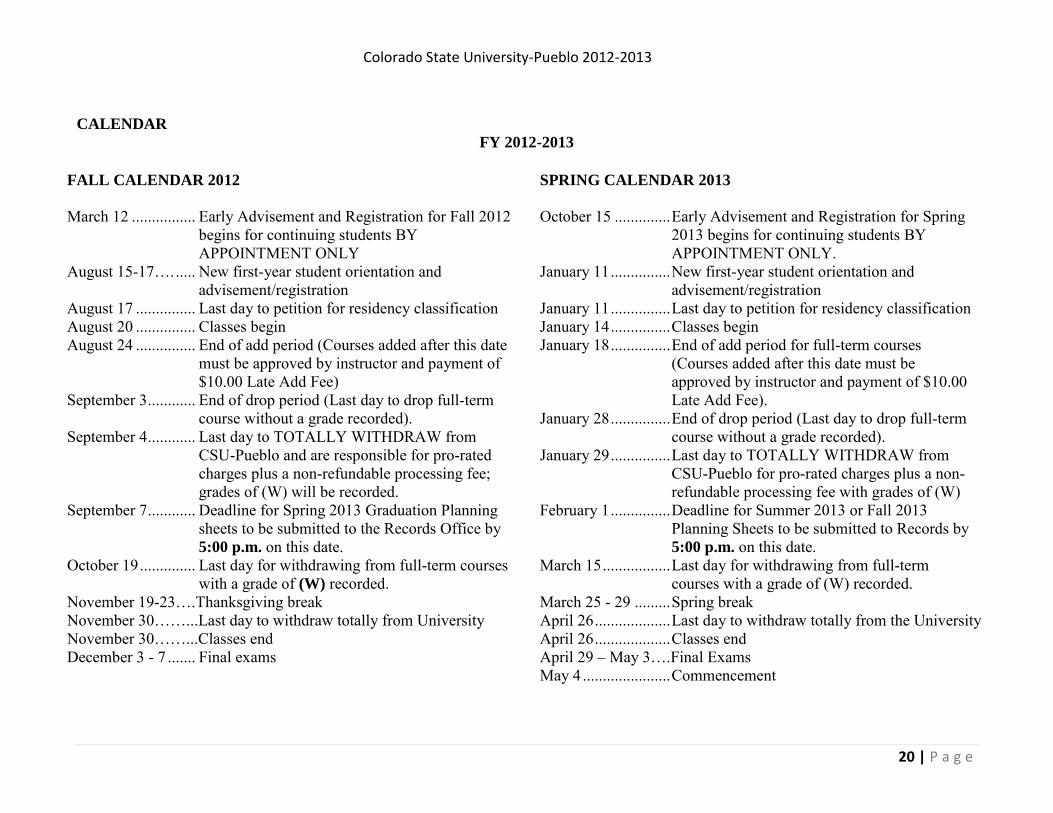
CALENDAR
FY 2012-2013
FALL CALENDAR 2012 March 12 ................ Early Advisement and Registration for Fall 2012
begins for continuing students BY APPOINTMENT ONLY
August 15-17…. ..... New first-year student orientation and advisement/registration
August 17 ............... Last day to petition for residency classification August 20 ............... Classes begin August 24 ............... End of add period (Courses added after this date
must be approved by instructor and payment of $10.00 Late Add Fee)
September 3 ............ End of drop period (Last day to drop full-term course without a grade recorded).
September 4 ............ Last day to TOTALLY WITHDRAW from CSU-Pueblo and are responsible for pro-rated charges plus a non-refundable processing fee; grades of (W) will be recorded.
September 7 ............ Deadline for Spring 2013 Graduation Planning sheets to be submitted to the Records Office by 5:00 p.m. on this date.
October 19 .............. Last day for withdrawing from full-term courses with a grade of (W) recorded.
November 19-23….Thanksgiving break November 30……...Last day to withdraw totally from University November 30……...Classes end December 3 - 7 ....... Final exams
SPRING CALENDAR 2013 October 15 .............. Early Advisement and Registration for Spring
2013 begins for continuing students BY APPOINTMENT ONLY.
January 11 ............... New first-year student orientation and advisement/registration
January 11 ............... Last day to petition for residency classification January 14 ............... Classes begin January 18 ............... End of add period for full-term courses
(Courses added after this date must be approved by instructor and payment of $10.00 Late Add Fee).
January 28 ............... End of drop period (Last day to drop full-term course without a grade recorded).
January 29 ............... Last day to TOTALLY WITHDRAW from CSU-Pueblo for pro-rated charges plus a non-refundable processing fee with grades of (W)
February 1 ............... Deadline for Summer 2013 or Fall 2013 Planning Sheets to be submitted to Records by 5:00 p.m. on this date.
March 15 ................. Last day for withdrawing from full-term courses with a grade of (W) recorded.
March 25 - 29 ......... Spring break April 26 ................... Last day to withdraw totally from the University April 26 ................... Classes end April 29 – May 3….Final Exams May 4 ...................... Commencement
Colorado State University-Pueblo 2012-2013
21 | P a g e
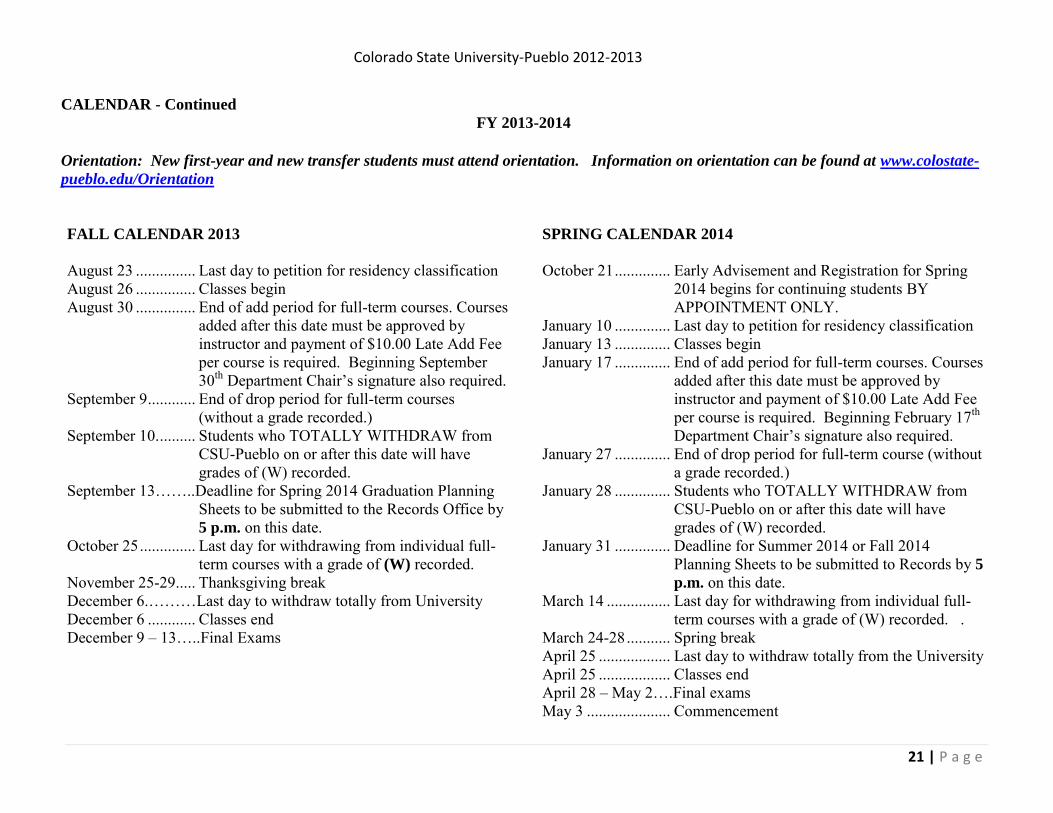
CALENDAR - Continued
FY 2013-2014
Orientation: New first-year and new transfer students must attend orientation. Information on orientation can be found at www.colostate-
pueblo.edu/Orientation FALL CALENDAR 2013 August 23 ............... Last day to petition for residency classification August 26 ............... Classes begin August 30 ............... End of add period for full-term courses. Courses
added after this date must be approved by instructor and payment of $10.00 Late Add Fee per course is required. Beginning September 30th Department Chair’s signature also required.
September 9 ............ End of drop period for full-term courses (without a grade recorded.)
September 10. ......... Students who TOTALLY WITHDRAW from CSU-Pueblo on or after this date will have grades of (W) recorded.
September 13……..Deadline for Spring 2014 Graduation Planning Sheets to be submitted to the Records Office by 5 p.m. on this date.
October 25 .............. Last day for withdrawing from individual full-term courses with a grade of (W) recorded.
November 25-29..... Thanksgiving break December 6.………Last day to withdraw totally from University December 6 ............ Classes end December 9 – 13…..Final Exams
SPRING CALENDAR 2014 October 21 .............. Early Advisement and Registration for Spring
2014 begins for continuing students BY APPOINTMENT ONLY.
January 10 .............. Last day to petition for residency classification January 13 .............. Classes begin January 17 .............. End of add period for full-term courses. Courses
added after this date must be approved by instructor and payment of $10.00 Late Add Fee per course is required. Beginning February 17th Department Chair’s signature also required.
January 27 .............. End of drop period for full-term course (without a grade recorded.)
January 28 .............. Students who TOTALLY WITHDRAW from CSU-Pueblo on or after this date will have grades of (W) recorded.
January 31 .............. Deadline for Summer 2014 or Fall 2014 Planning Sheets to be submitted to Records by 5
p.m. on this date. March 14 ................ Last day for withdrawing from individual full-
term courses with a grade of (W) recorded. . March 24-28 ........... Spring break April 25 .................. Last day to withdraw totally from the University April 25 .................. Classes end April 28 – May 2….Final exams May 3 ..................... Commencement

Colorado State University-Pueblo 2012-2013
22 | P a g e
COUNTY DEMOGRAPHICS
HOUSEHOLDS AND FAMILIES: Pueblo County had 62,000 households in 2009-2011 with an average of 2.5 people.
Families made up 64 percent of the households in Pueblo County. This figure includes both married-couple families (45 percent) and other families (19 percent). Nonfamily households made up 36 percent of all households in Pueblo County. Most of the nonfamily households were people living alone, but some were composed of people living in households in which no one was related to the householder.
CCUPATIONS AND TYPE OF EMPLOYER: Among the most common occupations were management, professional, and related occupations, 30.6 percent; sales and office occupations, 26.8 percent; service occupations, 21.9 percent; construction, extraction, maintenance and repair occupations, 9.6 percent; and production, transportation, and material moving occupations, 11
percent. Seventy-six percent of the people employed were private wage and salary workers; 18 percent were federal, state, or local government workers; and 5 percent were self-employed in own not incorporated business workers.
TRAVEL TO WORK: Eighty percent of Pueblo County workers drove to work alone in 2009-2011, 12 percent carpooled, 0.7 percent took public transportation, and two percent used other means. The remaining four percent worked at home. Those who commuted to work took an average of 21 minutes to get work.
INCOME: During 2009-2011 the median income of households in Pueblo County was $40,143. Seventy-one percent of the households received earnings and 21 percent received retirement income other than Social Security. Thirty three percent of the households received Social Security. The average income from Social Security was $14,984. These income sources are not mutually exclusive; that is, some households received income from more than one source.
POPULATION OF PUEBLO COUNTY: In 2009-2011, Pueblo County had a total population of 159,000: 81,000 (51%) females and 78,000 (49%) males. The median age was 38.8 years. Twenty-four percent of the population was under 18 years, and 15 percent was 65 years and older.
For people reporting one race alone, 84 percent were white; two percent were Black or African American; two percent American Indian and Alaska Native; one percent Asian; less than 0.5 percent Native Hawaiian and Other Pacific Islander, and ten
6.0%
30.0%
19.0%
45.0%
Other non-family households
People living alone
Other families
Married-couple families
2009-2011 Types of Households in Pueblo County
Colorado State University-Pueblo 2012-2013
23 | P a g e
percent other race. Four percent reported two or more races. Forty-one percent of the people in Pueblo County were Hispanic. Fifty-four percent of the people in Pueblo County were white, non-Hispanic. (People of Hispanic origin may be of any race.)
HOUSING COSTS: In 2009-2011, the median monthly housing costs for mortgaged owners was $1,171, non-mortgaged owners $355, and renters $698. Thirty-seven percent of owners with mortgages, 13 percent of owners without mortgages, and 57 percent of renters in Pueblo County spent 30 percent or more of household income on housing.
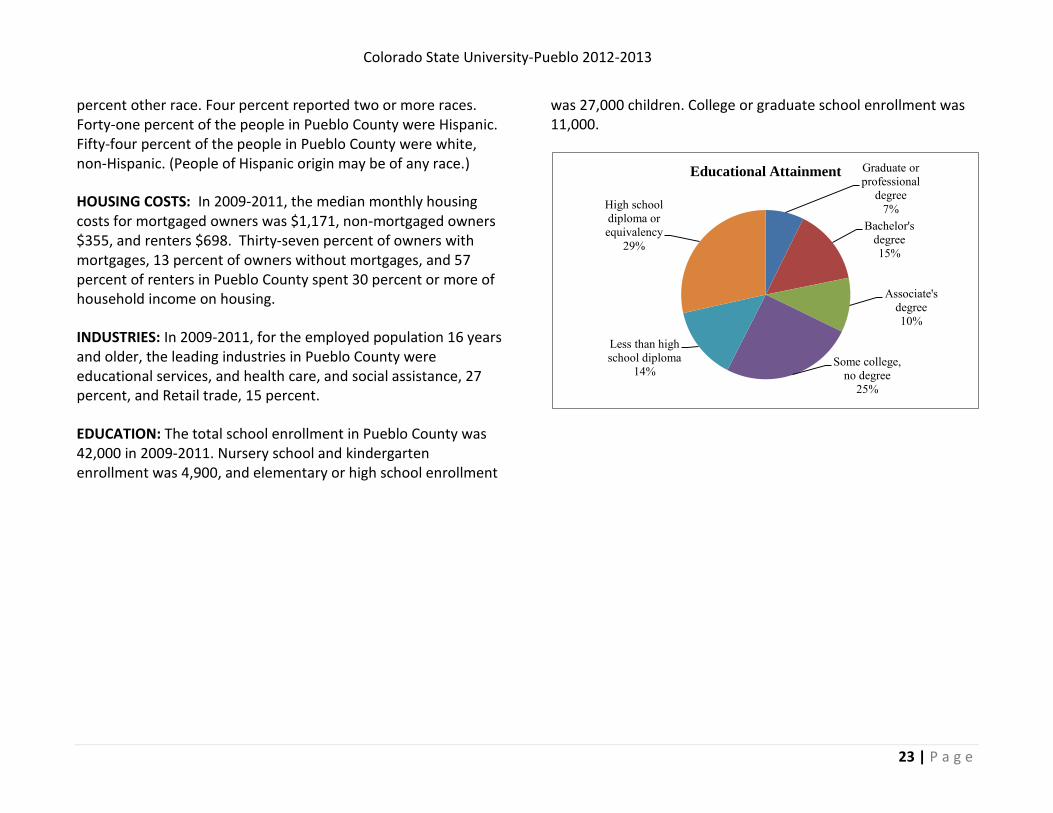
INDUSTRIES: In 2009-2011, for the employed population 16 years and older, the leading industries in Pueblo County were educational services, and health care, and social assistance, 27 percent, and Retail trade, 15 percent.
EDUCATION: The total school enrollment in Pueblo County was 42,000 in 2009-2011. Nursery school and kindergarten enrollment was 4,900, and elementary or high school enrollment
was 27,000 children. College or graduate school enrollment was 11,000.
Graduate or professional
degree 7%
Bachelor's degree 15%
Associate's degree 10%
Some college, no degree
25%
Less than high school diploma
14%
High school diploma or equivalency
29%
Educational Attainment
Colorado State University-Pueblo 2012-13
25 | P a g e
ADMISSIONS REQUIREMENTS
Colorado State University-Pueblo’s admission process supports the
enrollment goals of the University and assures access to qualified
applicants. This broad statement allows for the accommodation of
four types of student:
FRESHMEN
CSU-Pueblo requires a minimum admission index score of 86 to be
considered for admission. The index is a combination of high school
grade-point average and ACT composite or SAT combined scores. A
minimum high school grade-point average of 2.00 is also required.
In addition, all freshmen must complete a prescribed minimum high
school curriculum.
Students who apply on the basis of the General Education
Development (GED) test must have the agency issuing the GED test
forward the test scores (not the certificate) to the Office of
Admissions. Applicants who have completed their secondary
education through alternative options such as home schooling
should submit documentation of that education (i.e. transcript,
portfolio, narrative statements of accomplishment, etc.).
Consideration for admission will be similar to that for applicants
from traditional high school programs, but additional emphasis will
be placed on scores obtained on standardized examinations.
Graduates of Colorado high schools participating in the standards
based admissions project will be considered according to the current
state guidelines for that project.
TRANSFER STUDENTS
Students who have earned at least 13 credits at other colleges or
universities and are seeking admission to CSU-Pueblo are considered
transfer students. An applicant with less than 13 transferable
college semester credit hours must meet the first-time freshmen
standards. This includes international applicants.
Transfer students must be in good standing at the institution last
attended and have at least a 2.300 cumulative grade-point average.
If not, the records will be reviewed and a recommendation on
admission will be made by the admissions office.
INTERNATIONAL STUDENTS
Students who are residents of another country and are in possession
of, or seeking an F-1 or J-1 student visa, are considered international
students. All international applicants must submit transcripts in
both the native language and an official English translation, official
TOEFL or IELTS scores verifying English proficiency, a certified
financial statement showing the availability of resources required to
study in the U.S., along with financial sponsorship, if applicable, for
admission purposes. The Center for International Programs is the
primary contact for such prospective students.
GRADUATE STUDENTS
The Dean of Graduate Studies, in conjunction with the appropriate
academic department, determines requirements for admission to
each graduate program. Generally, a baccalaureate degree, an
undergraduate grade point average of at least 3.0 and an
appropriate graduate examination (GRE, GMAT, etc.) are required. If
the applicant is an international student, all requirements listed in
paragraph 3 above must be supplied to the Center for International
Programs. Currently, graduate programs of study are offered in
biology, biochemistry, chemistry, business administration, education,
engineering, English, history, and nursing.
Colorado State University-Pueblo 2012-13
26 | P a g e
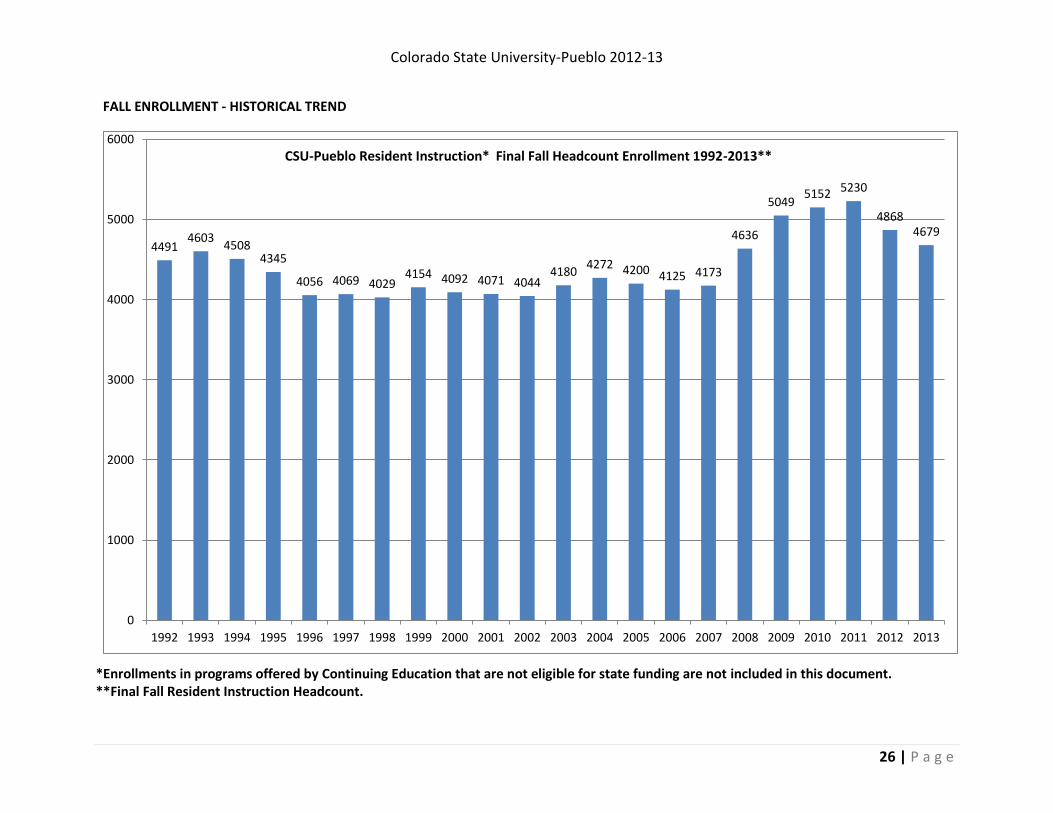
FALL ENROLLMENT - HISTORICAL TREND
* Enrollments in programs offered by Continuing Education that are not eligible for state funding are not included in this document.
*Enrollments in programs offered by Continuing Education that are not eligible for state funding are not included in this document.
**Final Fall Resident Instruction Headcount.
4491 4603
4508 4345
4056 4069 4029 4154 4092 4071 4044
4180 4272 4200 4125 4173
4636
5049 5152 5230
4868 4679
0
1000
2000
3000
4000
5000
6000
1992 1993 1994 1995 1996 1997 1998 1999 2000 2001 2002 2003 2004 2005 2006 2007 2008 2009 2010 2011 2012 2013
CSU-Pueblo Resident Instruction* Final Fall Headcount Enrollment 1992-2013**
Colorado State University-Pueblo 2012-13
27 | P a g e
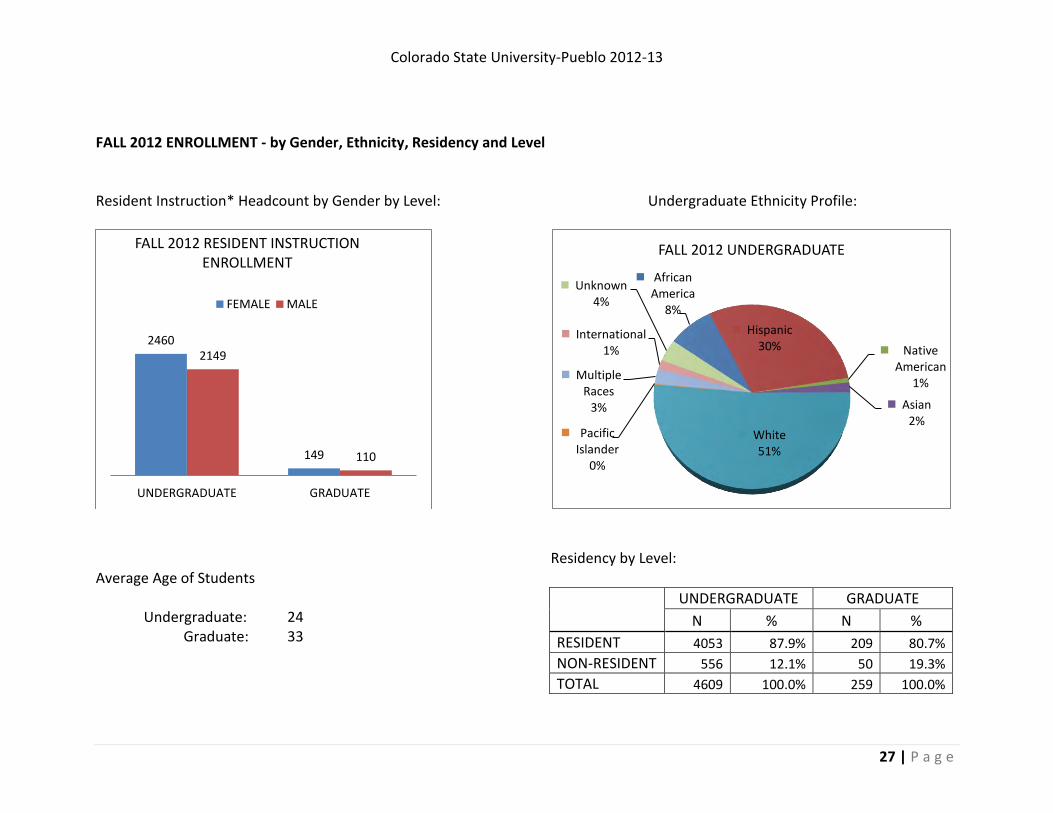
FALL 2012 ENROLLMENT - by Gender, Ethnicity, Residency and Level Resident Instruction* Headcount by Gender by Level: Undergraduate Ethnicity Profile:
Average Age of Students
Undergraduate: 24
Graduate: 33
Residency by Level:
UNDERGRADUATE GRADUATE
N % N %
RESIDENT 4053 87.9% 209 80.7%
NON-RESIDENT 556 12.1% 50 19.3%
TOTAL 4609 100.0% 259 100.0%
2460
149
2149
110
UNDERGRADUATE GRADUATE
FALL 2012 RESIDENT INSTRUCTION ENROLLMENT
FEMALE MALE
African America
8%
Hispanic 30% Native
American 1%
Asian 2%
White 51%
Pacific Islander
0%
Multiple Races
3%
International 1%
Unknown 4%
FALL 2012 UNDERGRADUATE

Colorado State University-Pueblo 2012-13
28 | P a g e
FALL 2012 ENROLLED STUDENT BY STATE*
*Final Fall Resident Instruction Data File

Colorado State University-Pueblo 2012-13
29 | P a g e
FALL 2012 ENROLLED COLORADO RESIDENTS BY COUNTY*
*Final Fall Resident Instruction Data File
Colorado State University-Pueblo 2012-13
30 | P a g e
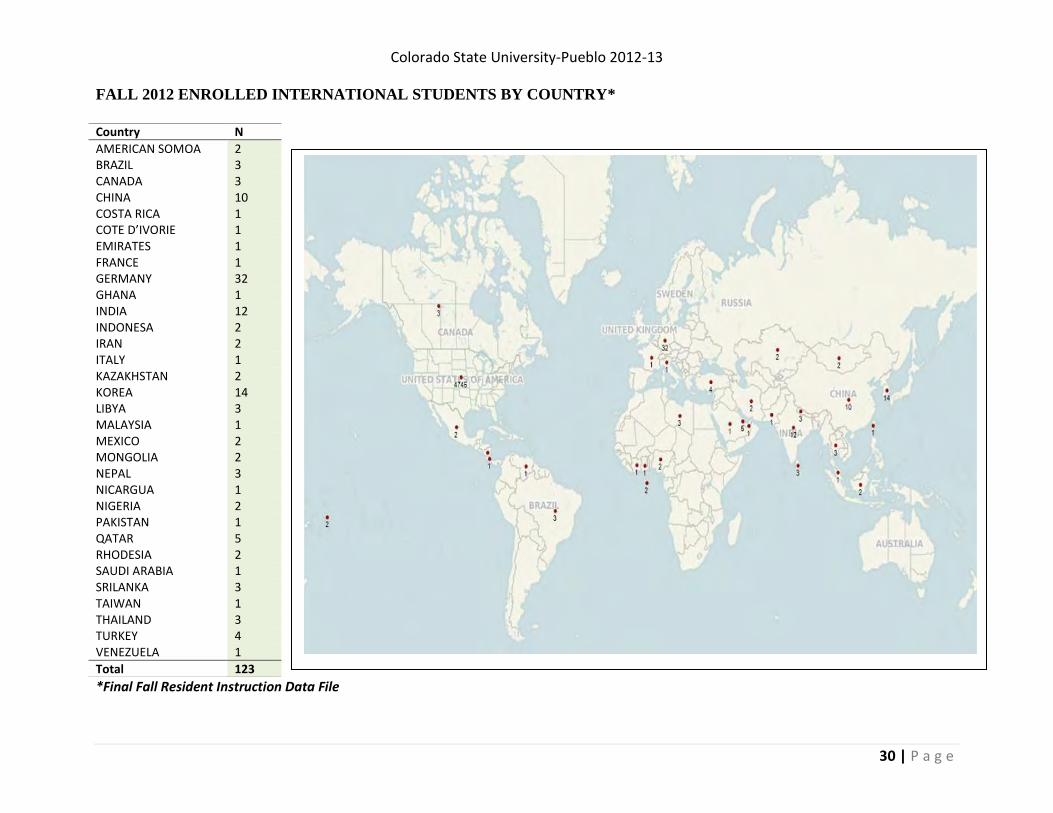
FALL 2012 ENROLLED INTERNATIONAL STUDENTS BY COUNTRY*
*Final Fall Resident Instruction Data File
Country N
AMERICAN SOMOA 2 BRAZIL 3 CANADA 3 CHINA 10 COSTA RICA 1 COTE D’IVORIE 1 EMIRATES 1 FRANCE 1 GERMANY 32 GHANA 1 INDIA 12 INDONESA 2 IRAN 2 ITALY 1 KAZAKHSTAN 2 KOREA 14 LIBYA 3 MALAYSIA 1 MEXICO 2 MONGOLIA 2 NEPAL 3 NICARGUA 1 NIGERIA 2 PAKISTAN 1 QATAR 5 RHODESIA 2 SAUDI ARABIA 1 SRILANKA 3 TAIWAN 1 THAILAND 3 TURKEY 4 VENEZUELA 1
Total 123
Colorado State University-Pueblo 2012-13
31 | P a g e
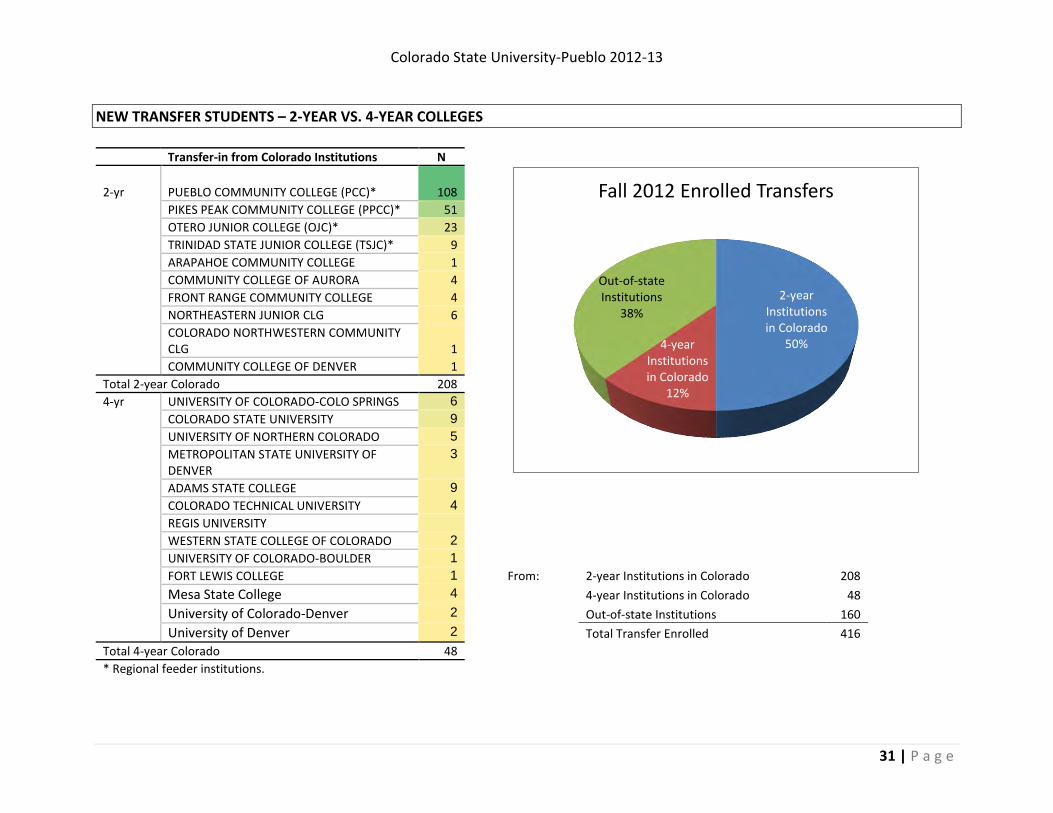
NEW TRANSFER STUDENTS – 2-YEAR VS. 4-YEAR COLLEGES
Transfer-in from Colorado Institutions N
2-yr PUEBLO COMMUNITY COLLEGE (PCC)* 108
PIKES PEAK COMMUNITY COLLEGE (PPCC)* 51
OTERO JUNIOR COLLEGE (OJC)* 23
TRINIDAD STATE JUNIOR COLLEGE (TSJC)* 9
ARAPAHOE COMMUNITY COLLEGE 1
COMMUNITY COLLEGE OF AURORA 4
FRONT RANGE COMMUNITY COLLEGE 4
NORTHEASTERN JUNIOR CLG 6
COLORADO NORTHWESTERN COMMUNITY CLG 1
COMMUNITY COLLEGE OF DENVER 1 Total 2-year Colorado 208 4-yr UNIVERSITY OF COLORADO-COLO SPRINGS 6
COLORADO STATE UNIVERSITY 9
UNIVERSITY OF NORTHERN COLORADO 5
METROPOLITAN STATE UNIVERSITY OF DENVER
3
ADAMS STATE COLLEGE 9
COLORADO TECHNICAL UNIVERSITY 4
REGIS UNIVERSITY
WESTERN STATE COLLEGE OF COLORADO 2
UNIVERSITY OF COLORADO-BOULDER 1
FORT LEWIS COLLEGE 1
From: 2-year Institutions in Colorado 208
Mesa State College 4
4-year Institutions in Colorado 48
University of Colorado-Denver 2
Out-of-state Institutions 160
University of Denver 2
Total Transfer Enrolled 416
Total 4-year Colorado 48 * Regional feeder institutions.
2-year Institutions in Colorado
50% 4-year Institutions in Colorado
12%
Out-of-state Institutions
38%
Fall 2012 Enrolled Transfers
Colorado State University-Pueblo 2012-2013
32 | P a g e
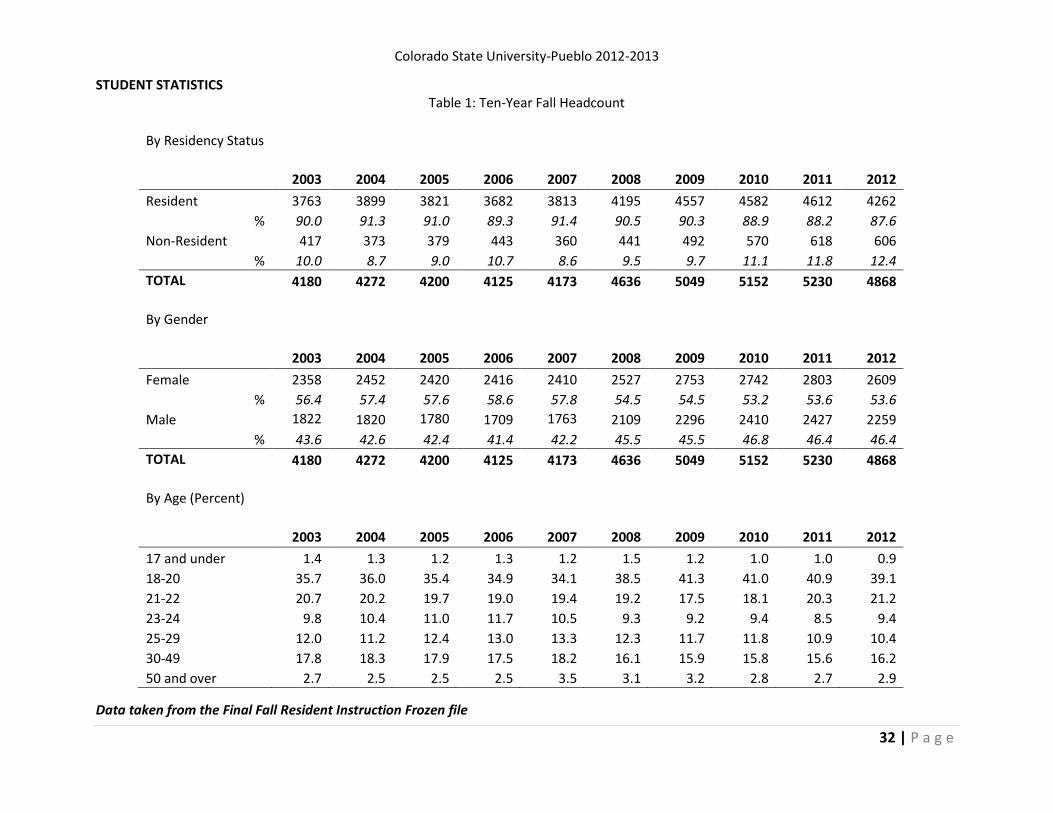
STUDENT STATISTICS Table 1: Ten-Year Fall Headcount
By Residency Status
2003 2004 2005 2006 2007 2008 2009 2010 2011 2012
Resident 3763 3899 3821 3682 3813 4195 4557 4582 4612 4262
% 90.0 91.3 91.0 89.3 91.4 90.5 90.3 88.9 88.2 87.6
Non-Resident 417 373 379 443 360 441 492 570 618 606
% 10.0 8.7 9.0 10.7 8.6 9.5 9.7 11.1 11.8 12.4
TOTAL 4180 4272 4200 4125 4173 4636 5049 5152 5230 4868
By Gender
2003 2004 2005 2006 2007 2008 2009 2010 2011 2012
Female 2358 2452 2420 2416 2410 2527 2753 2742 2803 2609
% 56.4 57.4 57.6 58.6 57.8 54.5 54.5 53.2 53.6 53.6
Male 1822 1820 1780 1709 1763 2109 2296 2410 2427 2259
% 43.6 42.6 42.4 41.4 42.2 45.5 45.5 46.8 46.4 46.4
TOTAL 4180 4272 4200 4125 4173 4636 5049 5152 5230 4868
By Age (Percent)
2003 2004 2005 2006 2007 2008 2009 2010 2011 2012
17 and under 1.4 1.3 1.2 1.3 1.2 1.5 1.2 1.0 1.0 0.9
18-20 35.7 36.0 35.4 34.9 34.1 38.5 41.3 41.0 40.9 39.1
21-22 20.7 20.2 19.7 19.0 19.4 19.2 17.5 18.1 20.3 21.2
23-24 9.8 10.4 11.0 11.7 10.5 9.3 9.2 9.4 8.5 9.4
25-29 12.0 11.2 12.4 13.0 13.3 12.3 11.7 11.8 10.9 10.4
30-49 17.8 18.3 17.9 17.5 18.2 16.1 15.9 15.8 15.6 16.2
50 and over 2.7 2.5 2.5 2.5 3.5 3.1 3.2 2.8 2.7 2.9
Data taken from the Final Fall Resident Instruction Frozen file

Colorado State University-Pueblo 2012-2013
33 | P a g e
STUDENT STATISTICS Table 1: Ten-Year Fall Headcount (Continued)
By Ethnic Status
2003 2004 2005 2006 2007 2008 2009 2010 2011 2012
Native American 82 80 77 78 86 91 79 65 53 39
% 2.0 1.9 1.8 1.9 2.1 2.0 1.6 1.3 1.0 0.8
Black, non-Hispanic 162 169 177 184 218 364 435 454 423 370
% 3.9 4.0 4.2 4.5 5.2 7.9 8.6 8.8 8.1 7.6
Asian or Pacific Isld. 94 101 94 103 102 116 126
% 2.2 2.4 2.2 2.5 2.4 2.5 2.5
Asian American 105 103 82
%
2.0 2.0 1.7
Pacific Islander 2 4 6
%
0.0 0.1 0.1
Hispanic 1156 1154 1068 998 1054 1135 1233 1290 1448 1417
% 27.7 27.0 25.4 24.2 25.3 24.5 24.4 25.0 27.7 29.1
White 2426 2494 2440 2339 2323 2481 2802 2811 2773 2513
% 58.0 58.4 58.1 56.7 55.7 53.5 55.5 54.6 53.0 51.6
Multiple 37 96 125
%
0.7 1.8 2.6
International 138 85 100 169 122 126 100 129 111 122
% 3.3 2.0 2.4 4.1 2.9 2.7 2.0 2.5 2.1 2.5
Unknown 122 189 244 254 268 323 274 259 219 194
% 2.9 4.4 5.8 6.2 6.4 7.0 5.4 5.0 4.2 4.0
TOTAL 4180 4272 4200 4125 4173 4636 5049 5152 5230 4868 Data taken from the Final Fall Resident Instruction Frozen file

Colorado State University-Pueblo 2012-2013
34 | P a g e
STUDENT STATISTICS Table 1: Ten-Year Fall Headcount (Continued)
By Student Level
2003 2004 2005 2006 2007 2008 2009 2010 2011 2012
Freshman 1084 1123 1076 989 1032 1512 1674 1533 1429 1290
Sophomore 809 784 776 761 679 744 864 1003 1004 882
Junior 820 897 846 836 809 780 891 930 1089 1009
Senior 1031 1019 1081 1076 1148 1038 1009 1078 1170 1174
Non-Degree 182 167 102 130 145 120 104 86 83 98
Degree Plus 125 156 160 159 138 176 184 187 186 156
Graduate 129 126 159 174 222 266 323 335 269 259
TOTAL 4180 4272 4200 4125 4173 4636 5049 5152 5230 4868
By Fall Admit Type
2003 2004 2005 2006 2007 2008 2009 2010 2011 2012
New Freshman* 704 760 682 625 628 1031 1047 945 994 880
New Graduate 58 45 75 76 122 98 149 105 58 93
New Transfer 372 386 404 386 398 458 493 471 449 416
Readmit 103 95 95 83 102 117 119 99 95 76
Continuing 2799 2853 2856 2835 2785 2829 3150 3456 3566 3321
New Sr. Citizens 16 9 4 1 5 14 16 9 10 22
Other New Non-Degree 128 124 84 119 133 89 75 67 58 60
TOTAL 4180 4272 4200 4125 4173 4636 5049 5152 5230 4868
Data taken from the Final Fall Resident Instruction Frozen file *New freshmen listed do not include freshmen who started in previous summer

Colorado State University-Pueblo 2012-2013
35 | P a g e
STUDENT STATISTICS Table 2: Fall 2012 Headcount by Major by Level
COLLEGE of EDUCATION, ENGINEERING and PROFESSIONAL STUDIES (CEEPS)
MAJOR 1 Freshman Sophomore Junior Senior Other Grad Total
Athletic Training (BS) 34 21 17 17
89
Automotive Industry Management (BS) 24 12 20 20
76
Civil Engineering Technology (BSCET) 21 11 12 18 1
63
Construction Management (BS) 7 6 6 6
25
Education (M.Ed.)
44 44
Engineering 51 33 31 28 4 4 151
Exercise Science, Hlth Prom & Rec (BS) 67 69 93 116 6
351
Industrial & Systems Engineering (MS)
15 15
Industrial Engineering (BSIEN) 6 4 10 6 3
29
Nursing (BSN)
2 22 81 36 4 145
Nursing (MS)
69 69
Pre-Engineering* 18 2 1
21
Pre-Nursing* 116 86 39 12 14
267
CEEPS Totals 344 246 251 304 64 136 1345
HASAN SCHOOL of BUSINESS (HSB)
MAJOR 1 Freshman Sophomore Junior Senior Other Grad Total
Pre-Business* 145 86 70 16 6 323
Accounting (BSBA) 5 6 19 36 3 69
Business Management (BSBA) 19 22 51 111 2 205
Computer Information Systems (BS) 39 24 39 32 4 138
Economics (BSBA) 1 1 3 15 1 21
Business Administration (MBA) 79 79
HSB Totals 209 139 182 210 16 79 835
*A program, but not a major

Colorado State University-Pueblo 2012-2013
36 | P a g e
STUDENT STATISTICS Table 2: Fall 2012 Headcount by Major by Level (Continued)
COLLEGE of SCIENCE and MATHEMATICS (CSM)
MAJOR 1 Freshman Sophomore Junior Senior Other Grad Total
Applied Natural Science (MSANS) 2 2
Biology (BS, MS) 133 68 66 71 12 8 358
Biochemistry (MS) 2 2
Chemistry (BS) 19 16 13 18 3 3 72
Mathematics (BA, BS) 10 7 12 13 4 46
Physics (BS) 5 5 2 7 19
CSM Totals 167 96 93 109 19 15 499
COLLEGE of HUMANITES and SOCIAL SCIENCES (CHASS)
MAJOR 1 Freshman Sophomore Junior Senior Other Grad Total
Art (BA, BS) 24 16 38 45 1 124
English (BA) 33 24 48 39 6 150
Foreign Language Spanish (BA) 15 14 14 13 3 59
History (BA, MA) 23 15 29 27 3 28 125
Liberal Studies (BS) 36 37 29 84 18 204
Mass Communication (BA, BS) 64 58 48 67 2 239
Music (BA) 15 25 20 29 2 91
Political Science (BA, BS) 27 11 12 13 63
Psychology (BA, BS) 62 55 70 60 3 250
Social Work (BSW) 24 40 61 59 5 189
Sociology (BA, BS) 79 78 110 112 8 387
CHASS Totals 402 373 479 548 51 28 1881
CSU-Pueblo Students - Enrollment in Consortium Master's Degree Program with CSU-Ft. Collins (Not CSU-Pueblo Major)
English (MA)
1 1
UNDECIDED AND UNCLASSIFIED
Undeclared/Unclassified 168 28 4 3 104 307
UNIVERSITY TOTALS 1290 882 1009 1174 254 259 4868
Data taken from the Final Fall Resident Instruction Frozen file
Colorado State University-Pueblo 2012-2013
37 | P a g e
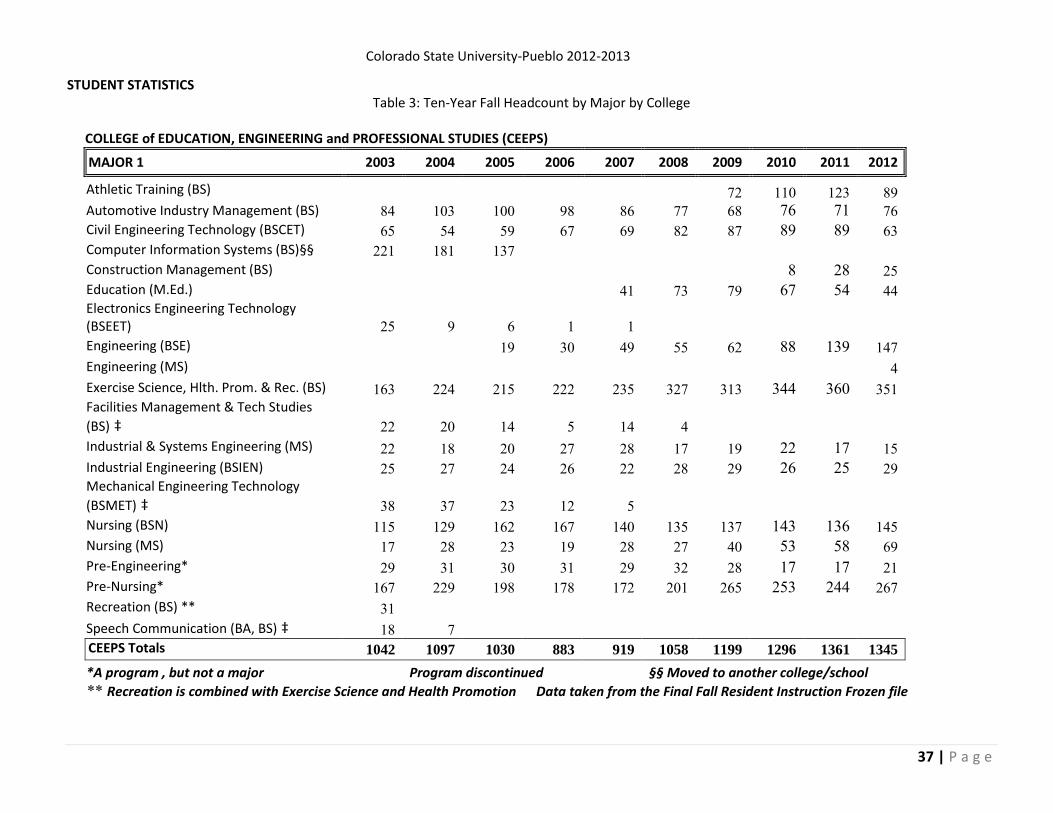
STUDENT STATISTICS Table 3: Ten-Year Fall Headcount by Major by College
COLLEGE of EDUCATION, ENGINEERING and PROFESSIONAL STUDIES (CEEPS)
MAJOR 1 2003 2004 2005 2006 2007 2008 2009 2010 2011 2012
Athletic Training (BS)
72 110 123 89
Automotive Industry Management (BS) 84 103 100 98 86 77 68 76 71 76 Civil Engineering Technology (BSCET) 65 54 59 67 69 82 87 89 89 63 Computer Information Systems (BS)§§ 221 181 137
Construction Management (BS)
8 28 25 Education (M.Ed.)
41 73 79 67 54 44
Electronics Engineering Technology (BSEET) 25 9 6 1 1
Engineering (BSE)
19 30 49 55 62 88 139 147
Engineering (MS) 4 Exercise Science, Hlth. Prom. & Rec. (BS) 163 224 215 222 235 327 313 344 360 351 Facilities Management & Tech Studies
(BS) ‡ 22 20 14 5 14 4 Industrial & Systems Engineering (MS) 22 18 20 27 28 17 19 22 17 15
Industrial Engineering (BSIEN) 25 27 24 26 22 28 29 26 25 29 Mechanical Engineering Technology
(BSMET) ‡ 38 37 23 12 5 Nursing (BSN) 115 129 162 167 140 135 137 143 136 145
Nursing (MS) 17 28 23 19 28 27 40 53 58 69 Pre-Engineering* 29 31 30 31 29 32 28 17 17 21 Pre-Nursing* 167 229 198 178 172 201 265 253 244 267 Recreation (BS) ** 31
Speech Communication (BA, BS) ‡ 18 7 CEEPS Totals 1042 1097 1030 883 919 1058 1199 1296 1361 1345
*A program , but not a major
Program discontinued
§§ Moved to another college/school
** Recreation is combined with Exercise Science and Health Promotion Data taken from the Final Fall Resident Instruction Frozen file
Colorado State University-Pueblo 2012-2013
38 | P a g e
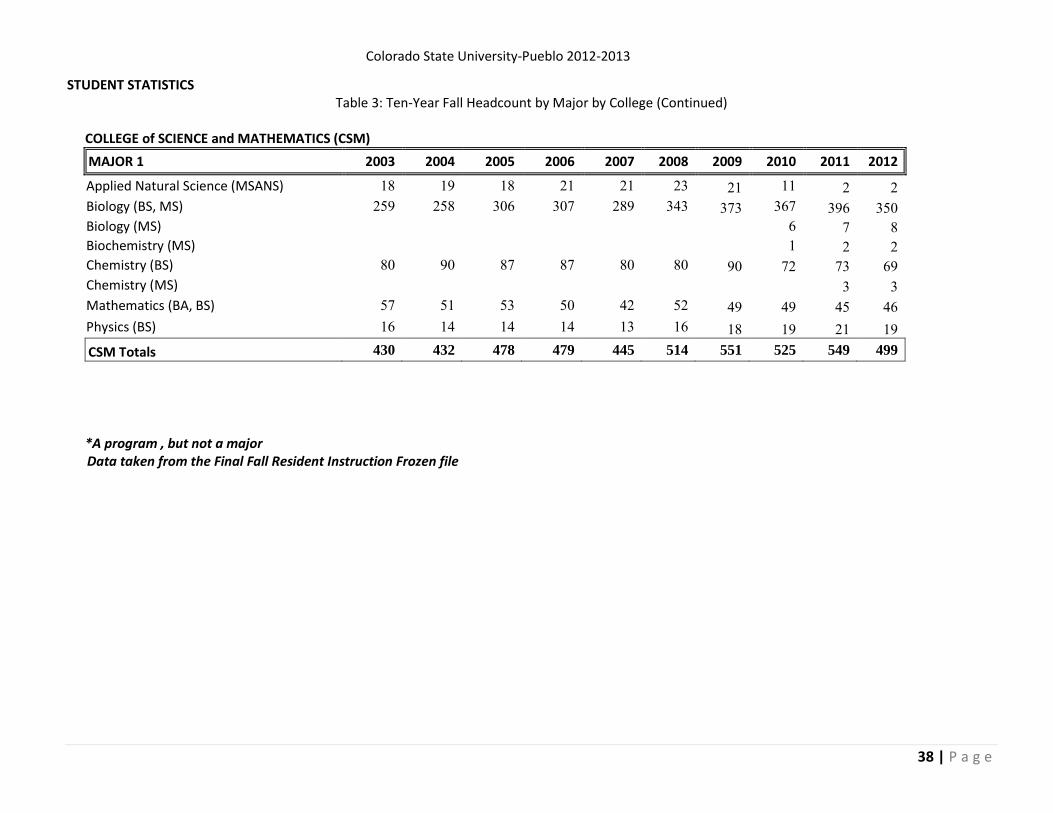
STUDENT STATISTICS Table 3: Ten-Year Fall Headcount by Major by College (Continued)
COLLEGE of SCIENCE and MATHEMATICS (CSM)
MAJOR 1 2003 2004 2005 2006 2007 2008 2009 2010 2011 2012
Applied Natural Science (MSANS) 18 19 18 21 21 23 21 11 2 2 Biology (BS, MS) 259 258 306 307 289 343 373 367 396 350 Biology (MS)
6 7 8
Biochemistry (MS)
1 2 2 Chemistry (BS) 80 90 87 87 80 80 90 72 73 69 Chemistry (MS)
3 3
Mathematics (BA, BS) 57 51 53 50 42 52 49 49 45 46 Physics (BS) 16 14 14 14 13 16 18 19 21 19 CSM Totals 430 432 478 479 445 514 551 525 549 499
*A program , but not a major Data taken from the Final Fall Resident Instruction Frozen file

Colorado State University-Pueblo 2012-2013
39 | P a g e
STUDENT STATISTICS Table 3: Ten-Year Fall Headcount by Major by College (Continued)
COLLEGE of HUMANITIES and SOCIAL SCIENCES (CHASS)
MAJOR 1 2003 2004 2005 2006 2007 2008 2009 2010 2011 2012
Art (BA, BS) 107 121 129 128 107 115 136 139 148 124 English (BA) 95 91 100 103 105 118 132 145 150 150 Foreign Language Spanish (BA) 24 24 24 23 26 34 51 43 48 59 History (BA) 101 122 111 122 114 149 118 120 115 97 History (MA) 34 35 32 28 Liberal Studies (BS) 294 340 335 308 297 276 276 263 237 204 Mass Communications (BA, BS) 251 254 254 228 211 230 240 233 243 239 Music (BA) 84 112 119 108 117 111 105 117 107 91 Political Science (BA, BS) 73 63 62 56 51 61 64 51 57 63 Psychology (BA, BS) 202 191 168 145 151 156 194 233 260 250 Social Science (BA, BS)‡‡ 16 15 7 3 8 6 5 4 6
Sociology (BA, BS) 275 265 252 227 312 346 376 414 440 387 Social Work (BSW) 102 103 107 104 102 120 131 150 187 189 Speech Communication (BA, BS) ‡ 3 1
CHASS Totals 1624 1701 1671 1555 1602 1722 1862 1947 2030 1881
CSU-Pueblo Students - Enrollment in Consortium Master's Degree Programs with CSU-Ft. Collins (Not CSU-Pueblo majors)
English (MA)
22 33 34 30 34 34 26 1
Social Work (MSW)‡ 14
TOTAL CHASS AND CONSORTIUM PROGRAMS 1638 1701 1693 1588 1636 1752 1896 1981 2056 1882
‡ Program discontinued ‡‡ Offered through Continuing Education Data taken from the Final Fall Resident Instruction Frozen file

Colorado State University-Pueblo 2012-2013
40 | P a g e
STUDENT STATISTICS Table 3: Ten-Year Fall Headcount by Major by College (Continued)
HASAN SCHOOL of BUSINESS (HSB)
MAJOR 1 2003 2004 2005 2006 2007 2008 2009 2010 2011 2012
Pre-Business* 320 298 288 368 389 480 492 436 346 323 Accounting (BSBA) 51 56 53 50 56 45 64 63 86 69 Business Management (BSBA) 141 150 155 143 142 137 173 223 251 205 Computer Information Systems (BS)
109 110 114 150 126 157 138
Economics (BSBA) 26 19 31 22 17 15 15 10 25 21 Business Administration (MBA)** 42 44 52 58 46 65 94 106 69 79 Pre-MBA* 17 18 25 16 24 30 HSB Totals 597 585 604 766 784 886 988 964 934 835
UNDECLARED and UNCLASSIFIED MAJOR 1 2003 2004 2005 2006 2007 2008 2009 2010 2011 2012
Undeclared/Unclassified 473 457 395 409 389 426 415 386 330 307
TOTAL FALL HEADCOUNT 4180 4272 4200 4125 4173 4636 5049 5152 5230 4868
*A program, but not a major ** Pre-MBA is included in the MBA counts Data taken from the Final Fall Resident Instruction Frozen file

Colorado State University-Pueblo 2012-2013
41 | P a g e
STUDENT STATISTICS Table 4: Ten-Year Fall Major 2 by College
COLLEGE of EDUCATION, ENGINEERING and PROFESSIONAL STUDIES (CEEPS)
MAJOR 2 2003 2004 2005 2006 2007 2008 2009 2010 2011 2012
Athletic Training (BS)
4 1
Automotive Industry Management (BS)
2 1 1
Civil Engineering Technology (BSCET) 1
1 1 Computer Information Systems (BS)§§ 4 4 4
Construction Management (BS)
1 2 1
Education (M.Ed.)
1
Engineering (BSE) 1 2
1
Exercise Science, Hlth Prom & Rec (BS) 2 1 2 1 1 4 3 10 12
Facilities Mgmt & Tech Studies (BS)‡ 1
Industrial & Systems Engineering (MS)
1
Industrial Engineering (BSIEN) 1
1 2 1 2 Mechanical Engineering Tech (BSMET)‡ 2 2 1
Nursing (BSN)
1 1
Nursing (MS) 1 Pre-Engineering*
1 1 Pre-Nursing* 2 3 1 1
1 2 5 2 Recreation (BS) ** 1
CEEPS Totals 12 9 10 3 2 3 9 11 25 22
*A program, but not a major ** Recreation is combined with Exercise Science and Health Promotion ‡Discontinued §§Moved to another college/school Data taken from the Final Fall Resident Instruction Frozen file

Colorado State University-Pueblo 2012-2013
42 | P a g e
STUDENT STATISTICS
Table 4: Ten-Year Fall Major 2 by College (Continued) COLLEGE of SCIENCE and MATHEMATICS (CSM)
MAJOR 2 2003 2004 2005 2006 2007 2008 2009 2010 2011 2012
Applied Natural Science (MSANS) 3 1 2 7 11 11 5 1 1 Biology (BS) 14 12 12 10 15 9 9 6 6 6
Biology (MS)
1 1
Chemistry (BS) 11 12 10 11 6 6 5 8 18 14 Chemistry (MS) 1 Mathematics (BA, BS) 11 4 5 6 5 3 5 8 13 9 Physics (BS) 1 3
3 3 4 3 5
CSM Totals 40 32 29 34 37 32 27 28 42 35
COLLEGE of HUMANITIES and SOCIAL SCIENCES (CHASS)
MAJOR 2 2003 2004 2005 2006 2007 2008 2009 2010 2011 2012
Art (BA, BS) 4 4 4 3 3 1
1 3 2 English (BA, BS) 4 6 8 5 2 2 10 13 17 10 Foreign Language Spanish (BA) 2 13 14 18 21 23 31 37 43 45 History (BA) 2 6 4 3 5 9 6 4 7 7 Liberal Studies (BS) 3 3
2 2 3 2 Mass Communications (BA, BS) 8 3 8 6 6 2 3 4 6 7 Music (BA) 4 4 5 6 7 5 6 5 4 2 Political Science (BA, BS) 5 3 5 4 5 6 6 4 8 4 Psychology (BA, BS) 7 13 6 1 8 7 6 8 18 22 Social Science (BA, BS)‡‡ 2
1
Sociology (BA, BS) 5 7 5 11 13 12 11 13 23 26 Social Work (BSW) 1 1 2 1 2 2 3 4 CHASS Totals 45 63 63 57 70 68 83 93 135 132
Data taken from the Final Fall Resident Instruction Frozen file ‡‡Offered through Continuing Education

Colorado State University-Pueblo 2012-2013
43 | P a g e
STUDENT STATISTICS
Table 4: Ten-Year Fall Major 2 by College (Continued)
HASAN SCHOOL of BUSINESS (HSB)
MAJOR 2 2003 2004 2005 2006 2007 2008 2009 2010 2011 2012
Computer Information Systems (BS) 1 1 5 2 4 Pre-Business* 2 1 1 2
2 6
2 5
Accounting (BSBA) 1 2 2 4 3 2 2 2 1 3 Business Management (BSBA) 5 3 3 6 7 5 8 11 15 6 Economics (BSBA)
2 2 3 2 3 4 1 8 5
Pre-MBA*
1
Business Administration (MBA)** 5 2 3 5 5 5 6 10 9 11 HSB Totals 13 10 11 20 17 19 27 29 37 34
TOTAL FALL HEADCOUNT (MAJOR 2) 110 114 113 114 126 122 146 161 239 223
*A program, but not a major ** Pre-MBA is included in the MBA counts Data taken from the Final Fall Resident Instruction Frozen file

Colorado State University-Pueblo 2012-2013
44 | P a g e
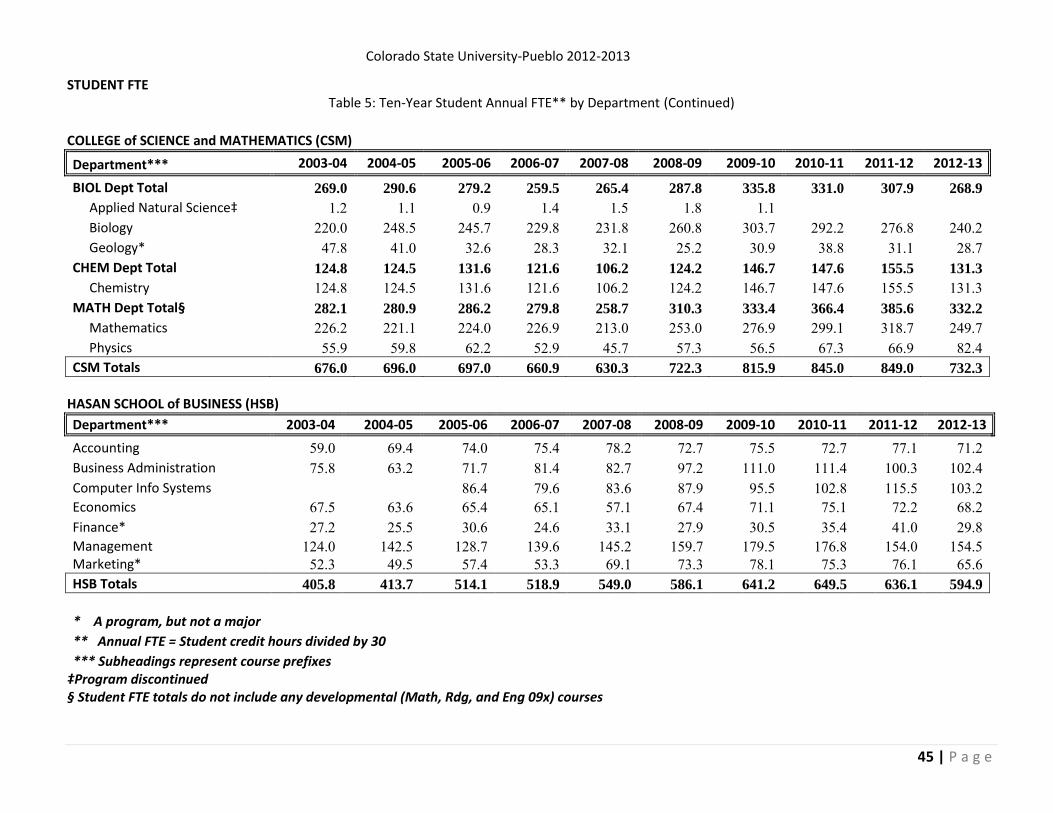
STUDENT FTE Table 5: Ten-Year Student Annual FTE** by Department
COLLEGE of EDUCATION, ENGINEERING and PROFESSIONAL STUDIES (CEEPS)
Department*** 2003-04 2004-05 2005-06 2006-07 2007-08 2008-09 2009-10 2010-11 2011-12 2012-13
AIM/FMTS Dept Total 49.5 59.0 44.6 45.5 39.0 39.1 33.0 38.1 46.9 45.5
Automotive Industry Mgmt 39.0 44.2 42.1 45.1 38.9 39.1 33.0 36.8 38.5 39.5
Facilities Management 10.5 14.8 2.5 0.4 0.1 Construction Mgmt
1.3 8.4 6.0
CIS Dept Total 156.8 115.2 5.0 Computer Information Sys §§ 156.8 115.2 5.0 EN Dept Total 28.0 29.1 37.3 43.6 46.1 45.0 51.3 59.3 66.2 85.2
Engineering 28.0 29.1 37.3 43.6 46.1 45.0 51.3 59.3 66.2 85.2
ET Dept Total 68.0 60.1 46.1 47.5 42.8 39.3 45.9 46.1 47.1 43.7
Civil Engineering Tech 31.9 31.5 28.7 32.4 41.5 39.3 45.9 46.1 47.1 43.7
Elec. E Tech/Comp E Tech‡ 21.9 11.9 10.0 8.3 Mechanical Engr. Tech‡ 14.2 16.7 7.4 6.8 1.3
EXHPR Dept Total 187.5 193.2 186.1 197.5 204.1 261.8 300.5 340.3 362.1 359.6
Exercise Sci. & Health Prom 166.8 171.9 167.9 173.4 176.2 231.9 266.2 254.8 259.7 268.8
Recreation 20.7 21.3 18.3 24.1 28.0 29.9 34.3 36.4 49.3 43.8
Athletic Training
49.1 53.1 47.1
NSG Dept Total 158.4 227.2 246.4 239.4 208.3 221.9 276.1 275.1 273.0 278.8
Nursing 158.4 227.2 246.4 239.4 208.3 221.9 276.1 275.1 273.0 278.8
TEP/SPCOM Dept Total 229.9 216.4 177.5 159.8 178.0 182.4 199.6 204.3 175.4 164.2
Bilingual Bicultural Ed*
1.7 8.1 2.8 4.6 2.0 4.1 1.4 2.3 2.9
Education* 151.3 148.4 149.0 142.6 155.6 161.4 177.1 184.8 154.8 141.5
Reading*§ 17.7 16.8 16.1 14.4 17.8 19.1 18.4 18.1 18.3 19.8
Speech Communication‡ 60.9 49.5 4.3 CEEPS Totals 878.1 900.2 743.1 733.3 718.3 789.5 906.4 963.2 970.8 977.0
* A program, but not a major § Student FTE totals do not include any developmental (Math, Rdg, and Eng 09x) courses
** Annual FTE =Student credit hours divided by 30
§§ Moved to another college/ school *** Subheadings represent course prefixes
‡ Program discontinued
Colorado State University-Pueblo 2012-2013
45 | P a g e
STUDENT FTE Table 5: Ten-Year Student Annual FTE** by Department (Continued)
COLLEGE of SCIENCE and MATHEMATICS (CSM) Department*** 2003-04 2004-05 2005-06 2006-07 2007-08 2008-09 2009-10 2010-11 2011-12 2012-13
BIOL Dept Total 269.0 290.6 279.2 259.5 265.4 287.8 335.8 331.0 307.9 268.9
Applied Natural Science‡ 1.2 1.1 0.9 1.4 1.5 1.8 1.1 Biology 220.0 248.5 245.7 229.8 231.8 260.8 303.7 292.2 276.8 240.2
Geology* 47.8 41.0 32.6 28.3 32.1 25.2 30.9 38.8 31.1 28.7 CHEM Dept Total 124.8 124.5 131.6 121.6 106.2 124.2 146.7 147.6 155.5 131.3
Chemistry 124.8 124.5 131.6 121.6 106.2 124.2 146.7 147.6 155.5 131.3 MATH Dept Total§ 282.1 280.9 286.2 279.8 258.7 310.3 333.4 366.4 385.6 332.2
Mathematics 226.2 221.1 224.0 226.9 213.0 253.0 276.9 299.1 318.7 249.7 Physics 55.9 59.8 62.2 52.9 45.7 57.3 56.5 67.3 66.9 82.4 CSM Totals 676.0 696.0 697.0 660.9 630.3 722.3 815.9 845.0 849.0 732.3
HASAN SCHOOL of BUSINESS (HSB)
Department*** 2003-04 2004-05 2005-06 2006-07 2007-08 2008-09 2009-10 2010-11 2011-12 2012-13
Accounting 59.0 69.4 74.0 75.4 78.2 72.7 75.5 72.7 77.1 71.2 Business Administration 75.8 63.2 71.7 81.4 82.7 97.2 111.0 111.4 100.3 102.4 Computer Info Systems
86.4 79.6 83.6 87.9 95.5 102.8 115.5 103.2
Economics 67.5 63.6 65.4 65.1 57.1 67.4 71.1 75.1 72.2 68.2 Finance* 27.2 25.5 30.6 24.6 33.1 27.9 30.5 35.4 41.0 29.8 Management 124.0 142.5 128.7 139.6 145.2 159.7 179.5 176.8 154.0 154.5 Marketing* 52.3 49.5 57.4 53.3 69.1 73.3 78.1 75.3 76.1 65.6 HSB Totals 405.8 413.7 514.1 518.9 549.0 586.1 641.2 649.5 636.1 594.9
* A program, but not a major ** Annual FTE = Student credit hours divided by 30
*** Subheadings represent course prefixes ‡Program discontinued
§ Student FTE totals do not include any developmental (Math, Rdg, and Eng 09x) courses

Colorado State University-Pueblo 2012-2013
46 | P a g e
STUDENT FTE Table 5: Ten-Year Student Annual FTE** by Department (Continued)
COLLEGE of HUMANITIES and SOCIAL SCIENCES (CHASS)
Department*** 2003-04 2004-05 2005-06 2006-07 2007-08 2008-09 2009-10 2010-11 2011-12 2012-13
ART Dept Total 121.7 115.8 113.9 126.2 117.0 135.9 140.1 136.9 131.3 116.7
Art 121.7 115.8 113.9 126.2 117.0 135.9 140.1 136.9 131.3 116.7 CS Total* 17.3 14.0 10.6 9.3 13.9 15.2 17.2 30.0 30.9 27.6
Chicano Studies* 17.3 14.0 10.6 9.3 13.9 15.2 17.2 30.0 30.9 27.6 ENG/FL Dept Total§ 349.5 354.9 406.0 396.0 393.9 479.1 526.6 551.0 531.6 487.9
English 258.7 269.0 280.5 258.7 242.6 299.4 332.3 345.4 332.9 295.4 Foreign Language 3.5 3.0 3.9
2.7 2.8 3.4 3.3 5.3 3.4
French* 19.5 16.0 13.0 8.5 11.2 12.8 12.0 11.6 9.1 10.2 German*
0.1
8.5 7.0 8.6 7.6 6.2
Italian* 17.5 16.9 16.2 11.4 12.7 10.4 10.7 14.1 19.0 13.6 Russian*
0.1
Spanish 50.4 50.0 49.3 64.5 76.1 88.1 92.0 98.2 96.1 89.6 Speech Communication*
42.8 52.9 48.6 57.0 69.2 69.8 61.5 69.5
HIST/POLSC/PHIL/GEOG/ Dept Total 241.2 286.9 265.4 255.8 260.0 293.3 315.7 321.5 314.1 259.8
Geography* 23.2 23.5 19.4 14.5 14.5 19.2 20.9 19.2 16.9 13.2 History 134.7 171.6 157.8 162.3 164.9 183.0 184.7 182.6 172.5 139.7 Philosophy* 23.3 29.3 27.0 28.6 35.5 42.4 47.6 52.9 59.5 44.6 Political Science 60.0 62.6 61.2 50.4 45.1 48.7 62.5 66.8 65.2 62.2 MCCNM Dept Total 166.0 156.5 150.7 132.0 128.5 114.9 117.4 130.9 132.4 141.1
Mass Communication 166.0 156.5 150.7 132.0 128.5 114.9 117.4 130.9 132.4 141.1 MSL Total* 2.3 2.6 3.0 4.6 4.4 4.2 3.9 5.9 4.9 3.0
Military Sci & Leadership 2.3 2.6 3.0 4.6 4.4 4.2 3.9 5.9 4.9 3.0 MUS Dept Total 111.1 118.7 121.5 107.3 115.1 117.1 122.6 126.0 107.8 99.9
Military Sci & Leadership 111.1 118.7 121.5 107.3 115.1 117.1 122.6 126.0 107.8 99.9 * A program, but not a major
** Annual FTE = Student credit hours divided by 30 *** Subheadings represent course prefixes
§ Student FTE totals do not include any developmental (Math, Rdg, and Eng 09x) courses

Colorado State University-Pueblo 2012-2013
47 | P a g e
STUDENT FTE Table 5: Ten-Year Student Annual FTE** by Department (Continued)
COLLEGE of HUMANITIES and SOCIAL SCIENCES (CHASS)
Department*** 2003-04 2004-05 2005-06 2006-07 2007-08 2008-09 2009-10 2010-11 2011-12 2012-13
PSYCH Dept Total 249.4 241.3 208.2 185.8 188.6 213.0 238.3 263.4 288.0 272.9
Psychology 249.4 241.3 208.2 185.8 188.6 213.0 238.3 263.4 288.0 272.9 SOC Dept Total 228.9 238 212.4 197.9 202.5 236.9 260.3 280.6 289.0 268.2
Anthropology* 20.7 21.9 9.2 12.3 9.6 10.8 14.9 16.9 20.9 13.2 Sociology 208.2 216.1 203.2 185.6 192.9 225.0 244.6 260.9 265.7 255.0 Social Science‡‡
1.1 0.9 2.8 2.4
SW Dept Total 65.7 57.5 51.5 43 52.1 66.8 76.2 98.0 112.1 118.2
Social Work 65.7 57.5 51.5 43 52.1 66.8 76.2 98.0 112.1 118.2 US/HONORS Total* 14.3 13.2 10.7 9.9 20.2 16.9 15.1 17.0 18.5 21.3
University Studies* 14.3 13.2 10.7 9.9 20.2 16.9 15.1 17.0 18.5 21.3 WS Total* 13.3 15 14.3 10.5 13.6 24.4 22.6 15.9 25.6 21.6
Womens Studies* 13.3 15 14.3 10.5 13.6 24.4 22.6 15.9 25.6 21.6 CHASS Totals 1580.8 1614.6 1568.3 1478.4 1509.8 1717.7 1856.0 1977.1 1986.2 1835.4
Adjustments• -6.7 -10.3 -4.5 -5 0.4 -9.39 -5.0 -4.2 -5.3 UNIVERSITY TOTALS 3534.1 3614.1 3518.0 3386.4 3407.8 3806.2 4214.5 4430.6 4436.8 4142.5
* A program, but not a major
‡‡Offered through Continuing Education ** Annual FTE = Student credit hours divided by 30
*** Subheadings represent course prefixes •Not claimable for state support
Colorado State University-Pueblo 2012-2013
48 | P a g e
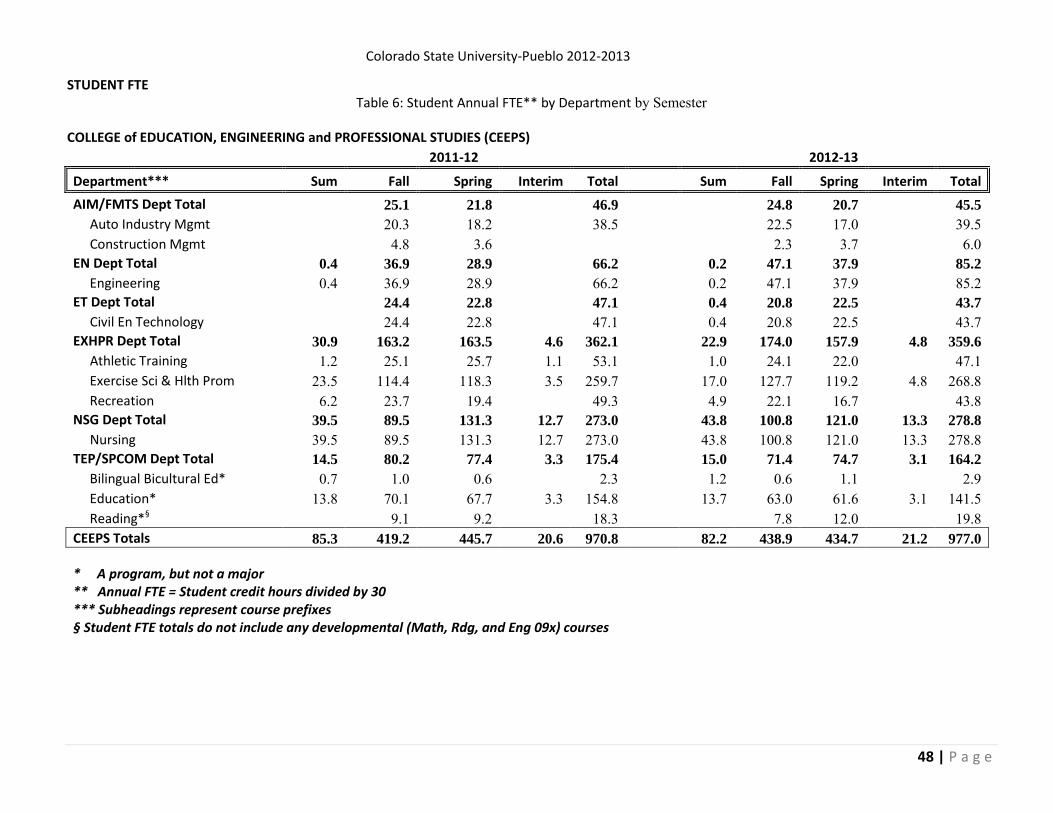
STUDENT FTE Table 6: Student Annual FTE** by Department by Semester
COLLEGE of EDUCATION, ENGINEERING and PROFESSIONAL STUDIES (CEEPS)
2011-12
2012-13
Department*** Sum Fall Spring Interim Total Sum Fall Spring Interim Total
AIM/FMTS Dept Total
25.1 21.8
46.9
24.8 20.7
45.5
Auto Industry Mgmt
20.3 18.2
38.5
22.5 17.0
39.5 Construction Mgmt
4.8 3.6
2.3 3.7
6.0
EN Dept Total 0.4 36.9 28.9
66.2
0.2 47.1 37.9
85.2
Engineering 0.4 36.9 28.9
66.2
0.2 47.1 37.9
85.2 ET Dept Total
24.4 22.8
47.1
0.4 20.8 22.5
43.7
Civil En Technology
24.4 22.8
47.1
0.4 20.8 22.5
43.7 EXHPR Dept Total 30.9 163.2 163.5 4.6 362.1
22.9 174.0 157.9 4.8 359.6
Athletic Training 1.2 25.1 25.7 1.1 53.1
1.0 24.1 22.0
47.1 Exercise Sci & Hlth Prom 23.5 114.4 118.3 3.5 259.7
17.0 127.7 119.2 4.8 268.8
Recreation 6.2 23.7 19.4
49.3
4.9 22.1 16.7
43.8 NSG Dept Total 39.5 89.5 131.3 12.7 273.0
43.8 100.8 121.0 13.3 278.8
Nursing 39.5 89.5 131.3 12.7 273.0
43.8 100.8 121.0 13.3 278.8 TEP/SPCOM Dept Total 14.5 80.2 77.4 3.3 175.4
15.0 71.4 74.7 3.1 164.2
Bilingual Bicultural Ed* 0.7 1.0 0.6
2.3
1.2 0.6 1.1
2.9 Education* 13.8 70.1 67.7 3.3 154.8
13.7 63.0 61.6 3.1 141.5
Reading*§
9.1 9.2
18.3
7.8 12.0
19.8 CEEPS Totals 85.3 419.2 445.7 20.6 970.8 82.2 438.9 434.7 21.2 977.0
* A program, but not a major ** Annual FTE = Student credit hours divided by 30
*** Subheadings represent course prefixes § Student FTE totals do not include any developmental (Math, Rdg, and Eng 09x) courses
Colorado State University-Pueblo 2012-2013
49 | P a g e
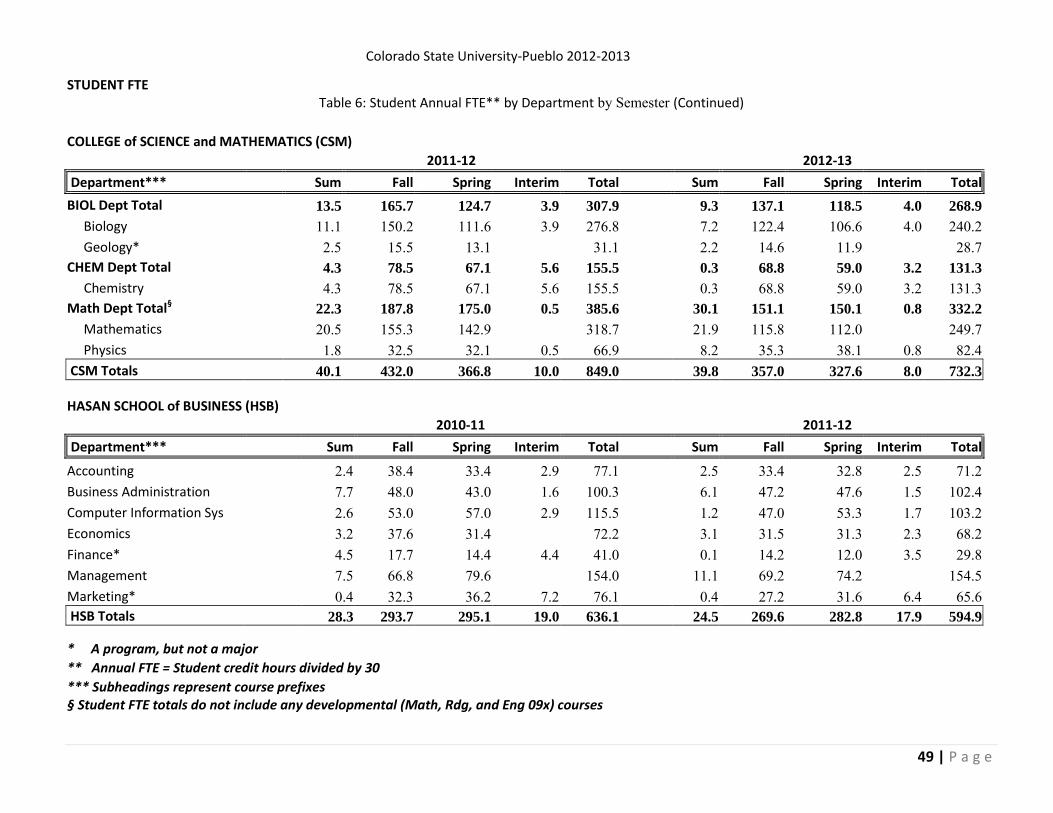
STUDENT FTE Table 6: Student Annual FTE** by Department by Semester (Continued)
COLLEGE of SCIENCE and MATHEMATICS (CSM)
2011-12
2012-13
Department*** Sum Fall Spring Interim Total Sum Fall Spring Interim Total
BIOL Dept Total 13.5 165.7 124.7 3.9 307.9
9.3 137.1 118.5 4.0 268.9
Biology 11.1 150.2 111.6 3.9 276.8
7.2 122.4 106.6 4.0 240.2 Geology* 2.5 15.5 13.1
31.1
2.2 14.6 11.9
28.7
CHEM Dept Total 4.3 78.5 67.1 5.6 155.5
0.3 68.8 59.0 3.2 131.3
Chemistry 4.3 78.5 67.1 5.6 155.5
0.3 68.8 59.0 3.2 131.3 Math Dept Total§ 22.3 187.8 175.0 0.5 385.6
30.1 151.1 150.1 0.8 332.2
Mathematics 20.5 155.3 142.9
318.7
21.9 115.8 112.0
249.7 Physics 1.8 32.5 32.1 0.5 66.9
8.2 35.3 38.1 0.8 82.4
CSM Totals 40.1 432.0 366.8 10.0 849.0 39.8 357.0 327.6 8.0 732.3
HASAN SCHOOL of BUSINESS (HSB)
2010-11
2011-12
Department*** Sum Fall Spring Interim Total Sum Fall Spring Interim Total
Accounting 2.4 38.4 33.4 2.9 77.1 2.5 33.4 32.8 2.5 71.2 Business Administration 7.7 48.0 43.0 1.6 100.3
6.1 47.2 47.6 1.5 102.4
Computer Information Sys 2.6 53.0 57.0 2.9 115.5
1.2 47.0 53.3 1.7 103.2 Economics 3.2 37.6 31.4
72.2
3.1 31.5 31.3 2.3 68.2
Finance* 4.5 17.7 14.4 4.4 41.0 0.1 14.2 12.0 3.5 29.8 Management 7.5 66.8 79.6
154.0
11.1 69.2 74.2
154.5
Marketing* 0.4 32.3 36.2 7.2 76.1
0.4 27.2 31.6 6.4 65.6 HSB Totals 28.3 293.7 295.1 19.0 636.1 24.5 269.6 282.8 17.9 594.9
* A program, but not a major ** Annual FTE = Student credit hours divided by 30
*** Subheadings represent course prefixes § Student FTE totals do not include any developmental (Math, Rdg, and Eng 09x) courses
Colorado State University-Pueblo 2012-2013
50 | P a g e
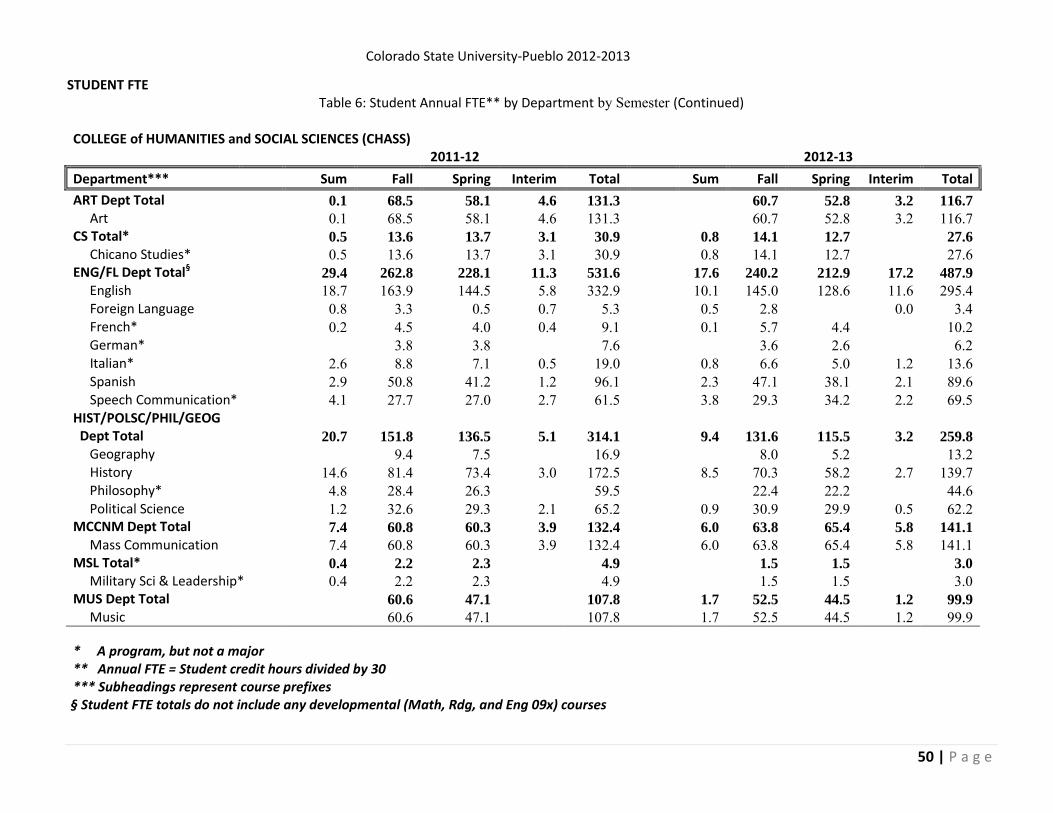
STUDENT FTE Table 6: Student Annual FTE** by Department by Semester (Continued)
COLLEGE of HUMANITIES and SOCIAL SCIENCES (CHASS)
2011-12
2012-13
Department*** Sum Fall Spring Interim Total Sum Fall Spring Interim Total
ART Dept Total 0.1 68.5 58.1 4.6 131.3
60.7 52.8 3.2 116.7
Art 0.1 68.5 58.1 4.6 131.3
60.7 52.8 3.2 116.7 CS Total* 0.5 13.6 13.7 3.1 30.9
0.8 14.1 12.7
27.6
Chicano Studies* 0.5 13.6 13.7 3.1 30.9
0.8 14.1 12.7
27.6 ENG/FL Dept Total§ 29.4 262.8 228.1 11.3 531.6
17.6 240.2 212.9 17.2 487.9
English 18.7 163.9 144.5 5.8 332.9
10.1 145.0 128.6 11.6 295.4 Foreign Language 0.8 3.3 0.5 0.7 5.3
0.5 2.8
0.0 3.4
French* 0.2 4.5 4.0 0.4 9.1
0.1 5.7 4.4
10.2 German*
3.8 3.8
7.6
3.6 2.6
6.2
Italian* 2.6 8.8 7.1 0.5 19.0
0.8 6.6 5.0 1.2 13.6 Spanish 2.9 50.8 41.2 1.2 96.1
2.3 47.1 38.1 2.1 89.6
Speech Communication* 4.1 27.7 27.0 2.7 61.5
3.8 29.3 34.2 2.2 69.5 HIST/POLSC/PHIL/GEOG
Dept Total 20.7 151.8 136.5 5.1 314.1
9.4 131.6 115.5 3.2 259.8
Geography
9.4 7.5
16.9
8.0 5.2
13.2 History 14.6 81.4 73.4 3.0 172.5
8.5 70.3 58.2 2.7 139.7
Philosophy* 4.8 28.4 26.3
59.5
22.4 22.2
44.6 Political Science 1.2 32.6 29.3 2.1 65.2
0.9 30.9 29.9 0.5 62.2
MCCNM Dept Total 7.4 60.8 60.3 3.9 132.4
6.0 63.8 65.4 5.8 141.1
Mass Communication 7.4 60.8 60.3 3.9 132.4
6.0 63.8 65.4 5.8 141.1 MSL Total* 0.4 2.2 2.3
4.9
1.5 1.5
3.0
Military Sci & Leadership* 0.4 2.2 2.3
4.9
1.5 1.5
3.0 MUS Dept Total
60.6 47.1
107.8
1.7 52.5 44.5 1.2 99.9
Music
60.6 47.1 107.8 1.7 52.5 44.5 1.2 99.9
* A program, but not a major ** Annual FTE = Student credit hours divided by 30
*** Subheadings represent course prefixes § Student FTE totals do not include any developmental (Math, Rdg, and Eng 09x) courses

Colorado State University-Pueblo 2012-2013
51 | P a g e
STUDENT FTE Table 6: Student Annual FTE** by Department by Semester (Continued)
COLLEGE of HUMANITIES and SOCIAL SCIENCES (CHASS)
2011-12
2012-13
Department*** Sum Fall Spring Interim Total Sum Fall Spring Interim Total
PSYCH Dept Total 22.6 139.5 120.0 5.9 288.0
15.5 131.9 122.9 2.6 272.9
Psychology 22.6 139.5 120.0 5.9 288.0
15.5 131.9 122.9 2.6 272.9 SOC Dept Total 18.6 134.5 129.0 6.9 289.0
23.8 124.8 116.2 3.4 268.2
Anthropology* 0.8 11.2 8.9
20.9
8.1 5.1
13.2 Sociology 17.8 122.1 118.9 6.9 265.7
23.8 116.7 111.1 3.4 255.0
Social Science‡‡
1.2 1.2
2.4 SW Dept Total 18.2 43.1 49.1 1.7 112.1
19.6 50.8 47.8
118.2
Social Work 18.2 43.1 49.1 1.7 112.1
19.6 50.8 47.8
118.2 US/HONORS Total* 1.8 13.5 3.2
18.5
1.1 14.6 5.6
21.3
University Studies* 1.8 13.5 3.2
18.5
1.1 14.6 5.6
21.3 WS Total* 1.6 10.5 11.5 2.0 25.6
1.2 12.4 8.0
21.6
Women Studies* 1.6 10.5 11.5 2.0 25.6
1.2 12.4 8.0
21.6 CHASS Totals 121.2 961.5 858.9 44.5 1986.2 95.7 899.0 805.8 36.6 1838.2
Adjustments• -0.3 -3.1 -1.9
-5.3
UNIVERSITY TOTALS 274.7 2103.4 1964.6 94.2 4436.8 242.2 1964.4 1851.0 83.7 4142.4
* A program, but not a major
‡‡Offered through Continuing Education ** Annual FTE = Student credit hours divided by 30
*** Subheadings represent course prefixes •Not claimable for state support
Colorado State University-Pueblo 2012-2013
52 | P a g e
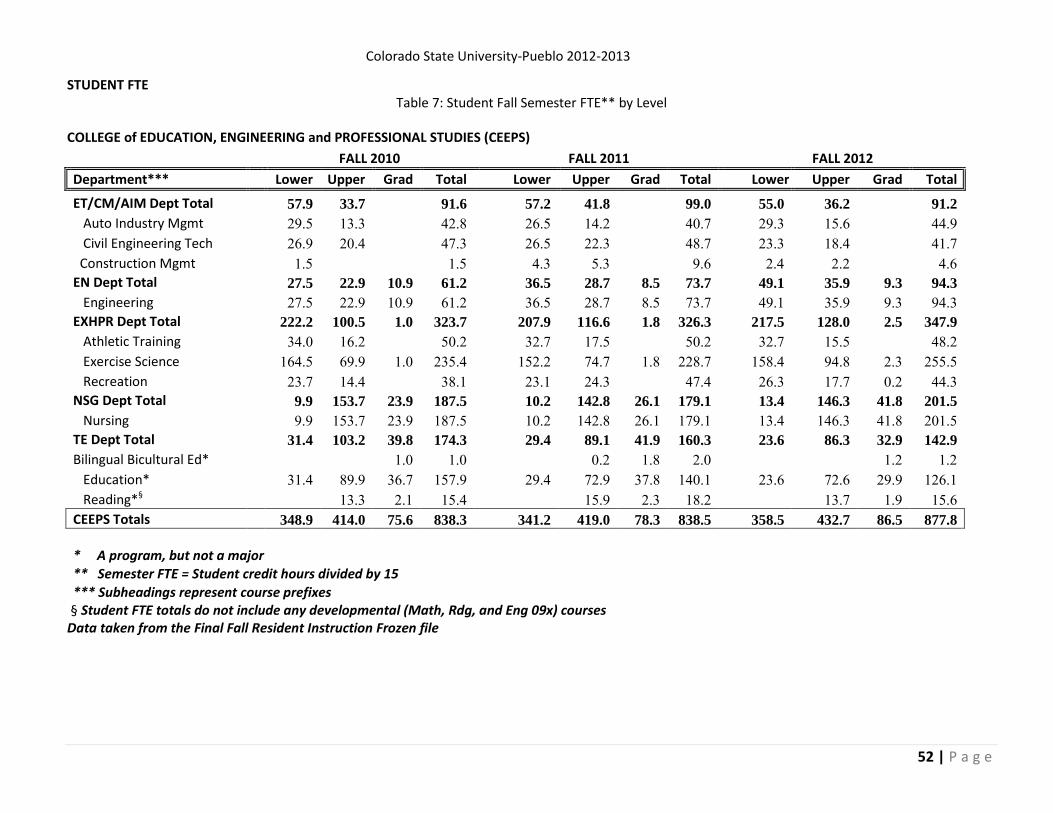
STUDENT FTE Table 7: Student Fall Semester FTE** by Level
COLLEGE of EDUCATION, ENGINEERING and PROFESSIONAL STUDIES (CEEPS)
FALL 2010 FALL 2011 FALL 2012
Department*** Lower Upper Grad Total Lower Upper Grad Total Lower Upper Grad Total
ET/CM/AIM Dept Total
57.9 33.7
91.6 57.2 41.8
99.0 55.0 36.2
91.2
Auto Industry Mgmt
29.5 13.3
42.8 26.5 14.2
40.7 29.3 15.6
44.9 Civil Engineering Tech
26.9 20.4
47.3 26.5 22.3
48.7 23.3 18.4
41.7
Construction Mgmt
1.5
1.5 4.3 5.3
9.6 2.4 2.2
4.6 EN Dept Total
27.5 22.9 10.9 61.2 36.5 28.7 8.5 73.7 49.1 35.9 9.3 94.3
Engineering
27.5 22.9 10.9 61.2 36.5 28.7 8.5 73.7 49.1 35.9 9.3 94.3 EXHPR Dept Total
222.2 100.5 1.0 323.7 207.9 116.6 1.8 326.3 217.5 128.0 2.5 347.9
Athletic Training
34.0 16.2
50.2 32.7 17.5
50.2 32.7 15.5
48.2 Exercise Science
164.5 69.9 1.0 235.4 152.2 74.7 1.8 228.7 158.4 94.8 2.3 255.5
Recreation
23.7 14.4
38.1 23.1 24.3
47.4 26.3 17.7 0.2 44.3 NSG Dept Total
9.9 153.7 23.9 187.5 10.2 142.8 26.1 179.1 13.4 146.3 41.8 201.5
Nursing
9.9 153.7 23.9 187.5 10.2 142.8 26.1 179.1 13.4 146.3 41.8 201.5 TE Dept Total
31.4 103.2 39.8 174.3 29.4 89.1 41.9 160.3 23.6 86.3 32.9 142.9
Bilingual Bicultural Ed*
1.0 1.0
0.2 1.8 2.0
1.2 1.2 Education*
31.4 89.9 36.7 157.9 29.4 72.9 37.8 140.1 23.6 72.6 29.9 126.1
Reading*§
13.3 2.1 15.4
15.9 2.3 18.2
13.7 1.9 15.6
CEEPS Totals 348.9 414.0 75.6 838.3 341.2 419.0 78.3 838.5 358.5 432.7 86.5 877.8
* A program, but not a major ** Semester FTE = Student credit hours divided by 15
*** Subheadings represent course prefixes § Student FTE totals do not include any developmental (Math, Rdg, and Eng 09x) courses
Data taken from the Final Fall Resident Instruction Frozen file
Colorado State University-Pueblo 2012-2013
53 | P a g e
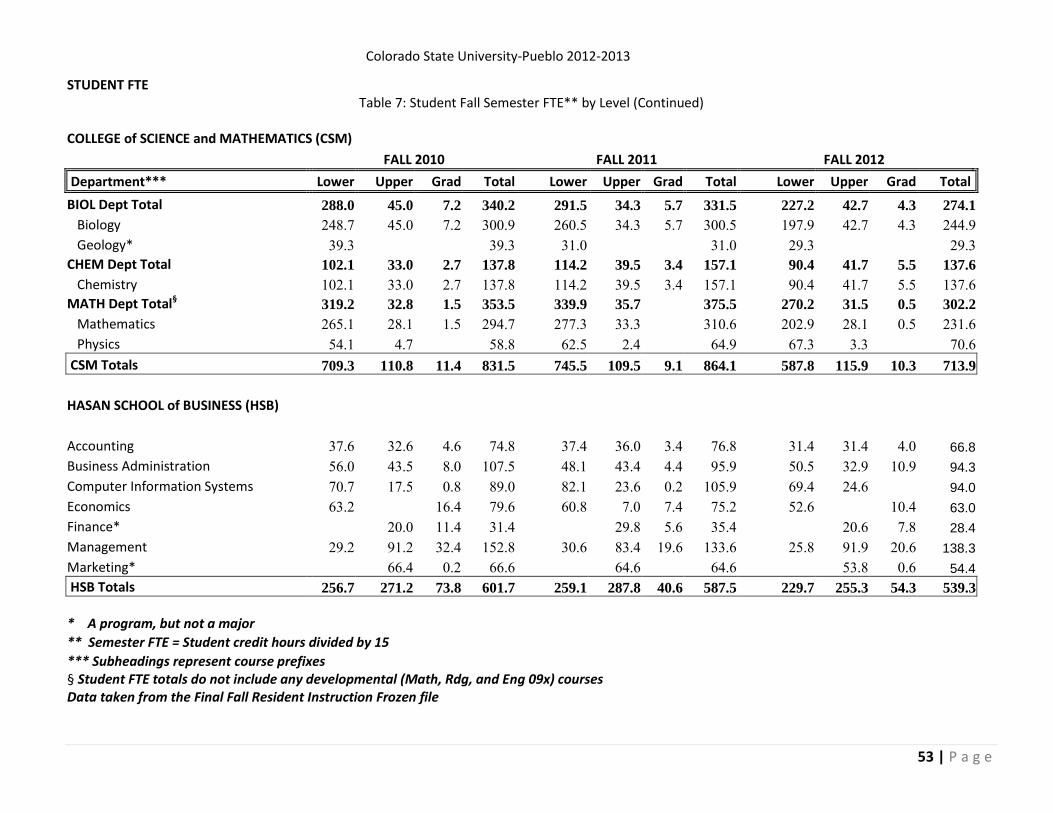
STUDENT FTE Table 7: Student Fall Semester FTE** by Level (Continued)
COLLEGE of SCIENCE and MATHEMATICS (CSM)
FALL 2010 FALL 2011 FALL 2012
Department*** Lower Upper Grad Total Lower Upper Grad Total Lower Upper Grad Total
BIOL Dept Total
288.0 45.0 7.2 340.2 291.5 34.3 5.7 331.5 227.2 42.7 4.3 274.1
Biology
248.7 45.0 7.2 300.9 260.5 34.3 5.7 300.5 197.9 42.7 4.3 244.9 Geology*
39.3
39.3 31.0
31.0 29.3
29.3
CHEM Dept Total
102.1 33.0 2.7 137.8 114.2 39.5 3.4 157.1 90.4 41.7 5.5 137.6
Chemistry
102.1 33.0 2.7 137.8 114.2 39.5 3.4 157.1 90.4 41.7 5.5 137.6 MATH Dept Total§
319.2 32.8 1.5 353.5 339.9 35.7
375.5 270.2 31.5 0.5 302.2
Mathematics
265.1 28.1 1.5 294.7 277.3 33.3
310.6 202.9 28.1 0.5 231.6 Physics
54.1 4.7
58.8 62.5 2.4
64.9 67.3 3.3
70.6
CSM Totals 709.3 110.8 11.4 831.5 745.5 109.5 9.1 864.1 587.8 115.9 10.3 713.9
HASAN SCHOOL of BUSINESS (HSB)
Accounting
37.6 32.6 4.6 74.8 37.4 36.0 3.4 76.8 31.4 31.4 4.0 66.8
Business Administration
56.0 43.5 8.0 107.5 48.1 43.4 4.4 95.9 50.5 32.9 10.9 94.3
Computer Information Systems
70.7 17.5 0.8 89.0 82.1 23.6 0.2 105.9 69.4 24.6
94.0
Economics
63.2
16.4 79.6 60.8 7.0 7.4 75.2 52.6
10.4 63.0
Finance*
20.0 11.4 31.4
29.8 5.6 35.4
20.6 7.8 28.4
Management
29.2 91.2 32.4 152.8 30.6 83.4 19.6 133.6 25.8 91.9 20.6 138.3
Marketing*
66.4 0.2 66.6
64.6
64.6
53.8 0.6 54.4
HSB Totals 256.7 271.2 73.8 601.7 259.1 287.8 40.6 587.5 229.7 255.3 54.3 539.3
* A program, but not a major ** Semester FTE = Student credit hours divided by 15
*** Subheadings represent course prefixes § Student FTE totals do not include any developmental (Math, Rdg, and Eng 09x) courses
Data taken from the Final Fall Resident Instruction Frozen file
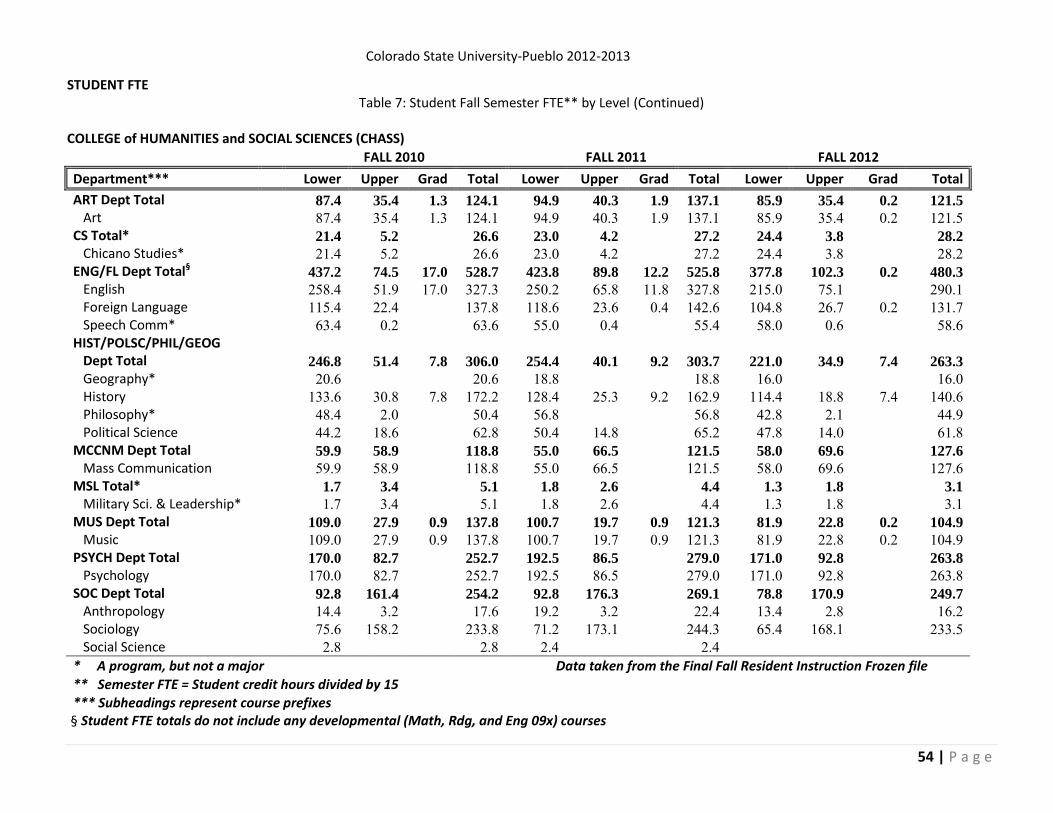
Colorado State University-Pueblo 2012-2013
54 | P a g e
STUDENT FTE Table 7: Student Fall Semester FTE** by Level (Continued)
COLLEGE of HUMANITIES and SOCIAL SCIENCES (CHASS)
FALL 2010 FALL 2011 FALL 2012
Department*** Lower Upper Grad Total Lower Upper Grad Total Lower Upper Grad Total
ART Dept Total
87.4 35.4 1.3 124.1 94.9 40.3 1.9 137.1 85.9 35.4 0.2 121.5
Art
87.4 35.4 1.3 124.1 94.9 40.3 1.9 137.1 85.9 35.4 0.2 121.5 CS Total*
21.4 5.2
26.6 23.0 4.2
27.2 24.4 3.8
28.2
Chicano Studies*
21.4 5.2
26.6 23.0 4.2
27.2 24.4 3.8
28.2 ENG/FL Dept Total§
437.2 74.5 17.0 528.7 423.8 89.8 12.2 525.8 377.8 102.3 0.2 480.3
English
258.4 51.9 17.0 327.3 250.2 65.8 11.8 327.8 215.0 75.1
290.1 Foreign Language
115.4 22.4
137.8 118.6 23.6 0.4 142.6 104.8 26.7 0.2 131.7
Speech Comm*
63.4 0.2
63.6 55.0 0.4
55.4 58.0 0.6
58.6 HIST/POLSC/PHIL/GEOG
Dept Total
246.8 51.4 7.8 306.0 254.4 40.1 9.2 303.7 221.0 34.9 7.4 263.3
Geography*
20.6
20.6 18.8
18.8 16.0
16.0 History
133.6 30.8 7.8 172.2 128.4 25.3 9.2 162.9 114.4 18.8 7.4 140.6
Philosophy*
48.4 2.0
50.4 56.8
56.8 42.8 2.1
44.9 Political Science
44.2 18.6
62.8 50.4 14.8
65.2 47.8 14.0
61.8
MCCNM Dept Total
59.9 58.9
118.8 55.0 66.5
121.5 58.0 69.6
127.6
Mass Communication
59.9 58.9
118.8 55.0 66.5
121.5 58.0 69.6
127.6 MSL Total*
1.7 3.4
5.1 1.8 2.6
4.4 1.3 1.8
3.1
Military Sci. & Leadership*
1.7 3.4
5.1 1.8 2.6
4.4 1.3 1.8
3.1 MUS Dept Total
109.0 27.9 0.9 137.8 100.7 19.7 0.9 121.3 81.9 22.8 0.2 104.9
Music
109.0 27.9 0.9 137.8 100.7 19.7 0.9 121.3 81.9 22.8 0.2 104.9 PSYCH Dept Total
170.0 82.7
252.7 192.5 86.5
279.0 171.0 92.8
263.8
Psychology
170.0 82.7
252.7 192.5 86.5
279.0 171.0 92.8
263.8 SOC Dept Total
92.8 161.4
254.2 92.8 176.3
269.1 78.8 170.9
249.7
Anthropology
14.4 3.2
17.6 19.2 3.2
22.4 13.4 2.8
16.2 Sociology
75.6 158.2
233.8 71.2 173.1
244.3 65.4 168.1
233.5
Social Science
2.8
2.8 2.4
2.4 * A program, but not a major
Data taken from the Final Fall Resident Instruction Frozen file
** Semester FTE = Student credit hours divided by 15 *** Subheadings represent course prefixes
§ Student FTE totals do not include any developmental (Math, Rdg, and Eng 09x) courses

Colorado State University-Pueblo 2012-2013
55 | P a g e
STUDENT FTE Table 7: Student Fall Semester FTE** by Level (Continued)
COLLEGE of HUMANITIES and SOCIAL SCIENCES (CHASS)
FALL 2010 FALL 2011 FALL 2012
Department*** Lower Upper Grad Total Lower Upper Grad Total Lower Upper Grad Total
SW Dept Total
37.1 43.5
80.6 35.6 50.5
86.1 37.3 64.2
101.5
Social Work
37.1 43.5
80.6 35.6 50.5
86.1 37.3 64.2
101.5 US/HONORS Total*
18.4 4.6
23.0 22.7 4.4
27.1 25.1 4.2
29.3
University Studies*
18.4 4.6
23.0 22.7 4.4
27.1 25.1 4.2
29.3 WS Total*
7.0 2.0
9.0 16.8 4.2
21.0 20.4 4.4
24.8
Women's Studies*
7.0 2.0
9.0 16.8 4.2
21.0 20.4 4.4
24.8 CHASS Totals 1288.7 550.9 27.0 1866.6 1313.9 585.1 24.1 1923.2 1182.9 607.1 8.0 1798.0
UNIVERSITY 2603.6 1346.9 187.8 4138.1 2659.8 1401.4 152.1 4213.2 2358.9 1410.9 159.1 3928.9
* A program, but not a major
** Semester FTE = Student credit hours divided by 15 *** Subheadings represent course prefixes
Data taken from the Final Fall Resident Instruction Frozen file

Colorado State University-Pueblo 2012-2013
56 | P a g e
ADMITTED STUDENT PROFILE Table 8: Ten-Year Applicant Profiles
1. Entering Credentials - First Time Enrolled Students
Fall 03 Fall 04 Fall 05 Fall 06 Fall 07 Fall 08 Fall 09 Fall 10 Fall 11 Fall 12
Mean ACT
19.7 20.6 20.5 20.5 20 20.1 20.5 20.4 20.6 20.5
Mean HS GPA
3.0 3.2 3.2 3.1 3.1 3.0 3.1 3.1 3.1 3.1
2. Applications\Acceptance and Enrollment
Fall 03 Fall 04 Fall 05 Fall 06 Fall 07 Fall 08 Fall 09 Fall 10 Fall 11 Fall 12
First Time
Applied
1850 1816 1771 1698 1482 3471 2758 3264 3377 3147
Accepted
1734 1713 1695 1632 1438 3364 2614 3046 3167 2969
% of Applied that Accepted* 93.7 94.3 95.7 96.1 97.0 96.9 94.8 93.3 93.8 94.3 94.3
Enrolled
706 768 690 650 628 1032 1050 945 1001 880
% Enrolled (yield rate)** 40.7 44.8 40.7 39.8 43.9 30.7 40.2 31.0 31.6 29.6
% Accepted in Window 16.9 11.7 14.3 14.3 16.9 19.1 22.4 22.4
Transfer
Applied
528 550 583 541 594 640 694 697 670 669 670
Accepted
528 547 581 540 594 639 688 692 669 668 669
Enrolled
360 365 386 373 387 419 458 471 442 416 442
Readmit
Applied
195 201 206 185 181 208 210 184 178 162 178
Accepted
191 200 206 185 181 207 208 183 178 162 178
Enrolled
144 132 148 129 138 147 119 94 86 75 86
* Percent of applied students who were accepted
** Percent of accepted students who enrolled Data taken from the Final Fall Frozen SURDS (Student Unit Record Data System) file
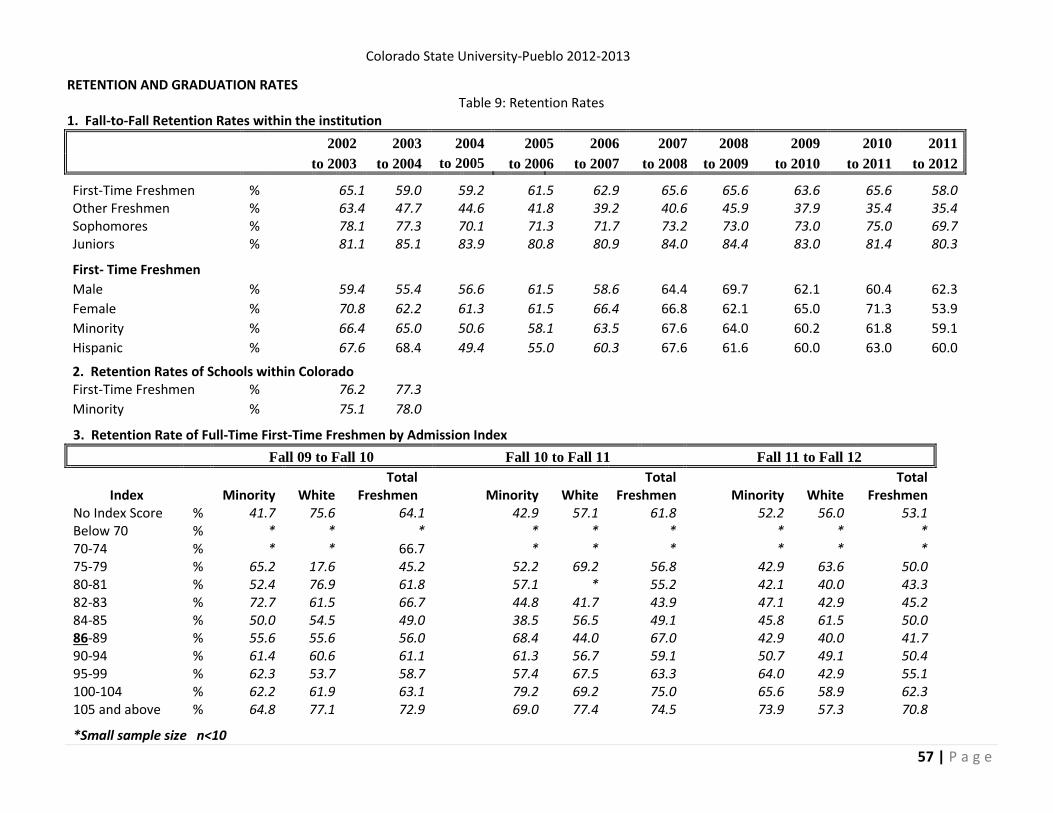
Colorado State University-Pueblo 2012-2013
57 | P a g e
RETENTION AND GRADUATION RATES Table 9: Retention Rates
1. Fall-to-Fall Retention Rates within the institution
2002 2003 2004 2005 2006 2007 2008 2009 2010 2011
to 2003 to 2004 to 2005 to 2006 to 2007 to 2008 to 2009 to 2010 to 2011 to 2012
First-Time Freshmen % 65.1 59.0 59.2 61.5 62.9 65.6 65.6 63.6 65.6 58.0 Other Freshmen % 63.4 47.7 44.6 41.8 39.2 40.6 45.9 37.9 35.4 35.4 Sophomores % 78.1 77.3 70.1 71.3 71.7 73.2 73.0 73.0 75.0 69.7 Juniors % 81.1 85.1 83.9 80.8 80.9 84.0 84.4 83.0 81.4 80.3
First- Time Freshmen Male % 59.4 55.4 56.6 61.5 58.6 64.4 69.7 62.1 60.4 62.3
Female % 70.8 62.2 61.3 61.5 66.4 66.8 62.1 65.0 71.3 53.9
Minority % 66.4 65.0 50.6 58.1 63.5 67.6 64.0 60.2 61.8 59.1
Hispanic % 67.6 68.4 49.4 55.0 60.3 67.6 61.6 60.0 63.0 60.0
2. Retention Rates of Schools within Colorado First-Time Freshmen % 76.2 77.3
Minority % 75.1 78.0
3. Retention Rate of Full-Time First-Time Freshmen by Admission Index
Fall 09 to Fall 10 Fall 10 to Fall 11 Fall 11 to Fall 12
Index
Minority White Total
Freshmen Minority White Total
Freshmen Minority White Total
Freshmen No Index Score % 41.7 75.6 64.1 42.9 57.1 61.8 52.2 56.0 53.1 Below 70 % * * * * * * * * * 70-74 % * * 66.7 * * * * * * 75-79 % 65.2 17.6 45.2 52.2 69.2 56.8 42.9 63.6 50.0 80-81 % 52.4 76.9 61.8 57.1 * 55.2 42.1 40.0 43.3 82-83 % 72.7 61.5 66.7 44.8 41.7 43.9 47.1 42.9 45.2 84-85 % 50.0 54.5 49.0 38.5 56.5 49.1 45.8 61.5 50.0 86-89 % 55.6 55.6 56.0 68.4 44.0 67.0 42.9 40.0 41.7 90-94 % 61.4 60.6 61.1 61.3 56.7 59.1 50.7 49.1 50.4 95-99 % 62.3 53.7 58.7 57.4 67.5 63.3 64.0 42.9 55.1 100-104 % 62.2 61.9 63.1 79.2 69.2 75.0 65.6 58.9 62.3 105 and above % 64.8 77.1 72.9 69.0 77.4 74.5 73.9 57.3 70.8
*Small sample size n<10
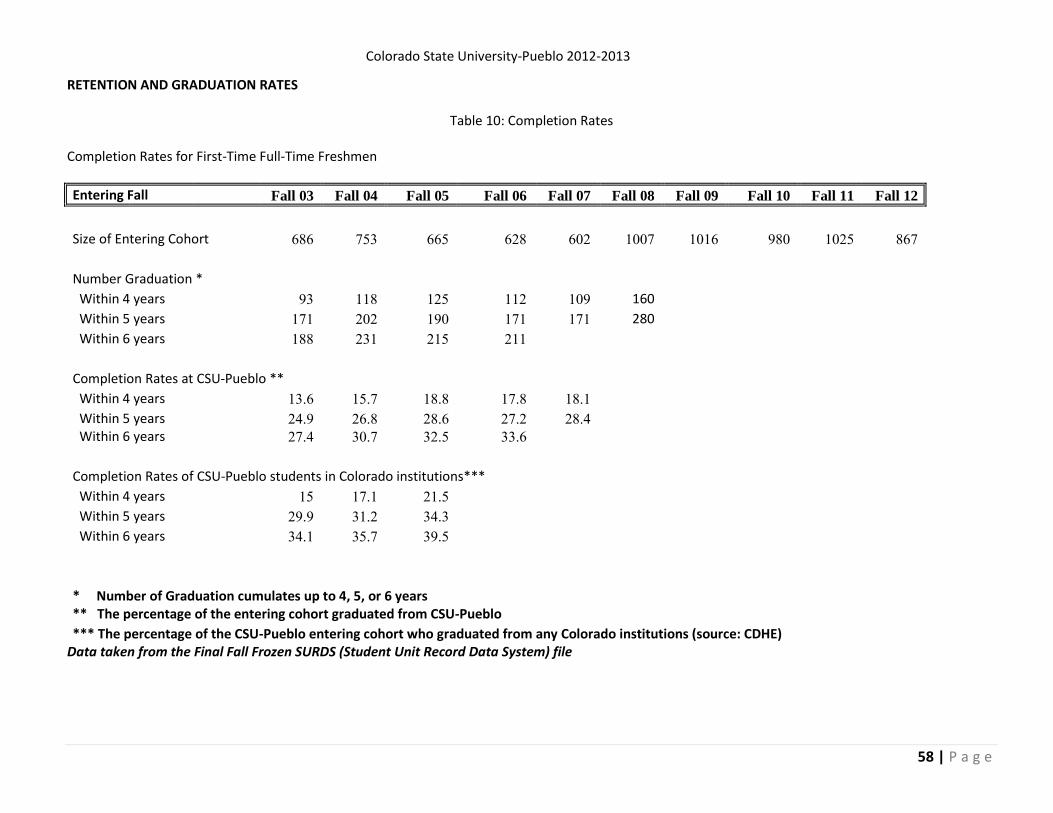
Colorado State University-Pueblo 2012-2013
58 | P a g e
RETENTION AND GRADUATION RATES
Table 10: Completion Rates
Completion Rates for First-Time Full-Time Freshmen
Entering Fall Fall 03 Fall 04 Fall 05 Fall 06 Fall 07 Fall 08 Fall 09 Fall 10 Fall 11 Fall 12
Size of Entering Cohort 686 753 665 628 602 1007 1016 980 1025 867
Number Graduation * Within 4 years
93 118 125 112 109 160
Within 5 years
171 202 190 171 171 280 Within 6 years
188 231 215 211
Completion Rates at CSU-Pueblo ** Within 4 years
13.6 15.7 18.8 17.8 18.1
Within 5 years
24.9 26.8 28.6 27.2 28.4 Within 6 years
27.4 30.7 32.5 33.6
Completion Rates of CSU-Pueblo students in Colorado institutions*** Within 4 years
15 17.1 21.5
Within 5 years
29.9 31.2 34.3 Within 6 years
34.1 35.7 39.5
* Number of Graduation cumulates up to 4, 5, or 6 years ** The percentage of the entering cohort graduated from CSU-Pueblo
*** The percentage of the CSU-Pueblo entering cohort who graduated from any Colorado institutions (source: CDHE) Data taken from the Final Fall Frozen SURDS (Student Unit Record Data System) file

Colorado State University-Pueblo 2012-2013
59 | P a g e
DEGREE AWARDED Table 11: Degrees* Granted by Level, Gender, or Ethnicity
Degree 2003-04 2004-05 2005-06 2006-07 2007-08 2008-09 2009-10 2010-11 2011-12 2012-13
Bachelor
796 722 754 768 742 722 781 738 785 889 % 96.1 94.6 92.7 92.4 92.8 91.2 89.1 84.7 89.7 89.7 Graduate
32 41 59 63 58 70 96 133 90 102
% 3.9 5.4 7.3 7.6 7.3 8.8 10.9 15.3 10.3 10.3 Total 828 763 813 831 800 792 877 871 875 991
UNDERGRADUATE DEGREE DISTRIBUTION BY GENDER 2003-04 2004-05 2005-06 2006-07 2007-08 2008-09 2009-10 2010-11 2011-12 2012-13
Female
488 419 472 497 460 451 458 447 478 564 % 61.3 58.0 62.6 64.7 62.0 62.5 58.6 60.6 60.9 56.9 Male
308 303 282 271 282 271 323 291 307 427
% 38.7 42.0 37.4 35.3 38.0 37.5 41.4 39.4 39.1 43.1 Total 796 722 754 768 742 722 781 738 785 991
UNDERGRADUATE DEGREE DISTRIBUTION BY ETHNICITY 2003-04 2004-05 2005-06 2006-07 2007-08 2008-09 2009-10 2010-11 2011-12 2012-13
Native American 9 17 13 13 10 5 12 7 14 10 %
1.1 2.4 1.7 1.7 1.3 0.7 1.5 0.9 1.8 1.0
Black, non-Hispanic 1.1 2.4 1.7 1.7 1.3 0.7 1.5 0.9 1.8 1.0 %
4.9 5.0 5.2 4.8 4.3 5.7 6.1 5.3 6.8 7.3
Asian or Pacific Islander 16 15 16 20 14 22 38 16 20 25 %
2.0 2.1 2.1 2.6 1.9 3.0 4.9 2.2 2.5 2.5
Hispanic
192 182 179 174 163 179 164 157 176 222 %
24.1 25.2 23.7 22.7 22.0 24.8 21.0 21.3 22.4 22.4
Non-resident Alien 28 28 23 13 22 23 17 12 12 47 %
3.5 3.9 3.1 1.7 3.0 3.2 2.2 1.6 1.5 4.7
White, non-Hispanic 486 418 453 471 454 401 453 458 456 560 %
61.1 57.9 60.1 61.3 61.2 55.5 58.0 62.1 58.1 56.5
Unknown
26 26 31 40 47 51 49 48 50 49 %
3.3 3.6 4.1 5.2 6.3 7.1 6.3 6.5 6.4 4.9
Multiple
1 4 6 %
0.1 0.5 0.6
Total
796 722 754 768 742 722 781 738 785 991
*Degrees reflect number of degrees not headcount (e.g., one student may have multiple degrees)
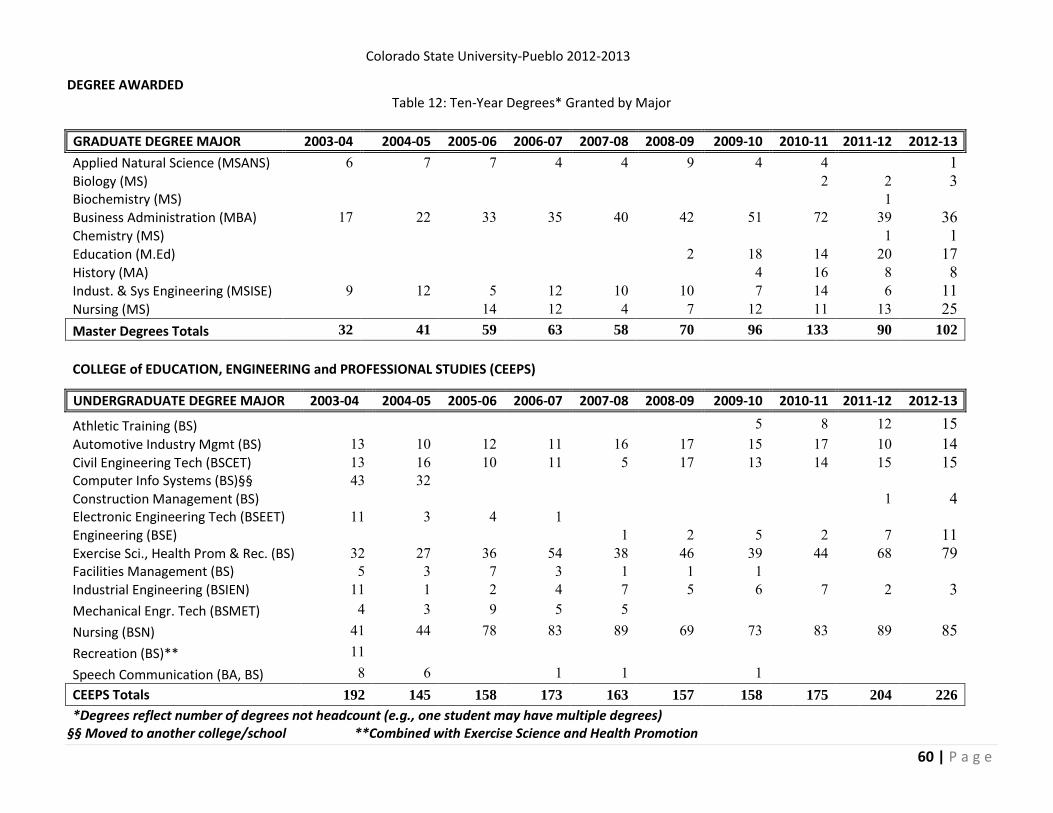
Colorado State University-Pueblo 2012-2013
60 | P a g e
DEGREE AWARDED Table 12: Ten-Year Degrees* Granted by Major
GRADUATE DEGREE MAJOR 2003-04 2004-05 2005-06 2006-07 2007-08 2008-09 2009-10 2010-11 2011-12 2012-13
Applied Natural Science (MSANS) 6 7 7 4 4 9 4 4 1 Biology (MS) 2 2 3 Biochemistry (MS) 1 Business Administration (MBA) 17 22 33 35 40 42 51 72 39 36 Chemistry (MS) 1 1 Education (M.Ed) 2 18 14 20 17 History (MA) 4 16 8 8 Indust. & Sys Engineering (MSISE) 9 12 5 12 10 10 7 14 6 11 Nursing (MS) 14 12 4 7 12 11 13 25 Master Degrees Totals 32 41 59 63 58 70 96 133 90 102
COLLEGE of EDUCATION, ENGINEERING and PROFESSIONAL STUDIES (CEEPS)
UNDERGRADUATE DEGREE MAJOR 2003-04 2004-05 2005-06 2006-07 2007-08 2008-09 2009-10 2010-11 2011-12 2012-13
Athletic Training (BS) 5 8 12 15 Automotive Industry Mgmt (BS) 13 10 12 11 16 17 15 17 10 14 Civil Engineering Tech (BSCET) 13 16 10 11 5 17 13 14 15 15 Computer Info Systems (BS)§§ 43 32 Construction Management (BS) 1 4 Electronic Engineering Tech (BSEET) 11 3 4 1 Engineering (BSE) 1 2 5 2 7 11 Exercise Sci., Health Prom & Rec. (BS) 32 27 36 54 38 46 39 44 68 79 Facilities Management (BS) 5 3 7 3 1 1 1 Industrial Engineering (BSIEN) 11 1 2 4 7 5 6 7 2 3 Mechanical Engr. Tech (BSMET) 4 3 9 5 5 Nursing (BSN) 41 44 78 83 89 69 73 83 89 85 Recreation (BS)** 11 Speech Communication (BA, BS) 8 6 1 1 1 CEEPS Totals 192 145 158 173 163 157 158 175 204 226
*Degrees reflect number of degrees not headcount (e.g., one student may have multiple degrees) §§ Moved to another college/school **Combined with Exercise Science and Health Promotion

Colorado State University-Pueblo 2012-2013
61 | P a g e
DEGREE AWARDED Table 12: Ten-Year Degrees* Granted by Major (Continued)
HASAN SCHOOL of BUSINESS (HSB)
UNDERGRADUATE DEGREE MAJOR 2003-04 2004-05 2005-06 2006-07 2007-08 2008-09 2009-10 2010-11 2011-12 2012-13
Accounting (BSBA) 16 17 15 19 31 17 20 18 18 23 Business Management (BSBA) 82 98 72 91 74 84 106 84 99 111 Computer Information Systems (BS) 42 20 17 21 14 26 21 20 Economics (BSBA) 15 8 16 16 16 7 16 4 15 13 HSB Totals 113 123 145 146 138 129 156 132 153 167
COLLEGE of SCIENCE and MATHEMATICS (CSM)
UNDERGRADUATE DEGREE MAJOR 2003-04 2004-05 2005-06 2006-07 2007-08 2008-09 2009-10 2010-11 2011-12 2012-13
Biology (BS) 24 32 29 42 32 42 45 41 27 26 Chemistry (BS) 9 5 4 8 11 11 12 10 8 3 Mathematics (BA, BS) 16 9 10 10 6 8 11 8 9 8 Physics (BS) 2 2 2 2 4 5 CSM Totals 51 48 43 60 49 63 68 61 48 42
*Degrees reflect number of degrees not headcount (e.g., one student may have multiple degrees)
Data taken from the Degrees Granted File

Colorado State University-Pueblo 2012-2013
62 | P a g e
DEGREE AWARDED
Table 12: Ten-Year Degrees* Granted by Major (Continued)
COLLEGE of HUMANITIES and SOCIAL SCIENCES (CHASS)
UNDERGRADUATE DEGREE MAJOR 2003-04 2004-05 2005-06 2006-07 2007-08 2008-09 2009-10 2010-11 2011-12 2012-13
Art (BA, BS) 16 21 16 22 25 26 24 12 23 31 English (BA) 20 18 25 15 20 31 24 24 29 32 Foreign Language Spanish (BA) 11 5 8 7 8 8 11 10 9 16 History (BA) 18 22 25 33 18 20 27 21 20 17 Liberal Studies (BS) 51 45 43 48 66 36 59 48 43 40 Mass Communications (BA, BS) 50 57 47 52 47 48 46 41 40 61 Music (BA) 7 7 10 11 9 15 14 15 14 14 Political Science (BA, BS) 8 13 8 11 8 11 11 14 8 15 Psychology (BA, BS) 58 25 35 41 33 28 24 34 36 44 Social Science (BA, BS) 51 32 21 16 16 5 19 6 10 11 Social Work (BSW) 30 38 41 33 34 27 33 36 33 57 Sociology (BA, BS) 120 123 129 100 108 118 107 109 115 116 CHASS Totals 440 406 408 389 392 373 399 370 380 454
Bachelor Degrees Totals 796 722 754 768 742 722 781 738 785 889
UNIVERSITY TOTALS 828 763 813 831 800 792 877 871 875 991
* Degrees reflect number of degrees not headcount (e.g., one student may have multiple degrees)
Data taken from the Degrees Granted File (a standard CDHE file)
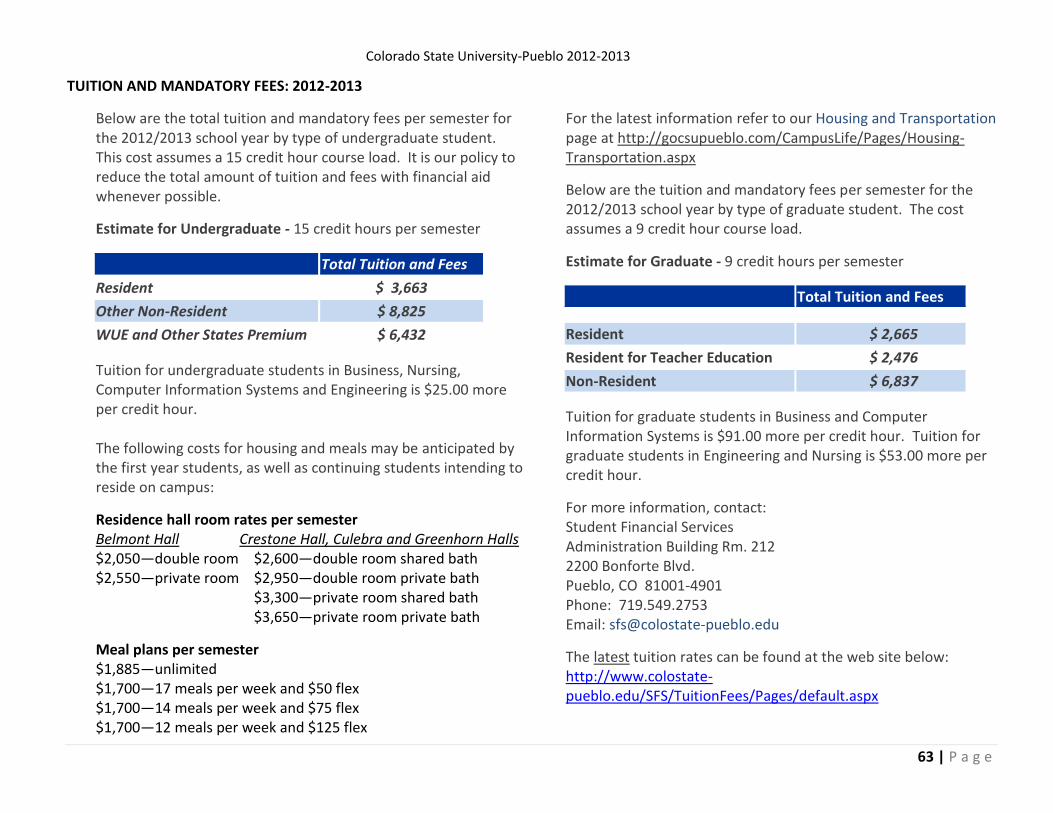
Colorado State University-Pueblo 2012-2013
63 | P a g e
TUITION AND MANDATORY FEES: 2012-2013
Below are the total tuition and mandatory fees per semester for the 2012/2013 school year by type of undergraduate student. This cost assumes a 15 credit hour course load. It is our policy to reduce the total amount of tuition and fees with financial aid whenever possible.
Estimate for Undergraduate - 15 credit hours per semester
Total Tuition and Fees
Resident $ 3,663
Other Non-Resident $ 8,825
WUE and Other States Premium $ 6,432
Tuition for undergraduate students in Business, Nursing, Computer Information Systems and Engineering is $25.00 more per credit hour. The following costs for housing and meals may be anticipated by the first year students, as well as continuing students intending to reside on campus:
Residence hall room rates per semester Belmont Hall Crestone Hall, Culebra and Greenhorn Halls $2,050—double room $2,600—double room shared bath $2,550—private room $2,950—double room private bath $3,300—private room shared bath
$3,650—private room private bath
Meal plans per semester $1,885—unlimited $1,700—17 meals per week and $50 flex $1,700—14 meals per week and $75 flex $1,700—12 meals per week and $125 flex
For the latest information refer to our Housing and Transportation page at http://gocsupueblo.com/CampusLife/Pages/Housing-Transportation.aspx
Below are the tuition and mandatory fees per semester for the 2012/2013 school year by type of graduate student. The cost assumes a 9 credit hour course load.
Estimate for Graduate - 9 credit hours per semester
Total Tuition and Fees
Resident $ 2,665
Resident for Teacher Education $ 2,476
Non-Resident $ 6,837
Tuition for graduate students in Business and Computer Information Systems is $91.00 more per credit hour. Tuition for graduate students in Engineering and Nursing is $53.00 more per credit hour.
For more information, contact: Student Financial Services Administration Building Rm. 212 2200 Bonforte Blvd. Pueblo, CO 81001-4901 Phone: 719.549.2753 Email: [email protected]
The latest tuition rates can be found at the web site below: http://www.colostate-pueblo.edu/SFS/TuitionFees/Pages/default.aspx
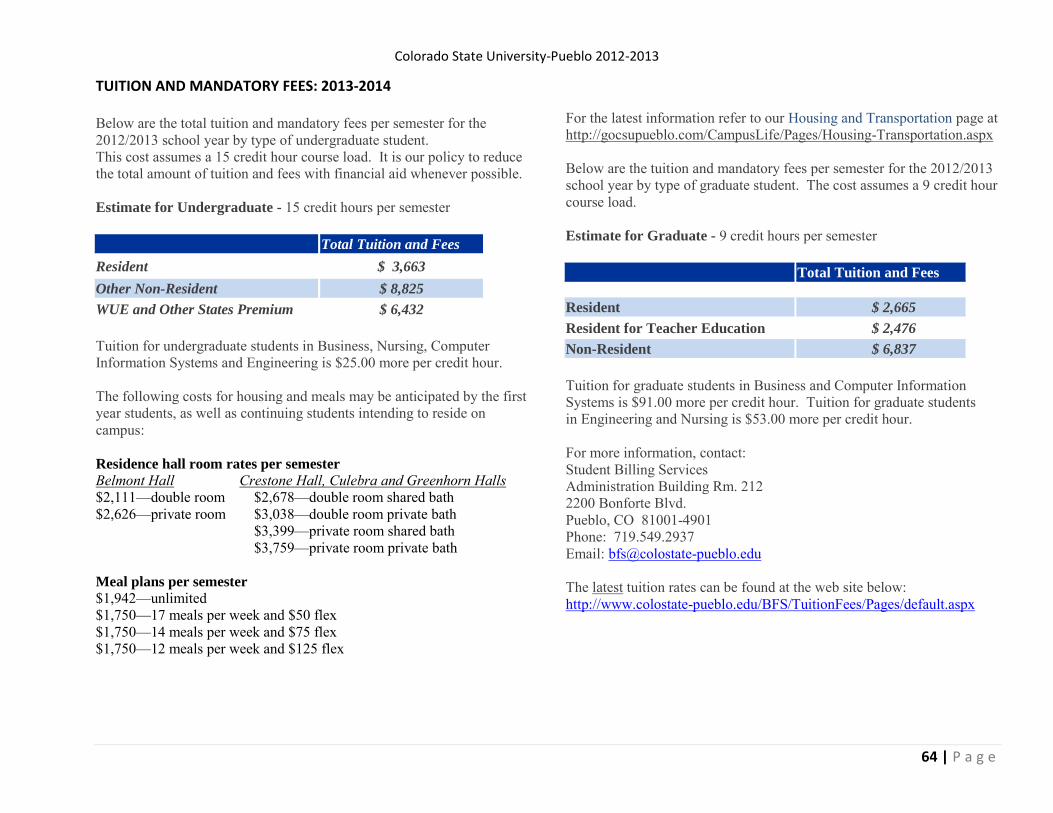
Colorado State University-Pueblo 2012-2013
64 | P a g e
TUITION AND MANDATORY FEES: 2013-2014 Below are the total tuition and mandatory fees per semester for the 2012/2013 school year by type of undergraduate student. This cost assumes a 15 credit hour course load. It is our policy to reduce the total amount of tuition and fees with financial aid whenever possible. Estimate for Undergraduate - 15 credit hours per semester
Total Tuition and Fees Resident $ 3,663 Other Non-Resident $ 8,825 WUE and Other States Premium $ 6,432 Tuition for undergraduate students in Business, Nursing, Computer Information Systems and Engineering is $25.00 more per credit hour. The following costs for housing and meals may be anticipated by the first year students, as well as continuing students intending to reside on campus: Residence hall room rates per semester
Belmont Hall Crestone Hall, Culebra and Greenhorn Halls $2,111—double room $2,678—double room shared bath $2,626—private room $3,038—double room private bath $3,399—private room shared bath
$3,759—private room private bath
Meal plans per semester $1,942—unlimited $1,750—17 meals per week and $50 flex $1,750—14 meals per week and $75 flex $1,750—12 meals per week and $125 flex
For the latest information refer to our Housing and Transportation page at http://gocsupueblo.com/CampusLife/Pages/Housing-Transportation.aspx Below are the tuition and mandatory fees per semester for the 2012/2013 school year by type of graduate student. The cost assumes a 9 credit hour course load.
Estimate for Graduate - 9 credit hours per semester Total Tuition and Fees
Resident $ 2,665 Resident for Teacher Education $ 2,476 Non-Resident $ 6,837
Tuition for graduate students in Business and Computer Information Systems is $91.00 more per credit hour. Tuition for graduate students in Engineering and Nursing is $53.00 more per credit hour. For more information, contact: Student Billing Services Administration Building Rm. 212 2200 Bonforte Blvd. Pueblo, CO 81001-4901 Phone: 719.549.2937 Email: [email protected] The latest tuition rates can be found at the web site below: http://www.colostate-pueblo.edu/BFS/TuitionFees/Pages/default.aspx
Colorado State University-Pueblo 2012-2013
65 | P a g e
ESTIMATED COST OF ATTENDANCE FOR UNDERGRADUATE RESIDENTS The annual cost for tuition, fees, books, and room and board is approximately $17,126 for full time Colorado residents living in on campus housing. The actual costs of housing may be much different, and the cost for a student from another state will be different as well. Students may also be eligible for various forms of financial aid, thereby reducing the actual cost. Financial need is a factor in determining the financial aid eligibility and actual cost. Financial need is the difference between the Cost of Attendance (COA) and the Expected Family Contribution (EFC) as calculated by the U.S. Department of Education via the Free Application for Federal Student Aid (FAFSA). Financial need can be expressed as a simple equation: (COA – EFC = financial need) For each student, the COA, EFC, and financial need will be different. Financial aid is offered to help students cover their financial need depending on available funding and specific student characteristics. So, as an example, if the COA is $17,126 and the EFC is $10,000, the financial need is, thus $7,126. This need may be met by grants, scholarships, work programs, and/or loans. To determine what the Expected Family Contribution (EFC) is, students should complete the FAFSA or FAFSA 4caster at http://www.fafsa.gov
Below are the steps to take to determine how much it will cost to attend CSU-Pueblo.
Estimate the actual Cost Of Attendance (COA) using tuition and fee information at http://www.colostate-pueblo.edu/BFS/TuitionFees/Pages/default.aspx Use the figure provided for other expenses, i.e., supplies, transportation, and medical, and use actual housing costs if living off campus.
Find the Expected Family Contribution (EFC) at http://www.fafsa.gov
Determine the Financial Need by subtracting the EFC from the COA.
A Net Price Calculator (NPC) estimating the cost of attending CSU-Pueblo can be located at http://www.colostate-pueblo.edu/IR/NetPriceCalculator/Pages/default.aspx Complete the FAFSA and the CSU-Pueblo scholarship application. Both applications are found at the Financial Aid Website at https://www.colostate-pueblo.edu/FinancialAid Complete each year no later than March 1 to maximize financial aid eligibility.
Colorado State University-Pueblo 2012-2013
66 | P a g e
FINANCIAL AID At CSU-Pueblo we are committed to helping students explore financing options to help them achieve their educational goals. Approximately 80 percent of our students receive some type of assistance such as federal, state and institutional grants, scholarships, a variety of student employment programs, and federal student loans. Students may apply for financial aid by completing and submitting the Free Application for Federal Student Aid (FAFSA) at www.fafsa.gov. Priority is given to students who complete the FAFSA by March 1 each year (prior to that academic year's
fall semester). The CSU-Pueblo school code is 001365. Students who want to be considered for all University grants or scholarships must also complete the scholarship application by March 1 each year. For more detailed information on the types of aid available and for other financial aid questions please visit our website at http://www.colostate-pueblo.edu/FinancialAid/ .


Colorado State University-Pueblo 2012-2013
68 | P a g e
ALUMNI CSU-Pueblo Alumni Association provides activities that connect alumni to the University, including benefit programs, and educational and social networking opportunities which allow graduates to stay in touch with friends, faculty, and mentors. The Alumni Association is the source for alumni updates, invitations, and a bi-annual alumni magazine. Annual Alumni Association events include pre-Football Game Tailgate Parties, outreach events across the US, Homecoming activities, and the Commencement reception. Benefits to members through the Alumni Association include a student and alumni discount program, reduced rates for membership at the Student Recreation Center, insurance affinity discount, and CSU-Pueblo license plates.
Contact the CSU-Pueblo Alumni Association at: CSU-Pueblo Alumni Association 2200 Bonforte Blvd. Pueblo, CO 81001 719-549-2858 [email protected] Or visit us online at: http://alumni.colostate-pueblo.edu Stay connected via Facebook, LinkedIn and Twitter
The Office of Alumni has provided the following Alumni data.
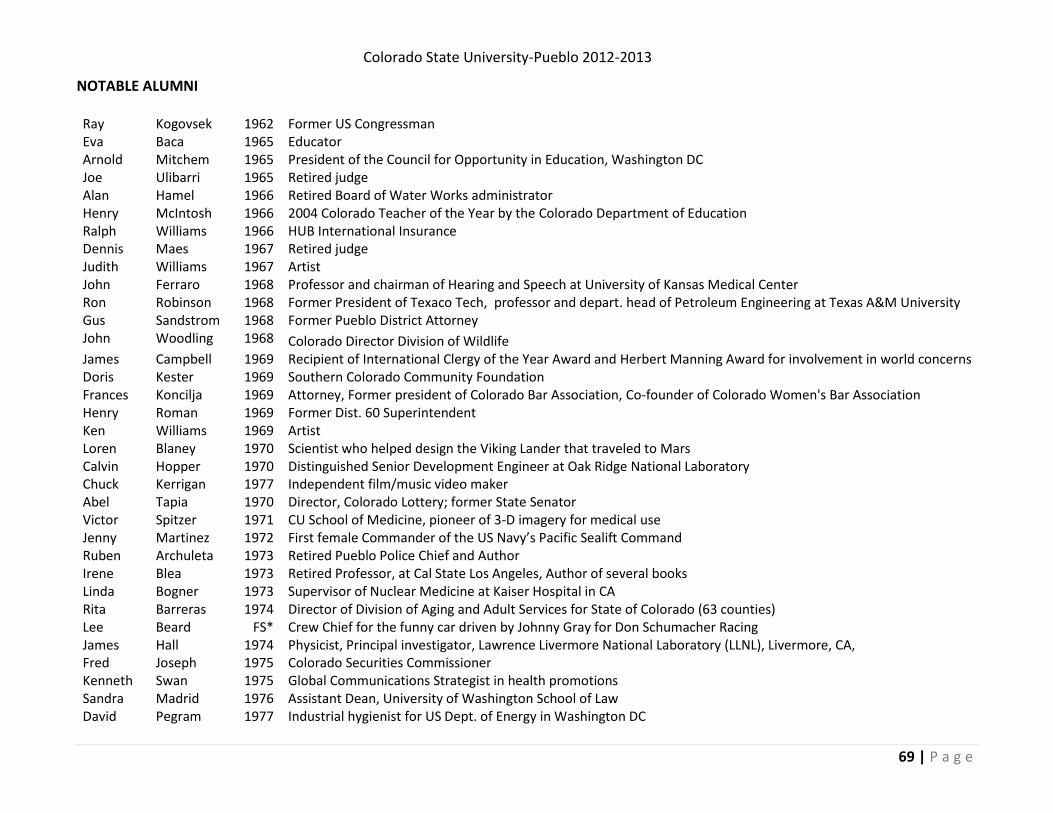
Colorado State University-Pueblo 2012-2013
69 | P a g e
NOTABLE ALUMNI Ray Kogovsek 1962 Former US Congressman Eva Baca 1965 Educator Arnold Mitchem 1965 President of the Council for Opportunity in Education, Washington DC Joe Ulibarri 1965 Retired judge Alan Hamel 1966 Retired Board of Water Works administrator Henry McIntosh 1966 2004 Colorado Teacher of the Year by the Colorado Department of Education Ralph Williams 1966 HUB International Insurance Dennis Maes 1967 Retired judge Judith Williams 1967 Artist John Ferraro 1968 Professor and chairman of Hearing and Speech at University of Kansas Medical Center Ron Robinson 1968 Former President of Texaco Tech, professor and depart. head of Petroleum Engineering at Texas A&M University Gus Sandstrom 1968 Former Pueblo District Attorney John Woodling 1968 Colorado Director Division of Wildlife James Campbell 1969 Recipient of International Clergy of the Year Award and Herbert Manning Award for involvement in world concerns Doris Kester 1969 Southern Colorado Community Foundation Frances Koncilja 1969 Attorney, Former president of Colorado Bar Association, Co-founder of Colorado Women's Bar Association Henry Roman 1969 Former Dist. 60 Superintendent Ken Williams 1969 Artist Loren Blaney 1970 Scientist who helped design the Viking Lander that traveled to Mars Calvin Hopper 1970 Distinguished Senior Development Engineer at Oak Ridge National Laboratory Chuck Kerrigan 1977 Independent film/music video maker Abel Tapia 1970 Director, Colorado Lottery; former State Senator Victor Spitzer 1971 CU School of Medicine, pioneer of 3-D imagery for medical use Jenny Martinez 1972 First female Commander of the US Navy’s Pacific Sealift Command Ruben Archuleta 1973 Retired Pueblo Police Chief and Author Irene Blea 1973 Retired Professor, at Cal State Los Angeles, Author of several books Linda Bogner 1973 Supervisor of Nuclear Medicine at Kaiser Hospital in CA Rita Barreras 1974 Director of Division of Aging and Adult Services for State of Colorado (63 counties) Lee Beard FS* Crew Chief for the funny car driven by Johnny Gray for Don Schumacher Racing James Hall 1974 Physicist, Principal investigator, Lawrence Livermore National Laboratory (LLNL), Livermore, CA, Fred Joseph 1975 Colorado Securities Commissioner Kenneth Swan 1975 Global Communications Strategist in health promotions Sandra Madrid 1976 Assistant Dean, University of Washington School of Law David Pegram 1977 Industrial hygienist for US Dept. of Energy in Washington DC
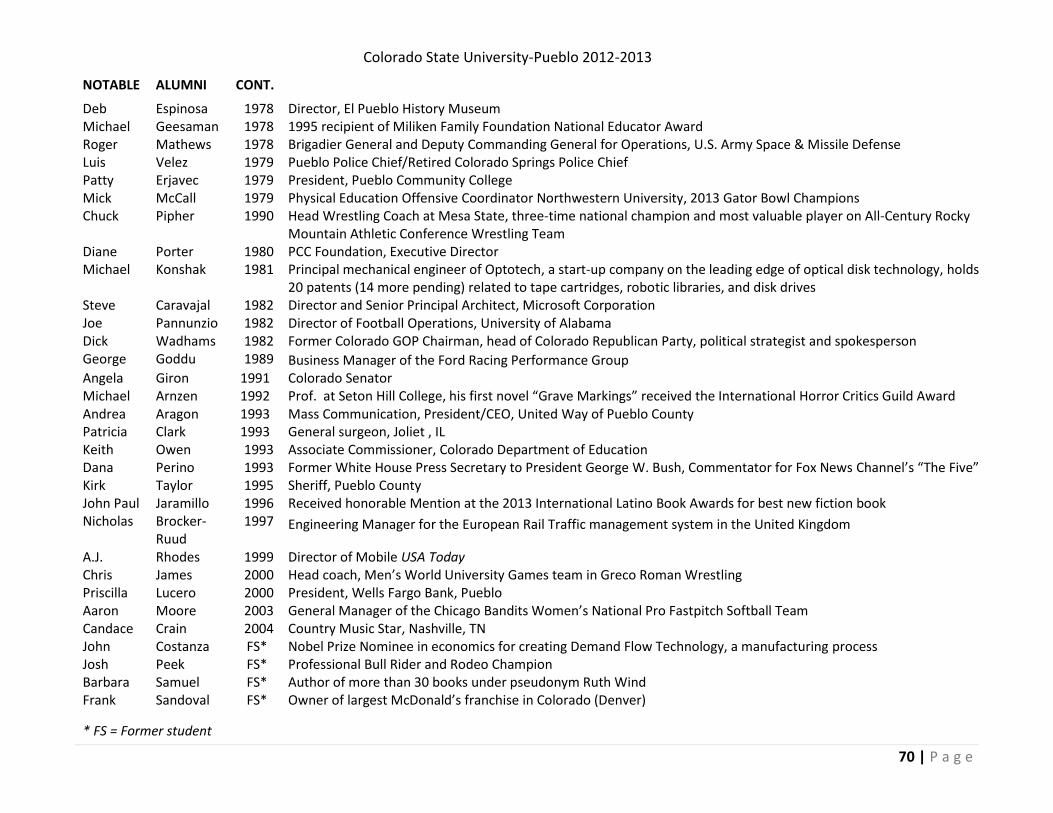
Colorado State University-Pueblo 2012-2013
70 | P a g e
NOTABLE ALUMNI CONT. Deb Espinosa 1978 Director, El Pueblo History Museum Michael Geesaman 1978 1995 recipient of Miliken Family Foundation National Educator Award Roger Mathews 1978 Brigadier General and Deputy Commanding General for Operations, U.S. Army Space & Missile Defense Luis Velez 1979 Pueblo Police Chief/Retired Colorado Springs Police Chief Patty Erjavec 1979 President, Pueblo Community College Mick McCall 1979 Physical Education Offensive Coordinator Northwestern University, 2013 Gator Bowl Champions Chuck Pipher 1990 Head Wrestling Coach at Mesa State, three-time national champion and most valuable player on All-Century Rocky
Mountain Athletic Conference Wrestling Team Diane Porter 1980 PCC Foundation, Executive Director Michael Konshak 1981 Principal mechanical engineer of Optotech, a start-up company on the leading edge of optical disk technology, holds
20 patents (14 more pending) related to tape cartridges, robotic libraries, and disk drives Steve Caravajal 1982 Director and Senior Principal Architect, Microsoft Corporation Joe Pannunzio 1982 Director of Football Operations, University of Alabama Dick Wadhams 1982 Former Colorado GOP Chairman, head of Colorado Republican Party, political strategist and spokesperson George Goddu 1989 Business Manager of the Ford Racing Performance Group Angela Giron 1991 Colorado Senator Michael Arnzen 1992 Prof. at Seton Hill College, his first novel “Grave Markings” received the International Horror Critics Guild Award Andrea Aragon 1993 Mass Communication, President/CEO, United Way of Pueblo County Patricia Clark 1993 General surgeon, Joliet , IL Keith Owen 1993 Associate Commissioner, Colorado Department of Education Dana Perino 1993 Former White House Press Secretary to President George W. Bush, Commentator for Fox News Channel’s “The Five” Kirk Taylor 1995 Sheriff, Pueblo County John Paul Jaramillo 1996 Received honorable Mention at the 2013 International Latino Book Awards for best new fiction book Nicholas Brocker-
Ruud 1997 Engineering Manager for the European Rail Traffic management system in the United Kingdom
A.J. Rhodes 1999 Director of Mobile USA Today Chris James 2000 Head coach, Men’s World University Games team in Greco Roman Wrestling Priscilla Lucero 2000 President, Wells Fargo Bank, Pueblo Aaron Moore 2003 General Manager of the Chicago Bandits Women’s National Pro Fastpitch Softball Team Candace Crain 2004 Country Music Star, Nashville, TN John Costanza FS* Nobel Prize Nominee in economics for creating Demand Flow Technology, a manufacturing process Josh Peek FS* Professional Bull Rider and Rodeo Champion Barbara Samuel FS* Author of more than 30 books under pseudonym Ruth Wind Frank Sandoval FS* Owner of largest McDonald’s franchise in Colorado (Denver)
* FS = Former student
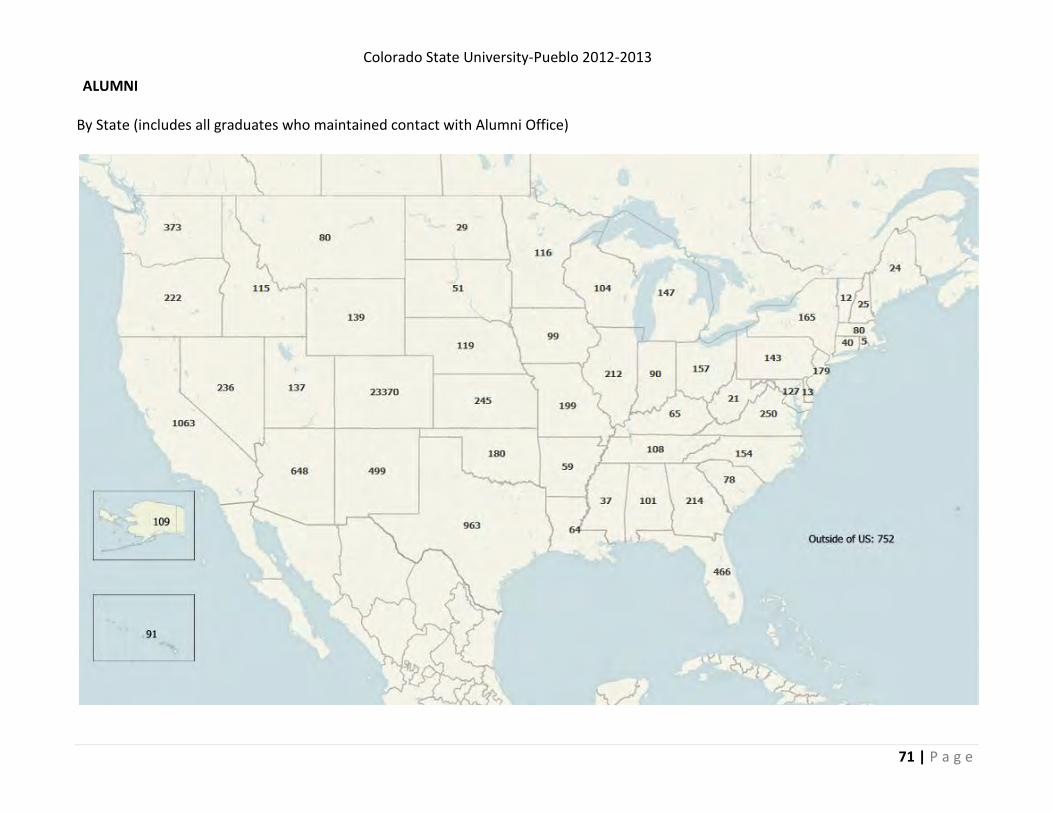
Colorado State University-Pueblo 2012-2013
71 | P a g e
ALUMNI By State (includes all graduates who maintained contact with Alumni Office)
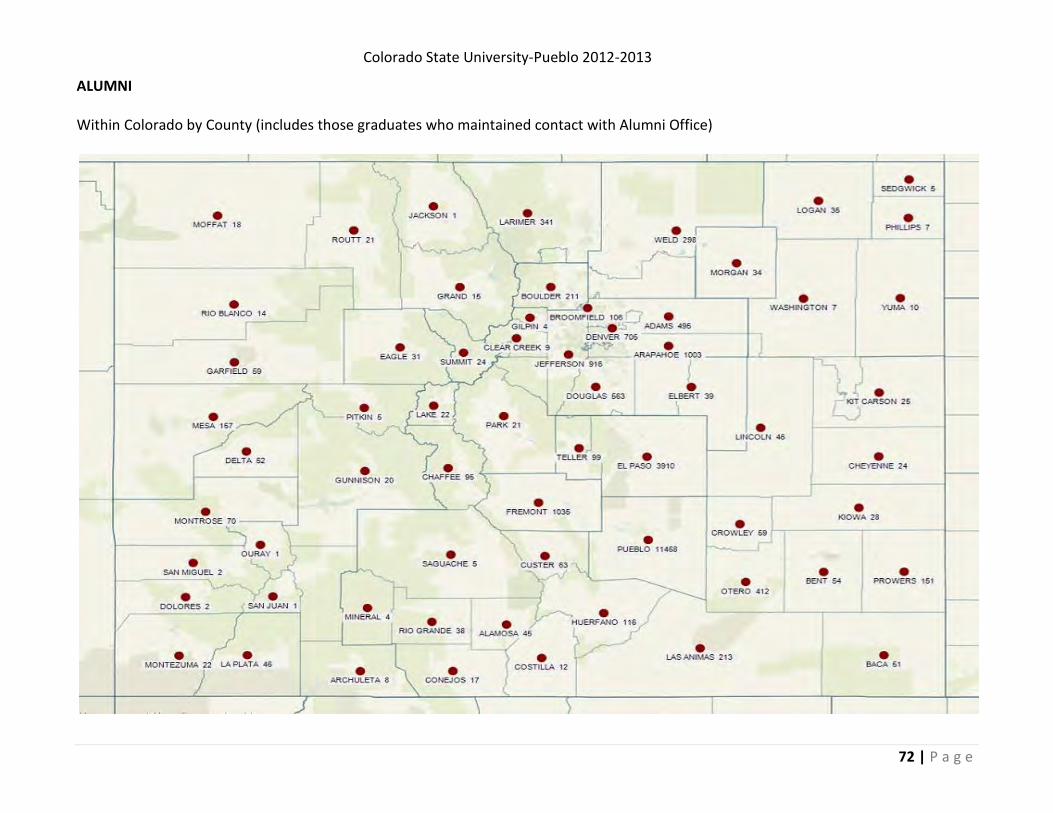
Colorado State University-Pueblo 2012-2013
72 | P a g e
ALUMNI Within Colorado by County (includes those graduates who maintained contact with Alumni Office)
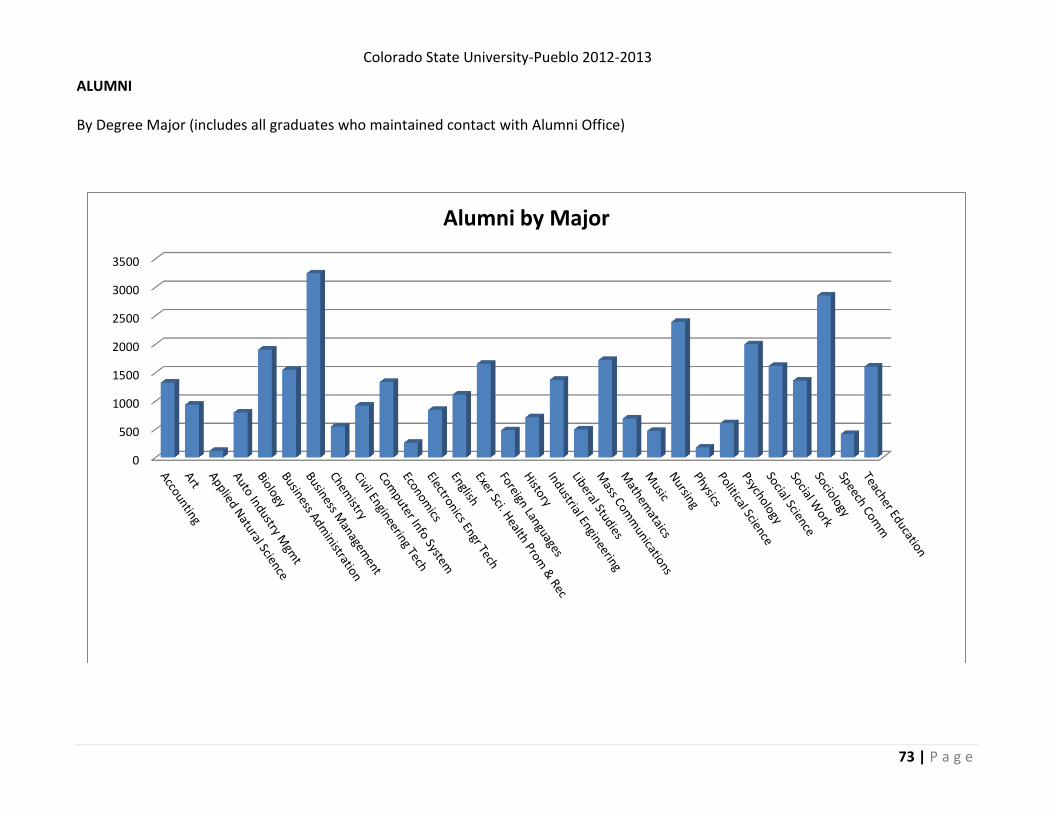
Colorado State University-Pueblo 2012-2013
73 | P a g e
ALUMNI By Degree Major (includes all graduates who maintained contact with Alumni Office)
0
500
1000
1500
2000
2500
3000
3500
Alumni by Major

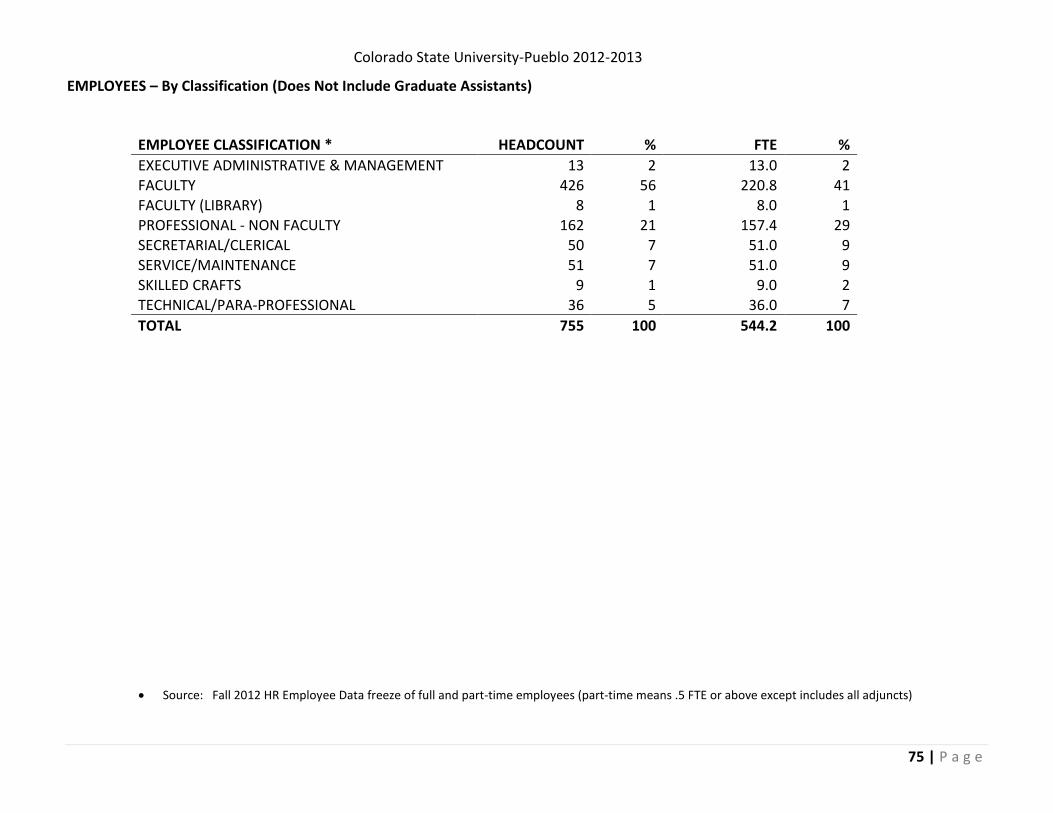
Colorado State University-Pueblo 2012-2013
75 | P a g e
EMPLOYEES – By Classification (Does Not Include Graduate Assistants)
EMPLOYEE CLASSIFICATION * HEADCOUNT % FTE %
EXECUTIVE ADMINISTRATIVE & MANAGEMENT 13 2 13.0 2 FACULTY 426 56 220.8 41 FACULTY (LIBRARY) 8 1 8.0 1 PROFESSIONAL - NON FACULTY 162 21 157.4 29 SECRETARIAL/CLERICAL 50 7 51.0 9
SERVICE/MAINTENANCE 51 7 51.0 9 SKILLED CRAFTS 9 1 9.0 2 TECHNICAL/PARA-PROFESSIONAL 36 5 36.0 7
TOTAL 755 100 544.2 100
Source: Fall 2012 HR Employee Data freeze of full and part-time employees (part-time means .5 FTE or above except includes all adjuncts)

Colorado State University-Pueblo 2012-2013
76 | P a g e
EMPLOYEES – Classification by Gender by Ethnicity
Classification by Gender by Ethnicity *
Executive/ Management
Faculty Faculty
(Library) Professional
Staff Secretarial
/Clerical Service/
Maintenance Skilled Crafts
Technical Total
N % N % N % N % N % N % N % N %
African Am 15 2.0 Male 5 1.2 3 1.9 1 2.0 1 2.8 10 1.3
Female 2 0.5 2 1.2 1 2.0 5 0.7
Asian 22 2.9 Male 9 2.1 1 0.6 10 1.3
Female 8 1.9 2 1.2 1 2.0 1 2.8 12 1.6 Hispanic 163 21.6
Male 1 7.7 17 4.0 16 9.9 20 39.2 3 33.3 3 8.3 60 7.9 Female 33 7.7 31 19.1 19 38.0 9 17.6 1 11.1 10 27.8 103 13.6
White 519 68.7 Male 6 46.2 155 36.4 1 12.5 47 29.0 4 8.0 17 33.3 4 44.4 15 41.7 249 33.0
Female 5 38.5 171 40.1 7 87.5 54 33.3 25 50.0 2 3.9 1 11.1 5 13.9 270 35.8 Multiple 4 0.5
Male 1 0.2 1 0.6 2 0.3 Female 1 0.2 1 0.6 2 0.3
Foreign 3 0.4 Male 1 0.2 1 0.1
Female 1 0.5 2 0.3 Unknown 28 3.7
Male 1 7.7 12 2.8 2 1.2 1 2.0 1 2.8 16 2.1
Female 9 2.1 2 1.2 1 2.0 12 1.6
Total 13 426 8 162 50 51 9 36 755 Male 8 61.5 200 46.9 1 12.5 70 43.2 4 8.0 39 76.5 7 77.8 20 55.6 349 46.2
Female 5 38.5 226 53.1 7 87.5 92 56.8 46 92.0 12 23.5 2 22.2 16 44.4 406 53.8
* Source: Fall 2012 HR Employee Data freeze of full and part-time employees (part-time means .5 FTE or above except includes all adjuncts)
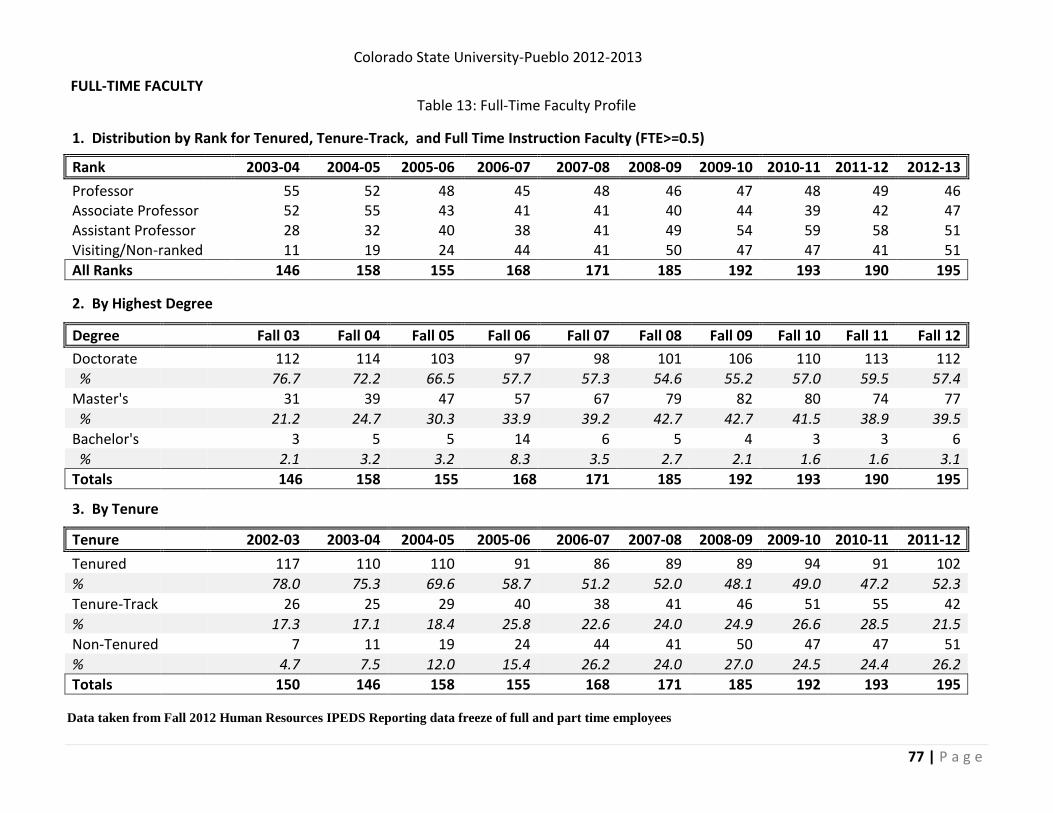
Colorado State University-Pueblo 2012-2013
77 | P a g e
FULL-TIME FACULTY Table 13: Full-Time Faculty Profile
1. Distribution by Rank for Tenured, Tenure-Track, and Full Time Instruction Faculty (FTE>=0.5) Rank 2003-04 2004-05 2005-06 2006-07 2007-08 2008-09 2009-10 2010-11 2011-12 2012-13
Professor
55 52 48 45 48 46 47 48 49 46 Associate Professor 52 55 43 41 41 40 44 39 42 47 Assistant Professor 28 32 40 38 41 49 54 59 58 51 Visiting/Non-ranked
11 19 24 44 41 50 47 47 41 51
All Ranks 146 158 155 168 171 185 192 193 190 195
2. By Highest Degree Degree Fall 03 Fall 04 Fall 05 Fall 06 Fall 07 Fall 08 Fall 09 Fall 10 Fall 11 Fall 12
Doctorate 112 114 103 97 98 101 106 110 113 112 %
76.7 72.2 66.5 57.7 57.3 54.6 55.2 57.0 59.5 57.4
Master's
31 39 47 57 67 79 82 80 74 77
%
21.2 24.7 30.3 33.9 39.2 42.7 42.7 41.5 38.9 39.5
Bachelor's 3 5 5 14 6 5 4 3 3 6
%
2.1 3.2 3.2 8.3 3.5 2.7 2.1 1.6 1.6 3.1
Totals
146 158 155 168 171 185 192 193 190 195
3. By Tenure
Tenure 2002-03 2003-04 2004-05 2005-06 2006-07 2007-08 2008-09 2009-10 2010-11 2011-12
Tenured
117 110 110 91 86 89 89 94 91 102
% 78.0 75.3 69.6 58.7 51.2 52.0 48.1 49.0 47.2 52.3
Tenure-Track 26 25 29 40 38 41 46 51 55 42
% 17.3 17.1 18.4 25.8 22.6 24.0 24.9 26.6 28.5 21.5
Non-Tenured 7 11 19 24 44 41 50 47 47 51
% 4.7 7.5 12.0 15.4 26.2 24.0 27.0 24.5 24.4 26.2
Totals 150 146 158 155 168 171 185 192 193 195
Data taken from Fall 2012 Human Resources IPEDS Reporting data freeze of full and part time employees

Colorado State University-Pueblo 2012-2013
78 | P a g e
FULL-TIME FACULTY Table 13: Full-Time Faculty Profile (Continued)
4. By Gender
Gender 2003-04 2004-05 2005-06 2006-07 2007-08 2008-09 2009-10 2010-11 2011-12 2012-13
Female
53 65 66 81 81 92 92 94 88 89
% 36.3 41.1 42.6 48.2 47.4 49.7 47.9 48.7 46.3 45.6
Male
93 93 89 87 90 93 100 99 102 106
% 63.7 58.9 57.4 51.8 52.6 50.3 52.1 51.3 53.7 54.4
Totals 146 158 155 168 171 185 192 193 190 195
5. By Ethnicity Ethnicity 2003-04 2004-05 2005-06 2006-07 2007-08 2008-09 2009-10 2010-11 2011-12 2012-13
White, non-Hispanic 117 122 121 131 130 136 144 143 136 141 %
80.1 77.2 78.1 78.0 76.0 73.5 75.0 74.1 71.6 72.3
Hispanic
17 17 16 18 18 20 21 19 19 21
%
11.6 10.8 10.3 10.7 10.5 10.8 10.9 9.8 10.0 10.8
Black, non-Hispanic 4 4 5 4 4 5 6 6 5 5
%
2.7 2.5 3.2 2.4 2.3 2.7 3.1 3.1 2.6 2.6
Native American 1 1 %
0.7 0.6
Asian or Pacific Islander 7 8 6 6 7 9 9 9 13 13
%
4.8 5.1 3.9 3.6 4.1 4.8 4.7 4.7 6.8 6.7
Unknown
6 7 9 10 13 10 12 13 12
%
3.8 4.5 5.4 5.8 7.0 5.2 6.2 6.8 6.2
Foreign
2 2 2 4 3 2 %
1.2 1.1 1.0 2.1 1.6 1.0
Multiple
1 1
%
0.5 0.5
Total
146 158 155 168 171 185 192 193 190 195 Data taken from Fall 2012 Human Resources IPEDS Reporting data freeze of full and part time employees

Colorado State University-Pueblo 2012-2013
79 | P a g e
FULL-TIME FACULTY
Table 13: Full-Time Faculty Profile (Continued)
6. Average Annual Salary by Rank Rank 2003-04 2004-05 2005-06 2006-07 2007-08 2008-09 2009-10 2010-11 2011-12 2012-13
Professor
60,002 63,250 65,884 70,325 70,959 73,731 74,765 76,834 79,223 81,878
Associate Professor 48,291 51,006 53,215 54,879 59,609 61,804 62,548 62,165 62,467 61,347 Assistant Professor 42,332 44,252 50,883 49,046 50,063 53,194 54,082 53,806 52,300 55,431 Visiting/Non-ranked
44,520 43,580 44,773 35,976 32,898 31,076 27,766 32,515 33,647 35,734
All Ranks 51,407 50,200 53,562 53,585 54,102 54,198 54,643 56,038 58,009 57,944
Data taken from Fall 2012 Human Resources IPEDS Reporting data freeze of full and part time employees
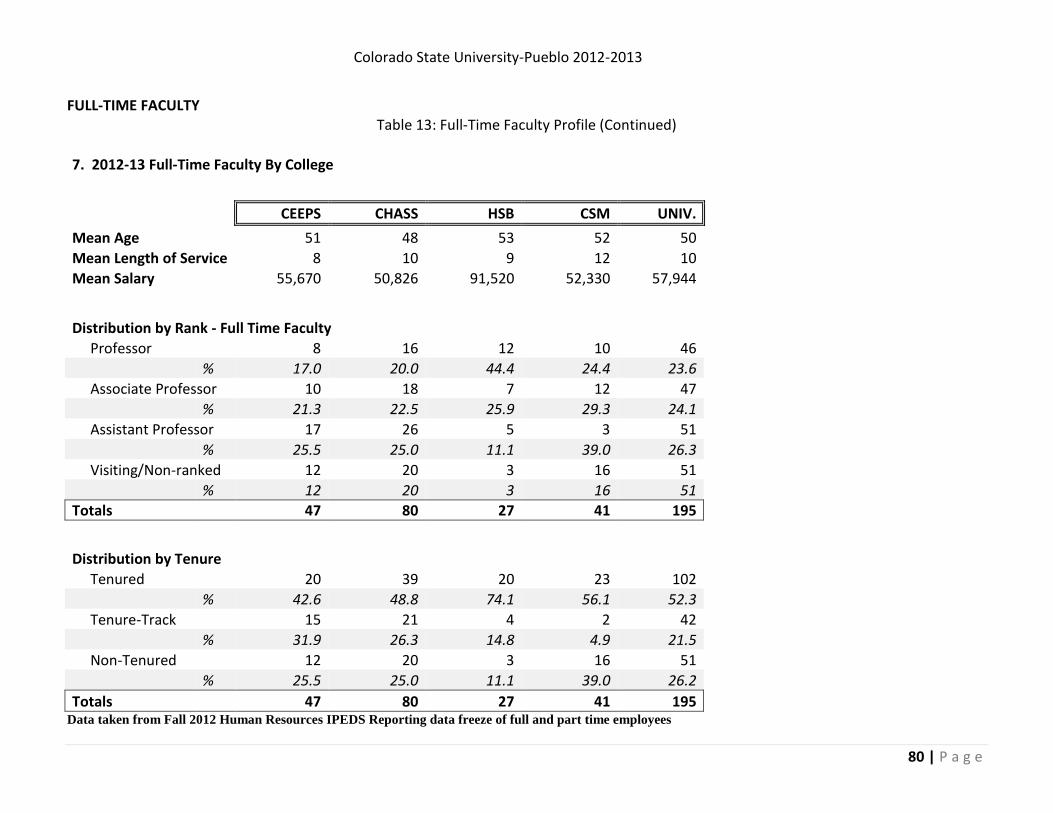
Colorado State University-Pueblo 2012-2013
80 | P a g e
FULL-TIME FACULTY
Table 13: Full-Time Faculty Profile (Continued)
7. 2012-13 Full-Time Faculty By College
CEEPS CHASS HSB CSM UNIV.
Mean Age 51 48 53 52 50
Mean Length of Service 8 10 9 12 10
Mean Salary 55,670 50,826 91,520 52,330 57,944
Distribution by Rank - Full Time Faculty Professor 8 16 12 10 46
% 17.0 20.0 44.4 24.4 23.6
Associate Professor 10 18 7 12 47
% 21.3 22.5 25.9 29.3 24.1
Assistant Professor 17 26 5 3 51
% 25.5 25.0 11.1 39.0 26.3
Visiting/Non-ranked 12 20 3 16 51
% 12 20 3 16 51
Totals 47 80 27 41 195
Distribution by Tenure Tenured 20 39 20 23 102
% 42.6 48.8 74.1 56.1 52.3
Tenure-Track 15 21 4 2 42
% 31.9 26.3 14.8 4.9 21.5
Non-Tenured 12 20 3 16 51
% 25.5 25.0 11.1 39.0 26.2
Totals
47 80 27 41 195 Data taken from Fall 2012 Human Resources IPEDS Reporting data freeze of full and part time employees
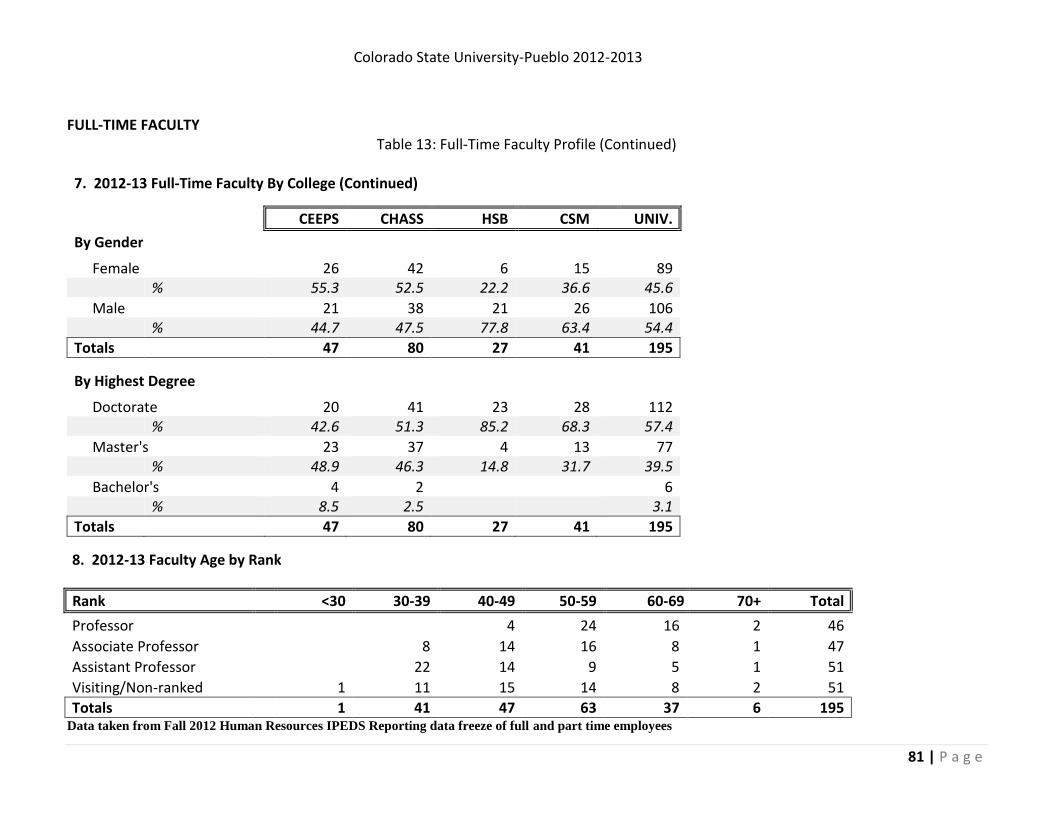
Colorado State University-Pueblo 2012-2013
81 | P a g e
FULL-TIME FACULTY
Table 13: Full-Time Faculty Profile (Continued)
7. 2012-13 Full-Time Faculty By College (Continued)
CEEPS CHASS HSB CSM UNIV.
By Gender Female 26 42 6 15 89
% 55.3 52.5 22.2 36.6 45.6
Male
21 38 21 26 106
% 44.7 47.5 77.8 63.4 54.4
Totals 47 80 27 41 195
By Highest Degree Doctorate 20 41 23 28 112
% 42.6 51.3 85.2 68.3 57.4
Master's 23 37 4 13 77
% 48.9 46.3 14.8 31.7 39.5
Bachelor's 4 2
6
% 8.5 2.5
3.1
Totals 47 80 27 41 195
8. 2012-13 Faculty Age by Rank
Rank <30 30-39 40-49 50-59 60-69 70+ Total
Professor
4 24 16 2 46
Associate Professor
8 14 16 8 1 47
Assistant Professor
22 14 9 5 1 51
Visiting/Non-ranked 1 11 15 14 8 2 51
Totals 1 41 47 63 37 6 195 Data taken from Fall 2012 Human Resources IPEDS Reporting data freeze of full and part time employees

Colorado State University-Pueblo 2012-2013
82 | P a g e
FULL-TIME FACULTY
Table 13: Full-Time Faculty Profile (Continued)
9. 2012-13 Faculty by Age and College
College <30 30-39 40-49 50-59 60-69 70+ Total
College of Ed., Engineer. & Professional Studies 8 13 18 7 1 47
College of Humanities and Social Sciences 1 22 19 20 17 1 80
College of Science and Mathematics 8 10 11 8 4 41
Hasan School of Business
3 5 14 5
27
Totals
1 41 47 63 37 6 195
Data taken from Fall 2012 Human Resources IPEDS Reporting data freeze of full and part time employees
0% 20% 40% 60% 80% 100%
College of Ed., Engineer. & Professional Studies
College of Humanities and Social Sciences
College of Science and Mathematics
Hasan School of Business
Faculty Age by College
<30 30-39 40-49 50-59 60-69 70+

Colorado State University-Pueblo 2012-2013
83 | P a g e
FULL-TIME FACULTY Table 13: Full-Time Faculty Profile (Continued)
10. Five-Year Trend in Faculty Age
Age 2008-09 2009-10 2010-11 2011-12 2012-13 Five-Year Change
Younger than 30 5 5 7 5 1 -80.0%
30 to 39 33 33 34 35 41 24.2%
40 to 49 45 52 50 44 47 4.4%
50 to 59 64 63 62 67 63 -1.6%
60 to 69 33 36 38 34 37 12.1%
70 and Older 5 3 2 5 6 20.0%
Totals 185 192 193 190 195 5.4%
Data taken from Fall 2012 Human Resources IPEDS Reporting data freeze of full and part time employees
0
20
40
60
80
2008-09 2009-10 2010-11 2011-12 2012-13
Five-Year History of Faculty by Age
Younger than 30 30 to 39 40 to 49 50 to 59 60 to 69 70 and Older
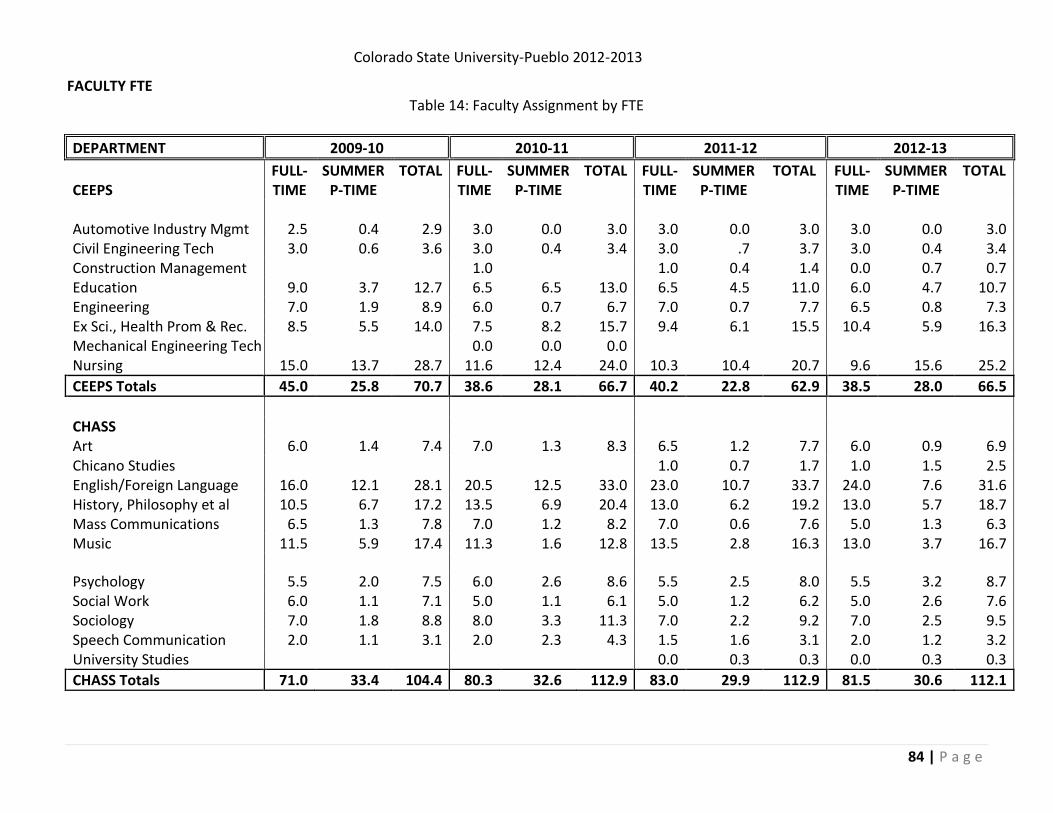
Colorado State University-Pueblo 2012-2013
84 | P a g e
FACULTY FTE Table 14: Faculty Assignment by FTE
DEPARTMENT 2009-10 2010-11 2011-12 2012-13
FULL- SUMMER TOTAL FULL- SUMMER TOTAL FULL- SUMMER TOTAL FULL- SUMMER TOTAL
CEEPS TIME P-TIME TIME P-TIME TIME P-TIME TIME P-TIME
Automotive Industry Mgmt 2.5 0.4 2.9 3.0 0.0 3.0 3.0 0.0 3.0 3.0 0.0 3.0 Civil Engineering Tech 3.0 0.6 3.6 3.0 0.4 3.4 3.0 .7 3.7 3.0 0.4 3.4 Construction Management
1.0
1.0 0.4 1.4 0.0 0.7 0.7
Education 9.0 3.7 12.7 6.5 6.5 13.0 6.5 4.5 11.0 6.0 4.7 10.7 Engineering 7.0 1.9 8.9 6.0 0.7 6.7 7.0 0.7 7.7 6.5 0.8 7.3 Ex Sci., Health Prom & Rec. 8.5 5.5 14.0 7.5 8.2 15.7 9.4 6.1 15.5 10.4 5.9 16.3 Mechanical Engineering Tech
0.0 0.0 0.0
Nursing 15.0 13.7 28.7 11.6 12.4 24.0 10.3 10.4 20.7 9.6 15.6 25.2
CEEPS Totals 45.0 25.8 70.7 38.6 28.1 66.7 40.2 22.8 62.9 38.5 28.0 66.5
CHASS
Art 6.0 1.4 7.4 7.0 1.3 8.3 6.5 1.2 7.7 6.0 0.9 6.9 Chicano Studies
1.0 0.7 1.7 1.0 1.5 2.5
English/Foreign Language 16.0 12.1 28.1 20.5 12.5 33.0 23.0 10.7 33.7 24.0 7.6 31.6 History, Philosophy et al 10.5 6.7 17.2 13.5 6.9 20.4 13.0 6.2 19.2 13.0 5.7 18.7 Mass Communications 6.5 1.3 7.8 7.0 1.2 8.2 7.0 0.6 7.6 5.0 1.3 6.3 Music 11.5 5.9 17.4 11.3 1.6 12.8 13.5 2.8 16.3 13.0 3.7 16.7
Psychology 5.5 2.0 7.5 6.0 2.6 8.6 5.5 2.5 8.0 5.5 3.2 8.7 Social Work 6.0 1.1 7.1 5.0 1.1 6.1 5.0 1.2 6.2 5.0 2.6 7.6 Sociology 7.0 1.8 8.8 8.0 3.3 11.3 7.0 2.2 9.2 7.0 2.5 9.5 Speech Communication 2.0 1.1 3.1 2.0 2.3 4.3 1.5 1.6 3.1 2.0 1.2 3.2 University Studies
0.0 0.3 0.3 0.0 0.3 0.3
CHASS Totals 71.0 33.4 104.4 80.3 32.6 112.9 83.0 29.9 112.9 81.5 30.6 112.1

Colorado State University-Pueblo 2012-2013
85 | P a g e
FACULTY FTE Table 14: Faculty Assignment by FTE (Continued)
DEPARTMENT 2009-10 2010-11 2011-12 2012-13
FULL- SUMMER TOTAL FULL- SUMMER TOTAL FULL- SUMMER TOTAL FULL- SUMMER TOTAL
CSM TIME P-TIME TIME P-TIME TIME P-TIME TIME P-TIME
Chemistry 7.5 2.0 9.5 7.0 1.9 8.9 7.5 1.3 8.8 7.0 0.1 7.1
Biology 11.0 4.5 15.5 11.5 3.4 14.9 10.6 2.9 13.5 10.6 3.2 13.8
Mathematics 13.0 3.4 16.4 19.0 5.1 24.1 19.0 3.8 22.8 16.9 3.2 20.2
Physics 2.0 1.8 3.8 2.0 1.8 3.8 2.0 2.0 4.0 2.0 1.5 3.5
CSM Totals 33.5 11.6 45.1 39.5 12.2 51.7 39.1 10.0 49.1 36.6 8.0 44.5
HSB
Computer Information Sys 7.0 1.3 8.3 7.0 0.6 7.6 6.0 1.1 7.1 5.5 1.6 7.1
Business Admin/Mgmt 15.4 14.7 30.1 17.1 8.2 25.3 19.0 6.6 25.6 20.0 5.1 25.1
HSB Totals 22.4 16.0 38.4 24.1 8.8 32.9 25.0 7.7 32.7 25.5 6.7 32.2
TOTAL FACULTY 171.8 86.7 258.5 182.4 81.7 264.2 187.3 70.4 257.7 182.1 73.2 255.3
NOTE: Faculty proportion on sponsored release is excluded.

Colorado State University-Pueblo 2012-2013
87 | P a g e
REVENUES BY SOURCE
All Funds Revenues Percent of Total Revenue
Revenue Amount
E & G Revenues
Percent of Total Revenue
Revenue Amount
Tuition and Fees, net 42% $30,320,764
Tuition and Fees 81% $35,219,492
Fee for Service (State 10% $7,498,083
Fee for Service (State 17% $7,498,083
Grants and Contracts 26% $18,859,369
Sales & Service of ED Activities 1% $308,558
Auxiliary Operations, net 16% $11,906,187
F&A Recoveries 0% $197,851
Gifts 3% $1,865,968
Other Sources 1% $314,612
Interest Earnings, net 0% $172,609
Investment Income 0% $18,191
State Capital Funds 1% $1,028,354 Other Sources 1% $930,389 Total Revenue All Funds 100% $72,581,724
Total Revenue E&G Funds Only 100% $43,556,787
Tuition and Fees, net
42%
Fee for Service (State 10%
Grants and Contracts
26%
Auxiliary Operations,
net 16%
Gifts 3%
Interest Earnings, net
0%
State Capital Funds
2%
Other Sources
1%
FY 13 All Funds Revenues - $72.5 Million
Tuition and Fees, net
81%
Fee for Service (State 17%
Grants and Contracts
1% Auxiliary Operations,
net 0%
Gifts 1%
Interest Earnings,
net 0%
FY 13 Education & General Revenues - $43.6 Million
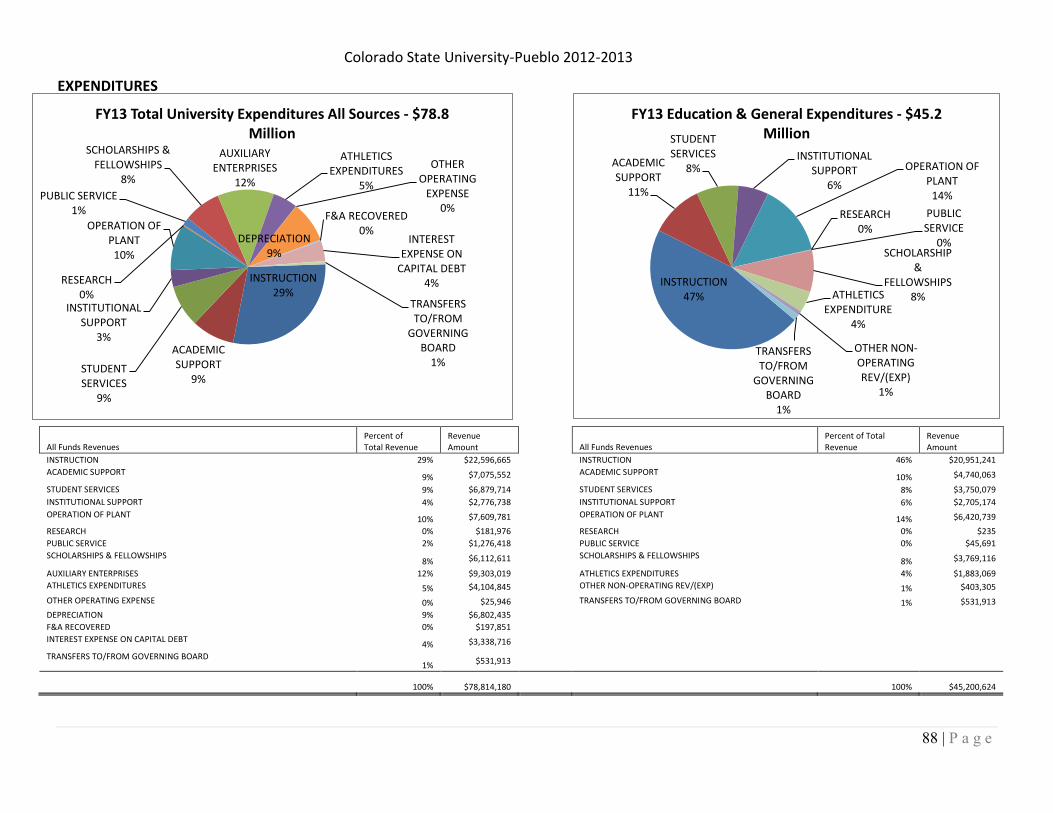
Colorado State University-Pueblo 2012-2013
88 | P a g e
EXPENDITURES
All Funds Revenues Percent of Total Revenue
Revenue Amount
All Funds Revenues Percent of Total Revenue
Revenue Amount
INSTRUCTION 29% $22,596,665
INSTRUCTION 46% $20,951,241
ACADEMIC SUPPORT 9% $7,075,552
ACADEMIC SUPPORT 10% $4,740,063
STUDENT SERVICES 9% $6,879,714
STUDENT SERVICES 8% $3,750,079
INSTITUTIONAL SUPPORT 4% $2,776,738
INSTITUTIONAL SUPPORT 6% $2,705,174
OPERATION OF PLANT 10% $7,609,781
OPERATION OF PLANT 14% $6,420,739
RESEARCH 0% $181,976
RESEARCH 0% $235
PUBLIC SERVICE 2% $1,276,418
PUBLIC SERVICE 0% $45,691
SCHOLARSHIPS & FELLOWSHIPS 8% $6,112,611
SCHOLARSHIPS & FELLOWSHIPS 8% $3,769,116
AUXILIARY ENTERPRISES 12% $9,303,019
ATHLETICS EXPENDITURES 4% $1,883,069
ATHLETICS EXPENDITURES 5% $4,104,845
OTHER NON-OPERATING REV/(EXP) 1% $403,305
OTHER OPERATING EXPENSE 0% $25,946
TRANSFERS TO/FROM GOVERNING BOARD 1% $531,913
DEPRECIATION 9% $6,802,435
F&A RECOVERED 0% $197,851
INTEREST EXPENSE ON CAPITAL DEBT 4% $3,338,716
TRANSFERS TO/FROM GOVERNING BOARD 1% $531,913
100% $78,814,180 100% $45,200,624
INSTRUCTION 47%
ACADEMIC SUPPORT
11%
STUDENT SERVICES
8% INSTITUTIONAL
SUPPORT 6%
OPERATION OF PLANT
14%
RESEARCH 0%
PUBLIC SERVICE
0% SCHOLARSHIP
& FELLOWSHIPS
8% ATHLETICS EXPENDITURE
4%
OTHER NON-OPERATING REV/(EXP)
1%
TRANSFERS TO/FROM
GOVERNING BOARD
1%
FY13 Education & General Expenditures - $45.2 Million
INSTRUCTION 29%
ACADEMIC SUPPORT
9% STUDENT SERVICES
9%
INSTITUTIONAL SUPPORT
3%
OPERATION OF PLANT
10%
RESEARCH 0%
PUBLIC SERVICE 1%
SCHOLARSHIPS & FELLOWSHIPS
8%
AUXILIARY ENTERPRISES
12%
ATHLETICS EXPENDITURES
5%
OTHER OPERATING
EXPENSE 0%
DEPRECIATION 9%
F&A RECOVERED 0%
INTEREST EXPENSE ON
CAPITAL DEBT 4%
TRANSFERS TO/FROM
GOVERNING BOARD
1%
FY13 Total University Expenditures All Sources - $78.8 Million

Colorado State University-Pueblo 2012-2013
89 | P a g e
UNIVERSITY FOUNDATION The Colorado State University-Pueblo Foundation was organized and incorporated in 1954 in Pueblo, Colorado. The Foundation’s sole purpose is to solicit, receive, manage and invest contributions, gifts, grants, devises or bequests of real or personal property, or both, from individuals, foundations, partnerships, associations, governmental bodies or public or private corporations. Total Foundation Assets Size of Endowment Total Private Gifts FY 2012 $26,238108 FY2012 $12,118,336 FY2012 $1,783,914 FY 2011 $26,217,870 FY 2011 $11,884,316 FY 2011 $2,612,203 FY 2010 $22,419,471 FY 2010 $11,110,740 FY 2010 $3,216,271 FY 2009 $19,277,269 FY 2009 $10,984,790 FY 2009 $1,526,910 FY 2008 $23,099,091 FY 2008 $11,104,512 FY 2008 $2,678,624 FY 2007 $23,926,094 FY 2007 $10,231,198 FY 2007 $1,541,581 FY 2006 $21,164,827 FY 2006 $9,601,036 FY 2006 $1,088,000 FY 2005 $21,068,247 FY 2005 $9,504,852 FY 2005 $1,064,172 FY 2012 Expenses Program and Scholarship Expenses - $2,200,211 Management and General - $389,129 Fundraising - $207,386 FY 2011 Expenses Program and Scholarship Expenses - $1,732,488 Management and General - $384,287 Fundraising - $201,468
Colorado State University-Pueblo 2012-2013
90 | P a g e
UNIVERSITY FOUNDATION - Continued Our Vision The CSU-Pueblo Foundation will provide sustainable financial support to the University and its students, in the form of private gifts and grants, to achieve our shared goal of excellence. Our Mission The CSU-Pueblo Foundation will advance the University’s mission through philanthropic efforts designed to supplement and enhance University programs, activities and educational opportunities. Our End Goals
1. The CSU-Pueblo Foundation shall provide sustainable financial support to CSU-Pueblo through the solicitation of private gifts and grants. 2. The CSU-Pueblo Foundation shall steward gifts with the utmost integrity while maximizing those gifts in a prudent and responsible manner. 3. The CSU-Pueblo Foundation shall be an advocate for the University by building relationships and fostering partnerships with our constituents.
Core Values Grateful *Service-Oriented *Competent *Trustworthy *Genuine *Respectful *Responsive *Professional *Transparent Contact the Foundation: CSU-Pueblo Foundation 2200 Bonforte Blvd., Pueblo, CO 81001 719-549-2380 [email protected] http://www.csupueblofoundation.org
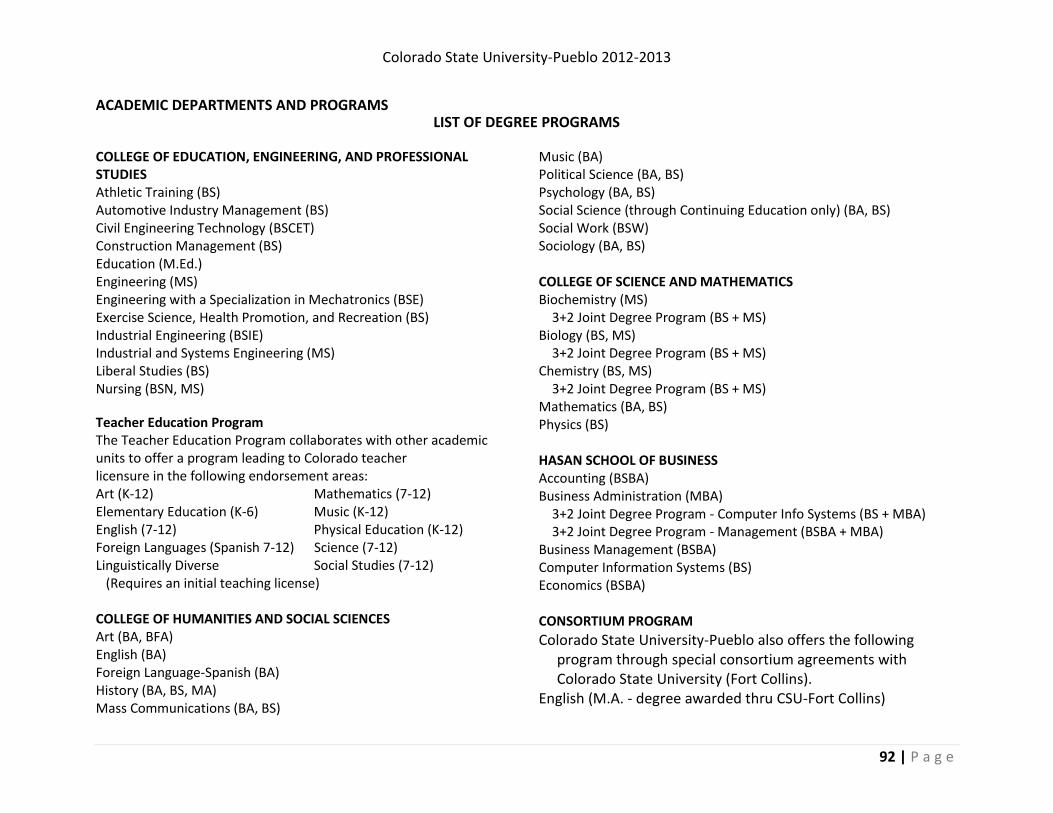
Colorado State University-Pueblo 2012-2013
92 | P a g e
ACADEMIC DEPARTMENTS AND PROGRAMS LIST OF DEGREE PROGRAMS
COLLEGE OF EDUCATION, ENGINEERING, AND PROFESSIONAL STUDIES Athletic Training (BS) Automotive Industry Management (BS) Civil Engineering Technology (BSCET) Construction Management (BS) Education (M.Ed.) Engineering (MS) Engineering with a Specialization in Mechatronics (BSE) Exercise Science, Health Promotion, and Recreation (BS) Industrial Engineering (BSIE) Industrial and Systems Engineering (MS) Liberal Studies (BS) Nursing (BSN, MS) Teacher Education Program The Teacher Education Program collaborates with other academic units to offer a program leading to Colorado teacher licensure in the following endorsement areas: Art (K-12) Mathematics (7-12) Elementary Education (K-6) Music (K-12) English (7-12) Physical Education (K-12) Foreign Languages (Spanish 7-12) Science (7-12) Linguistically Diverse Social Studies (7-12) (Requires an initial teaching license) COLLEGE OF HUMANITIES AND SOCIAL SCIENCES Art (BA, BFA) English (BA) Foreign Language-Spanish (BA) History (BA, BS, MA) Mass Communications (BA, BS)
Music (BA) Political Science (BA, BS) Psychology (BA, BS) Social Science (through Continuing Education only) (BA, BS) Social Work (BSW) Sociology (BA, BS) COLLEGE OF SCIENCE AND MATHEMATICS Biochemistry (MS) 3+2 Joint Degree Program (BS + MS) Biology (BS, MS) 3+2 Joint Degree Program (BS + MS) Chemistry (BS, MS) 3+2 Joint Degree Program (BS + MS) Mathematics (BA, BS) Physics (BS) HASAN SCHOOL OF BUSINESS Accounting (BSBA) Business Administration (MBA) 3+2 Joint Degree Program - Computer Info Systems (BS + MBA) 3+2 Joint Degree Program - Management (BSBA + MBA) Business Management (BSBA) Computer Information Systems (BS) Economics (BSBA) CONSORTIUM PROGRAM
Colorado State University-Pueblo also offers the following program through special consortium agreements with Colorado State University (Fort Collins). English (M.A. - degree awarded thru CSU-Fort Collins)

Colorado State University-Pueblo 2012-2013
93 | P a g e
PERFORMANCE MEASURES FOR ACADEMIC PROGRAMS
I. Introduction The purpose of this report is to present performance indicators, which will be of assistance in the assessment of programs. The indicators are not a substitute for evaluation, but will help the identification of trends and might serve to unify the assessment process. Assessment is used in accreditation, in the periodic review of programs, in staffing discussions, and for strategic planning.
II. The Indicators
While it is extremely difficult, perhaps impossible, to quantify the performance outcomes of a department or program, there are readily available measures (or indicators) which provide information about performance. These measures include:
Student Demand Majors Student Usage FTE Enrollment Completion Degrees Awarded Resources Used Dollars Expended Faculty Usage FTE Positions Efficiency Scheduling Much of the information is available in the Fact Book, budget and expenditure reports, and class schedules, but it has not been formally presented and sorted by program. The report accumulates by department and programs the aforementioned indicators and calculates simple performance ratios (students per faculty, cost per student, etc.) which can be used in the assessment process.
III. Report Organization Each academic program offered by the University it is assigned to a responsible academic department for administrative purposes. Some departments are responsible for more than one program (e.g. language/literature has both Foreign Language and English). Certain indicators are reported at the program level (FTE students, majors, degrees, etc.) while others are usually reported at the departmental level (FTE faculty, cost, etc.)
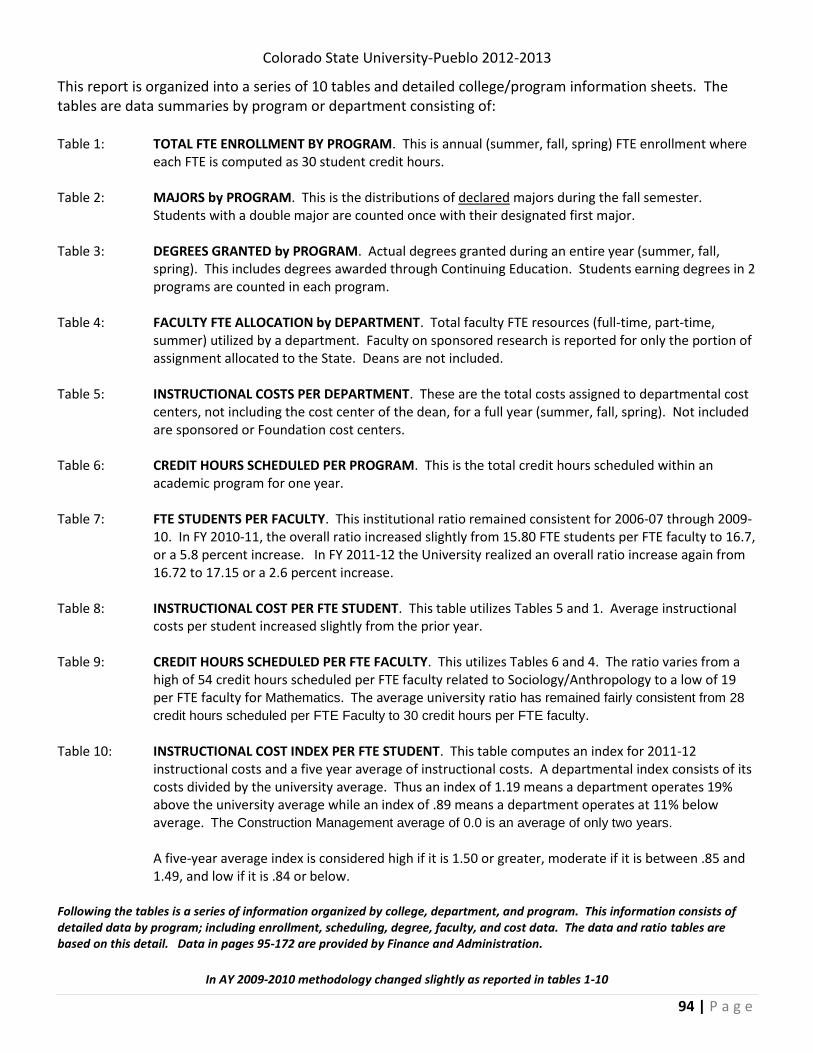
Colorado State University-Pueblo 2012-2013
94 | P a g e
This report is organized into a series of 10 tables and detailed college/program information sheets. The tables are data summaries by program or department consisting of: Table 1: TOTAL FTE ENROLLMENT BY PROGRAM. This is annual (summer, fall, spring) FTE enrollment where
each FTE is computed as 30 student credit hours. Table 2: MAJORS by PROGRAM. This is the distributions of declared majors during the fall semester.
Students with a double major are counted once with their designated first major. Table 3: DEGREES GRANTED by PROGRAM. Actual degrees granted during an entire year (summer, fall,
spring). This includes degrees awarded through Continuing Education. Students earning degrees in 2 programs are counted in each program.
Table 4: FACULTY FTE ALLOCATION by DEPARTMENT. Total faculty FTE resources (full-time, part-time,
summer) utilized by a department. Faculty on sponsored research is reported for only the portion of assignment allocated to the State. Deans are not included.
Table 5: INSTRUCTIONAL COSTS PER DEPARTMENT. These are the total costs assigned to departmental cost
centers, not including the cost center of the dean, for a full year (summer, fall, spring). Not included are sponsored or Foundation cost centers.
Table 6: CREDIT HOURS SCHEDULED PER PROGRAM. This is the total credit hours scheduled within an
academic program for one year. Table 7: FTE STUDENTS PER FACULTY. This institutional ratio remained consistent for 2006-07 through 2009-
10. In FY 2010-11, the overall ratio increased slightly from 15.80 FTE students per FTE faculty to 16.7, or a 5.8 percent increase. In FY 2011-12 the University realized an overall ratio increase again from 16.72 to 17.15 or a 2.6 percent increase.
Table 8: INSTRUCTIONAL COST PER FTE STUDENT. This table utilizes Tables 5 and 1. Average instructional
costs per student increased slightly from the prior year. Table 9: CREDIT HOURS SCHEDULED PER FTE FACULTY. This utilizes Tables 6 and 4. The ratio varies from a
high of 54 credit hours scheduled per FTE faculty related to Sociology/Anthropology to a low of 19 per FTE faculty for Mathematics. The average university ratio has remained fairly consistent from 28
credit hours scheduled per FTE Faculty to 30 credit hours per FTE faculty. Table 10: INSTRUCTIONAL COST INDEX PER FTE STUDENT. This table computes an index for 2011-12
instructional costs and a five year average of instructional costs. A departmental index consists of its costs divided by the university average. Thus an index of 1.19 means a department operates 19% above the university average while an index of .89 means a department operates at 11% below average. The Construction Management average of 0.0 is an average of only two years.
A five-year average index is considered high if it is 1.50 or greater, moderate if it is between .85 and 1.49, and low if it is .84 or below.
Following the tables is a series of information organized by college, department, and program. This information consists of detailed data by program; including enrollment, scheduling, degree, faculty, and cost data. The data and ratio tables are based on this detail. Data in pages 95-172 are provided by Finance and Administration.
In AY 2009-2010 methodology changed slightly as reported in tables 1-10

Colorado State University-Pueblo 2012-2013
95 | P a g e
Table 1: Total FTE Enrollment by Academic Program
Department 2007-08 2008-09 2009-10 2010-11 2011-12 2012-13
AIM 38.87 39.13 33.04 36.83 38.50 39.47
Civil Engineering Tech 41.50 39.30 45.87 46.10 47.14 43.70
Electronics Engr. Tech
0.00
Engineering 46.13 44.97 55.16 59.33 66.24 85.17
Facilities Mgmt & Tech* 0.10
Mechanical Engr. Tech* 1.27
Teacher Education§ 177.96 182.44 194.16 204.30 175.40 164.23
Ex. Sci. & Health Prom 176.17 231.90 260.87 254.71 259.67 268.80
Recreation 27.97 29.93 34.27 36.43 49.33 43.77
Athletic Training**
49.07 53.13 47.07
Construction Mgmt**
1.33 8.43 6.03
Nursing 208.33 221.87 257.43 275.13 272.97 278.80
Subtotal CEEPS 718.30 789.54 880.80 963.23 970.81 977.04
Accounting 78.20 72.70 73.40 72.70 77.10 71.20
Business Management 330.08 358.08 378.63 398.96 371.37 352.30
Economics 57.10 67.40 66.80 75.10 72.20 68.20
Computer Info Systems 83.57 87.87 93.84 102.77 115.47 103.20
Subtotal HSB 548.95 586.05 612.67 649.53 636.14 594.90
Chemistry 106.20 124.17 140.67 147.60 155.53 131.27
Biology + ANS + Geology 265.43 287.80 327.03 330.93 307.87 268.90
Mathematics§ 213.00 252.97 276.87 299.10 318.67 249.73
Physics 45.73 57.33 55.33 67.27 66.90 82.43
Subtotal CSM 630.36 722.27 799.90 844.90 848.97 732.33
Art 116.97 135.93 131.83 136.90 131.33 116.73
English§ 242.57 299.40 325.50 345.40 332.94 295.40
Foreign Language 102.73 122.66 123.23 135.80 137.13 123.00
Mass Communications 128.54 114.93 114.17 130.86 132.36 141.07
Music 115.10 117.13 121.77 126.01 107.77 99.87
Speech Communications 48.60 57.00 64.70 69.80 61.50 69.50
Subtotal Humanities 754.51 847.05 881.20 944.77 903.03 845.57
Psychology 188.64 213.03 235.30 263.43 287.96 272.87
History 164.87 182.97 179.60 182.60 172.50 139.73
Political Science 45.13 48.73 60.90 66.80 65.23 62.23
Philosophy 35.50 42.40 47.50 52.90 59.50 44.63
Geography 14.50 19.20 20.90 19.20 16.90 13.20
Chicano Studies 13.87 15.20 15.73 30.00 30.90 27.63
Women's Studies 13.60 24.40 20.80 15.90 25.60 21.60
Anthropology 9.60 10.80 14.90 16.90 20.90 13.20
Sociology 192.93 226.07 239.04 263.67 268.13 255.03
Social Work 52.07 66.77 76.17 98.00 112.10 118.17
Subtotal Soc Sciences 730.71 849.57 910.84 1,009.40 1,059.72 968.29
Subtotal Hum/Soc Sci. 1,485.22 1,696.62 1,792.04 1,954.17 1,962.74 1,813.86
University Total 3,382.83 3,794.48 4,085.41 4,411.83 4,418.66 4,118.13
*Program discontinued in FY 2005-06 **New Programs, Athletic Training FY 2009-10, Construction Mgmt FY 2010-11 §Student FTE totals do not include any developmental (Math, Rdg, and Eng 09X)courses
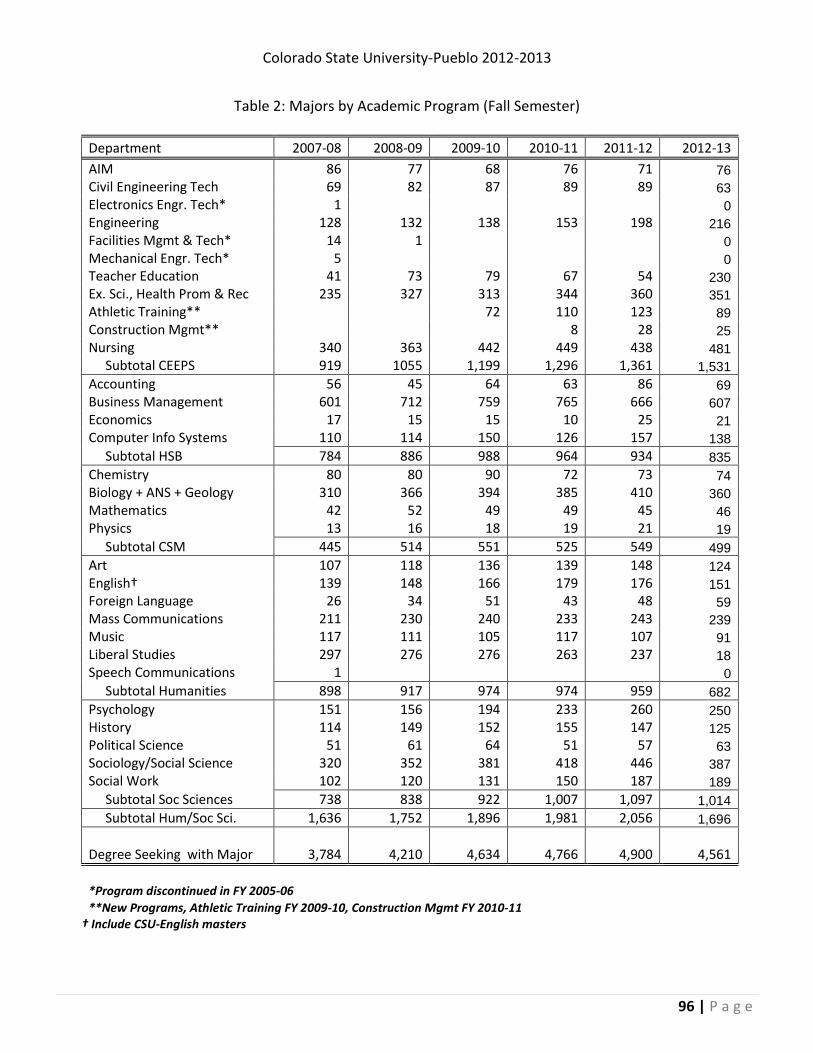
Colorado State University-Pueblo 2012-2013
96 | P a g e
Table 2: Majors by Academic Program (Fall Semester)
Department 2007-08 2008-09 2009-10 2010-11 2011-12 2012-13
AIM 86 77 68 76 71 76
Civil Engineering Tech 69 82 87 89 89 63
Electronics Engr. Tech* 1 0
Engineering 128 132 138 153 198 216
Facilities Mgmt & Tech* 14 1 0
Mechanical Engr. Tech* 5 0
Teacher Education 41 73 79 67 54 230
Ex. Sci., Health Prom & Rec 235 327 313 344 360 351
Athletic Training**
72 110 123 89
Construction Mgmt**
8 28 25
Nursing 340 363 442 449 438 481
Subtotal CEEPS 919 1055 1,199 1,296 1,361 1,531
Accounting 56 45 64 63 86 69
Business Management 601 712 759 765 666 607
Economics 17 15 15 10 25 21
Computer Info Systems 110 114 150 126 157 138
Subtotal HSB 784 886 988 964 934 835
Chemistry 80 80 90 72 73 74
Biology + ANS + Geology 310 366 394 385 410 360
Mathematics 42 52 49 49 45 46
Physics 13 16 18 19 21 19
Subtotal CSM 445 514 551 525 549 499
Art 107 118 136 139 148 124
English† 139 148 166 179 176 151
Foreign Language 26 34 51 43 48 59
Mass Communications 211 230 240 233 243 239
Music 117 111 105 117 107 91
Liberal Studies 297 276 276 263 237 18
Speech Communications 1 0
Subtotal Humanities 898 917 974 974 959 682
Psychology 151 156 194 233 260 250
History 114 149 152 155 147 125
Political Science 51 61 64 51 57 63
Sociology/Social Science 320 352 381 418 446 387
Social Work 102 120 131 150 187 189
Subtotal Soc Sciences 738 838 922 1,007 1,097 1,014
Subtotal Hum/Soc Sci. 1,636 1,752 1,896 1,981 2,056 1,696
Degree Seeking with Major 3,784 4,210 4,634 4,766 4,900 4,561
*Program discontinued in FY 2005-06
**New Programs, Athletic Training FY 2009-10, Construction Mgmt FY 2010-11 † Include CSU-English masters

Colorado State University-Pueblo 2012-2013
97 | P a g e
Table 3: Degrees Granted by Academic Program
Department 2007-08 2008-09 2009-10 2010-11 2011-12 2012-13
AIM 16 17 15 17 10 14
Civil Engineering Tech 5 17 13 14 15 15
Engineering 18 17 18 23 15 25
Facilities Mgmt & Tech* 1 1 1
Mechanical Engr. Tech* 5 0 0
Teacher Education NA 2 18 14 20 17
Ex. Sci., Health Prom & Rec 38 46 39 44 68 79
Athletic Training**
5 8 12 15
Construction Mgmt**
1 4
Nursing 93 76 85 94 102 110
Subtotal CEEPS 176 176 194 214 243 279
Accounting 31 17 20 18 18 23
Business Management 114 126 157 156 136 147
Economics 16 7 16 4 15 13
Computer Info Systems 17 21 14 26 21 20
Subtotal HSB 178 171 207 204 190 203
Chemistry 11 11 12 10 9 4
Biology + ANS + Geology 36 51 49 47 30 30
Mathematics 6 8 11 8 9 8
Physics
2 2 4 5
Subtotal CSM 53 72 72 67 52 47
Art 25 26 24 12 23 31
English 20 31 24 24 29 32
Foreign Language 8 8 11 10 9 16
Mass Communications 47 48 46 41 40 61
Music 9 15 14 15 14 14
Liberal Studies 66 36 59 48 43 40
Speech Communications 1 1 0
Subtotal Humanities 176 164 179 150 158 194
Psychology 33 28 24 34 36 44
History 18 20 31 37 28 25
Political Science 8 11 11 14 7 15
Sociology & Soc Sciences 124 123 126 115 122 127
Social Work 34 27 33 36 33 57
Subtotal Soc Sciences 217 209 225 236 226 268
Subtotal Hum/Soc Sci. 393 373 404 386 384 462
Total Degrees 800 792 877 871 869 991
*Program discontinued in FY 2005-06 **New Programs, Athletic Training FY 2009-10, Construction Mgmt FY 2010-11
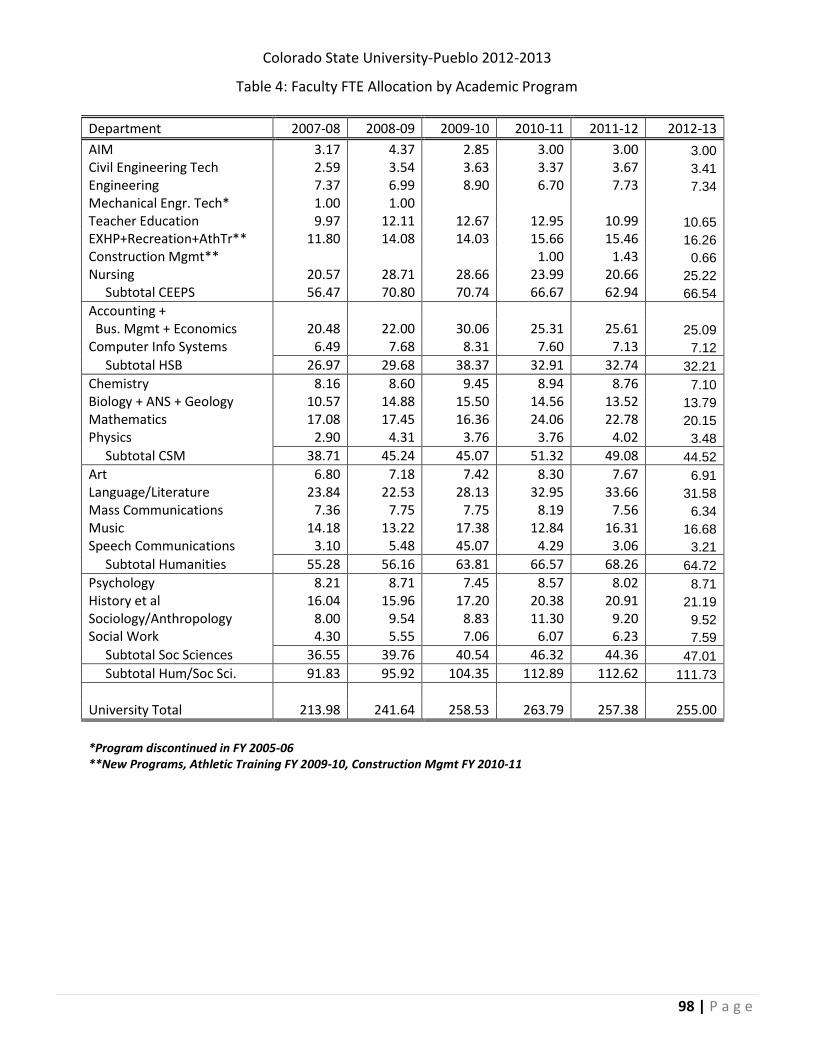
Colorado State University-Pueblo 2012-2013
98 | P a g e
Table 4: Faculty FTE Allocation by Academic Program
Department 2007-08 2008-09 2009-10 2010-11 2011-12 2012-13
AIM 3.17 4.37 2.85 3.00 3.00 3.00
Civil Engineering Tech 2.59 3.54 3.63 3.37 3.67 3.41
Engineering 7.37 6.99 8.90 6.70 7.73 7.34
Mechanical Engr. Tech* 1.00 1.00
Teacher Education 9.97 12.11 12.67 12.95 10.99 10.65
EXHP+Recreation+AthTr** 11.80 14.08 14.03 15.66 15.46 16.26
Construction Mgmt**
1.00 1.43 0.66
Nursing 20.57 28.71 28.66 23.99 20.66 25.22
Subtotal CEEPS 56.47 70.80 70.74 66.67 62.94 66.54
Accounting +
Bus. Mgmt + Economics 20.48 22.00 30.06 25.31 25.61 25.09
Computer Info Systems 6.49 7.68 8.31 7.60 7.13 7.12
Subtotal HSB 26.97 29.68 38.37 32.91 32.74 32.21
Chemistry 8.16 8.60 9.45 8.94 8.76 7.10
Biology + ANS + Geology 10.57 14.88 15.50 14.56 13.52 13.79
Mathematics 17.08 17.45 16.36 24.06 22.78 20.15
Physics 2.90 4.31 3.76 3.76 4.02 3.48
Subtotal CSM 38.71 45.24 45.07 51.32 49.08 44.52
Art 6.80 7.18 7.42 8.30 7.67 6.91
Language/Literature 23.84 22.53 28.13 32.95 33.66 31.58
Mass Communications 7.36 7.75 7.75 8.19 7.56 6.34
Music 14.18 13.22 17.38 12.84 16.31 16.68
Speech Communications 3.10 5.48 45.07 4.29 3.06 3.21
Subtotal Humanities 55.28 56.16 63.81 66.57 68.26 64.72
Psychology 8.21 8.71 7.45 8.57 8.02 8.71
History et al 16.04 15.96 17.20 20.38 20.91 21.19
Sociology/Anthropology 8.00 9.54 8.83 11.30 9.20 9.52
Social Work 4.30 5.55 7.06 6.07 6.23 7.59
Subtotal Soc Sciences 36.55 39.76 40.54 46.32 44.36 47.01
Subtotal Hum/Soc Sci. 91.83 95.92 104.35 112.89 112.62 111.73
University Total 213.98 241.64 258.53 263.79 257.38 255.00
*Program discontinued in FY 2005-06 **New Programs, Athletic Training FY 2009-10, Construction Mgmt FY 2010-11
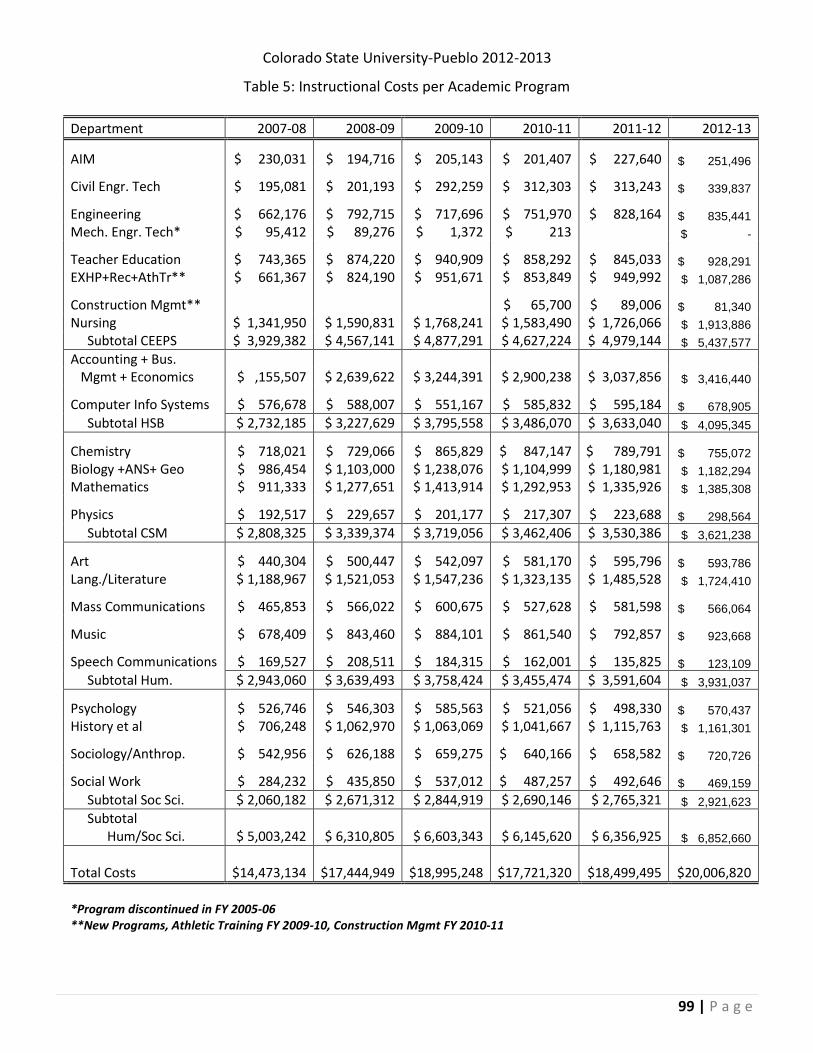
Colorado State University-Pueblo 2012-2013
99 | P a g e
Table 5: Instructional Costs per Academic Program
Department 2007-08 2008-09 2009-10 2010-11 2011-12 2012-13
AIM $ 230,031 $ 194,716 $ 205,143 $ 201,407 $ 227,640
$ 251,496
Civil Engr. Tech $ 195,081 $ 201,193 $ 292,259 $ 312,303 $ 313,243
$ 339,837
Engineering $ 662,176 $ 792,715 $ 717,696 $ 751,970 $ 828,164
$ 835,441
Mech. Engr. Tech* $ 95,412 $ 89,276 $ 1,372 $ 213 $ -
Teacher Education $ 743,365 $ 874,220 $ 940,909 $ 858,292 $ 845,033
$ 928,291
EXHP+Rec+AthTr** $ 661,367 $ 824,190 $ 951,671 $ 853,849 $ 949,992 $ 1,087,286
Construction Mgmt**
$ 65,700 $ 89,006
$ 81,340
Nursing $ 1,341,950 $ 1,590,831 $ 1,768,241 $ 1,583,490 $ 1,726,066 $ 1,913,886
Subtotal CEEPS $ 3,929,382 $ 4,567,141 $ 4,877,291 $ 4,627,224 $ 4,979,144 $ 5,437,577
Accounting + Bus.
Mgmt + Economics $ ,155,507 $ 2,639,622 $ 3,244,391 $ 2,900,238 $ 3,037,856 $ 3,416,440
Computer Info Systems $ 576,678 $ 588,007 $ 551,167 $ 585,832 $ 595,184
$ 678,905
Subtotal HSB $ 2,732,185 $ 3,227,629 $ 3,795,558 $ 3,486,070 $ 3,633,040 $ 4,095,345
Chemistry $ 718,021 $ 729,066 $ 865,829 $ 847,147 $ 789,791
$ 755,072
Biology +ANS+ Geo $ 986,454 $ 1,103,000 $ 1,238,076 $ 1,104,999 $ 1,180,981 $ 1,182,294
Mathematics $ 911,333 $ 1,277,651 $ 1,413,914 $ 1,292,953 $ 1,335,926 $ 1,385,308
Physics $ 192,517 $ 229,657 $ 201,177 $ 217,307 $ 223,688
$ 298,564
Subtotal CSM $ 2,808,325 $ 3,339,374 $ 3,719,056 $ 3,462,406 $ 3,530,386 $ 3,621,238
Art $ 440,304 $ 500,447 $ 542,097 $ 581,170 $ 595,796
$ 593,786
Lang./Literature $ 1,188,967 $ 1,521,053 $ 1,547,236 $ 1,323,135 $ 1,485,528 $ 1,724,410
Mass Communications $ 465,853 $ 566,022 $ 600,675 $ 527,628 $ 581,598
$ 566,064
Music $ 678,409 $ 843,460 $ 884,101 $ 861,540 $ 792,857
$ 923,668
Speech Communications $ 169,527 $ 208,511 $ 184,315 $ 162,001 $ 135,825
$ 123,109
Subtotal Hum. $ 2,943,060 $ 3,639,493 $ 3,758,424 $ 3,455,474 $ 3,591,604 $ 3,931,037
Psychology $ 526,746 $ 546,303 $ 585,563 $ 521,056 $ 498,330
$ 570,437
History et al $ 706,248 $ 1,062,970 $ 1,063,069 $ 1,041,667 $ 1,115,763 $ 1,161,301
Sociology/Anthrop. $ 542,956 $ 626,188 $ 659,275 $ 640,166 $ 658,582
$ 720,726
Social Work $ 284,232 $ 435,850 $ 537,012 $ 487,257 $ 492,646
$ 469,159
Subtotal Soc Sci. $ 2,060,182 $ 2,671,312 $ 2,844,919 $ 2,690,146 $ 2,765,321 $ 2,921,623
Subtotal Hum/Soc Sci. $ 5,003,242 $ 6,310,805 $ 6,603,343 $ 6,145,620 $ 6,356,925 $ 6,852,660
Total Costs $14,473,134 $17,444,949 $18,995,248 $17,721,320 $18,499,495 $20,006,820
*Program discontinued in FY 2005-06 **New Programs, Athletic Training FY 2009-10, Construction Mgmt FY 2010-11
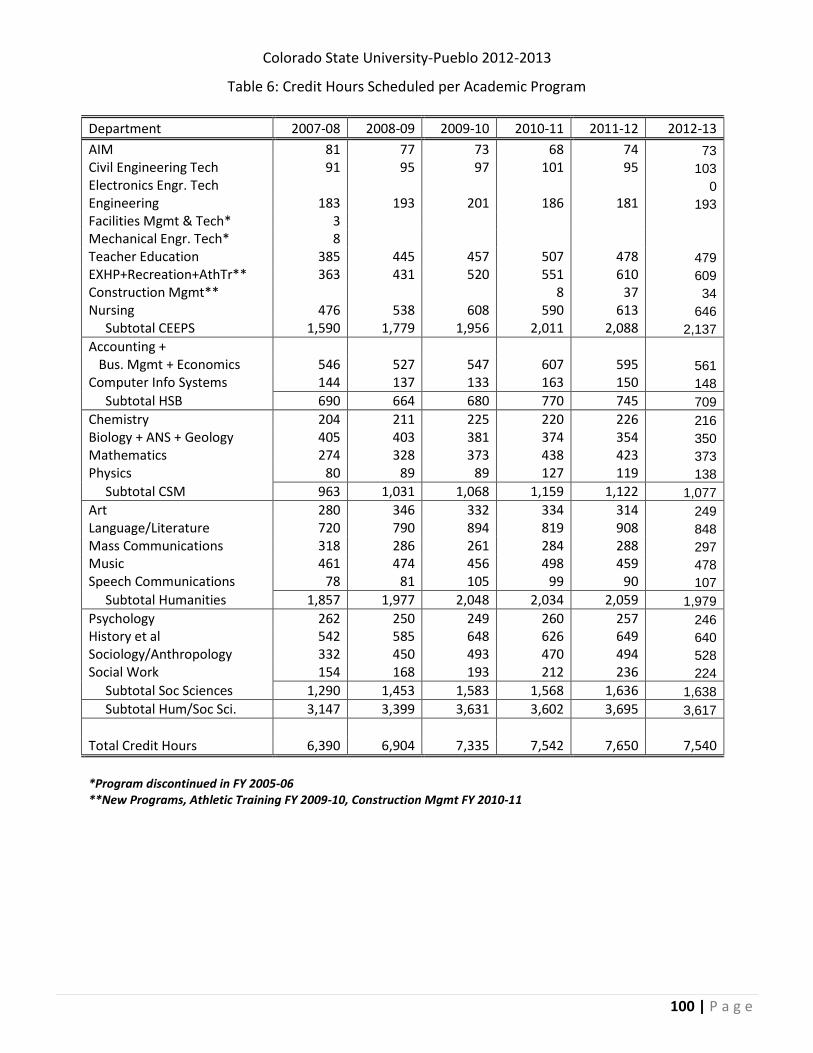
Colorado State University-Pueblo 2012-2013
100 | P a g e
Table 6: Credit Hours Scheduled per Academic Program
Department 2007-08 2008-09 2009-10 2010-11 2011-12 2012-13
AIM 81 77 73 68 74 73
Civil Engineering Tech 91 95 97 101 95 103
Electronics Engr. Tech
0
Engineering 183 193 201 186 181 193
Facilities Mgmt & Tech* 3
Mechanical Engr. Tech* 8
Teacher Education 385 445 457 507 478 479
EXHP+Recreation+AthTr** 363 431 520 551 610 609
Construction Mgmt**
8 37 34
Nursing 476 538 608 590 613 646
Subtotal CEEPS 1,590 1,779 1,956 2,011 2,088 2,137
Accounting +
Bus. Mgmt + Economics 546 527 547 607 595 561
Computer Info Systems 144 137 133 163 150 148
Subtotal HSB 690 664 680 770 745 709
Chemistry 204 211 225 220 226 216
Biology + ANS + Geology 405 403 381 374 354 350
Mathematics 274 328 373 438 423 373
Physics 80 89 89 127 119 138
Subtotal CSM 963 1,031 1,068 1,159 1,122 1,077
Art 280 346 332 334 314 249
Language/Literature 720 790 894 819 908 848
Mass Communications 318 286 261 284 288 297
Music 461 474 456 498 459 478
Speech Communications 78 81 105 99 90 107
Subtotal Humanities 1,857 1,977 2,048 2,034 2,059 1,979
Psychology 262 250 249 260 257 246
History et al 542 585 648 626 649 640
Sociology/Anthropology 332 450 493 470 494 528
Social Work 154 168 193 212 236 224
Subtotal Soc Sciences 1,290 1,453 1,583 1,568 1,636 1,638
Subtotal Hum/Soc Sci. 3,147 3,399 3,631 3,602 3,695 3,617
Total Credit Hours 6,390 6,904 7,335 7,542 7,650 7,540
*Program discontinued in FY 2005-06 **New Programs, Athletic Training FY 2009-10, Construction Mgmt FY 2010-11
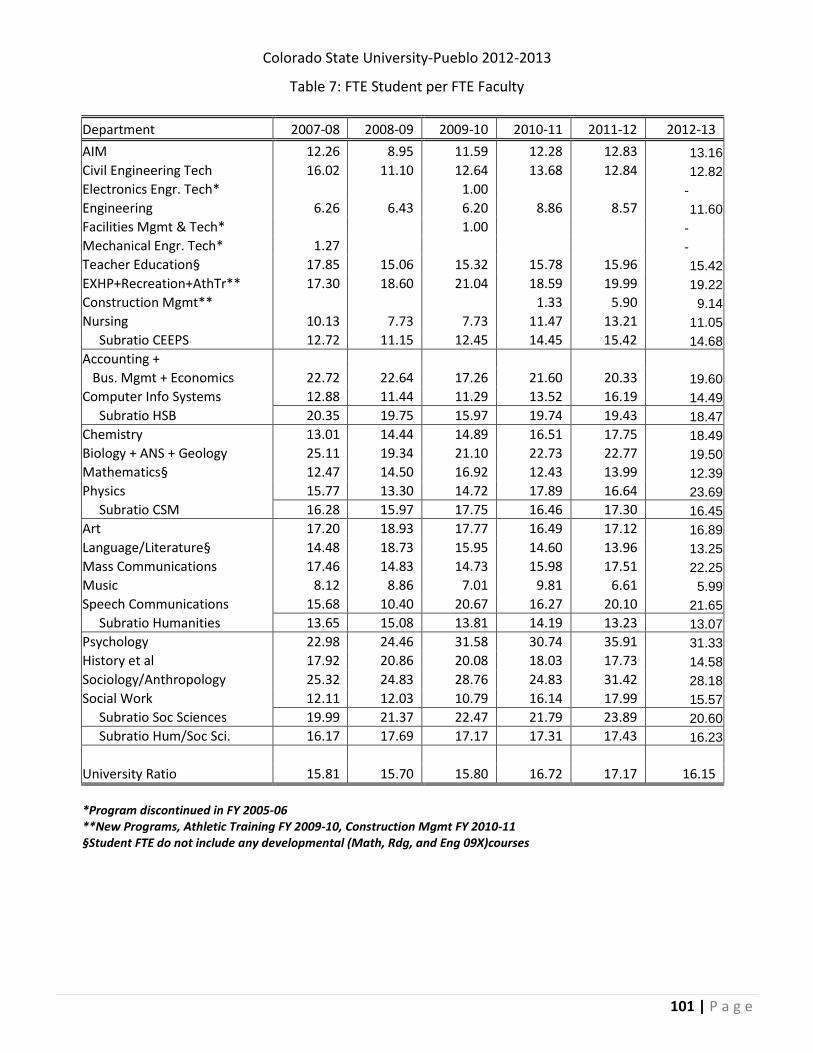
Colorado State University-Pueblo 2012-2013
101 | P a g e
Table 7: FTE Student per FTE Faculty
Department 2007-08 2008-09 2009-10 2010-11 2011-12 2012-13
AIM 12.26 8.95 11.59 12.28 12.83 13.16
Civil Engineering Tech 16.02 11.10 12.64 13.68 12.84 12.82
Electronics Engr. Tech*
1.00 -
Engineering 6.26 6.43 6.20 8.86 8.57 11.60
Facilities Mgmt & Tech*
1.00 -
Mechanical Engr. Tech* 1.27 -
Teacher Education§ 17.85 15.06 15.32 15.78 15.96 15.42
EXHP+Recreation+AthTr** 17.30 18.60 21.04 18.59 19.99 19.22
Construction Mgmt**
1.33 5.90 9.14
Nursing 10.13 7.73 7.73 11.47 13.21 11.05
Subratio CEEPS 12.72 11.15 12.45 14.45 15.42 14.68
Accounting +
Bus. Mgmt + Economics 22.72 22.64 17.26 21.60 20.33 19.60
Computer Info Systems 12.88 11.44 11.29 13.52 16.19 14.49
Subratio HSB 20.35 19.75 15.97 19.74 19.43 18.47
Chemistry 13.01 14.44 14.89 16.51 17.75 18.49
Biology + ANS + Geology 25.11 19.34 21.10 22.73 22.77 19.50
Mathematics§ 12.47 14.50 16.92 12.43 13.99 12.39
Physics 15.77 13.30 14.72 17.89 16.64 23.69
Subratio CSM 16.28 15.97 17.75 16.46 17.30 16.45
Art 17.20 18.93 17.77 16.49 17.12 16.89
Language/Literature§ 14.48 18.73 15.95 14.60 13.96 13.25
Mass Communications 17.46 14.83 14.73 15.98 17.51 22.25
Music 8.12 8.86 7.01 9.81 6.61 5.99
Speech Communications 15.68 10.40 20.67 16.27 20.10 21.65
Subratio Humanities 13.65 15.08 13.81 14.19 13.23 13.07
Psychology 22.98 24.46 31.58 30.74 35.91 31.33
History et al 17.92 20.86 20.08 18.03 17.73 14.58
Sociology/Anthropology 25.32 24.83 28.76 24.83 31.42 28.18
Social Work 12.11 12.03 10.79 16.14 17.99 15.57
Subratio Soc Sciences 19.99 21.37 22.47 21.79 23.89 20.60
Subratio Hum/Soc Sci. 16.17 17.69 17.17 17.31 17.43 16.23
University Ratio 15.81 15.70 15.80 16.72 17.17 16.15
*Program discontinued in FY 2005-06 **New Programs, Athletic Training FY 2009-10, Construction Mgmt FY 2010-11 §Student FTE do not include any developmental (Math, Rdg, and Eng 09X)courses
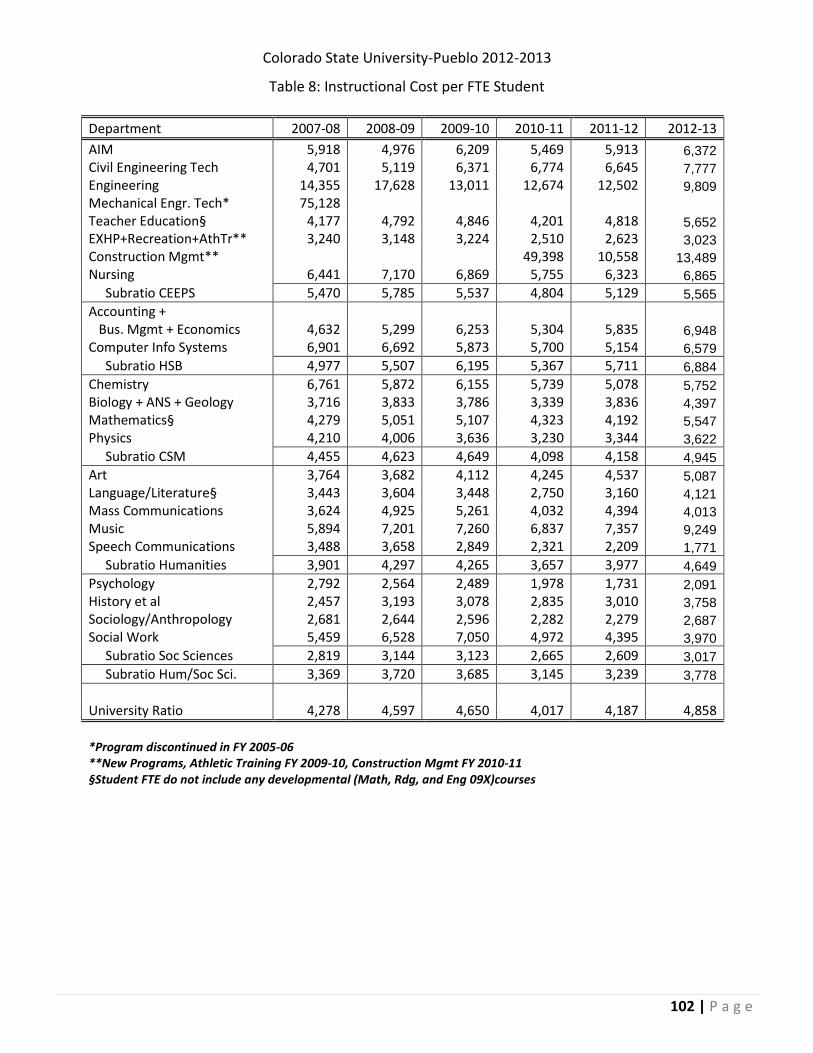
Colorado State University-Pueblo 2012-2013
102 | P a g e
Table 8: Instructional Cost per FTE Student
Department 2007-08 2008-09 2009-10 2010-11 2011-12 2012-13
AIM 5,918 4,976 6,209 5,469 5,913 6,372
Civil Engineering Tech 4,701 5,119 6,371 6,774 6,645 7,777
Engineering 14,355 17,628 13,011 12,674 12,502 9,809
Mechanical Engr. Tech* 75,128
Teacher Education§ 4,177 4,792 4,846 4,201 4,818 5,652
EXHP+Recreation+AthTr** 3,240 3,148 3,224 2,510 2,623 3,023
Construction Mgmt**
49,398 10,558 13,489
Nursing 6,441 7,170 6,869 5,755 6,323 6,865
Subratio CEEPS 5,470 5,785 5,537 4,804 5,129 5,565
Accounting +
Bus. Mgmt + Economics 4,632 5,299 6,253 5,304 5,835 6,948
Computer Info Systems 6,901 6,692 5,873 5,700 5,154 6,579
Subratio HSB 4,977 5,507 6,195 5,367 5,711 6,884
Chemistry 6,761 5,872 6,155 5,739 5,078 5,752
Biology + ANS + Geology 3,716 3,833 3,786 3,339 3,836 4,397
Mathematics§ 4,279 5,051 5,107 4,323 4,192 5,547
Physics 4,210 4,006 3,636 3,230 3,344 3,622
Subratio CSM 4,455 4,623 4,649 4,098 4,158 4,945
Art 3,764 3,682 4,112 4,245 4,537 5,087
Language/Literature§ 3,443 3,604 3,448 2,750 3,160 4,121
Mass Communications 3,624 4,925 5,261 4,032 4,394 4,013
Music 5,894 7,201 7,260 6,837 7,357 9,249
Speech Communications 3,488 3,658 2,849 2,321 2,209 1,771
Subratio Humanities 3,901 4,297 4,265 3,657 3,977 4,649
Psychology 2,792 2,564 2,489 1,978 1,731 2,091
History et al 2,457 3,193 3,078 2,835 3,010 3,758
Sociology/Anthropology 2,681 2,644 2,596 2,282 2,279 2,687
Social Work 5,459 6,528 7,050 4,972 4,395 3,970
Subratio Soc Sciences 2,819 3,144 3,123 2,665 2,609 3,017
Subratio Hum/Soc Sci. 3,369 3,720 3,685 3,145 3,239 3,778
University Ratio 4,278 4,597 4,650 4,017 4,187 4,858
*Program discontinued in FY 2005-06 **New Programs, Athletic Training FY 2009-10, Construction Mgmt FY 2010-11 §Student FTE do not include any developmental (Math, Rdg, and Eng 09X)courses
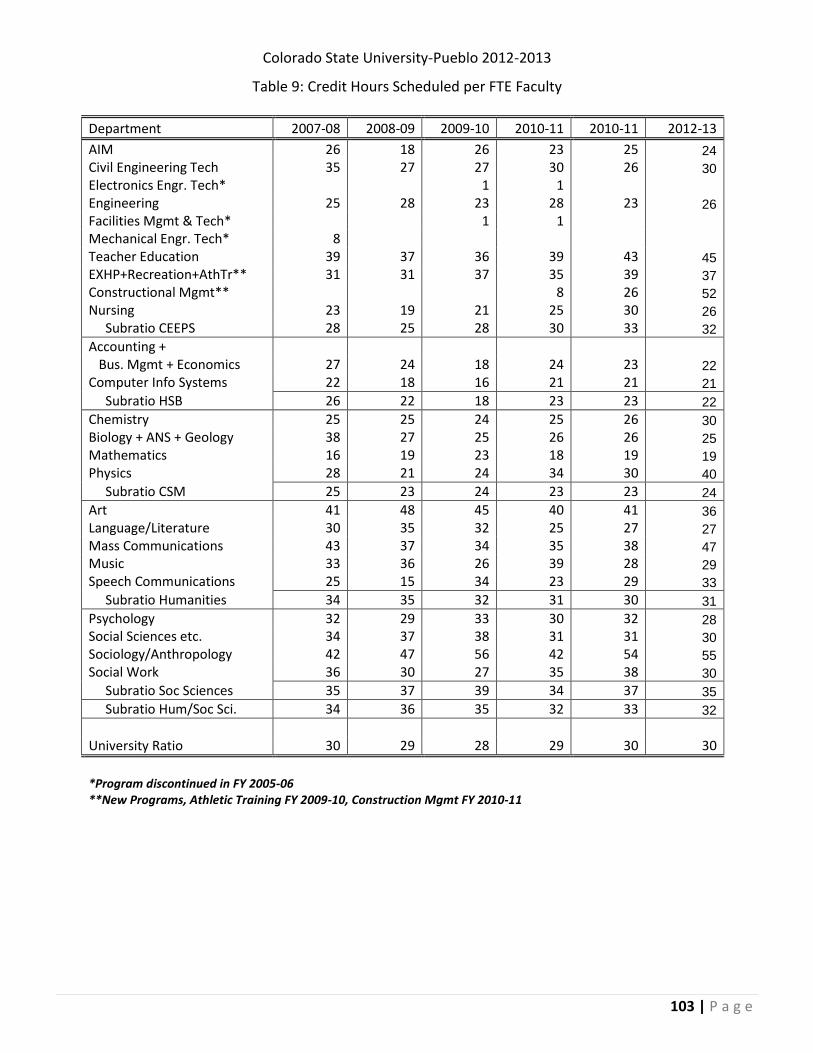
Colorado State University-Pueblo 2012-2013
103 | P a g e
Table 9: Credit Hours Scheduled per FTE Faculty
Department 2007-08 2008-09 2009-10 2010-11 2010-11 2012-13
AIM 26 18 26 23 25 24
Civil Engineering Tech 35 27 27 30 26 30
Electronics Engr. Tech*
1 1
Engineering 25 28 23 28 23 26
Facilities Mgmt & Tech*
1 1
Mechanical Engr. Tech* 8
Teacher Education 39 37 36 39 43 45
EXHP+Recreation+AthTr** 31 31 37 35 39 37
Constructional Mgmt**
8 26 52
Nursing 23 19 21 25 30 26
Subratio CEEPS 28 25 28 30 33 32
Accounting +
Bus. Mgmt + Economics 27 24 18 24 23 22
Computer Info Systems 22 18 16 21 21 21
Subratio HSB 26 22 18 23 23 22
Chemistry 25 25 24 25 26 30
Biology + ANS + Geology 38 27 25 26 26 25
Mathematics 16 19 23 18 19 19
Physics 28 21 24 34 30 40
Subratio CSM 25 23 24 23 23 24
Art 41 48 45 40 41 36
Language/Literature 30 35 32 25 27 27
Mass Communications 43 37 34 35 38 47
Music 33 36 26 39 28 29
Speech Communications 25 15 34 23 29 33
Subratio Humanities 34 35 32 31 30 31
Psychology 32 29 33 30 32 28
Social Sciences etc. 34 37 38 31 31 30
Sociology/Anthropology 42 47 56 42 54 55
Social Work 36 30 27 35 38 30
Subratio Soc Sciences 35 37 39 34 37 35
Subratio Hum/Soc Sci. 34 36 35 32 33 32
University Ratio 30 29 28 29 30 30
*Program discontinued in FY 2005-06 **New Programs, Athletic Training FY 2009-10, Construction Mgmt FY 2010-11