columbia pike transit initiative: comparative … pike transit initiative: comparative return on ......
TRANSCRIPT
Columbia Pike Transit Initiative:
Comparative Return on Investment Study
Prepared for:
Arlington County, Virginia
March 26, 2014
Prepared by:
HR&A Advisors, Inc.
2101 L Street NW, Suite 800
Washington, DC 20037-1526

General and Limiting Conditions
1. HR&A Advisors, Inc. (HR&A) has been engaged and compensated by Arlington County, Virginia to
prepare this Study. In preparing this Study, HR&A has used its independent professional judgment
and skills in good faith, subject to the limitations, disclosures and disclaimers herein.
2. Any person who relies on or otherwise uses this Study is required to have first read, understood
and accepted the following disclosures, limitations and disclaimers, and will, by reason of such
reliance or other use, be deemed to have read, understood and accepted the same.
3. This Study is based on estimates, assumptions and other information developed by HR&A, other
third party consultants, and Arlington County officials. Every reasonable effort has been made to
ensure that the data contained in this Study are accurate as of the date of this Study; however,
factors exist that are outside the control of HR&A and that may affect the estimates and/or
projections noted herein.
4. HR&A reviewed the information and projections provided by third parties using its independent
professional judgment and skills in good faith, but assumes no liability resulting from errors,
omissions or any other inaccuracies with respect to the information provided by such third parties
referenced in this Study.
5. HR&A also relied on data provided by or obtained from Arlington County, Fairfax County,
AECOM, CoStar Group, ESRI Business Analyst, and the U.S. Bureau of Labor Statistics in the
preparation of this report. HR&A assumes no liability resulting from errors, omissions or any other
inaccuracies with respect to the information provided by these parties.
6. In addition to relying on data, information, projections and forecasts of others as referred to
above, HR&A has included in this Study estimates, assumptions, and projections of future events
made by HR&A that HR&A believes are appropriate, but HR&A makes no representation that
there will be no variances between actual outcomes and such estimates and assumptions.
7. No opinion is intended to be expressed and no responsibility is assumed for any matters that are
legal in nature or require legal expertise or specialized knowledge beyond that of a real estate
and economic development consultant.
8. This Study is qualified in its entirety by, and should be considered in light of these General and
Limiting Conditions. By use of this Study each party that uses this Study agrees to be bound by all
of the General and Limiting Conditions stated herein.
HR&A Advisors, Inc. Comparative Return on Investment Study | 2
Table of Contents
General and Limiting Conditions ..................................................................................................................................... 2
Table of Contents ............................................................................................................................................................... 3
Executive Summary ............................................................................................................................................................. 4
I. Summary of Transit Services ...................................................................................................................................... 10
II. Existing Transit Corridor Conditions ......................................................................................................................... 14
III. Real Estate and Economic Development Impacts of Transit ............................................................................... 29
IV. Developer and Retailer Interview Findings .......................................................................................................... 42
V. Economic Impacts of Columbia Pike Transit Initiative .......................................................................................... 48
VI. Local Fiscal Benefits ................................................................................................................................................... 59
VII. Appendix.................................................................................................................................................................... 61
HR&A Advisors, Inc. Comparative Return on Investment Study | 3

Executive Summary
Introduction
The Columbia Pike transit corridor, located in Arlington and Fairfax Counties in the Commonwealth of
Virginia, is an important regional transportation link that spans a series of urban contexts. The Columbia
Pike corridor lies outside of Arlington County’s two Metrorail corridors, and, as a focal point for the
County’s multi-year Columbia Pike Initiative and Columbia Pike Neighborhoods Area Plan, is expected to
accommodate a larger share of future regional growth in the coming decades, putting increasing pressure
on an existing bus system that is already at-capacity. In response to the need for a transportation solution
that expands transit capacity and encourages mode shifting from single-occupancy vehicles, Arlington and
Fairfax Counties undertook a comprehensive analysis of transit alternatives, including a no build scenario,
two levels of enhanced bus service, and a streetcar. Because an existing agreement between Arlington
County and the Virginia Department of Transportation stipulates that travel lanes cannot be removed from
Columbia Pike,1 a transit service requiring a dedicated lane such as light rail transit or bus rapid transit
(BRT) is not feasible in the transit corridor.2
The County Boards of Arlington County and Fairfax County have both adopted the streetcar build
alternative as the preferred transit alternative along the Columbia Pike transit corridor, enabling a high-
capacity service for the growing and increasingly congested corridor. In response to constituent questions
on the benefits of a streetcar service versus an enhanced bus service, Arlington County, Virginia (“The
County”) retained HR&A Advisors, Inc. (HR&A) to prepare an updated and comparative return on
investment analysis of the streetcar alternative versus an enhanced bus alternative.
This study specifically compares the value of streetcar service versus an enhanced bus service across
several dimensions, including economic and fiscal benefits generated, the ability to support the County’s
development and place-making goals, and anticipated timing of these impacts. A key consideration is that
the Columbia Pike Transit Initiative is intended not simply as a mobility solution, but an opportunity for
integrated land use and transportation planning that enhances the quality of place of the corridor.
Arlington County’s Columbia Pike Neighborhoods Area Plan (2012) and Columbia Pike Initiative (2005),
envision a compelling, accessible medium-density residential and retail corridor that provides market rate
and affordable housing opportunities and a diversity of options for entertainment, eating, and shopping.
The County’s Pentagon City General Land Use Plan envisions a dynamic, high-density, 24-hour neighborhood
with a mix of residential uses that complement its core retail and office functions. The Fairfax County
Comprehensive Plan, as amended in 2013, envisions a restored urban center, connected to the Washington
Metro via mass transit. The development Fairfax County seeks to promote will complement the existing
Skyline Complex and retailers.
1 Source: County Board of Arlington County, Virginia; Commonwealth of Virginia, Department of Transportation, "Memorandum of Agreement, Transfer of Columbia Pike (Route 244) and Certain Other Streets Ancillary to Columbia Pike From the Primary System of State Highways to the Local Road System of Arlington County," 2010. 2 The Institute for Transportation Development and Policy (ITDP) has produced a commonly-used scoring system, “the BRT Standard,” that defines the criteria for a bus system qualifying as “BRT.” According to ITDP, one of the threshold requirements for BRT is a dedicated right-of-way, something that is not possible on the Columbia Pike Corridor. In the United States, no transit corridors have earned a “gold” ranking on the BRT Standard and only the Health Line in Cleveland has earned “silver.” The vast majority of rapid bus lines in the US, including what would be possible on Columbia Pike under the TSM 2 alternative, are considered “below basic.”
HR&A Advisors, Inc. Comparative Return on Investment Study | 4

Transit investment is an important factor in facilitating the desired future of each submarket because it
creates new connections and enhances existing connections, is new infrastructure that is attractive to
development, and can be paired with place-making efforts and amenities to draw residents and
businesses. In order to attract growth in the form of high-quality, walkable places, Arlington and Fairfax
County recognize that they must make infrastructure improvements that make the corridor more competitive
in capturing demand in the Washington DC metro area, especially in response to high-quality transit
investments elsewhere in the region such as the Silver Line, H-Street Streetcar, and Purple Line.
To produce this study, HR&A analyzed current real estate conditions along the transit corridor, conducted a
detailed review and data analysis of the real estate and economic impacts of previous transit investments
elsewhere in the United States, and engaged with the local real estate and retail community to understand
their perceptions of the impacts of streetcar versus enhanced bus service. Based on the breadth of this
evidence, HR&A prepared an economic model that compares the net benefits, in terms of real estate value
generated, to Arlington and Fairfax Counties of a streetcar or enhanced bus service versus baseline
conditions over a 30-year period. HR&A also developed estimates of the number of jobs supported and
County tax revenues generated by each transit service versus baseline conditions.
HR&A is a real estate and economic development consulting firm with offices in Washington, DC, New
York, NY, and Los Angeles, CA. HR&A has provided high-quality independent analysis for complex public-
private development projects in the United States and abroad for over three decades. The firm specializes
in measuring the economic and fiscal impacts of major development and infrastructure projects, as well as
policy interventions. Studies recently completed by HR&A include an economic and fiscal impact study of
the proposed streetcar system in the District of Columbia and a benefit-cost assessment of the
reconstruction of the Inner Loop in Rochester, NY.
Transportation Impacts
The most recent transportation modeling, which accounts for the connection of the Columbia Pike
transit to the Crystal City Streetcar, estimated that the streetcar would initially carry 15,900 daily riders
versus 11,800 for the enhanced bus service, a difference of 35 percent.3
AECOM conducted ridership forecasting on behalf of Arlington County for an initial build year and in the
year 2035. The transportation model accounted for modal preference and network benefits conferred via
a connection to the planned Crystal City Streetcar. Either enhanced bus or streetcar would provide an
easier connection to the Metro at Pentagon City, linking the corridor to the regional markets for jobs,
labor, and customers. Assuming no connection to the planned Crystal City Streetcar, the transportation
model estimates initial daily ridership of 13,800 for a streetcar and 11,800 for an enhanced bus, a
difference of 17 percent.
A streetcar along Columbia Pike would enable a seamless, one-seat ride from Skyline through Crystal City.
A connection between enhanced bus service along Columbia Pike and the Crystal City Streetcar, by
contrast, would require a modal transfer. The transportation modeling conducted on behalf of Arlington
3 Per Federal Transit Administration guidelines, “existing conditions” forecasts were for the year 2015, rather than the actual anticipated opening year of 2019. In 2019, the ridership would likely be somewhat higher for both modes due to population and employment growth along the corridor.
HR&A Advisors, Inc. Comparative Return on Investment Study | 5
County estimated daily ridership in the initial year of operation of 15,900 for the Columbia Pike streetcar
service with a Crystal City connection, versus 11,800 for enhanced bus, a difference of 35 percent. This
difference reflects the extent to which a seamless service would be valued as a critical link between
Columbia Pike and employment nodes in Crystal City, Pentagon City, and Skyline.
Summary of Findings
Investment in transit increases demand for locations along the corridor because it improves mobility for
residents, workers, and visitors moving along the corridor and creates a place-making amenity that serves
to brand the corridor and enhance the character of its public realm. The transportation benefits and higher
quality of place are reflected through three types of impacts to real estate along the corridor: property
value appreciation for existing properties along the corridor, and a faster pace and greater extent of
future development along the transit corridor as the development community responds to an increase in the
corridor’s desirability by delivering new product. Ultimately, transit investment positions the corridor to
capture a great share of regional development, growing the local tax base and attaining the vision
articulated in County planning documents.
HR&A’s analysis of data regarding development impacts of previous transit investments in the United
States and of the collective opinions provided in interviews with local developers and retailers informed
the assumptions that underpinned our economic model. HR&A found that streetcars and comparable fixed
guideway systems in the United States have, with few exceptions, facilitated more significant impacts in
terms of value and volume of new real estate development than either BRT or enhanced bus.
The comparative economic model analyzed the incremental benefits to the economies of both Arlington
and Fairfax Counties of enhanced bus versus streetcar service over a 30-year period. For both types of
service, real estate value impacts were compared against initial capital costs and ongoing annual
operating and maintenance costs to determine the net incremental benefit in each year. Net incremental
benefits are benefits over and above those anticipated to occur over the next 30 years under baseline
conditions without a transit investment.
Net Incremental Benefits
Over 30 years, HR&A estimates that streetcar will confer between $2.2 billion and $3.0 billion more
in net incremental benefits over and above enhanced bus, and between $3.2 billion and $4.4 billion
more in net incremental benefits over and above baseline conditions.
Streetcar service is expected to generate a significantly larger net incremental benefit to Arlington and
Fairfax Counties than enhanced bus service because the real estate benefits generated significantly
outweigh the streetcar’s higher initial capital costs. HR&A’s projections of net incremental benefits are
presented in Figure 1.
HR&A Advisors, Inc. Comparative Return on Investment Study | 6

Figure 1: Net Incremental Benefits (Return on Investment) of Enhanced Bus and Streetcar Service
0% Discount Rate 3% Discount Rate 7% Discount Rate
TSM 2 Streetcar TSM 2 Streetcar TSM 2 Streetcar
Net Incremental Benefits -
Return on Investment ($M) $1,930 $5,770 $1,410 $4,390 $1,000 $3,210
Source: HR&A Advisors, Inc. analysis
Note: All dollar amounts are in millions of $2014, rounded to nearest $10 million.
Applying a three percent discount rate to future net benefits, streetcar service generates $4.4 billion in net
benefits versus $1.4 billion for enhanced bus service. Applying a seven percent discount rate to future net
benefits, streetcar service generates approximately $3.2 billion in net benefits versus $1 billion for
enhanced bus service.
This study does not make an assumption about the source of funds for the capital investment in enhanced
transit. While the benefits accrue primarily within Arlington County and Fairfax County, to the extent that
capital costs are subsidized by the federal or state government, these costs will not necessarily be borne
locally, which serves to understate the net economic benefits of both streetcar and enhanced bus service to
Arlington County and Fairfax County.
Incremental Employment Benefits
By 2027, or approximately ten years after the beginning of construction, HR&A estimates that
streetcar will support 6,600 new jobs in the transit corridor over the amount that would existing under
baseline conditions, and 4,600 new jobs more than would be supported by enhanced bus.
HR&A estimated the number of jobs that would be supported by net new real estate development in
Arlington and Fairfax Counties owing to the new investment in transit infrastructure. New commercial and
retail space would support additional transit-accessible employment opportunities in the two counties. The
results of this analysis are presented in Figure 2.
Figure 2: Incremental New Jobs Supported by 2027
TSM 2 Streetcar
2,000 6,600
Source: HR&A Advisors, Inc. analysis
Note: All figures rounded to nearest 100 jobs.
HR&A Advisors, Inc. Comparative Return on Investment Study | 7

Incremental Local Fiscal Benefits
HR&A estimates that over a 30-year period, an investment in streetcar and the resulting real estate
impacts will generate between $315 million and $620 million more in local tax revenues for the two
counties than would be generated by enhanced bus.
The increased quantity, pace, and value of development along the transit corridor will generate new tax
revenues for Arlington County and Fairfax County. HR&A estimated the incremental tax revenue
generated by enhanced bus service and streetcar service from new real estate property taxes, personal
property taxes, business/professional/occupational license taxes, sales taxes (only the portion retained
locally), and meal taxes.
As in HR&A’s economic model, tax revenues projected to be generated by both enhanced bus and
streetcar service are net of projected tax revenues under baseline conditions. The model estimates tax
revenues over a 30 year period, with the fiscal benefits reported under a three percent and seven percent
discount rate. Fiscal benefits are presented in Figure 3.
Figure 3: Incremental Tax Revenue Due to Enhanced Bus and Streetcar Service
0% Discount Rate 3% Discount Rate 7% Discount Rate
TSM 2 Streetcar TSM 2 Streetcar TSM 2 Streetcar
Arlington County $385 $1,260 $225 $735 $115 $375
Fairfax County $90 $285 $50 $160 $25 $80
Total Tax Revenue $475 $1,545 $275 $895 $140 $455
Source: HR&A Advisors, Inc. analysis
Note: All dollar amounts are in millions of $2014, rounded to nearest $5 million.
Streetcar service would help Arlington County and Fairfax County attract a more substantial share of new
economic activity in the region, producing more net new tax revenue. HR&A projects that streetcar service
generates significantly greater fiscal benefits to both Arlington County and Fairfax County than does
enhanced bus service. We estimate the total net present value of tax revenues generated by a streetcar
service to Arlington County and Fairfax County as $895 million assuming a three percent discount rate,
and $455 million assuming a seven percent discount rate. By contrast, we estimate the net present value
of tax revenues generated by an enhanced bus service to Arlington County and Fairfax County of $275
million assuming a three percent discount rate and $140 million assuming a seven percent discount rate.
Report Organization
This report is organized in six chapters, plus an appendix. The first two chapters outline baseline
transportation and real estate characteristics. The following two chapters outline evidence on how each
transit mode will affect baseline conditions. The final two chapters present the economic and fiscal impacts
generated by each intervention.
HR&A Advisors, Inc. Comparative Return on Investment Study | 8

Chapter I: Summary of Transit Services: This chapter summarizes the specific characteristics of
the streetcar service and enhanced bus service analyzed, including their respective operating
characteristics, projected ridership, and costs.
Chapter II: Existing Transit Corridor Conditions: This chapter describes the existing real
estate conditions on the transit corridor that would potentially be affected by new transit
service, including demographics, streetscape conditions, development pace, property values
and rents, and tax revenue generation. It also outlines the visions of Arlington and Fairfax
Counties for the corridor as expressed through plans and regulatory documents.
Chapter III: Real Estate and Economic Development Impacts of Transit: This chapter
summarizes the findings of HR&A’s literature review and case studies of previous transit
investments and describes how these findings relate to the future of the Columbia Pike transit
corridor under an enhanced bus and streetcar system.
Chapter IV: Developer and Retailer Interview Findings: This chapter summarizes the findings
of HR&A’s interviews with local real estate developers and retailers, focusing on how they
perceive either a streetcar or enhanced bus service would affect real estate and retail
dynamics along the Columbia Pike.
Chapter V: Economic Impacts of Columbia Pike Transit Initiative: This chapter synthesizes
the findings of the transit precedents and interviews to advance assumptions on how the
streetcar service and enhanced bus service will affect real estate dynamics along the corridor.
The results of HR&A’s economic model are presented, including real estate value and jobs
generated under each scenario.
Chapter VI: Local Fiscal Benefits: This chapter presents the results of HR&A’s fiscal model,
detailing the new tax revenues projected to be generated from both a streetcar and
enhanced bus service.
Appendix: The appendix consists of detailed findings from HR&A’s literature review, the full
case studies of comparable systems developed by HR&A, and the interview questionnaires
that HR&A employed in engaging the local real estate community and retailers.
HR&A Advisors, Inc. Comparative Return on Investment Study | 9
I. Summary of Transit Services
Arlington County, Virginia retained HR&A to prepare an updated and comparative return on investment
analysis of the proposed Columbia Pike Transit Initiative. HR&A’s comprehensive study compares the net
benefits of streetcar service versus an enhanced bus service across several dimensions. This chapter outlines
the transportation characteristics of the streetcar and enhanced bus service. The assumptions in this chapter
underpin the remainder of HR&A’s analysis.
The comparative analysis assumes the streetcar alternative largely corresponds to the Skyline Central
Plaza design alternative defined in the Alternatives Analysis/Environmental Assessment, and the enhanced
bus alternative largely corresponds to the Transportation Systems Management 2 (“TSM 2”) transit
alternative defined in the Alternatives Analysis/Environmental Assessment. Because this right-of-way is
constrained by legal agreement and by space, it cannot include a dedicated lane to accommodate bus
rapid transit or a light rail line. Such a dedicated right of way is one of the threshold criteria to meet the
Institute for Transportation and Development Policy’s “BRT Standard.” By that rating system, no bus
corridors in the US are defined as “gold,” and only the Health Line in Cleveland scores “silver.” The TSM 2
alternative, like most rapid bus lines in the US, would score “below basic” in this system.
Any discrepancies between the characteristics and assumptions reported in this chapter versus the original
Alternatives Analysis/Environmental Assessment reflect new information, and are specifically noted in this
chapter.
HR&A’s comparative analysis assumes that both the streetcar and enhanced bus alternatives offer
connections to existing transit options in Arlington (including WMATA and ART buses and the Pentagon City
Metrorail Station), and a connection to the proposed Crystal City Streetcar Corridor. With streetcar service
along Columbia Pike, the lines could effectively function as one line offering a one-seat ride from Skyline
through Crystal City. A connection between enhanced bus service along Columbia Pike and the Crystal City
Streetcar would require a modal transfer.
All information regarding the characteristics of the streetcar and enhanced bus service alternatives was
furnished by Arlington County and its consultants, and is summarized by HR&A for the purposes of this
comparative assessment. AECOM conducted ridership forecasting for the existing year (2015) and in the
year 2035. A table summarizing the assumed transportation characteristics of each alternative follows the
detailed descriptions of the service.
Streetcar Service
Overview
The Streetcar alternative provides enhanced transit service along Columbia Pike through a modern
streetcar service featuring extended service hours and increased frequency. The Streetcar alternative
would replace the 16G and 16H bus routes along Columbia Pike, and extend these routes to Skyline. No
other bus lines would be eliminated. Streetcars would be powered by overhead wires, and operate in the
outside lanes of Columbia Pike along with other traffic.
HR&A Advisors, Inc. Comparative Return on Investment Study | 10
Operations
The Streetcar alternative would maintain service hours similar to Metrorail, operating weekdays from 5:30
AM to 1:00 AM, Saturdays from 6:30 AM to 1:00 AM, and Sundays from 6:00 AM to 11:30 PM. The
streetcar service, in combination with the existing bus service, would operate at combined two-to-three
minute headways during the peak period and at combined four minute headways during the off-peak
period. Stops would be spaced 0.25 to 0.5 miles apart. Total travel time would be 22 minutes in each
direction. Streetcar service would feature off-vehicle fare collection, and multi-door boarding/alighting. It
is assumed that Arlington Transit would operate the service.
Capacity and Ridership
The Columbia Pike transit network would have a total transit capacity (streetcar and buses) of 2,300
during peak hour/direction under the streetcar alternative. With total projected rider demand of 2,100 in
2035, the volume to capacity ratio would be 0.91, indicating high utilization but not overcapacity. Initial
streetcar daily ridership is projected to be of 13,800 without a connection to the Crystal City Streetcar,
increasing to 15,900 with a connection to the Crystal City Streetcar.4 This compares to 2010 daily
ridership of 2,600 for the 16G and 16H lines (the bus lines that would be replaced by the streetcar).
Equipment and Infrastructure Requirements
The streetcar alternative requires the purchase of 14 streetcars, each with a capacity of 155 passengers
per vehicle. The system would require investments in new permanent stops, with stops along Columbia Pike
being developed through the Super Stops program. These stops have 90 to 120-foot long platforms and
incorporate off-vehicle fare collection machines. Stops would also include real-time information, waiting
areas, and shelters. The system also requires investment in an overhead contact wire system, five traction
power substations (TPSS), a 12,000 square foot operations and maintenance facility, and a construction
staging and storage facility. The system requires a new intermodal transit center within what is currently a
large parking area of the Crossroads Center mall at the corner of Jefferson Street near Leesburg Pike.
The transit center would include daily and short-term parking, loading bays for connecting bus lines, and
curbside pick-up and drop-off in the ultimate configuration. The most likely total cost of the project in year
of expenditure dollars, as identified by the Project Management Oversight Contractor (PMOC) Report
prepared for the FTA, is $310 million. In current dollars ($2014), the total project cost is $284 million.
Enhanced Bus Alternative
Overview
The enhanced bus alternative is an enhanced bus service that operates with larger, 60-foot articulated
buses, extended service hours, and increased frequency. The bus alternative would replace the 16G and
16H bus routes along Columbia Pike, and extends these routes to Skyline. The buses would share lanes with
other traffic along Columbia Pike and not operate in a dedicated lane, as the removal of travel lanes
4 Arlington County revised the planned vehicle capacity from 115 riders to 155 riders in response to the strong projected ridership.
HR&A Advisors, Inc. Comparative Return on Investment Study | 11

from Columbia Pike is expressly prohibited by an agreement between Arlington County and Virginia
Department of Transportation.5
Operations
The enhanced bus alternative would maintain service hours similar to Metrorail, operating weekdays from
5:30 AM to 1:00 AM, Saturdays from 6:30 AM to 1:00 AM, and Sundays from 6:00 AM to 11:30 PM. The
enhanced bus service, in combination with the existing bus service, would operate at combined two-to-three
minute headways during the peak period and at combined four minute headways during the off-peak
period. Stops would be spaced 0.25 to 0.5 miles apart. Total travel time would be 23 minutes in each
direction. The system would feature off-vehicle fare collection, and multi-door boarding/alighting. It is
assumed that Arlington Transit would operate the service, rather than WMATA as had been indicated in
the Columbia Pike Transit Initiative: Alternatives Analysis / Environmental Assessment.
Capacity and Ridership
The Columbia Pike transit network would have a total transit capacity (enhanced bus and buses) of 1,600
during peak hour/direction under the enhanced bus alternative. With total projected rider demand of
1,900 in 2035, the volume to capacity ratio would be 1.19, indicating the transit network would be
overcapacity. Initial enhanced bus daily ridership is projected to be 11,800 with or without a connection to
the Crystal City Streetcar. This compares to 2010 daily ridership of 2,600 for the 16G and 16H lines (the
bus lines that would be replaced by enhanced bus).
Equipment and Infrastructure Requirements
The enhanced bus alternative requires the purchase of 18, 60-foot articulated buses, each with a capacity
of 94 passengers.6 The system would require investments in new permanent stops, with stops along
Columbia Pike being developed through the Super Stops program, and a new intermodal transit center at
Crossroads Center Mall, both as described under the Streetcar alternative. It would also require a new
O&M facility that could accommodate articulated buses. This operations and maintenance facility was not
identified in the original Alternatives Analysis/Environmental Assessment, but subsequent analysis by
Arlington County has determined it would be required to service articulated buses. Moreover, the
enhanced bus service would require replacing the asphalt bus travel lane on Columbia Pike with a concrete
lane. This improvement was also not identified in the original Alternatives Analysis/Environmental
Assessment, but subsequent analysis by Arlington County determined it would be required to maintain road
conditions. With the inclusion of these additional costs (estimated to total $15 million), the total project cost
($2014) is estimated to be $67 million.7
5 Source: County Board of Arlington County, Virginia; Commonwealth of Virginia, Department of Transportation, "Memorandum of Agreement, Transfer of Columbia Pike (Route 244) and Certain Other Streets Ancillary to Columbia Pike From the Primary System of State Highways to the Local Road System of Arlington County," 2010. 6 The purchase of more than 14 buses may be required to accommodate the number of riders projected in the most recent, but
this study assumes only 14 vehicles must be purchased. 7 This cost estimate assumes that the following costs are added to the $52 million capital cost estimate ($2014) for the TSM 2 Alternative from the Columbia Pike Transit Initiative: Alternatives Analysis / Environmental Assessment: the cost of constructing the O&M Facility is $3.3 (the difference between the Support Facilities line item for the TSM 2 Alternative and Streetcar Alternative in the Columbia Pike Transit Initiative: Alternatives Analysis / Environmental Assessment); the cost of acquiring the land for the O&M Facility is $6.4 million (as reported in the Columbia Pike Transit Initiative: Alternatives Analysis / Environmental Assessment); and the cost of the concrete lane is $5.5 million (based on analysis prepared by Arlington County). It should be noted the cost estimates for the O&M facility are conceptual; a site that could accommodate the enhanced bus O&M facility has not been identified, and this
HR&A Advisors, Inc. Comparative Return on Investment Study | 12
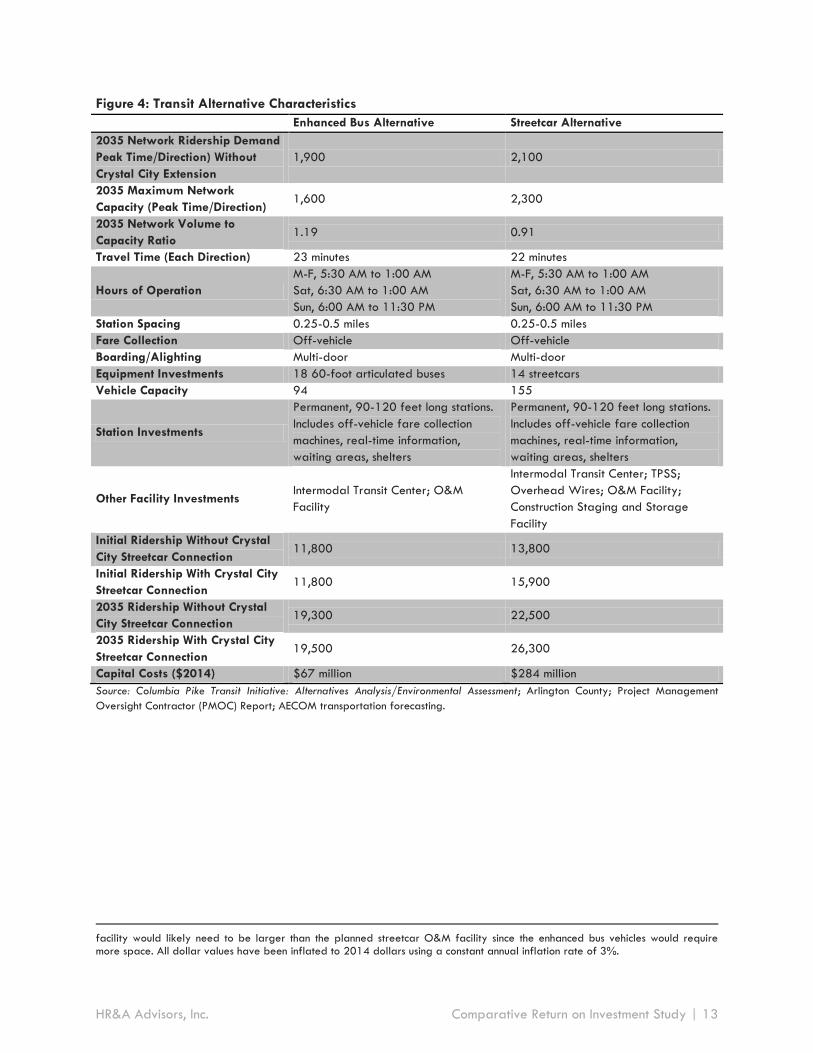
Figure 4: Transit Alternative Characteristics
Enhanced Bus Alternative Streetcar Alternative
2035 Network Ridership Demand
Peak Time/Direction) Without
Crystal City Extension
1,900 2,100
2035 Maximum Network
Capacity (Peak Time/Direction) 1,600 2,300
2035 Network Volume to
Capacity Ratio 1.19 0.91
Travel Time (Each Direction) 23 minutes 22 minutes
Hours of Operation
M-F, 5:30 AM to 1:00 AM
Sat, 6:30 AM to 1:00 AM
Sun, 6:00 AM to 11:30 PM
M-F, 5:30 AM to 1:00 AM
Sat, 6:30 AM to 1:00 AM
Sun, 6:00 AM to 11:30 PM
Station Spacing 0.25-0.5 miles 0.25-0.5 miles
Fare Collection Off-vehicle Off-vehicle
Boarding/Alighting Multi-door Multi-door
Equipment Investments 18 60-foot articulated buses 14 streetcars
Vehicle Capacity 94 155
Station Investments
Permanent, 90-120 feet long stations.
Includes off-vehicle fare collection
machines, real-time information,
waiting areas, shelters
Permanent, 90-120 feet long stations.
Includes off-vehicle fare collection
machines, real-time information,
waiting areas, shelters
Other Facility Investments Intermodal Transit Center; O&M
Facility
Intermodal Transit Center; TPSS;
Overhead Wires; O&M Facility;
Construction Staging and Storage
Facility
Initial Ridership Without Crystal
City Streetcar Connection 11,800 13,800
Initial Ridership With Crystal City
Streetcar Connection 11,800 15,900
2035 Ridership Without Crystal
City Streetcar Connection 19,300 22,500
2035 Ridership With Crystal City
Streetcar Connection 19,500 26,300
Capital Costs ($2014) $67 million $284 million
Source: Columbia Pike Transit Initiative: Alternatives Analysis/Environmental Assessment; Arlington County; Project Management
Oversight Contractor (PMOC) Report; AECOM transportation forecasting.
facility would likely need to be larger than the planned streetcar O&M facility since the enhanced bus vehicles would require more space. All dollar values have been inflated to 2014 dollars using a constant annual inflation rate of 3%.
HR&A Advisors, Inc. Comparative Return on Investment Study | 13

II. Existing Transit Corridor Conditions
This chapter establishes the existing demographic and real estate market conditions in submarkets
proximate to the proposed Columbia Pike transit corridor. The chapter documents the current area built
environment conditions, demographics, existing transit ridership, residential, office, and retail real estate
market conditions, and current property tax revenues. These existing conditions provide the baseline
against which HR&A analyzed projected real estate market changes due to an investment in a streetcar or
enhanced bus service.
Study Area Submarkets
The transit corridor travels through three submarkets: Pentagon City in Arlington County, Columbia Pike in
Arlington County, and Baileys Crossroads in Fairfax County. The majority of the corridor is along Columbia
Pike, connecting Pentagon City and Skyline Plaza in Baileys Crossroads at the termini (see Figure 5).
Source: AECOM
HR&A compiled demographic indicators for each submarket within a 0.25-mile radius of the transit
corridor. HR&A also compiled real estate indicators, the development pipeline, assessed values, and taxes
generated within each submarket using submarket boundaries as determined roughly by a 0.25-mile
radius of the transit corridor (the “Study Area”). For the purposes of this analysis, this boundary was
adjusted along Columbia Pike to include larger, single-ownership multifamily rental properties which exist
within Neighborhood Area Plan subareas and Commercial Nodes. The Pentagon City submarket also
Figure 5: Map of Transit Corridor
HR&A Advisors, Inc. Comparative Return on Investment Study | 14

includes large, single-ownership multifamily rental properties which fall partially outside the 0.25-mile
radius (see Figure 6 through Figure 8).
Columbia Pike is largely auto-oriented in key commercial nodes, which contain strip malls and some small
office buildings with local businesses. These areas form transitions between large stretches of the Pike with
garden and mid- and high-rise apartment complexes set back from the Pike itself. Sections of Columbia
Pike are pedestrian-friendly, primarily in areas located near newer mixed-used developments and in
commercial nodes east of South Glebe Road, with narrower setbacks, sidewalk-accessible retail (as
opposed to parking lot-accessible retail), and newer streetscaping.
Pentagon City is also primarily auto-oriented, consisting of wide boulevards serving a network of major
roads and highways surrounding the neighborhood. The predominant development context consists of large
multifamily and retail developments on larger parcels, with standalone residential developments set back
from the roads. However, there are a limited number of units located in mixed-use residential
developments with town center-style retail that seeks to incorporate an internal pedestrian experience,
away from the arterials.
Figure 6: Columbia Pike Submarket
Figure 7: Pentagon City Submarket Figure 8: Baileys Crossroads Submarket
HR&A Advisors, Inc. Comparative Return on Investment Study | 15

Baileys Crossroads is the most auto-oriented portion of the alignment, with larger buildings and
neighborhood and community shopping centers set back from Jefferson Street and the Leesburg Pike. The
initial portions of this section of alignment heading south along Jefferson Street from Columbia Pike wind
through garden and mid- and high-rise apartment complexes set back from the road. As the alignment
continues toward Leesburg Pike and Skyline, the residential environment gives way to the Crossroads Place
Mall featuring big box stores and large parking lot. Upon crossing Leesburg Pike into Skyline, the
alignment transitions into Skyline, a large, self-contained residential and office development with a Target
Store. Skyline is interconnected by internal roads and parking lots, with some internal pedestrian
circulation.
Neighborhood Planning Goals
Columbia Pike
Arlington County has worked to increase density, encourage mixed-use development, and promote
vibrancy on Columbia Pike for over a decade. Current efforts began in 1998 with the Columbia Pike
Initiative, a plan to encourage new investment along the Pike in key commercial nodes. This effort led
directly to the adoption of the County's first form based code in February 2003, the Columbia Pike Form
Based Code. This important first step allowed for increased density at the commercial nodes along the Pike,
and under the code, developers have completed 991 new market-rate residential units and 174,000
square feet of retail since 2008.
The County then updated the Columbia Pike Initiative, releasing the Columbia Pike Initiative – A
Revitalization Plan, Update 2005, which refines the implementation and strategy goals of the original plan,
and sought to ensure that the guidelines set by the Form Based Code could be understood in the context of
this and other prior planning efforts.
In 2008, the County initiated an effort to provide the same framework promoted in the Columbia Pike
Initiative to the expansive multi-family residential areas also along the Pike. In July 2012, Arlington County
adopted the Columbia Pike Neighborhoods Area Plan. The Plan seeks to enhance the livability and vibrancy
of the Columbia Pike corridor through affordable housing, transit investment, increased density, open
space, and enhanced public facilities. The Plan seeks to maintain the affordability of existing units at key
properties along the Pike, as well as encourage the provision of new affordable housing through continued
support of the Arlington Affordable Housing Fund, bonus density, transfer of development rights, and other
mechanisms. The Plan also recommends transportation investments along the length of the corridor,
including improved street connections, enhanced pedestrian infrastructure, traffic calming measures, and
investment in a streetcar. Finally, the plan includes recommendations to enhance the existing form based
code to allow developers and landowners additional opportunities beyond just the commercial nodes to
develop property to achieve greater density and increased height along the Pike. As part of the new form
based code, the Neighborhoods Area Plan also offers opportunities for developers to earn density bonuses
by providing affordable housing.
Pentagon City
Arlington County’s vision for Pentagon City is a high-density, mixed-use, transit-oriented neighborhood
serving both residents and employees. Pentagon City consist of just over 230 acres of land, much of which
currently consists of high-rise residential developments, retail malls, some office, and mixed-use residential-
HR&A Advisors, Inc. Comparative Return on Investment Study | 16
retail product. While approximately half of the area was privately developed with high-rise residential
buildings with little comprehensive planning through the 1970s, development in Pentagon City since then
has been largely guided by the following:
1. The 1976 Pentagon City Phased Development Site Plan (PDSP), which set the initial parameters of
Pentagon City as a high-density, mixed-use neighborhood that would take advantage of the then-
new Metro system;
2. The 1997 Pentagon City Planning Task Force, which updated the PDSP to focus more on retail and
residential uses;
3. The County’s current Pentagon City General Land Use Plan (GLUP), which codifies the
recommendations of the remaining, undeveloped areas of the PDSP; and
4. The County’s current zoning ordinance.
The County continues to support Pentagon City as a high-density neighborhood throughout the remaining
portions of the PDSP: in September 2013, the County Board approved an amendment to the PDSP that
will allow for the phased development of PenPlace by Vornado on the largest undeveloped piece of land
in Pentagon City. As proposed and approved by the Board, PenPlace will include two million square feet
of offices, ground floor retail, a hotel, and the option of up to 300 residential units.
Baileys Crossroads
Fairfax County’s primary document for guiding development in Baileys Crossroads is the Fairfax County
Comprehensive Plan, amended in 2013. In it, the County notes that much of Baileys Crossroads consists of
neighborhood-serving shopping centers, strip commercial areas, multifamily housing, and some single-
family homes. Baileys Crossroads is also home to Skyline Center, a large multifamily and office complex.
Two Baileys Crossroads planning districts exist within a one-quarter mile radius of the proposed transit
corridor: Town Center and Baileys East. Town Center is located near and around the proposed transit
center that is to act as the terminus of the planned transit corridor. As expressed in the Comprehensive
Plan, the County’s vision for the area is one of a “densely developed downtown area” with “mixed-used
buildings, urban large scale retail uses, and a new Arts Center.” The County’s vision for Baileys East—
which includes Skyline—is a mixed-used neighborhood similar to Town Center, but at a slightly lower
density. The County envisions additional construction of new, mixed-use residential and office buildings that
compliment Skyline.
Demographic Indicators
Columbia Pike, Pentagon City, and Baileys Crossroads vary greatly in average household size, rates of
homeownership, and income. As demonstrated in Figure 9, each submarket has distinct demographic
characteristics:
Compared to Arlington County as a whole, Columbia Pike has larger households, slightly lower
rates of homeownership, 43% lower median household income, and 42% lower per capita income.
Overall, residents of post-war multifamily buildings along Columbia Pike are typically family
households attracted by the size of the units, which average 1,000 rentable square feet.
Pentagon City has smaller households, lower rates of homeownership, and higher median
household income and per capita income than the Columbia Pike. Median per capita income in
HR&A Advisors, Inc. Comparative Return on Investment Study | 17

Pentagon City is higher than Arlington County as a whole, but median household income is lower, a
function of the small households that reside in the area.
The average household size in Baileys Crossroads is nearly 2.0, which is in between those of
Columbia Pike and Pentagon City, and rates of homeownership are higher than both at just over
40%. Median household income and per capita income are similar to Columbia Pike, at 26% and
40% lower than Pentagon City, respectively.
Figure 9: 2012 Demographic Indicators in Arlington County and within 0.25 Miles of Transit Corridor
Total
Population
Average
Household
Size
Home-
ownership
rate
Median
Household
Income
Median Per
Capita
Income
Arlington County 215,286 2.10 37.6% $90,423 $55,546
Columbia Pike 28,548 2.35 23.3% $51,400 $32,174
Pentagon City 7,072 1.50 9.5% $80,514 $68,921
Baileys Crossroads 9,618 1.99 40.4% $59,328 $40,190
Source: ESRI, HR&A Advisors, Inc., analysis
Ridership
As of 2010, the 15 bus routes operating along the Columbia Pike corridor carry nearly 17,000 riders per
day. At key points along the corridor, buses arrive every 2-3 minutes during peak demand periods. The
16G, 16H, and 16H/, which would be replaced by the new transit service, combined for 2,267 daily
riders in 2010, significantly fewer than the initial number projected to be carried by enhanced bus
(11,800 riders) or streetcar (13,800 riders).
Figure 10: 2010 Bus Ridership Along Transit Corridor
Route Ridership
16A 1,667
16B 1,678
16D 1,676
16F 1,020
16J 2,595
16Y 1,029
16L 90
16G 1,750
16H 531
16H/ 346
ART41 2,737
ART42 1,075
ART45 349
ART74 245
Total 16,788
Source: Washington Metropolitan Area Transit Authority
Note: Routes that would be replaced by enhanced bus or streetcar highlighted.
HR&A Advisors, Inc. Comparative Return on Investment Study | 18
Housing
Residential product throughout the study area generally consists of: single-family homes, low-rise post-war
garden apartments, high-rise post-war apartment towers, and new mid-rise mixed-use apartment
buildings.
Overall Multifamily Residential Market
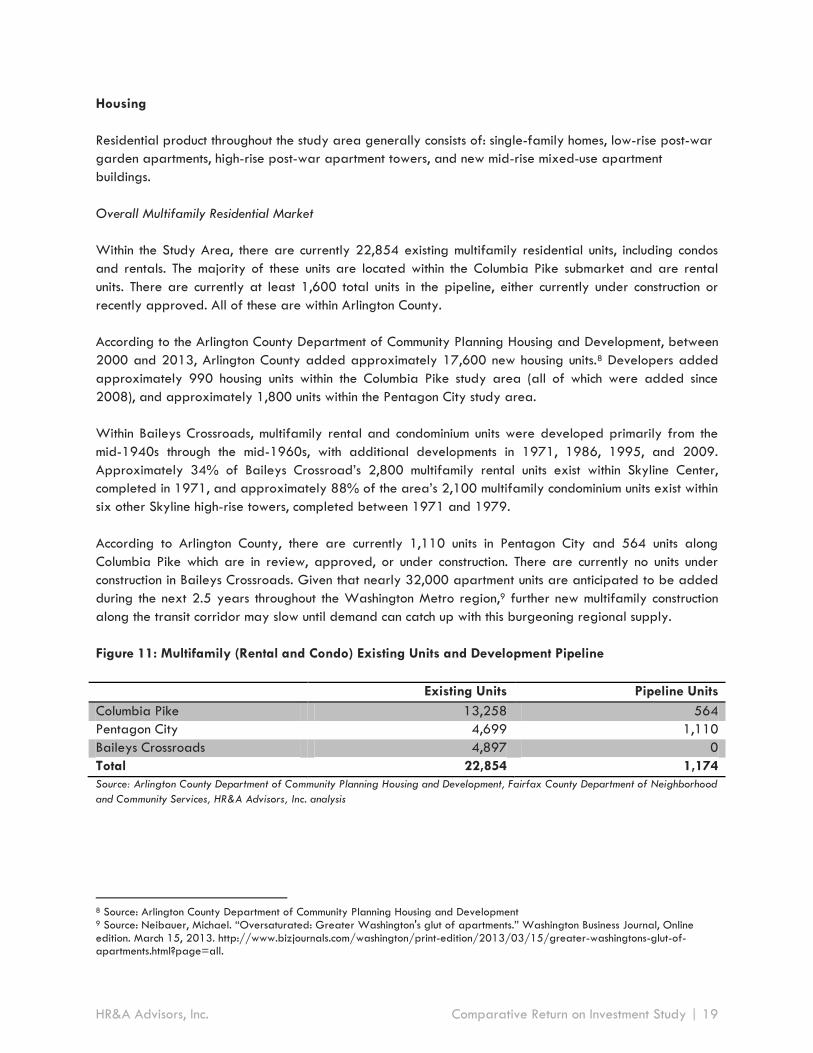
Within the Study Area, there are currently 22,854 existing multifamily residential units, including condos
and rentals. The majority of these units are located within the Columbia Pike submarket and are rental
units. There are currently at least 1,600 total units in the pipeline, either currently under construction or
recently approved. All of these are within Arlington County.
According to the Arlington County Department of Community Planning Housing and Development, between
2000 and 2013, Arlington County added approximately 17,600 new housing units.8 Developers added
approximately 990 housing units within the Columbia Pike study area (all of which were added since
2008), and approximately 1,800 units within the Pentagon City study area.
Within Baileys Crossroads, multifamily rental and condominium units were developed primarily from the
mid-1940s through the mid-1960s, with additional developments in 1971, 1986, 1995, and 2009.
Approximately 34% of Baileys Crossroad’s 2,800 multifamily rental units exist within Skyline Center,
completed in 1971, and approximately 88% of the area’s 2,100 multifamily condominium units exist within
six other Skyline high-rise towers, completed between 1971 and 1979.
According to Arlington County, there are currently 1,110 units in Pentagon City and 564 units along
Columbia Pike which are in review, approved, or under construction. There are currently no units under
construction in Baileys Crossroads. Given that nearly 32,000 apartment units are anticipated to be added
during the next 2.5 years throughout the Washington Metro region,9 further new multifamily construction
along the transit corridor may slow until demand can catch up with this burgeoning regional supply.
Figure 11: Multifamily (Rental and Condo) Existing Units and Development Pipeline
Existing Units Pipeline Units
Columbia Pike 13,258 564
Pentagon City 4,699 1,110
Baileys Crossroads 4,897 0
Total 22,854 1,174
Source: Arlington County Department of Community Planning Housing and Development, Fairfax County Department of Neighborhood
and Community Services, HR&A Advisors, Inc. analysis
8 Source: Arlington County Department of Community Planning Housing and Development 9 Source: Neibauer, Michael. “Oversaturated: Greater Washington's glut of apartments.” Washington Business Journal, Online edition. March 15, 2013. http://www.bizjournals.com/washington/print-edition/2013/03/15/greater-washingtons-glut-of-apartments.html?page=all.
HR&A Advisors, Inc. Comparative Return on Investment Study | 19

Figure 12: Multifamily Monthly Rents Per Square Foot, Q3 2013
Source: Arlington County Department of Community Planning Housing and Development, Fairfax County Department of Neighborhood
and Community Services, CoStar, HR&A Advisors, Inc. analysis
Columbia Pike Multifamily Market Conditions
Overall, residential multifamily rental product along Columbia Pike achieves monthly rents of $1.50 to
$1.65 per square foot. Older properties consisting of MARKs account for the majority of rental units within
the Columbia Pike study area, totaling approximately 7,000 out of 9,700 rental units, or 72%.12 Some of
these older properties have vacancy rates as low as 2%.13
Newer properties along Columbia Pike—such as Halstead, Siena Park, Penrose Square, and others (see
Figure 13)—ask rents of $2.25 to $2.90 per square foot monthly. The majority of current residents are
young professionals and young couples. Units are on average 900 rentable square feet. These buildings
offer amenities found in modern apartments such as resident lounges, fitness centers, rooftop lounges, and
rooftop pools.
Pentagon City Multifamily Market Conditions
Many of the multifamily residential buildings in Pentagon City are high-rises, with a limited number of mid-
rise buildings and one garden-style apartment complex. Construction of these projects commenced on the
northeast end of Pentagon City, between South Lynn Street and I-395. Developers began to deliver these
buildings through the late 1950s and mid-1960s, with the delivery of 1,792 units within the Study Area by
1964. These early properties are modernist-style high-rise buildings surrounded by green plazas, most of
which are condominiums, which contain basic amenities such as indoor gyms and pools. Construction
resumed in the late 1970s with 762 units (220 condos and 542 apartments), adding additional product to
the outer perimeter of Pentagon City along Hayes Road. Except for 299 apartment units delivered in
1990, all of the most recent wave of 1,846 new units have been delivered since 2001. These units are all
rentals. Developers began constructing these new high-rise residential projects surrounding The Fashion
Centre at Pentagon City and Pentagon Centre. Projects include Pentagon Row, Gramercy at Metropolitan
Park, and The Millennium (see Figure 14 for the full list).
In contrast to earlier projects, three out of five of these new residential buildings are mixed-use and have
some retail component. These newer buildings also contain amenities found in most modern apartment
buildings, such as resident lounges, fitness centers, rooftop lounge, and rooftop pools. Residents in
Pentagon City are primarily young professionals in the 25 to 34 year-old range, with many living alone.14
10 Includes all property completed since 2001. 11 Average rents at Bailey’s Crossing, completed 2009, the only new multifamily project completed since 1995. Source: Behringer Harvard Residential. 12 Source: Arlington County Department of Community Planning Housing and Development 13 Source: Developer outreach. 14 Source: Arlington County Department of Community Planning Housing and Development.
All Properties New Properties10
Columbia Pike $1.50-$1.65 $2.35-$2.55
Pentagon City $2.25-$2.35 $2.75-$2.95
Baileys Crossroads $1.60-$1.70 $2.05-$2.1511
HR&A Advisors, Inc. Comparative Return on Investment Study | 20

Pentagon City residents also have the lowest single-occupant vehicle (“SOV”) mode share in the County,
with only 34.2% of residents utilizing SOV as their primary means of transportation to work.15
Overall, rents in Pentagon City are higher than those along Columbia Pike. As a whole, asking rents range
from $2.25-$2.35 per square foot, and asking rents for buildings constructed since 2001 range from
$2.35-$2.45 per square foot.
Baileys Crossroads Multifamily Market Conditions
In Baileys Crossroads, the transit corridor runs south along South Jefferson Street and terminates within
Skyline Center. Skyline Center is a large, multi-tower residential, office, and retail complex located on the
site of the former Washington-Virginia Airport that was completed between 1977 and 1979.
The residential component of Skyline Center consists of eight towers: Skyline Plaza, Skyline House, and
Skyline Square contain approximately 1800 condominium units in six buildings (two buildings each),16 and
Skyline Towers Apartments contain approximately 950 rental units in two buildings.
Beyond Skyline Center, the submarket contains approximately 1,800 additional multifamily units,
developed primarily from the mid-1940s through the mid-1960s, with additional developments in 1986,
1995, and 2009.17 Many of these developments contain rent-restricted units, and market-rate rents
average $1.60 to $1.70 per square foot, with one newer development—Baileys Crossing, built in 2009—
asking average rents from $2.05 to $2.15 per square foot. The study area also includes approximately
250 garden condominium units located with the “Savoy Condo” development constructed in 1994.
15 Source: Ibid. 16 This excludes approximately 500 units within one of the Skyline Plaza towers which is wholly outside of the Study Area. 17 Source: Fairfax County Department of Neighborhood and Community Services, Rental Housing Complex Analysis 2011.
HR&A Advisors, Inc. Comparative Return on Investment Study | 21

Figure 13: New Construction Market-Rate Residential Product on Columbia Pike, All Properties, 2001 to Present18
18 Source: Arlington Economic Development; Individual property and developer websites.
The Halstead Arlington 55 Hundred Siena Park Penrose Square
Developer DSF Group Fairfield Residential Woodfield Investments Carbon Thompson Development
2013 Assessed Value
$95.6 million $71.6 million $71.9 million $120.9 million
Completed 2008 2009 2011 2011
Units 269 235 188 299
Retail (SF) 34,850 7,500 30,000 97,000, including a Giant grocery
Average Unit Size (SF)
940 1,110 740 920
Average Monthly Rent ($/SF)
$2.50 $2.15 $2.90 $2.25
HR&A Advisors, Inc. Comparative Return on Investment Study | 22

Figure 14: New Construction Market Rate Residential Product in Pentagon City, All Properties, 2001 to Present19
19 Source: Arlington Economic Development; Individual property and developer websites.
Pentagon Row The Metropolitan at Pentagon City
The Metropolitan at Pentagon Row
Gramercy at Metropolitan Park
The Millennium
Developer Federal Realty Investment Trust
Kettler Kettler Kettler Kettler
2013 Assessed Value
$3.0 billion $124.4 million $128.1 million $138.0 million $101.2 million
Completed 2001-2002 2002 2004 2007 2009
Units 500 321 326 399 300
Retail (SF) 300,000 0 0 11,200 7,800
Average Unit Size (SF)
1000 800 980 995 935
Average Monthly Rent ($/SF)
$2.85 $2.80 $2.50 $2.85 $3.00
HR&A Advisors, Inc. Comparative Return on Investment Study | 23

Affordable Housing
Within Arlington County, affordable housing takes the following forms:
Market-Rate Affordable Units (“MARKs”). The County defines MARKs as “lower-rent units in the
private market which receive no County assistance and for which owners have made no
commitment to retain as affordable in the future.” The County designates MARKs into two
categories: units that maintain rent levels affordable to households earning up to 60% of area
median income (“AMI”), and units that maintain rent levels affordable to households earning 60%
to 80% of area median income. MARKs make up 37% of all housing units in Arlington County.
MARKs up to 60% AMI make up 12% of all housing, and MARKs at 60% to 80% AMI make up
25% of all housing in Arlington County. MARKs are located largely in older, post-war garden,
medium-rise and high-rise apartment buildings.20 These buildings, while largely consisting of
MARKs, also contain some units which are affordable to households earning above 80% of AMI
and are not considered “affordable” by Arlington County.
Committed Affordable Units (“CAFs”). CAFs are units for which owners have committed to retain
as affordable for a certain period of time as a condition of gaining access to gap funding sources
such as low-cost loans from the Arlington Affordable Housing Investment Fund (“AHIF”) and tax
credit equity from programs such as the federal Low Income Housing Tax Credit (“LIHTC”)
program. CAFs are also produced by minimum affordability requirements as established by
Arlington County, and participation in the County’s density bonus program, which allows for
additional density through the provision of additional CAFs on- or off-site. CAFs make up 14% of
all housing units in Arlington County.21
Fairfax County also supports affordable housing. The Fairfax County Comprehensive Plan, as amended in
2013, recommends that 12% of new, incremental units resulting from new housing development be
reserved as affordable, and that any affordable units removed as a result of demolition be preserved in
the new development. These units are subject either to the Affordable Dwelling Unit (ADU) Program for
families with incomes of 70% of AMI or below, or to the Workforce Housing program for families with
incomes of 120% of AMI or below, depending on the area. In addition, Fairfax County adds additional
incentive to developers to provide Workforce Housing with bonus density: the County allows developers to
realize a bonus of up to one additional market rate unit for each supplied Workforce Housing unit, so long
as developers provide at least 12% affordable units under the Affordable Dwelling Units and/or
Workforce Housing Programs.22
Overall Single-Family Market Conditions
Within one-quarter mile of the proposed transit route, Columbia Pike contains nearly 2,400 single-family
attached and semi-attached units, including townhomes. About 60% of these homes—largely single-family
detached homes—were built prior to 1962, and approximately 100 new homes have been completed
since 2000, largely in the form of townhomes.
20 Source: Arlington County Affordable Housing Study, Interim Data Report. 21 Ibid. 22 Source: Fairfax County Comprehensive Plan, 2013.
HR&A Advisors, Inc. Comparative Return on Investment Study | 24

While there are single-family homes proximate to Pentagon City, none are located within a one-quarter
mile radius around the proposed transit route.
Baileys Crossroads contains 84 single-family homes,23 including 30 townhouses within the “Skyline Village”
development constructed in 1982.24
Figure 15: Single-Family Detached and Semi-Attached Existing Units
Existing Units Average Assessed Value
Columbia Pike 2,336 $406,000
Pentagon City 0 N/A
Baileys Crossroads 84 $420,000
Total 2,390
Source: Arlington County Department of Community Planning Housing and Development, Fairfax County Department of Neighborhood
and Community Services, HR&A Advisors, Inc. analysis
Commercial Real Estate Market
While there is new office product nearing completion, approved, or in predevelopment stages, the overall
reduction in the government-related workforce —both direct employment within federal agencies or
contract employment resulting from government procurement—has resulted in high vacancy rates, as high
as 24% in some submarkets, as is the case currently in Crystal City.25 Further, while Class A rental rates
have grown slightly—from $41.52 to $42.55 over the last two years County-wide26—landlords are
increasingly offering more in rent abatements and tenant improvements.
Still, new office product is in the pipeline in areas within and proximate to the Study Area, including:
Recent delivery of 524,605 square feet at 1812 N. Moore Street in Rosslyn;
Ongoing construction of Boeing Company’s 453,422 square foot regional headquarters in Crystal
City;
Planned construction of 426,900 square feet of space at 4040 Wilson Boulevard in Ballston;
Approval of 489,911 square feet of space at Pentagon Centre in Pentagon City; and
Approval of 1,809,000 square feet of space at PenPlace in Pentagon City.
Within the study area, Columbia Pike has approximately 236,000 square feet of office space in four
buildings. Most of this product was constructed during the 1960s and 1970s and consists of primarily Class
B and Class C properties with annual rents averaging $25.00 per square foot. Office tenants along
Columbia Pike consist primarily of medical-related uses and accountants, local law firms, and other
neighborhood-scale professional services.27 Siena Park—one of the newer residential buildings completed
in 2011 (see Figure 13), added approximately 15,000 square feet of office space to the market, and
tenants include two start-up tech companies—Mindseye Solutions and TechTrend—and a dental office.
23 Source: Fairfax County Department of Neighborhood and Community Services. 24 Source: Zillow. 25 Source: Cushman & Wakefield MarketBeat Office Snapshot, Northern Virginia, Q4 2013. 26 Source: CoStar. 27 Source: Arlington County Economic Development.
HR&A Advisors, Inc. Comparative Return on Investment Study | 25

The five office buildings in Pentagon City (including office space within the Pentagon City Mall) have low
vacancy rates:
Two of the buildings, Pentagon City One and Pentagon City Two, were constructed in 1982 and
currently house the Transportation Security Administration.
Lincoln Place complex consists of two buildings constructed in 1988, and houses the headquarters
of the Drug Enforcement Administration.
Washington Tower, located atop the Fashion Centre at Pentagon City, was constructed in 1989
and is currently only 10% vacant. Its tenants include government-serving professional services firms
like the RAND Corporation.
In Baileys Crossroads, Skyline has eight office buildings with a total of 2.6 million square feet of space.
These buildings were constructed between 1965 and 2001, are all Class A and B, and are all owned by
Vornado-Charles E. Smith. These office buildings have high vacancy rates, with an average of 34% of
space unoccupied (see Figure 16). There is approximately 500,000 square feet of other office space
within the Baileys Crossroads study area, largely located within older, low-rise office buildings and
garden-style office condominiums with local, neighborhood commercial tenants.
Figure 16: Office Market Conditions (All Properties) and Development Pipeline, Q3 2013
Total Inventory
(SF) Pipeline (SF) Avg. Asking Rent Vacancy
Columbia Pike 236,206 0 $25.00 5%
Pentagon City 1.2 million 2.3 million $41.00 1%
Baileys Crossroads 2.9 million 0 $33.00 34%
Source: Arlington County Department of Community Planning Housing and Development, Fairfax County Department of Neighborhood
and Community Services, CoStar, Jones Lang LaSalle, CBRE, Cushman & Wakefield, HR&A Advisors, Inc. analysis
Retail Market
Retail along Columbia Pike takes two forms: strip retail centers and ground-floor retail in newer residential
buildings. Rents in strip retail centers are in the $20 to $25 per square foot range, and developers HR&A
interviewed note that vacancy rates are low and the centers are “performing well.” Strip centers contain a
wide variety of tenants, including restaurants, liquor stores, check cashing stores, neighborhood-serving
doctors’ offices, and convenience stores. Rental rates for ground-floor retail in newer buildings range from
$28 to $32 per square foot, though developers note that these spaces are not performing as well because
some businesses are not achieving sufficient sales volume to support these higher rents. Tenants in these
spaces consist mainly of newer, local sit-down restaurants, some of which are second and third locations.
Within Pentagon City, retail is concentrated on the ground-floor in new construction mixed-used residential
and commercial buildings, and within The Fashion Centre at Pentagon City and Pentagon Centre.
Constructed in 1989 and 1994, respectively, these two developments contain the glut of retail product
within Pentagon City. The Fashion Centre at Pentagon City, a 1 million square foot regional mall, is
anchored by Macy’s and a Nordstrom, and houses smaller tenants consisting mainly of national chains.
Pentagon Centre, a single-floor, 340,000 square foot power center, primarily houses big box retailers,
including Nordstrom Rack, Costco, Best Buy, and Marshalls. Ground-floor retail consists mainly of national
chains, with some local business and local chains. For example, the 300,000 square foot retail component
HR&A Advisors, Inc. Comparative Return on Investment Study | 26

of Pentagon Row contains a Harris Teeter grocery store, an LA Fitness, and a Bed Bath and Beyond, as
well as smaller local retailers and restaurants such as Denim Bar (clothing) and Thaiphoon (Thai restaurant).
Retail in Baileys Crossroads consists mainly of strip retail and community/neighborhood shopping centers
along Jefferson Street and Leesburg Pike. Tenants include junior anchors such as DSW, Value City
Furniture, and Party Depot, big box stores such as Advance Auto Parts and Toys “R” Us, and smaller chain
retail outfits such as Starbucks and Einstein Bros Bagels. In addition, the Skyline Mall, located within Skyline
Center, was originally a 225,000 square foot property constructed in 1977 as an “unanchored, interior
mall [with] a number of national tenants”28 to serve the surrounding residential and office buildings. In
2002, Target Corporation purchased the entire property and transformed it into one of its retail stores.
Figure 17: Retail Market Conditions, Ground-Floor Mixed Use, Q3 2013†
Total Inventory (SF)
Columbia Pike 201,415
Pentagon City 321,219
Baileys Crossroads 0
†HR&A and the County anticipate that future retail development along the improved transit service route will likely take the form
of ground-floor retail within mixed-use buildings. For this reason, market conditions here reflect this type of retail only, excluding
any shopping centers or “big box” properties located within the Study Area.
Source: Arlington County Department of Community Planning Housing and Development, Fairfax County Department of Neighborhood
and Community Services, CoStar, HR&A Advisors, Inc. analysis
Total Assessed Value and Tax Revenue
The current inventory of land and improved property within Columbia Pike, Pentagon City, and Baileys
Crossroads had a total assessed value of approximately $7.8 billion in FY 2013. This property produced
approximately $78.2 million in property tax revenue to Arlington and Fairfax Counties. Chapter III of this
report assesses the comparative impacts of enhanced bus service and streetcar service on the value of
existing properties, the pace of new development, and resulting property tax revenue.
Figure 18: Total Assessed Value and Tax Revenue, FY 2013
Total Assessed Value Total Tax Revenue
Columbia Pike $3.6 billion $35.1 million
Pentagon City $2.9 billion $28.5 million
Baileys Crossroads $1.3 billion $14.6 million
Total $7.8 billion $78.2 million
Source: Arlington County Department of Community Planning Housing and Development, Fairfax County Department of Neighborhood
and Community Services, HR&A Advisors, Inc. analysis
28 Source: Kretikos, Eleni. “Skyline Mall- Discount retailer to displace tenants at aging center.” Washington Business Journal, Online edition. Sep 30, 2002. http://www.bizjournals.com/washington/stories/2002/09/30/story1.html?page=3.
HR&A Advisors, Inc. Comparative Return on Investment Study | 27
Key Implications
Within Pentagon City, Arlington County hopes to facilitate new residential and office developments in the
neighborhood's larger remaining infill parcels. The County envisions a dynamic, high-density, 24-hour
neighborhood with a diverse population of residents, employees, and visitors. Along Columbia Pike,
Arlington County envisions a compelling, accessible medium-density residential and retail corridor,
benefitting from significant transit investment. Within Baileys Crossroads, Fairfax County envisions a
restored urban center, connected to the Washington Metro via mass transit, along with high- and medium-
density scale mixed-use residential and office buildings, drawing residents and companies.
However, existing market conditions in the studied submarkets present some challenges for new
development. Within Columbia Pike, rents do not currently support the concrete construction required to
meet the density levels specified by the Draft Form Based Code. Residential and office development in
Pentagon City will face competition from a sizeable region-wide delivery of multifamily and office
product through late 2015. Moreover, the financial feasibility of new wood frame and concrete residential
development within the Fairfax County portion of the corridor is also uncertain.
While developers are delivering some new office product in Arlington with the goal of targeting private
sector tenants, the overall asset class is constrained by reduced demand from federal tenants. Columbia
Pike office product is largely small scale and older, and the Draft Form Based Code does not focus on
fostering additional product. While Pentagon City office buildings have high occupancy, the feasibility of
additional product will be conditional on future demand from federal tenants and related private
contractors. Skyline, in Baileys Crossroads, has high levels of vacancy, and the delivery of new product
also faces the same considerations.
Transit investment can be an important factor in facilitating new development because it creates new
connections and enhances existing connections, is new infrastructure that is attractive to development, and
can be paired with place-making efforts and amenities to draw residents and businesses to an area.
An additional consideration that may affect development in Pentagon City, Columbia Pike, and Baileys
Crossroads is the nascent competition posed by transit investments elsewhere in Northern Virginia. For
example, the completion of the Silver Line may enhance the market positioning of Tysons Corner, and the
completion of the Potomac Yards Metro may enhance the market positioning of Alexandria relative to the
three submarkets analyzed here.
Improved transit service in the Columbia Pike, Pentagon City, and Baileys Crossroads submarkets could
improve market dynamics and attract new investment. Specifically, it could increase real estate values and
accelerate the pace and extent of development along the corridor overall. These improvements in market
dynamics would facilitate Arlington County’s place-making goals for the corridor and enhance the
corridor‘s competitive position compared to other areas throughout the region. The next chapter focuses on
understanding the real estate market implications of introducing streetcar or enhanced bus service along
the transit corridor based on the experience of precedent systems elsewhere.
HR&A Advisors, Inc. Comparative Return on Investment Study | 28

III. Real Estate and Economic Development Impacts
of Transit
A key component of this comparative ROI study is assessing enhanced transit’s potential impact on real
estate value and development in the corridor. As part of this comparative assessment, HR&A conducted
two complementary, and data-driven, analyses of the real estate impacts of precedent transit system
elsewhere in the country:
1. Literature Review: A considerable body of literature exists examining the real estate impacts of
transit systems in the United States. Many of these studies have quantified the value premium or
change in the pace or quantity of development owing to transit service through rigorous research,
in many cases attempting to hold constant factors other than the transit investment that may
influence price. HR&A focused on studies analyzing the impacts of either streetcar or enhanced
bus. However, because a majority of relevant literature focuses on light rail or BRT, some studies
focusing on these additional modes were also reviewed. Taken as a whole this body of literature
provides a valuable repository of evidence on the range of development impacts that may occur
along the Columbia Pike transit corridor.
2. Case Studies: HR&A conducted in-depth case studies of four transit services (one streetcar, one
light rail, and two enhanced buses) selected due to having similar characteristics to the transit
service possible along Columbia Pike. These case studies complement the literature review with
more in-depth discussions of the specific ways in which the most comparable transit investments
have influenced real estate dynamics– including property values, the quantity and pace of
development, and quality of place-making.
The literature review included sixteen studies that evaluate real estate impacts owing to enhanced
bus/BRT, streetcar, and light rail systems. The findings of the literature review are summarized in Figure
19, where a “green up arrow” indicates positive findings, a “red down arrow” indicates negative findings,
a “yellow horizontal arrow” indicates inconclusive or inconsistent findings, and a blank space indicates the
study did not analyze the effect.
The four precedent four case studies evaluated by HR&A are described in Figure 20, including their real
estate development impacts and similarities and differences from the Columbia Pike transit corridor.
HR&A Advisors, Inc. Comparative Return on Investment Study | 29

Figure 19: Summary of Real Estate Impact Findings from 16 Precedent Studies
Study
Enhanced Bus / BRT Streetcar Light Rail
Strong Price
Premium
Development
Pace/Quantity
Increase
Strong Price
Premium
Development
Pace /Quantity
Increase
Strong Price
Premium
Development
Pace/Quantity
Increase
More Development for Your Transit Dollar
The New Real Estate Mantra: Location Near Public Transportation
Capturing the Value of Transit
Land Use Impacts of Bus Rapid Transit: Effects of BRT Station Proximity
on Property Values along the Pittsburgh Martin Luther King Jr. East
Busway
Land Use Impacts of Bus Rapid Transit: Effects of BRT Station Proximity
on Property Values along the Boston Silver Line Washington Street
Corridor
Capitalization of BRT Network Expansions Effects Into Prices of Non-
Expansion Areas
Value Capture and TIF Options for Streetcar Construction
Portland Streetcar Development Impacts
Transit Cooperative Research Program Synthesis 86: Relationships
between Streetcars and the Built Environment
The Impact of TOD on Housing Prices in San Diego
Charlotte Streetcar Economic Development Study
Land Value Impacts of Rail Transit Services in San Diego County
An Assessment of the DART LRT on Taxable Property Valuations and
Transit
Land Development at Selected Hudson-Bergen Light Rail Stations
The Impact of Hudson-Bergen Light Rail on Residential Property
Appreciation
The Hiawatha Line: Impacts on Land Use and Residential Housing Value
HR&A Advisors, Inc. Comparative Return on Investment Study | 30
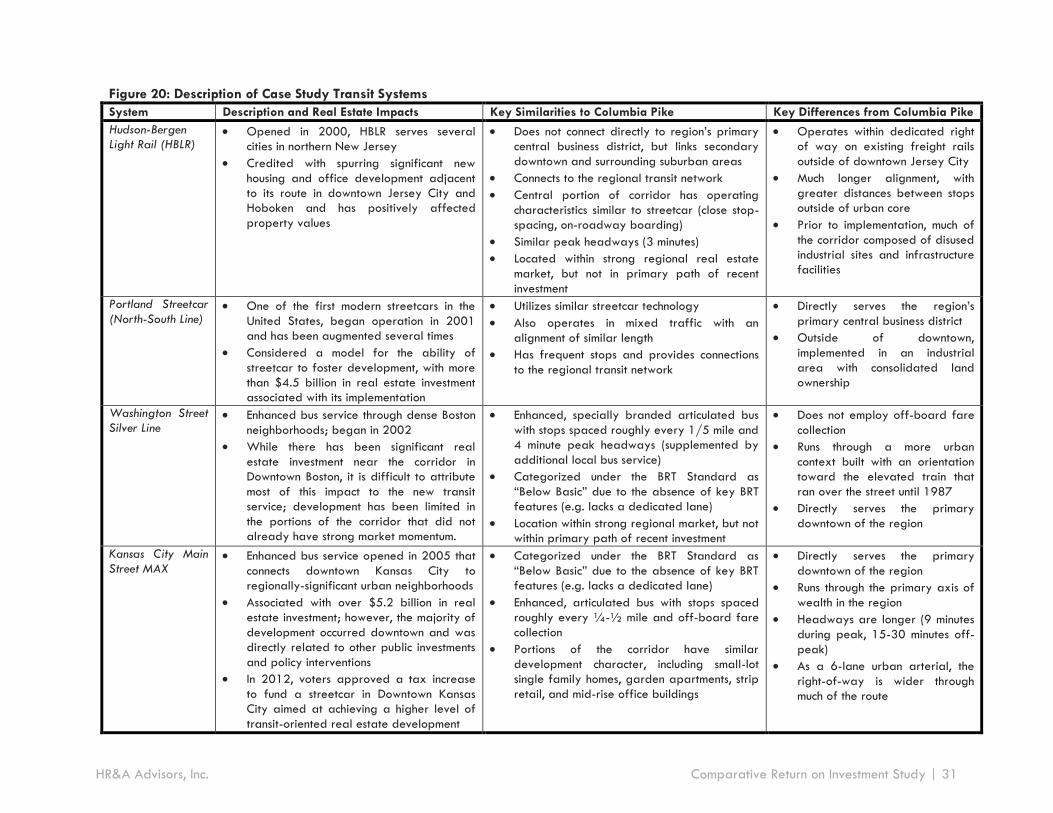
Figure 20: Description of Case Study Transit Systems
System Description and Real Estate Impacts Key Similarities to Columbia Pike Key Differences from Columbia Pike
Hudson-Bergen
Light Rail (HBLR)
Opened in 2000, HBLR serves several
cities in northern New Jersey
Credited with spurring significant new
housing and office development adjacent
to its route in downtown Jersey City and
Hoboken and has positively affected
property values
Does not connect directly to region’s primary
central business district, but links secondary
downtown and surrounding suburban areas
Connects to the regional transit network
Central portion of corridor has operating
characteristics similar to streetcar (close stop-
spacing, on-roadway boarding)
Similar peak headways (3 minutes)
Located within strong regional real estate
market, but not in primary path of recent
investment
Operates within dedicated right
of way on existing freight rails
outside of downtown Jersey City
Much longer alignment, with
greater distances between stops
outside of urban core
Prior to implementation, much of
the corridor composed of disused
industrial sites and infrastructure
facilities
Portland Streetcar
(North-South Line) One of the first modern streetcars in the
United States, began operation in 2001
and has been augmented several times
Considered a model for the ability of
streetcar to foster development, with more
than $4.5 billion in real estate investment
associated with its implementation
Utilizes similar streetcar technology
Also operates in mixed traffic with an
alignment of similar length
Has frequent stops and provides connections
to the regional transit network
Directly serves the region’s
primary central business district
Outside of downtown,
implemented in an industrial
area with consolidated land
ownership
Washington Street
Silver Line Enhanced bus service through dense Boston
neighborhoods; began in 2002
While there has been significant real
estate investment near the corridor in
Downtown Boston, it is difficult to attribute
most of this impact to the new transit
service; development has been limited in
the portions of the corridor that did not
already have strong market momentum.
Enhanced, specially branded articulated bus
with stops spaced roughly every 1/5 mile and
4 minute peak headways (supplemented by
additional local bus service)
Categorized under the BRT Standard as
“Below Basic” due to the absence of key BRT
features (e.g. lacks a dedicated lane)
Location within strong regional market, but not
within primary path of recent investment
Does not employ off-board fare
collection
Runs through a more urban
context built with an orientation
toward the elevated train that
ran over the street until 1987
Directly serves the primary
downtown of the region
Kansas City Main
Street MAX Enhanced bus service opened in 2005 that
connects downtown Kansas City to
regionally-significant urban neighborhoods
Associated with over $5.2 billion in real
estate investment; however, the majority of
development occurred downtown and was
directly related to other public investments
and policy interventions
In 2012, voters approved a tax increase
to fund a streetcar in Downtown Kansas
City aimed at achieving a higher level of
transit-oriented real estate development
Categorized under the BRT Standard as
“Below Basic” due to the absence of key BRT
features (e.g. lacks a dedicated lane)
Enhanced, articulated bus with stops spaced
roughly every ¼-½ mile and off-board fare
collection
Portions of the corridor have similar
development character, including small-lot
single family homes, garden apartments, strip
retail, and mid-rise office buildings
Directly serves the primary
downtown of the region
Runs through the primary axis of
wealth in the region
Headways are longer (9 minutes
during peak, 15-30 minutes off-
peak)
As a 6-lane urban arterial, the
right-of-way is wider through
much of the route
HR&A Advisors, Inc. Comparative Return on Investment Study | 31

Quantity of Development
Streetcars and comparable fixed guideway systems in the United States have, with few exceptions,
facilitated more significant impacts in terms of value and volume of new real estate development than
enhanced bus services. Market conditions, timing, existing physical conditions, and policy context all play
critical roles in determining the success of transit in facilitating economic development. However, over a
broad range of conditions, previous experience indicates that streetcars are more consistently associated
with transformational real estate impacts than enhanced bus. Streetcar has been strongly associated with
an increase in real estate investment adjacent to the alignments, both in absolute terms and in terms of the
share of new development in a wider area that transit-adjacent locations captured. In contrast, while there
are some instances of development catalyzed by bus investments, these development impacts are
inconsistent across systems and are generally associated with more complete bus infrastructure than is
possible on Columbia Pike.
This national evidence corroborates past surveys conducted in the region. A 2005 study of potential
streetcar lines in the District of Columbia included a survey of developers active in the region. In that study,
“the respondents were close to unanimous in preference for Streetcar over BRT” because “it is seen as a
fixed investment with distinctive features” Respondents “were unanimous with regard to the positive
influence that premium transit would have on residential development in certain corridors that were not
already built-out,” indicating that “premium transit was viewed as a differentiator in the District real estate
market as improved access is always important to commercial tenants and residents.”29 Given that
Columbia Pike is centrally located in a strong regional real estate market, is centrally located and
Arlington County has been proactive in adopting policies to encourage transit-oriented development, it is
likely the Columbia Pike corridor would experience strong impacts from a streetcar system. The following
examples from the literature review and case studies illustrate potential impacts:
Evidence from Literature Review:
A 2005 study of development impacts of the Portland Streetcar provides strong evidence
that streetcar and complementary land-use policies had a pronounced impact on the pace
and scale of development in the streetcar corridor. Prior to the announcement of the
streetcar in 1997, buildings within one block of the corridor utilized approximately 34 percent
of allowable FAR; development that occurred after the decision to implement the streetcar
utilized an average of 90 percent of allowable FAR. Moreover, the blocks directly adjacent to
the streetcar alignment contained 19 percent of the total building square footage in
downtown Portland prior to 1997; after 1997, these blocks captured 55 percent of new
development.30
Of the 12 BRT and bus lines studied in an Institute for Transportation and Development
Policy report, only two were categorized as having “strong” TOD impacts. In contrast,
both of the streetcars systems profiled in that report (the Portland Streetcar and the South
Lake Union Streetcar in Seattle) achieved “strong” TOD Impacts.31 This study estimated both
the total TOD investment in these transit corridors and expressed TOD investment as a return
29 Source: District of Columbia Transit Improvements Alternatives Analysis. DMJM Harris Planning, 2005. 30 Source: Jordan and Hovee. Portland Streetcar Development Impacts. ED Hovee and Company, 2005. 31 Source: Hook, Lotshaw, and Weinstock. More Development for your Transit Dollar: An Analysis of 21 North American Transit Corridors. Institute for Transportation Development and Transportation Policy.
HR&A Advisors, Inc. Comparative Return on Investment Study | 32
on investment (ROI) ratio of development leveraged to the capital cost of constructing the
transit service.
o Despite costing more per mile to construct compared with forms of BRT and enhanced bus
systems, these two streetcars leveraged more development per dollar invested than
sixteen of the nineteen other transit lines studied. The Portland Streetcar was associated
with $4.5 billion ($41.48 ROI) and the South Lake Union Streetcar was associated with $3
billion ($53.57 ROI)32 worth of TOD investment. In contrast, of the 12 bus and BRT lines
profiled, three had such “nominal” impacts that their value was not calculated; the
remaining nine generated an average TOD investment of $1.9 billion ($32.36 ROI). This
aggregated total is driven by successful cases, such as the Cleveland Health Line and the
Las Vegas SDX (for which development on the Vegas Strip was questionably attributed to
BRT).
o This report also concluded that the strongest factors influencing transit-oriented
development are favorable local government policy followed by existing strength of the
local real estate market, both factors that are present in Arlington County for the
Columbia Pike transit corridor.
Evidence from Case Studies:
In Portland, Jersey City, and Hoboken, the implementation of streetcar (and streetcar-like)
transit has been associated with dramatic transformation of neighborhoods through new,
high-density and high-quality development. In Portland, large swathes of disused industrial
parcels in the Pearl District and South Waterfront were converted to transit-oriented housing,
offices, and retail. Jersey City and Hoboken underwent a similar transformation following the
implementation of the Hudson-Bergen Light Rail (HBLR). In its first seven years of operation,
the HBLR was associated with the development of more than 10,000 new housing units ($5.3
billion) at only five of its stations; since that study, another 5,000 units and 4.5 million square
feet of commercial space have been developed or are under construction at a single 28-acre
site that is served by two HBLR stations.33
By establishing Jersey City and Hoboken as core transit centers (instead of merely the
“ends” of connections from Manhattan), HBLR supported their development as the premier
high-density employment, entertainment, and residential districts in the sub-region. On
the Columbia Pike corridor, similar impacts would likely be felt strongly at and near Pentagon
City, where the streetcar would link with Metro and the Crystal City Streetcar and contribute
to ongoing place-making and development initiatives.
In Boston, the implementation of the Silver Line did not have a significant impact on
development in the Washington St. corridor outside of downtown. The $650 million in new
investment attributed to the Silver Line by an Institute for Transportation & Development Policy
(ITDP) report, places the Silver Line in the lower half of the 21 transit corridors surveyed, and
32 Return on investment (“ROI”) is a measure used to judge the performance of an investment, comparing its financial benefit generated to its cost. Here, ROI analysis is employed to compare the value of new development to the cost of the investment in new transit. A higher ROI suggest a more cost-effective investment, although it does not imply greater net benefits when comparing investments of different initial amounts. 33 Source: Robins and Wells. Land Development at Selected Hudson-Bergen Light Rail Stations. Alan M. Voorhees Transportation Center, Edward J. Bloustein School of Planning and Public Policy, Rutgers University, 2008.
HR&A Advisors, Inc. Comparative Return on Investment Study | 33
is difficult to attribute to the Silver Line according to the report’s authors.34 Other literature
notes that the majority of the investment that did occur was in the Downtown portion of the line
already well-served by subway.35
In Kansas City, enhanced bus was associated with a significant amount of new
development, but this development did not occur in greater quantity adjacent to the
alignment than it did several blocks away. The vast majority of this occurred in the
downtown, where the City actively incentivized development (though tax-increment financing
and direct investment). Despite the high-performing enhanced bus service, Kansas City plans to
implement a streetcar to generate transit-oriented development. In the first 11 months
following the announcement of the downtown streetcar, 33 new projects were proposed, under
construction, or completed within one ¼ of the planned alignment.
Value Appreciation
Streetcar systems have generally conferred more significant value premiums to surrounding parcels
than BRT or enhanced bus. Researchers have illustrated this impact through two types of studies: (1)
assessments of comparative value appreciation (how much do properties accessible to transit appreciate
relative to comparable, less transit-accessible properties?) and (2) assessments of nominal relative value
(controlling for all other variables, how much does transit enhance real estate values?). While specific
results vary across studies and depend on a variety of factors, given the Columbia Pike’s central location
within a strong regional market, the premium conferred by streetcar and by enhanced bus would likely fall
within the range of results demonstrated elsewhere. As a BRT system is not feasible along Columbia Pike,
the mixed evidence of value premiums associated with enhanced bus systems is more instructive for
Arlington County than the stronger evidence associated with more complete BRT systems.
The survey conducted for the 2012 Columbia Pike Transit Initiative Return on Investment Study confirmed this
expectation. While the survey reflected a wide variety of perspectives, including both a segment of
respondents who expected premiums greater than 25 percent and a segment who believed there would
be no property impact at all, the plurality of respondents expected a property premium between 4 and
14 percent.
Due to its higher speeds, dedicated right-of-way, and wider stop-spacing, light rail is distinct from the
enhanced bus or streetcar transit that is possible on the Columbia Pike corridor. However, because the
visibility of light rail infrastructure can play a similar role in place-making as streetcar, and because a
wealth of research studies the impacts of light rail, it is included here.
Evidence from Literature Review- Comparative Growth Rates:
New streetcar lines are more consistently associated with property value appreciation
than enhanced bus.
o A Brookings Institute report found dramatic increases in property values associated
with modern streetcars.36
34 Source: Hook, Lotshaw, and Weinstock. More Development for your Transit Dollar: An Analysis of 21 North American Transit Corridors. Institute for Transportation Development and Transportation Policy. 35 Source: Schimek, Darido, and Schneck. “Boston Silver Line Washington Street Bus Rapid Transit (BRT) Demonstration Project Evaluation.” Federal Transit Administration, 2005.
HR&A Advisors, Inc. Comparative Return on Investment Study | 34

From 2003-2008, parcels with buildings along the Seattle South Lake Union
Streetcar (which began service in 2007) experienced increases in assessed value
of 50 percent for multi-family properties, 85 percent for mixed-use, 58 percent
for office, and 61 percent for retail. These differences in appreciation were
greater for each property type than were experienced for properties in Seattle
as a whole, ranging from 3 percent greater for multi-family to 35 percent
greater for mixed-use parcels.
From 1997-2008, along the Portland Streetcar line (which began service in 2001)
north of the CBD, single-family homes increased in value by 182 percent,
multifamily homes increased by 205 percent, and assessments on commercial
properties grew by 231 percent. The differences in appreciation outpaced those
for the city as a whole by 46 percent, 87 percent, and 101 percent, respectively.
In Tampa, which has a heritage rather than modern streetcar, the impacts of the
streetcar varied greatly by neighborhood. From 2002 (when the streetcar
opened) and 2008, property values in the Channelside District (an industrial area
directly adjacent to downtown) increased by a median of 313 percent. In Ybor
City (a more historic former industrial area where redevelopment substantially
predated the streetcar), property values increased by a median of 71 percent.
Unlike the modern streetcars with a stronger transportation purpose, however,
these rates of appreciation did not keep pace with prices elsewhere in
Hillsborough County.
o In a study of the Hudson Bergen Light Rail, property value appreciation was especially
pronounced at peripheral stations. At the time of study, West Side Avenue (Jersey City)
and 22nd Street (Bayonne) were stations at the ends of the lines, where the time-savings
associated with light rail service (relative to driving) were the greatest. At those stations,
single family home prices grew at an annual rate of 17-20 percent greater than those in
comparison areas between 1991 and 2009. The magnitude of the premium declined with
distance from the stations and was undetectable at one quarter mile.37
o In contrast, an analogous study of the Washington Street Silver Line enhanced bus
service found property value impacts to be much less significant.38
From 2000-2009, condominium prices near the Washington Street Silver Line
corridor overall grew at a slower rate (52 percent) than those in the City of
Boston as a whole (54 percent).
Prior to the start of service, condos adjacent to the corridor were sold for 22
percent less per square foot than those 0.18 miles away. Following
implementation, the researchers found the opposite relationship, with condos
directly adjacent to Washington St. selling for 7.6 percent more, per square foot,
than those located 0.16 miles away.
36 Source: Value Capture and Tax-Increment Financing Options for Streetcar Construction. Brookings Institution, HDR, Reconnecting
America, RCLCO, 2009. 37 Source: Kim and Michael Lahr. The Impact of Hudson-Bergen Light Rail on Residential Property Appreciation. Papers in Regional Science, 2013 38 Source: Perk and Catala. Land Use Impacts of Bus Rapid Transit: Effects of BRT Station Proximity on Property Values along the Pittsburgh Martin Luther King, Jr. East Busway. National Bus Rapid Transit Institute, Center for Urban Transportation Research, University of South Florida, 2009.
HR&A Advisors, Inc. Comparative Return on Investment Study | 35

The implementation of the Silver Line coincided with streetscape
improvements on Washington Street, which may help explain why value
premiums were limited to properties within 1-2 blocks of the corridor.
While enhanced bus service had a positive impact on property values adjacent to
the line relative to others in the immediate vicinity, it did not increase the value of
the corridor relative to the region.
o A report from the Center for Neighborhood Technology found that property values in
transit accessible locations proved more resilient than overall property values in their
regions during the great recession (2006-2011). One of the five regions they profiled
offers a service similar to streetcar (San Francisco) and another includes an enhanced bus
(Boston).39
In San Francisco, while the average transit adjacent property out-performed the
region by 37.2 percent, properties adjacent to MUNI lines (which include
streetcar, light rail, and cable car services) retained their values at a 61.6 percent
greater rate than the region.
In Boston, BRT-served locations performed on par with the average for transit-
served locations, (roughly 130 percent better than the region). However, this
included both the Washington Street branch (similar to TSM 2) and the
Airport/Waterfront branch, which features true BRT elements including a
dedicated tunnel. Housing values in areas served by rapid-transit (subway and
light rail) out-performed the region by 226.7 percent.
Evidence from Literature Review- Nominal Values:
While the impact of streetcar on nominal value premiums has not been widely studied
studies on light rail and BRT indicate light rail generally confers greater value premiums
than does bus.
o Along the Martin Luther King, Jr. East Busway in Pittsburgh, Pittsburgh, BRT’s impact
on property value was shown to be greatest within 100 feet from a station and to
decline with distance. The study finds an effect equivalent to an 11% premium over the
mean value of homes in the study area, with property 100 feet from a station area
valued $9,745 more than property 1,000 feet from a station. The magnitude of value
premium declines with distance from the station until it is fully extinguished at 1,000 feet.40
Pittsburgh’s BRT line includes a fully separated right of way and wide stop spacing; an
enhanced bus such as the one proposed for Columbia Pike would likely have a lesser
impact.
o A 2008 literature review conducted by the Center for Transit-Oriented Development
found light rail had significant impacts on values and rents for different real estate
uses:41
Single Family Homes: 2% - 32%
Apartment Rents: 0% - 45%
39 Source: Becker, Bernstein, and Young. The New Real Estate Mantra: Location Near Public Transportation. The Center for
Neighborhood Technology, 2013. 40 Source: Perk and Catala. Land Use Impacts of Bus Rapid Transit: Effects of BRT Station Proximity on Property Values along the Pittsburgh Martin Luther King, Jr. East Busway, 2009. 41 Source: Fogarty, et al. Capturing the Value of Transit. The Center for Transit Oriented Development, 2008.
HR&A Advisors, Inc. Comparative Return on Investment Study | 36

Office: 10% - 120%
Retail: 30% - 167%
Referencing research by Robert Cervero, the authors note three factors
that are often significant in determining the value premiums generated by
transit: healthy economic and real estate conditions, supportive public
policy, and traffic congestion.42
o The Columbia Pike corridor is poised to benefit from these
conditions. In addition to the already noted favorable market
conditions and public policy environment, increasing traffic
congestion in the Washington region will likely enhance the value
of transit accessibility over time.
In Minneapolis, researchers found value premiums for both single-family and
multifamily properties in station areas of the Hiawatha Line Light Rail.
Single-family homes in station areas command an approximately 3
percent price premium over the median sales price in the market area
(equivalent to $5,229 price premium).
Multifamily properties in station areas command an approximately 9
percent price premium over the median sales price in the market area
(equivalent to a $15,755 price premium).43
In San Diego, proximity to light rail was associated with significant value
premiums for both condominiums (2–6 percent) and multifamily housing (4–
17 percent). This was not consistently true of value premiums for single family
homes (-4–1 percent) or commercial properties (-9–72 percent).44
Place-Making and Streetscape
Transit has the potential to not only increase the value and quantity of real estate development, but
also alter its form by promoting compact development and walkability. Recent research from the
George Washington University School of Business has found that walkability is a critical neighborhood
amenity in the DC region; areas identified as “WalkUP’s” because they are walkable command significant
premiums over non-walkable places (as high as 75 percent for office and 71 percent for for-sale housing)
and also are attracting an increasing share of the region’s development. While Pentagon City and Bailey’s
Crossroads are considered “WalkUP’s,” Columbia Pike itself is not.45
To the extent that transit is recognized as a visible, valuable place-making amenity that provides
uniqueness to the surrounding area, new development will be oriented toward it. This orientation may
be in the form of pedestrian-oriented design (engaging, varied ground floors that abut the sidewalks),
pedestrian amenities (such as trees, sidewalks, and benches), or clustering of new development at transit
nodes. On Columbia Pike, an enhanced sense of place and creating a walkable neighborhood are goals in
their own right. Because of its visibility and ability to integrate into neighborhoods, distinctiveness,
42 Source: Cervero et. al. Transit Cooperative Research Program Report 102: Transit-Oriented Development in the United States: Experiences, Challenges, and Prospects. Transportation Research Board of the National Academies, 2004. 43 Source: Goetz, et al., ibid. 44 Source: Cervero and Duncan. Land Value Impacts of Rail Transit Services in San Diego County, 2002. 45 Source: Leinberger. DC: The WalkUP Wake-Up Call: The Nation’s Capital as a National Model for Walkable Urban Places, 2013.
HR&A Advisors, Inc. Comparative Return on Investment Study | 37

and perceived permanence, streetcar has greater potential to advance place-making goals for
Columbia Pike than enhanced bus.
Evidence from Literature Review:
A study of properties near the San Diego Trolley (light rail) found that a good quality
pedestrian environment in combination with location in a San Diego Trolley (light rail)
station area conferred a significant value premium for condo prices. There was no value
premium for station areas with an “average” pedestrian environment. These findings provide
strong evidence that place-making is a critical element of value creation relating to transit.46
o In areas with a good pedestrian environment, the condo value premium for being in a
station area exceeded 15 percent (a $20,000 premium). Conversely, in areas with a
poor quality pedestrian environment there was a penalty to station area proximity, with
value discounts approaching 11 percent (a $15,000 discount).
Evidence from Case Studies:
Both the Portland Streetcar and Hudson-Bergen Light Rail catalyzed a dramatic remaking
of urban places. In both Jersey City and Portland, the introduction of transit was associated
with the remaking of streetscapes in a consciously pedestrian-scaled, transit-oriented manner.
This was realized through development designed to take advantage of the visibility and
accessibility enhancements brought by transit, as well as through the installation of pedestrian
infrastructure, tree plantings, and ground-floor retail. These buildings and streetscape
improvements interact to establish and reinforce a sense of place. The causes and effects of
these factors are multi-directional. For instance, in Portland, the implementation of a streetcar
raised the development potential such that private developers were willing to invest in major
parks and public improvements to support their real estate investments. As new development,
residents, and workers were drawn to the area, financial and political will became more
focused on expanding these amenities, which in turn helped generate more land value and
development. However, the premium placed on the transit by developers, policymakers,
businesses, and residents was a necessary element to catalyze this virtuous cycle.
In contrast, major investments in streetscape improvements along Washington Street associated
with the efforts of non-profit organizations did not catalyze a transit-orientation of a
significant amount of new real estate. In Kansas City, the greatest place-making investments
were in the Power and Light District, a mega-project that is adjacent to, but not oriented
toward, the Main Street MAX.
Network Effects
As transit networks expand, accessibility benefits accrue not only to newly-served areas, but also to
already-served transit corridors. While less studied than the above factors, the value of such “network
effects” is a critical impact of transit. A study of the TransMilenio BRT system in Bogota found that asking
46 Source: Duncan. The Impact of Transit-oriented Development on Housing Prices in San Diego, CA, 2010.
HR&A Advisors, Inc. Comparative Return on Investment Study | 38

prices increased by 13-14 percent in areas already served by BRT due to network expansion, (compared
to a control area that was not affected by the expansion).47
For properties near the Columbia Pike transit corridor, it is likely that a seamless connection with the
planned Crystal City Streetcar would confer a value premium over-and-above that associated with the
initial provision of transit service. Enhancing the accessibility of an important employment center like
Crystal City would increase demand for land on the transit corridor, enhancing property values and
encouraging development. A corresponding impact on property values and development is likely in Crystal
City due to the seamless connection with the transit service on Columbia Pike. While some network effect
would likely exist for either a streetcar or enhanced bus service along Columbia Pike, the network effect
would be greatly enhanced if the two lines function as components of a single network. Because streetcar
service is planned for Crystal City, the implementation of a streetcar on Columbia Pike would best
facilitate connectivity. This is further evidenced by the transportation model’s ridership projections that
indicate the streetcar would initially attract 35 percent more riders than the enhanced bus service.
Other Key Findings
Role of Transportation Characteristics
Each of the case studies underscores that the ability of transit investments to catalyze new
development is not purely a function of their transportation performance characteristics. For instance,
the transit-derived accessibility benefits of the Main Street MAX were profound in Kansas City, but did
not lead to significant new transit-oriented development; conversely, the Portland Streetcar, where
operating speeds matched those of the buses it replaced, induced a greater transit-orientation of new
development. Evidence suggests that streetcar offers greater catalytic development potential for Columbia
Pike, even as compared to an enhanced bus service with comparable travel speeds and frequencies.
Existing Conditions and Development Context
The presence of underutilized parcels was a strong factor determining the amount of TOD in all case
studies. In the case studies, these were most often in the form of vacant and industrial properties; on
Columbia Pike low-intensity buildings and surface parking lots represent the best opportunity for large-
scale redevelopment. However, because these uses are active and cash-flowing, landowners may be less
willing to engage in redevelopment. Thus, these properties may face a greater hurdle to redevelopment
than many of those found in these case studies. Having greater potential to increase land value, streetcar
is better suited than enhanced bus to help clear this barrier.
The Portland Streetcar illustrates that the ability for transit to induce new development depends
greatly on the level of buy-in from the development community. Unless developers believe the transit
investment will enhance land value in an area and are willing to act on it, the investment won’t catalyze
significant new redevelopment. In the case of Portland, this buy-in came from developers focusing on
transit-oriented development, who acquired parcels from existing property owners; the same may be true
for Columbia Pike.
47 Source: Rodriguez and Mojica. Capitalization of BRT Network Expansions Effects Into Prices of Non-Expansion Areas, 2009.
HR&A Advisors, Inc. Comparative Return on Investment Study | 39
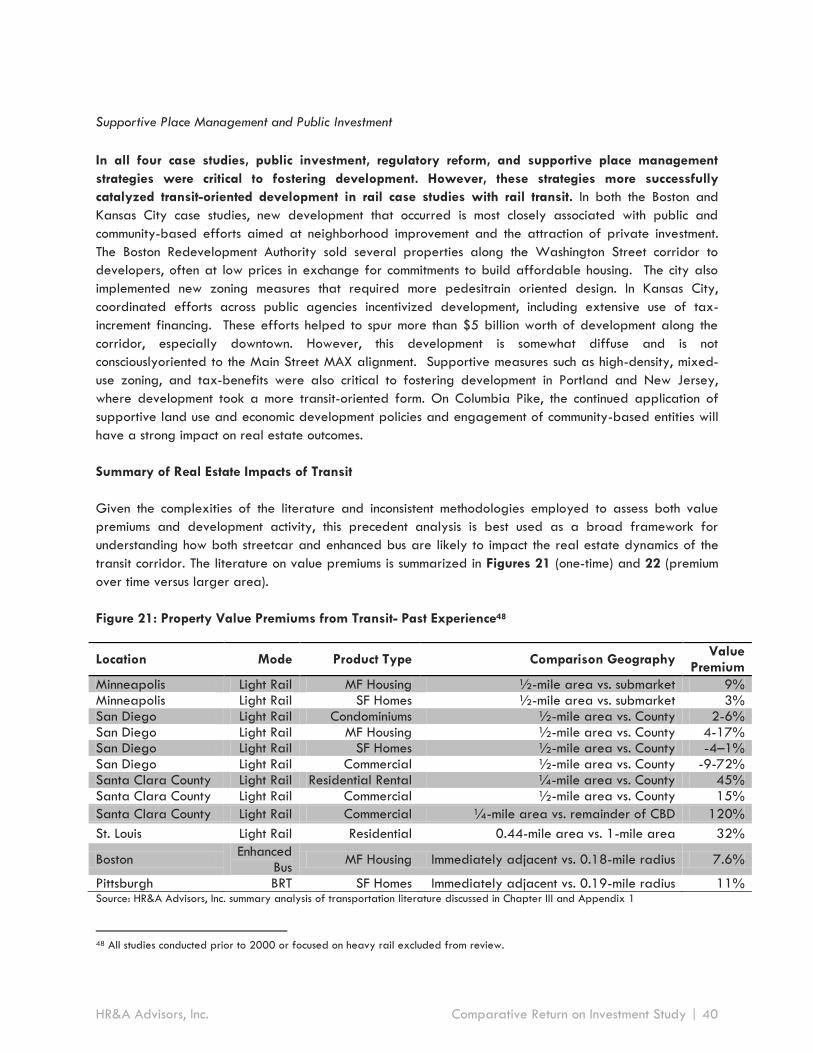
Supportive Place Management and Public Investment
In all four case studies, public investment, regulatory reform, and supportive place management
strategies were critical to fostering development. However, these strategies more successfully
catalyzed transit-oriented development in rail case studies with rail transit. In both the Boston and
Kansas City case studies, new development that occurred is most closely associated with public and
community-based efforts aimed at neighborhood improvement and the attraction of private investment.
The Boston Redevelopment Authority sold several properties along the Washington Street corridor to
developers, often at low prices in exchange for commitments to build affordable housing. The city also
implemented new zoning measures that required more pedesitrain oriented design. In Kansas City,
coordinated efforts across public agencies incentivized development, including extensive use of tax-
increment financing. These efforts helped to spur more than $5 billion worth of development along the
corridor, especially downtown. However, this development is somewhat diffuse and is not
consciouslyoriented to the Main Street MAX alignment. Supportive measures such as high-density, mixed-
use zoning, and tax-benefits were also critical to fostering development in Portland and New Jersey,
where development took a more transit-oriented form. On Columbia Pike, the continued application of
supportive land use and economic development policies and engagement of community-based entities will
have a strong impact on real estate outcomes.
Summary of Real Estate Impacts of Transit
Given the complexities of the literature and inconsistent methodologies employed to assess both value
premiums and development activity, this precedent analysis is best used as a broad framework for
understanding how both streetcar and enhanced bus are likely to impact the real estate dynamics of the
transit corridor. The literature on value premiums is summarized in Figures 21 (one-time) and 22 (premium
over time versus larger area).
Figure 21: Property Value Premiums from Transit- Past Experience48
Source: HR&A Advisors, Inc. summary analysis of transportation literature discussed in Chapter III and Appendix 1
48 All studies conducted prior to 2000 or focused on heavy rail excluded from review.
Location Mode Product Type Comparison Geography Value
Premium
Minneapolis Light Rail MF Housing ½-mile area vs. submarket 9% Minneapolis Light Rail SF Homes ½-mile area vs. submarket 3% San Diego Light Rail Condominiums ½-mile area vs. County 2-6% San Diego Light Rail MF Housing ½-mile area vs. County 4-17% San Diego Light Rail SF Homes ½-mile area vs. County -4–1% San Diego Light Rail Commercial ½-mile area vs. County -9-72% Santa Clara County Light Rail Residential Rental ¼-mile area vs. County 45% Santa Clara County Light Rail Commercial ½-mile area vs. County 15%
Santa Clara County Light Rail Commercial ¼-mile area vs. remainder of CBD 120%
St. Louis Light Rail Residential 0.44-mile area vs. 1-mile area 32%
Boston Enhanced
Bus MF Housing Immediately adjacent vs. 0.18-mile radius 7.6%
Pittsburgh BRT SF Homes Immediately adjacent vs. 0.19-mile radius 11%
HR&A Advisors, Inc. Comparative Return on Investment Study | 40

Figure 22 illustrates previous examples of transit can catalyzing further differential value appreciation
over time.
Figure 22: Summary of Property Value Growth Rates in Transit Corridors
Location Mode Product
Type Comparison Geography
Annualized Differential
Growth Rate
Time Period (years)
End-Year Value
Premium
Portland Streetcar MF Housing 3 block area to City 3.1% 11 40% Portland Streetcar Office 3 block area to City 3.4% 11 44% Seattle Streetcar MF Housing 3 block area to City 4.2% 5 23% Seattle Streetcar Retail 3 block area to City 1.9% 5 10% Boston Enhanced Bus MF Housing ¼ mile area to City -0.4% 9 -4% Source: HR&A Advisors, Inc. analysis of transportation literature discussed in Chapter III and Appendix 1
The preponderance of evidence suggests that streetcar and similar rail-based forms of transit have
catalyzed larger impacts on the value of surrounding land uses than enhanced bus or true bus-rapid transit
(BRT). Studies undertaken since 2000 consistently show rail-based transit, including both light rail and
streetcar, has a strongly positive impact on multifamily property values. While rail’s impact on commercial
values and single-family homes has been somewhat less consistent, it has also generally been positive. In
contrast, while enhanced bus and BRT do appear to have a positive impact, it is far less robust and
widespread. While studies of Boston and Pittsburgh found premiums of 8-11%, these were only for
properties immediately adjacent to the alignment compared to properties 0.2 miles away, not relative to
the rest of the cities; in these studies, the impact dissipated quickly with distance from the alignment.
Moreover, the literature review contained consistent evidence of the premium associated with streetcar
growing over time; for instance, streetcar-accessible properties attained up to a 44 percent value premium
over other properties in the City after 11 years in Portland. A study of the Washington Street Silver Line in
Boston found that multifamily properties within ¼ mile of the line did not appreciate as quickly as
elsewhere in the City over a nine year period following project initiation.
HR&A therefore expects that streetcar service will have a more significant impact on real estate dynamics
along the Columbia Pike corridor than enhanced bus service. HR&A also conducted interviews with
developers to ascertain their opinions on the relative impacts of streetcar versus enhanced bus transit. In
Chapter V of this report, the findings from these interviews are integrated with the key findings of this
literature review and case study analysis to project the economic impact of both enhanced bus service and
streetcar service along the Columbia Pike transit corridor.
HR&A Advisors, Inc. Comparative Return on Investment Study | 41

IV. Developer and Retailer Interview Findings
Overview of Process
In the course of this analysis, HR&A conducted interviews with ten (10) developers and property owners.
These interviews focused on gathering informed opinions from local real estate experts regarding how
streetcar and enhanced bus would affect the value of existing real estate, the pace, quantity, and value of
future development, and factors that may differentiate the two services, such as branding and place-
making.
HR&A worked with staff from Arlington County to recruit participants for these interviews, with HR&A
initially selecting candidates for outreach from the list of developers and property owners to which
AECOM fielded their online developer survey when conducting the 2012 Columbia Pike Transit Initiative
Return on Investment Study. We purposely selected a diverse array of participants for outreach, with the
key selection criteria being:
(1) Having undertaken recent development activity in Arlington County; and/or
(2) Having holdings along Columbia Pike, in Pentagon City, or in the vicinity of Skyline.
We invited fifteen developers and property owners from this list to participate in interviews; HR&A
interviewed the ten who accepted our invitation.
HR&A also conducted interviews with six (6) retailers. These interviews focused on identifying how the
presence of either a streetcar or enhanced bus service would benefit their businesses and affect their
future business decisions.
HR&A worked with staff from Arlington County to recruit retailers for these interviews, with HR&A selecting
candidates for outreach from an initial list of local retailers provided by Arlington County. Key criteria in
the selection process where:
(1) Current location(s) on the Columbia Pike, in Pentagon City, or in the vicinity of Skyline; or
(2) Current location(s) elsewhere in Arlington or Fairfax County with potential for future expansion.
We invited ten retailers from this list to participate in interviews; HR&A interviewed the six who accepted
our invitation.
HR&A employed a standard list of questions to structure all interviews, which form Appendix 3 of this
report. The interviews offered HR&A opinions from local market experts against which to assess the data-
driven findings discussed in Chapters II and III.
Key Findings
Most developers and land owners noted that a streetcar system would confer greater advantages to
area real estate dynamics than an enhanced bus system. Interviewees cited various reasons including the
greater amenity value of a streetcar over an enhanced bus, and that a streetcar would appeal more to
HR&A Advisors, Inc. Comparative Return on Investment Study | 42
riders due to its perception as being cleaner and more efficient, and providing a higher quality of service
than an enhanced bus. These interviewees opined that a streetcar would therefore enhance the marketing
potential of and demand for new residential and office product along the corridor, and enable greater
growth in rents, property values, and supportable density overall. These dynamics would increase the
feasibility and appeal of developing along the corridor for both area developers and current property
owners.
A smaller number believed that a streetcar would not have a greater overall impact on real estate
dynamics than an enhanced bus system, and that it may be unlikely for either investment to be
impactful. Some interviewees opined that both systems would impact the corridor equally, noting that the
enhanced bus system could ride, feel, and look very similar to the proposed streetcar. Others opined that
neither system would have any impact, particularly along Columbia Pike, explaining that only a “Metro-
level” investment might pique the interest of owners who largely enjoy high rates of occupancy and debt-
free cash flow. Others noted that the fragmented ownership within commercial nodes would present
another barrier to redevelopment, which neither investment would be likely to overcome.
Almost all interviewees noted that the network benefits of connecting to the planned Crystal City
Streetcar would amplify the potential real estate impacts of streetcar. Interviewees largely opined that
the potential for seamless connection between two streetcar systems would be more important than a
connection between an enhanced bus and a streetcar system. In addition, one interviewee noted that the
network benefits would be felt particularly in Baileys Crossroads, which currently does not enjoy a mass
transit connection to key destinations throughout the Metro region.
Most retailers noted that they would be more likely to consider expanding along the corridor with
investment in a streetcar versus an enhanced bus system. Retailers both off and on the corridor cited
various reasons why a streetcar would support the corridor retail environment better, including ease of use,
and a streetcar’s greater potential to contribute to the identity of the corridor, which in turn drives the
corridor’s potential as a retail destination. Most retailers located outside the corridor noted that the
streetcar presents distinct advantages to branding, placemaking, and wayfinding, and that the streetcar
would be more likely to draw new residents and visitors to shop along Columbia Pike. Retailers currently
on the corridor also noted that these advantages would be heightened with streetcar over enhanced bus,
and that their existing businesses would greatly benefit. Some retailers also noted that the proposed
streetcar was an express reason for their decision to locate on the corridor.
Developer Interview Findings
Overall Impact on Real Estate Dynamics
Six (6) of the ten interviewees opined that a streetcar system would likely have a greater impact on real
estate dynamics throughout the corridor than an enhanced bus system. They opined that the streetcar
would have a greater impact on rents, property values, development pace, and/or total density along the
corridor.
Three (3) interviewees opined both systems would likely have equal impact on real estate dynamics
throughout the corridor, believing that both systems would equally impact rents, property values,
development pace, and/or total density.
HR&A Advisors, Inc. Comparative Return on Investment Study | 43

One interviewee opined that it was unlikely that either system would have an impact on real estate
dynamics throughout the corridor.
Rent or Value Premium Impacts
Five (5) interviewees opined that a streetcar would drive greater rent and/or value premiums than an
enhanced bus. Of these, two (2) opined that an enhanced bus would not impact rents at all. One suggested
a rent premium of 5% to 10% over baseline. Three (3) opined that rents along Columbia Pike and in
Baileys Crossroads would continue to trail behind rents along the Rosslyn-Ballston Corridor regardless of
investment. Three (3) of these interviewees also opined that the corridor would experience a value
premium as a result of the system being installed, tested, and operational, not from anticipation of the
system. Another interviewee opined that the increase in value could result in a change in office tenure,
resulting in more owner-occupied property.
Four (4) interviewees opined that either streetcar or enhanced bus would impact rent and/or value
equally, suggesting, collectively, a 4% to 10% premium. These interviewees also opined that rents along
Columbia Pike and in Baileys Crossroads would continue to trail behind rents along the Rosslyn-Ballston
Corridor. Two (2) interviewees opined, however, that both systems would impact rent for new properties
only, not existing properties. One interviewee opined that both would bring a newer, higher paying
demographic to the corridor, particularly on the Columbia Pike.
One interviewee opined that neither option would impact rents or value along the corridor.
Submarket Impacts
Among interviewees who opined that a streetcar would have a greater impact, most interviewees
addressed the relative impacts between the two systems on different submarkets along the corridor. One
interviewee specifically opined that the presence of a streetcar will accelerate preleasing of new
residential and office space currently under review or approved in Pentagon City. One interviewee
specifically opined that a streetcar would greatly benefit Baileys Crossroads, and Skyline Center in
particular, as the location currently lacks a mass transit connection. Four (4) interviewees opined that a
streetcar would have greater impact on Columbia Pike than an enhanced bus system, with one citing the
greater amenity value of a streetcar in marketing new apartments, and one noting that the Pike already
has momentum, and that the streetcar would continue to support it. One interviewee also noted that, as a
result of increases in rent and value, the streetcar would be more likely to result in interest from new area
developers in developing along Columbia Pike, though they warned that the Pike faces particular
challenges due to fragmented ownership.
Development Pace and Density Impacts
Four (4) interviewees opined that a streetcar would have a greater impact on development pace and/or
total density along the corridor than an enhanced bus system. One noted that a streetcar would be more
likely to interest developers in assembling land from what is currently fragmented ownership along some
areas of Columbia Pike. One offered the caveat that the increased in development activity may only occur
initially, and sustaining that pace would depend on the success of first-movers.
HR&A Advisors, Inc. Comparative Return on Investment Study | 44
Three (3) interviewees opined that both systems would have equal impacts on development pace and/or
total density along the corridor, with one noting that both systems may result in a three-year acceleration
in the amount of time before rents increases to the point where revenue would support higher cost
construction and therefore more density.
Three (3) interviewees did not think either system would have an impact on development pace and/or total
density along the corridor.
Branding and Placemaking Impacts
Four (4) of the interviewees opined that a streetcar has better branding and placemaking potential than
an enhanced bus. One explained that this is due to impressions that a streetcar is more fun and efficient.
This interviewee also opined that a streetcar’s brand advantage is due to its role as both a neighborhood
amenity—similar to schools, libraries, and nightlife—and a property amenity similar to pools and fitness
centers. This interviewee also believed that a streetcar would positively affect residential absorption up to
10% greater than an enhanced bus because it would help market new residential rental product. One of
the interviewees opined that a streetcar would provide significant improvements to wayfinding due to
nature of the higher expectations of a fixed-rail system. Another interviewee opined further that a
streetcar would provide greater transformative effects to neighborhoods which are further away from
existing Metro connections. In particular, a streetcar would have a greater impact on transforming the area
around Skyline Center at Leesburg Pike into a more pedestrian-friendly neighborhood. Finally, one of
these interviewees opined that there are ways to brand a bus system to look modern, and that the
proposed enhanced bus system is moving in that direction. However, they note that, regardless, a streetcar
still drives rent and demand to a greater extent, and contributes more to a neighborhood’s brand and
identity.
Four (4) of the interviewees opined that a streetcar would not provide any branding or placemaking
advantages over an enhanced bus. Three (3) of these believed that a streetcar would not provide
improvements to wayfinding over an enhanced bus, with one interviewee clarifying that the enhanced bus
system would need to be designed to have the same wayfinding advantages as a streetcar. One
explained that both an enhanced bus service and a streetcar could bring the same number of new
residents, workers, and visitors to the corridor if the County were to invest in very high quality buses that
were modern, well branded, and similar in look and feel to streetcars. This interviewee also noted that the
improved branding and placemaking would increase the appeal of new property and would affect
absorption rates equally between the two systems.
Two (2) of the interviewees did not directly comment.
Network Benefits
Eight (8) interviewees opined that an improved connection between the Columbia Pike transit corridor and
the planned Crystal City Streetcar would be critical to the success of either system because it would
facilitate access to a regionally significant employment center. Seven (7) of these interviewees opined that
a seamless ride across both corridors presents a distinct benefit. This implies that a one-seat streetcar ride
HR&A Advisors, Inc. Comparative Return on Investment Study | 45

would provide more benefits to real estate along the Columbia Pike than an enhanced bus-to-streetcar
connection that required a transfer.
One interviewee opined that there would be no benefit to connecting either system to the Crystal City
streetcar, and one interviewee did not directly comment.
Impact on Parking Demand
Five (5) interviewees opined that neither system would reduce parking demand. One interviewee
specifically noted that demographic changes drive changes in parking demand, not investments in transit.
Two (2) interviewees opined that the presence of a streetcar would reduce demand for parking more than
an enhanced bus would, as individuals would be more likely to take transit in the form of a streetcar. One
opined that the Counties would need to reduce parking minimums, and one opined that Arlington County
already reduced the parking minimum for the proposed PenPlace development in Pentagon City in
anticipation of a streetcar. These interviewees noted that reductions to parking requirements would
enhance the feasibility of new development even at existing rent levels by reducing construction costs.
One interviewee opined that both systems would reduce parking demand equally.
Two (2) interviewees did not directly comment about the impact on parking demand.
Retailer Interview Findings
General Corridor Outlook
Amongst retailers currently located on the corridor, interviewees largely noted that anticipation of the
streetcar was extremely influential in their decisions to locate on the corridor. However, one retailer noted
with concern that the corridor currently lacks a brand, and because development has occurred in pockets,
has not created enough synergy amongst retail locations to generate sufficient sales volume. Another
retailer opined that, without the streetcar, newer businesses along the corridor may struggle.
Amongst retailers not currently located on the corridor, interviewees commented noted that, overall, the
Columbia Pike had good potential and was ripe for development and was becoming more vibrant and
interesting. Some opined that development beyond Glebe Road may take more time, but that the Pike is
ripe for retail otherwise. Some expressed surprise that development has not occurred at a faster pace.
Branding and Placemaking Impacts
Five (5) retailers opined that a streetcar had an advantage to both branding and placemaking over an
enhanced bus. One opined that retailers would expect greater capacity and use of a streetcar, and two
opined that a streetcar is more effective at enhancing walkable environments. Retailers without locations
along the corridor noted that they would be more likely to locate along the corridor should a streetcar be
installed. Retailers that currently have locations along the corridor anticipate that the overall brand of the
corridor would be greatly enhanced by a streetcar, and note that this brand enhancement is critically
important to the success of their businesses. Four (4) of these retailers also opined that a streetcar would
HR&A Advisors, Inc. Comparative Return on Investment Study | 46

provide significant improvements to wayfinding and would be more successful at drawing new customers
who do not typically use transit to retail destinations than an enhanced bus.
One off-corridor retailer opined that transit investments are important for retail success, but are not as
important as demographics and spending potential. Therefore, this retailer notes that, while there would
be a benefit to branding and placemaking that results from investment in transit, there would be no
difference between the two systems. This retailer also did not see any distinct wayfinding advantages
between the two systems.
Construction Impact
Five (5) retailers opined that the construction disruption caused by installing an enhanced bus system would
be less severe than the construction disruption caused by installing a streetcar system. However, among
these, four (4) retailers—largely but not all located on the corridor—opined that the short-term
construction impacts of a streetcar system would be outweighed by the long-term benefits. One retailer not
located on the corridor opined that the short-term construction impacts of a streetcar system would not be
outweighed by the long-term benefits.
One retailer did not comment directly.
Sales Volume Impact
Two (2) retailers opined that a streetcar would have a greater positive impact on sales volume than an
enhanced bus. They note that the branding, placemaking, and wayfinding advantages resulting from a
streetcar over an enhanced bus system would directly drive increases in sales volume for businesses
currently located on the corridor.
One retailer opined that neither system would have a greater impact on sales volume over the other.
Three (3) retailers did not comment directly.
HR&A Advisors, Inc. Comparative Return on Investment Study | 47

V. Economic Impacts of Columbia Pike Transit
Initiative
New transit investment along the Columbia Pike transit corridor will affect the current real estate dynamics
of the Columbia Pike, Pentagon City, and Baileys Crossroads submarkets. The data-driven summary of our
literature review and case studies in Chapter III provides a national perspective on the experience of other
markets with new transit investments, demonstrating that streetcar service generally confers a greater
impact in terms of generating property value increases and enhancing development quantity and pace.
The findings from the collective opinions expressed in HR&A’s interviews with real estate developers
described in Chapter IV suggest that the permanence of streetcar infrastructure and its brand value would
enable it to have a greater impact on real estate dynamics along the Columbia Pike corridor than an
enhanced bus service. In this chapter we draw on these data and local opinions to evaluate the material
differences between each transit service and how these differences are manifest in influencing real estate
values. These assumptions underpin the economic model developed to assess the comparative return on
investment of these two modes.
The extent to which an investment in transit along the Columbia Pike corridor will generate real estate and
economic developments benefits depends on two specific characteristics:
The transit service will improve mobility for residents, workers, and business traveling to, from, or
within the corridor. Through its connection to the Metro at Pentagon City in particular, higher
quality transit service better links the corridor to the regional markets for jobs, labor, and
customers. This enhances quality of life for residents and facilitates commerce, enhancing real
estate demand for space the corridor.
The transit service will serve as a place-making amenity that improves the public realm of the
corridor. This enhances quality of life and positions the corridor to capture a greater share of real
estate demand in the region.
The specific differences between streetcar and enhanced bus service as they relate to each of these
effects are described below.
Mobility
The differences between the enhanced bus service and streetcar as they relate to mobility value are
summarized in Figure 23.
HR&A Advisors, Inc. Comparative Return on Investment Study | 48

Figure 23: Mobility Effects of Transit Service
TSM 2 Streetcar
Quality of rider
experience
Branded buses offer opportunity for
improved rider experience
Smoother, quieter experience than
existing and enhanced bus
Connections
Existing bus system connections
available; Metro connection at
Pentagon City
One seat ride through Crystal City
available in addition to existing bus
system connections; Metro connection
at Pentagon City
Enhancement of existing
transit service
Offers lesser improvement in
breadth of transit service in corridor
Offers greater improvement in
breadth of transit service in corridor
by introducing new mode
Travel time along
corridor 23 minutes 22 minutes
Vehicle capacity 94 riders 155 riders
2035 network volume to capacity ratio
1.19 (Indicates overcapacity) 0.91 (Indicates under capacity)
Source: HR&A Advisors, Inc. analysis; Columbia Pike Transit Initiative: Alternatives Analysis/Environmental Assessment; Arlington
County
The ultimate measure of the extent to which each mode enhances mobility in the corridor is the number of
riders that choose to take advantage of the service. The most recent ridership projections furnished by
AECOM indicate more users will choose to take advantage of the streetcar service than the enhanced bus,
with 13,800 riders projected to ride the streetcar daily initially versus 11,800 riders projected to ride the
enhanced bus.49 Assuming a connection to the planned Crystal City Streetcar, the initial ridership difference
widens to 15,900 daily riders for streetcar versus 11,800 for enhanced bus, meaning that streetcar is
estimated to attract 35 percent more riders than enhanced bus when the transportation modeling
accounts for modal preference and network connectivity. Moreover, in two decades the Columbia Pike
transit network (including the new transit investment as well as local buses) is projected to be overcapacity
under the enhanced bus alternative, but not overcapacity under the streetcar alternative. It is clear that the
streetcar service would have a greater impact on mobility along the Columbia Pike transit corridor.
Amenity
The differences between the enhanced bus service and streetcar as they relate to amenity value are
summarized in Figure 24.
49 As noted previously, per Federal Transit Administration guidelines, “existing conditions” forecasts were for the year 2015,
rather than the actual anticipated opening year of 2019. In 2019, the ridership would likely be somewhat higher for both modes due to population and employment growth along the corridor.
HR&A Advisors, Inc. Comparative Return on Investment Study | 49

Figure 24: Amenity Effects of Transit Service
TSM 2 Streetcar
Place-Making Function Vehicle, station infrastructure, and
signage serve place-making function
Vehicle, tracks, wires, station
infrastructure, signage serve place-
making function
Branding /
Differentiation Effects
Less unique positioning offers less
branding value to differentiate corridor
Unique modern positioning has
psychological cachet and
corresponding branding value
Permanence of
Physical Infrastructure
Stations provide impression of
permanence
Vehicles, stations, tracks, and wires
provide impression of permanence
Impact on Corridor
Congestion
Smaller vehicle capacity (94) limits
ability to reduce congestion
Larger vehicle capacity (155)
improves ability to reduce congestion
Source: HR&A Advisors, Inc. analysis; Columbia Pike Transit Initiative: Alternatives Analysis/Environmental Assessment; Arlington
County
As described in Chapter III and Chapter IV, streetcar service is expected to have greater place-making
impacts along the corridor because it offers more seamless integration with the built environment, more
permanent infrastructure, and a greater opportunity to uniquely position the corridor within the region.
Impact on Real Estate Demand and Supply Dynamics
While both the streetcar service and enhanced bus service are projected to focus regional demand along
the Columbia Pike corridor, streetcar is expected to enhance demand to a greater degree.
Residential users will appreciate the enhanced mobility benefits of streetcar over enhanced
bus, including the opportunity for a one-seat ride to Crystal City. Moreover, the higher quality
public realm catalyzed by streetcar service would make Pentagon City, Columbia Pike, and
Baileys Crossroads more attractive neighborhoods within which to live.
Office users will be more inclined to locate on the corridor because the streetcar will meet
GSA standards for proximity to rail transit, while enhanced bus will not. Moreover, the
streetcar will enhance the ability of office users to attract employees who prefer using rail
over bus transit.
Retail users will be more inclined to locate on the corridor because the streetcar system, which
is projected to attract more riders, will generate more foot traffic. Additionally, the more
transit and pedestrian-oriented development forms and public realm encouraged by streetcar
will create a more pleasant shopping and dining experience for potential customers.
As the demand for various product types increases, and property values appreciate, the development
community will respond by introducing new supply. The principal reasons new transit investment generates
new supply include:
Increased demand enables developers to achieve higher pricing for their real estate products,
which enhances the feasibility of undertaking infill development and redeveloping existing
parcels.
Since streetcar is a more permanent infrastructure investment than enhanced bus, it is a stronger
signal to the long term viability of a location for developers and lenders.
HR&A Advisors, Inc. Comparative Return on Investment Study | 50

The greater mobility benefits of streetcar reduce demand for parking, which provides a rationale
for reducing parking requirements where they are overly restrictive; the need to provide less
parking can reduce construction costs and enhance the financial feasibility of undertaking infill
development or redeveloping existing properties.
Overview of Economic Model
Analyzing the comparative impacts of streetcar service versus enhanced bus requires developing
assumptions for the magnitude of each service’s impact on property values, development quantity, and
development pace. These assumptions were based primarily on the findings of the literature and case
studies reviewed in Chapter III. They were further refined through the filter of the local conditions analysis
in Chapter II, the outcomes of the developer interviews in Chapter IV, and through conceptual pro-forma
analyses conducted to determine the point in time that various construction types will become financially
feasible in each location along the corridor.
HR&A constructed a 30-year economic model evaluating the real estate value generated by transit
investment, which reflects the net economic benefit to Arlington and Fairfax Counties. Increases in the
amenity value of locations proximate to transit, including the quality of the public realm, local
environmental benefits, place-making features, and neighborhood connectivity, are assumed to be
capitalized into the values of surrounding real estate.
In this model, economic benefits are compared against the one-time costs of construction and ongoing
maintenance and operations to determine the net benefits of the project, or “return on investment”. For
both the enhanced bus service and streetcar, project benefits are calculated as the net benefit of each
over and above projected baseline conditions. All project benefits and costs are presented assuming a
real discount rate of 3 percent and 7 percent.50 Project costs are presented in Figure 25 below.
Figure 25: Project Costs – Capital Investment and Ongoing Operations & Maintenance Expense51
Cost Year Incurred Baseline TSM 2 Streetcar
Capital
Investment
Half in 2017;
Half in 2018 $0 $67,000,000 $284,000,000
Ongoing
Operations and
Maintenance
Each year
2015-2044 $15,700,000 $21,200,000 $24,500,000
Source: Columbia Pike Transit Initiative: Alternatives Analysis/Environmental Assessment; Arlington County; Project Management
Oversight Contractor (PMOC) Report
50 These “discount rates” reflect that money has greater value in the present than in the future, i.e. the “time value of money” because immediate returns are preferable to future returns. Three percent and seven percent are the values utilized in Federal Transit Administration grant applications (e.g. TIGER Grant applications) and illustrate the different time-values of money under reasonable discount rates. 51 TSM 2 and Streetcar scenarios assume that operation and maintenance costs would be equal to those of the baseline scenario
until each new transit service is implemented in year 2019. All costs are in $2014. See Chapter I for a detailed explanation of capital costs. The PMOC Report estimated the capital cost of the streetcar as $310 million in $2017, equivalent to $284 million in $2014. The capital cost of TSM 2, including elements not identified in the AA/EA report, is estimated to be $47 million in $2011, equivalent to $52 million in $2014. Arlington County identified $15 million in additional costs above the original estimate that would be incurred in implementing TSM 2.
HR&A Advisors, Inc. Comparative Return on Investment Study | 51
Value Premiums
As discussed in Chapter III, the literature examining the property value premium of transit investments
includes studies of both nominal property value premiums and comparative studies of differential
appreciation over time. In reality, these two effects are not separate, but two facets of a dynamic process.
At some point after the investment is recognized as highly likely (e.g. announcement of funding award;
ground breaking), a one-time premium is realized over unaffected property values. Later, as homebuyers,
renters, employers, and customers appreciate the mobility and amenity benefits of transit, an increasing
share of regional demand is attracted to the new transit corridor; property owners respond to this by
raising prices and rents. The literature demonstrates that this dynamic results in the price appreciation of
transit-accessible properties at a disproportionately high rate relative to the region. As developers
anticipate and respond to this rise in demand by increasing supply and investing in public realm
enhancements, the quality of place become more established and these growth rates are further
reinforced.
Our literature review and analysis of data from previous studies (see Figures 19, 21 and 22), suggests
that there is substantially more evidence from other North American transit systems that streetcar in
particular and light rail in general has a more consistent, positive and amplified impact on both
surrounding real estate values and development activity than do BRT or other forms of enhanced bus
systems. The literature review provided consistent evidence of the premium associated with modern
streetcar growing over time for multiple classes of uses, including multifamily, single-family, office, and
retail.
Specifically, for multifamily housing, value premiums in Portland, Seattle, Northern New Jersey, and
Minneapolis ranged from 9 percent to 40 percent in areas between a few blocks and ½ mile from transit
corridors versus comparable properties in the submarket. Enhanced bus systems in Boston and Pittsburgh
had value premiums of 8 percent to 11 percent in areas directly adjacent to transit stops. However, when
evaluated at a ¼ mile radius, as HR&A does for Columbia Pike, the evidence suggests that bus systems’
impact on real estate value is broadly neutral.
The range of value premiums found in the literature review directionally aligns with the opinions of
developers expressed during the interviews described in Chapter IV. Of the ten developers HR&A
interviewed, half believed that streetcar would generate greater rent premiums than enhanced bus and
three expected that enhanced bus would generate no premium at all. None believed enhanced bus would
generate a greater premium than streetcar. Interviewees that did expect a premium believed it would be
in the range of 4 to 10 percent for both modes. These ranges broadly adhere with the survey results of the
2012 Columbia Pike Transit Initiative Return on Investment Study, echo the opinions depicted in the 2005
District of Columbia Transit Improvements Alternatives Analysis, and are generally conservative for streetcar
in context of the overall findings of the case studies and literature review.
Given the precedents described above and the results of the developer surveys, HR&A developed
relatively conservation projections of the impacts enhanced bus service and streetcar service would have
on Columbia Pike. The model includes the assumption that, for residential and office products, streetcar-
accessible properties would have a 6 percent premium over the baseline condition at implementation,
which would grow to a 10 percent premium 10 years after implementation. Because the results for retail
are less consistent, HR&A estimates that streetcar-accessible retail properties would have a 4 percent
HR&A Advisors, Inc. Comparative Return on Investment Study | 52

premium over the baseline condition at implementation, which would grow to a 7 percent premium 10
years after implementation.
Based on the results of the literature review and case studies, the fact that a seamless one-seat connection
to the Crystal City Streetcar is not possible for enhanced bus, and grounded through the expectations of
the development community on Columbia Pike, HR&A estimates that TSM 2 will induce lower real estate
premiums. Specifically, the value premium associated with TSM 2 over the full ¼ mile area around the
Columbia Pike transit corridor will likely be lower than that observed in Boston or Pittsburgh. HR&A
estimates that TSM 2 would induce residential and office real estate value premiums of 2 percent at
implementation, growing to 4 percent 10 years after implementation. Given the inconsistent findings
related to impacts of transit on retail values, and lack of evidence of bus transit’s impact on retail
properties in particular, HR&A estimates that TSM 2 would confer a 1 percent value premium on retail
properties at implementation, growing to 2 percent 10 years after implementation.
Figure 26 illustrates the overall premiums that are expected for each real estate product type, depending
on the enhanced transit mode that is implemented, in terms of the expected initial value premium and
value premium at Year 10 over and above assumed price appreciation in a baseline, no-build scenario.
Figure 26: HR&A Estimated Property Value Premiums Initial and 10-Years after Transit Implementation
(over No-Build Scenario)
TSM 2 Streetcar
Residential Retail Office Residential Retail Office
Initial Premium
2% 1% 2% 6% 4% 6%
10-Year Premium
4% 2% 4% 10% 7% 10%
Source: HR&A Advisors, Inc. assumptions
The capitalization of transit value over time is a dynamic process, and these 10-year property value
premiums represent an intermediate point in time. The transit premiums will continue to grow larger in the
years that follow as the mobility and amenity benefits from transit further differentiate the transit corridor
in the regional real estate market through a virtuous cycle.
Three sets of interacting assumptions for each mode and property type were developed based on HR&A’s
analysis of precedent data and incorporated into HR&A’s economic model:
1) An initial premium for properties on the corridor that results from the initiation of construction (year
2017);
2) A further initial premium for properties on the corridor in the streetcar scenario due to the network
benefits demonstrating through transportation modeling (year 2017);
3) An expected differential growth rate of property values on the corridor over the baseline
property appreciation rate throughout the region.52
52 The projected baseline growth rate of 1.5% was estimated by adjusting the Federal Housing Finance Agency’s housing price index for the DC region from 1993 to 2013 to eliminate inflation (based on the consumer price index), and then applying this real appreciation rate to the data in this study.
HR&A Advisors, Inc. Comparative Return on Investment Study | 53
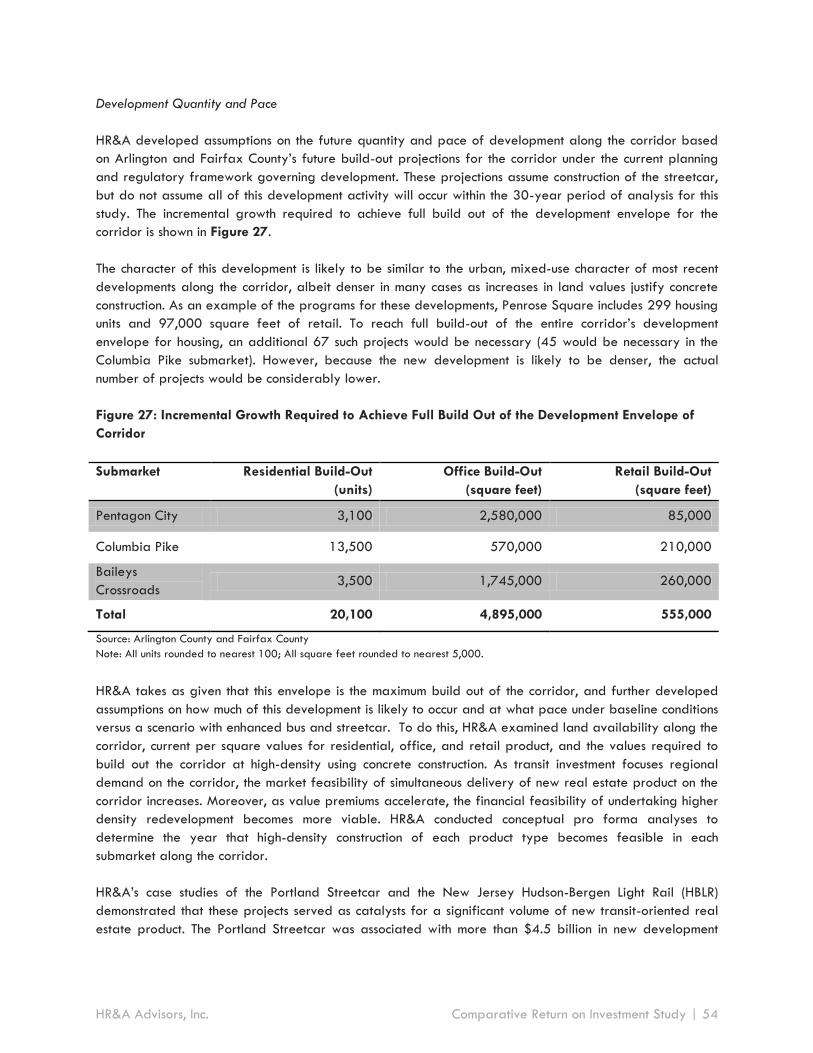
Development Quantity and Pace
HR&A developed assumptions on the future quantity and pace of development along the corridor based
on Arlington and Fairfax County’s future build-out projections for the corridor under the current planning
and regulatory framework governing development. These projections assume construction of the streetcar,
but do not assume all of this development activity will occur within the 30-year period of analysis for this
study. The incremental growth required to achieve full build out of the development envelope for the
corridor is shown in Figure 27.
The character of this development is likely to be similar to the urban, mixed-use character of most recent
developments along the corridor, albeit denser in many cases as increases in land values justify concrete
construction. As an example of the programs for these developments, Penrose Square includes 299 housing
units and 97,000 square feet of retail. To reach full build-out of the entire corridor’s development
envelope for housing, an additional 67 such projects would be necessary (45 would be necessary in the
Columbia Pike submarket). However, because the new development is likely to be denser, the actual
number of projects would be considerably lower.
Figure 27: Incremental Growth Required to Achieve Full Build Out of the Development Envelope of
Corridor
Submarket Residential Build-Out
(units)
Office Build-Out
(square feet)
Retail Build-Out
(square feet)
Pentagon City 3,100 2,580,000 85,000
Columbia Pike 13,500 570,000 210,000
Baileys
Crossroads 3,500 1,745,000 260,000
Total 20,100 4,895,000 555,000
Source: Arlington County and Fairfax County
Note: All units rounded to nearest 100; All square feet rounded to nearest 5,000.
HR&A takes as given that this envelope is the maximum build out of the corridor, and further developed
assumptions on how much of this development is likely to occur and at what pace under baseline conditions
versus a scenario with enhanced bus and streetcar. To do this, HR&A examined land availability along the
corridor, current per square values for residential, office, and retail product, and the values required to
build out the corridor at high-density using concrete construction. As transit investment focuses regional
demand on the corridor, the market feasibility of simultaneous delivery of new real estate product on the
corridor increases. Moreover, as value premiums accelerate, the financial feasibility of undertaking higher
density redevelopment becomes more viable. HR&A conducted conceptual pro forma analyses to
determine the year that high-density construction of each product type becomes feasible in each
submarket along the corridor.
HR&A’s case studies of the Portland Streetcar and the New Jersey Hudson-Bergen Light Rail (HBLR)
demonstrated that these projects served as catalysts for a significant volume of new transit-oriented real
estate product. The Portland Streetcar was associated with more than $4.5 billion in new development
HR&A Advisors, Inc. Comparative Return on Investment Study | 54

along its route. In its first seven years of operation, the HBLR was associated with the development of
more than 10,000 new housing units ($5.3 billion) at only five of its stations; since that study occurred,
another 5,000 units and 4.5 million square feet of commercial space have been developed or are under
construction at a single 28-acre site that is served by two HBLR stations.53 In Portland in particular,
developers utilized significantly more of the allowable FAR on properties adjacent to the alignment after
the streetcar was built than before. Prior to the announcement of the streetcar in 1997, buildings within one
block of the corridor utilized approximately 34 percent of allowable FAR; development that occurred
after the decision to implement the streetcar utilized an average of 90 percent of allowable FAR. These
considerations guided HR&A in developing the following estimates in Figure 28 for the amount of
incremental corridor build-out that will be achieved under each level of transit investment.
Figure 28: Estimated Incremental Development under Each Transit System within 30-Years
Submarket
Percent of Remaining
Build-Out Achieved
Under Baseline
Percent of Remaining
Build-Out Achieved
Under TSM 2
Percent of Remaining
Build-Out Achieved
Under Streetcar
Pentagon City 100% 100% 100%
Columbia Pike 60% 65% 80%
Baileys Crossroads 25% 35% 50%
Total 58% 64% 75%
Source: HR&A Advisors, Inc. assumptions
HR&A estimates that current values in Pentagon City support concrete construction, which is borne out by
recent mixed-use development in the submarket. We assume that under any scenario of transit investment,
Pentagon City will be fully built out over the next thirty years. However, transit investment will make a
bigger difference in development outcomes along Columbia Pike and Baileys Crossroads, where current
values do not support the concrete construction necessary for higher density infill development and
redevelopment. We project these submarkets will achieve a greater share of their maximum build out
under streetcar than enhanced bus or baseline transit conditions projected for the corridor.
These assumptions produce the total net development outcome described in Figure 29.
Figure 29: Total Net 30-Year Real Estate Delivery
Total New
Development
Baseline TSM 2 Streetcar
Residential (units) 11,400 12,600 15,400
Retail (square feet) 260,000 300,000 370,000
Office (square feet) 3,410,000 3,610,000 3,970,000
Source: HR&A Advisors, Inc. analysis
53 Source: Robins and Wells. Land Development at Selected Hudson-Bergen Light Rail Stations. Alan M. Voorhees Transportation Center, Edward J. Bloustein School of Planning and Public Policy, Rutgers University, 2008.
HR&A Advisors, Inc. Comparative Return on Investment Study | 55

In addition to affecting the total quantity of development over the next 30 years, HR&A also estimates
that the pace of this development will be different under each transit mode. This owes primarily to the
greater value appreciation achieved with new transit investment, which accelerates the timeframe for when
higher density development becomes viable in each submarket. For instance, although we anticipate
Pentagon City will be fully built out in the next 30 years under any transit mode, we expect the pace of
this build out to be quicker under enhanced bus than the baseline condition, and quicker still under
streetcar than enhanced bus. HR&A assumptions regarding the pace of development activity under each
mode are presented in Figure 30.
Figure 30: Development Pace
Annual Portion of Total
Development
Baseline TSM 2 Streetcar
Years 1-10 2% 3% 5%
Years 11-20 3% 3% 3%
Years 21-30 5% 4% 2%
Source: HR&A Advisors, Inc. assumptions
Key Findings from the HR&A Economic Model: Comparative Analysis of Streetcar versus Enhanced
Bus
Net Incremental Benefits to Arlington and Fairfax County
Over 30 years, HR&A estimates that streetcar will confer between $2.2 billion and $3.0 billion more
in net incremental benefits over and above enhanced bus, and between $3.2 billion and $4.4 billion
more in net incremental benefits over and above baseline conditions.
The net incremental benefits to Arlington County and Fairfax County (calculated as the total real estate
value generated less the cost of the capital investment and system maintenance and operations costs) are
presented in Figure 31. Again, factors including the quality of the public realm, local environmental
benefits, place-making features, and neighborhood connectivity, are implicitly captured by the economic
model to the extent they are capitalized into the values of surrounding real estate. It is important to note
that HR&A does not make any assumption about the source of funds for the capital investment; although
benefits accrue primarily to Arlington County and Fairfax County, to the extent that capital costs are
subsidized by the federal or state government, these costs are not necessarily borne locally. Thus, the net
incremental benefits (or return-on-investment) presented may be conservative for both transit modes from
the perspective of the local economy.
HR&A Advisors, Inc. Comparative Return on Investment Study | 56

Figure 31: Net Incremental Benefits (Return on Investment) of Enhanced Bus and Streetcar Service
0% Discount Rate 3% Discount Rate 7% Discount Rate
Impact Type TSM 2 Streetcar TSM 2 Streetcar TSM 2 Streetcar
Real Estate Value
Generated ($M)
$2,140 $6,280 $1,560 $4,790 $1,100 $3,510
Capital Investment Cost
($M) $70 $280 $60 $260 $50 $220
Operations and
Maintenance Cost ($M) $140 $230 $90 $140 $50 $80
Net Benefits - Return
on Investment ($M)
$1,930 $5,770 $1,410 $4,390 $1,000 $3,210
Source: HR&A Advisors, Inc. analysis; Note: All dollar amounts are in millions of $2014, rounded to nearest $10 million.
HR&A projects that streetcar service generates the greatest net benefits, equal to approximately $4.4
billion assuming a three percent discount rate and $3.2 billion assuming a seven percent discount rate.
The net benefits of the TSM 2 alternative, by comparison, are estimated to be approximately $1.4 billion
assuming a three percent discount rate and $1 billion assuming a seven percent discount rate. These net
benefits reflect the greater desirability and productivity of land in the transit corridor as streetcar service
generates mobility and amenity benefits and positions the corridor to be more competitive in the Northern
Virginia market.
Incremental Employment Benefits
By 2027, ten years after the beginning of construction, HR&A estimates that streetcar will support
6,600 new jobs in the transit corridor over the amount that would exist under baselines conditions,
and 4,600 new jobs more than would be supported by enhanced bus.
In addition to the real estate value generated, new transit investment is also expected to support
incremental job creation in Arlington County and Fairfax County because it allows the corridor to attract
more new development than would have occurred under baseline conditions. According to standards
furnished by the US Green Building Council54, there is on average approximately:
One office employee per 225 square feet of office space
One retail employee per 550 square feet of retail space
One restaurant employee per 125 square feet of restaurant space
HR&A leveraged these ratios to project net new job creation along the corridor under both an enhanced
bus service and streetcar service.55 The results of this analysis are presented in Figure 32.
54 Source: U.S. Green Building Council, Building Area Per Employee, 2008. http://www.usgbc.org/Docs/Archive/General/Docs4111.pdf 55 HR&A assumes that retail stores make up 70% and restaurants make up 30% of “retail” space.
HR&A Advisors, Inc. Comparative Return on Investment Study | 57
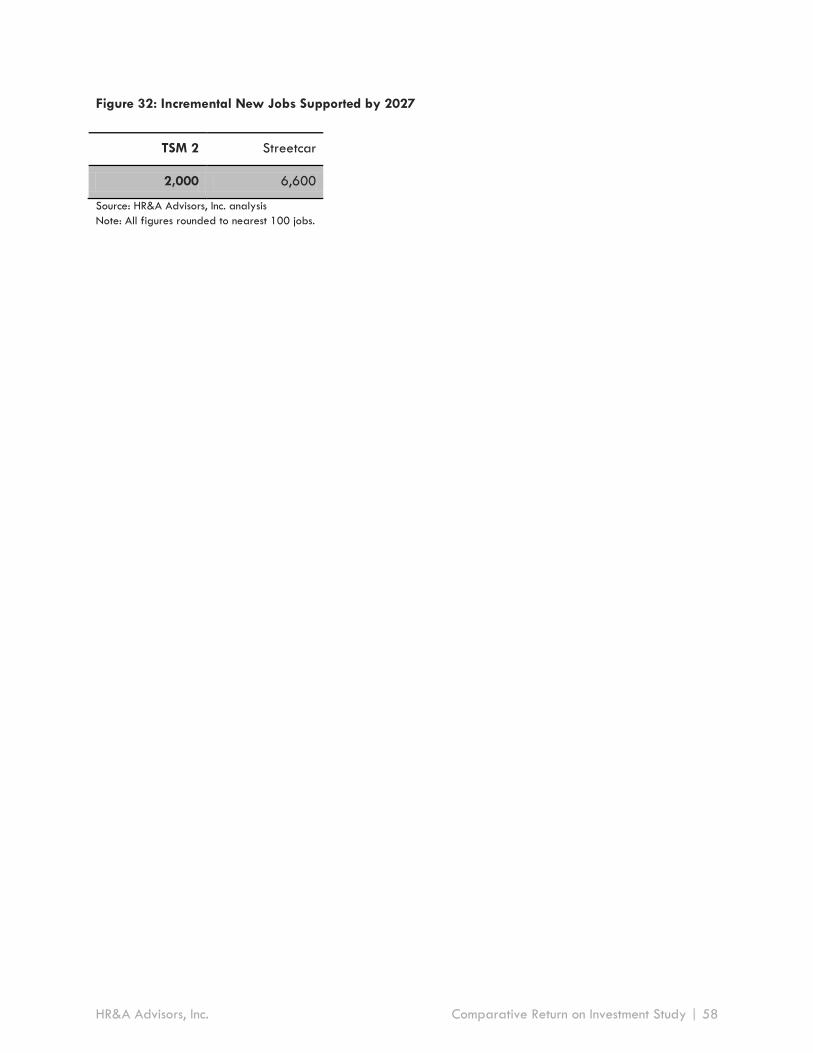
Figure 32: Incremental New Jobs Supported by 2027
TSM 2 Streetcar
2,000 6,600
Source: HR&A Advisors, Inc. analysis
Note: All figures rounded to nearest 100 jobs.
HR&A Advisors, Inc. Comparative Return on Investment Study | 58

VI. Local Fiscal Benefits
The increased quantity, pace, and value of development along the transit corridor will generate net new
tax revenues for Arlington County and Fairfax County. This tax revenue can be used to provide vital
County-wide services like police and fire protection and education, and also be reinvested into the corridor
through new place-making amenities and community facilities that enhance local quality of life.
HR&A estimated the tax revenue generated by enhanced bus service and streetcar service owing to four
types of taxes:
Real Estate Property Tax: An ad valorem tax on the assessed value of real property in Arlington
and Fairfax Counties. In the most recent fiscal year, real estate property taxes accounted for 53
percent of Arlington County’s revenues and 53 percent of Fairfax County’s revenues. HR&A
assumes current mileage rates will continue to apply to property generated by the transit
investment in the future. In Arlington County, residential property is taxed at 1.006 percent and
commercial property at 1.131 percent each year. In Fairfax County, residential property in
Baileys Crossroads is taxed at 1.085 percent and commercial property at 1.210 percent.
Personal Property Tax: An ad valorem tax in Arlington and Fairfax Counties primarily consisting
of taxes on the market value of motor vehicles and tangible business property. In the most recent
fiscal year, personal property taxes accounted for 10 percent of Arlington County’s revenues and
9 percent of Fairfax County’s revenues. HR&A assumes personal property tax revenues will be
generated in concert with employment and residential growth in each county owing to the transit
investment. Arlington County currently receives approximately $225 in tangible business property
taxes per person employed in the County and $400 in vehicle taxes per household, while Fairfax
County receives approximately $200 in tangible business property taxes per person employed in
the County and $325 in vehicle taxes per household.56
Business/Professional/Occupational License (BPOL) Tax: A graduated tax on business gross
receipts in Arlington County and Fairfax County. In the most recent fiscal year, BPOL taxes
accounted for 6 percent of Arlington County’s revenues and 4 percent of Fairfax County’s
revenues. HR&A assumes BPOL tax revenues will be generated in concert with employment growth
in each county owing to the transit investment. Arlington County currently receives approximately
$375 in personal property taxes per person employed in the County, while Fairfax County
receives approximately $275 in personal property taxes per person employed in the County.
Sales Tax: A one percent sales tax on retail sales collected in both Arlington County and Fairfax
County. In the most recent fiscal year, local sales taxes accounted for 4 percent of Arlington
County’s revenues and 7 percent of Fairfax County’s revenues. This tax is applied to projected
future revenues associated with retail space generated by the transit investment. HR&A assumes
future retail space generates $300 in annual sales per square foot, in line with national averages
56 HR&A assumes that 25 percent less in vehicle property taxes per household will be received from new units in the Columbia Pike transit corridor than are currently received by Arlington and Fairfax Counties per unit since the corridor will be transit-oriented and thus residents of these developments will be less likely to own vehicles. Thus, future residential units are projected to generate $300 in annual vehicle tax for Arlington County and $250 in annual vehicle tax for Fairfax County.
HR&A Advisors, Inc. Comparative Return on Investment Study | 59
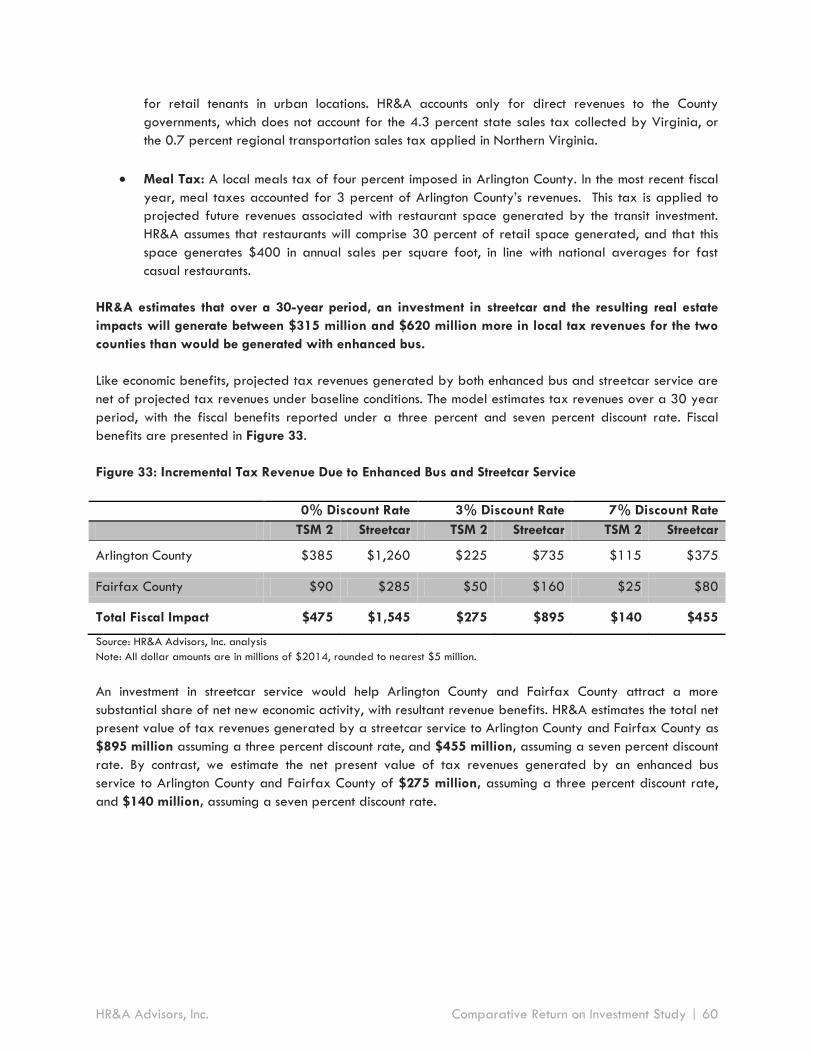
for retail tenants in urban locations. HR&A accounts only for direct revenues to the County
governments, which does not account for the 4.3 percent state sales tax collected by Virginia, or
the 0.7 percent regional transportation sales tax applied in Northern Virginia.
Meal Tax: A local meals tax of four percent imposed in Arlington County. In the most recent fiscal
year, meal taxes accounted for 3 percent of Arlington County’s revenues. This tax is applied to
projected future revenues associated with restaurant space generated by the transit investment.
HR&A assumes that restaurants will comprise 30 percent of retail space generated, and that this
space generates $400 in annual sales per square foot, in line with national averages for fast
casual restaurants.
HR&A estimates that over a 30-year period, an investment in streetcar and the resulting real estate
impacts will generate between $315 million and $620 million more in local tax revenues for the two
counties than would be generated with enhanced bus.
Like economic benefits, projected tax revenues generated by both enhanced bus and streetcar service are
net of projected tax revenues under baseline conditions. The model estimates tax revenues over a 30 year
period, with the fiscal benefits reported under a three percent and seven percent discount rate. Fiscal
benefits are presented in Figure 33.
Figure 33: Incremental Tax Revenue Due to Enhanced Bus and Streetcar Service
0% Discount Rate 3% Discount Rate 7% Discount Rate
TSM 2 Streetcar TSM 2 Streetcar TSM 2 Streetcar
Arlington County $385 $1,260 $225 $735 $115 $375
Fairfax County $90 $285 $50 $160 $25 $80
Total Fiscal Impact $475 $1,545 $275 $895 $140 $455
Source: HR&A Advisors, Inc. analysis
Note: All dollar amounts are in millions of $2014, rounded to nearest $5 million.
An investment in streetcar service would help Arlington County and Fairfax County attract a more
substantial share of net new economic activity, with resultant revenue benefits. HR&A estimates the total net
present value of tax revenues generated by a streetcar service to Arlington County and Fairfax County as
$895 million assuming a three percent discount rate, and $455 million, assuming a seven percent discount
rate. By contrast, we estimate the net present value of tax revenues generated by an enhanced bus
service to Arlington County and Fairfax County of $275 million, assuming a three percent discount rate,
and $140 million, assuming a seven percent discount rate.
HR&A Advisors, Inc. Comparative Return on Investment Study | 60
VII. Appendix
Appendix 1 - Literature Review: Precedent Studies of Real Estate Impacts of Transit Investment
Appendix 2- Case Studies: Impacts of Similar Transit Modes
Appendix 3 – Developer and Retailer Interview Questions
HR&A Advisors, Inc. Comparative Return on Investment Study | 61

Appendix 1 - Literature Review: Precedent Studies of Real Estate Impacts of Transit Investment
To inform its assessment of the comparative return on investment (ROI) of streetcar versus enhanced bus
along the Columbia Pike corridor, HR&A undertook a literature review of precedent studies that examined
the impact of transit on property values and development pace and quantity. Taken as a whole, this body
of literature provides a valuable repository of evidence on the range of development impacts that may
occur along the Columbia Pike transit corridor. In this appendix, the purpose and methodology, key
findings, and relevance to Columbia Pike transit service are described for 16 precedent studies.
The findings of the literature review are summarized in Figure A-1, where a “green up arrow” indicates
positive findings, a “red down arrow” indicates negative findings, a “yellow horizontal arrow” indicates
inconclusive or inconsistent findings, and a blank space indicates the study did not analyze the effect.
HR&A Advisors, Inc. Comparative Return on Investment Study | 62
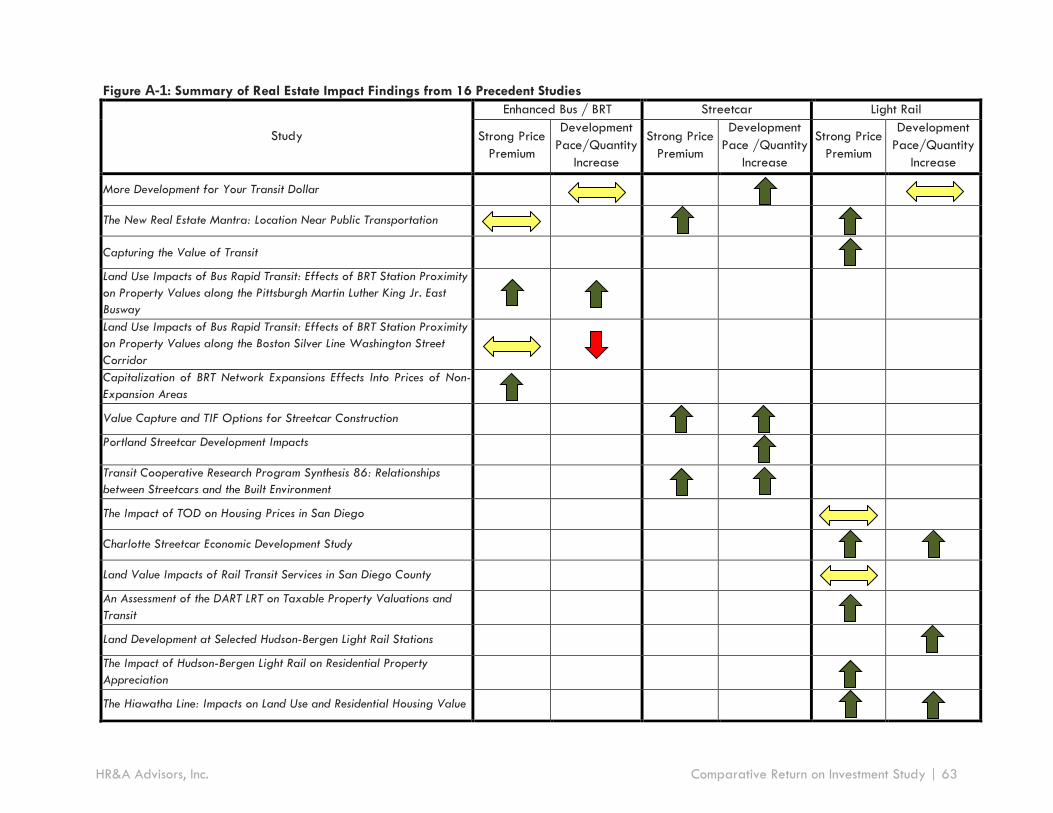
Figure A-1: Summary of Real Estate Impact Findings from 16 Precedent Studies
Study
Enhanced Bus / BRT Streetcar Light Rail
Strong Price Premium
Development Pace/Quantity
Increase
Strong Price Premium
Development Pace /Quantity
Increase
Strong Price Premium
Development Pace/Quantity
Increase
More Development for Your Transit Dollar
The New Real Estate Mantra: Location Near Public Transportation
Capturing the Value of Transit
Land Use Impacts of Bus Rapid Transit: Effects of BRT Station Proximity on Property Values along the Pittsburgh Martin Luther King Jr. East Busway
Land Use Impacts of Bus Rapid Transit: Effects of BRT Station Proximity on Property Values along the Boston Silver Line Washington Street Corridor
Capitalization of BRT Network Expansions Effects Into Prices of Non-Expansion Areas
Value Capture and TIF Options for Streetcar Construction
Portland Streetcar Development Impacts
Transit Cooperative Research Program Synthesis 86: Relationships between Streetcars and the Built Environment
The Impact of TOD on Housing Prices in San Diego
Charlotte Streetcar Economic Development Study
Land Value Impacts of Rail Transit Services in San Diego County
An Assessment of the DART LRT on Taxable Property Valuations and Transit
Land Development at Selected Hudson-Bergen Light Rail Stations
The Impact of Hudson-Bergen Light Rail on Residential Property Appreciation
The Hiawatha Line: Impacts on Land Use and Residential Housing Value
HR&A Advisors, Inc. Comparative Return on Investment Study | 63
Research/Reports Focusing on Multiple Modes
The New Real Estate Mantra: Location Near Public Transportation
Authors: Sofia Becker, Scott Bernstein, and Linda Young (The Center for Neighborhood
Technology)
Publication: Commissioned and released by the American Public Transportation Association (APTA),
in partnership with the National Association of Realtors (NAR), 2013
Transit System Examined: Systems in five regions: Boston (Massachusetts Bay Transportation
Authority (MBTA)’s Rapid Transit, Commuter Rail, and BRT lines), Chicago (Metra commuter rail
lines and Chicago Transit Authority’s rapid transit), Minneapolis (Metro Transit’s Hiawatha Line
light rail service and North Star commuter rail line), Phoenix (Valley Metro Light Rail), and San
Francisco (Altamont Commuter Express, Bay Area Rapid Transit (BART), and Caltrain commuter rail
services, Amtrak’s Capitol Corridor line, and the San Francisco Municipal Transportation Agency
(MUNI)’s light rail/streetcar and cable car lines)
Purpose and Methodology: This study, sponsored by APTA (a transit advocacy organization) and
a NAR (the national trade organization for real estate brokers) investigates how well residential
properties located in proximity to fixed-guideway transit have maintained their value since the
peak of the national housing market. In five metro areas, the authors compared properties within
a half-mile of a fixed-guideway transit station to less transit-accessible properties in the region. In
regions where multiple modes of fixed guideway transit were present, the authors also compared
the relative impact of specific transit modes on the resiliency of housing values.
Key Findings:
In each of the five regions, from 2006 to 2011, transit-accessible residential properties
gained value relative to the average for the region, while other residential properties
exhibited declines in value. Specifically, properties in the transit shed outperformed those
in the region as a whole in value appreciation by 41.6 percent.
In Boston, Minneapolis-St. Paul, and Chicago, subway, light rail, and other modes of high
frequency rapid transit had a much more positive impact on property value retention than
did commuter rail. The San Francisco Bay Area has six different agencies that operate a
variety of rail services in different segments of the region, and the MUNI light rail and
cable cars (which function similarly to a streetcar along large portions of their corridors)
performed the best overall: these station areas performed 61.6 percent better than the
average for the region, whereas transit served areas performed 37.2 percent better than
the region as a whole.
In Boston, the one region studied that has a form of Bus Rapid Transit (the MBTA Silver
Line), BRT-served locations performed only on par with the average for transit-served
locations, (roughly 130 percent better than the regional average for each). However, this
included both the Washington Street branch and the Airport/Waterfront branch; while the
former is enhanced bus similar to TSM 2, the latter has more BRT elements (including a
dedicated tunnel). In contrast, the housing values in rapid-transit served (subway and light
rail) locations out-performed the region by 226.7 percent.
HR&A Advisors, Inc. Comparative Return on Investment Study | 64

Where data was available, the authors also analyzed how different residential product
types fared across these geographies. However, they did not find any consistent trends
among the five study regions.
Relevance to Columbia Pike Transit Service:
Transit-accessible locations captured an increasing share of demand and retained their values
better than non-transit-accessible locations in five diverse regions across the country. While there
properties in the BRT transit shed experienced significant price resilience/appreciation relative to
non-accessible locations, those areas accessible to subway, streetcar, and light rail were able to
retain value and appreciate at nearly double the rate of properties proximate to BRT. This
evidence collectively suggests that enhanced transit service will position the Columbia Pike corridor
to attract a greater share of regional demand, with this greater demand reflected in price
appreciation along the Corridor. A fixed guideway streetcar may have a significantly greater
impact on real estate values than an enhanced bus on the Columbia Pike corridor, generating
increased property tax revenue for Arlington and Fairfax Counties.
More Development for your Transit Dollar: An Analysis of 21 North American Transit Corridors
Authors: Walter Hook, Stephanie Lotshaw, and Annie Weinstock
Publication: Published by the Institute for Transportation and Development Policy (ITDP), 2013
Transit System Examined: Boston’s Washington Street and Waterfront Silver Line bus services,
Charlotte’s Lynx LRT, Cleveland’s Health Line BRT, Denver’s Central Corridor and Southwest
Corridor LRT services, Eugene’s Emerald Express Green Line BRT, Kansas City’s Main Street Metro
Area Express (MAX) bus, Las Vegas’s Strip and Downtown BRT and MAX bus, Los Angeles’s
Orange Line BRT, Ottawa’s O-Train LRT and Transitway BRT, Phoenix’s Metro LRT, Pittsburgh’s
Martin Luther King Jr. East Busway, South Busway, and West Busway BRT services and “The T” LRT
lines, Portland’s MAX Blue Line LRT and Streetcar, and Seattle’s South Lake Union Streetcar.
Purpose and Methodology: Produced by ITDP, an organization that “works to spread knowledge
about BRT” domestically and internationally, this study examined 21 transit corridors in the United
States.57 These systems represent streetcar, light rail, and BRT/bus lines that range from “below
basic” to “silver” on the ITDP’s “BRT Standard” rating methodology. The report chiefly assesses the
amount of new development spurred by each of these transit investments and discusses factors that
were important in explaining the wide range of outcomes. The authors also estimate a “return on
investment” (ROI)58 based on the cost associated with implementing the new transit service and the
value of the real estate development with which it is credited. Special attention is given to case
studies of BRT lines in Pittsburgh and Cleveland.
57 Source: Institute for Transportation and Development Policy: What We Do: Public Transport, https://go.itdp.org/display/live/Public+Transport 58 Return on investment (“ROI”) is a measure used to judge the performance of an investment, comparing its financial benefit generated to its cost. Here, ROI analysis is employed to compare the value of new development. to the cost of the investment in new transit. A higher ROI suggest a more cost-effective investment, although it does not imply greater net benefits when comparing investments of different initial amounts.
HR&A Advisors, Inc. Comparative Return on Investment Study | 65

Key Findings:
Government support for TOD is the strongest predictor of success in encouraging
development. The strength of the land market around the transit corridor is the next
greatest indicator of success.
Although both BRT and light rail/streetcars can leverage many times more TOD investment
than they cost, the quality of the transit investment—how well it meets the best practices
detailed in the BRT Standard—is only the third greatest indicator of success.
Both of the streetcars systems profiled—the Portland Streetcar and the South Lake Union
Streetcar in Seattle—achieved “strong” TOD Impacts. Bus systems profiled had much more
inconsistent development impacts.
o These two streetcar systems leveraged more TOD per dollar invested than sixteen
of the nineteen other transit lines studied. The Portland Streetcar was associated
with $4.5 billion ($41.48 ROI) and the South Lake Union Streetcar was associated
with $3 billion ($53.57 ROI) worth of investment.
o In contrast, of the 12 bus and BRT lines profiled, three had such “nominal” impacts
that their value was not calculated; the remaining nine generated an average
TOD investment of $1.9 billion ($32.36 ROI).
This average is driven by the extraordinarily successful cases, including
the Cleveland Health Line and the Las Vegas SDX (for which development
on the Vegas Strip was questionably attributed to BRT).
A more typical case and one of the two BRT lines selected for a full case
study, the Martin Luther King East Busway in Pittsburgh, is said to have
leveraged only $903 million in new development ($3.59 ROI).
The study argues that, per dollar of transit investment, and under similar conditions, bus
rapid transit leverages more TOD investment than Light Rail Transit or streetcars.
o However, out of the 12 BRT and bus lines included in the survey, the study finds
that only the Cleveland Health Line and the Kansas City MAX had “strong” TOD
impacts. Of these, the Cleveland Health Line was the most successful, leveraging
$115 of TOD investment per dollar invested.
Relevance to Columbia Pike Transit Service:
This study demonstrates that contextual factors, including government support and market
strength, are often more important in predicting development outcomes than transit mode
or service. Columbia Pike benefits from its location within a very strong regional market
that is attuned to the value of transit. The amount of development catalyzed will be a
function of the degree to which Columbia Pike becomes better positioned to capture
demand in the competitive Northern Virginia market. A proactive policy environment,
exemplified by the Pike’s form-based code, will enhance development outcomes for
Columbia Pike.
Many of the “best practices” for BRT lines profiled in the study are dissimilar to the TSM 2
proposal that is feasible in Arlington. TSM 2 would expand capacity and would offer
some new features, such as off-board fare collection, but would not include features such
like protected, dedicated lanes. As such, “full BRT” lines, such as those in Cleveland,
Pittsburgh, Las Vegas, and Eugene are flawed comparisons.
HR&A Advisors, Inc. Comparative Return on Investment Study | 66
o For instance, the Cleveland Health Line includes a combination of features and
amenities that are unmatched by other buses in the United States; the proposed
enhanced bus along the Columbia Pike would not include a dedicated lane or
signal prioritization, two features that significantly enhance transit performance. In
addition, this line connects Cleveland’s three largest and strongest employment
centers, including its downtown, University Circle (home of Case Western Reserve
University and several major medical and cultural institutions), and the world-
renowned Cleveland Clinic. For these reasons, it is unlikely an enhanced bus
along Columbia Pike could induce the magnitude of development associated with
the Cleveland Health Line.
Rather, systems such as the Washington Street Silver Line in Boston and the Main Street
MAX in Kansas City are much closer comparables. Lacking dedicated lanes for much of its
length, the Kansas City Main Street MAX line is far more similar to the proposed enhanced
bus along Columbia Pike. It was associated with a large increment of new development,
with the vast majority of it taking place in downtown Kansas City. The study notes,
however, that “downtown Kansas City, though which the majority of the Main Street MAX
service runs, has experienced significant development over the past ten years, primarily
due to the emerging downtown land market and the strong government interventions that
have encouraged land development downtown,” rather than primarily due to the
implementation of BRT.
Likewise, the streetcar and light rail systems this report profiles are also not perfectly
comparable to the streetcar proposed for Columbia Pike. The length and frequency of
service of the streetcar planned for Columbia Pike would allow it to play much more of a
true role in facilitating transportation than the more development-focused streetcars in
Portland and Seattle, the latter of which in particular is primarily an inducement to new
development. However, the speed, stop frequency, and relationship with the built
environment also set it apart from most light rail lines, such as those in Denver or Phoenix.
Capturing the Value of Transit
Authors: Nadine Fogarty, et al.
Publication: Published and produced by The Center for Transit-Oriented Development.
Commissioned by the Federal Transit Administration, 2008
Transit System Examined: The literature review includes studies of BART, Chicago Metra, Dallas
Area Rapid Transit light rail, Metropolitan Atlanta Rapid Transit Authority rail, the Portland MAX
light rail, the Sacramento Light Rail, the San Diego Trolley light rail, the Santa Clara County VTA
light rail, St. Louis MetroLink light rail, and Washington Metrorail.
Purpose and Methodology: This study was produced by the Center for Transit-Oriented
Development, a partnership between two non-profit organizations (the Center for Neighborhood
Technology and Reconnecting America) and Strategic Economics, a for-profit consulting firm. This
report was published under a long-term contract to provide applied, quasi-academic research to
the Federal Transit Administration. Composed primarily of an overview of strategies and
opportunities related to value capture financing strategies, this study begins with a meta-analysis
HR&A Advisors, Inc. Comparative Return on Investment Study | 67

of previous studies that have measured the property value impacts of transit. Findings are
disaggregated by property type, with the range of property value premiums found for single
family residential, condominium, apartment, office, retail properties. Though no distinction is made
among transit modes for this analysis (which looks only at heavy rail and light rail systems), there is
a discussion of the factors that influence the magnitude of the value impacts.
Key Findings:
The literature review suggested the following range of property value premiums:
o Single Family Homes: 2% - 32% (same range for light rail lines)
o Condominium Prices: 2 -18% (same range for light rail lines)
o Apartment Rents: 0% - 45% (same range for light rail lines)
o Office: 0% - 120% (10% - 120% for light rail lines)
o Retail: 0% - 167% (0% - 167% for light rail lines)
Referencing research by Robert Cervero, the authors note three factors that can often
play a significant role in determining the value premiums generated by transit:59
o “Good economy and healthy real estate conditions”: while transit cannot create
real estate demand where it does not exist, it can help to direct and concentrate
it.
o “Supportive public policy”: without the necessary planning, zoning, parking
requirements, and/or incentives, transit will not spur new development.
o “Traffic congestion”: the more that transit compares favorably to cars in terms of
travel times, price, accessibility, and reliability, the more valuable locations near
transit tend to become.
Relevance to Columbia Pike Transit Service:
While the results for each property type ranged widely (especially for commercial and
retail properties) and focused exclusively on light and heavy rail transit, this research
illustrates that the potential property value impact of transit is very high.
The Columbia Pike corridor possesses two of the three factors noted as playing a
significant role in determining value premiums of transit.
o “Good economy and healthy real estate conditions”: This is a factor for Columbia
Pike. The economic and real estate conditions of the DC metro area are among
the strongest in the country, including in Arlington.
o “Supportive public policy”: This is a factor for Columbia Pike. Arlington County is
playing an active role in supporting TOD along this and its other major transit
corridors.
o “Traffic congestion”: This is not a factor for Columbia Pike. Increasing traffic
congestion in the Washington region will likely enhance the value of transit
accessibility over time, including transit along Columbia Pike. However, to the
extent Columbia Pike itself suffers from congestion, the lack of a dedicated lane
will hinder this benefit. Larger streetcar vehicles could mitigate some of this traffic
congestion, while increases in bus frequency could lead to bus bunching that
exacerbates congested conditions.
59 Cervero et. al. Transit Cooperative Research Program Report 102: Transit-Oriented Development in the United States: Experiences, Challenges, and Prospects. Transportation Research Board of the National Academies, 2004.
HR&A Advisors, Inc. Comparative Return on Investment Study | 68

Research/Reports Focusing on Buses and BRT
Land Use Impacts of Bus Rapid Transit: Effects of BRT Station Proximity on Property Values along the Pittsburgh
Martin Luther King, Jr. East Busway
Authors: Victoria A. Perk and Martin Catala
Publication: Sponsored by the Federal Transit Administration, released by the National Bus Rapid
Transit Institute, Center for Urban Transportation Research, University of South Florida, 2009
Transit System Examined: Martin Luther King, Jr. East Busway, Pittsburgh. The 9.1 mile busway is
composed of fully dedicated, multi-lane right-of-way resembling a highway for buses and is
utilized by multiple bus routes.
Purpose and Methodology: This academic study, produced in partnership with the Federal Transit
Administration, employs a hedonic price regression analysis60 to determine the value premium
associated with access to BRT stations. The study compares single-family homes within a half-mile
radius of a busway station to homes within five miles of a station. The study limits itself to
properties between the Allegheny and Monongahela Rivers.
Key Findings:
BRT’s impact on property value was shown to be greatest within 100 feet from a station
and to decline with distance. The study finds an effect equivalent to an 11% premium over
the mean value of homes in the study area, with property 100 feet from a station area
valued $9,745 more than property 1,000 feet from a station. The magnitude of value
premium declines with distance from the station until it is fully extinguished at 1,000 feet.
The study references another study of the development along the East Busway that found
$302 million worth of new or improved development within 1,500 feet of the stations
between 1983 and 1996; 80% was clustered at stations. That study further estimates that
another $203 million of development has occurred since 1996, and that an increment of
$300 million occurred between 2004 and 2009. However, the study notes that much of
this could be best characterized as “transit-adjacent” rather than “transit-oriented.”
Relevance to Columbia Pike Transit Service:
The accessibility premiums identified in this study demonstrate BRT’s ability to generate a
premium to property values. However, those impacts were limited chiefly to property
values, with the presence of BRT failing to significantly alter either the quantity or form of
new development. However, the intensity of the infrastructure investment and the vehicle
speeds along the East Busway vastly exceed those proposed under the TSM 2 enhanced
bus service. Therefore, value premiums on Columbia Pike resulting from the presence of
TSM 2 would be expected to be somewhat less than the value premiums resulting from an
investment in true BRT.
60 In real estate research, a hedonic price regression analysis involves the development of statistical model that assesses how much each of a property’s characteristics (size, condition, neighborhood amenities, etc.) tend to contribute to its total value. Through this method, the researchers aim to answer the question, “if all other characteristics are held constant, how do property values change due to proximity or accessibility to a transit node?” The quantity or percentage of this difference is said to be the “value premium” associated with transit.
HR&A Advisors, Inc. Comparative Return on Investment Study | 69

Land Use Impacts of Bus Rapid Transit: Phase II - Effects of BRT Station Proximity on Property Values along the
Boston Silver Line Washington Street Corridor
Authors: Victoria A. Perk, Martin Catala, and Steven Reader. (Federal Transit Administration)
Publication: Sponsored and released by the Federal Transit Administration, 2012
Transit System Examined: Washington St. Silver Line in Boston, MA, a specially branded enhanced
bus service that lacks a physically separated lane.
Purpose and Methodology: This academic study, produced in partnership with the Federal Transit
Administration, employs hedonic price regression models to estimate the impact of access to a bus
station on the sale prices of condominium units within 1/4 mile of the Washington Street corridor.
On a per square foot basis, prices in 2000/2001 (before the implementation of the Silver Line
service on Washington Street) were compared to those in 2007/2009; the study employs distance
from the corridor as a second independent variable.
In a second analysis, changes in land uses along the corridor were examined over the period from
2003 to 2009, (the years following the implementation of the Silver Line on Washington Street).
Key Findings:
In 2007/2009, the researchers found that condos located directly adjacent to
Washington St. sold for 7.6 percent more, per square foot, than those located 0.16 miles
away, all else equal. This represents a significant change from 2000-2001, when there
was a negative relationship between proximity to Washington Street and condominium
price (at a distance of 0.18 miles from the corridor, condos sold for an average of 22
percent more on a per square foot basis, than condos located directly on the corridor). As
such, Silver Line service appears to have had a positive impact on the prices of
condominiums adjacent to the alignment.
Over this same period, condominium prices in the corridor overall grew at a slightly slower
rate than those in the City of Boston as a whole (52 percent in the corridor, 54 percent in
the city overall). Thus, Silver Line service did not increase the corridor’s value relative to
the broader housing market.
A large number of parcels changed their use to condominium, which was expected, given
the strong growth of the condominium product type throughout the Boston region during
this time period. However, within this corridor, the vast majority of these condos were small
projects, occupying a single rowhouse parcel and with no greater concentration closer to
Washington Street. There were a small number of larger projects (less than 10) in the
South End and the edge of downtown, but were only two condo projects of any size within
the Roxbury portion of the corridor.
Relevance to Columbia Pike Transit Service:
The Silver Line experience suggests that enhanced bus could ameliorate the
disadvantages of locations directly adjacent to the busy Columbia Pike, particularly in
concert with other place-making initiatives.
HR&A Advisors, Inc. Comparative Return on Investment Study | 70

That condo prices along the Silver Line did not appreciate as fast as they did in the City
of Boston, and the area did not experience significant new development, suggests that
enhanced bus service alone is unlikely to help the Columbia Pike corridor capture a
greater share of regional demand.
Capitalization of BRT Network Expansions Effects Into Prices of Non-Expansion Areas
Authors: Daniel A. Rodriguez and Carlos H. Mojica
Publication: Transportation Research Part A, 2009
Transit System Examined: The TransMilenio, Bogota, Colombia’s extensive BRT system. Opened in
2000, the system has eleven lines and over one hundred stations, and features fully dedicated
lanes, large-capacity articulated buses, and off-vehicle fare collection.
Purpose and Methodology: This academic study seeks to understand the impact of “network
benefits” on property values in order to inform future transportation investment decisions
regarding BRT and BRT expansions. That is, what is the benefit to properties already served by
transit of expanding accessibility by building additional transit lines and stops elsewhere in that
network? This study specifically looks at the extent to which expansions of the BRT network have
resulted in land value premiums in non-expansion areas. The study employs a hedonic regression
analysis to examine changes in price owing to BRT expansions that took place between 2003 and
2006 for a selected group of residential properties that were already within 1 km of the BRT
system in 2003.
Key Findings:
The study finds evidence of a network benefit from the system expansion. Asking prices
increased by 13 to 14 percent in areas already served by BRT due to the network
expansion, as compared to a control area that was not affected by the expansion. The
premium did not dissipate significantly with distance, as it was similar within 500 meters
from the BRT and between 500 meters and 1 kilometer of the line.
The authors note evidence of appreciation may owe to station area improvements and the
initial introduction of BRT service that took time to materialize.
Relevance to Columbia Pike Transit Service:
For properties near the transit corridor (either on Columbia Pike, in Pentagon City, or in
Baileys Crossroads), it is likely that a seamless connection to the planned Crystal City
streetcar line would confer a value premium over-and-above that associated with the
initial provision of transit service. Enhancing accessibility to an important employment
center would increase demand along the transit corridor, resulting in greater land value.
Specifically, since the mode of the new Crystal City system will be a streetcar, the
implementation of a streetcar on Columbia Pike would likely produce a higher network
effect because it would enable the two lines to function as components of a single network.
Because the TransMilenio is perhaps the most fully-developed BRT service in the world, the
specific level of price premium identified in this study holds little guidance for enhanced
bus service in Arlington County, which could not offer a dedicated lane.
HR&A Advisors, Inc. Comparative Return on Investment Study | 71
Research/Reports Focusing on Streetcar
Value Capture and Tax-Increment Financing Options for Streetcar Construction
Authors: Brookings Institution, HDR, Reconnecting America, RCLCO
Publication: Commissioned and released by D.C. Surface Transit, Inc. (DCST), 2009
Transit System Examined: Portland, Seattle (South Lake Union), and Tampa (Ybor City) Streetcars.
Purpose and Methodology: This study was commissioned by a group advocating for the
implementation of streetcar service in Washington, DC. While the body of the document consists
of an assessment of financing options and value capture potential for the proposed transit system,
Appendix II of the study includes case studies of the real estate impacts of three streetcar lines. In
each case, both the land value and land use impact of transit implementation were evaluated by
mapping and comparing tax assessment data from a date prior to transit service and a date
following service. In the case of Portland, two sets of time periods were assessed to determine how
land use impacts matured over time.
Key Findings:
Seattle:
o In Seattle, this modern streetcar runs from downtown through the formerly
industrial South Lake Union neighborhood. Approximately half of the funding for
the line came from contributions from property owners, through a local
improvement district.
o From 2003 to 2008 (the period during which the streetcar was planned and
constructed), assessed values for parcels with buildings rose between 50 and 85
percent. For all property types, this represented significantly greater appreciation
than was experienced in Seattle as a whole, ranging from 3 percent greater
(multi-family) to 35 percent greater (mixed-use structures).
o Over the course of this period, a significant quantity of vacant, industrial, and
commercial land was redeveloped into office buildings.
Portland:
o As in Seattle and Tampa, the Portland Streetcar (one of the first modern streetcar
lines implemented in the US) connected previously industrial areas to the
downtown and was associated with the redevelopment of those parcels into
higher value office and residential uses. Over the course of the 11-year period
examined as a part of this study, nearly all of the industrial properties in this
corridor (which had previously constituted the vast majority of land in the Pearl
District and much of the eastern portion of the Northwest District) were
redeveloped into commercial, mixed-use, and multi-family uses.
o A majority of the property value increases were associated with this
redevelopment, but properties that were not redeveloped also experienced very
significant price appreciation.
Existing (not redeveloped) single-family homes, on less than 0.5 acres
along the corridor and north of the CBD, increased in value by 183
HR&A Advisors, Inc. Comparative Return on Investment Study | 72
percent from 1997-2008; citywide, this property type increased in value
by 136 percent over this period.
Existing multifamily housing in this area increased in value by 205 percent
compared to 118 percent in the city as a whole.
The assessed value of commercial properties rose by 231 percent; in the
city as a whole, they increased by 130 percent over this period.
Tampa:
o In Tampa, the TECO line, a heritage streetcar, runs from downtown to the
Channelside and Ybor City neighborhoods.
From 2002 (when the streetcar opened) and 2008, property values in the
Channelside District have increased a median of 313 percent. The majority of this
change was associated with the redevelopment of large, vacant and industrial
parcels into high-value condominiums and high-rise apartment buildings. The
streetcar is credited with having re-connected this formerly-severed neighborhood
with downtown, thus increasing the accessibility and demand for housing.
o Over the same period, property values increased a median of 71 percent in Ybor
City (where substantial redevelopment predated the streetcar).
There were two factors that were common to the success of each of these cases. The first
was that the streetcar strengthened the connection to downtown from previously
underutilized districts. The second was that value generation was chiefly associated with
the redevelopment of vacant and industrial parcels into high-density uses.
Relevance to Columbia Pike Transit Service:
Just as the streetcar helped re-positioned downtown adjacent neighborhoods in Portland,
Seattle, and Tampa, a streetcar on Columbia Pike with visible infrastructure is likely to
help to strengthen connections between places on the corridor and promote development
in a more integrated fashion.
Columbia Pike lacks the large vacant and industrial parcels found in these case studies,
but does feature a significant number of parcels with low-intensity uses. Because these
parcels constitute a somewhat greater hurdle, a more significant increase in value is
necessary to catalyze new development.
The case studies of Portland and Seattle demonstrate that property values of multiple
types of uses adjacent to the streetcar appreciated more than did land in the cities as a
whole. Moreover, the streetcar facilitated large-scale redevelopment by helping focus
demand on an underutilized corridor, evidence of its potential ability to do the same
along the Columbia Pike corridor.
Portland Streetcar Development Impacts
Authors: Tess Jordan and Eric Hovee (E.D. Hovee & Company, LLC)
Publication: Prepared for and released by Portland Streetcar, Inc., 2005
Transit System Examined: Portland Streetcar
HR&A Advisors, Inc. Comparative Return on Investment Study | 73

Purpose and Methodology: This study was commissioned by operating entity of the Portland
Streetcar as a means of projecting the potential impact of an extension of the streetcar network to
the east side of the city. The study compared development patterns in the central business district
prior to 1997 (when the streetcar alignment was chosen) to the new development that occurred
after 1997. It considered two factors: how much of the allowable building envelope was utilized
in blocks along the streetcar alignment and what share of development in the CBD was captured in
those blocks.
Key Findings:
Prior to 1997, buildings on parcels within one block of the streetcar alignment utilized
approximately 34 percent of their allowable FAR; development that occurred after 1997
utilized an average of 90 percent of the allowable FAR. The authors suggest that this is
evidence that the streetcar changed the real estate economics of the adjacent blocks such
that it became profitable to build more densely, with evidence of a development impact
observable for up to three blocks from the alignment (a distance of 600 to 800 feet).
Prior to 1997, the blocks directly adjacent to the streetcar alignment included 19 percent
of the total building square footage in the downtown. After 1997, these blocks captured
55 percent of all new development. Conversely, prior to 1997, the portions of the CBD
that were greater than three blocks from the future streetcar line constituted more than 50
percent of the building area; after 1997, these areas only captured 25 percent of new
development.
Relevance to Columbia Pike Transit Service:
This study provides strong evidence of streetcar’s ability to change real estate dynamics,
attracting more and denser development to a corridor. A streetcar on Columbia Pike
would likely help focus regional demand on adjacent land, encouraging higher density
development with an orientation towards the transit use.
Transit Cooperative Research Program Synthesis 86: Relationships between Streetcars and the Built Environment
Authors: Ron Golem and Janet Smith-Heimer
Publication: Sponsored by the Federal Transit Administration, published by the Transportation
Research Board of the National Academies, 2010
Transit System Examined: Heritage streetcar lines in Memphis, TN; Kenosha, WI; and Savannah,
GA; modern streetcar lines in Portland, OR and Seattle, WA. Given the significantly different
contexts in Kenosha and Savannah, this review focuses on the evidence from Memphis, Portland,
and Seattle.
Purpose and Methodology: This quasi-academic study, published as part of a Transit Cooperative
Research Program Synthesis series of reports, includes a literature review and an assessment of the
impact of streetcar on the built environment. That assessment includes both a survey of transit
operators and case studies of five recently implemented streetcar lines.
HR&A Advisors, Inc. Comparative Return on Investment Study | 74

Key Findings:
Memphis (Heritage Streetcar):
o The study includes original research into the value premium associated with the
Madison Ave. streetcar line, evaluating how tax assessments on parcels within .25
miles of the alignment changed between 2002 and 2008.
Over this period, the aggregate assessment on parcels on the transit
corridor grew by 760 percent, compared to 24 percent in the city as a
whole. The authors note that most of this is attributable to the
development of condominiums on formerly vacant or underutilized
parcels.
Among commercial properties, there was a differential impact on
structures vs. land.
o Commercial land in the transit corridor increased in value by 70
percent over this period, as compared to 15 percent in the city as
a whole.
o In contrast, the assessed value of commercial structures actually
fell by 8 percent during this period, even as such parcels grew in
aggregate value by 17 percent in the city as a whole.
o The authors also note that, since 1991, more than $3 billion in development
projects have been completed, are planned, or are under way on or near the
three trolley corridors.
In an interview conducted as a part of this study, the manager of the
Memphis Area Transit Authority noted that the trolley system was a vital
component of the urban resurgence in Memphis, demonstrating public
investment to improve the area. However, he also noted that it was one
of several factors that contributed to the transformation of area’s physical
environment.
Seattle (Modern Streetcar):
o As of the 2010, more than 3 million square feet of new office space and 6,000
new residential units had been built, or were in some phase of development in the
South Lake Union area.
o The authors cite consolidated land ownership and supportive land use policy
(including 90 foot height limits and no parking requirements) as key factors in the
increment of new development associated with the streetcar line.
Portland (Modern Streetcar):
o The authors cite the previously referenced Jordan and Hovee report, arguing that
the FAR analysis is flawed because it compares existing development to new
development within the transit corridor, but does not account for the character of
new development elsewhere in the CBD.
Relevance to Columbia Pike Transit Service:
This study documents the significant potential impact of streetcar on property values. In
each case, the influence of streetcar was augmented by other factors (including supportive
land use policy, an active real estate market, and the implementation of public
improvements). Given the strength of the regional real estate market and Arlington
HR&A Advisors, Inc. Comparative Return on Investment Study | 75
County’s commitment to facilitating TOD, the Columbia Pike corridor seems to have some
of the ingredients necessary for strong development impacts.
o The Memphis and Seattle cases demonstrate the strong potential development
impacts of streetcar in terms of property value appreciation and development
pace and quantity.
o The streetcar provided a rationale for relaxing parking requirements in Seattle,
which provides a tangible example of how a streetcar on Columbia Pike could
facilitate development by reducing the cost burden to developers.
Research/Reports Focusing on Light Rail
The Impact of Transit-oriented Development on Housing Prices in San Diego, CA
Authors: Michael Duncan
Publication: Urban Studies, 2010
Transit System Examined: San Diego Trolley, a light rail system with 53 stations in the San Diego
metropolitan area.
Purpose and Methodology: This academic research, produced for publication in a peer-reviewed
journal, examines the prices of condominiums within the service area of San Diego Trolley.
Specifically, the study employs a hedonic price model to assess how two sets of transit-oriented
development variables influence value premiums:
Transit-accessible homes within 1000 feet of a station were compared to those between
1000 feet and one mile; and
Effects of a high quality pedestrian environment (e.g. a well-connected street pattern,
attractive commercial destinations mixed with housing, and flat walking paths, etc.). Prices
were based on transactions from 1997 – 2001 and were limited to parcels located
outside of the CBD.
Key Findings:
The study found no statistically significant value premium for locations in station areas,
assuming an “average” pedestrian environment.
However, there was a significant interaction effect between station accessibility and other
TOD measures. Specifically, increases in intersection density, people-serving commercial
activity, or steepness in terrain enhance the relative value of station proximity.
o In areas with a good pedestrian environment, the condo value premium for being
in a station area exceeded 15 percent (a $20,000 premium).
o Conversely, in areas with a poor quality pedestrian environment there was a
penalty to station area proximity, with value discounts approaching 11 percent (a
$15,000 discount).
Relevance to Columbia Pike Transit Service:
A transit investment must be made in conjunction with public investment in pedestrian
infrastructure and private investment in retail/services in order for it to generate a
HR&A Advisors, Inc. Comparative Return on Investment Study | 76

positive impact on property values on Columbia Pike. Streetcar transit is more likely to
leverage such investments and would thus have the best opportunity to generate broader
value for the corridor.
Charlotte Streetcar Economic Development Study
Authors: Bay Area Economics, Warren & Associates, Integra Realty Resources
Publication: Prepared for and released by the City of Charlotte, 2009
Transit System Examined: Charlotte Blue Line, a light rail line in Charlotte with 15 stations that
connects several neighborhoods to Uptown Charlotte.
Purpose and Methodology: This study primarily focuses on assessing the potential impact of
implementing a proposed streetcar line in Charlotte. In addition to presenting a literature review
and a set of other case studies, the study includes original research on the Charlotte Lynx (Blue
Line) light rail. The researchers evaluated land sales in the Blue Line corridor between 2002 and
2008. Blue Line service began in 2007, but supplemented a trolley line that had already been in
service over a portion of this corridor. Sixty-five (65) land sales were identified along this
corridor, including 11 paired sales (sale and resale of the same property). Those eleven paired
sales were analyzed to find the annualized percentage change in value. This was supplemented
with a set of developer interviews to obtain of qualitative understanding of the factors perceived
to be most important in this land value appreciation.
Key Findings:
Of the nine paired parcels that had zoning changes over this period, annualized price
appreciation averaged 72 percent, with a range of 37 percent (at New Bern Ave station)
to 143.1 percent (at Arrowood station).
For the two parcels that did not have any zoning changes, the annualized increases in
value were much smaller: five percent (at Woodlawn Station) and 17 percent (at
East/West Boulevard Station).
In interviews, the developers who invested along the proposed streetcar route attribute
the streetcar with attracting their capital investment. However, in some cases, they also
mentioned that the corresponding increases in zoning/entitlements were important factors
in their decision. Interviews also suggested that much of the market demand and
attraction of private capital is driven by perceptions of competitive advantage deriving
from streetcar.
Relevance to Columbia Pike Transit Service:
The experience of the Charlotte Blue Line provides strong evidence that rail transit is
attractive to development and can significantly enhance an area’s competitiveness in a
regional context. Although the Columbia Pike streetcar would differ considerably in its
transit characteristics, fixed guideway rail transit would likely position the corridor to
attract more development in the competitive Northern Virginia market.
HR&A Advisors, Inc. Comparative Return on Investment Study | 77

Land Value Impacts of Rail Transit Services in San Diego County
Authors: Robert Cervero and Michael Duncan
Publication: Prepared for and released by the National Association of Realtors and the Urban
Land Institute, 2002
Transit System Examined: Coaster (commuter rail) and light rail lines in San Diego County
Purpose and Methodology: The study, funded and released by the professional association for
real estate brokers (NAR) and the leading national real estate research organization (ULI),
applied a hedonic price model to determine the value premium associated with proximity to a
range of transit services.
Key Findings:
The greatest premiums were associated with condominiums and commuter rail; such
properties commanded a 46 percent premium around Coaster stations. Single-family
homes in Coaster station areas also conferred a large value premium (17 percent).
Proximity to light rail was associated with value premiums for both condominiums (2 – 6
percent) and multifamily housing (4 – 17 percent).
However, for single family homes, light rail was a disamenity and for multifamily
properties, the same was true for accessibility to the Coaster. Commercial properties
experienced highly variable premiums across transit lines and locations.
Relevance to Columbia Pike Transit Service:
Evidence from San Diego suggests that implementing rail transit in the Columbia Pike
corridor will likely generate a price premium for multi-family housing product, whether
rental or ownership. Given the differences in mode and area characteristics, the extent of
the premium generated along the Columbia Pike corridor may differ.
An Assessment of the DART LRT on Taxable Property Valuations and Transit
Authors: Bernard L. Weinstein and Terry L. Clower
Publication: Prepared for Dallas Area Rapid Transit and released by the University of North
Texas, Center for Economic Development and Research, 2002
Transit System Examined: Dallas Area Rapid Transit Light Rail,
Purpose and Methodology: The study was prepared on behalf of the operator of the Dallas light
rail system and analyzed real estate impacts of DART rail for 23 station areas (defined as
properties within ¼ mile of a light rail station) outside of the CBD. The authors compared
assessed value increases within these station areas versus control areas from the period between
1997 and 2001, disaggregated by property type.
HR&A Advisors, Inc. Comparative Return on Investment Study | 78

Key Findings:
For office properties, assessments grew by 24.7 percent within the station areas,
compared to 11.5 percent in the control areas (differential appreciation of +13.2
percent).
For residential properties, assessments grew by 32.1 percent within the station areas,
compared to 19.5 percent in the control areas (differential appreciation of +12.6
percent).
For retail properties, assessments grew by 28.3 percent within the station areas,
compared to 30.4 percent in the control areas (differential appreciation of – 2.1 percent).
For industrial properties, assessments grew by 13.0 percent within the station areas,
compared to 21.5 percent in the control areas (differential appreciation of -8.5 percent).
Relevance to Columbia Pike Transit Service:
Based upon the experience of DART rail in Dallas, substantial transit investment on
Columbia Pike has the potential to induce significant property value premiums for office
and residential uses in adjacent areas. Similar to the San Diego study, this research does
not provide strong evidence that a similar premium would be experienced by retail uses.
Land Development at Selected Hudson-Bergen Light Rail Stations
Authors: Martin E. Robins and Jan S. Wells
Publication: Prepared for and funded by NJ Transit, released by the Alan M. Voorhees
Transportation Center, Edward J. Bloustein School of Planning and Public Policy, Rutgers University,
2008
Transit System Examined: Hudson-Bergen Light Rail (HBLR)
Purpose and Methodology: Funded by NJ transit (the sponsoring agency of the Hudson-Bergen
Light Rail), the authors employed a case study approach to review the form, value, and total
quantity of new housing development near a selection of HBLR stations from 2000-2007.
Key Findings:
New TOD was most prevalent in downtown Jersey City, where HBLR functions like a
streetcar. Between 2000 (when HBLR began service) and 2007, 4,265 new units of
housing with an estimated value of $2.3 billion were developed within ¼ of the Jersey
Avenue, Marin Boulevard, and Essex Street Stations.
The greatest increment of new TOD has been undertaken and/or planned in areas where
there were large, underutilized industrial sites. Between 2000 and 2007, more than
2,000 housing units were developed near 9th Street in Hoboken, where several industrial
parcels and buildings had been vacated. Along the HBLR line, many acres of disused rail
yards, piers, and industrial sites have been redeveloped into compact, transit- and
pedestrian-oriented environments.
New TOD has been undertaken and/or planned in areas where HBLR meets existing
transit connections. At Port Imperial, which has a ferry link to Midtown Manhattan, a
HR&A Advisors, Inc. Comparative Return on Investment Study | 79
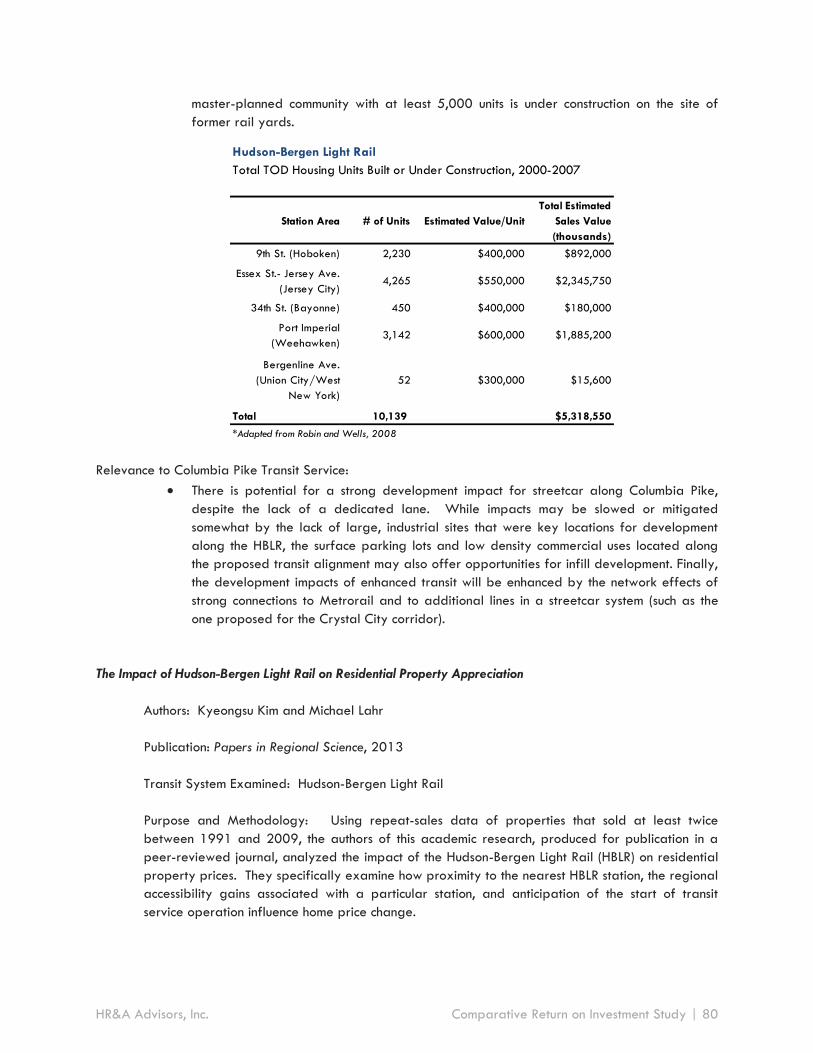
Hudson-Bergen Light Rail
Total TOD Housing Units Built or Under Construction, 2000-2007
Station Area # of Units Estimated Value/Unit
Total Estimated
Sales Value
(thousands)
9th St. (Hoboken) 2,230 $400,000 $892,000
Essex St.- Jersey Ave.
(Jersey City) 4,265 $550,000 $2,345,750
34th St. (Bayonne) 450 $400,000 $180,000
Port Imperial
(Weehawken) 3,142 $600,000 $1,885,200
Bergenline Ave.
(Union City/West
New York)
52 $300,000 $15,600
Total 10,139 $5,318,550
*Adapted from Robin and Wells, 2008
master-planned community with at least 5,000 units is under construction on the site of
former rail yards.
Relevance to Columbia Pike Transit Service:
There is potential for a strong development impact for streetcar along Columbia Pike,
despite the lack of a dedicated lane. While impacts may be slowed or mitigated
somewhat by the lack of large, industrial sites that were key locations for development
along the HBLR, the surface parking lots and low density commercial uses located along
the proposed transit alignment may also offer opportunities for infill development. Finally,
the development impacts of enhanced transit will be enhanced by the network effects of
strong connections to Metrorail and to additional lines in a streetcar system (such as the
one proposed for the Crystal City corridor).
The Impact of Hudson-Bergen Light Rail on Residential Property Appreciation
Authors: Kyeongsu Kim and Michael Lahr
Publication: Papers in Regional Science, 2013
Transit System Examined: Hudson-Bergen Light Rail
Purpose and Methodology: Using repeat-sales data of properties that sold at least twice
between 1991 and 2009, the authors of this academic research, produced for publication in a
peer-reviewed journal, analyzed the impact of the Hudson-Bergen Light Rail (HBLR) on residential
property prices. They specifically examine how proximity to the nearest HBLR station, the regional
accessibility gains associated with a particular station, and anticipation of the start of transit
service operation influence home price change.
HR&A Advisors, Inc. Comparative Return on Investment Study | 80

Key Findings:
Properties near West Side Avenue (Jersey City) and 22nd Street (Bayonne) Stations (the
southern ends of the system as of 2010), had annual price appreciation rates of 17 to 20
percent greater than comparison properties in the area, respectively. These two stations
are relatively far from the employment centers of the region and the HBLR represented a
major increase in accessibility.
In both of these cases, transit’s impact on price appreciation is limited to a ¼ mile radius
of the station areas, with the effect extinguished at ¼ mile. In contrast, homes near 9th
Street in Hoboken experienced noteworthy, but lesser price appreciation effects, while
Bergenline Ave. Station, which was already strongly linked by express buses to
Manhattan, experienced no such impacts.
Relevance to Columbia Pike Transit Service:
Property value increases owing to new transit service may be proportionately greatest for
the parts of the corridor far from existing transit service, where the change in transit
accessibility is greatest. Along Columbia Pike, this would imply that areas further south in
Arlington County and in Fairfax County may experience a relatively stronger price
premium because they are more distant from existing rail transit.
The Hiawatha Line: Impacts on Land Use and Residential Housing Value
Authors: Edward G. Goetz, et al.
Publication: Center for Transportation Studies, Humphrey Institute of Public Affairs, University of
Minnesota, 2010
Transit System Examined: The Hiawatha Line light rail
Purpose and Methodology: The authors of this report, which was produced by a research center
at the University of Minnesota, explored three questions, relative to the implementation of the first
light rail light in the Twin Cities: 1) What are the impacts on property values of proximity to a
station? 2) How have land-uses changed around stations? and 3) What are the impacts of the
transit stations on the level of housing investment within the corridor?
For the first question, sales data was evaluated to determine the relative change in prices
between a period the preceded transit service (1997-2004) and one that followed (2004-2005).
Six station areas located south of downtown, but north of a concentration of large institutional uses
near Minneapolis’s southern boundary, were compared to a designated comparison market area
of southeast Minneapolis. They were also compared internally, with areas west of the transit line
(primarily residential in character) to areas east of the transit line (primarily industrial in nature
and separated by an elevated highway). In response to the second question, land use patterns
were examined over the entire corridor to determine how this variable changed in response to
light rail service. Finally, to address the third question, building permits data was evaluated in the
same geographies and time periods determine the level of housing investment.
HR&A Advisors, Inc. Comparative Return on Investment Study | 81

Key Findings:
There has been a significant amount of new housing construction immediately adjacent to
the Hiawatha Line since 1997; 183 percent more than would be expected given rates of
new construction throughout the southeast Minneapolis sub-market. In total, there were 67
residential properties constructed within 300 feet of the light rail tracks after funding for
the project was announced in 1997.
Permit activity within a quarter mile of the Franklin Avenue station, the Lake Street station,
and the V.A. station were all well above the sub-market rate for the 2000-2007 period.
The authors note that station-area planning and rezoning efforts by the City of
Minneapolis were completed first for the Franklin Avenue and Lake Street station areas.
Thus, the greater rate of investment reflected in permit activity may due in part to the
plans and to accompanying increases in permissible development.
Prior to light rail service, single family homes within a half-mile radius of the station areas
sold for 16.4 percent lower than homes sold in the larger southeast Minneapolis sub-
market. After 2004, this relationship flipped, with single family homes within station areas
selling for 4.2 percent more than homes in the comparison area.
For single family residential properties in station areas west of the Hiawatha Line, a
location closer to the LRT stations was associated with higher property values, an effect
that extends beyond a half-mile. There was also a negative, nuisance effect for properties
that were very close to the LRT tracks. However, that effect was of a smaller magnitude
than the positive, accessibility effects.
Properties on the east side of the Hiawatha Line did not demonstrate any price premiums
due to proximity to the line. The authors note that this is likely due to the intervening
effect of the four-lane Hiawatha Avenue and the strip of industrial land use immediately
adjacent to the highway on the east.
Single-family homes in station areas command an approximately 3 percent price premium
over the median sales price in the market area (equivalent to $5,229 price premium).
Multifamily properties in station areas command an approximately 9 percent price
premium over the median sales price in the market area (equivalent to a $15,755 price
premium).
Development of the Hiawatha Light Rail Line has produced an average $15,755 price
premium per multifamily property in the station areas. If this premium is applied to all
multifamily properties in the station areas, the Hiawatha Line would produce an
aggregate premium of $17.7 million.
Relevance to Columbia Pike Transit Service:
As Columbia Pike lacks the type of noxious uses that hindered impacts on the east side of
the Hiawatha Line, real estate development impacts and value premiums to both single-
family and multi-family homes of the sort catalyzed by the Hiawatha Line should be
largely applicable to both sides of Columbia Pike.
HR&A Advisors, Inc. Comparative Return on Investment Study | 82

Appendix 2- Case Studies: Impacts of Similar Transit Modes
To inform its assessment of the comparative return on investment (ROI) of streetcar versus enhanced bus
along the Columbia Pike corridor, HR&A conducted in-depth case studies of four transit services (two
streetcars and two enhanced buses) with characteristics most similar to the service possible along Columbia
Pike. These case studies complement the literature review with more in-depth discussions of the specific
ways in which the most comparable transit investments have influenced real estate dynamics– including
property values, the quantity and pace of development, and quality of place-making.
The four precedent four case studies evaluated by HR&A are described in Figure A-2, including their real
estate development impacts and similarities and differences from the Columbia Pike transit corridor.
HR&A Advisors, Inc. Comparative Return on Investment Study | 83
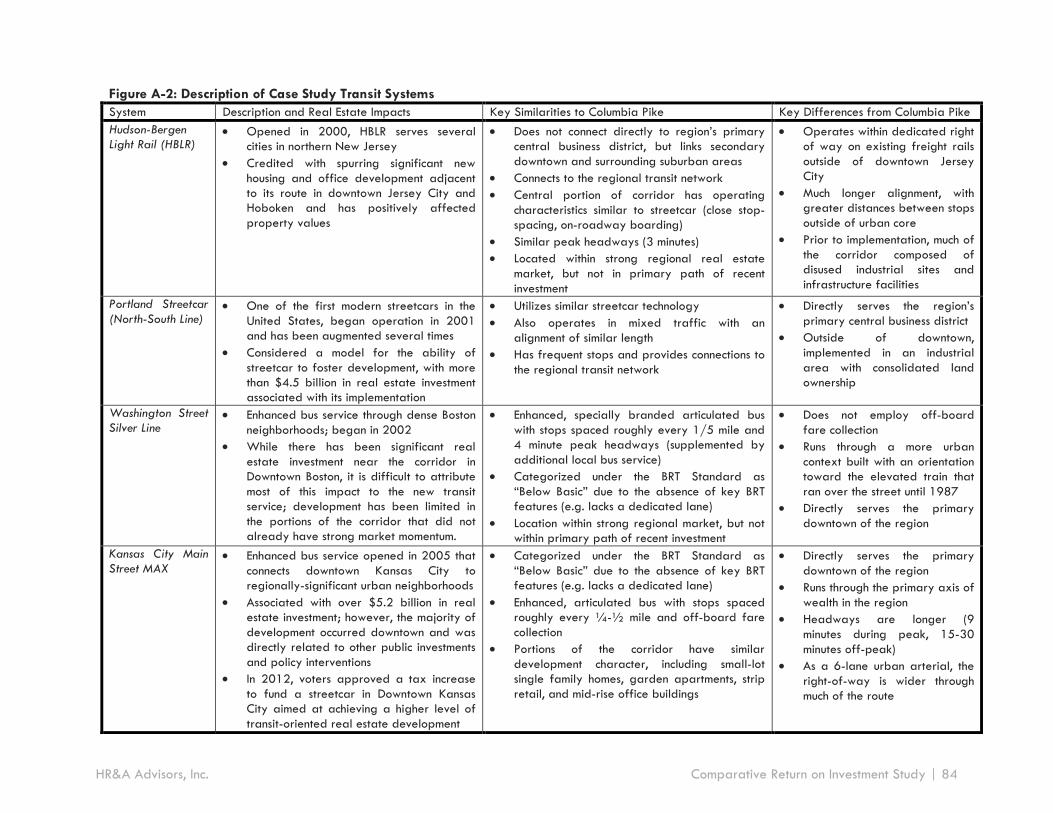
Figure A-2: Description of Case Study Transit Systems System Description and Real Estate Impacts Key Similarities to Columbia Pike Key Differences from Columbia Pike Hudson-Bergen Light Rail (HBLR)
• Opened in 2000, HBLR serves several cities in northern New Jersey
• Credited with spurring significant new housing and office development adjacent to its route in downtown Jersey City and Hoboken and has positively affected property values
• Does not connect directly to region’s primary central business district, but links secondary downtown and surrounding suburban areas
• Connects to the regional transit network • Central portion of corridor has operating
characteristics similar to streetcar (close stop-spacing, on-roadway boarding)
• Similar peak headways (3 minutes) • Located within strong regional real estate
market, but not in primary path of recent investment
• Operates within dedicated right of way on existing freight rails outside of downtown Jersey City
• Much longer alignment, with greater distances between stops outside of urban core
• Prior to implementation, much of the corridor composed of disused industrial sites and infrastructure facilities
Portland Streetcar (North-South Line)
• One of the first modern streetcars in the United States, began operation in 2001 and has been augmented several times
• Considered a model for the ability of streetcar to foster development, with more than $4.5 billion in real estate investment associated with its implementation
• Utilizes similar streetcar technology • Also operates in mixed traffic with an
alignment of similar length • Has frequent stops and provides connections to
the regional transit network
• Directly serves the region’s primary central business district
• Outside of downtown, implemented in an industrial area with consolidated land ownership
Washington Street Silver Line
• Enhanced bus service through dense Boston neighborhoods; began in 2002
• While there has been significant real estate investment near the corridor in Downtown Boston, it is difficult to attribute most of this impact to the new transit service; development has been limited in the portions of the corridor that did not already have strong market momentum.
• Enhanced, specially branded articulated bus with stops spaced roughly every 1/5 mile and 4 minute peak headways (supplemented by additional local bus service)
• Categorized under the BRT Standard as “Below Basic” due to the absence of key BRT features (e.g. lacks a dedicated lane)
• Location within strong regional market, but not within primary path of recent investment
• Does not employ off-board fare collection
• Runs through a more urban context built with an orientation toward the elevated train that ran over the street until 1987
• Directly serves the primary downtown of the region
Kansas City Main Street MAX
• Enhanced bus service opened in 2005 that connects downtown Kansas City to regionally-significant urban neighborhoods
• Associated with over $5.2 billion in real estate investment; however, the majority of development occurred downtown and was directly related to other public investments and policy interventions
• In 2012, voters approved a tax increase to fund a streetcar in Downtown Kansas City aimed at achieving a higher level of transit-oriented real estate development
• Categorized under the BRT Standard as “Below Basic” due to the absence of key BRT features (e.g. lacks a dedicated lane)
• Enhanced, articulated bus with stops spaced roughly every ¼-½ mile and off-board fare collection
• Portions of the corridor have similar development character, including small-lot single family homes, garden apartments, strip retail, and mid-rise office buildings
• Directly serves the primary downtown of the region
• Runs through the primary axis of wealth in the region
• Headways are longer (9 minutes during peak, 15-30 minutes off-peak)
• As a 6-lane urban arterial, the right-of-way is wider through much of the route
HR&A Advisors, Inc. Comparative Return on Investment Study | 84
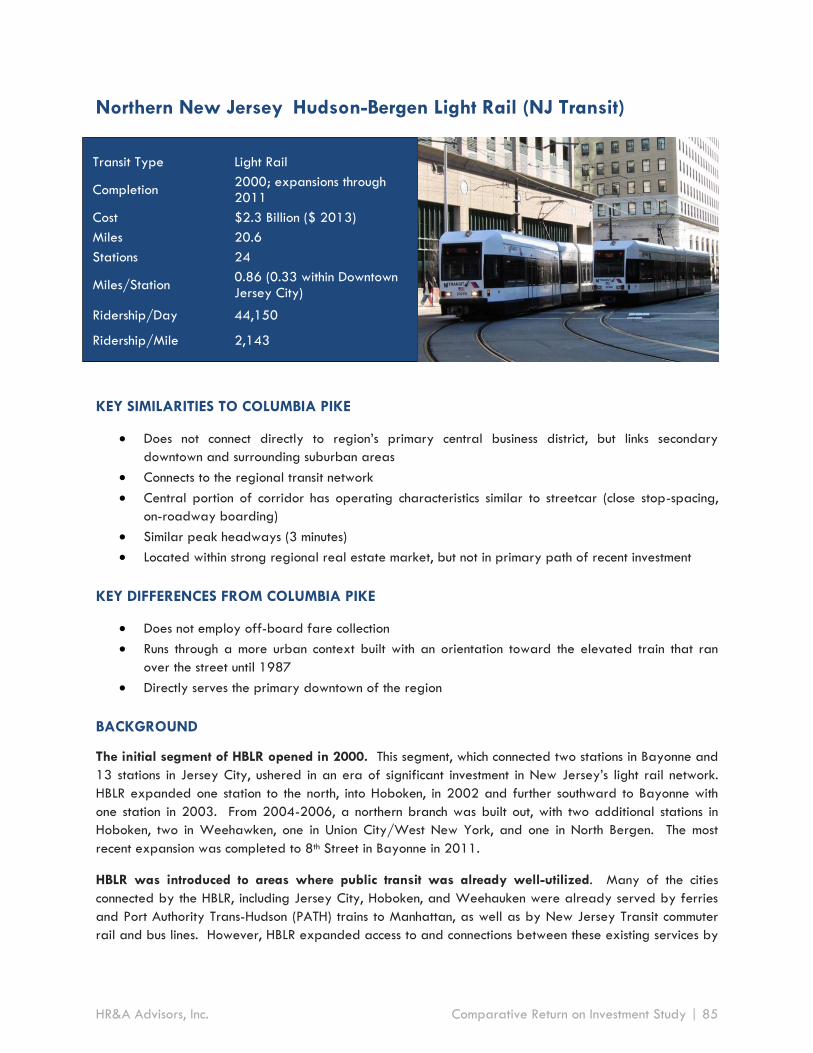
Northern New Jersey Hudson-Bergen Light Rail (NJ Transit)
KEY SIMILARITIES TO COLUMBIA PIKE
Does not connect directly to region’s primary central business district, but links secondary
downtown and surrounding suburban areas
Connects to the regional transit network
Central portion of corridor has operating characteristics similar to streetcar (close stop-spacing,
on-roadway boarding)
Similar peak headways (3 minutes)
Located within strong regional real estate market, but not in primary path of recent investment
KEY DIFFERENCES FROM COLUMBIA PIKE
Does not employ off-board fare collection
Runs through a more urban context built with an orientation toward the elevated train that ran
over the street until 1987
Directly serves the primary downtown of the region
BACKGROUND
The initial segment of HBLR opened in 2000. This segment, which connected two stations in Bayonne and
13 stations in Jersey City, ushered in an era of significant investment in New Jersey’s light rail network.
HBLR expanded one station to the north, into Hoboken, in 2002 and further southward to Bayonne with
one station in 2003. From 2004-2006, a northern branch was built out, with two additional stations in
Hoboken, two in Weehawken, one in Union City/West New York, and one in North Bergen. The most
recent expansion was completed to 8th Street in Bayonne in 2011.
HBLR was introduced to areas where public transit was already well-utilized. Many of the cities
connected by the HBLR, including Jersey City, Hoboken, and Weehauken were already served by ferries
and Port Authority Trans-Hudson (PATH) trains to Manhattan, as well as by New Jersey Transit commuter
rail and bus lines. However, HBLR expanded access to and connections between these existing services by
Transit Type Light Rail
Completion 2000; expansions through 2011
Cost $2.3 Billion ($ 2013)
Miles 20.6
Stations 24
Miles/Station 0.86 (0.33 within Downtown Jersey City)
Ridership/Day 44,150
Ridership/Mile 2,143
HR&A Advisors, Inc. Comparative Return on Investment Study | 85

providing a rapid connection from outlying areas of Hudson County. High density new development has
occurred and is planned at nodes that were disconnected from these services prior to HBLR. In addition,
by establishing Jersey City and Hoboken as core transit centers (instead of merely the “ends” of lines from
Manhattan), HBLR supported their development as the premier high-density employment, entertainment,
and residential districts in the sub-region.
HBLR stations were implemented in a diverse range
of urban contexts. From Pavonia/Newport to Jersey
Avenue, HBLR runs through downtown Jersey City, with
the majority of track lain either within or directly
adjacent to existing streets. With stations spaced only
1/3 mile apart in this section, HBLR functions like a
streetcar, running through an urban area with large
tracts of underutilized land. Throughout the rest of the
system, HBLR primarily runs on existing rail right-of-
way and functions more like a commuter light rail. In
Hoboken and Bayonne, stations are roughly ¾ mile
apart and located near core commercial areas.
Stations in southern Jersey City, Weehauken, and
North Bergen are somewhat isolated and function
primarily as park-and-rides (though Port Imperial and
Lincoln Harbor also have ferry connections). Finally,
Bergenline Avenue, the system’s sole underground
station, is located in a fully developed commercial
area.
HBLR was developed through an innovative design-
build-operate-maintain contract. In exchange for a
fixed construction budget and annual fee paid by NJ
Transit, its operator took responsibility for all costs
related to design, construction, and on-going
operations and maintenance. The funding for HBLR’s
construction came from a combination of FTA New
Starts grants, State Transportation Trust Fund grants
(from motor fuel tax receipts), and bonds backed by the expectation of future fare revenue.
REAL ESTATE IMPACTS AND IMPLICATIONS FOR ARLINGTON
New TOD has been most prevalent in downtown Jersey City, where HBLR functions like a streetcar.
Between 2000 (when HBLR began service) and 2007, 4,265 new units of housing with an estimated value
of $2.3 billion were developed within ¼ of the Jersey Avenue, Marin Boulevard, Essex Street Stations.
This does not include the additional 5,333 housing units or 4.5 million square feet of commercial space
planned for the Liberty Harbor project that spans 28 blocks adjacent to those stations, or the large
increment of development near Pavonia/Newport, Harsimus Cove, Harborside, or Exchange Place stations.
The Liberty Harbor project, located on an 80-acre brownfield site on the north bank of the Morris Canal,
was designed with a network of small city-blocks, 8-acres of parks and open space, a new school, and
HR&A Advisors, Inc. Comparative Return on Investment Study | 86
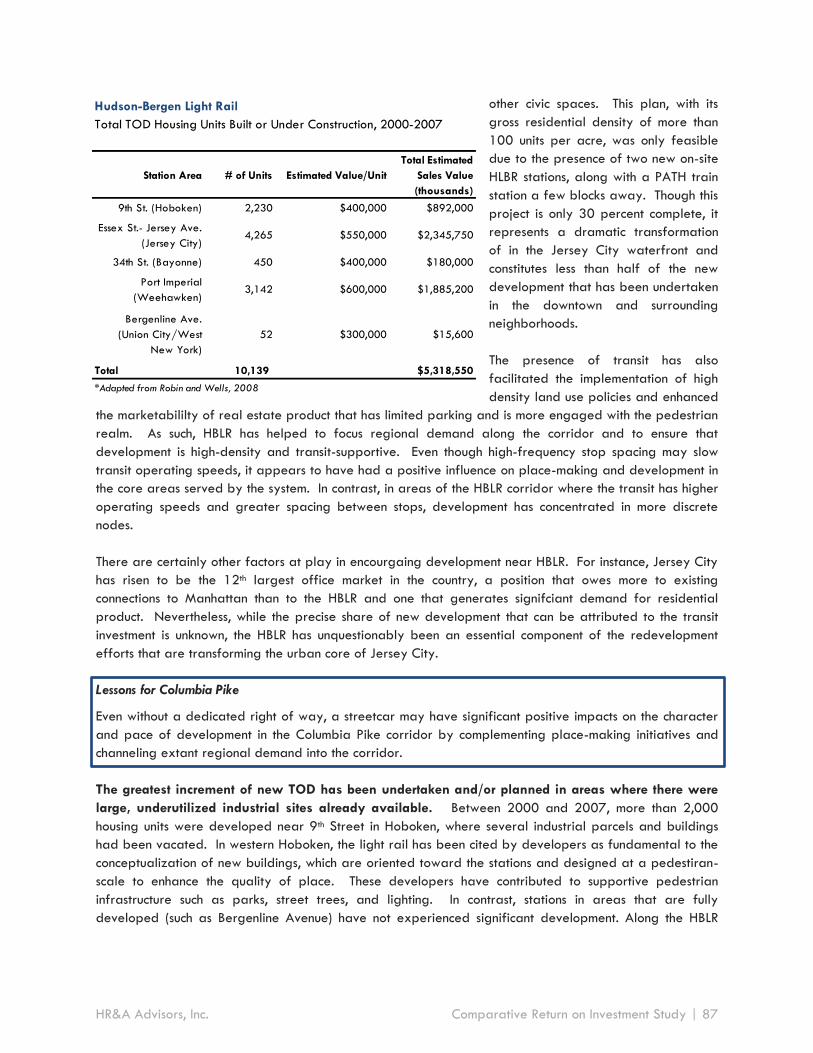
Hudson-Bergen Light Rail
Total TOD Housing Units Built or Under Construction, 2000-2007
Station Area # of Units Estimated Value/Unit
Total Estimated
Sales Value
(thousands)
9th St. (Hoboken) 2,230 $400,000 $892,000
Essex St.- Jersey Ave.
(Jersey City) 4,265 $550,000 $2,345,750
34th St. (Bayonne) 450 $400,000 $180,000
Port Imperial
(Weehawken) 3,142 $600,000 $1,885,200
Bergenline Ave.
(Union City/West
New York)
52 $300,000 $15,600
Total 10,139 $5,318,550
*Adapted from Robin and Wells, 2008
other civic spaces. This plan, with its
gross residential density of more than
100 units per acre, was only feasible
due to the presence of two new on-site
HLBR stations, along with a PATH train
station a few blocks away. Though this
project is only 30 percent complete, it
represents a dramatic transformation
of in the Jersey City waterfront and
constitutes less than half of the new
development that has been undertaken
in the downtown and surrounding
neighborhoods.
The presence of transit has also
facilitated the implementation of high
density land use policies and enhanced
the marketabililty of real estate product that has limited parking and is more engaged with the pedestrian
realm. As such, HBLR has helped to focus regional demand along the corridor and to ensure that
development is high-density and transit-supportive. Even though high-frequency stop spacing may slow
transit operating speeds, it appears to have had a positive influence on place-making and development in
the core areas served by the system. In contrast, in areas of the HBLR corridor where the transit has higher
operating speeds and greater spacing between stops, development has concentrated in more discrete
nodes.
There are certainly other factors at play in encourgaing development near HBLR. For instance, Jersey City
has risen to be the 12th largest office market in the country, a position that owes more to existing
connections to Manhattan than to the HBLR and one that generates signifciant demand for residential
product. Nevertheless, while the precise share of new development that can be attributed to the transit
investment is unknown, the HBLR has unquestionably been an essential component of the redevelopment
efforts that are transforming the urban core of Jersey City.
Lessons for Columbia Pike
Even without a dedicated right of way, a streetcar may have significant positive impacts on the character
and pace of development in the Columbia Pike corridor by complementing place-making initiatives and
channeling extant regional demand into the corridor.
The greatest increment of new TOD has been undertaken and/or planned in areas where there were
large, underutilized industrial sites already available. Between 2000 and 2007, more than 2,000
housing units were developed near 9th Street in Hoboken, where several industrial parcels and buildings
had been vacated. In western Hoboken, the light rail has been cited by developers as fundamental to the
conceptualization of new buildings, which are oriented toward the stations and designed at a pedestiran-
scale to enhance the quality of place. These developers have contributed to supportive pedestrian
infrastructure such as parks, street trees, and lighting. In contrast, stations in areas that are fully
developed (such as Bergenline Avenue) have not experienced significant development. Along the HBLR
HR&A Advisors, Inc. Comparative Return on Investment Study | 87
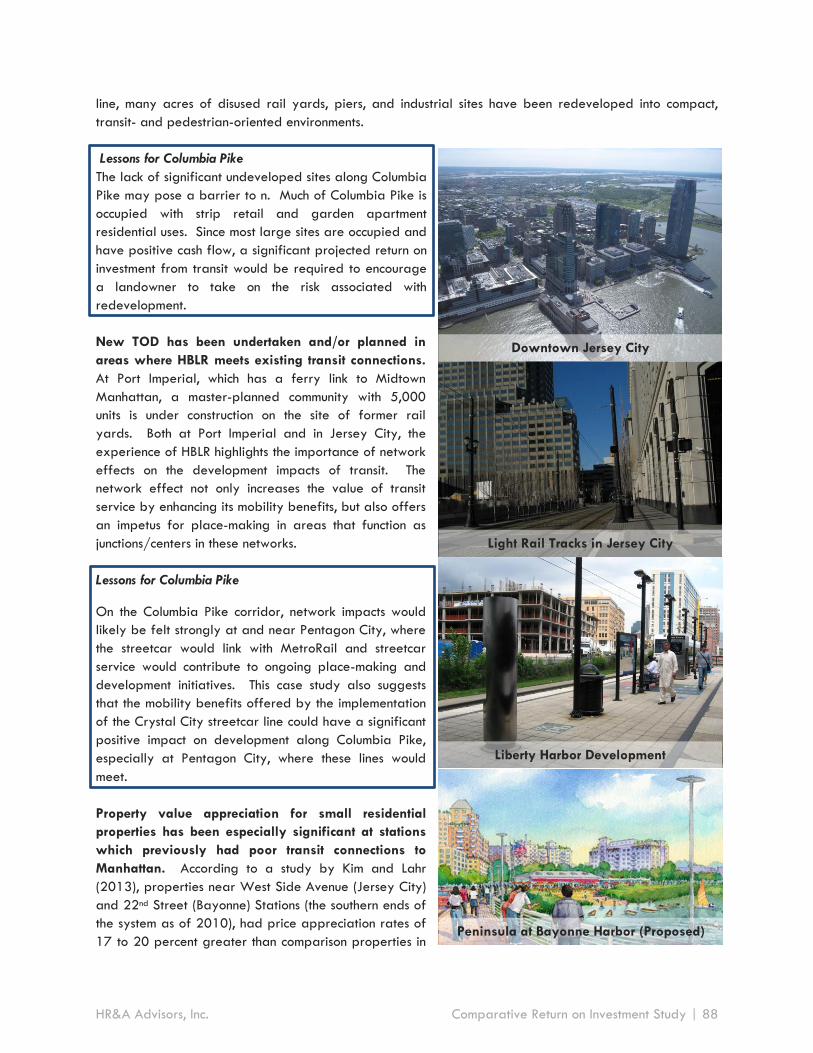
line, many acres of disused rail yards, piers, and industrial sites have been redeveloped into compact,
transit- and pedestrian-oriented environments.
Lessons for Columbia Pike
The lack of significant undeveloped sites along Columbia
Pike may pose a barrier to n. Much of Columbia Pike is
occupied with strip retail and garden apartment
residential uses. Since most large sites are occupied and
have positive cash flow, a significant projected return on
investment from transit would be required to encourage
a landowner to take on the risk associated with
redevelopment.
New TOD has been undertaken and/or planned in
areas where HBLR meets existing transit connections.
At Port Imperial, which has a ferry link to Midtown
Manhattan, a master-planned community with 5,000
units is under construction on the site of former rail
yards. Both at Port Imperial and in Jersey City, the
experience of HBLR highlights the importance of network
effects on the development impacts of transit. The
network effect not only increases the value of transit
service by enhancing its mobility benefits, but also offers
an impetus for place-making in areas that function as
junctions/centers in these networks.
Lessons for Columbia Pike
On the Columbia Pike corridor, network impacts would
likely be felt strongly at and near Pentagon City, where
the streetcar would link with MetroRail and streetcar
service would contribute to ongoing place-making and
development initiatives. This case study also suggests
that the mobility benefits offered by the implementation
of the Crystal City streetcar line could have a significant
positive impact on development along Columbia Pike,
especially at Pentagon City, where these lines would
meet.
Property value appreciation for small residential
properties has been especially significant at stations
which previously had poor transit connections to
Manhattan. According to a study by Kim and Lahr
(2013), properties near West Side Avenue (Jersey City)
and 22nd Street (Bayonne) Stations (the southern ends of
the system as of 2010), had price appreciation rates of
17 to 20 percent greater than comparison properties in
Downtown Jersey City
Light Rail Tracks in Jersey City
Liberty Harbor Development
Peninsula at Bayonne Harbor (Proposed)
HR&A Advisors, Inc. Comparative Return on Investment Study | 88

the area, respectively. These two stations are relatively far from the employment centers of the region
and the HBLR represented a major accessibility improvement. In both of these cases, transit’s impact on
price appreciation is limited to a ¼ mile radius of the station areas. In contrast, homes near 9th Street in
Hoboken experienced noteworthy, but lesser price appreciation effects.
Lessons for Columbia Pike
This experience suggests that the greater the distance a parcel is from existing transit facility (the
Pentagon City Metro station), the greater the relative value of the accessibility benefits associated with a
transit investment that provides a link to that node. Therefore, on a percentage basis, property value
increases may most significant at the southwestern end of the corridor (e.g. near Skyline and the southern
end of Columbia Pike), where the new transit represents the most significant improvement in accessibility.
Transit-oriented “mega-projects” have been strongly affected by the regional real estate market. Much
of the commercial development along the corridor was spurred by spillover demand from Manhattan,
especially after the 9/11 attacks. The strong transit connectivity of Jersey City, including HBLR, helped
give Hudson County a competitive advantage over other potential submarkets. However, after the
deflation of the housing bubble in 2008, much of the large scale development stalled. At 34th Street,
where the 430-acre Military Ocean Terminal at Bayonne was decommissioned in 1999, a major new
development was planned that included 6,700 new units of housing. However, to date only 450 units have
been developed, the Bayonne Redevelopment Authority has been dissolved, and 130 acres of the land
have been transferred to the Port Authority of New York and New Jersey, which has focused on
expanding cruise ship and container port facilities on the site.
Lessons for Columbia Pike
To the extent the Washington DC real estate market remains strong, transit investment along Columbia
Pike will make Arlington more competitive in capturing regional market demand. However, transit alone
does not create regional market demand and large, capital-intensive projects are especially vulnerable to
shifts in market cycles.
Public investment and regulatory policies have helped to spur private development. At 9th Street in
Hoboken, successful development is partly attributed to the development of a public elevator that connects
to the neighborhoods directly to the west which are at a much higher elevation. At Port Imperial, $44
million was invested in improvement to the ferry facilities, which helped reinforce the importance of the
neighborhood’s multimodal transit center. Finally, subsidies associated with Jersey City’s Urban Enterprise
Zones, conducive land-use policies, and tax abatements in Redevelopment Areas were significant factors in
attracting development to the corridor.
Lessons for Columbia Pike
The success of investment in transit improvements along Columbia Pike will depend on public policies that
promote transit-oriented development. Such policies, plans, and infrastructure improvements have been
critical to the advancement of Arlington’s Rosslyn-Ballston corridor into a national model for transit-
oriented development.
(as of 2007)
HR&A Advisors, Inc. Comparative Return on Investment Study | 89

KEY METRICS
At peripheral stations, homes appreciated at an average annual rate of 18.4 percentage points
higher than other properties; this effect diminished as distance increased from stations and was
fully extinguished after 400 meters.
At five HBLR stations, 10,139 new housing units worth a total of $5.3 billion were developed from
2000-2007.
KEY LESSONS FOR ARLINGTON
Along HBLR, new development occurred in greatest volume where the transit had running speeds
and stop-spacing similar to streetcar. HBLR critically supported urban place-making strategies in
these core areas. This suggests the potential for a strong development impact for streetcar along
Columbia Pike, despite the lack of a dedicated lane.
Columbia Pike lacks the kind of large, industrial sites that were key locations for development
along the HBLR. These site conditions may limit and/or slow new development along the corridor.
Nevertheless, the surface parking lots and low density commercial uses located along the
proposed transit alignment may offer opportunities for in-fill development.
Network impacts are critical: strong connections to Metrorail and to additional lines in a streetcar
system (such as the one proposed for the Crystal City corridor) will enhance the development
impacts of enhanced transit along the Columbia Pike corridor.
Property value increases owing to new transit service may be greatest for the most remote parts
of the corridor, where the change in perceived accessibility is greatest.
A visible transit investment along Columbia Pike will make Arlington and Fairfax more competitive
in capturing regional market demand in the DC metro area.
The ability of enhanced transit to impact development will be influenced by the strength of
supporting policies and public investments, such as those already deployed by Arlington County.
SOURCES
Federal Transit Administration. “Project Profiles: Hudson-Bergen Light Rail,”
http://www.fhwa.dot.gov/ipd/project_profiles/nj_hudson_bergen.htm
Fitzsimmons and Birch. “Hudson-Bergen Light Rail System and Economic Development on the Waterfront.”
Transportation Research Circulator E-C058: 9th Annual National Light Rail Transit Conference, 2003.
Kim and Lahr. “The Impact of Hudson-Bergen Light Rail on Residential Property Appreciation.” Papers in
Regional Science, 2013.
Martin. “Developing a ‘Final Frontier’ of Hoboken.” The New York Times, 2010,
http://www.nytimes.com/2010/12/19/realestate/19njzo.html?_r=0
New Jersey Transit. “Rail Transit as an Economic Development Tool: Potential Effect on the Hudson River
Waterfront,” 1993.
New Jersey Transit Department of Capital Planning and Programs. “Hudson-Bergen Light Rail,” 2006,
http://www.njtransit.com/tm/tm_servlet.srv?hdnPageAction=Project001To
HR&A Advisors, Inc. Comparative Return on Investment Study | 90

Robins and Wells. “Land Development at Selected Hudson-Bergen Light Rail Stations.” Alan M. Vorhees
Transportation Center, Edward J. Bloustein School of Planning and Public Policy, Rutgers University, 2008.
IMAGE SOURCES
GK tramrunner229. Wikipedia Commons,
http://commons.wikimedia.org/wiki/File:HBLR_at_Hudson_and_Grand_Streets,_Jersey_City.jpg
Gryffindor. Wikipedia Commons, http://en.wikipedia.org/wiki/File:Jersey_City.JPG
Hudson County Economic Development Corporation. RFP- The Peninsula at Bayonne Harbor,
http://hudsonedc.org/rfp-the-peninsula-at-bayonne-harbor/
Jim.henderson. Wikipedia Commons,
http://commons.wikimedia.org/wiki/File:Jersey_Av_HBLR_platform_jeh.JPG
Kmf164. Wikipedia Commons,
http://commons.wikimedia.org/wiki/File:Hudson_bergen_exchange_place.jpg
McConnell, Robert. Wikipedia Commons, http://en.wikipedia.org/wiki/File:Hudson-
Bergen_Light_Rail_map.png
Jim.henderson. Wikipedia Commons,
http://commons.wikimedia.org/wiki/File:Jersey_Av_HBLR_platform_jeh.JPG
HR&A Advisors, Inc. Comparative Return on Investment Study | 91

Portland Streetcar, North-South Line
KEY SIMILARITIES TO COLUMBIA PIKE
• Utilizes similar streetcar technology
• Also operates in mixed traffic with an alignment of similar length
• Has frequent stops and provides connections to the regional transit network
KEY DIFFERENCES FROM COLUMBIA PIKE
• Directly serves the region’s primary central business district
• Outside of downtown, implemented in an industrial area with consolidated land ownership
BACKGROUND
The Portland Streetcar opened in 2001, adding a north-south axis to the rail network in Portland’s
downtown, which was already served by the east-west-running MAX light rail lines. At its ends, the
streetcar connects Portland State University to the south of downtown with the Pearl District and Nob Hill
north of downtown. This initial segment was 2.4 miles from end-to-end, consisting of a 4.8 mile single-track
loop. In 2005 and 2007, this line was extended an additional 1.5 miles to the South Waterfront area.
The streetcar was implemented through several areas that were rich in disused, underutilized, and
vacant lands with consolidated ownership. Prior to the 1990s, the Pearl District was largely composed
of warehouses, light industry, and rail yards. In the 1980s and 1990s, the Pearl District attracted the
interest of artists, who were drawn by the availability of inexpensive warehouse space for use as
live/work studios, and developers began to invest in small-scale industrial conversion projects. This
burgeoning neighborhood change drew the attention of both planners and large-scale developers. Homer
Williams acquired the 34-acre Hoyt Street Yards and redeveloped the property with more than 3,000
housing units and 200,000 square feet of commercial space. He was also an early booster and negotiator
for the implementation of Portland Streetcar. Later, Gerding Edlen purchased the 4.6 acre Henry
Weinhard Brewery Complex and redeveloped it into a 1.6 million square foot mixed-use development
that includes a 15-story residential tower.
CONTEXT
Transit Type Streetcar
Completion 2001; expansions through 2007
Cost $129 Million ($2013)
Miles 3.9
Stations 25
Miles/Station 0.16
Ridership/Day 12,500
Ridership/Mile 3,205
HR&A Advisors, Inc. Comparative Return on Investment Study | 92

The South Waterfront, another area
substantially composed of abandoned
industrial sites and warehouses, was also
already attracting development interest prior
to the implementation of the streetcar.
However, because the site was isolated from
the rest of the city by topography and
highway infrastructure, these early
redevelopment projects were substantially
self-contained and oriented toward marina
uses. As plans emerged to extend the
streetcar through the area, Homer Williams
acquired 38-acres of the 130-acre South
Waterfront redevelopment district. As the
streetcar was extended through the area in
2005 and 2007, and an aerial tram was
constructed to connect the area to the main
campus of Oregon Health Sciences University,
an ambitious transit-oriented development
program commenced. To date, more than
2,000 new housing units, ground-floor retail, a
hotel, and a 400,000 square foot health
sciences research facility have been
developed. Three residential towers were
constructed in anticipation of the streetcar,
while another seven have been developed
since; plans for additional high-rise buildings
of up to 35 stories are being pursued. The
program animates the pedestrian experience
through wide sidewalks, street trees, and other
plantings. In 2015, a new light rail bridge will
connect the district to Portland’s Eastside,
further enhancing accessibility to the area.
The tax increment collected from the urban
renewal area was used to fund new streets
and two new parks totaling 6-acres.
The streetcar’s construction and operation
has been funded through an innovative partnership between private landowners, the City of Portland,
and Tri-County Metropolitan Transportation District of Oregon (Tri-Met). The $19.4 million contributed
by landowners through the creation of a Local Improvement District represented 19 percent of the total
construction budget and was one of the central features of the Portland Streetcar’s development. Other
major sources included $28.6 million (28 percent) from the issuance of bonds backed by parking revenues,
$21.5 million (21 percent) from tax-increment financing, $10 million from contributions by the regional
planning agency (10 percent), and $8.8 million (8 percent) from the City of Portland. A non-profit
organization, Portland Streetcar, Inc., was created to design, build, operate, and maintain the streetcar.
Its ongoing operations are funded primarily by Tri-Met and the City of Portland.
HR&A Advisors, Inc. Comparative Return on Investment Study | 93

REAL ESTATE IMPACTS AND IMPLICATIONS FOR ARLINGTON
The impact of the streetcar on both development and property values have has been very strong,
especially on parcels directly adjacent to the line. A 2005 study by E.D. Hovee and Company examined
development along the then-operational segment of the streetcar line, assessing the degree to which the
permitted land-use envelope was utilized by developers. The study included a comparison of the
development patterns prior to 1997 (when the streetcar alignment was chosen) to the new development
that occurred after 1997. The study found that, prior to 1997, buildings within one block of the streetcar
alignment utilized approximately 34 percent of their allowable FAR; development that occurred after
1997 utilized an average of 90 percent of the allowable FAR. The authors suggest that this is evidence
that the streetcar changed the real estate economics of the adjacent blocks such that it became profitable
to build more densely. However, this effect faded with distance from the streetcar; there was no change in
use of allowable FAR for parcels that are more than three blocks from the transit. This finding attests to
the importance of the transit service’s visibility in promoting redevelopment.
This complements a 2009 study by RCLCO, HDR, Reconnecting America, and the Brookings Institution. That
study also assessed the impact of the streetcar and found that property value impacts were strong in the
Pearl District and Nob Hill. However, these property value increases were somewhat more diffuse
throughout these areas. In each period examined, (1997-2003 and 2003-2008), the greatest factor
influencing property value increases were was not proximity to transit, but instead whether or not the
parcel had been redeveloped during that period. However, property value increases were strong even on
those parcels that were not redeveloped, including in Nob Hill (where there was not significant up-zoning),
suggesting that there was a significant impact on land value. Existing (not redeveloped) single-family
homes along the portion of the corridor north of the CBD, increased in value by 182 percent from 1997-
2008; this is significantly greater that the growth of these properties citywide (136 percent) over this
period. Similar growth premiums were found for multifamily housing (205 percent growth near the
streetcar versus 118 percent growth citywide) and commercial properties (231 percent versus 130 percent
growth, respectively).
Lessons for Columbia Pike
This research suggests that the Columbia Pike Streetcar has the potential to catalyze significant
development and property value impacts. The development potential will likely be realized most strongly
on parcels nearest to the streetcar line. However, the property value increases may be felt over a much
wider area. While this offers an opportunity for wealth creation for property owners in the corridor and
will generate additional property tax revenues for the County, this may have consequences for those
households that cannot afford the increased tax burden.
The North-South streetcar line has been credited with spurring $4.5 billion worth of new development
in Portland. However, the streetcar’s impact on real estate is not explained primarily by its mobility
benefits. The Portland Streetcar has average running speeds of five miles per hour, comparable to the
local buses that operate in Portland’s downtown. While the specific route on which the streetcar operates
did not previously exist, the streetcar did not significantly shorten public transit commute times in the
neighborhoods that it serves. However, the new transit and related infrastructure raised the profile of the
Pearl District and South Waterfront and helped attract the attention of both developers and end-users.
Consequently, values have risen even on properties that have neither been redeveloped nor re-zoned.
Out of the 21 corridors studied in the Institute for Transportation & Development Policy’s report, “More
HR&A Advisors, Inc. Comparative Return on Investment Study | 94
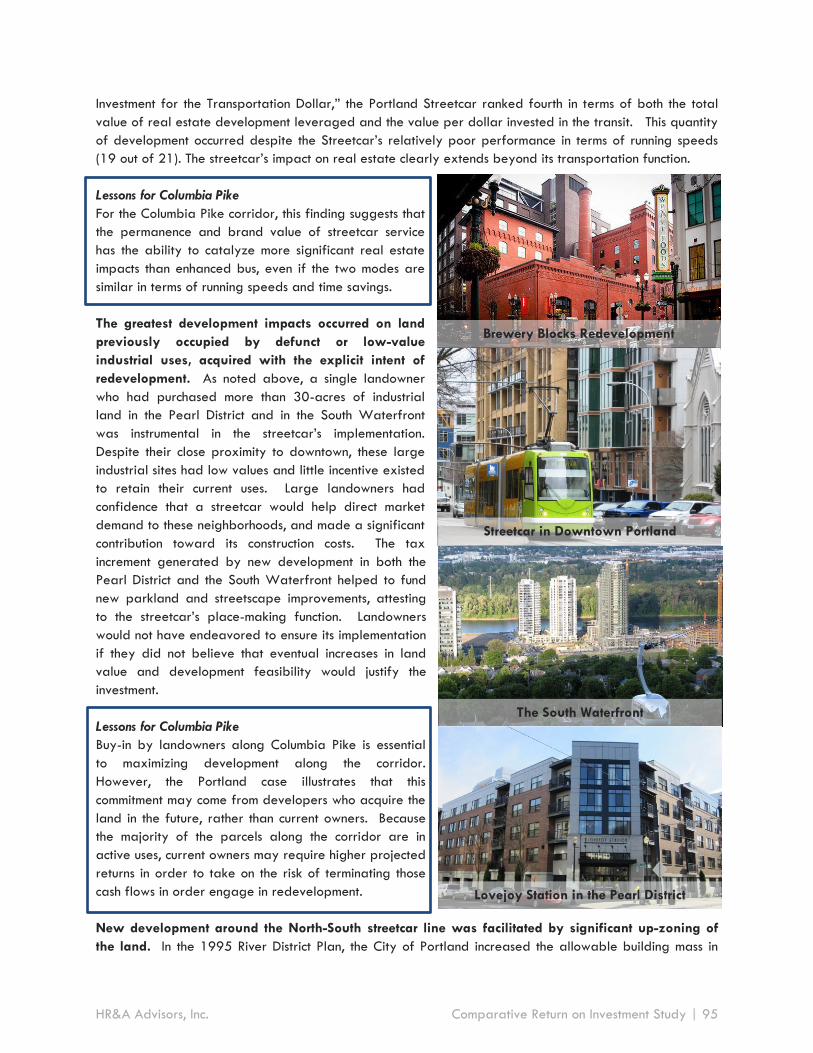
Investment for the Transportation Dollar,” the Portland Streetcar ranked fourth in terms of both the total
value of real estate development leveraged and the value per dollar invested in the transit. This quantity
of development occurred despite the Streetcar’s relatively poor performance in terms of running speeds
(19 out of 21). The streetcar’s impact on real estate clearly extends beyond its transportation function.
Lessons for Columbia Pike
For the Columbia Pike corridor, this finding suggests that
the permanence and brand value of streetcar service
has the ability to catalyze more significant real estate
impacts than enhanced bus, even if the two modes are
similar in terms of running speeds and time savings.
The greatest development impacts occurred on land
previously occupied by defunct or low-value
industrial uses, acquired with the explicit intent of
redevelopment. As noted above, a single landowner
who had purchased more than 30-acres of industrial
land in the Pearl District and in the South Waterfront
was instrumental in the streetcar’s implementation.
Despite their close proximity to downtown, these large
industrial sites had low values and little incentive existed
to retain their current uses. Large landowners had
confidence that a streetcar would help direct market
demand to these neighborhoods, and made a significant
contribution toward its construction costs. The tax
increment generated by new development in both the
Pearl District and the South Waterfront helped to fund
new parkland and streetscape improvements, attesting
to the streetcar’s place-making function. Landowners
would not have endeavored to ensure its implementation
if they did not believe that eventual increases in land
value and development feasibility would justify the
investment.
Lessons for Columbia Pike
Buy-in by landowners along Columbia Pike is essential
to maximizing development along the corridor.
However, the Portland case illustrates that this
commitment may come from developers who acquire the
land in the future, rather than current owners. Because
the majority of the parcels along the corridor are in
active uses, current owners may require higher projected
returns in order to take on the risk of terminating those
cash flows in order engage in redevelopment.
New development around the North-South streetcar line was facilitated by significant up-zoning of
the land. In the 1995 River District Plan, the City of Portland increased the allowable building mass in
The South Waterfront
Brewery Blocks Redevelopment
Streetcar in Downtown Portland
Lovejoy Station in the Pearl District
HR&A Advisors, Inc. Comparative Return on Investment Study | 95
much of the Pearl District to 6.0 Floor-Area Ratio (FAR). Likewise, in the 2002 South Waterfront Plan, the
FAR of the South Waterfront was raised to 6.0, with the potential to build up to FAR of 9.0 if floor area is
transferred from another parcel. In part, the presence of the streetcar provided justification for
significantly increasing allowable density, which attracted further developer interest because it allowed
developers to more fully capitalize on market demand. While the streetcar certainly helped to augment
market demand, accompanying zoning changes were essential to realizing the development impact.
Lessons for Columbia Pike
Supportive land use policies are essential to facilitating new development along Columbia Pike.
Arlington County has already up-zoned much of the land along the corridor in concert with a strong transit-
oriented development policy. The implementation of streetcar can help galvanize support for making use
of these polices.
KEY METRICS
As of 2005, parcels in the CBD and within one block of the streetcar alignment that had not been
redeveloped after 1997 utilized 34 percent of allowable FAR; parcels that had been
redeveloped after 1997 utilized an average of 90 percent of allowable FAR.
From 1997-2008, 55 percent of all new development within the CBD occurred within 1 block of
the streetcar alignment; prior to 1997, these parcels accounted for only 19 percent of the total
development within the CBD.
Existing (not redeveloped) single-family homes along the portion of the corridor north of the CBD, increased in value by 182 percent from 1997-2008; this is significantly greater than these growth experienced by these properties citywide (136 percent) over this period.
o Similar growth premiums were found for multifamily housing (205 percent growth near the streetcar versus 118 percent growth citywide) and commercial properties (231 percent versus 130 percent growth, respectively).
$4.5 billion has been invested in the corridor overall. This includes $3.5 billion within two blocks of
the streetcar alignment in the form of 10,212 new housing units and 5.4 million square feet of
office, institutional, retail and hotel construction.
KEY LESSONS FOR ARLINGTON
Streetcar has the ability to catalyze significant real estate impacts along the Columbia Pike
corridor. However, while land value impacts of the transit investment may be felt throughout the
corridor, new development is most likely on parcels directly facing the alignment.
The ability of transit investments to catalyze new development is not purely a function of their
transportation performance characteristics. In this regard, the visibility, perceived permanence,
and brand value of streetcar infrastructure carries greater development potential for Columbia
Pike than does an enhanced bus service with comparable speed, capacity, and frequency.
The ability for transit to induce new development depends greatly on the level of buy-in from the
development community: unless developers believe the transit investment will enhance land value in
an area and are willing to act on it, the investment won’t catalyze significant new redevelopment.
It is possible, however, that this buy-in will come not from current landowners, but from outside
HR&A Advisors, Inc. Comparative Return on Investment Study | 96

developers already focusing on transit-oriented development who seek to acquire land on the
corridor.
The presence of active, cash-flowing uses along Columbia Pike decreases the incentive for
landowners to engage in redevelopment. This may be a barrier to new development in the
corridor, but the premium conferred by streetcar can help overcome it.
Supportive land use policies and investments are critical to facilitating new development on
Columbia Pike. While Arlington has already implemented a strong transit-oriented development
policy, which includes many such policy measures, streetcar has greater potential to galvanize
support for further interventions than does enhanced bus.
SOURCES
Back. “River District has big plans for new housing.” Portland Business Journal, 2000,
http://www.bizjournals.com/portland/stories/2000/07/31/focus2.html?page=all
Brookings Institution. “Value Capture and Tax-Increment Financing Options for Streetcar Construction,” 2009. City of Portland. Municipal Code, Chapter 33.510: Central City Plan District,
http://www.portlandonline.com/shared/cfm/image.cfm?id=53363
City of Portland. “University District and River District Plans,” 1995,
http://www.portlandoregon.gov/bps/article/113040
City of Portland. “Zoning Code for the South Waterfront,” 2003,
http://www.portlandoregon.gov/bps/article/58750
Culverwell. “South Waterfront: The Failure that Wasn’t.” Portland Business Journal, 2013,
http://www.bizjournals.com/portland/print-edition/2013/08/16/south-waterfront-the-failure-
that.html?page=all
Golem and Smith-Heimer. “Transit Cooperative Research Program Synthesis 86: Relationships between Streetcars and the Built Environment.” Transportation Research Board, 2010. Hook, Lotshaw, and Weinstock. “More Development for your Transit Dollar: An Analysis of 21 North American Transit Corridors.” Institute for Transportation and Development Policy, 2013. Hovee and Jordan. “Streetcar-Development Linkage: The Portland Streetcar Loop,” 2008.
Jaquiss. “Homer’s Odyssey.” Willamette Week, 2003, http://www.wweek.com/portland/article-2307-homers_odyssey.html Jordan and Hovee. “Portland Streetcar Development Impacts,” 2005.
Office of Transportation of the City of Portland and Portland Streetcar, Inc. “Portland Streetcar:
Development Oriented Transit,” 2008.
Portland Streetcar. “Cost/Alignment Mile,”
http://www.portlandstreetcar.org/pdf/cost_per_alignment_mile_20120413.pdf
HR&A Advisors, Inc. Comparative Return on Investment Study | 97
IMAGE SOURCES
Another Believer. Wikipedia Commons,
http://commons.wikimedia.org/wiki/File:Lovejoy_Station,_Pearl_District,_Portland,_OR_2012.JPG
Cacaphony. Wikipedia Commons, http://commons.wikimedia.org/wiki/File:PortlandStreetcar5.jpg
Eytan, Ted. Flickr. http://www.flickr.com/photos/taedc/5935230109/
McCarthy, Eric. Flickr, http://www.flickr.com/photos/limulus/563914543/
Portland Streetcar. http://www.portlandstreetcar.org/node/4
Stevens, M.O. Wikipedia Commons,
http://commons.wikimedia.org/wiki/File:Portland_Streetcar_green.JPG
HR&A Advisors, Inc. Comparative Return on Investment Study | 98

Washington Street Silver Line (Boston, MBTA)
KEY SIMILARITIES TO COLUMBIA PIKE
Enhanced, specially branded articulated bus with stops spaced roughly every 1/5 mile and 4
minute peak headways (supplemented by additional local bus service)
Categorized under the BRT Standard as “Below Basic” due to the absence of key BRT features
(e.g. lacks a dedicated lane)
Location within strong regional market, but not within primary path of recent investment
KEY DIFFERENCES FROM COLUMBIA PIKE
Does not employ off-board fare collection
Runs through a more urban context built with an orientation toward the elevated train that ran
over the street until 1987
Directly serves the primary downtown of the region
BACKGROUND
The Washington Street Silver Line was constructed as a replacement for the Orange Line, which ran as
an elevated train along the corridor until it was demolished and relocated in 1987. Many advocating
on behalf of the primarily low-income and transit-dependent populations along the Washington Street
corridor reacted negatively to the bus service planned as a replacement for the rail infrastructure. While
the removal of the elevated rail eliminated a perceived source of neighborhood blight, residents
preferred new surface rail to be constructed in its place. The Federal Transit Administration rejected a an
application for funding light rail on Washington Street in 1992. Meanwhile, a constrained right-of-way
limited the potential to implement true BRT. The branding and enhanced features of the Silver Line, which
is included on the MBTA’s map of rapid transit lines, responded to demands for high quality transit service
on the corridor.
The Washington Street Silver Line has some but not all of the critical features of BRT. The Silver Line
has a dedicated lane outside of downtown, allowing it to meet greater performance standards than local
buses. However, aside from concrete and asphalt treatments on the road surface, there is limited
permanent infrastructure to distinguish the right-of-way of the Silver Line. Along most of its route, the bus
Transit Type Enhanced Bus/BRT
Completion 2002
Cost $142.8 Million ($ 2013)
Miles 2.2
Stations 13
Miles/Station 0.17
Ridership/Day 21,271
Ridership/Mile 9,669
HR&A Advisors, Inc. Comparative Return on Investment Study | 99
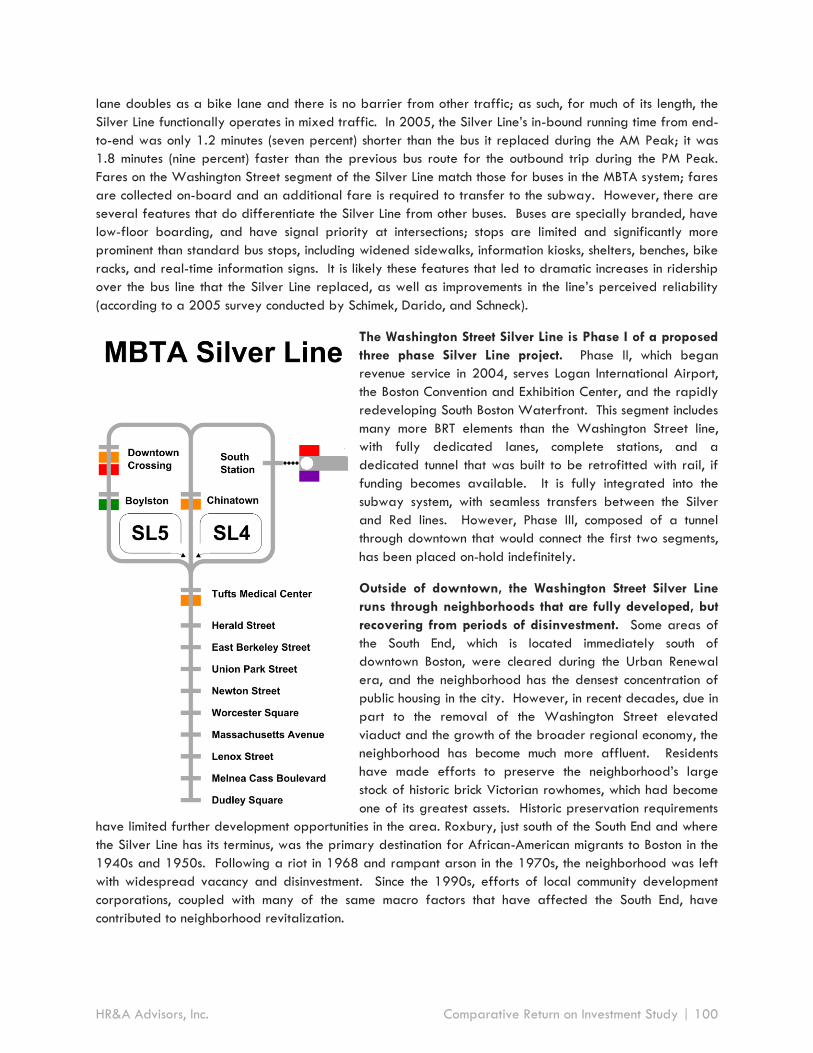
lane doubles as a bike lane and there is no barrier from other traffic; as such, for much of its length, the
Silver Line functionally operates in mixed traffic. In 2005, the Silver Line’s in-bound running time from end-
to-end was only 1.2 minutes (seven percent) shorter than the bus it replaced during the AM Peak; it was
1.8 minutes (nine percent) faster than the previous bus route for the outbound trip during the PM Peak.
Fares on the Washington Street segment of the Silver Line match those for buses in the MBTA system; fares
are collected on-board and an additional fare is required to transfer to the subway. However, there are
several features that do differentiate the Silver Line from other buses. Buses are specially branded, have
low-floor boarding, and have signal priority at intersections; stops are limited and significantly more
prominent than standard bus stops, including widened sidewalks, information kiosks, shelters, benches, bike
racks, and real-time information signs. It is likely these features that led to dramatic increases in ridership
over the bus line that the Silver Line replaced, as well as improvements in the line’s perceived reliability
(according to a 2005 survey conducted by Schimek, Darido, and Schneck).
The Washington Street Silver Line is Phase I of a proposed
three phase Silver Line project. Phase II, which began
revenue service in 2004, serves Logan International Airport,
the Boston Convention and Exhibition Center, and the rapidly
redeveloping South Boston Waterfront. This segment includes
many more BRT elements than the Washington Street line,
with fully dedicated lanes, complete stations, and a
dedicated tunnel that was built to be retrofitted with rail, if
funding becomes available. It is fully integrated into the
subway system, with seamless transfers between the Silver
and Red lines. However, Phase III, composed of a tunnel
through downtown that would connect the first two segments,
has been placed on-hold indefinitely.
Outside of downtown, the Washington Street Silver Line
runs through neighborhoods that are fully developed, but
recovering from periods of disinvestment. Some areas of
the South End, which is located immediately south of
downtown Boston, were cleared during the Urban Renewal
era, and the neighborhood has the densest concentration of
public housing in the city. However, in recent decades, due in
part to the removal of the Washington Street elevated
viaduct and the growth of the broader regional economy, the
neighborhood has become much more affluent. Residents
have made efforts to preserve the neighborhood’s large
stock of historic brick Victorian rowhomes, which had become
one of its greatest assets. Historic preservation requirements
have limited further development opportunities in the area. Roxbury, just south of the South End and where
the Silver Line has its terminus, was the primary destination for African-American migrants to Boston in the
1940s and 1950s. Following a riot in 1968 and rampant arson in the 1970s, the neighborhood was left
with widespread vacancy and disinvestment. Since the 1990s, efforts of local community development
corporations, coupled with many of the same macro factors that have affected the South End, have
contributed to neighborhood revitalization.
HR&A Advisors, Inc. Comparative Return on Investment Study | 100

The implementation of the Washington Street Silver Line was funded entirely through State and local
sources. The majority (75 percent) came from the Massachusetts Highway Fund, while the balance (25
percent) was derived from revenue from MBTA-issued bonds.
REAL ESTATE IMPACTS AND IMPLICATIONS FOR ARLINGTON
The implementation of the Silver Line has not had a
significant impact on development in the Washington
St. corridor outside of downtown. The Institute for
Transportation & Development Policy (ITDP) Report,
“More Development for your Transit Dollar,” estimates
that there was been $650 million of real estate
investment associated with the Washington Street Silver
Line as of 2013. However, the report notes that “the
[new development] observed for the Boston Washington
St corridor was by all accounts difficult to attribute to
the transit investment” (pg. 158). Moreover, this level of
investment places this segment of the Silver line in the
lower half of the 21 transit corridors surveyed in that
report in terms of development impacts. Schimek,
Darido, and Schneck (2005) estimate that, by value, 61
percent of development that occurred in the corridor
took place in downtown or Chinatown, where there was
already subway service; very little of the new
development (less than five percent) took place around
the terminus at Dudley Square. Much of the downtown
development is attributable to a redevelopment effort
on Avery Street (near Washington Street and
Chinatown), where a series of projects was developed
from 2000-2013 and included the Ritz-Carlton Hotel
and Residences (193-room hotel, 309 condominium units,
a 19-screen movie theatre, a fitness center, a
restaurant, and a salon) and the 256-unit Millennium
Place condominium tower. It is likely that most of that
$650 million in development cited by the ITDP Report
took place in Boston’s downtown.
Perk, Catala, and Reader (2012) also studies the land
use of parcels within a quarter mile of the Washington Street corridor between 2003 and 2009. They
found that a large number of parcels changed use to condominium, which was expected, given the growth
of the condominium product type throughout the Boston region during this time period. However, within this
corridor, the vast majority of these condos were small projects, occupying a single rowhouse parcel and
with no greater concentration closer to Washington Street. There were a small number of larger projects
(less than 10) in the South End and the edge of downtown, but only two were condo projects of any size
within the Roxbury portion of the corridor. The impact on the development of office and retail space in the
Massachusetts Ave. Bus Stop
Dudley Square
New Development on Washington Street
HR&A Advisors, Inc. Comparative Return on Investment Study | 101

corridor was even smaller, with only nine such projects undertaken during this time period, each on small
parcels.
Lessons for Columbia Pike
The amenity provided by the Washington Street Silver Line was not sufficient to overcome the many
barriers to development along this corridor. Even in a region with a growing economy and high-value
regional real estate market, a greater magnitude of change in local market conditions is necessary to spur
development in areas that lack a concentration of large, underutilized parcels.
The implementation of the Silver Line has had an impact on housing prices in the Washington St.
corridor relative to prices elsewhere in the South End and Roxbury, but not relative to the Boston
region. In 2000-2001, according to Perk, Catala, and Reader (2012) there was a negative relationship
between proximity to Washington Street and the prices of condominiums. For instance, at a distance of
0.18 miles away from from the corridor, condos sold for an average of 22 percent more, on a per square
foot basis, than condos located directly on the corrido, all else held constant. In 2007/2009, the
researchers found the opposite relationship, with condos located directly adjacent to Washington St. selling
for 7.6 percent more, per square foot, than those located 0.16 miles away. With the implementation of
the Silver Line, the nuisance effect of proximity to Washington St. was eliminated and, in fact, proximity
became an amenity. However, over this same period, condominium prices in the corridor grew at a slightly
slower rate than those in the City of Boston as a whole (52 percent in the corridor, 54 percent in the city
overall). Thus, Silver Line service did not increase the corridor’s value relative to the broader housing
market.
It is notable that both of these time periods were well after the demolition of the elevated viaduct.
However, other changes to the corridor were also under way in the 2000s, such as implementation of the
Washington Gateway Main Street program, which helped attract real estate investment, offered support
to local retailers and businesses, and installed placemaking features such as historic lights and other
pedestrian amenities. Nevertheless, the implementation of the Silver Line was prominent among the many
changes to Washington Street during this time.
Lessons for Columbia Pike
When implemented in concert with other place-making improvements to the corridor, an enhanced bus like
the TSM 2 may have the potential to increase the value of properties directly along the transit corridor. It
is unlikely, however, to affect a significant value premium relative to the broader region.
The efforts of place management organizations and community-based organizations, in coordination
with public entities, have been critical in catalyzing the development that did occur along the Silver
Line corridor outside of downtown. The Boston Redevelopment Authority owned many parcels along the
Washington Street corridor and sold these properties to developers, often at low prices in exchange for
commitments to build affordable housing. The city also implemented new zoning measures that required
more pedesitrain oriented design. Local community groups leveraged these and other opportunities to
help revitalize the corridor. In 1997, five years prior to implementation of the Silver Line, the Washington
Gateway Main Streets program was initiated in the South End. Since that time, the organization has
helped manage public improvements such as sidewalk widening and upgrades to signage and facades of
retailers, coordinated programs to assist in the developemnt of small businesses, and overseen real estate
projects in the district. Since 1997, over $1 billion of public and private investment has led to the
HR&A Advisors, Inc. Comparative Return on Investment Study | 102

rehabilatation or development of more than 2,000 housing units and the opening of more than 80 new
businesses, occupying 250,000 square feet of retail space, all of which occurred within a half-mile of
Washington Street. Likewise, the Dudley Street Neighborhood Initiative gained national repute for its
innovative strategies in support of community-empowerment and local economic development in Roxbury.
Since its founding in 1984, the organization has helped rehab 1,300 vacant lots for gardens, parks, and
other community facilities; it has been involved in the development of 400 new homes and the
rehabilitation of 500 others, with a special focus on maintaining the neighborhood’s affordability to low-
income residents.
Lessons for Columbia Pike
The new development and neighborhood changes along Washington Street over the past decade largely
resulted from significant investment of resources (including time, effort, and financial investment) by the
City of Boston and several community-based organizations. While the Silver Line has facilitated the
success of these efforts, the transit investment was been sufficient on its own. As Arlington County aims to
foster new development while maintaining affordability for residents of the Columbia Pike corridor,
engagement with and support of community-based non-profits is an important strategy. These groups may
be able to marshal and direct resources into programs that stabilize and increase the appeal of the
corridor to developers while helping to ensure that residents are able to participate in the benefits of
neighborhood improvement.
KEY METRICS
In 2000-2001, condominiums adjacent to the corridor were sold for 22 percent less per square
foot than those 0.18 miles away. In 2007/2009, condos located directly adjacent to Washington
St. sold for 7.6 percent more, per square foot than those located 0.16 miles away.
From 2000-2009, condominium prices in the corridor grew 52 percent; in Boston over all, they
grew 54 percent.
61 percent of development in the corridor took place in downtown or Chinatown (which were
already served by subway stations).
$650 million in new real estate development was associated with the implementation of the Silver
Line on Washington Avenue.
KEY LESSONS FOR ARLINGTON
Enhanced bus does have the potential to support property value increases, but may not represent
a significant enough intervention to help spur new development.
The low-intensity buildings and surface parking lots along Columbia Pike may represent an
opportunity for redevelopment, but also pose a barrier given that most of them currently provide
positive cash flows to their owners. However, these properties and the lack of major vacant
parcels constitute a lesser obstacle to wide-scale redevelopment than the high-value, statutorily-
preserved buildings in Boston’s South End.
Place management entities and community based organizations can be essential partners in the
strategy to revitalize the Columbia Pike corridor while maintaining housing affordability and
cultivating neighborhood-oriented economic development.
HR&A Advisors, Inc. Comparative Return on Investment Study | 103

SOURCES
Boston Housing Authority. “Development Information,” http://www.bostonhousing.org/housing_dev.html
Callaghan. “Addendum to ‘Funding Bus Rapid Transit in the US’: Funding Tables for BRT Projects
Analyzed.” Breakthrough Technologies Institute,
http://www.reconnectingamerica.org/assets/Uploads/bestpractices247.pdf
Downtown Boston Business Improvement District. “Development Fact Sheet: Compiled by the Boston
Redevelopment Authority, Updated August 2013,”
http://origin.library.constantcontact.com/download/get/file/1011270028105-
3714/Downtown+Development+Fact+Sheet+August+2013.pdf
Dudley Street Neighborhood Initiative. “History,” http://www.dsni.org/history
Hook, Lotshaw, and Weinstock. “More Development for your Transit Dollar: An Analysis of 21 North
American Transit Corridors.” Institute for Transportation and Development Policy, 2013.
Massachusetts Bay Transit Authority. “Schedules and Maps: Silver Line,”
http://www.mbta.com/schedules_and_maps/subway/lines/?route=SILVER
MIT Libraries. “Washington and Worcester Streets, Looking East, from Under Elevated Rail, Storefronts
with Liquor Store at Corner,” http://www.flickr.com/photos/mit-libraries/3381944051/in/photostream/
National Bus Rapid Transit Institute. “Boston Silver Line: Summary,” 2011. Perk, Catala, and Reader. “Land Use Impacts of Bus Rapid Transit: Phase II - Effects of BRT Station
Proximity on Property Values along the Boston Silver Line Washington Street Corridor.” Federal Transit
Administration, 2012.
Schimek, Darido, and Schneck. “Boston Silver Line Washington Street Bus Rapid Transit (BRT) Demonstration Project Evaluation.” Federal Transit Administration, 2005. Shannon. “South End History, Part III: Urban Renewal.” The South End Historian, http://www.southendhistory.org/2012/04/south-end-history-part-iii-urban.html, 2012. Washington Gateway Main Street. “History,” http://gatewaymainstreet.org/about/
IMAGE SOURCES
Grk1011. Wikipedia Commons, http://commons.wikimedia.org/wiki/File:MBTA_Silver_Line-
Mass_Ave_Station.JPG
Moreira, Adam. Wikipedia, http://en.wikipedia.org/wiki/File:Silver_Line_Phase_I_Phase_II.jpg
Phelan, John. Wikipedia Commons,
http://commons.wikimedia.org/wiki/File:Dudley_Department_Store,_Washington_St,_Roxbury_MA.jpg
HR&A Advisors, Inc. Comparative Return on Investment Study | 104

Phelan, John. Wikipedia Commons,
http://commons.wikimedia.org/wiki/ File:East_Berkeley_Street_Outbound,_Boston_MA.jpg
Pi.1415926535. Wikipedia Commons,
http://commons.wikimedia.org/wiki/File:MBTA_Silver_Line_map.svg
HR&A Advisors, Inc. Comparative Return on Investment Study | 105

Kansas City Metro Area Express (MAX), Main Street Line (KCATA)
KEY SIMILARITIES TO COLUMBIA PIKE
Categorized under the BRT Standard as “Below Basic” due to the absence of key BRT features
(e.g. lacks a dedicated lane)
Enhanced, articulated bus with stops spaced roughly every ¼-½ mile and off-board fare
collection
Portions of the corridor have similar development character, including small-lot single family
homes, garden apartments, strip retail, and mid-rise office buildings
KEY DIFFERENCES FROM COLUMBIA PIKE
Directly serves the primary downtown of the region
Runs through the primary axis of wealth in the region
Headways are significantly longer (9 minutes during peak, 15-30 minutes off-peak)
As a 6-lane urban arterial, the right-of-way is wider through much of the route
BACKGROUND
The Metro Area Express (MAX) Main Street line began service in 2005. From its northern terminus in the
River Market neighborhood just north of downtown Kansas City, it operates with limited stops for six miles,
running through a variety of urban contexts including the Central Business District, Crown Center (a
suburban-style office/retail complex that includes the headquarters for Hallmark), Broadway Gillham (a
strip retail district), and Midtown-Westport (a medium-density urban mixed-use area) before reaching the
Country Club District, the largest planned community in the US, which includes single-family homes,
apartment buildings, and a pedestrian-oriented retail complex. On weekdays, the bus continues
southward as a local service for an additional three miles, passing through residential areas primarily
composed of single-family homes and garden apartments, as well as the campus of the University of
Missouri-Kansas City.
Transit Type Enhanced Bus
Completion 2005
Cost $25.6 Million ($ 2013)
Miles 6.0
Stations 21
Miles/Station 0.29 on Express Segment
Ridership/Day 6,000
Ridership/Mile 1,000
HR&A Advisors, Inc. Comparative Return on Investment Study | 106
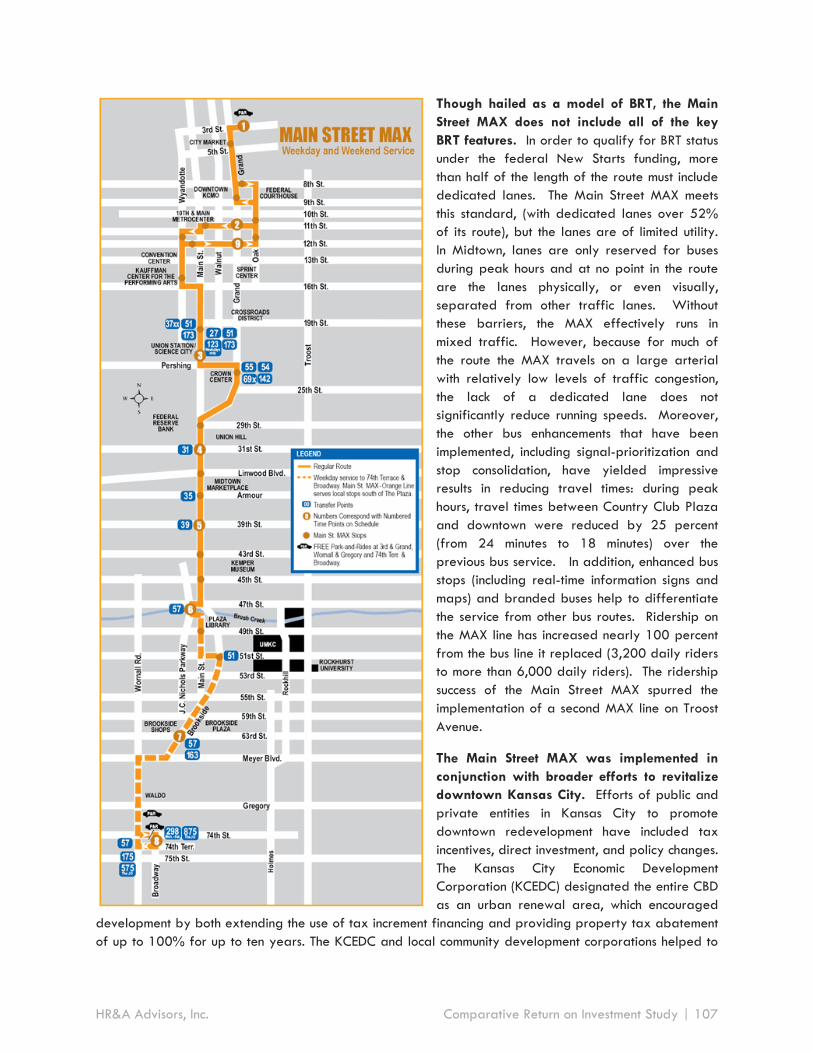
Though hailed as a model of BRT, the Main
Street MAX does not include all of the key
BRT features. In order to qualify for BRT status
under the federal New Starts funding, more
than half of the length of the route must include
dedicated lanes. The Main Street MAX meets
this standard, (with dedicated lanes over 52%
of its route), but the lanes are of limited utility.
In Midtown, lanes are only reserved for buses
during peak hours and at no point in the route
are the lanes physically, or even visually,
separated from other traffic lanes. Without
these barriers, the MAX effectively runs in
mixed traffic. However, because for much of
the route the MAX travels on a large arterial
with relatively low levels of traffic congestion,
the lack of a dedicated lane does not
significantly reduce running speeds. Moreover,
the other bus enhancements that have been
implemented, including signal-prioritization and
stop consolidation, have yielded impressive
results in reducing travel times: during peak
hours, travel times between Country Club Plaza
and downtown were reduced by 25 percent
(from 24 minutes to 18 minutes) over the
previous bus service. In addition, enhanced bus
stops (including real-time information signs and
maps) and branded buses help to differentiate
the service from other bus routes. Ridership on
the MAX line has increased nearly 100 percent
from the bus line it replaced (3,200 daily riders
to more than 6,000 daily riders). The ridership
success of the Main Street MAX spurred the
implementation of a second MAX line on Troost
Avenue.
The Main Street MAX was implemented in
conjunction with broader efforts to revitalize
downtown Kansas City. Efforts of public and
private entities in Kansas City to promote
downtown redevelopment have included tax
incentives, direct investment, and policy changes.
The Kansas City Economic Development
Corporation (KCEDC) designated the entire CBD
as an urban renewal area, which encouraged
development by both extending the use of tax increment financing and providing property tax abatement
of up to 100% for up to ten years. The KCEDC and local community development corporations helped to
HR&A Advisors, Inc. Comparative Return on Investment Study | 107

leverage Historic Preservation Tax Credits, brownfield tax credits, and both public and private investment
to support the establishment and relocation of major cultural institutions to the greater downtown, including
the Kauffmann Center for the Performing Arts, the Ballet Association of Kansas City, the Negro Leagues
Baseball Museum, and the American Jazz Museum. Finally, in 2010 Kansas City adopted the Greater
Downtown Area Plan, which establishes a vision, policies, and implementation measures to help cultivate
transit- and pedestrian-oriented development; in 2008 and 2011, the City amended its zoning code in
support of this vision.
The implementation of the Main Street MAX was 80 percent funded through Federal sources and 20
percent through local public sources. Of the $16.74 million in federal funding (2005 $), $8.27M came
from bus & bus facilities earmarks, $5M from a Federal Highway Administration earmark, $2.27M from
an FTA New Starts grant, and $1.2M from a grant for preliminary engineering. Of the $4.61M in local
sources (2005 $), $4.04 came from the proceeds of bonds issued by the City and $0.57M came from the
Kansas City Area Transportation Authority’s capital budget.
REAL ESTATE IMPACTS AND IMPLICATIONS FOR ARLINGTON
While a large increment of new development has occurred within the Downtown portion of the
alignment, much of this development appears to be incidental to the transit investment. A 2013 study
by the Institute for Transportation and Development Policy identified $5.2 billion in development along the
MAX corridor, the third most among the 21 corridors profiled in the report. Given the relatively low cost
of the transit investment, this translates to more than $100 of real estate investment per dollar spent on
implementing the MAX line. However, the vast majority of this development occurred downtown. One
project, the Kansas City Power & Light District, (a nine-block, master-planned and developed, mixed-use
office and entertainment area that includes the world headquarters of H&R Block), accounts for $850
million of the investment. While this development is well-served by the Main Street MAX, with the entire
footprint of the District falling within three blocks of the line, very little of it directly faces the route. The
downtown condominium boom in Kansas City was also not especially oriented around the bus line; while a
significant number of mid-rise adaptive reuse projects were built in the River Market District and are well
served by the MAX, many of the larger, high-rise projects were developed on the eastern edge of
downtown. Finally, many of the other notable projects such as the Todd Bolender Center for Dance &
Creativity and the Kauffman Center for the Performing Arts, are no closer than four blocks from the MAX’s
route. Given these patterns of development, it appears that the new transit investment has been largely
incidental to the coordinated revitalization efforts directed at downtown Kansas City- it is difficult to
attribute a significant portion of this development to the presence of the MAX line.
Lessons for Columbia Pike
An enhanced bus service in Arlington may facilitate some incremental development in core areas like
Pentagon City, but is unlikely to be the primary catalyst of new development on its own. It is also
questionable whether such a service would encourage a transit- and pedestrian-oriented public realm with
a strong sense of place.
The strong operating performance of the Main Street MAX has not directly translated into
demonstrable development impacts along much of the corridor. As noted above, the Main Street MAX
has effectively boosted ridership and cut transit times on the corridor. As the Main Street MAX was being
implemented, public and non-profit efforts, in concert with growing market demand in neighborhoods like
the River Market, facilitated a significant amount of redevelopment in downtown, much of it adjacent to
HR&A Advisors, Inc. Comparative Return on Investment Study | 108
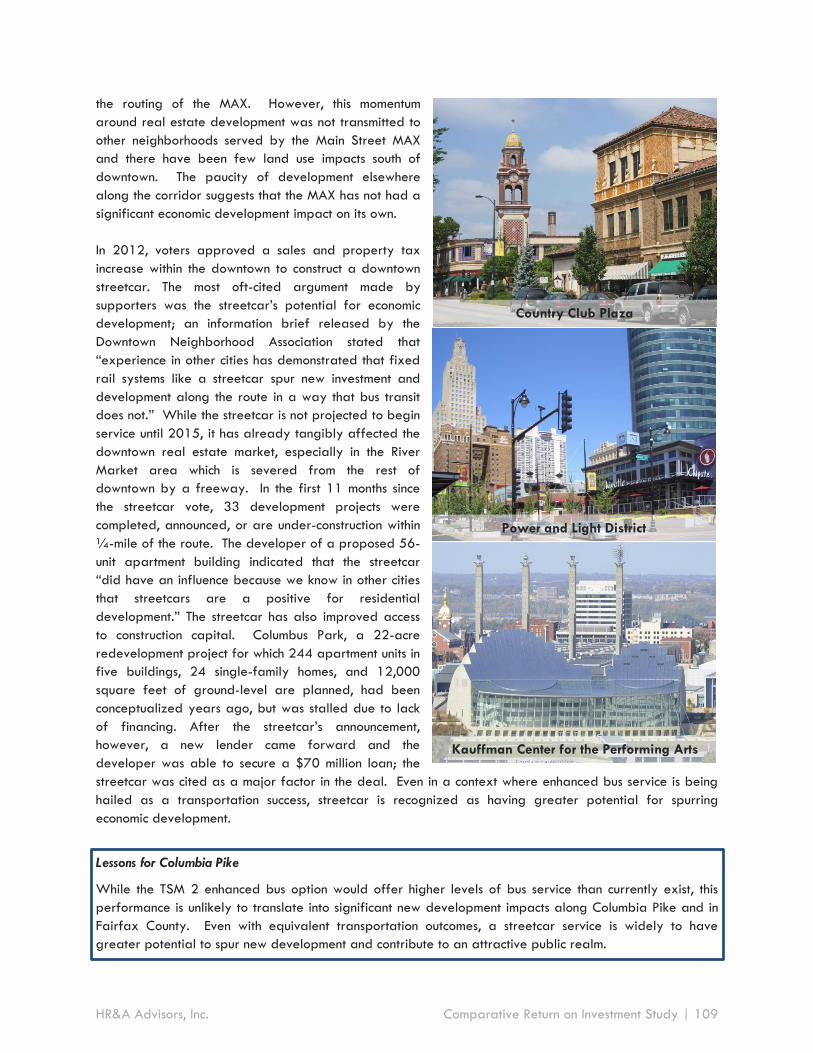
the routing of the MAX. However, this momentum
around real estate development was not transmitted to
other neighborhoods served by the Main Street MAX
and there have been few land use impacts south of
downtown. The paucity of development elsewhere
along the corridor suggests that the MAX has not had a
significant economic development impact on its own.
In 2012, voters approved a sales and property tax
increase within the downtown to construct a downtown
streetcar. The most oft-cited argument made by
supporters was the streetcar’s potential for economic
development; an information brief released by the
Downtown Neighborhood Association stated that
“experience in other cities has demonstrated that fixed
rail systems like a streetcar spur new investment and
development along the route in a way that bus transit
does not.” While the streetcar is not projected to begin
service until 2015, it has already tangibly affected the
downtown real estate market, especially in the River
Market area which is severed from the rest of
downtown by a freeway. In the first 11 months since
the streetcar vote, 33 development projects were
completed, announced, or are under-construction within
¼-mile of the route. The developer of a proposed 56-
unit apartment building indicated that the streetcar
“did have an influence because we know in other cities
that streetcars are a positive for residential
development.” The streetcar has also improved access
to construction capital. Columbus Park, a 22-acre
redevelopment project for which 244 apartment units in
five buildings, 24 single-family homes, and 12,000
square feet of ground-level are planned, had been
conceptualized years ago, but was stalled due to lack
of financing. After the streetcar’s announcement,
however, a new lender came forward and the
developer was able to secure a $70 million loan; the
streetcar was cited as a major factor in the deal. Even in a context where enhanced bus service is being
hailed as a transportation success, streetcar is recognized as having greater potential for spurring
economic development.
Lessons for Columbia Pike
While the TSM 2 enhanced bus option would offer higher levels of bus service than currently exist, this
performance is unlikely to translate into significant new development impacts along Columbia Pike and in
Fairfax County. Even with equivalent transportation outcomes, a streetcar service is widely to have
greater potential to spur new development and contribute to an attractive public realm.
Kauffman Center for the Performing Arts
t
Country Club Plaza
Power and Light District
HR&A Advisors, Inc. Comparative Return on Investment Study | 109

Downtown development in Kansas City has been boosted by streamlined bureaucracy and effective
coordination between public, private, and non-profit entities. The Kansas City Economic Development
Corporation (KCEDC) is one of the major players in Kansas City’s revitalization. This nonprofit agency is
an umbrella organization that manages the efforts of six statutory redevelopment agencies in the City: the
Tax Increment Financing (TIF) Commission, the Downtown Economic Stimulus Authority, the Land Clearance
for Redevelopment Authority, the Enhanced Enterprise Zone Boards, the Port Authority, and the EDC Loan
Corporation. Each of these agencies provides services and incentives to encourage development in
downtown Kansas City. TIF districts organized under the purview of the KCEDC have been used
extensively in downtown Kansas City to facilitate the development of a new hotel, a building for a major
garment manufacturer, and the rehabilitation of an historic building, among other purposes. The
Downtown Council of Kansas City, a business improvement district created in 1981, complements the efforts
of the KCEDC by working to market and beautify downtown Kansas City. A major focus of coordinated
action between these entities occurred in the historic Jazz District neighborhood in downtown, where the
city government, the Kansas City Downtown Council, and the Jazz District Redevelopment Corporation (the
local community development corporation) have all helped attract developers to historic buildings. Though
not served by the Main Street MAX, these endeavors have yielded $81 million of redevelopment, including
the establishment of the American Jazz Museum and the Negro Leagues Baseball Museum, the
rehabilitation of several historic structures, new retail construction, and the development of more than 800
apartment units. The city’s recent planning and rezoning efforts have helped maintain the momentum
generated by these investments and have provided a clear framework and vision for downtown
redevelopment.
Lessons for Columbia Pike
Development in Downtown Kansas City has relied on a coordinated effort between public, private, and
non-profit actors that leverages a variety of tools and resources. Absent these efforts, it is unlikely an
enhanced bus service could single-handedly catalyze redevelopment. Regardless of the mode chosen for
transit improvements on the Columbia Pike corridor, coordination between public, private, and non-profit
actors is essential to maximizing the development impact.
KEY METRICS
$5.2 billion in new real estate development was associated with the implementation of the Main
Street MAX.
In the first 11 months following the announcement of the downtown streetcar, 33 new projects were
proposed, under construction, or completed within ¼-mile of the planned alignment.
KEY LESSONS FOR ARLINGTON
Kansas City has found that, despite its high-performing BRT-like service, the implementation of a
streetcar is necessary to generate transit-oriented development. While an enhanced bus would
offer higher levels of bus service than currently exist on Columbia Pike, this performance is
similarly unlikely to catalyze transformative development impacts, especially further down the
Columbia Pike and in Fairfax County.
HR&A Advisors, Inc. Comparative Return on Investment Study | 110

An enhanced bus service may enhance ongoing development efforts in the urban center of
Pentagon City. However, it is unlikely to be a primary catalyst for development with a transit-
orientation.
Maximizing the development impacts of new transit service will require coordination between
public, private, and non-profit actors.
Supportive land use and economic development policies, such as those already adopted by
Arlington County, will play an important role in facilitating the realization of development impacts.
SOURCES
Callaghan. “Addendum to ‘Funding Bus Rapid Transit in the US’: Funding Tables for BRT Projects
Analyzed.” Breakthrough Technologies Institute,
http://www.reconnectingamerica.org/assets/Uploads/bestpractices247.pdf
City of Kansas City, Missouri. “Greater Downtown Area Plan,” 2010,
http://www.kcmo.org/idc/groups/cityplanningplanningdiv/documents/cityplanninganddevelopment/gda
p_final_web.pdf
Collison. “Developer plans River Market apartment project.” The Kansas City Star, 2013,
http://www.kansascity.com/2013/12/05/4671111/developer-plans-river-market-apartment.html
Collison. “New downtown streetcar carries hopes for development.” The Kansas City Star, 2013,
http://www.kansascity.com/2013/11/29/4659022/new-downtown-streetcar-carries.html
Davis. “A Look at BRT: The Kansas City MAX.” Metro Jacksonville, 2010,
http://www.metrojacksonville.com/article/2010-aug-a-look-at-brt-the-kansas-city-max
Downtown Council of Kansas City. “KC Streetcar Drives Development in Downtown,” 2013,
http://www.downtownkc.org/2013/11/06/kcmo-streetcar-de/
Downtown Neighborhood Association. “Streetcar Factsheet,”
http://dnakcmo.org/uploads/2/8/4/9/2849772/streetcar_brochure_-_web.pdf
Hook, Lotshaw, and Weinstock. “More Development for your Transit Dollar: An Analysis of 21 North
American Transit Corridors.” Institute for Transportation and Development Policy, 2013.
Kansas City Area Transportation Authority. “Kansas City’s MAX Bus Rapid Transit.” Presentation,
http://www.nbrti.org/docs/ppt/Broward%20County%20BRT%20Workshop/Kansas_City_MAX.pdf
Kansas City Area Transportation Authority. “Kansas City’s MAX Bus Rapid Transit.” Presentation to Urban
Land Institute: Seattle, 2011, http://northwest.uli.org/wp-content/uploads/2012/03/oconnor-brt-
presentation.pdf
Kansas City Area Transportation Authority. “MAX - Metro Area Express: Fact Sheet,”
http://www.kcata.org/documents/uploads/MAX_Fact_Sheet.pdf
HR&A Advisors, Inc. Comparative Return on Investment Study | 111

Kansas City Area Transportation Authority. “Main Street MAX: Weekday and Weekend Service,”
http://www.kcata.org/images/uploads/maxmwk.gif
Roberts. “Streetcar helps attract financing for $70M Columbus Park project.” Kansas City Business Journal,
2013, http://www.bizjournals.com/kansascity/news/2013/12/12/streetcar-helps-attract-financing-
for.html?page=all
Tate. “As Cities Improve Public Transit, Buses Get a New Look.” The Kansas City Star, 2013,
http://www.kansascity.com/2013/10/13/4551887/as-cities-such-as-kc-improve-rapid.html
IMAGE SOURCES
Charvex. Wikipedia Commons,
http://commons.wikimedia.org/wiki/File:Country_Club_Plaza_5_Kansas_City_MO.jpg
Charvex. Wikipedia Commons, http://commons.wikimedia.org/wiki/File:PowerLight_KCPL.jpg
Out of Focus. Flickr. http://www.flickr.com/photos/11513812@N02/6294713189/
The Kansas City Area Transportation Authority. Metro Area Express Maps and Schedules,
http://www.kcata.org/maps_schedules/max
U.S. Department of Transportation, Federal Transit Administration. Kansas City Area Transportation
Authority (KCATA) MAX Passengers Boarding, http://www.fta.dot.gov/about/region7_3380.html
HR&A Advisors, Inc. Comparative Return on Investment Study | 112

Appendix 3 – Developer and Retailer Interview Questions
To inform its assessment of the comparative return on investment (ROI) of streetcar versus enhanced bus
along the Columbia Pike corridor, HR&A conducted interview with ten (10) developers and six (6) retailers.
These interviews focused on gauging informed opinions from local real estate experts regarding how
streetcar and enhanced bus would affect the value of existing real estate and the pace and quantity of
future development, and also factors that differentiate the two services such as branding and place-
making. To structure these interviews in a consistent and formal manner, HR&A formulated a list of
questions that aimed to allow for sufficient opportunity for interviewees to express their opinions on the
potential impacts of a streetcar or enhanced bus service along the corridor. These questions follow.
HR&A Advisors, Inc. Comparative Return on Investment Study | 113
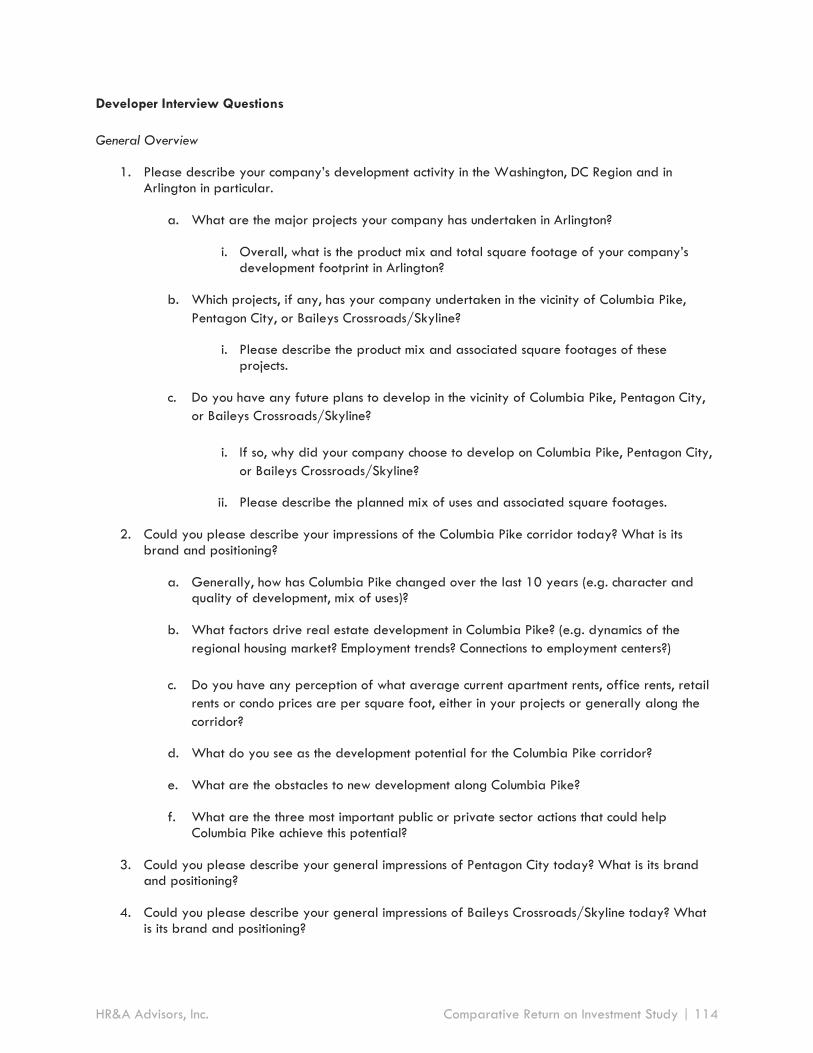
Developer Interview Questions
General Overview
1. Please describe your company’s development activity in the Washington, DC Region and in Arlington in particular.
a. What are the major projects your company has undertaken in Arlington?
i. Overall, what is the product mix and total square footage of your company’s development footprint in Arlington?
b. Which projects, if any, has your company undertaken in the vicinity of Columbia Pike,
Pentagon City, or Baileys Crossroads/Skyline?
i. Please describe the product mix and associated square footages of these projects.
c. Do you have any future plans to develop in the vicinity of Columbia Pike, Pentagon City,
or Baileys Crossroads/Skyline?
i. If so, why did your company choose to develop on Columbia Pike, Pentagon City,
or Baileys Crossroads/Skyline?
ii. Please describe the planned mix of uses and associated square footages.
2. Could you please describe your impressions of the Columbia Pike corridor today? What is its brand and positioning?
a. Generally, how has Columbia Pike changed over the last 10 years (e.g. character and quality of development, mix of uses)?
b. What factors drive real estate development in Columbia Pike? (e.g. dynamics of the
regional housing market? Employment trends? Connections to employment centers?)
c. Do you have any perception of what average current apartment rents, office rents, retail
rents or condo prices are per square foot, either in your projects or generally along the
corridor?
d. What do you see as the development potential for the Columbia Pike corridor?
e. What are the obstacles to new development along Columbia Pike?
f. What are the three most important public or private sector actions that could help Columbia Pike achieve this potential?
3. Could you please describe your general impressions of Pentagon City today? What is its brand and positioning?
4. Could you please describe your general impressions of Baileys Crossroads/Skyline today? What is its brand and positioning?
HR&A Advisors, Inc. Comparative Return on Investment Study | 114

Transit Alternatives
1. What placemaking and branding advantages to development along the transit corridor would you associate with:
a. Enhanced bus service?
b. Streetcar service?
2. How much would the ability to help direct visitors and potential customers to destinations along the transit corridor be improved by:
a. Enhanced bus service?
b. Streetcar service?
3. In general terms, do you see any differential advantages to real estate development from (1) a streetcar service or (2) an enhanced bus service along the transit corridor? Why or why not?
a. Would any specific sub-markets benefit more than others?
i. Columbia Pike
ii. Pentagon City
iii. Baileys Crossroads/Skyline
4. How would the density (in terms of built square footage) of new projects proposed by developers along the transit corridor evolve with:
a. Enhanced bus service?
b. Streetcar service?
5. How would the timeframe for build-out of parcels along the transit corridor be affected by:
a. Enhanced bus service?
b. Streetcar service?
6. To what extent would enhanced bus service catalyze the redevelopment of existing properties along the corridor? Would it lead to:
a. Demolition of existing structures and replacement with new product?
b. Construction of new square footage on existing properties?
c. Renovation of existing buildings?
d. No impact on redevelopment?
7. To what extent would streetcar service catalyze the redevelopment of existing properties along the corridor? Would it lead to:
HR&A Advisors, Inc. Comparative Return on Investment Study | 115

a. Demolition of existing structures and replacement with new product?
b. Construction of new square footage on existing properties?
c. Renovation of existing buildings?
d. No impact on redevelopment?
8. How would the need for the provision of parking at project sites along the transit corridor be impacted by:
a. Enhanced bus service?
b. Streetcar?
9. What increase in residential rents would you expect with proximity to:
a. Enhanced bus service?
b. Streetcar?
10. What increase in office rental rates would you expect with proximity to:
a. Enhanced bus service?
b. Streetcar?
11. What increase in retail rental rates would you expect with proximity to:
a. Enhanced bus service?
b. Streetcar?
12. What value premium to existing properties within ¼ mile of the alignment would you associate with proximity to streetcar service?
13. What value premium to existing properties within ¼ mile would you associate with proximity to enhanced bus service?
14. Do you think development along the transit corridor would experience any benefits if the transit service also connected with the planned Crystal City streetcar? Will connectivity affect the premium for existing properties?
HR&A Advisors, Inc. Comparative Return on Investment Study | 116

Retailer Interview Questions: Retailers Present on the Corridor
General Overview
1. Briefly describe your business, including what services and products you offer.
2. Who is your current customer base?
a. Age and Life Stage
b. Income
3. Could you please describe your impressions of the Columbia Pike corridor today? What is its brand and positioning?
a. What factors led you to locate your business on the Columbia Pike corridor?
b. How do you believe the Columbia Pike corridor will change over the next decade or two?
c. What are the obstacles to the Columbia Pike corridor achieving its potential?
d. What can the private and public sectors do to help the Columbia Pike corridor achieve this potential?
4. How do your customers tend to reach your business?
a. Driving?
b. Walking?
c. Biking?
d. Bus?
e. Metro?
Transit Alternatives
1. In general terms, do you see any advantages of one system over the other along the corridor? Why or why not?
2. For the enhanced bus service:
a. Do you think it would benefit your existing customers? How?
b. Do you think it would help attract new customers? How?
c. Do you think it would offer placemaking or branding advantages? How?
d. Do you think it would help to direct visitors and potential customers to destinations along the corridor?
e. Do you have any concerns about the impact of the service on your business?
HR&A Advisors, Inc. Comparative Return on Investment Study | 117

f. Do you think it would ultimately impact your sales volume? By how much (percentage terms)?
g. Would this impact your decision to expand your business or maintain your business on Columbia Pikey?
3. For the streetcar service:
h. Do you think it would benefit your existing customers? How?
i. Do you think it would help attract new customers? How?
j. Do you think it would offer placemaking or branding advantages? How?
k. Do you think it would help to direct visitors and potential customers to destinations along the corridor?
l. Do you have any concerns about the impact of the service on your business?
m. Do you think it would ultimately impact your sales volume? By how much (percentage terms)?
n. Would this impact your decision to expand your business or maintain your business on Columbia Pike?
HR&A Advisors, Inc. Comparative Return on Investment Study | 118

Retailer Interview Questions: Retailers Not Present on the Corridor
General Overview
1. Briefly describe your business, including what services and products you offer.
2. Where are your current locations in the DC metro area? How long have you been there?
3. What factors led you to locate your business at your current location(s)?
4. Who is your current customer base?
a. Age and Life Stage
b. Income
5. How do your customers tend to reach your business?
a. Driving?
b. Walking?
c. Biking?
d. Bus?
e. Metro?
6. Have you considered opening a new location?
a. If so, where and what factors do you consider when selecting a location?
7. What is your perception of Columbia Pike?
a. Why would you or would you not consider opening a location on Columbia Pike?
8. What is your perception of Pentagon City?
a. Why would you or would you not consider opening a location in Pentagon City?
9. What is your perception of Bailey’s Crossroads?
a. Why would you or would you not consider opening a location on Bailey’s Crossroads?
Transit Alternatives
1. How would the provision of enhanced bus service impact your decision to open a new location on Columbia Pike, Pentagon City, or Bailey’s Crossroads? Why?
a. Do you think it would offer placemaking or branding advantages? How?
HR&A Advisors, Inc. Comparative Return on Investment Study | 119

b. Do you think it would help to direct visitors and potential customers to destinations along the corridor?
c. Would you have any concerns about the impact of the service on your business?
d. Would this impact your decision to expand your business?
2. How would the provision of streetcar service impact your decision to open a new location on Columbia Pike, Pentagon City, or Bailey’s Crossroads? Why?
a. Do you think it would offer placemaking or branding advantages? How?
b. Do you think it would help to direct visitors and potential customers to destinations along the corridor?
c. Would you have any concerns about the impact of the service on your business?
d. Would this impact your decision to expand your business?
HR&A Advisors, Inc. Comparative Return on Investment Study | 120