columbia river crossing bottleneck simulation (1)
TRANSCRIPT

Columbia River Crossing Bottleneck SimulationBRYAN BLANC
ALI RAZMPA
1

PurposeUse a simulation tool to analyze real-world data
Compare alternative designs for transportation facilities and their effects on transportation operations
2Columbia River Crossing Bottleneck Simulation

ObjectivesCompare the existing Columbia River Interstate Bridge facility with the proposed design during PM peak usage conditions on the Northbound Side.
Propose minor improvements that can be made to the bridge now, until full construction (eventually) takes place on a new bridge
3Columbia River Crossing Bottleneck Simulation
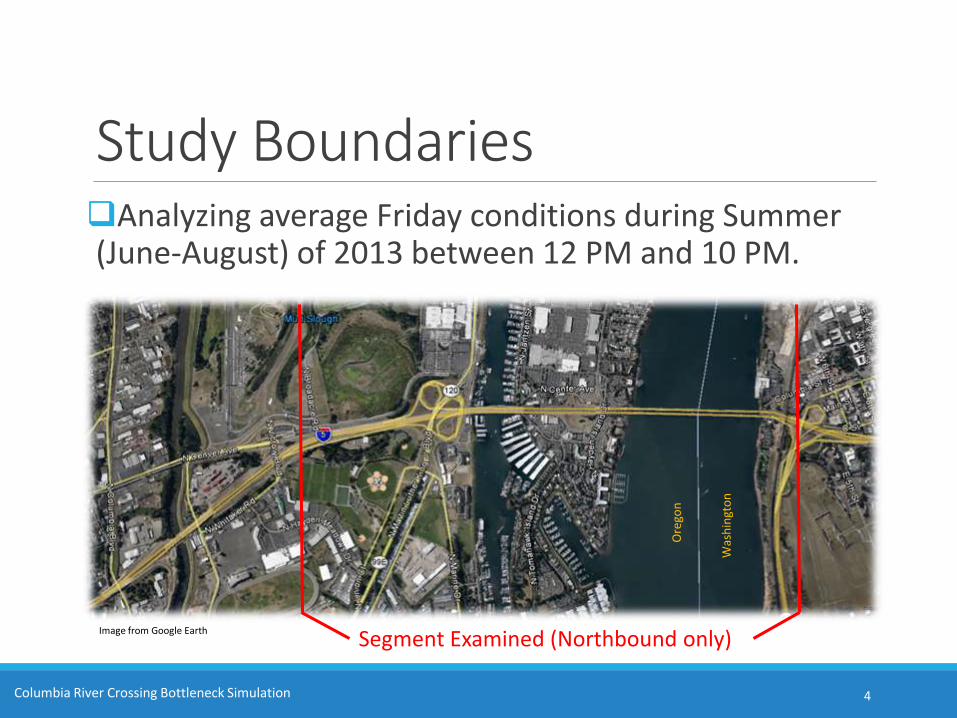
Study BoundariesAnalyzing average Friday conditions during Summer (June-August) of 2013 between 12 PM and 10 PM.
4Columbia River Crossing Bottleneck Simulation
Segment Examined (Northbound only)
Ore
gon
Was
hin
gto
n
Image from Google Earth

Data SourcesLoop detector data for I-5 freeway segment and on ramp volumes taken from PORTAL
Off ramp flows taken from Columbia River Crossing Traffic Technical Report1
Heavy vehicle assumptions from Columbia River Crossing technical report on existing freight conditions2
1: http://www.columbiarivercrossing.org/FileLibrary/TechnicalReports/Traffic_TechnicalReport.pdf2:http://www.columbiarivercrossing.org/FileLibrary/TechnicalReports/TruckFreightExistingConditions.pdf
5Columbia River Crossing Bottleneck Simulation

6Columbia River Crossing Bottleneck Simulation
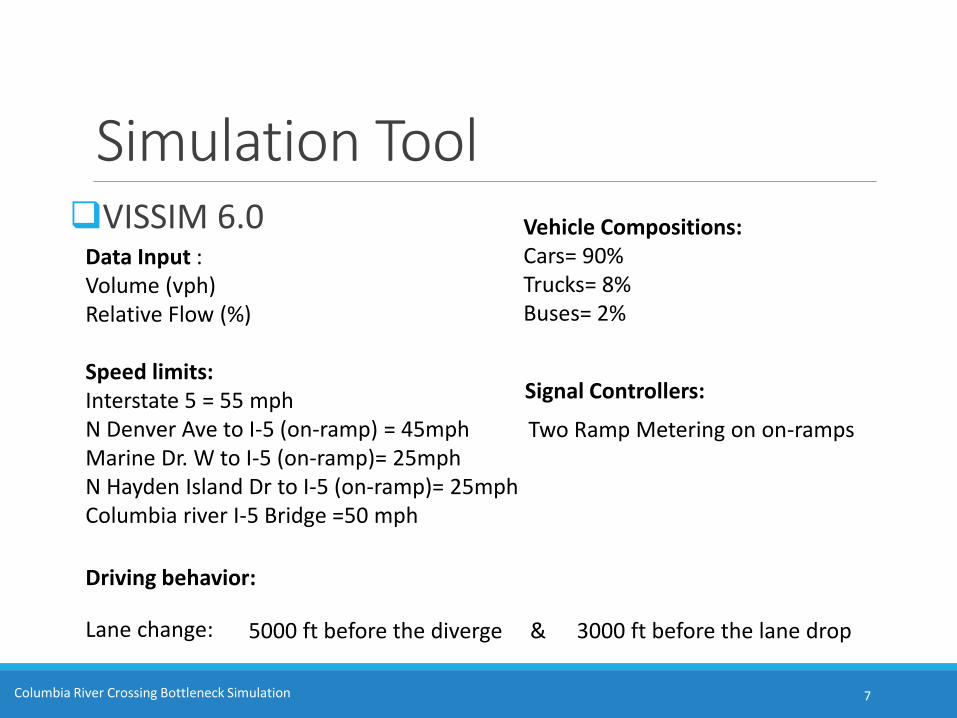
Simulation ToolVISSIM 6.0
7Columbia River Crossing Bottleneck Simulation
Data Input :Volume (vph) Relative Flow (%)
Speed limits:Interstate 5 = 55 mphN Denver Ave to I-5 (on-ramp) = 45mphMarine Dr. W to I-5 (on-ramp)= 25mphN Hayden Island Dr to I-5 (on-ramp)= 25mphColumbia river I-5 Bridge =50 mph
5000 ft before the diverge & 3000 ft before the lane dropLane change:
Driving behavior:
Vehicle Compositions:Cars= 90%Trucks= 8%Buses= 2%
Signal Controllers:
Two Ramp Metering on on-ramps

Design AlternativesExisting6-lane freeway bridge, problematic accesses are primary cause of bottleneck
8
Image from Google Earth
Time Avg Speed Avg Delay
2:00 PM - 3:00 PM 18 mph 188 Sec
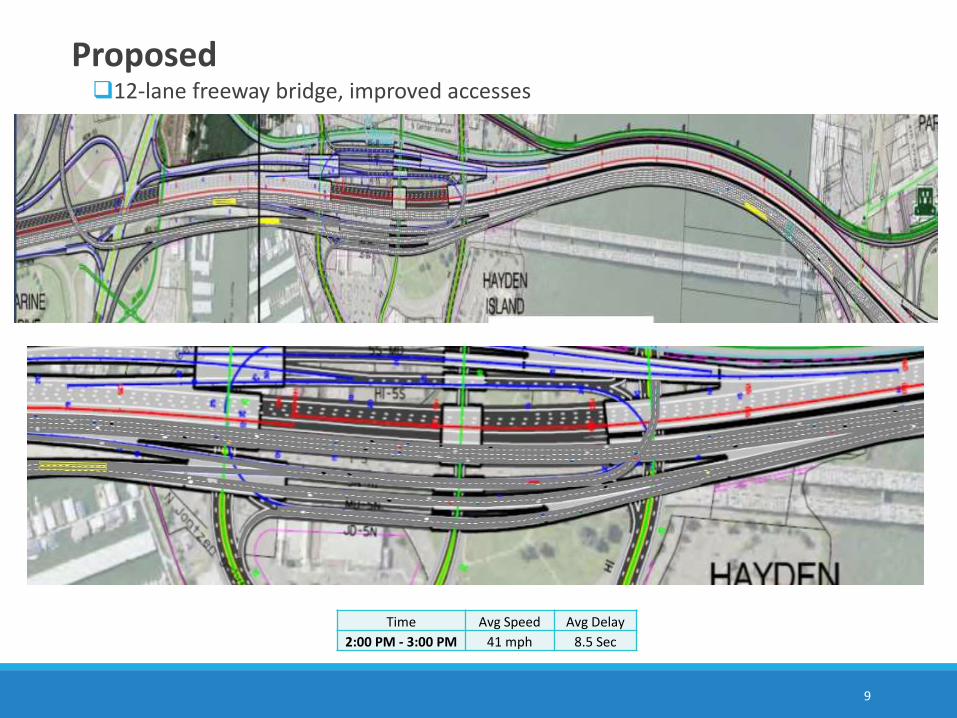
Proposed12-lane freeway bridge, improved accesses
9
Time Avg Speed Avg Delay
2:00 PM - 3:00 PM 41 mph 8.5 Sec

Our Test Alternative
Remove on-ramp for Hayden Island on Northbound side. Add one lane leading up to Columbia River Interstate Bridge (using existing shoulder)
10
Time Avg Speed Avg Delay
2:00 PM - 3:00 PM 26 mph 102 Sec

Average Speed
11
15
20
25
30
35
40
45
50
11:00 AM 12:00 PM 1:00 PM 2:00 PM 3:00 PM 4:00 PM 5:00 PM 6:00 PM 7:00 PM 8:00 PM 9:00 PM 10:00 PM
Ave
rage
Sp
eed
(m
ph
)
Existing Proposed Alternative
Columbia River Crossing Bottleneck Simulation
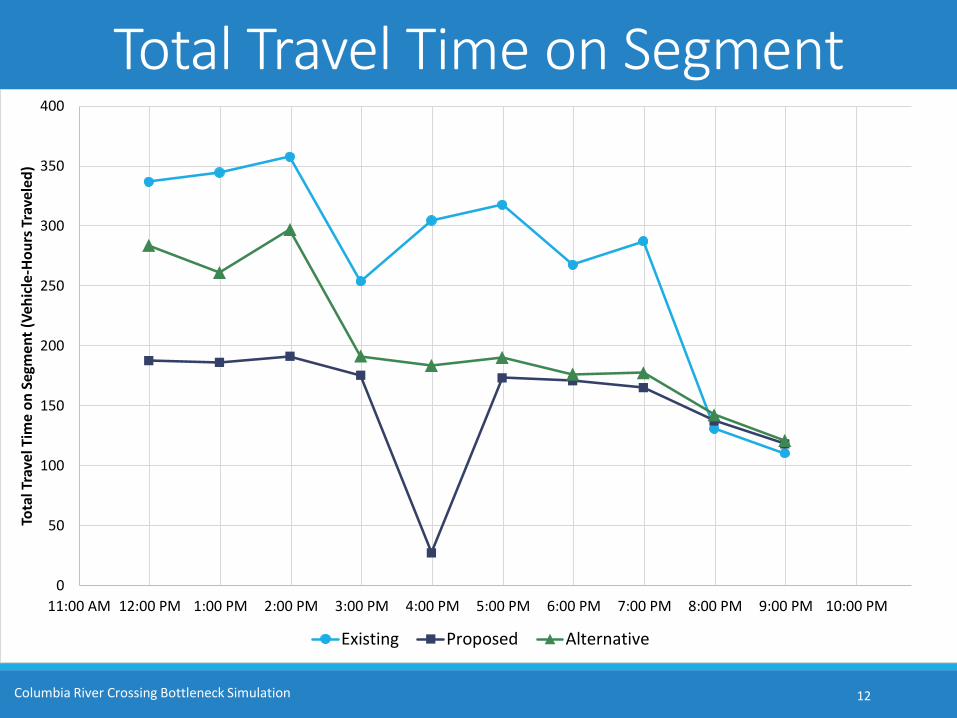
Total Travel Time on Segment
12
0
50
100
150
200
250
300
350
400
11:00 AM 12:00 PM 1:00 PM 2:00 PM 3:00 PM 4:00 PM 5:00 PM 6:00 PM 7:00 PM 8:00 PM 9:00 PM 10:00 PM
Tota
l Tra
vel T
ime
on
Seg
men
t (V
ehic
le-H
ou
rs T
rave
led
)
Existing Proposed Alternative
Columbia River Crossing Bottleneck Simulation

Total Delay on Segment
13
0
50
100
150
200
250
11:00 AM 12:00 PM 1:00 PM 2:00 PM 3:00 PM 4:00 PM 5:00 PM 6:00 PM 7:00 PM 8:00 PM 9:00 PM 10:00 PM
Tota
l Del
ay (
Veh
icle
-Ho
urs
)
Existing Proposed Alternative
Columbia River Crossing Bottleneck Simulation

Difference in Performance
14
+60%
-30%
-80%
+44%
-16%
-50%
-100%
-80%
-60%
-40%
-20%
0%
20%
40%
60%
80%
Average Speed in Segment (mph) Total Travel Time in Segment (VHT) Total Delay in Segment (hours)
Proposed Alternative
Columbia River Crossing Bottleneck Simulation
DiscussionEstimated Costs:Proposed: $3.1-3.5 BillionOur Test Alternative:<$100 Million
Could removing accesses be a temporary solution to mitigating congestion? Is it politically feasible? (Beyond the scope of this
project)
Other Possibilities:Demand reductionLimits on freight travel during peak hours
15Columbia River Crossing Bottleneck Simulation

Issues and LimitationsData validityIssues with speeds reported in PORTAL as compared to
those generated by simulation (using volumes from PORTAL). Which is more reliable measure of speed?
Simplified test scenarioSimplifying assumptions were made that may not be
valid under realistic conditions
Study boundariesSmall portion of corridor was analyzed
16Columbia River Crossing Bottleneck Simulation

17Columbia River Crossing Bottleneck Simulation
15
20
25
30
35
40
45
50
55
60
11:00 AM 12:00 PM 1:00 PM 2:00 PM 3:00 PM 4:00 PM 5:00 PM 6:00 PM 7:00 PM 8:00 PM 9:00 PM 10:00 PM
Ave
rage
Sp
ee
d (
mp
h)
Average Speed
Simulated Portal

18Columbia River Crossing Bottleneck Simulation

Project OutcomesGained experience in utilizing real world data with a simulation tool
Simulation allowed us to gain greater understanding of bottleneck conditions on Columbia River bridge
19Columbia River Crossing Bottleneck Simulation

Questions?
Thank you for your attention!20
Source:http://www.macalester.edu/academics/environmentalstudies/students/projects/citizenscience2010/columbiariverbridge/crcfuture.html