combat-seq: batch effect adjustment for rna-seq count data · analysis pipeline of rna-seq studies,...
TRANSCRIPT

ComBat-Seq: batch effect adjustment for RNA-Seq
count data
Yuqing Zhang1,2, Giovanni Parmigiani3,4, and W. Evan Johnson∗1,2,5
1Division of Computational Biomedicine, Boston University School of Medicine
2Graduate Program in Bioinformatics, Boston University
3Department of Data Sciences, Dana-Farber Cancer Institute
4Department of Biostatistics, Harvard T.H. Chan School of Public Health
5Department of Biostatistics, Boston University School of Public Health
∗: To whom correspondence may be addressed: [email protected]
Abstract
The benefit of integrating batches of genomic data to increase statistical power in differential ex-
pression is often hindered by batch effects, or unwanted variation in data caused by differences
in technical factors across batches. It is therefore critical to effectively address batch effects
in genomic data. Many existing methods for batch effect adjustment assume continuous, bell-
shaped Gaussian distributions for data. However in RNA-Seq studies where data are skewed,
over-dispersed counts, this assumption is not appropriate and may lead to erroneous results. Neg-
ative binomial regression models have been used to better capture the properties of counts. We
developed a batch correction method, ComBat-Seq, using negative binomial regression. ComBat-
Seq retains the integer nature of count data in RNA-Seq studies, making the batch adjusted data
1
.CC-BY-NC-ND 4.0 International license(which was not certified by peer review) is the author/funder. It is made available under aThe copyright holder for this preprintthis version posted January 14, 2020. . https://doi.org/10.1101/2020.01.13.904730doi: bioRxiv preprint

compatible with common differential expression software packages that require integer counts. We
show in realistic simulations that the ComBat-Seq adjusted data result in better statistical power
and control of false positives in differential expression, compared to data adjusted by the other
available methods. We further demonstrated in a real data example where ComBat-Seq success-
fully removes batch effects and recovers the biological signal in the data.
Key words: Batch effect adjustment, RNA-Seq, Differential expression, Negative binomial
regression, Data integration
Introduction
Genomic data are often produced in batches due to logistical or practical restrictions, but technical
variation and differences across batches, often called batch effects, can cause significant hetero-
geneity across batches of data (Leek et al., 2010). Batch effects often result in discrepancies in the
statistical distributions across data from different technical processing batches, and can have unfa-
vorable impact on downstream biological analysis. The presence of batch effects often reduces the
benefits of integrating batches of data to increase the inferential power to discover relevant biology
from the combined data.
Batch effects often cannot be fully addressed by normalization methods and procedures. The
differences in the overall expression distribution of each sample across batch may be corrected
by normalization methods, such as transforming the raw counts to (logarithms of) CPM, TPM, or
RPKM/FPKM, the trimmed mean of M values (TMM, Robinson and Oshlack, 2010), or relative
log expression (RLE, Risso et al., 2014a). However, batch effects in composition, i.e. the level
of expression of genes scaled by the total expression (coverage) in each sample, cannot be fully
corrected with normalization. Leek et al. (2010) provided an example of composition batch effects
in microarray data, showing that while the overall distribution of samples may be normalized to
the same level across batches, individual genes may still be affected by batch-level bias.
Many methods have been proposed to address batch effects in RNA-Seq studies. For example,
2
.CC-BY-NC-ND 4.0 International license(which was not certified by peer review) is the author/funder. It is made available under aThe copyright holder for this preprintthis version posted January 14, 2020. . https://doi.org/10.1101/2020.01.13.904730doi: bioRxiv preprint

ComBat (Johnson et al., 2007) remains one of the most popular batch effect adjustment methods
when the effects come from known sources. For heterogeneity from unknown sources, SVASeq
(Leek, 2014) and RUVSeq (Risso et al., 2014b) are commonly used. Methods designed for spe-
cific downstream tasks have also been proposed, including our own work using reference batches
for biomarker development and training (Zhang et al., 2018). For differential expression, many
common methods or procedures (e.g. edgeR (Robinson et al., 2010) and DESeq2 (Love et al.,
2014)) suggest to include batch variables as covariates in the linear models behind these methods
to account for the impact of batch.
Despite the established progress, there are still gaps in batch adjustment methodology for RNA-
Seq data which need to be bridged. Often times, batch effect adjustment methods either do not
directly provide adjusted data with batch effects removed, or do not preserve the integer nature of
counts in the adjusted data, despite the requirement of software such as edgeR and DESeq2 that
specifically require untransformed count matrices as inputs. This results in an inconsistency in the
analysis pipeline of RNA-Seq studies, as batch corrected data cannot be used as inputs for these
differential expression software. For this practical issue, it is favorable to develop a method which
generates adjusted data and is able to preserve the count nature of data.
More importantly, many popular adjustment methods, including ComBat, assume Gaussian
distributions for the underlying distribution of the data, which is not an appropriate distributional
assumption for counts. These methods typically estimate parameters representing differences in
the statistical moments across batches (usually the mean and the variance). Then they adjust all
batches to the same overall level in these moments. Such adjustment does not preserve integers, and
may results in negative values in adjusted count matrix, which is difficult to interpret biologically.
In addition, it has been well-established that there exists a mean-variance dependence in RNA-
Seq count data (Law et al., 2014). Distributions of counts are skewed and over-dispersed, i.e.
the variance is often larger than the mean of gene expression and genes with smaller counts tend
to have larger variances. These properties cannot be reflected with Gaussian distribution, which
assumes independent mean and variance parameters. Negative binomial regression models have
3
.CC-BY-NC-ND 4.0 International license(which was not certified by peer review) is the author/funder. It is made available under aThe copyright holder for this preprintthis version posted January 14, 2020. . https://doi.org/10.1101/2020.01.13.904730doi: bioRxiv preprint
been widely used to model count data in RNA-Seq studies. The Negative binomial distribution has
the potential to describe the skewness and mean-variance relationship observed in count matrices.
We propose to extend the original ComBat framework to RNA-Seq studies using negative binomial
regression.
Finally, existing methods may not be flexible enough to address all types of batch effects. In
particular, including batch variables in software for differential expression may be sufficient to ac-
count for batch effects in the mean expression. However, since both software assume a single dis-
persion parameter for all samples, variance batch effects is restricted, and completely determined
by mean batch effects, due to the properties of negative binomial modeling. Such assumption is
strong and may not always hold for real data. Therefore, we propose a more flexible approach to
address batch effects in the variance.
In this paper, we present a batch effect adjustment method, ComBat-Seq, that extends the
original ComBat adjustment framework to address the challenges in batch correction in RNA-Seq
count data. It generates adjusted data in the form of counts, thus preserving the integer nature of
data. We demonstrate that ComBat-Seq adjustment has potential benefits in differential expression
compared to the other adjustment methods, especially when there is a large variance batch effect
in the data.
Materials and methods
We propose a negative binomial regression model to estimate batch effects based on the count
matrix in RNA-Seq studies. With the estimated batch effect parameters, we calculate "batch-free"
distributions, i.e. the expected distributions if there were no batch effects in the data. We then
adjust the data by mapping the quantiles of the empirical distributions of data to the batch-free
distributions. We further describe the methods in the sections below.
4
.CC-BY-NC-ND 4.0 International license(which was not certified by peer review) is the author/funder. It is made available under aThe copyright holder for this preprintthis version posted January 14, 2020. . https://doi.org/10.1101/2020.01.13.904730doi: bioRxiv preprint

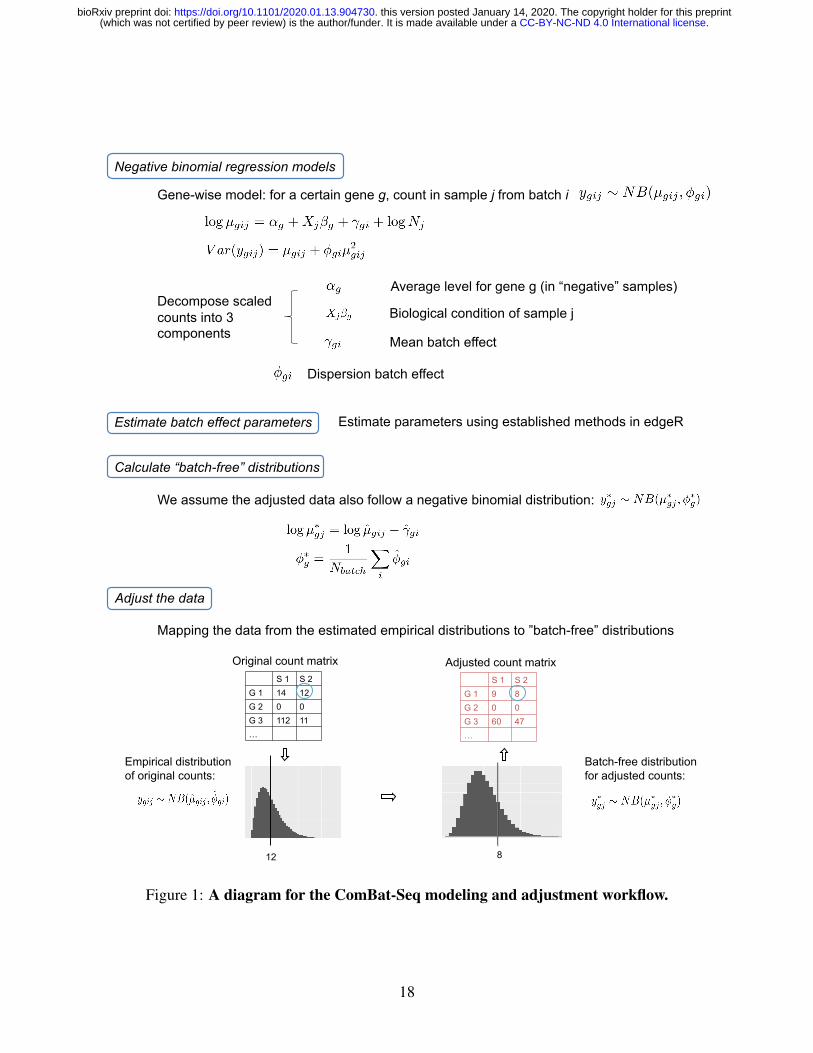
ComBat-Seq model
We define a regression model for each gene. Let the expression count value for gene g of sample
j from batch i be denoted by ygij . We assume that ygij follows a negative binomial distribution
NB(µgij, φgi), where µgij and φgi are the mean and the dispersion parameters. We propose the
gene-wise model:
log µgij = αg +Xjβg + γgi + logNj (1)
var(ygij) = µgij + φgiµ2gij (2)
where αg denotes the logarithm of expected counts for "negative" samples. Xjβg reflects
changes to the log of expected counts due to biological conditions, which is preserved in the data
after adjustment. In this term, Xj may be an indicator of the biological condition for sample j,
or a continuous value for a clinical covariate. βg denotes the corresponding regression coefficient.
Nj represents the library size, i.e. total counts across all genes in sample j. The mean and disper-
sion batch effect parameters are denoted by γgi and φgi, respectively, modeling the effect of batch
i on gene g. We estimate the model parameters, especially batch effect parameters γgi and φgi,
following the established methods in edgeR (Robinson et al., 2010; McCarthy et al., 2012; Chen
et al., 2014). Specifically, the mean batch effect parameters γgis are estimated with Fisher scor-
ing iteration, implemented in an optimized way to reduce the computational time. The dispersion
parameters φgi are estimated gene-wise by maximizing the Cox–Reid adjusted profile likelihood
(APL), as defined in Chen et al. (2014), and results in non-negative dispersion estimates. Note that
the estimates for mean of expression are not required to be non-negative, since they are on the log
scale. We estimated the gene-wise dispersion within each batch in ComBat-Seq.
ComBat-Seq adjustment
After the modeling, we obtain estimated batch effect parameters γ̂gi and φ̂gi, as well as the fit-
ted expectation of count µ̂gij . We then calculate parameters for "batch-free" distributions as fol-
5
.CC-BY-NC-ND 4.0 International license(which was not certified by peer review) is the author/funder. It is made available under aThe copyright holder for this preprintthis version posted January 14, 2020. . https://doi.org/10.1101/2020.01.13.904730doi: bioRxiv preprint
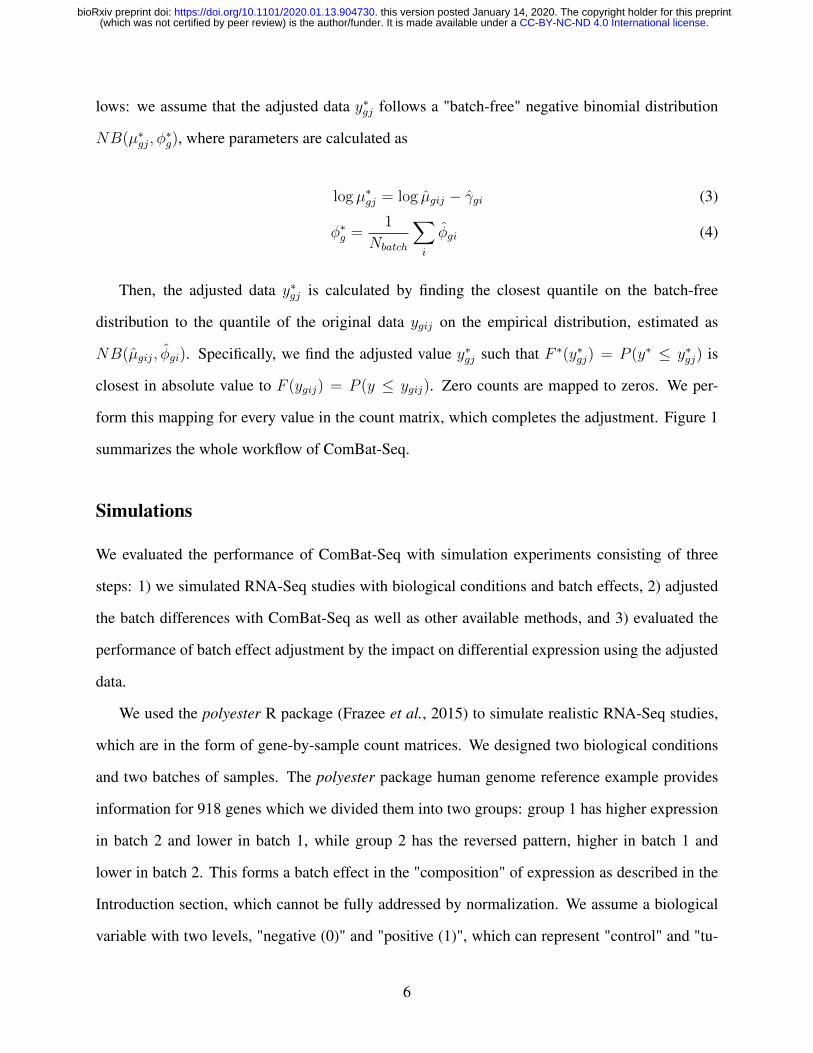
lows: we assume that the adjusted data y∗gj follows a "batch-free" negative binomial distribution
NB(µ∗gj, φ
∗g), where parameters are calculated as
log µ∗gj = log µ̂gij − γ̂gi (3)
φ∗g =
1
Nbatch
∑i
φ̂gi (4)
Then, the adjusted data y∗gj is calculated by finding the closest quantile on the batch-free
distribution to the quantile of the original data ygij on the empirical distribution, estimated as
NB(µ̂gij, φ̂gi). Specifically, we find the adjusted value y∗gj such that F ∗(y∗gj) = P (y∗ ≤ y∗gj) is
closest in absolute value to F (ygij) = P (y ≤ ygij). Zero counts are mapped to zeros. We per-
form this mapping for every value in the count matrix, which completes the adjustment. Figure 1
summarizes the whole workflow of ComBat-Seq.
Simulations
We evaluated the performance of ComBat-Seq with simulation experiments consisting of three
steps: 1) we simulated RNA-Seq studies with biological conditions and batch effects, 2) adjusted
the batch differences with ComBat-Seq as well as other available methods, and 3) evaluated the
performance of batch effect adjustment by the impact on differential expression using the adjusted
data.
We used the polyester R package (Frazee et al., 2015) to simulate realistic RNA-Seq studies,
which are in the form of gene-by-sample count matrices. We designed two biological conditions
and two batches of samples. The polyester package human genome reference example provides
information for 918 genes which we divided them into two groups: group 1 has higher expression
in batch 2 and lower in batch 1, while group 2 has the reversed pattern, higher in batch 1 and
lower in batch 2. This forms a batch effect in the "composition" of expression as described in the
Introduction section, which cannot be fully addressed by normalization. We assume a biological
variable with two levels, "negative (0)" and "positive (1)", which can represent "control" and "tu-
6
.CC-BY-NC-ND 4.0 International license(which was not certified by peer review) is the author/funder. It is made available under aThe copyright holder for this preprintthis version posted January 14, 2020. . https://doi.org/10.1101/2020.01.13.904730doi: bioRxiv preprint

mor" samples in a real dataset, for example. We simulated both up-regulated and down-regulated
true differentially expressed genes in both gene groups with increased expression in the positive
(up-regulated) or the negative (down-regulated) biological condition. The remaining genes are only
affected by batch, not by the condition. Differences in the average count of genes are simulated by
specifying fold changes across biological and batch sample groups using polyester. We also made
the dispersion of batch 2 a number of times larger than that of batch 1, allowing for different true
dispersion parameters across batches. Figure 2 shows the design we used for simulated data.
We repeated the simulation while varying the level of mean and dispersion batch differences.
Specifically, we changed the parameters for simulation such that mean of batch 2 is 1.5, 2, or 3
times that of batch 1. The dispersion of batch 2 was set to be 2, 3 or 4 fold of that of batch 1.
Experiments with no mean batch effect or no dispersion differences were also included. Results
were averaged over 100 repeated simulations under each parameter setting.
Our selected parameters in simulations are consistent with the degree of batch effect in real
data, as summarized in Table 1. Our observed condition signal (fold change in expression) from
real studies range from 1.65 to 3.98, and we specified a biological signal of 2 fold in simulations.
With regard to batch differences in the moments, we observed mean batch effect to be in the range
of 1.62 and 1.88 fold, and variance difference to be in 1.26 to 7.09 fold. Our selected parameters
in the simulations align with the realistic range, suggesting that the results are likely representative
for the expected effect on real data batch adjustment.
The batch effects in mean and dispersion (variance) were adjusted with ComBat-Seq, the "one-
step" approach, i.e. to include the batch variable in differential expression linear models, as well
as with SVA-Seq and RUV-Seq. We also included another commonly used method in practice,
which is to transform the count matrix to logCPM, then use the batch correction methods designed
for Gaussian distributed data, such as the original ComBat method. Aside from batch adjusted
data, we included two additional experiments for comparison: differential expression performed
on 1) data without simulated batch effects, and 2) data with simulated batch differences, but no
adjustment. We compared both the statistical power (true positive rate, TPR) and control of type-
7
.CC-BY-NC-ND 4.0 International license(which was not certified by peer review) is the author/funder. It is made available under aThe copyright holder for this preprintthis version posted January 14, 2020. . https://doi.org/10.1101/2020.01.13.904730doi: bioRxiv preprint

I errors (false positive rate, FPR) in detection using data without batch effects, data with batch
effects before and after different adjustments.
Real data application
We applied the proposed ComBat-Seq approach on an RNA-Seq data from a perturbation experi-
ment using primary breast tissue attempting to profile the activity levels of growth factor receptor
network (GFRN) pathways in relation to breast cancer progression (Rahman et al. (2017); Mc-
Querry et al. (2019)). We took a subset of experiments, which consists of 3 batches. In each batch,
the expression of a specific GFRN oncogene was induced by transfection to activate the down-
stream pathway signals (different oncogene/pathway in each batch). Controls were transfected
with a vector that expresses a green fluorescent protein (GFP), and GFP controls were present in
all batches. More specifically, batch 1 contains 5 replicates of cells overexpressing HER2, and 12
replicates for GFP controls (GEO accession GSE83083); batch 2 contains 6 replicates of each for
EGFR and its corresponding controls (GEO accession GSE59765); batch 3 consists of 9 replicates
of each for wild type KRAS and GFP controls (GEO accession GSE83083).
Note that this is a challenging study design for batch effect adjustment: the control samples
are balanced across batches, while each of the 3 kinds of treated cells, with different levels of
biological signals, is completely nested within a single batch. A favorable adjustment would pool
control samples from the three batches, while keeping all treated cells separated from the controls,
and from each other.
We combined the three batches and performed batch correction. Among the batch correction
methods considered, only RUV-Seq, the original ComBat used on logged and normalized data,
and ComBat-Seq output adjusted data. We apply these methods to address the batch effects in
the pathway signature dataset. We compared ComBat-Seq with the other methods, both qualita-
tively through principal component analysis (PCA), and quantitatively with explained variations
by condition and batch.
8
.CC-BY-NC-ND 4.0 International license(which was not certified by peer review) is the author/funder. It is made available under aThe copyright holder for this preprintthis version posted January 14, 2020. . https://doi.org/10.1101/2020.01.13.904730doi: bioRxiv preprint

Results
We developed and implemented ComBat-Seq as described above, and applied the method to the
simulated and real data examples. In the sections below, we justify the necessity of using negative
binomial distribution instead of Gaussian distribution for count data. We then summarize our
observations in simulations and a real data application example, showing the potential benefits of
ComBat-Seq adjustment.
Using appropriate model assumptions for count data
An example demonstrating the weakness of Gaussian-based models is given in Figure 3. In this
example, we simulated a count matrix using polyester (Frazee et al., 2015) with balanced case-
control design and 2 batches. Figure 3 shows the counts in a gene. The control samples in both
batches have low expression, while there is a case sample in batch 2 with a relatively large count
over 30. When estimating the differences in mean across batch, due to the sample with the large
count in the second batch, the mean of the second batch is estimated to be larger than that of batch
1. If we apply Gaussian-based batch adjustment which brings the mean to the same level, control
samples in the second batch will be adjusted to negative values, while counts in the first batch will
be increased. This results in a significant artificial difference between control samples from the
two batch after correction (P = 0.0033). These observations demonstrate the potential issue of
applying batch correction method using Gaussian distribution on count data. A more appropriate
model for integer counts would avoid such limitations.
We then applied the ComBat-Seq method, which assumes negative binomial distributions for
the underlying data. As shown in Figure 3, the adjusted data do not contain negative values or
the false significant result between the control samples of the two batches. This suggest that the
negative binomial assumption indeed addresses the limitations mentioned above.
9
.CC-BY-NC-ND 4.0 International license(which was not certified by peer review) is the author/funder. It is made available under aThe copyright holder for this preprintthis version posted January 14, 2020. . https://doi.org/10.1101/2020.01.13.904730doi: bioRxiv preprint
Simulations
We evaluated ComBat-Seq and compared its performance with other available approaches in our
simulation studies as described in the Method section. Results comparing all batch adjustment
methods under different settings of degree of batch effects are summarized in Figure 4.
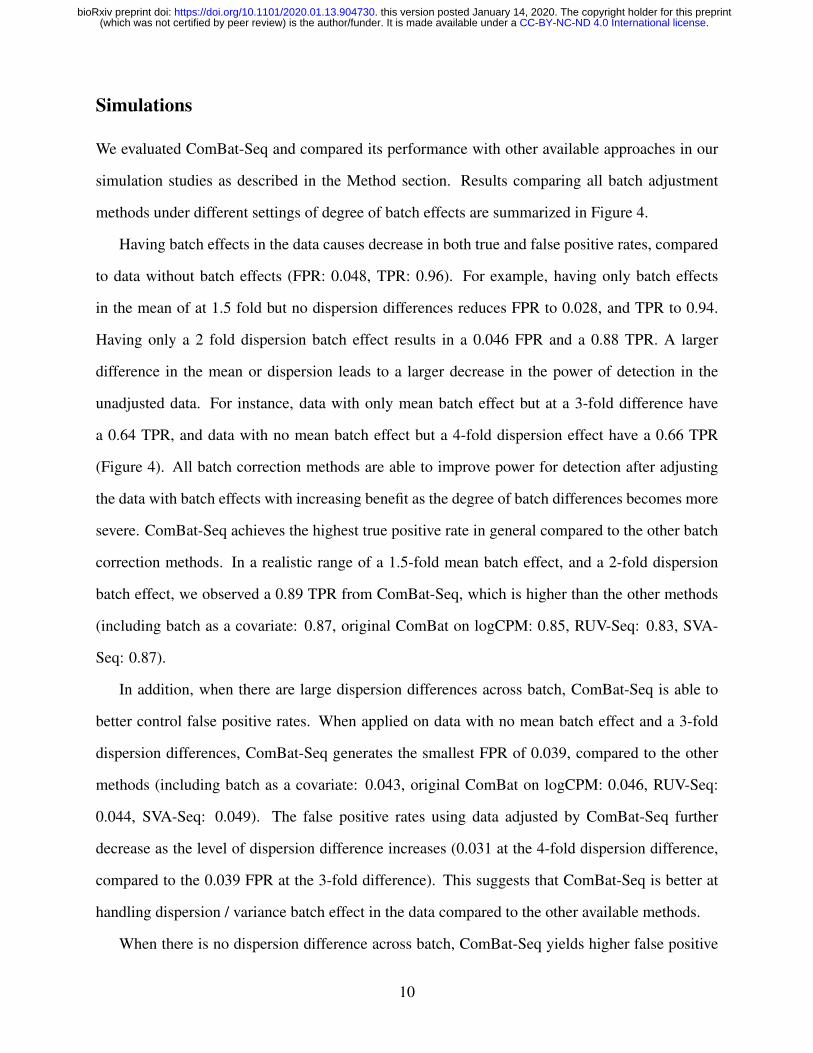
Having batch effects in the data causes decrease in both true and false positive rates, compared
to data without batch effects (FPR: 0.048, TPR: 0.96). For example, having only batch effects
in the mean of at 1.5 fold but no dispersion differences reduces FPR to 0.028, and TPR to 0.94.
Having only a 2 fold dispersion batch effect results in a 0.046 FPR and a 0.88 TPR. A larger
difference in the mean or dispersion leads to a larger decrease in the power of detection in the
unadjusted data. For instance, data with only mean batch effect but at a 3-fold difference have
a 0.64 TPR, and data with no mean batch effect but a 4-fold dispersion effect have a 0.66 TPR
(Figure 4). All batch correction methods are able to improve power for detection after adjusting
the data with batch effects with increasing benefit as the degree of batch differences becomes more
severe. ComBat-Seq achieves the highest true positive rate in general compared to the other batch
correction methods. In a realistic range of a 1.5-fold mean batch effect, and a 2-fold dispersion
batch effect, we observed a 0.89 TPR from ComBat-Seq, which is higher than the other methods
(including batch as a covariate: 0.87, original ComBat on logCPM: 0.85, RUV-Seq: 0.83, SVA-
Seq: 0.87).
In addition, when there are large dispersion differences across batch, ComBat-Seq is able to
better control false positive rates. When applied on data with no mean batch effect and a 3-fold
dispersion differences, ComBat-Seq generates the smallest FPR of 0.039, compared to the other
methods (including batch as a covariate: 0.043, original ComBat on logCPM: 0.046, RUV-Seq:
0.044, SVA-Seq: 0.049). The false positive rates using data adjusted by ComBat-Seq further
decrease as the level of dispersion difference increases (0.031 at the 4-fold dispersion difference,
compared to the 0.039 FPR at the 3-fold difference). This suggests that ComBat-Seq is better at
handling dispersion / variance batch effect in the data compared to the other available methods.
When there is no dispersion difference across batch, ComBat-Seq yields higher false positive
10
.CC-BY-NC-ND 4.0 International license(which was not certified by peer review) is the author/funder. It is made available under aThe copyright holder for this preprintthis version posted January 14, 2020. . https://doi.org/10.1101/2020.01.13.904730doi: bioRxiv preprint
rates with no further gain in detection power. For example, when data contain no dispersion batch
effect, only a 2-fold mean batch effect, ComBat-Seq, SVA-Seq, and including batch as a covariate
in the differential expression model all achieve 0.97 TPR, while ComBat-Seq has the highest FPR
of 0.059 (0.047 for both the other two methods). This is consistent with the intuition for batch
correction. Existing methods, such as including batch as a covariate in the differential expression
methods, may be sufficient in addressing batch effect in the mean. In this case, ComBat-Seq which
assumes separate dispersion across batch may be redundant and lead to higher false positives. Only
when there exists dispersion / variance differences in the data are methods which specify separate
dispersion parameters necessary.
Application to the GFRN signature dataset
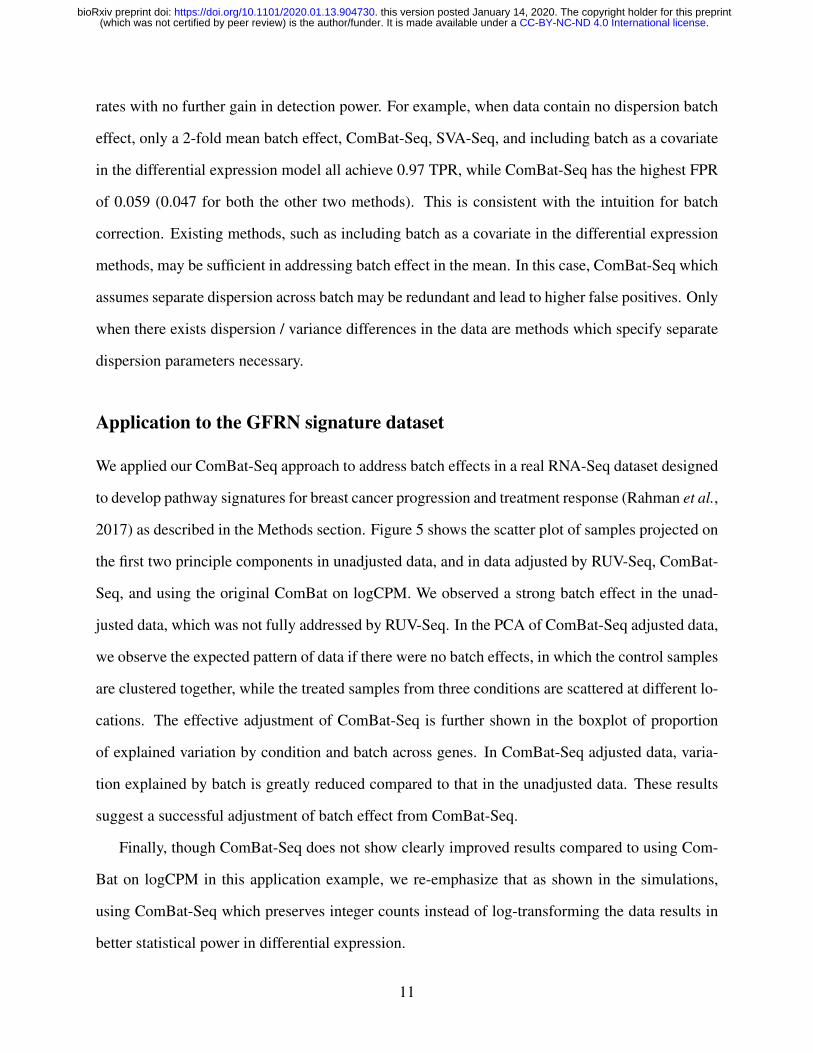
We applied our ComBat-Seq approach to address batch effects in a real RNA-Seq dataset designed
to develop pathway signatures for breast cancer progression and treatment response (Rahman et al.,
2017) as described in the Methods section. Figure 5 shows the scatter plot of samples projected on
the first two principle components in unadjusted data, and in data adjusted by RUV-Seq, ComBat-
Seq, and using the original ComBat on logCPM. We observed a strong batch effect in the unad-
justed data, which was not fully addressed by RUV-Seq. In the PCA of ComBat-Seq adjusted data,
we observe the expected pattern of data if there were no batch effects, in which the control samples
are clustered together, while the treated samples from three conditions are scattered at different lo-
cations. The effective adjustment of ComBat-Seq is further shown in the boxplot of proportion
of explained variation by condition and batch across genes. In ComBat-Seq adjusted data, varia-
tion explained by batch is greatly reduced compared to that in the unadjusted data. These results
suggest a successful adjustment of batch effect from ComBat-Seq.
Finally, though ComBat-Seq does not show clearly improved results compared to using Com-
Bat on logCPM in this application example, we re-emphasize that as shown in the simulations,
using ComBat-Seq which preserves integer counts instead of log-transforming the data results in
better statistical power in differential expression.
11
.CC-BY-NC-ND 4.0 International license(which was not certified by peer review) is the author/funder. It is made available under aThe copyright holder for this preprintthis version posted January 14, 2020. . https://doi.org/10.1101/2020.01.13.904730doi: bioRxiv preprint
Discussion and conclusions
We developed ComBat-Seq to adjust batch effects from known sources in count data from RNA-
Seq studies. ComBat-Seq is able to preserve the integer nature of count data, making the analysis
pipeline more compatible for RNA-Seq studies. We showed in simulations that ComBat-Seq gen-
erally out-performs other methods in terms of the impact on downstream differential expression.
When variance batch effect is present in the data, ComBat-Seq is able to achieve better statistical
power, while controlling false positive rates, compared to the other available methods. We further
demonstrated the utility of ComBat-Seq in addressing batch effect in the GFRN signature dataset,
showing its potential to recover biological signals from data affected by batch.
In simulations, we observed that when there is no true difference in dispersion across batch,
applying ComBat-Seq, which specifies different dispersion parameters for batches, results in in-
creased false positive rates compared to the other methods without further increasing the detection
power. ComBat-Seq controls false positives and shows benefits in increased true positive rates
only when a true dispersion batch effect is present in the data. This is consistent with the intuition
of batch effect adjustment, that modifying the data in any way comes with a risk of jeopardiz-
ing biological signals in the data. Therefore, batch effects should only be adjusted when they are
present and result in unfavorable impact on downstream analysis. Such observations emphasize
the importance for careful diagnosis of batch effect before applying any transformation to the data.
In the simulation studies, we also compared ComBat-Seq with the commonly applied approach
to transform the count matrix to logCPM, and then apply batch correction methods based on Gaus-
sian distributions. This method essentially assumes a log-normal distribution for the data. In
simulations, we observed that ComBat-Seq generally out-performs log transforming the data in
terms of power and control of false positives. These results provide evidence that using appropri-
ate probabilistic models for count data may be more beneficial than arbitrarily transforming the
data.
Our study has several limitations. We used an idealistic data model in simulations, and charac-
terized biological signals and batch effects in the form of fold changes in the average value across
12
.CC-BY-NC-ND 4.0 International license(which was not certified by peer review) is the author/funder. It is made available under aThe copyright holder for this preprintthis version posted January 14, 2020. . https://doi.org/10.1101/2020.01.13.904730doi: bioRxiv preprint

batch. Though there may be other methods to model count data with both condition and batch
effects, our model is a valid and convenient assumption for the data, which is easy to implement
with the polyster package. We focused primarily on addressing the unwanted impact of batch
effect on downstream differential expression. It is known that batch effects may also negatively
impact other biological tasks, such as developing predictive models for genomic data. Performance
of batch correction in these tasks requires further evaluation, but is beyond the scope of this pa-
per. Our ComBat-Seq method is based on a gene-wise negative binomial regression model, which,
similar to other (generalized) linear models, may not work well on data with severely or even com-
pletely confounded study designs. However, batch correction in confounded designs is challenging
for most if not all the state-of-the-art batch adjustment methods, and careful experimental design
has been widely advised to mitigate the unfavorable impact of batch effects.
Reproducibility
ComBat-Seq software is available at https://github.com/zhangyuqing/sva-devel.
Code to reproduce the results in this paper are available at https://github.com/zhangyuqing/
ComBat-seq.
Acknowledgement
This work is supported by grants from the NIH 4P30CA006516-51 (Giovanni Parmigiani), NSF-
DMS 1810829 (Giovanni Parmigiani), 5U01 CA220413-03 (W. Evan Johnson), and 5R01GM127430-
02 (W. Evan Johnson). We would like to thank Dr. Solaiappan Manimaran for insightful discus-
sions throughout the development of this method.
13
.CC-BY-NC-ND 4.0 International license(which was not certified by peer review) is the author/funder. It is made available under aThe copyright holder for this preprintthis version posted January 14, 2020. . https://doi.org/10.1101/2020.01.13.904730doi: bioRxiv preprint

References
Chen, Y., Lun, A. T., and Smyth, G. K. (2014). Differential expression analysis of complex rna-
seq experiments using edger. In Statistical analysis of next generation sequencing data, pages
51–74. Springer.
Frazee, A. C., Jaffe, A. E., Langmead, B., and Leek, J. T. (2015). Polyester: simulating rna-seq
datasets with differential transcript expression. Bioinformatics, 31(17), 2778–2784.
Johnson, W. E., Li, C., and Rabinovic, A. (2007). Adjusting batch effects in microarray expression
data using empirical bayes methods. Biostatistics, 8(1), 118–127.
Law, C. W., Chen, Y., Shi, W., and Smyth, G. K. (2014). voom: Precision weights unlock linear
model analysis tools for rna-seq read counts. Genome biology, 15(2), R29.
Leek, J. T. (2014). Svaseq: removing batch effects and other unwanted noise from sequencing
data. Nucleic acids research, 42(21), e161–e161.
Leek, J. T., Scharpf, R. B., Bravo, H. C., Simcha, D., Langmead, B., Johnson, W. E., Geman, D.,
Baggerly, K., and Irizarry, R. A. (2010). Tackling the widespread and critical impact of batch
effects in high-throughput data. Nature Reviews Genetics, 11(10), 733.
Love, M. I., Huber, W., and Anders, S. (2014). Moderated estimation of fold change and dispersion
for rna-seq data with deseq2. Genome biology, 15(12), 550.
McCarthy, D. J., Chen, Y., and Smyth, G. K. (2012). Differential expression analysis of multifactor
rna-seq experiments with respect to biological variation. Nucleic acids research, 40(10), 4288–
4297.
McQuerry, J. A., Jenkins, D. F., Yost, S. E., Zhang, Y., Schmolze, D., Johnson, W. E., Yuan, Y., and
Bild, A. H. (2019). Pathway activity profiling of growth factor receptor network and stemness
pathways differentiates metaplastic breast cancer histological subtypes. BMC cancer, 19(1),
881.
14
.CC-BY-NC-ND 4.0 International license(which was not certified by peer review) is the author/funder. It is made available under aThe copyright holder for this preprintthis version posted January 14, 2020. . https://doi.org/10.1101/2020.01.13.904730doi: bioRxiv preprint
Rahman, M., MacNeil, S. M., Jenkins, D. F., Shrestha, G., Wyatt, S. R., McQuerry, J. A., Piccolo,
S. R., Heiser, L. M., Gray, J. W., Johnson, W. E., et al. (2017). Activity of distinct growth fac-
tor receptor network components in breast tumors uncovers two biologically relevant subtypes.
Genome medicine, 9(1), 40.
Risso, D., Ngai, J., Speed, T. P., and Dudoit, S. (2014a). Normalization of rna-seq data using factor
analysis of control genes or samples. Nature biotechnology, 32(9), 896.
Risso, D., Dudoit, S., Risso, M. D., Biobase, D., BiocStyle, S., and biocViews DifferentialExpres-
sion, P. (2014b). Package ‘ruvseq’.
Robinson, M. D. and Oshlack, A. (2010). A scaling normalization method for differential expres-
sion analysis of rna-seq data. Genome biology, 11(3), R25.
Robinson, M. D., McCarthy, D. J., and Smyth, G. K. (2010). edger: a bioconductor package for
differential expression analysis of digital gene expression data. Bioinformatics, 26(1), 139–140.
Sugathan, A., Biagioli, M., Golzio, C., Erdin, S., Blumenthal, I., Manavalan, P., Ragavendran, A.,
Brand, H., Lucente, D., Miles, J., et al. (2014). Chd8 regulates neurodevelopmental pathways
associated with autism spectrum disorder in neural progenitors. Proceedings of the National
Academy of Sciences, 111(42), E4468–E4477.
Suliman, S., Thompson, E. G., Sutherland, J., Weiner 3rd, J., Ota, M. O., Shankar, S., Penn-
Nicholson, A., Thiel, B., Erasmus, M., Maertzdorf, J., et al. (2018). Four-gene pan-african blood
signature predicts progression to tuberculosis. American journal of respiratory and critical care
medicine, 197(9), 1198–1208.
Zak, D. E., Penn-Nicholson, A., Scriba, T. J., Thompson, E., Suliman, S., Amon, L. M., Ma-
homed, H., Erasmus, M., Whatney, W., Hussey, G. D., et al. (2016). A blood rna signature for
tuberculosis disease risk: a prospective cohort study. The Lancet, 387(10035), 2312–2322.
15
.CC-BY-NC-ND 4.0 International license(which was not certified by peer review) is the author/funder. It is made available under aThe copyright holder for this preprintthis version posted January 14, 2020. . https://doi.org/10.1101/2020.01.13.904730doi: bioRxiv preprint

Zhang, Y., Jenkins, D. F., Manimaran, S., and Johnson, W. E. (2018). Alternative empirical bayes
models for adjusting for batch effects in genomic studies. BMC bioinformatics, 19(1), 262.
16
.CC-BY-NC-ND 4.0 International license(which was not certified by peer review) is the author/funder. It is made available under aThe copyright holder for this preprintthis version posted January 14, 2020. . https://doi.org/10.1101/2020.01.13.904730doi: bioRxiv preprint

Dataset Condition Batch Mean Batch Dispersion References
GFRN 1.65 1.88 2.78 Rahman et al. (2017)CHD8 2.92 1.68 7.09 Sugathan et al. (2014)
TB 3.98 1.62 1.26 Zak et al. (2016); Suliman et al. (2018)
Table 1: Levels of biological and batch effects in real datasets. For the condition effect, we usededgeR to perform differential expression within one of the batches in the studies, and identified thetop-50 up-regulated, and top-50 down-regulated genes, ranked by FDR corrected P values. We tookthe median of fold changes across conditions among the top-50 up-regulated genes, and the medianof those among the down-regulated genes. We reported the maximum of two medians in the table.For mean batch effects, we calculated the gene-wise average expression within each batch, andeach biological condition. We took the median of mean expression across genes, then comparedthe medians across batch, and report the maximum fold change. For dispersion differences, wereport the maximum fold change in the median gene-wise dispersion across batch. Gene-wisedispersion are estimated with edgeR.
17
.CC-BY-NC-ND 4.0 International license(which was not certified by peer review) is the author/funder. It is made available under aThe copyright holder for this preprintthis version posted January 14, 2020. . https://doi.org/10.1101/2020.01.13.904730doi: bioRxiv preprint
Decompose scaled counts into 3 components
Average level for gene g (in “negative” samples)
Biological condition of sample j
Mean batch effect
Dispersion batch effect
Gene-wise model: for a certain gene g, count in sample j from batch i
Negative binomial regression models
Estimate batch effect parameters
Calculate “batch-free” distributions
We assume the adjusted data also follow a negative binomial distribution:
Estimate parameters using established methods in edgeR
S 1 S 2G 1 14 12G 2 0 0G 3 112 11…
12 8
Empirical distribution of original counts:
S 1 S 2G 1 9 8G 2 0 0G 3 60 47…
Adjusted count matrixOriginal count matrix
Adjust the data
Mapping the data from the estimated empirical distributions to ”batch-free” distributions
Batch-free distribution for adjusted counts:
Figure 1: A diagram for the ComBat-Seq modeling and adjustment workflow.
18
.CC-BY-NC-ND 4.0 International license(which was not certified by peer review) is the author/funder. It is made available under aThe copyright holder for this preprintthis version posted January 14, 2020. . https://doi.org/10.1101/2020.01.13.904730doi: bioRxiv preprint

Figure 2: Study design of the simulation experiments. The data are in the form of gene bysample matrices. We simulated 2 biological conditions: negative (0) and positive (1), as well as2 batches. We also simulated 2 groups of genes. Group 1 has higher expression in batch 2 andlower in batch 1, while group 2 has the reversed pattern, higher in batch 1 and lower in batch2. The figure shows high expression in yellow, and low expression in blue. We also simulateddifferentially expressed genes in both groups. A deeper color represents increased expression dueto biological condition.
Figure 3: Problematic results caused by applying Gaussian-based batch adjustment approachon count data. We simulated count matrix with a balanced case-control design and 2 batches. Thefigure shows counts in a gene which is lowly expressed in almost all control samples. However, onecase sample in the second batch contains a high count. Adjustment based on Gaussian distributionbrings the mean of two batches to the same level, causing artificially induced differences acrosscontrol samples from the two batches. When applying ComBat-Seq which is based on negativebinomial distribution, the adjusted data no longer contain the negative values or the erroneoussignificant difference between control samples from the two batches.
19
.CC-BY-NC-ND 4.0 International license(which was not certified by peer review) is the author/funder. It is made available under aThe copyright holder for this preprintthis version posted January 14, 2020. . https://doi.org/10.1101/2020.01.13.904730doi: bioRxiv preprint
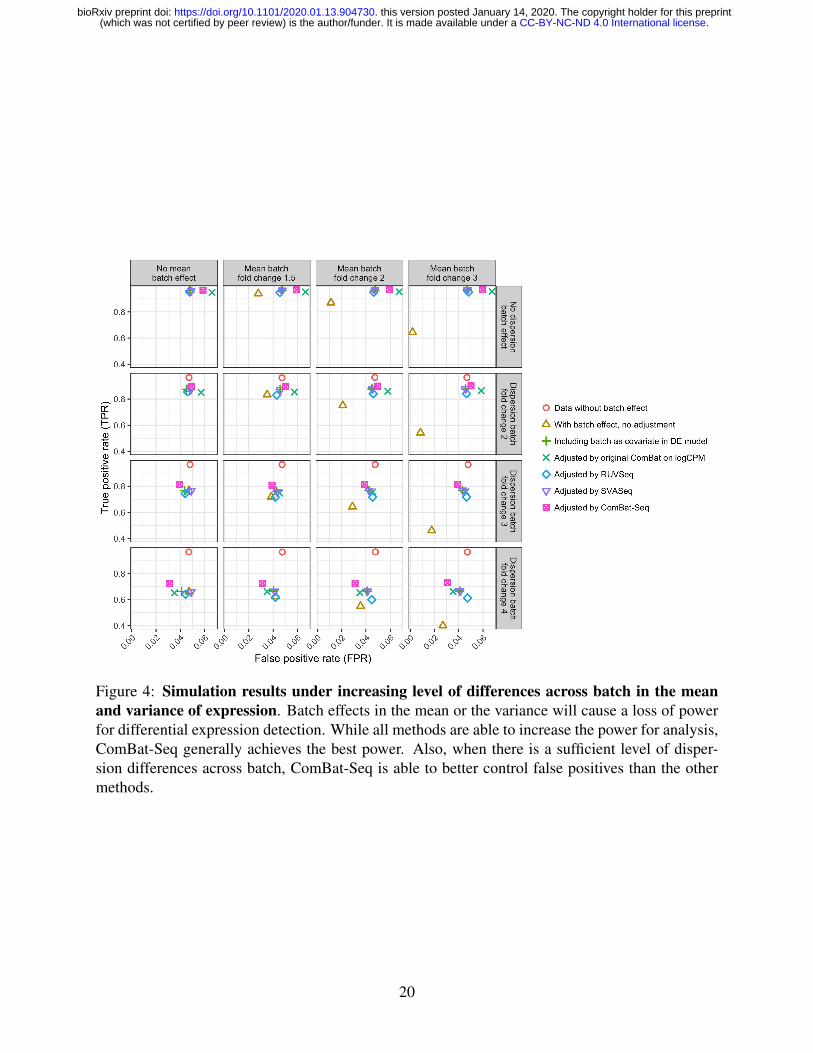
Figure 4: Simulation results under increasing level of differences across batch in the meanand variance of expression. Batch effects in the mean or the variance will cause a loss of powerfor differential expression detection. While all methods are able to increase the power for analysis,ComBat-Seq generally achieves the best power. Also, when there is a sufficient level of disper-sion differences across batch, ComBat-Seq is able to better control false positives than the othermethods.
20
.CC-BY-NC-ND 4.0 International license(which was not certified by peer review) is the author/funder. It is made available under aThe copyright holder for this preprintthis version posted January 14, 2020. . https://doi.org/10.1101/2020.01.13.904730doi: bioRxiv preprint
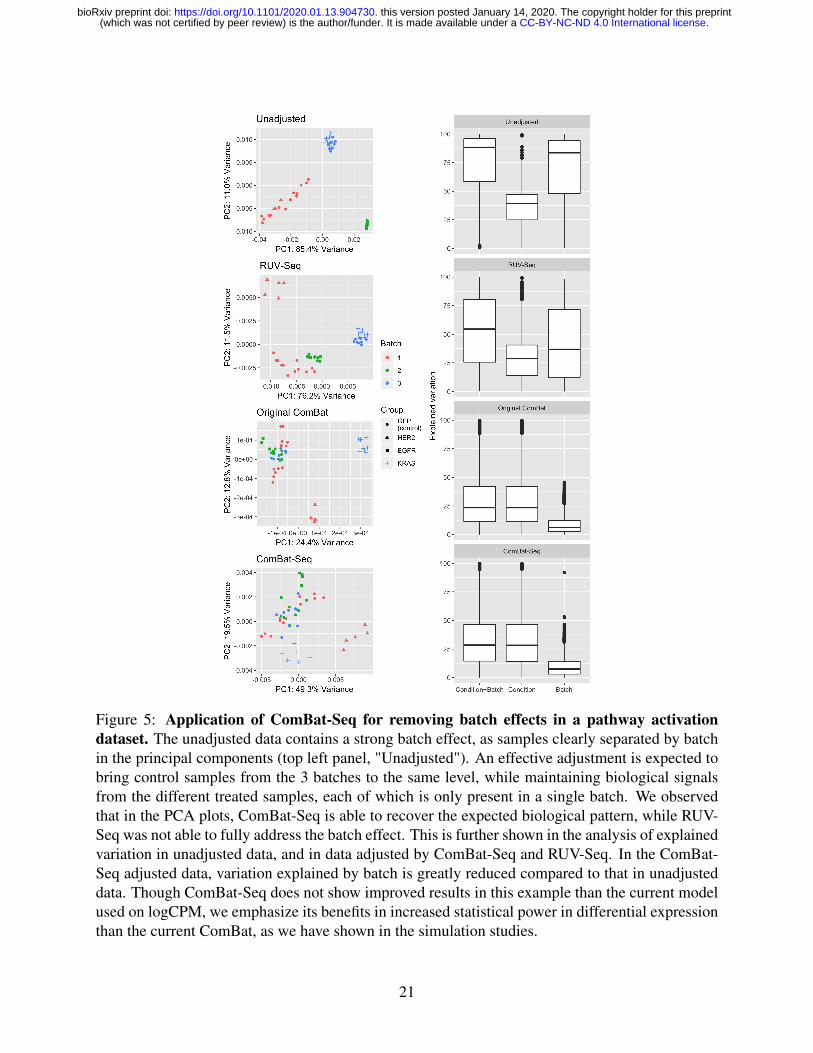
Figure 5: Application of ComBat-Seq for removing batch effects in a pathway activationdataset. The unadjusted data contains a strong batch effect, as samples clearly separated by batchin the principal components (top left panel, "Unadjusted"). An effective adjustment is expected tobring control samples from the 3 batches to the same level, while maintaining biological signalsfrom the different treated samples, each of which is only present in a single batch. We observedthat in the PCA plots, ComBat-Seq is able to recover the expected biological pattern, while RUV-Seq was not able to fully address the batch effect. This is further shown in the analysis of explainedvariation in unadjusted data, and in data adjusted by ComBat-Seq and RUV-Seq. In the ComBat-Seq adjusted data, variation explained by batch is greatly reduced compared to that in unadjusteddata. Though ComBat-Seq does not show improved results in this example than the current modelused on logCPM, we emphasize its benefits in increased statistical power in differential expressionthan the current ComBat, as we have shown in the simulation studies.
21
.CC-BY-NC-ND 4.0 International license(which was not certified by peer review) is the author/funder. It is made available under aThe copyright holder for this preprintthis version posted January 14, 2020. . https://doi.org/10.1101/2020.01.13.904730doi: bioRxiv preprint