erange rna-seq pipeline
TRANSCRIPT

RNA-Seq and Differentially Expressed Gene Analysis
PipelineNCIBI/RCMI –Workshop on
Translational Bioinformatics
U-M, Ann Arbor, MichiganJuly 29-30, 2010
1

RNA-Seq Workshop
Jim Cavalcoli, Yongsheng Bai, Xiao-Wei Chen, Rich McEachin
2

Roadmap
• Next Generation Sequencing (Jim)– Methods and platforms
• Differential Gene Expression (Xiao-Wei)– SEC-24a
• RNA-Seq (Rich)• Analysis pipeline (Yongsheng)
– Candidate Gene Selection (hands on) – ConceptGen (hands on)– Biological relevance
3

Next-Generation Sequencing
Overview of methods and platforms available
4
Outline
• Technology Description and examination of different platforms
• Biological Applications of the Methods
• Informatics applications
5

Next-Generation Sequencing
• Should be called “Now-generation”…. It’s Here!
• Enhanced sequencing capabilities– Increased throughput (huge increase in # of reads, decrease
in time to produce)– Decreased costs per base– Ability to sequence from individual samples
6

Platform InformationCompany Roche Applied
BiosystemsIlumina Dover Systems Helicos Pacific
Biosciences
Platform FLX SOLiD 3 GA II, HiSeq2000 Polonator Heliscope -
Method of Sequencing
Emulsion PCR on beads
Emulsion PCR on beads
Bridge PCR Amplification
Emulsion PCR on beads
Single moleculesequencing
Single molecule SMRT
Chemistry Pyrosequencing with polymerase
Ligation (dual-base encoding)
Reversible terminator with polymerase
Ligation (single base encoding)
Asynchronous extension using polymerase
Single molecule SMRT
Machine cost ~500K ~600K ~600K ~170K ~999K ~600K (anticipated)
Reagents per Run (cost per MB)
5K ($60) 3K ($2) 4-6K ($2) 1K ($1) 18K ($2) $ 99 (?)
Capacity per Run 0.5 GB 60+ GB 25-35K (much more with HiSeq)
4-10 GB 28 GB 72 Mb (predicted)
Read Length 400-600 nt 50 nt 36-100 nt 13 nt 25-50 nt 580-2,800 nt
Input DNA required 500 ng-1ug 10 ng (200-10kb input fragment)
0.1-10ug (200-500 bp fragment)
- As low as 50 pg -
Advantages Long read length Accuracy of dual base calls, high output
No emulsion PCR Open source model No clonalamplification
No clonalamplification
Disadvantages Unreliable for homopolymerregions
Short read length Medium read length, long run times
Short read length Cost of machine ?
Primary Error Type Indel substitution substitution substitution deletion
Table created jointly from: Lerner and Fleisher, 2010. The Auk 127(1):4-15; and Shendon and Ji, 2008. Nat. Biotech. 26(10):1135-1145.
7

More about major platforms
• Illumina Solexa– http://www.youtube.com/watch?v=77r5p8IBwJk
• Roche 454– http://www.youtube.com/watch?v=bFNjxKHP8Jc
• ABI SOLiD– http://www.youtube.com/watch?v=nlvyF8bFDwM
• Choice of technology is dependent on the experimental method and hypothesis
8

Types of Applications to Biology• Genomic Resequencing
– Sequencing select genomic regions, and comparing to a reference genome
• De novo assembly of novel genomes– Needs lots of depth of coverage– Works best for small (bacterial) genomes– Paired ends and different size libraries
• RNA Expression (RNA-Seq)– Expressed genes and level of expression – more detail to follow
• Protein binding to DNA (ChIP-Seq)– Immunoprecipitation of Protein bound to DNA (chromatin)
• Primer-specific sequencing (16S RNA)– Identifies communities of 16S RNA in microbe / samples
• Metagenomic sequencing – shotgun sequencing from a community of DNA
• Methylation of DNA (Bisulfite sequencing)9

Library type
• Three major types of sequencing can be planned for:– Single End reads– Paired End reads– Mate Pair reads
10

Library Methods
Fragment size – “Insert” 200-500 bpSingle End
Paired End
Mate-Pair2-5 Kb
Biotinylate
Circularlize
Affinity Purify 11

http://www.illumina.com/pages.ilmn?ID=203
Illumina: Solexa
12

13

Library PreparationUsing a series of standard molecular biology techniques, short adaptors (A and B) - specific for both the 3' and 5' ends - are added to each fragment. The adaptors are used for purification, amplification, and sequencing steps. Single-stranded fragments with A and B adaptors compose the sample library used for subsequent workflow steps.
One Fragment = One BeadThe single-stranded DNA library is immobilized onto specifically designed DNA Capture Beads. Each bead carries a unique single-stranded DNA library fragment. The bead-bound library is emulsified with amplification reagents in a water-in-oil mixture resulting in microreactors containing just one bead with one unique sample-library fragment.
emPCR (Emulsion PCR) AmplificationEach unique sample library fragment is amplified within its own microreactor, excluding competing or contaminating sequences. Amplification of the entire fragment collection is done in parallel; for each fragment, this results in a copy number of several million per bead. Subsequently, the emulsion PCR is broken while the amplified fragments remain bound to their specific beads.
454 Process
14

454 (Roche) • Beads with millions of copies of
DNA are sequenced in parallel.
• Polymerase extends the existing DNA strand by adding nucleotide(s). If a nucleotide complementary to the template strand is flowed into a well,
• The Addition of one (or more) nucleotide(s) results in a reaction that generates a light signal that is recorded by the CCD camera.
• The signal strength is proportional to the number of nucleotides, for example, homopolymer stretches, incorporated in a single nucleotide flow
15

Output from GenomeAnalyzer II(Illumina – Solexa)
• Read length 36, 75, 100 nt– 150 nt and more, soon– Single Read, Paired-End reads as well as Mate-Pair reads
• 8 lanes per flow cell, 15-20 million reads per lane
• ~ 30 Gbases per flow cell – PE, 100 nt
• Accuracy is ~99 - 99.5% – Primary type of error: Substitution– 150 million errors per flow cell!
16

Data output and processing• Image data output (tiff files)
– 100 tiles per lane, 8 lanes per flow cell, 100 cycles.
– 4 images (A,G,C,T) per tile per cycle = 320,000 images
– Each tiff image is ~ 7 MB = 2,240,000 MB of data (2.24 TB !)– 4.5 TB for 100 nt Paired-end read
• Illumina Pipeline:– Firecrest (image analysis)
• Locates clusters and calculates intensity and noise– Bustard (base calling)
• Deconvolutes signal and corrects for cross-talk, phasing– GERALD – generation of recursive analyses linked by dependency
• ELAND – (Efficient large-scale alignment of nucleotide databases)
17

Sequence text output
18

Other software applications for assembly and alignment
http://seqanswers.com/ 19

Data from ChIP Seq
experiments
20

Xbp1 transcript Hit Maps global view and Ire1a cleavage sites zoomed in on.
?
?
21

Bioinformatics workflow
• Image extraction• Base Calling, quality scoring• Align reads to known sequence OR each other• Assemble Reads• Analysis of genes, regions• Coverage, quantification• Annotation
22

Summary• Technology is available to rapidly use DNA
sequencing to address biology questions without needing to be a sequencing center.
• Bioinformatics is challenged to keep up and develop robust methods as the technology is rapidly changing and improving.
• 3rd-Gen sequencing is just about here.
23

Xiao-Wei Slides
• Not available for printing
24

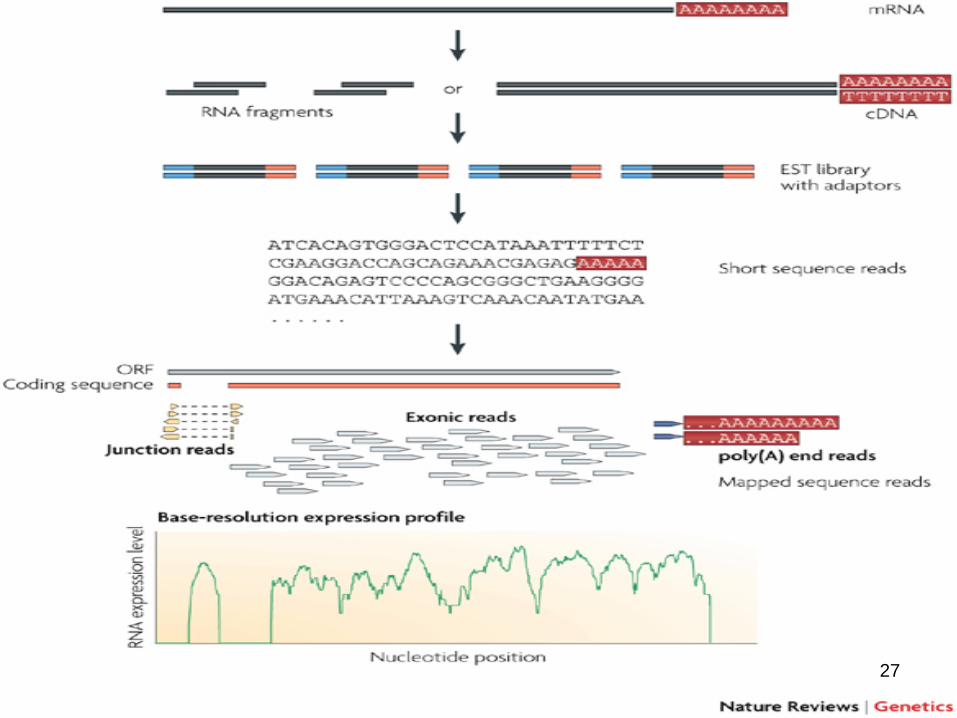
RNA-Seq
• Transcriptome analysis comparable to microarray analysis– Complementary DNA (cDNA) is generated
from mRNA • Rather than hybidizing to array, cDNA
“reads” are sequenced using next-gen technologies
• Reads are aligned to a reference genome and a transcriptome map is constructed
RNA-Seq: a revolutionary tool for transcriptomics Nat Rev Genet. 2009 Jan;10(1):57-6325

Aims of RNA-Seq
• Quantify mRNA abundance• Determine the transcriptional structure of
genes: start sites, 5′ and 3′ ends, splicing patterns
• Quantify changing expression levels under comparable conditions– Sec24a wild type versus mutant
26
27

Visualizing RNA Seq Results
28

Alignment Issues
• Identify Intron/Exon Boundaries– Known splice sites based on gene models– Transcripts consistent with novel splice sites
• Multiple matches of read to sequence– Paralogous sequences– Repetitive sequence
29

RNA-Seq Strengths
• High-throughput quantitative measurement of transcript abundance
• Expression levels correlate well with qPCR• Costs continue to fall due to multiplexing• Expected to replace microarrays for
transcriptomic studies• Automated pipeline
30

ERANGE (Enhanced Read Analysis of Gene Expression)
– Developed by Mortazavi et al. in Wold Lab at Caltech– Open-source, *nix platforms, python 2.5+– NOT a “point-and-click”, turn-key package– Memory and computation intensive– Dual-use for CHIP-Seq and RNA-Seq analysis– Require Cistematic version of the genomes
– A platform for cis-regulatory element analysis within and across multiple genomes
– Available at http://cistematic.caltech.edu– Need genome sequences and gene models from UCSC– Details available at http://woldlab.caltech.edu/rnaseq/
31

RNA-Seq Pipeline WorkflowStep 1. Setup the path and prepare
necessary files– Set up access paths for ERANGE (Enhanced Read Analysis
of Gene Expression), Cistematic, and Python– Download and prepare input data locally from UCSC:
chromosomes, gene models, repeatMask sequences (and other necessary annotation files) genome.ucsc.edu
– Create splice files and build expanded genome & repeatMaskdatabase
Whole chromosomes
Known genes
Repeats Exon junctions
32

RNA-Seq Pipeline Workflow (Cont.)Step 2. Map reads to Mouse genome
– Obtain NGS read sequence files (i.e. Solexa read data file s_*_sequence.txt)
– Align reads to the reference genome– ELAND (for read less then 30 bp)– BOWTIE (read length > 32 bp)– BLAT (read length > 50 bp)
33

RNA-Seq Pipeline Workflow (Cont.)Step 3. ERANGE counting pipeline
(http://woldlab.caltech.edu/rnaseq)– Count reads falling on gene models
– Filter out reads that overlap repeats– Map reads with a certain radius of genes
– Identify novel transcripts– Reads from all samples that did not fall within known
exons were aggregated into CANDIDATE exons by requiring regions with at least 15 reads whose starts are not separated by more than 30bp
– CANDIDATE exons that fell within 20 kb of one another but further than 20 kb from any other gene were aggregated into predicted “FAR” loci
– Weight multi-reads
34

RNA-Seq Pipeline Workflow (Cont.)Step 3. ERANGE counting pipeline
(http://woldlab.caltech.edu/rnaseq)– Reads that fell onto exons and candidate exons as well as
splices were summed up for each locus and normalized by the predicted mRNA length into expanded exonic read density
– Expressed as reads per KB per million reads (RPKM) using the formula 109C/NL
– Where C is the number of mappable reads falling on exons– N is the total number of mappable reads – L is the sum of the exon lengths in bps
– *.final.rpkm (uniques + spliced + multireads + RNAFAR) is the most comprehensive result among all of the output files
– RPKM can be converted into absolute transcript numbers
35

ERANGE output file (*.final.rpkm)
gene len_kb RPKMAlb1 2.028 31420.21Apoe 1.089 13931.63Apoa2 0.477 11242.40…
A list of differentially expressed genes
Entrez Gene ID773711311930939765741311714373…
RNA-Seq Pipeline Workflow (Cont.)Step 4. Gene level differential expression
(DE) analysis based on ERANGE output
R scripts to detect DE genes
36

Top over-represented biological concepts(Metabolic Processes)
fatty acid synthesis
monocarboxylic acid
carboxylic acid
organic acid
…
RNA-Seq Pipeline Workflow (Cont.)Step 5. Biological concepts enrichment
analysis for differentially expressed (down-regulated) genes
A list of differentially expressed genes
Entrez Gene ID773711311930939765741311714373…
37

References• Mortazavi A, Williams BA, McCue K, Schaeffer L, Wold
B: Mapping and quantifying mammalian transcriptomesby RNA-Seq. Nature Methods 2008, 5, 621-628.
• Sartor M, Mahavisno V, Keshamouni V, Cavalcoli J, Wright Z, Karnovsky A, Kuick R, Jagadish HV, Mirel B, Weymouth T, Athey B, Omenn G: ConceptGen: a gene set enrichment and gene set relation mapping tool. Bioinformatics 2010, 26(4):456-463.
38