combining academic, noncognitive, and college knowledge
TRANSCRIPT
RESEARCH & PRACTICE IN ASSESSMENT
5Volume Twelve | Summer 2017
CORRESPONDENCE
AUTHORS
James Soland, Ph.D. NWEA
Combining Academic, Noncognitive, and College Knowledge Measures to Identify Students Not on Track For College: A Data-Driven Approach
Considerable research has been devoted to identifying measures that predict whether a student is ready for college. These types of measures include (but are not limited to) test scores, grade-point average (GPA), secondary course-taking patterns, assessments of so-called “noncognitive” factors like grit, and surveys of how well students understand the college admissions process. Within each of these types of measures, there may be dozens of assessments or instruments shown to forecast college readiness. For example, there are hundreds of noncognitive surveys, many of which predict postsecondary success (Dweck, Walton, & Cohen, 2011). While a number of papers suggest how these different measures relate to each other (Conley, 2008; Dweck, Walton, & Cohen, 2011; Farrington et al., 2012), little guidance exists for practitioners on how to combine and prioritize these measures with the goal of optimally identifying students who will enter, and persist in, college. As a result, educators are left with a potentially overwhelming array of measures to choose from when attempting to figure out which students are not on track for college. I help address this issue by using data reduction techniques designed to select the measures that maximize the accuracy with which students are identified as being ready to enroll in college and persist for at least a semester. Results show that students not on track for a postsecondary education can be identified with 90 percent accuracy using only a handful of predictors. These predictors tend to measure four broad constructs—academic preparation, educational aspirations and expectations, socioeconomic status, and teacher perceptions of student performance—that educators can use to inform development of college readiness instruments and interventions for students, either before or after college begins.
These issues are examined by mining a national dataset with thousands of college readiness-related variables to answer two specific research questions. First, can a small subset of measures be combined into a single model that accurately and consistently identifies students not on track for college? Second, what are the most important predictors
AbstractResearch shows college readiness can be predicted using a variety of measures, including test scores, grades, course-taking patterns, non-cognitive instruments, and surveys of how well students understand
the college admissions process. However, few studies provide guidance on how educators can prioritize predictors of college readiness across
instruments, constructs, and frameworks to optimally identify students not on track for college. Using a nationally representative dataset with
thousands of measures, I employ data reduction techniques to identify a handful of variables that are the strongest predictors of college readiness
and understand what they measure. Based on my models, enrolling in college and persisting for a semester can be predicted with almost 90
percent accuracy using a small set of predictors. Evidence suggests these predictors measure academic preparation, postsecondary aspirations,
teacher perceptions of readiness, and socioeconomic status. Educators can use results to help identify appropriate supports for students not on
track for college.
RESEARCH & PRACTICE IN ASSESSMENT
6 Volume Twelve | Summer 2017
of college readiness across models and what do they measure? When trying to identify students not on track to enroll and persist in college, practitioners can use answers to these questions to maximize the usefulness of the data they already have—and find new readiness predictors that are simple to measure but can greatly increase the accuracy with which off-track students are identified.
Literature on College Readiness & Data ReductionIn this section, I review studies on college readiness that are most pertinent to the
research questions and data, including relevant measures and frameworks. I also examine the growing use of data reduction techniques in education. Despite their promise, these data reduction methods have not been used to identify the strongest predictors of college readiness nor to help identify what educators should measure if trying to support students who are not on track for college.
College Readiness InputsDavid Conley (2005, 2007, 2008, 2010) has suggested that there are four main
components to being college ready, including being prepared academically, mastering various cognitive strategies, understanding the college process, and holding certain attitudes. The first, being prepared for college academically, involves both developing content knowledge and using that content knowledge to solve novel problems. Students must also use analytical strategies that are not content specific, such as the ability to reason, argue, and interpret. Conley (2007) argues that students may seem ready for college based on content mastery but still lack these other competencies, suggesting that college eligibility and college readiness are not the same. His research influences and is informed by work showing that the courses students take and their performance in them, especially course failures and GPA, are much better predictors of high school graduation and college readiness than standardized test scores (Allensworth, 2013; Allensworth & Easton, 2005; Balfanz & Boccanfuso, 2007; Camara, 2013; Neild, Balfanz, & Herzog, 2007; Roderick et al., 2006).
Beyond academics, research shows students need to have a basic understanding of the admissions process and how to survive in postsecondary settings that emphasize autonomy, an understanding many term “college knowledge” (Conley, 2005, 2008; Hooker & Brand, 2010; York-Anderson & Bowman, 1991). For example, a student may be highly qualified for college academically but not know how to secure financial aid, without which a postsecondary education would be prohibitively expensive. The importance of college knowledge has been reinforced by randomized control trials around interventions related to the college admissions process. One recent study randomly selected low- to middle-income families filing their taxes with H & R Block to have federal student loan applications filled out for them, as well as receive information on eligibility for financial aid and estimated award amounts (Bettinger, Long, Oreopoulos, & Sanbonmatsu, 2012). Students from families receiving these supports were substantially more likely to submit the aid application, enroll in college the following fall, and receive financial aid (Bettinger, Long, Oreopoulos, & Sanbonmatsu, 2012). How well students understand college processes and contexts can also influence whether and where they decide to go to school (Perna, 2000), and how comfortable they feel when they get there (Hurtado & Carter, 1997).
Researchers further show that students’ attitudes and beliefs are important to success in college. Resilience, self-regulation, and beliefs about intelligence are all predictive of college grades and completion (Cury, Elliot, Da Fonseca, & Moller, 2006; Durlak, Weissberg, Dymnicki, Taylor, & Schellinger, 2011; Dweck et al., 2011). For instance, students who believe they belong in their college’s academic community are likelier to persist and graduate, especially among minority and first-generation students (Walton & Cohen, 2007, 2011). In some instances, these measures of attitudes and beliefs have predicted long-term academic achievement better than grades and test scores (Deke & Haimson, 2006; Duckworth, Grant, Loew, Oettingen, & Gollwitzer, 2011; Duckworth & Quinn, 2009; Duckworth, Peterson, Matthews, & Kelly, 2007; Good & Dweck, 2006).
…little guidance exists for practitioners on how
to combine and prioritize these measures with the goal of optimally
identifying students who will enter, and persist
in, college.
RESEARCH & PRACTICE IN ASSESSMENT
Volume Twelve | Summer 2017 7
Sedlacek’s (2004) work on noncognitive measures shows how results of studies on student attitudes can be used in the college admissions process. For example, Noonan, Sedlacek, and Veerasamy (2005) find that noncognitive questionnaire responses predict GPA for community college students and should therefore be used in admissions criteria. Noncognitive outcomes also vary in how much they improve college readiness forecasts by race. Tracey and Sedlacek (1982) show that different noncognitive questions predict college GPA for white students (self-confidence, preference for long-range goals, and realistic self-appraisal) compared to black students (positive self-concept and realistic self-appraisal). In more recent work, Sedlacek (2004) argues that using noncognitive outcomes in college admissions is not only useful, but also practically feasible.
College Readiness FrameworksGiven the range of measures and constructs that research suggests are associated
with postsecondary success, college readiness frameworks abound. Some of these frameworks, like Conley’s (2005, 2007, 2008, 2010), look across all types of measures to identify the constructs most important to college readiness (Borsato, Nagaoka, & Foley, 2013). Others look specifically at certain types of measures, especially noncognitive factors. For example, Dweck, Walton, and Cohen (2011) highlighted a few attitudes and beliefs that predict achievement: tenacity, mindset, social belonging, and self-regulation. They argued that, in combination, having these noncognitive factors in place generates motivated students. Similarly, a literature review produced by the Chicago Consortium on School Research (Farrington et al., 2012) synthesized different categories of noncognitive skills into a framework that shows how these skills relate to each other and influence academic achievement. They suggested that academic behaviors (e.g. completing school work in a timely way) are most proximal to achievement and that these behaviors are driven by social skills, perseverance, and learning strategies (Farrington et al., 2012).
These frameworks are often cited and likely useful to educators. However, they do not always give concrete guidance on how to prioritize and blend different measures of college readiness when trying to identify students most in need of related supports and interventions. That is, they show that certain measures and constructs are important but often emphasize different aspects of readiness and do not look across frameworks to identify the relative importance of predictors in forecasting college readiness. I use data reduction techniques to help close this gap.
Data Reduction Techniques and College ReadinessOver the last few decades, data reduction techniques have been developed to help make
decisions when researchers or practitioners are awash in data, including cases where there are more variables than observations. These data reduction techniques, specifically decision trees, have advantages relative to traditional regression-based methods that can help identify the best predictors of college readiness. For example, these methods are straightforward, produce results that are easily interpretable (including to lay audiences), and generate clear decision points for action (Magee, 1964; Murthy, 1998; Quinlan, 1990). A range of articles demonstrate, and argue for, the importance of data reduction techniques when identifying students who are not ready for college or are unlikely to persist (Baker & Corbett, 2014; Denley, 2014; O’Reilly & Veeramachaneni, 2014). However, this literature remains sparse.
Fong, Si, and Biuk-Aghai (2009) used decision trees to predict university admissions in Macau and, thereby, better understand how students ended up in the schools they ultimately attended. Specifically, t hey p redicted w hich u niversity a s tudent w as l ikeliest t o e nter b y analyzing achievement, student background, and university admissions criteria. These models were shown to accurately predict which school a student would enter over 95 percent of the time, and were easily tailored to students’ interests and experiences (Fong et al., 2009). Other studies, meanwhile, used decision trees to identify which students entering college were likely to complete their postsecondary education. Dekker, Pechenizkiy, and Vleeshouwers (2009) used data reduction to identify which college freshmen in an electrical engineering program were likeliest to drop out before receiving their degrees. They were able to classify students
Despite their promise, these data reduction methods have not been used to identify the strongest predictors of college readiness nor to help identify what educators should measure if trying to support students who are not on track for college.
RESEARCH & PRACTICE IN ASSESSMENT
8 Volume Twelve | Summer 2017
with 80 percent accuracy and, in the process, identify dropout indicators that were not being used as warning flags by student counselors (Dekker et al., 2009). Similarly, when examining high school students, Quadri and Kalyankar (2010) showed that dropout indicators included a range of measures like GPA, gender, attendance, and parental income.
Data I use the National Education Longitudinal Survey (NELS) in my analyses. This dataset tracks students from their 8th-grade year in 1988 through 2000—which means postsecondary outcomes are recorded. In addition to providing several college readiness outcomes, the dataset is nationally representative and includes thousands of student survey items. (One reason I use NELS instead of the Education Longitudinal Survey (ELS), which is similar and more recent, is that the former includes a broader range of student survey items.) I use various measures from students’ 8th- and 10th-grade years (the two grades at which data were collected) to predict college readiness.
One disadvantage to NELS survey items is that they are not organized by construct. Therefore I have no concise way to summarize what, exactly, these thousands of survey items measure. However, there are some distinct themes in the questions, which relate (among other things) to postsecondary aspirations and expectations, home environment, language proficiency, attitudes and beliefs about schooling, occupational expectations, self-esteem and locus of control, quality of life, and college choice factors. These items span different aspects of college readiness, including academic preparation, attitudinal factors, and college knowledge.
Researchers for NELS collected baseline data on 12,144 students, of whom 9,601 (79 percent) attended college1. Of those 12,144, roughly 8,800 persisted for a semester. I use college attendance for a semester rather than completion as an outcome despite the latter being a much better measure of college readiness. This approach is taken because available measures of enrollment after a semester are imperfect, let alone after two to four years. Further, sample sizes dwindle considerably when college completion is the outcome, and there are only limited (and technically complicated) options for dealing with missingness in the dependent variable. Therefore, I try to balance the accuracy and completeness of the outcome variable with how well it measures college readiness.
There are, however, several basic approaches available to address the substantial missingness in the predictors. First, when a variable is nominal (i.e. unordered categorical), NELS always includes a category for missing. In a data reduction framework, I can divide nominal variables into a series of binary variables, including a separate binary variable for missing versus nonmissing. Second, I impute missing values based on all of the covariates in the sample using a fully conditional estimation strategy appropriate for categorical variables (Buuren & Groothuis-Oudshoorn, 2011; Van Buuren, Brand, Groothuis-Oudshoorn, & Rubin, 2006). Imputation has been used many times before with NELS (Bokossa & Huang, 2001) and is appropriate given the missingness in the data appears to be covariate-dependent.
Training and Test Datasets A measure to identify students not on track for college is only as good as its ability to predict which students fall in each category when we do not know their outcome. Educators are primarily interested in signs that a student is off-track well before the end of high school in order to provide those students with the supports they need. To simulate this process, I use an approach well documented in the data reduction literature, namely dividing the full dataset into training and test data. The training data are used to fit models, then predictions relying on those model parameters are made for the test data. This approach means we can test the model on a set of students not used to derive that model, as well as protect against overfitting the model (mistaking the noise for signal). Roughly 70 percent of the 12,144 students in the sample were randomly assigned to the training set with the remaining 30 percent assigned to the test set. Results did not change substantively when different proportions of students were assigned to each group.
1 College is defined as any two- or four-year institution.
Researchers further show that students’ attitudes
and beliefs are important to success in college.
A measure to identify students not on track for
college is only as good as its ability to predict which students fall in
each category when we do not know their
outcome. Educators are primarily interested
in signs that a student is off-track well before the end of high school
in order to provide those students with the
supports they need.
RESEARCH & PRACTICE IN ASSESSMENT
Volume Twelve | Summer 2017 9
MethodsIn this section, I discuss methods on a question-by-question basis. Those questions are as follows:
1) Can a small subset of measures be combined into a single model thataccurately and consistently identifies students not on track for college?
2) What are the most important predictors of college readiness acrossmodels and what do they measure?
Can a small subset of measures be combined into a single model that accurately and consistently identifies students not on track for college?
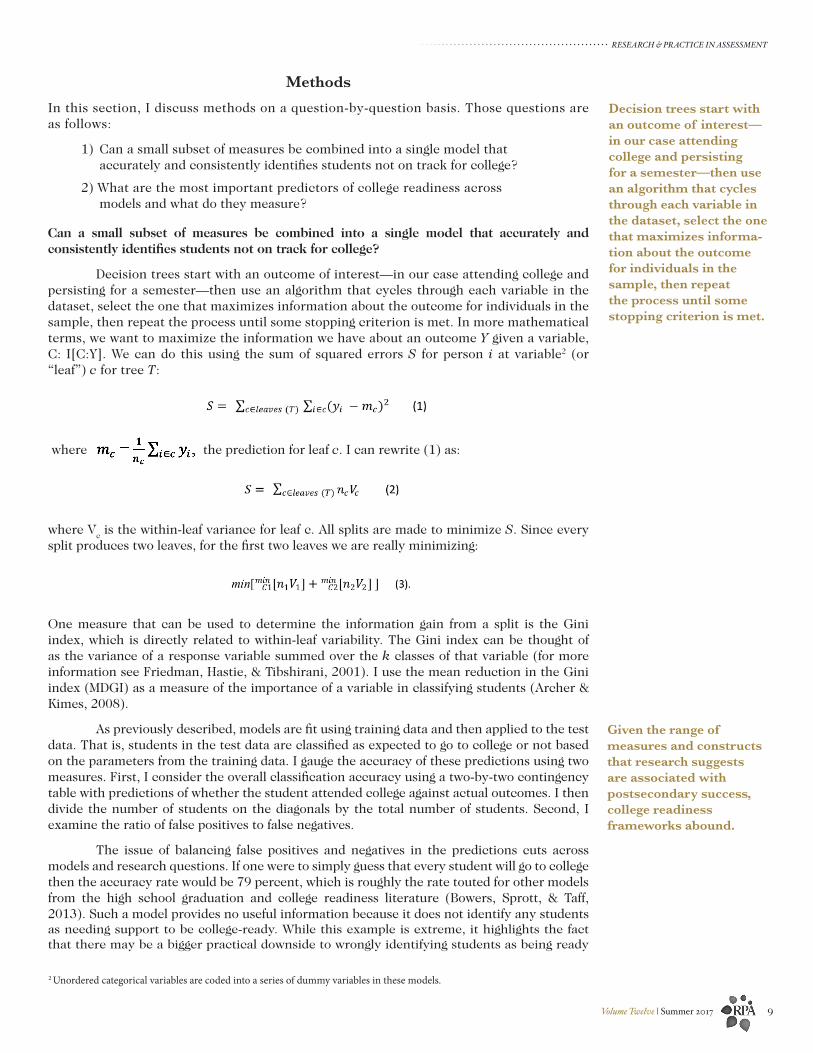
Decision trees start with an outcome of interest—in our case attending college and persisting for a semester—then use an algorithm that cycles through each variable in the dataset, select the one that maximizes information about the outcome for individuals in the sample, then repeat the process until some stopping criterion is met. In more mathematical terms, we want to maximize the information we have about an outcome Y given a variable, C: I[C:Y]. We can do this using the sum of squared errors S for person i at variable2 (or “leaf”) c for tree T:
where the prediction for leaf c. I can rewrite (1) as:
where Vc is the within-leaf variance for leaf c. All splits are made to minimize S. Since every
split produces two leaves, for the first two leaves we are really minimizing:
One measure that can be used to determine the information gain from a split is the Gini index, which is directly related to within-leaf variability. The Gini index can be thought of as the variance of a response variable summed over the k classes of that variable (for more information see Friedman, Hastie, & Tibshirani, 2001). I use the mean reduction in the Gini index (MDGI) as a measure of the importance of a variable in classifying students (Archer & Kimes, 2008).
As previously described, models are fit using training data and then applied to the test data. That is, students in the test data are classified as expected to go to college or not based on the parameters from the training data. I gauge the accuracy of these predictions using two measures. First, I consider the overall classification accuracy using a two-by-two contingency table with predictions of whether the student attended college against actual outcomes. I then divide the number of students on the diagonals by the total number of students. Second, I examine the ratio of false positives to false negatives.
The issue of balancing false positives and negatives in the predictions cuts across models and research questions. If one were to simply guess that every student will go to college then the accuracy rate would be 79 percent, which is roughly the rate touted for other models from the high school graduation and college readiness literature (Bowers, Sprott, & Taff, 2013). Such a model provides no useful information because it does not identify any students as needing support to be college-ready. While this example is extreme, it highlights the fact that there may be a bigger practical downside to wrongly identifying students as being ready
2 Unordered categorical variables are coded into a series of dummy variables in these models.
Given the range of measures and constructs that research suggests are associated with postsecondary success, college readiness frameworks abound.
Decision trees start with an outcome of interest—in our case attending college and persisting for a semester—then use an algorithm that cycles through each variable in the dataset, select the one that maximizes informa-tion about the outcome for individuals in the sample, then repeat the process until some stopping criterion is met.

RESEARCH & PRACTICE IN ASSESSMENT
10 Volume Twelve | Summer 2017
for college than the opposite. That is, one could argue there is a bigger downside to not giving a student support who needs it than to helping a student who is actually college ready. To acknowledge this argument, I built additional trees that were weighted to de-emphasize false positives. I accomplished this weighting using a built-in feature of the ctree package (Hothorn, Hornik, & Zeileis, 2006) in the R programming language.
What are the most important predictors of college readiness across models and what do they measure?
In the first question, I built a single model designed to maximize the accuracy with which students were classified as not on track for college. In this question, I attempt to identify the best predictors of college readiness across a range of models and determine what the predictors measure in tandem. I approach this question in two steps. First, I fit a series of data reduction models, then see which predictors are most important across those models. Second, I do a factor analysis of those important predictors to help determine what constructs they appear to be measuring. By understanding what they measure, I can provide general guidance on what educators may wish to assess when trying to identify students who need college supports, both those who are far off course and those who are more borderline.
First, I generate a variety of models to identify the best predictors of college readiness. In all cases, these models are built using the training data then applied to the test data. One model replicates the original decision tree many times. This type of model is called a random forest. Random forests address a problem with decision trees, namely that they can be sensitive to the first split. For example, 100 decision trees might produce 50 different first splits. Since the rest of the tree is conditional on that first split each would produce discrepant results. Random forest models were developed to counteract this sensitivity to the first split and generally protect against overfitting. Random forests replicate decision trees hundreds of times in order to identify the covariates that do the best job of classifying students on average across all the replications. (For more details on this method, please see Elith, Leathwick, & Hastie, 2008). I identify variables that show the highest MDGI across these replicated decision trees as important predictors. Specifically, I decide which variables to retain by estimating the random forest models with a dataset that includes ten variables generated randomly with known means and variances. I then keep any variable that had a higher MDGI than these randomly generated variables.
I also build models that do not use decision trees because one could plausibly argue that a decision tree misrepresents the data. Decision trees assume the data can be divided into smaller datasets that are modeled in turn. By contrast, the data could be represented altogether in a single model, the approach used in most regression methods. To acknowledge this alternative conceptualization of the data I use lasso, a regression-based method. Lasso essentially runs a series of regressions omitting each variable, determines how much the omission impacts the residual sum of squares, then shrinks coefficients to zero when they have little predictive power. Mathematically, this model can be described for student i and covariate j as:
With the below restriction:
I identify t using a cross-validation process on the training data outlined in Tibshirani (1996)3. Any variables with non-zero coefficients are deemed strong predictors.
In the second step, I take all the variables identified as important in the random forest and lasso models and explore what they measure. I do this by conducting a factor analysis on those highly predictive variables. In particular, I do an exploratory factor analysis on the training data followed by a confirmatory factor analysis on the test data to make sure the model fits data from a different group of students.
3 Per Gelman (2008), all variables are scaled by dividing by two standard deviations to make them comparable to binary variables. Nominal variables are coded as a series of dummy variables.
These data reduction techniques, specifically
decision trees, have advantages relative to
traditional regression-based methods that
can help identify the best predictors of college readiness.
I also build models that do not use decision
trees because one could plausibly argue
that a decision tree misrepresents the data.
Decision trees assume the data can be divided
into smaller datasets that are modeled in turn.
RESEARCH & PRACTICE IN ASSESSMENT
Volume Twelve | Summer 2017 11
In addition to a standard factor analysis model, I also fit higher-order factor and bifactor models. The higher-order and bifactor models acknowledge that college readiness could involve both a single construct and several subconstructs. In practical terms, these models recognize that there might be a general aspect of college readiness that cuts across measures as well as specific aspects of readiness that may or may not relate to that general aspect. The higher-order model treats factors as nested within that general construct. The bifactor model, meanwhile, includes a general factor but treats it as distinct from the other constructs being measured. All of these models are well established in the literature so I will not show the underlying matrix algebra here. For details, please see Holzinger and Swineford (1937). Analyses in this paper were implemented using the omega command in the Psych package in R (Revelle, 2011; Revelle & Zinbarg, 2009).
To determine which factor analysis model to use, fit statistics including Chi-square statistics and the root mean squared error of approximation (RMSEA) were compared across models, the latter of which is not sample-size dependent (Koh & Zumbo, 2008). Based on these statistics the bifactor model fit the data best. For example, the chi-square statistics for the bifactor model is 2403 and the RMSEA is .056 (the RMSEA for the higher-order model was .059). Therefore, results from the bifactor model are reported in the findings section. The number of factors retained was determined using scree plots and Very Simple Structure analysis (Revelle & Rocklin, 1979).
LimitationsDespite the benefits of this methodological approach there are limitations worth
mentioning. First, the methods are designed to maximize classification accuracy—not necessarily how actionable a measure may be for educators. While a survey question may be quite good at dividing students into those who are and are not on track for college, the question itself might have little to do with the root causes of being off-track—which would limit its use in informing instructional practice. Even if a measure does help identify an underlying cause of being off track that cause might not be especially actionable. For example, if aspects of poverty cause students to be less ready for college there are few options for educators to improve students’ socioeconomic statuses.
This approach also does little to improve the measures themselves. For example, decision tree models do not generally account for measurement error, though the factor analyses do, to some extent. Further, survey responses can still suffer from self-report biases and grades can still rely on subjective judgments from teachers. Using such measures to make decisions with implications for students and teachers would likely only increase these deficiencies.
Relatedly, despite the wide range of questions asked and constructs measured by the NELS surveys, not all constructs of interest are included. For example, NELS largely predates Duckworth and Quinn’s (2009) work on developing and validating a short grit scale and much of Dweck’s (2006) research on growth mindset. Therefore, additional research will be needed to continue to understand the relative importance of constructs in determining which students are on track for college. Findings should also be replicated using newer data and different sets of survey questions.
ResultsI show that a small number of measures can be combined in a single model to
identify which students are on track for college with great accuracy. Across models, these predictors appear to measure academic achievement, college aspirations and expectations, socioeconomic status, and teacher perceptions of postsecondary readiness.
Can a small subset of measures be combined into a single model that accurately and consistently identifies students not on track for college?
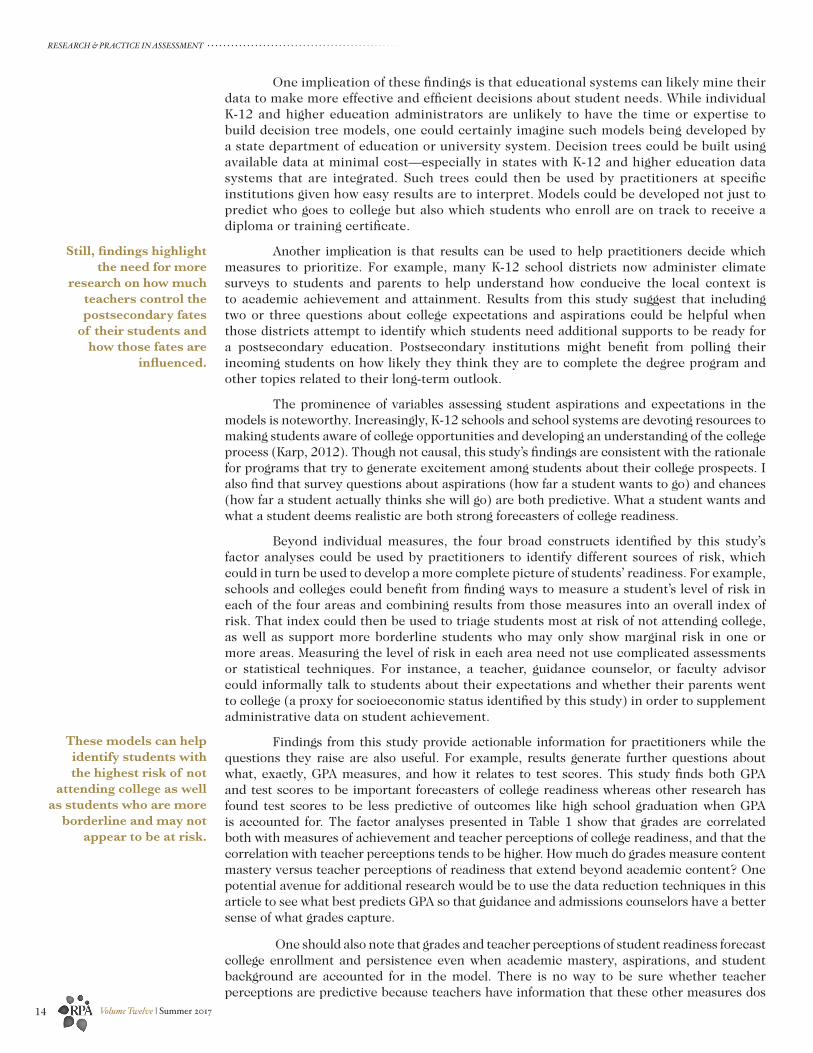
Figure 1 displays the decision tree produced using weights4. For these models, roughly 12 percent of students in the training data and 14 percent in the test data were misclassified. The balance between false negatives and positives was much better than in the unweighted models. This tree’s first split is based on a question asking students how far in school they think
The higher-order and bifactor models acknowledge that college readiness could involve both a single construct and several subconstructs. In practical terms, these models recognize that there might be a general aspect of college readiness that cuts across measures as well as specific aspects of readiness that may or may not relate to that general aspect.
Even if a measure does help identify an underlying cause of being off track that cause might not be especially actionable. For example, if aspects of poverty cause students to be less ready for college there are few options for educators to improve students’ socioeconomic statuses.

RESEARCH & PRACTICE IN ASSESSMENT
12 Volume Twelve | Summer 2017
they will go. Splits that immediately follow primarily use questions about students’ educational plans, standardized test scores, and socioeconomic status. The covariates in the tree include a blend of test scores, administrative data, and student and teacher surveys.
In some cases, a very small number of splits can be used to identify students with a high risk of not going to, and persisting in, college. For example, looking at the left-most branch of the decision tree, among the 712 students who did not think they would make it to college and were in the bottom quartile of SES, only 28 percent went to college and persisted. The tree also helps identify students who are high risk but may be less obvious absent the tree. For instance, going down the right-most branch, students who plan to go to college, are in the upper two standardized test quartiles, but who do not plan to go straight into college, occasionally cut class, and have low social studies grades have only a 50 percent chance of being college-ready.
What are the most important predictors of college readiness across models and what do they measure?
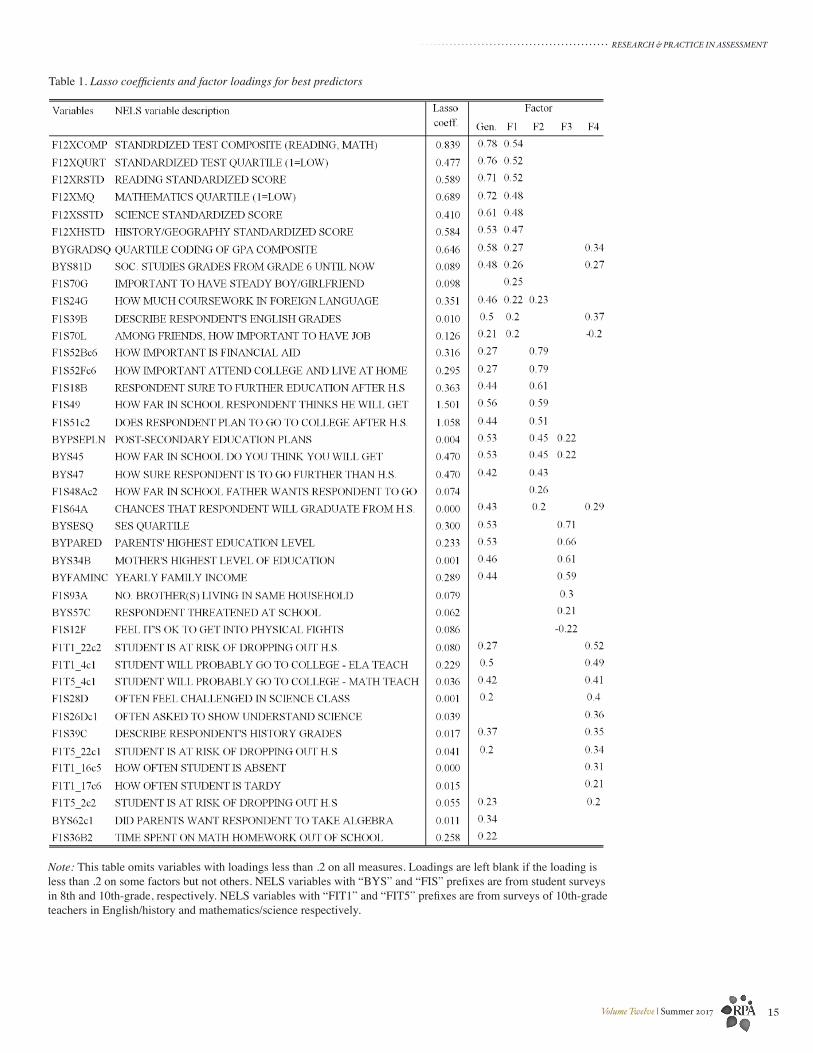
Table 1 presents results from lasso and random forest models as well as loadings from the factor analysis. Roughly 40 variables were deemed strongly predictive based on random forest and lasso models. I report only the coefficients from the latter because they are very highly correlated with the MDGI values and are easier to interpret. The coefficients can be interpreted as the change in the log odds of going to, and persisting in, college associated with every one-unit increase in the independent variable, each of which has been standardized. On average, random forest models accurately classified 91 percent of students in the training set and 88 percent in the test set—with far fewer false positives than in unweighted models. Classification rates were similar for the lasso models.
While there are not many studies describing the classification accuracy of models predicting college enrollment there are dozens showing the classification accuracy for high school completion. The accuracy rates of the models are higher than those from 97 percent of the studies predicting high school completion catalogued by Bowers, Sprott, and Taff (2013), a statistic made more meaningful by the fact that models using only K-12 data usually do a better job of predicting high school completion than college enrollment (Soland, 2013). Variables that were predictive in both random forest and lasso models included measures of postsecondary aspirations and expectations, socioeconomic status, GPA, standardized test scores, and teacher survey questions.
Turning to the factor loadings in Table 1, I show how individual variables load on the general factor and each subfactor. Only loadings of .2 or higher are reported, and variables that do not have loadings of .2 or higher on any variable are omitted for parsimony. Beyond the general factor, the variables load on roughly four factors. The first of these factors is associated primarily with test scores and other measures of academic preparation like grades. Variables related to postsecondary aspirations and expectations load on the second factor, as do factors in the college application process like the importance of financial aid to the student. The third factor is correlated with measures of socioeconomic status, including parents’ level of educational attainment and family income. Finally, the fourth factor is associated with measures related to teachers’ perceptions of the student’s college readiness, including survey questions asking whether the student is likely to finish high school and go on to college.
DiscussionThere are two major findings from this work, both of which can be useful to practitioners.
First, results show that, while there are thousands of measures that forecast college readiness, a student can be classified as on track to enroll in, and persist at, a postsecondary institution with a high degree of accuracy (over 90 percent) using a small number of variables. Second, these predictors of college readiness tend to measure four things: academic preparation, educational aspirations and expectations, socioeconomic status, and teacher perceptions of student performance (GPA, teachers’ confidence the student will go to college, etc.).
4 A copy of the decision tree using the original NELS variable names is available upon request.
In some cases, a very small number of splits can be used to identify
students with a high risk of not going to, and
persisting in, college.
This study finds both GPA and test scores to be important forecast-
ers of college readiness whereas other research
has found test scores to be less predictive
of outcomes like high school graduation when
GPA is accounted for.

RESEARCH & PRACTICE IN ASSESSMENT
Volume Twelve | Summer 2017 13
Figu
re 1
. Dec
isio
n Tr
ee R
esul
ts
RESEARCH & PRACTICE IN ASSESSMENT
14 Volume Twelve | Summer 2017
One implication of these findings is that educational systems can likely mine their data to make more effective and efficient decisions about student needs. While individual K-12 and higher education administrators are unlikely to have the time or expertise to build decision tree models, one could certainly imagine such models being developed by a state department of education or university system. Decision trees could be built using available data at minimal cost—especially in states with K-12 and higher education data systems that are integrated. Such trees could then be used by practitioners at specific institutions given how easy results are to interpret. Models could be developed not just to predict who goes to college but also which students who enroll are on track to receive a diploma or training certificate.
Another implication is that results can be used to help practitioners decide which measures to prioritize. For example, many K-12 school districts now administer climate surveys to students and parents to help understand how conducive the local context is to academic achievement and attainment. Results from this study suggest that including two or three questions about college expectations and aspirations could be helpful when those districts attempt to identify which students need additional supports to be ready for a postsecondary education. Postsecondary institutions might benefit from polling their incoming students on how likely they think they are to complete the degree program and other topics related to their long-term outlook.
The prominence of variables assessing student aspirations and expectations in the models is noteworthy. Increasingly, K-12 schools and school systems are devoting resources to making students aware of college opportunities and developing an understanding of the college process (Karp, 2012). Though not causal, this study’s findings are consistent with the rationale for programs that try to generate excitement among students about their college prospects. I also find that survey questions about aspirations (how far a student wants to go) and chances (how far a student actually thinks she will go) are both predictive. What a student wants and what a student deems realistic are both strong forecasters of college readiness.
Beyond individual measures, the four broad constructs identified by this study’s factor analyses could be used by practitioners to identify different sources of risk, which could in turn be used to develop a more complete picture of students’ readiness. For example, schools and colleges could benefit from finding ways to measure a student’s level of risk in each of the four areas and combining results from those measures into an overall index of risk. That index could then be used to triage students most at risk of not attending college, as well as support more borderline students who may only show marginal risk in one or more areas. Measuring the level of risk in each area need not use complicated assessments or statistical techniques. For instance, a teacher, guidance counselor, or faculty advisor could informally talk to students about their expectations and whether their parents went to college (a proxy for socioeconomic status identified by this study) in order to supplement administrative data on student achievement.
Findings from this study provide actionable information for practitioners while the questions they raise are also useful. For example, results generate further questions about what, exactly, GPA measures, and how it relates to test scores. This study finds both GPA and test scores to be important forecasters of college readiness whereas other research has found test scores to be less predictive of outcomes like high school graduation when GPA is accounted for. The factor analyses presented in Table 1 show that grades are correlated both with measures of achievement and teacher perceptions of college readiness, and that the correlation with teacher perceptions tends to be higher. How much do grades measure content mastery versus teacher perceptions of readiness that extend beyond academic content? One potential avenue for additional research would be to use the data reduction techniques in this article to see what best predicts GPA so that guidance and admissions counselors have a better sense of what grades capture.
One should also note that grades and teacher perceptions of student readiness forecast college enrollment and persistence even when academic mastery, aspirations, and student background are accounted for in the model. There is no way to be sure whether teacher perceptions are predictive because teachers have information that these other measures dos
Still, findings highlight the need for more
research on how much teachers control the postsecondary fates
of their students and how those fates are
influenced.
These models can help identify students with the highest risk of not
attending college as well as students who are more
borderline and may not appear to be at risk.
RESEARCH & PRACTICE IN ASSESSMENT
Volume Twelve | Summer 2017 15
Table 1. Lasso coefficients and factor loadings for best predictors
Note: This table omits variables with loadings less than .2 on all measures. Loadings are left blank if the loading is less than .2 on some factors but not others. NELS variables with “BYS” and “FIS” prefixes are from student surveys in 8th and 10th-grade, respectively. NELS variables with “FIT1” and “FIT5” prefixes are from surveys of 10th-grade teachers in English/history and mathematics/science respectively.

RESEARCH & PRACTICE IN ASSESSMENT
16 Volume Twelve | Summer 2017
not capture or because the teachers have a hand in determining who goes to college and who does not. There is ample literature on self-fulfilling prophecies generated by teachers (Jussim, Eccles, & Madon, 1996; Madon, Jussim, & Eccles, 1997), and even some evidence that the effects of these self-fulfilling prophecies on postsecondary outcomes are modest (Soland, 2013). Still, findings highlight the need for more research on how much teachers control the postsecondary fates of their students and how those fates are influenced.
In sum, this study’s results provide useful guidance for educators in the K-12 and higher education systems. First, decision rules can be established that identify students not on track for college with greater accuracy than in much of the prior research. These models can help identify students with the highest risk of not attending college as well as students who are more borderline and may not appear to be at risk. While decision tree methods are somewhat nuanced, they can be developed at the system level and are straightforward to interpret. Second, results show that the strongest predictors of college readiness appear to be measuring four broad categories: academic preparation, college goals and aspirations, teacher perceptions and evaluations of college readiness, and socioeconomic status, including parental education. Educators interested in identifying students for college readiness supports may benefit from basing determinations on measures of these constructs, whether formal or informal.
Second, results show that the strongest
predictors of college readiness appear to be measuring four broad categories: academic preparation, college
goals and aspirations, teacher perceptions
and evaluations of college readiness, and socioeconomic status,
including parental education.
RESEARCH & PRACTICE IN ASSESSMENT
Volume Twelve | Summer 2017 17
ReferencesArcher, K. J., & Kimes, R. V. (2008). Empirical characterization of random forest variable importance measures. Computational Statistics & Data Analysis, 52(4), 2249–2260.
Baker, R. S., & Corbett, A. T. (2014). Assessment of robust learning with educational data mining. Research & Practice in Assessment, 9(2), 38–50.
Bettinger, E. P., Long, B. T., Oreopoulos, P., & Sanbonmatsu, L. (2012). The role of application assistance and information in college decisions: Results from the H&R block FAFSA experiment. The Quarterly Journal of Economics, 127(3), 1205–1242.
Bokossa, M. C., & Huang, G. (2001). Imputation of test scores in the national education longitudinal study of 1988 (NELS: 88). US Department of Education, Office of Educational Research and Improvement, National Center for Education Statistics.
Borsato, G. N., Nagaoka, J., & Foley, E. (2013). College readiness indicator systems framework. Stanford, CA: The John W. Gardner Center for Youth and Their Communities.
Bowers, A. J., Sprott, R., & Taff, S. A. (2013). Do we know who will drop out?: A review of the predictors of dropping out of high school: Precision, sensitivity, and specificity. The High School Journal, 96(2), 77–100.
Bradford, J. P., Kunz, C., Kohavi, R., Brunk, C., & Brodley, C. E. (1998). Pruning decision trees with misclassification costs. In Machine Learning: ECML-98 (pp. 131–136). Berlin, Germany: Springer.
Buuren, S., & Groothuis-Oudshoorn, K. (2011). mice: Multivariate imputation by chained equations in R. Journal of Statistical Software, 45(3).
Conley, D. T. (2005). College knowledge: Getting in is only half the battle. Principal Leadership, 6(1), 16–21.
Conley, D. T. (2007). The challenge of college readiness. Educational Leadership, 64(7), 23.
Conley, D. T. (2008). College knowledge: What it really takes for students to succeed and what we can do to get them ready. Hoboken, NJ: Wiley.
Conley, D. T. (2010). College and career ready: Helping all students succeed beyond high school. Hoboken, NJ: Wiley.
Cury, F., Elliot, A. J., Da Fonseca, D., & Moller, A. C. (2006). The social-cognitive model of achievement motivation and the 2-times-2 achievement goal framework. Journal of Personality and Social Psychology, 90(4), 666.
Dattatreya, G. R., & Sarma, V. V. S. (1981). Bayesian and decision tree approaches for pattern recognition including feature measurement costs. IEEE transactions on pattern analysis and machine intelligence, 3, 293–298.
Dekker, G., Pechenizkiy, M., & Vleeshouwers, J. (2009, July). Predicting students drop out: A case study. Paper presented at the International Conference on Education Data Mining, Cordoba, Spain.
Denley, T. (2014). How predictive analytics and choice architecture can improve student success. Research & Practice in Assessment, 9(2), 61–69.
Duckworth, A. L., & Quinn, P. D. (2009). Development and validation of the Short Grit Scale (GRIT–S). Journal of Personality Assessment, 91(2), 166–174.
Durlak, J. A., Weissberg, R. P., Dymnicki, A. B., Taylor, R. D., & Schellinger, K. B. (2011). The impact of enhancing students’ social and emotional learning: A meta-analysis of school-based universal interventions. Child Development, 82(1), 405–432.
Dweck, C. (2006). Mindset: The new psychology of success. New York, NY: Random House.
Dweck, C., Walton, G. M., & Cohen, G. L. (2011). Academic tenacity: Mindset and skills that promote long-term learning. Seattle, WA: Bill & Melinda Gates Foundation.
Elith, J., Leathwick, J. R., & Hastie, T. (2008). A working guide to boosted regression trees. Journal of Animal Ecology, 77(4), 802–813.
Farrington, C. A., Roderick, M., Allensworth, E., Nagaoka, J., Keyes, T. S., Johnson, D. W., & Beechum, N. O. (2012). Teaching adolescents to become learners: The role of noncognitive factors in shaping school performance– A critical literature review. Chicago, IL: Consortium on Chicago School Research.

RESEARCH & PRACTICE IN ASSESSMENT
18 Volume Twelve | Summer 2017
Fong, S., Si, Y.W., & Biuk-Aghai, R. P. (2009, December). Applying a hybrid model of neural network and decision tree classifier for predicting university admission. Paper presented at the International Conference on Information, Communications and Signal Processing, Macau, China. doi: 10.1109/ICICS.2009.5397665
Friedman, J., Hastie, T., & Tibshirani, R. (2001). The elements of statistical learning (Vol. 1). vol. 536 (2nd ed). Berlin, Germany: Springer.
Gelman, A. (2008). Scaling regression inputs by dividing by two standard deviations. Statistics in Medicine, 27(15), 2865–2873.
Hauser, R. M., & Andrew, M. (2007). Reliability of student and parent reports of socioeconomic status in NELS-88. Presented at the ITP Seminar, University of Wisconsin–Madison.
Hooker, S., & Brand, B. (2010). College knowledge: A critical component of college and career readiness. New Directions for Youth Development, 2010(127), 75–85.
Hothorn, T., Hornik, K., & Zeileis, A. (2006). Unbiased recursive partitioning: A conditional inference framework. Journal of Computational and Graphical Statistics, 15(3), 651–674.
Hurtado, S., & Carter, D. F. (1997). Effects of college transition and perceptions of the campus racial climate on Latino college students’ sense of belonging. Sociology of Education, 324–345.
Jussim, L., Eccles, J., & Madon, S. (1996). Social perception, social stereotypes, and teacher expectations: Accuracy and the quest for the powerful self-fulfilling prophecy. Advances in Experimental Social Psychology, 28, 281–388.
Karp, M. M. (2012). “ I don’t know, I’ve never been to college!” Dual enrollment as a college readiness strategy. New Directions for Higher Education, 158, 21–28.
Koh, K. H., & Zumbo, B. D. (2008). Multi-group confirmatory factor analysis for testing measurement invariance in mixed item format data. Journal of Modern Applied Statistical Methods, 7(2), 12.
Madon, S., Jussim, L., & Eccles, J. (1997). In search of the powerful self-fulfilling prophecy. Journal of Personality and Social Psychology, 72(4), 791.
Magee, J. F. (1964, July). Decision trees for decision making. Harvard Business Review.
Murthy, S. K. (1998). Automatic construction of decision trees from data: A multi-disciplinary survey. Data Mining and Knowledge Discovery, 2(4), 345–389.
Noonan, B. M., Sedlacek, W. E., & Veerasamy, S. (2005). Employing noncognitive variables in admitting and advising community college students. Community College Journal of Research and Practice, 29(6), 463–469.
O’Reilly, U.-M., & Veeramachaneni, K. (2014). Technology for mining the big data of MOOCs. Research & Practice in Assessment, 9(2), 29–37.
Perna, L. W. (2000). Differences in the decision to attend college among African Americans, Hispanics, and Whites. Journal of Higher Education, 117–141.
Quadri, M. M., & Kalyankar, N. V. (2010). Drop out feature of student data for academic performance using decision tree techniques. Global Journal of Computer Science and Technology, 10(2), 2-5.
Quinlan, J. R. (1990). Decision trees and decision-making. IEEE Transactions on Systems, Man and Cybernetics, 20(2), 339–346.
Revelle, W. (2011). An introduction to psychometric theory with applications in R. New York, NY: Springer.
Revelle, W., & Rocklin, T. (1979). Very simple structure: An alternative procedure for estimating the optimal number of interpretable factors. Multivariate Behavioral Research, 14(4), 403–414.
Revelle, W., & Zinbarg, R. E. (2009). Coefficients alpha, beta, omega, and the glb: Comments on Sijtsma. Psychometrika, 74(1), 145–154.
Sedlacek, W. E. (2004). Beyond the Big Test: Noncognitive Assessment in Higher Education. Indianapolis, IN: Wiley.
Soland, J. (2013). Predicting high school graduation and college enrollment: Comparing early warning indicator data and teacher intuition. Journal of Education for Students Placed at Risk (JESPAR), 18(3–4), 233–262.
Tibshirani, R. (1996). Regression shrinkage and selection via the lasso. Journal of the Royal Statistical Society. Series B (Methodological), 267–288.
RESEARCH & PRACTICE IN ASSESSMENT
19Volume Twelve | Summer 2017
Tracey, T. J., & Sedlacek, W. E. (1984). Noncognitive variables in predicting academic success by race. Measurement and Evaluation in Guidance,16(4), 171–78.
Van Buuren, S., Brand, J. P., Groothuis-Oudshoorn, C. G. M., & Rubin, D. B. (2006). Fully conditional specification in multivariate imputation. Journal of Statistical Computation and Simulation, 76(12), 1049–1064.
Walton, G. M., & Cohen, G. L. (2007). A question of belonging: Race, social fit, and achievement. Journal of Personality and Social Psychology, 92(1), 82.
Walton, G. M., & Cohen, G. L. (2011). A brief social-belonging intervention improves academic and health outcomes of minority students. Science, 331(6023), 1447–1451.
York-Anderson, D. C., & Bowman, S. L. (1991). Assessing the college knowledge of first-generation and second- generation college students. Journal of College Student Development, 32(2), 116-122.