cognitive and noncognitive improvements among … · cognitive and noncognitive improvements among...
TRANSCRIPT

Distribution unlimited
Cognitive and Noncognitive Improvements Among ChalleNGe Cadets: A Survey of Seven Sites Lauren D. Malone and Jennifer R. Atkin
June 2016
Copyright © 2016 CNA
This document contains the best opinion of CNA at the time of issue. It does not necessarily represent the opinion of the sponsor.
Distribution
Distribution unlimited. Specific authority: N00014-16-D-5003.
Copies of this document can be obtained through the Defense Technical Information Center at www.dtic.mil or contact CNA Document Control and Distribution Section at 703-824-2123.
Photography Credit: Cadets with the Maryland National Guard’s Freestate ChalleNGe Academy stand at the position of parade rest while waiting in line at the academy’s mess hall, Nov. 17, 2015. The Youth ChalleNGe program follows a quasi-military program of instruction as a way to instill discipline and esprit de corps in cadets. Photo by Sgt. 1st Class Jon Soucy.
Approved by: June 2016
Jeffery M. Peterson, Director Fleet and Operational Manpower Team Resource Analysis Division
i
Abstract
This study analyzes the cognitive and noncognitive development of cadets participating in the National Guard Youth ChalleNGe Program (ChalleNGe). It analyzes data from the spring FY15 class of cadets at seven ChalleNGe sites and draws conclusions regarding how participation in ChalleNGe affects both cognitive and noncognitive growth. It also looks at the relationship between cognitive and noncognitive measures and their ability to predict program completion and test score improvement. Using data on cadets’ scores on the Test of Adult Basic Education (TABE) and cadets’ responses to survey questions gauging their noncognitive skills, our analysis reveals that ChalleNGe cadets, on average, experience significant improvements in both their cognitive and noncognitive skills. In addition, cognitive skills are important determinants of final noncognitive skills, suggesting that ChalleNGe should continue its efforts to develop both skill sets simultaneously. We also found notable gender differences and that age is an important predictor of program completion.
ii
This page intentionally left blank.
iii
Executive Summary
In this study, we evaluate the development of both cognitive skills (e.g., math and language arts) and noncognitive skills (e.g., ability to follow directions and determination/grit) in youth resulting from their participation in the National Guard Youth ChalleNGe Program (ChalleNGe). We analyze data from a class of cadets at seven ChalleNGe sites across the country: the Grizzly Youth Academy (California), Fort Gordon Youth ChalleNGe Academy (Georgia), Lincoln’s ChalleNGe Academy (Illinois), Youth ChalleNGe Program-Gillis Long (Louisiana), the Freestate ChalleNGe Academy (Maryland), the Washington Youth Academy (Washington), and the Wisconsin ChalleNGe Academy (Wisconsin). These sites were chosen in an effort to have a balance of sites that provide General Educational Development (GED) preparation and those that offer credit recovery, while providing a wide geographic distribution.
In this analysis, we use several sources of site-provided data. First, the sites collected cadets’ scores on the Test of Adult Basic Education (TABE) at the beginning and end of the program. Our analysis relies on the four TABE subsections, or subtests (Math Computation, Applied Math, Reading, and Language), as well as the total score. The sites also provided information on which cadets completed the program and cadets’ ages. In addition, we use data from a survey that was designed to measure noncognitive skills. It gathered data on five measures previously developed by other researchers: grit, locus-of-control, perceived math and science efficacy, time preference, and following directions. Cadets completed the survey twice—once during intake (day 1) and again during the last week of classes.
Our analysis first focuses on survey results regarding cadets’ noncognitive skills. Specifically, we provide descriptive statistics and explain how they change over the course of the program. We then examine the improvements cadets made in cognitive skills and analyze the relationship between noncognitive skills and program outcomes. Finally, we use the TABE data to determine if initial TABE scores, in addition to initial noncognitive scores, can be used to predict ChalleNGe completion or final TABE scores.
Our findings indicate that ChalleNGe does improve cadets’ noncognitive skills. The effects, however, are not significant and consistent across all noncognitive
measures. Specifically, we find that cadets’ grit as well as their perceived math and science efficacy increase over the course of the program, but there is no statistically

iv
significant change in locus-of-control, expressed willingness to delay gratification, or ability to read and follow directions from the initial noncognitive survey to the final one. These differences from our previous Washington-only findings—where all noncognitive skills improved—highlight the importance of site-level differences. We also found that initial cognitive skills (TABE scores) influence noncognitive skill development—in almost all cases, higher cognitive skills are associated with more developed noncognitive skills—suggesting that the sites should continue their efforts to develop the two simultaneously.
We also found notable gender differences. We analyzed the impact of two demographic characteristics on noncognitive skill development: gender and age. We find, overall, that there are statistically significant effects of gender, even when
holding all other variables constant. Specifically, at the end of ChalleNGe, female cadets have higher perceived science efficacy and are more able to read and follow directions than their male counterparts, all else equal. Female cadets also experience smaller grit improvements while at ChalleNGe but are more likely to experience positive improvements in their ability to delay gratification and follow directions. These findings confirm that gender-tailored approaches are likely appropriate for ChalleNGe since male and female cadets not only arrive at different stages of noncognitive development (female cadets initially have lower grit and lower perceived science efficacy but are more likely to follow directions) but also vary in their responsiveness to noncognitive skill improvement approaches at ChalleNGe (at the program’s end, female cadets are more than twice as likely as male cadets to follow directions). Conversely, the effect of cadet age was largely insignificant in determining noncognitive development.
We find that cadets experience significant cognitive development while at
ChalleNGe. Among ChalleNGe graduates, there are sizable and significant increases in all TABE subtests—an average increase of two grade levels, ranging from a low of
1.1 for reading to a high of 2.8 for math computation. We find significant effects of the ChalleNGe site attended on cognitive development but no significant impact of age or gender. These findings suggest that the specific site attended matters more for a cadet’s final noncognitive skills than does the cadet’s gender or age. These site-level differences could emerge because the sites differ in their philosophies and practices, because the sites serve different populations (from a demographic and socioeconomic standpoint), or because of some combination of these two effects.
We do, however, find that age is an important predictor of program completion.
Regardless of model specification, we find that older cadets are more likely to complete ChalleNGe than their 16-year-old counterparts. The robustness of this finding to various econometric specifications suggests that age is an independently important predictor of program completion. We recommend that ChalleNGe evaluate this further, consider encouraging greater interaction across age levels, and perhaps encourage the formation of mentor-mentee relationships among cadets.
v
There also were significant site effects, again suggesting that (a) there are differences in the sites’ philosophies and practices, (b) the sites serve different populations (from a demographic and socioeconomic standpoint), or (c) there is some combination of these two effects at play. Namely, relative to California, five of the seven remaining sites (Georgia, Illinois, Louisiana, Maryland, and Wisconsin) have lower completion rates, after the estimation’s other controls have been taken into
account.
Our analysis of American Community Survey data reveals that these site effects
may be partially the result of socioeconomic and demographic differences in the
populations each site serves. There is, for example, significant variation in the racial/ethnic makeup of the local population, which implies cultural differences in the households in which the ChalleNGe cadets were raised. In addition, there is noticeable variation in the female share of the labor force, the female share of the unemployed, and the primary industry of employment. As a result, cadets’ parents and other influencers will likely have different labor market experiences across sites; this could influence cadets’ outlook on their ability to find work and become productive, contributing members of society. Finally, there also were noticeable differences in the adolescent populations across the locations, primarily in the percentage of adolescents who gave birth in the last 12 months and in the percentage living in households. Such differences could affect the cognitive and noncognitive improvements that are achievable while the cadets are at ChalleNGe, suggesting that it may be naïve to compare TABE achievement, completion rates, or other statistics across sites without taking such differences into account. We recommend further study to determine whether site effects are primarily being driven by site differences or population differences.
A few additional recommendations emerged from our analysis:
• Our analysis has highlighted a number of cases in which there are differences in cognitive or noncognitive development (while at ChalleNGe) by gender or age. We therefore recommend that the sites work to leverage these differences. For example, female cadets could help male cadets in areas in which they have a revealed advantage (and vice versa). Similarly, older cadets could work with younger cadets as necessary. In many cases, the establishment of direct mentoring relationships may not be necessary; the desired influence could be achieved simply via interaction and observation of one’s peers.
• It is important that the existing differences in the ChalleNGe sites’ populations and any other site differences be well understood by the “consumers” of the annual report statistics. Such differences include how the TABE tests are administered as well as any socioeconomic and demographic differences in the sites’ populations. It is crucial that policy-makers and researchers understand that comparing growth across ChalleNGe sites is not an “apples to apples”
comparison.

vi
This page intentionally left blank.
vii
Contents
Introduction and Background .................................................................................................. 1
National Guard Youth ChalleNGe Program ...................................................................... 1 Noncognitive skills ................................................................................................................ 2 This report .............................................................................................................................. 3
Data Sources and Methodology ............................................................................................... 4
Cognitive skills: TABE scores .............................................................................................. 4 Noncognitive skills: cadet survey....................................................................................... 5 Methodology ........................................................................................................................... 9
The Seven ChalleNGe Sites ..................................................................................................... 10
Results .......................................................................................................................................... 15
Noncognitive skills .............................................................................................................. 15 Descriptive statistics ................................................................................................... 15 Comparison of pre- and post-ChalleNGe scores ................................................... 19 Multivariate analysis .................................................................................................... 24
Cognitive skills..................................................................................................................... 29 Descriptive statistics ................................................................................................... 30 Comparison of pre- and post-ChalleNGe scores ................................................... 33 Differences by cadet characteristics ........................................................................ 33 Multivariate analysis .................................................................................................... 35
Predictive power of our noncognitive and cognitive measures ................................. 39
Conclusions and Recommendations .................................................................................... 43
References ................................................................................................................................... 47

viii
This page intentionally left blank.

ix
List of Figures
Figure 1. Cadets’ grit-score distributions, before and after ChalleNGe .............. 17 Figure 2. Cadets’ locus-of-control distributions, before and after ChalleNGe ... 17 Figure 3. Distribution of perceived math efficacy for cadets before and after
ChalleNGe ........................................................................................................ 18 Figure 4. Distribution of perceived science efficacy for cadets before and
after ChalleNGe .............................................................................................. 19 Figure 5. Average pre- and post-TABE subtest and total battery scores, by
ChalleNGe site ................................................................................................ 30 Figure 6. TABE-level distribution, by subtest and site ............................................ 32

x
This page intentionally left blank.
xi
List of Tables
Table 1. Initial and final sample sizes, by ChalleNGe site ...................................... 8 Table 2. Size and characteristics of the 16 and older population in
surrounding areas, by ChalleNGe site ....................................................... 11 Table 3. Size and characteristics of the 15- to 19-year-old population in
surrounding areas, by ChalleNGe site ....................................................... 14 Table 4. Average noncognitive measures, before and after ChalleNGe ............. 20 Table 5. Average Initial and final scores on noncognitive measures, by
gender .............................................................................................................. 22 Table 6. Average initial and final scores on noncognitive measures, by age ... 23 Table 7. Average initial and final scores on noncognitive measures, by
incoming TABE score .................................................................................... 24 Table 8. Multivariate analysis of noncognitive skill determinants (grit,
locus-of-control, math efficacy, and science efficacy) ........................... 27 Table 9. Multivariate analysis of noncognitive skill determinants (chose
$100 over $50, followed directions, and percent response) ................ 28 Table 10. Average cognitive measures ........................................................................ 33 Table 11. Cadets’ average initial and final TABE GE scores, by gender ............... 34 Table 12. Cadets’ average initial and final TABE GE scores, by age ...................... 35 Table 13. Determinants of final TABE scores: total battery and subtests ........... 36 Table 14. Determinants of final TABE scores (including initial noncognitive
skills): total battery and subtests ............................................................... 37 Table 15. Predictors of ChalleNGe completion .......................................................... 41
xii
This page intentionally left blank.
xiii
Glossary
A Advanced ACS American Community Survey ChalleNGe National Guard Youth ChalleNGe Program D Difficult E Easy GE Grade Equivalent GED General Educational Development M Medium SD Standard Deviation TABE Test of Adult Basic Education WYA Washington Youth Academy
xiv
This page intentionally left blank.
1
Introduction and Background
In this study, we present follow-on analysis of youths’ changes—both cognitive (e.g., math and language arts) and noncognitive (e.g., ability to follow directions and determination)—resulting from their participation in the National Guard Youth ChalleNGe Program (ChalleNGe). CNA’s previous analyses [1-2] looked at changes in two classes of cadets at ChalleNGe in Washington State—the Washington Youth Academy (WYA). In this study, we analyze data from classes of cadets at seven ChalleNGe sites across the country: the Grizzly Youth Academy (California), Fort Gordon Youth ChalleNGe Academy (Georgia), Lincoln’s ChalleNGe Academy (Illinois), Youth ChalleNGe Program-Gillis Long (Louisiana), the Freestate ChalleNGe Academy (Maryland), the Wisconsin ChalleNGe Academy (Wisconsin), and the WYA. These sites were chosen in an effort to have a balance of sites that provide General Educational Development (GED) preparation and those that offer credit recovery, while also providing a wide geographic distribution. We continue to focus on how participation in ChalleNGe affects youths’ cognitive and noncognitive growth; we are now able to analyze whether our previous findings were unique to the WYA or are consistent across other ChalleNGe sites.
National Guard Youth ChalleNGe Program
The National Guard Youth ChalleNGe Program is designed to provide a second chance to high school dropouts and support for those at risk of dropping out. Eligible youth are ages 16 to 18. The program consists of two components: a 5-month residential portion, followed by a 12-month mentoring phase. ChalleNGe has a quasi-military structure: participants live in barracks, wear military-style uniforms, and perform activities typically associated with military training (e.g., marching, drills, and physical training). Participation, however, is voluntary. Although participants are referred to as cadets, they have no subsequent requirement for military service. The goal of ChalleNGe is to help “young people improve their self-esteem, self-confidence, life skills, education levels, and employment potential” [3].
There are currently 37 ChalleNGe academies operating in 27 states, Puerto Rico, and the District of Columbia. These sites are funded jointly by the Department of Defense and the states. The National Guard Bureau is responsible for management and oversight of ChalleNGe. That said, each site is given discretion in how it

2
structures its program. As a result, the academic goals of the ChalleNGe sites vary. Some seek to have cadets pass the GED test, while others award alternative high school diplomas. Some ChalleNGe sites provide credit recovery so that cadets can earn high school credits and return to their original high schools after completing the program. There also are some ChalleNGe sites that are equivalent to high schools and award state-certified high school diplomas. In many cases, sites offer more than one of these options.
In addition to providing an academic program, ChalleNGe seeks to instill life skills in the cadets. Toward that end, the core values of ChalleNGe are honor, courage, and commitment. The program also has eight core components: leadership/followership, responsible citizenship, service to community, life-coping skills, physical fitness, health and hygiene, job skills, and academic excellence. All of these core values and components focus cadets toward the changes needed to become productive citizens on completion of ChalleNGe.
Some of the goals of ChalleNGe are hard to measure, making an evaluation of the effectiveness of the program difficult. In contrast to academic progress, which can be measured through standardized tests or course completion, some of the core components are heavily dependent on the development of noncognitive skills. Given ChalleNGe’s emphasis on noncognitive skills, it is important to have measures of such skills and, optimally, measures of how they change during the course of the program. We administered a survey to meet these needs.
Noncognitive skills
Noncognitive skills are the sets of behaviors, skills, attitudes, and strategies that are not reflected in test scores but play a key role in many areas of life, including career potential, social development, and academic performance. In the literature, noncognitive skills are often referred to as “soft skills.” Noncognitive skills can range from study skills, work habits, and time management to individuals’ beliefs about their own intelligence, self-control, and persistence. These factors often determine how successfully people manage new environments and meet new academic and social demands [4].
Though noncognitive skills are viewed as important, they often are considered secondary to traditional cognitive skills, such as math and reading proficiency, since the latter can be more easily assessed and measured. Understanding how to improve noncognitive skills is important, however, because—unlike cognitive skills—they are not as highly dependent on the building-block skills developed in early childhood; the trajectory of noncognitive growth can be changed into the young adult years, regardless of whether earlier investments were lacking [5-8]. This means that such a program as ChalleNGe has an opportunity to have an impact on improving cadets’
3
noncognitive skills. ChalleNGe makes concerted efforts to assist students with development of their life skills and other noncognitive measures; this is lacking in the curricula at traditional high schools. For these reasons, we can expect ChalleNGe to have effects on cadets’ noncognitive skills that the cadets wouldn’t otherwise experience if they remained enrolled in a traditional high school. In a similar program focused on interventions for at-risk minors (albeit younger than those participating in ChalleNGe), the Perry Preschool Project showed long-term success of participants in educational outcomes, pregnancy rates, criminal behavior, and economic outcomes. These successes are most likely explained by increases in noncognitive skills because the cognitive benefits the participants gained eroded after a short time [9].
Noncognitive skills are important not just because they can be affected well into young adulthood, but also because they have been associated with other positive outcomes. For example, the literature has shown a strong relationship between noncognitive skills and academic success [6]. In addition to the academic benefits, Heckman argues that noncognitive skills are critical in later life, including affecting one’s success in the labor market [10]. Other researchers have shown that noncognitive skills are also related to such outcomes as the probability of arrest/ incarceration and college attendance [9, 11].
This report
Our main focus in this report lies in determining whether cadets experience cognitive and/or noncognitive growth while at ChalleNGe. We also analyze whether the likelihood of such growth varies by cadet characteristics, in order to inform whether ChalleNGe should focus on particular populations if its goal is to maximize these gains. Finally, we determine if a statistically significant relationship exists between incoming skills—whether cognitive or noncognitive—and cadets’ likelihood of completing the program and/or experiencing improvement in scores on the Test of Adult Basic Education (TABE). The remainder of the report is organized as follows. In the next section, we provide detailed information on our data and methodology. This includes a description of the noncognitive measures included on the survey we administered as well as the TABE data. Then we present statistics from the American Community Survey (ACS) on the geographic home areas of each site’s cadets. We do this to illustrate ways in which the cadet populations may differ across the sites since we do not have demographic information on the cadets; such population differences may be partially responsible for any variation we find in the skill growth that cadets experience. Following that section, we present our results regarding skill growth and the ability of incoming skill levels to predict program completion and TABE gains. In the final section, we provide our conclusions and recommendations.

4
Data Sources and Methodology
Our analysis relies on several data sources, all provided by the seven participating ChalleNGe sites. The sites provided their cadets’ TABE scores, both at the beginning and at the end of the program. In addition, all cadets completed a survey designed to measure noncognitive skills; they completed the survey twice—once at the beginning of the program and again shortly before graduation.1 We used cadets’ survey participation to deduce program completion. Specifically, we consider any cadets who took our second survey to have completed ChalleNGe (since our survey was administered only one week prior to graduation). Similarly, we consider any cadet who did not take our second survey—and for whom the program did not provide a reason for the absence (e.g., at sick bay)—to have dropped out. In this section, we provide more information on our data sources and how they inform our analysis.
Cognitive skills: TABE scores
Our measure of cognitive skills is created using TABE exam scores, which cadets take at the beginning (pre-TABE) and the end (post-TABE) of ChalleNGe. Our analysis of TABE data is limited to those cadets who took both the pre-TABE and the post-TABE; thus, those cadets who dropped out before the post-TABE are excluded. Some cadets dropped out after the post-TABE; they are included in our analysis. The TABE was
designed for placement of adult learners into appropriate grade-level groups and is often used as an assessment tool in adult education programs that have a focus on GED completion. Each subsection of the TABE is scored to indicate a grade level (for example, a score of 9.3 indicates performance at the 3rd month of the 9th grade).
Our analysis relies on the four subsections of the TABE— Math Computation, Applied Math, Language, and Reading—as well as the total score (formed by averaging subtest scores). The Math Computation section is made up of computational problems requiring test-takers to perform addition, subtraction, multiplication, and division; to work with percentiles, fractions, and exponents; and to solve basic algebra problems. The Applied Math section comprises word problems, which require the following
1 The survey also asked for age and gender.
5
abilities: chart and table comprehension, basic equation setup, coordinate graphing, an understanding of limited geometry, and application of the concepts of fractions, percentiles, and algebra in the context of word problems. The Language section includes questions on grammar and punctuation, combining sentences to preserve their meanings, and some basics of paragraph composition. The Reading section involves reading passages or detailed charts/tables and answering questions about the content. We chose these four subtests because they represent the core subtests of the TABE. Also, ChalleNGe historically uses these subtests when reporting test-score data. Of all the TABE subtests, these four are the most similar to the GED test.
Noncognitive skills: cadet survey
Our data include several measures of noncognitive skills based on the cadet survey we administered at each of the seven ChalleNGe sites. The cadets completed the survey at the beginning of the program and then completed an identical survey during the last week of the program. The survey was developed using instruments established by and well tested in existing economic and psychological literature. It included the following noncognitive measures:
• Grit2
• Locus-of-control3
• Efficacy measures to determine confidence in math and science abilities4
• Time preference—cadets were asked if they would prefer to be paid $50 today or $100 in 6 months5
• Following directions—cadets were asked to read and follow instructions on a question about why they left their previous high school; we also consider the
2 The grit scale was developed by and used with the permission of Dr. Angela Duckworth, Department of Psychology, University of Pennsylvania.
3 The locus-of-control scale was developed by and used with the permission of Dr. Julian Rotter, Emeritus Professor, Department of Psychology, University of Connecticut. In both Rotter’s and our work, an internal locus-of-control is considered to be a positive attribute.
4 Efficacy scales were adapted from Middle and High School STEM-Student Survey, 2012, Raleigh, North Carolina, and used by permission of the Friday Institute for Educational Innovation, North Carolina State University.
5 A few authors have illustrated that a person’s revealed discount rate (or time preference) may differ in real versus hypothetical situations [12-13]. Thus, to the extent that cadets responded to our hypothetical time preference question differently than they would respond in real life, there is potential for measurement error.
6
percentage of the survey completed as a separate metric of following directions.
The survey’s eight-item grit scale is designed to measure the respondents’ determination or tenacity. For each of these questions, the cadets are presented with a statement and are asked how well it describes them. For example, the survey asks how strongly the cadets agree with the statement, “I finish whatever I begin.” The answers range from “Very much like me” to “Not like me at all” in the form of a 5-point Likert (rating) scale. The grit score is calculated by awarding points for stated determination; for example, one statement is “I am a hard worker,” and another is “I often set one goal but later choose to pursue a different goal.” For the first statement, cadets received 5 points for selecting “Very much like me” and decreasing numbers of points down to 1 point for “Not at all like me.” For the second statement, cadets received 1 point for choosing “Very much like me” and increasing numbers of points up to 5 points for “Not at all like me.” For those cadets answering all eight grit subquestions, total grit scores range from 8 to 40 with higher scores indicating higher levels of determination, or grit.
In previous iterations of this survey and accompanying analysis, we included only those cadets who answered all eight grit questions. This was because it would otherwise be unclear whether a low grit score was representative of a cadet with truly low grit or one with high grit who only answered one or two of the grit questions. We therefore restricted the sample to those who answered all eight questions (and similar restrictions were made for other noncognitive measures). In this iteration, however, we take a somewhat different approach, in order to maintain as much data as possible. Cadets who answered fewer than eight grit questions are still included in our analysis, but their grit measures are down-weighted to account for our uncertainty in how they would respond to the unanswered questions. We do this by multiplying a cadet’s total grit score by the share of grit questions that he or she answered. Therefore, the score gets multiplied by 1 for cadets who answered all grit questions, by 0.5 for cadets who only answered four grit questions, and so on. In this way, we give less weight to answers that are less complete.6
Locus-of-control measures the extent to which a person believes that his or her own
actions (versus random factors or other powers) determine outcomes. Essentially, the
6 Theoretically, when using weighted noncognitive measures, any change in noncognitive skills from the initial to the final survey could be due to a change in either the cadet’s noncognitive skill or the cadet’s weight (calculated as the fraction of subquestions answered for that noncognitive measure). Changes in weights from the initial to the final survey, however, are trivial: 0.0063 for the grit weight, 0.0024 for locus-of-control, 0.0031 for perceived math efficacy, and 0.0040 for science efficacy. Thus, any observed changes in the cadets’ noncognitive skills from the initial to the final survey can be attributed to noncognitive changes, as opposed to changes in survey completion (and the corresponding weight).
7
scale measures the extent to which respondents believe that they can control their lives. Those who believe that their own actions have consequences are designated as “internal”; those who believe that other factors determine outcomes are termed “external.” For each question, the respondent chooses which of two statements best describes his or her beliefs/feelings. Respondents receive 1 point each time they choose a statement indicating that they have control over situations; the score ranges from 0 (completely external, failing to see a relationship between their own actions and consequences/reactions) to 13 (completely internal, giving no explanatory power to luck). We consider an internal locus-of-control to be preferable (and therefore assign it a higher value); people with an internal locus-of-control are more likely to take actions that will result in positive consequences or rewards because they see a direct correlation between outcomes and their own behaviors. Conversely, those with an external locus-of-control will be less likely to take responsibility for any negative outcomes that occur in their lives; they will therefore not be likely to adjust their behaviors accordingly. As we did for the grit measure, we weight cadets’ responses by the share of total locus-of-control questions that they answered.
Efficacy is measured using a 5-point Likert scale of responses to a series of
statements about the cadet’s attitude toward, and confidence in, math and science. We calculate math and science efficacy separately. In each case, the efficacy score is determined by awarding points for responses that exhibit a positive attitude or confidence in the subject. Thus, cadets who select “Strongly agree” for such statements as “I know I can do well in science” receive 5 points, as do cadets who select “Strongly disagree” for such statements as “I can handle most subjects well, but I cannot do a good job in science.” Each efficacy score indicates the average response on the Likert scale with higher scores indicating higher perceived efficacy. Scores range from 1 to 5. As we did for the other measures, we weight efficacy responses—in effect down-weighting the replies of those who answered fewer than all of the efficacy questions.
Time preference is the fourth measure of noncognitive skills and is captured by a
simple question: would the cadet prefer to be paid $50 today or twice that in 6 months? Indicating a preference for $100 in 6 months suggests a level of determination, planning, and self-control.
Following directions is the fifth noncognitive measure.7 Cadets are asked why they left their previous high schools. They are given a variety of possible reasons and are instructed to mark all that apply as well as to circle the most important reason.
7 For a comprehensive review of each of these noncognitive measures and a more in-depth discussion of why they are viewed as beneficial to development, see [14].
8
Not all cadets marked at least one reason: 97 percent did on the initial survey and 65 percent did on the final survey. Among those cadets who marked at least one reason, we considered those who also circled a reason to have followed directions and those who did not circle a reason to have not followed the directions. Those who did not mark at least one reason are not included in our calculations for this metric—we excluded them because we cannot differentiate those who did not follow directions from those who skipped the last page of the survey.
Percent response is our final noncognitive measure. It is the percentage of all survey
questions that the cadet answered and measures survey completeness.
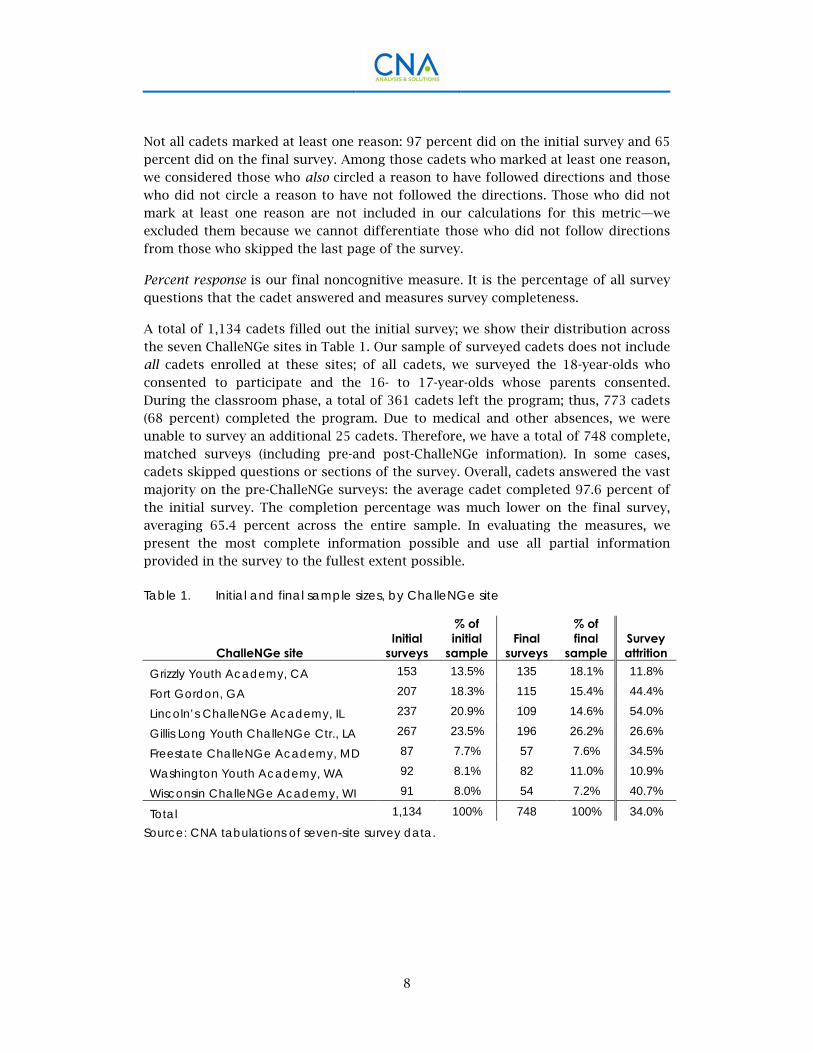
A total of 1,134 cadets filled out the initial survey; we show their distribution across the seven ChalleNGe sites in Table 1. Our sample of surveyed cadets does not include all cadets enrolled at these sites; of all cadets, we surveyed the 18-year-olds who
consented to participate and the 16- to 17-year-olds whose parents consented. During the classroom phase, a total of 361 cadets left the program; thus, 773 cadets (68 percent) completed the program. Due to medical and other absences, we were unable to survey an additional 25 cadets. Therefore, we have a total of 748 complete, matched surveys (including pre-and post-ChalleNGe information). In some cases, cadets skipped questions or sections of the survey. Overall, cadets answered the vast majority on the pre-ChalleNGe surveys: the average cadet completed 97.6 percent of the initial survey. The completion percentage was much lower on the final survey, averaging 65.4 percent across the entire sample. In evaluating the measures, we present the most complete information possible and use all partial information provided in the survey to the fullest extent possible.
Table 1. Initial and final sample sizes, by ChalleNGe site
ChalleNGe site Initial
surveys
% of initial
sample
Final
surveys
% of final
sample Survey attrition
Grizzly Youth Academy, CA 153 13.5% 135 18.1% 11.8%
Fort Gordon, GA 207 18.3% 115 15.4% 44.4%
Lincoln’s ChalleNGe Academy, IL 237 20.9% 109 14.6% 54.0%
Gillis Long Youth ChalleNGe Ctr., LA 267 23.5% 196 26.2% 26.6%
Freestate ChalleNGe Academy, MD 87 7.7% 57 7.6% 34.5%
Washington Youth Academy, WA 92 8.1% 82 11.0% 10.9%
Wisconsin ChalleNGe Academy, WI 91 8.0% 54 7.2% 40.7%
Total 1,134 100% 748 100% 34.0%
Source: CNA tabulations of seven-site survey data.
9
Methodology
As we previously discussed, our primary objective is to analyze whether cadets experience cognitive and/or noncognitive growth while at ChalleNGe. The seven ChalleNGe sites we included were selected to provide a balance of sites that provide GED preparation and those that offer credit recovery, as well as a wide geographic distribution. We also considered the size of the sites to ensure that we would have a sufficient sample size. Based on these considerations, our seven selected sites (as listed in Table 1) were Grizzly Youth Academy, Fort Gordon, Lincoln’s ChalleNGe Academy, Gillis Long Youth ChalleNGe Center, Freestate ChalleNGe Academy, Washington Youth Academy, and Wisconsin ChalleNGe Academy. The specific analytical questions we ask regarding cadets’ growth follow:
• For all cognitive and noncognitive measures, how do cadets’ pre- and post-ChalleNGe scores compare? Are there variations by gender, age, incoming TABE score, or ChalleNGe site? That is, are certain subpopulations more likely to experience improvements than others?
• What is the relationship between cognitive and noncognitive skills? We analyze whether initial cognitive or noncognitive skills are important in determining cadets’ final cognitive abilities and which are more important.
• Are either initial cognitive or noncognitive skills significant predictors of cadets’ success at ChalleNGe? Our success metrics include both program completion and overall TABE score improvement.
In answering these questions, we use both univariate and multivariate analyses. Univariate analysis—or differences in means—takes into account only one variable at a time. For example, it answers such questions as “How do incoming TABE scores differ for male and female cadets?” and “How do incoming TABE scores differ for cadets of different ages?” In answering these questions, no other variables are taken into account. As a result, univariate results are often oversimplified and do not portray the complete story. A finding, for example, that cadets of a certain age are more likely to drop from the program may in fact be related to differences in cognitive or noncognitive skills that exist across age groups. In such a case, univariate analysis can be misleading; it may be that, once these skill differences are also taken into account, age itself does not have an independent effect. For these reasons, multivariate analysis—which allows us to simultaneously control for a number of factors—is important. The univariate analysis helps determine what characteristics we should be taking into account when conducting the multivariate analysis. The characteristics we consider are gender, age, incoming and final TABE scores, incoming and final noncognitive skills, and the specific site the cadet attended (of our seven).

10
The Seven ChalleNGe Sites
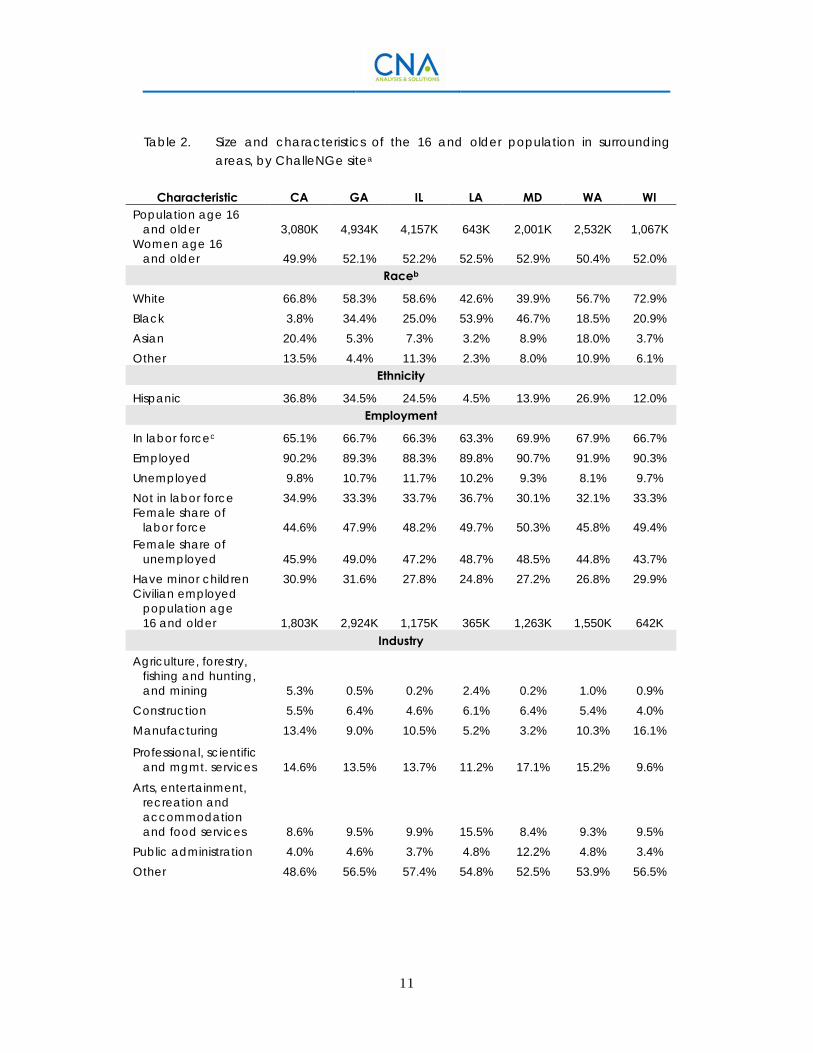
In this section, we present American Community Survey demographic and socioeconomic data on the populations in the areas surrounding each of the seven ChalleNGe sites. We do this to highlight differences that may exist across different sites’ cadets, potentially influencing not just the initial cognitive or noncognitive skills of cadets, but also the growth that is achievable. Our multivariate analysis controls for the particular ChalleNGe site cadets attend; any significant site effects could reflect differences in the sites’ policies and procedures or could reflect differences in the cadet populations. To determine whether substantial differences exist in cadets’ characteristics, we asked each site to identify the primary counties or metro areas that are home to its cadets. We then used the ACS’s summary tables to identify the average characteristics of people living in these areas. Cadets, of course, will not be a random sampling of each area’s overall population; it is therefore possible that cadets’ characteristics (and their families’ characteristics) will not align with those of the overall population. We find it reasonable, however, to assume that areas with overall different populations will also produce cadets with different characteristics. The ACS summary statistics are presented in Table 2 and Table 3. Table 2 contains information on population size, gender, racial/ethnic diversity, employment status, employment industry, and income range for those age 16 and older. Table 3 presents statistics for the 15- to 19-year-old population, including school enrollment, marital status, and idleness.
There are a number of differences across these populations—differences that could be influencing the cognitive and noncognitive growth that is achievable at ChalleNGe. First, there are noticeable differences in the size of the age 16 and older population, ranging from 643,140 in Louisiana to 4,934,315 in Georgia. In all locations, women compose roughly half of this population. In addition, 63 to 70 percent of these regional populations are in the labor force—meaning they are either employed or are looking for work—and, of those in the labor force, roughly 90 percent are employed across all locations. There is greater variation, however, in the racial/ethnic makeup, the female share of the labor force, and the female share of the unemployed. While 72.9 percent of the surrounding population is white in Washington, 58.3 percent is white in Georgia, and only 39.9 percent is white in Maryland. Similarly, 34.4 percent of the surrounding population is black in Georgia, compared with 53.9 percent in Maryland and 3.8 percent in California. Similarly large differences can be found in ethnicity; only 4.5 percent of the surrounding population identifies as Hispanic in Louisiana, compared with 13.9 percent in Maryland and 36.8 percent in California.
11
Table 2. Size and characteristics of the 16 and older population in surrounding areas, by ChalleNGe sitea
Characteristic CA GA IL LA MD WA WI Population age 16 and older 3,080K 4,934K 4,157K 643K 2,001K 2,532K 1,067K Women age 16 and older 49.9% 52.1% 52.2% 52.5% 52.9% 50.4% 52.0%
Raceb
White 66.8% 58.3% 58.6% 42.6% 39.9% 56.7% 72.9% Black 3.8% 34.4% 25.0% 53.9% 46.7% 18.5% 20.9% Asian 20.4% 5.3% 7.3% 3.2% 8.9% 18.0% 3.7% Other 13.5% 4.4% 11.3% 2.3% 8.0% 10.9% 6.1%
Ethnicity
Hispanic 36.8% 34.5% 24.5% 4.5% 13.9% 26.9% 12.0% Employment
In labor forcec 65.1% 66.7% 66.3% 63.3% 69.9% 67.9% 66.7% Employed 90.2% 89.3% 88.3% 89.8% 90.7% 91.9% 90.3% Unemployed 9.8% 10.7% 11.7% 10.2% 9.3% 8.1% 9.7% Not in labor force 34.9% 33.3% 33.7% 36.7% 30.1% 32.1% 33.3% Female share of labor force 44.6% 47.9% 48.2% 49.7% 50.3% 45.8% 49.4% Female share of unemployed 45.9% 49.0% 47.2% 48.7% 48.5% 44.8% 43.7% Have minor children 30.9% 31.6% 27.8% 24.8% 27.2% 26.8% 29.9% Civilian employed population age 16 and older 1,803K 2,924K 1,175K 365K 1,263K 1,550K 642K
Industry Agriculture, forestry, fishing and hunting, and mining 5.3% 0.5% 0.2% 2.4% 0.2% 1.0% 0.9% Construction 5.5% 6.4% 4.6% 6.1% 6.4% 5.4% 4.0% Manufacturing 13.4% 9.0% 10.5% 5.2% 3.2% 10.3% 16.1%
Professional, scientific and mgmt. services 14.6% 13.5% 13.7% 11.2% 17.1% 15.2% 9.6%
Arts, entertainment, recreation and accommodation and food services 8.6% 9.5% 9.9% 15.5% 8.4% 9.3% 9.5% Public administration 4.0% 4.6% 3.7% 4.8% 12.2% 4.8% 3.4% Other 48.6% 56.5% 57.4% 54.8% 52.5% 53.9% 56.5%

12
Characteristic CA GA IL LA MD WA WI Income
Less than $10,000 4.5% 7.2% 8.6% 13.9% 6.3% 5.7% 8.1% $10,000-$14,999 4.1% 4.6% 4.9% 7.7% 3.7% 3.5% 6.6% $15,000-$24,999 7.9% 9.9% 10.4% 13.8% 6.8% 7.6% 12.7% $25,000-$34,999 7.7% 10.0% 9.6% 11.0% 7.2% 8.0% 11.5% $35,000-$49,999 10.5% 13.8% 12.6% 13.2% 10.9% 12.0% 14.6% $50,000-$74,999 15.2% 18.3% 17.1% 14.5% 16.9% 17.8% 18.3% $75,000-$99,999 12.4% 12.3% 12.0% 8.9% 12.6% 13.3% 11.6% $100,000- $149,999 16.9% 13.4% 13.2% 9.0% 16.8% 16.8% 10.8% $150,000- $199,999 9.1% 5.3% 5.5% 3.6% 8.7% 7.5% 3.2% $200,000 or more 11.8% 5.3% 6.2% 4.3% 10.1% 7.7% 2.5%
Source: U.S. Census Bureau, 2010-2014 American Community Survey 5-Year Estimates, Table DP03: Selected Economic Characteristics. a. Percentages may not sum to 100 due to rounding. b. Race distributions are based on the entire population, not just those age 16 and older, due to ACS data availability. c. Throughout this table, labor force refers to the civilian labor force. Technically, the labor force also includes the armed forces, but it is not possible to be in the armed forces and unemployed. Thus, we are only interested in statistics that relate to the civilian labor force.
These differences in racial/ethnic makeup will likely translate directly into differences in culture, perhaps including parenting styles, the perceived importance of schooling, or social interactions. Such cultural elements will reasonably affect children’s and adolescents’ development—both cognitive and noncognitive.
There also are important differences in the labor force composition. Women make up as little as 44.6 percent of the labor force in California and as much as 50.3 percent in Maryland. In addition, they make up 43.7 percent of the unemployed in Wisconsin and 49.0 percent in Georgia. This variation in the extent to which women are active members of the labor force in cadets’ home regions could influence their perceptions of women’s roles in society and could certainly influence female cadets’ perceptions of their ability to participate in and contribute to their local economies.
The other areas in which site-level variation is found are industry of employment and the income distribution. Regarding industry, agriculture is notably more represented in California, manufacturing is more highly represented in California and Wisconsin, and professional services is most represented in Maryland, as are the arts and public administration. The fact that the prominent industries vary across these geographic areas suggests that the populations will face different economic shocks and will likely experience different degrees of financial stability. This will very likely have direct impacts on the household environments in which cadets were raised.
13
Finally, Table 2 contains information on income distribution in the ChalleNGe sites’ surrounding areas. There are a few noticeable differences, primarily at the low and high ends of the income distribution. Specifically, Louisiana has the largest share of households with incomes under $10,000 a year, as well as in the $10,000-$14,999 and $15,000-$24,999 ranges. Wisconsin households are also well represented in these lower income ranges. Conversely, California and Maryland have the most households on the upper end of the income distribution: 11.8 percent of California households and 10.1 percent of Maryland households earn annual incomes of $200,000 or more, compared with 7.7 and 2.5 percent of Washington and Wisconsin households, respectively. Such income variation is likely to contribute to different childhood and early adolescent experiences, which may affect the ChalleNGe cadets’ propensity for either cognitive or noncognitive growth.
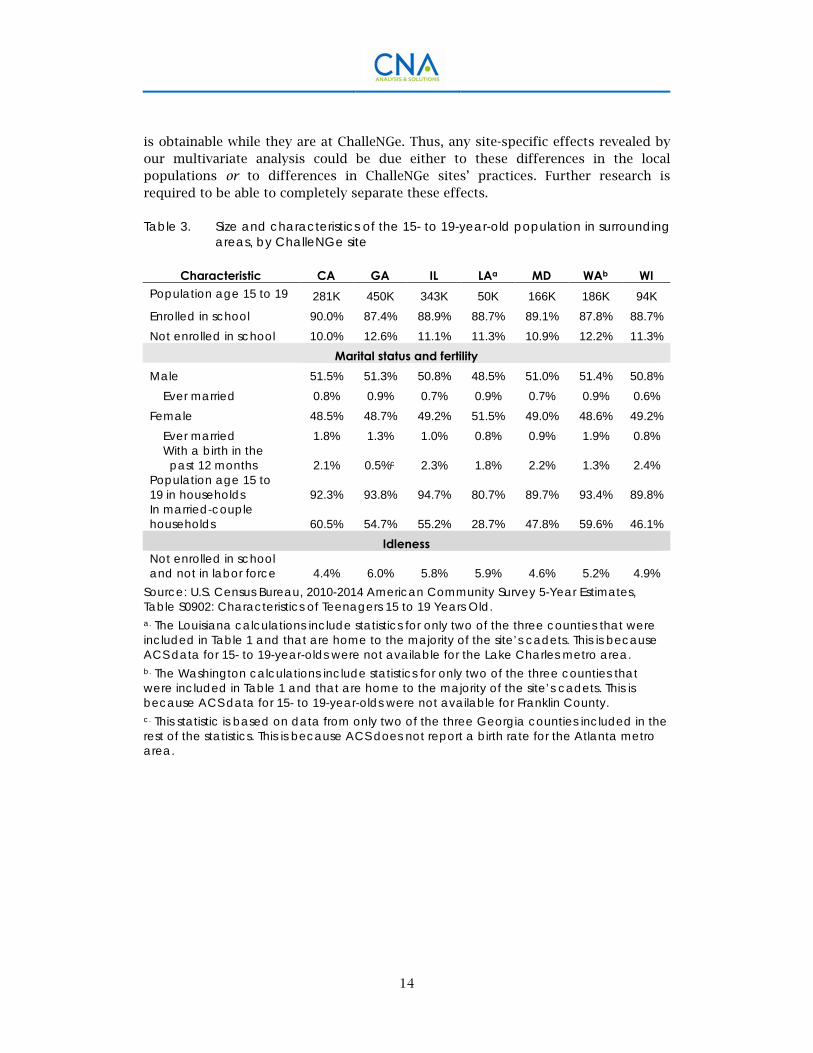
Having illustrated that the adult populations surrounding the seven ChalleNGe sites differ, both demographically and socioeconomically, we now focus on differences in the late adolescent populations. ACS provides a limited set of information on the 15- to 19-year-old population, largely focused on school enrollment, fertility, and labor force participation. These statistics are summarized in Table 3. The sites surrounded by the highest number of 15- to 19-year-olds are Georgia and Illinois, with Louisiana having the smallest population. There is only small variation in school enrollment rates, from a low of 87.4 percent in Georgia to a high of 90.0 percent in California. The 15- to 19-year-old population tends to be roughly 51 percent male; Louisiana’s population is 48.5 percent male, making it an outlier. Across all locations, less than 1 percent of these male adolescents have ever been married, compared with nearly 2 percent of female adolescents in California and Washington. The percentage of 15- to 19-year-olds who gave birth in the last 12 months also varies across these locations, from a low of .5 percent in Georgia to a high of 2.4 percent in Wisconsin. That is, the birth rate in Georgia for this population is nearly five times that in Wisconsin. There also are interesting differences in the percentages of 15- to 19-year-olds who live in a household (as opposed, for example, to a group home or being homeless) and, of those who live in households, the percentage living in a married-couple family. The percentage living in a household ranges from a low of 80.7 percent in Louisiana to a high of 94.7 percent in Illinois. Of those who do live in households, there is even more significant variation in the percentage living in a married-couple household: 28.7 percent in Louisiana, 46.1 percent in Wisconsin, 55.2 percent in Illinois, and 60.5 percent in California. These are large differences that may affect the adolescents’ views on family stability and are also likely to affect their noncognitive skills.
The statistics presented in this section (for both those age 16 and older and 15- to 19-year-olds) indicate that there are real and noticeable differences in the socioeconomic and demographic characteristics of those populations from which the sites most frequently recruit. This suggests that the cadets at the seven ChalleNGe sites will have varying backgrounds and experience, which will likely affect not only the cognitive and noncognitive skills with which they arrive but also the growth that
14
is obtainable while they are at ChalleNGe. Thus, any site-specific effects revealed by our multivariate analysis could be due either to these differences in the local populations or to differences in ChalleNGe sites’ practices. Further research is required to be able to completely separate these effects.
Table 3. Size and characteristics of the 15- to 19-year-old population in surrounding areas, by ChalleNGe site
Characteristic CA GA IL LAa MD WAb WI Population age 15 to 19 281K 450K 343K 50K 166K 186K 94K Enrolled in school 90.0% 87.4% 88.9% 88.7% 89.1% 87.8% 88.7% Not enrolled in school 10.0% 12.6% 11.1% 11.3% 10.9% 12.2% 11.3%
Marital status and fertility Male 51.5% 51.3% 50.8% 48.5% 51.0% 51.4% 50.8% Ever married 0.8% 0.9% 0.7% 0.9% 0.7% 0.9% 0.6% Female 48.5% 48.7% 49.2% 51.5% 49.0% 48.6% 49.2% Ever married 1.8% 1.3% 1.0% 0.8% 0.9% 1.9% 0.8% With a birth in the past 12 months 2.1% 0.5%c 2.3% 1.8% 2.2% 1.3% 2.4% Population age 15 to 19 in households 92.3% 93.8% 94.7% 80.7% 89.7% 93.4% 89.8% In married-couple households 60.5% 54.7% 55.2% 28.7% 47.8% 59.6% 46.1%
Idleness Not enrolled in school and not in labor force 4.4% 6.0% 5.8% 5.9% 4.6% 5.2% 4.9%
Source: U.S. Census Bureau, 2010-2014 American Community Survey 5-Year Estimates, Table S0902: Characteristics of Teenagers 15 to 19 Years Old. a. The Louisiana calculations include statistics for only two of the three counties that were included in Table 1 and that are home to the majority of the site’s cadets. This is because ACS data for 15- to 19-year-olds were not available for the Lake Charles metro area. b. The Washington calculations include statistics for only two of the three counties that were included in Table 1 and that are home to the majority of the site’s cadets. This is because ACS data for 15- to 19-year-olds were not available for Franklin County. c. This statistic is based on data from only two of the three Georgia counties included in the rest of the statistics. This is because ACS does not report a birth rate for the Atlanta metro area.

15
Results
In this section, we present results from our analysis of the survey data collected at the seven ChalleNGe sites. Initially, we focus on the survey results of the cadets’ noncognitive skills, providing descriptive statistics and explaining how they change during the program. We also examine the progress they made in cognitive skills and then analyze the relationship between noncognitive skills and program outcomes. Using TABE data, we determine if initial TABE scores, in addition to initial noncognitive scores, can be used to predict ChalleNGe completion and how noncognitive skills influence TABE scores.
Noncognitive skills
As explained earlier, we use our survey to ascertain cadets’ level of noncognitive skills. There are three comparison groups whose survey results we analyze:
1. The pre-ChalleNGe survey of all cadets
2. The pre-ChalleNGe survey of cadets who complete ChalleNGe
3. The post-ChalleNGe survey of cadets who complete ChalleNGe
These groups are meaningful because they allow us to establish the two sets of comparisons of primary interest in this study. The first is to compare the initial noncognitive skills of cadets who start ChalleNGe, but do not finish, with those of cadets who complete ChalleNGe. This comparison allows us to analyze whether there are statistically significant differences in the noncognitive skills of those who complete ChalleNGe versus those who do not. The second is to compare the initial noncognitive skills of cadets entering ChalleNGe with the final noncognitive skills of these same cadets, once they graduate. This comparison provides an understanding of whether cadets who complete ChalleNGe experience an improvement in their noncognitive skills as a result of their participation in the program.
Descriptive statistics
Before exploring the comparison of the three groups of survey results, we provide descriptive statistics for each of the metrics we analyze in the cadet survey. The
16
following figures present the score distributions for the grit, locus-of-control, and perceived efficacy measures. Each figure presents both pre- and post-ChalleNGe scores for all graduates, along with pre-ChalleNGe scores for all cadets. Green and dark blue bars, respectively, show the initial score distributions for all cadets and for cadets who ultimately graduate. Light blue bars represent the distribution of final grit scores (no final scores are available for cadets who do not complete ChalleNGe).
Figure 1 shows the distribution of cadets’ grit scores. The modal weighted initial grit score is 25 for all cadets and 28 for those who will ultimately complete the program; it is 24 for those who do not complete the program.8 This value (as compared to 25 for all cadets) might suggest that higher initial grit levels are associated with a higher probability of completing ChalleNGe. In addition, by the end of ChalleNGe, cadets have more grit. This is seen in the shift to the right of the light blue bars (as compared to the dark blue bars) in Figure 1. The mode of the final weighted grit score is 30. This improvement suggests that cadets are becoming more determined (i.e., have higher grit) as a result of ChalleNGe.
Figure 2 illustrates the distribution of cadets’ locus-of-control. The mode of the initial locus-of-control distribution of all cadets, as well as of those cadets who ultimately graduate, is a score of 8. In addition, the final locus-of-control mode (for those cadets who graduated) is also 8. That is, when analyzing the sample of these seven ChalleNGe sites as a whole, there is no increase in cadets’ locus-of-control from induction to graduation. In addition, there is no difference in the locus-of-control of all incoming cadets versus those incoming cadets who will ultimately graduate. This can be seen in Figure 2, in which the initial locus distribution, the initial locus distribution for graduates, and the final locus distribution for graduates are all similar in form.
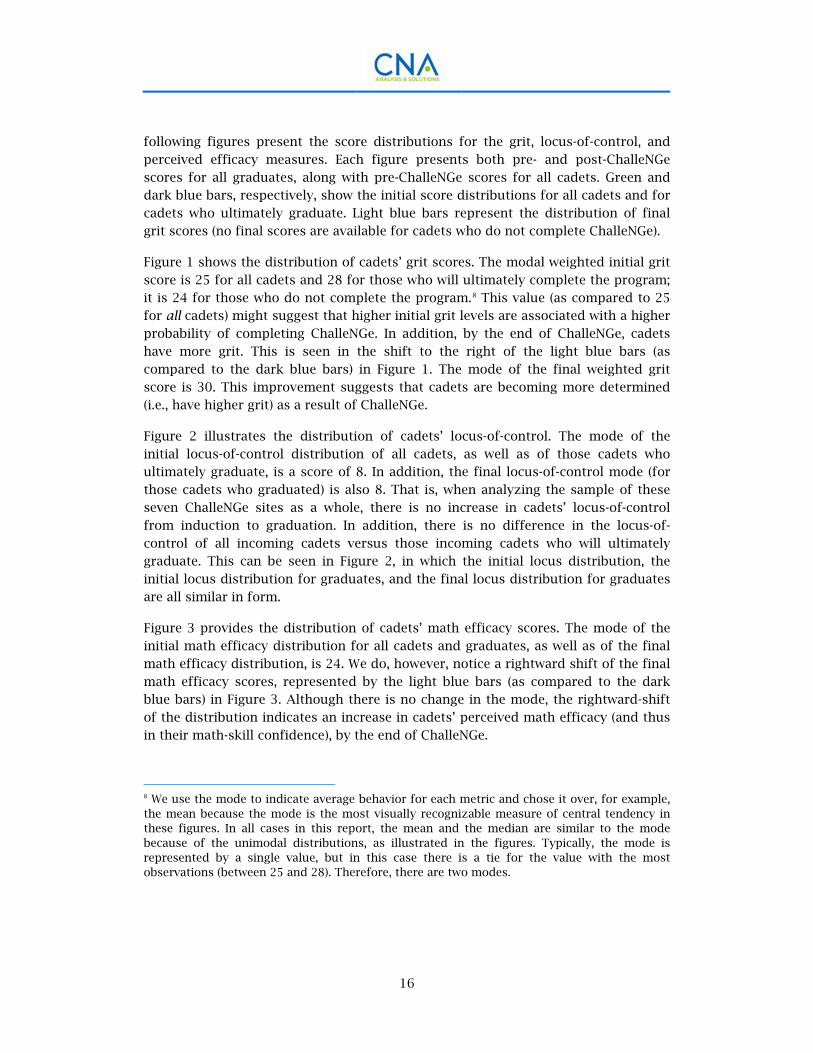
Figure 3 provides the distribution of cadets’ math efficacy scores. The mode of the initial math efficacy distribution for all cadets and graduates, as well as of the final math efficacy distribution, is 24. We do, however, notice a rightward shift of the final math efficacy scores, represented by the light blue bars (as compared to the dark blue bars) in Figure 3. Although there is no change in the mode, the rightward-shift of the distribution indicates an increase in cadets’ perceived math efficacy (and thus in their math-skill confidence), by the end of ChalleNGe.
8 We use the mode to indicate average behavior for each metric and chose it over, for example, the mean because the mode is the most visually recognizable measure of central tendency in these figures. In all cases in this report, the mean and the median are similar to the mode because of the unimodal distributions, as illustrated in the figures. Typically, the mode is represented by a single value, but in this case there is a tie for the value with the most observations (between 25 and 28). Therefore, there are two modes.

17
Figure 1. Cadets’ grit-score distributions, before and after ChalleNGea
Source: Tabulations from CNA seven-site cadet survey. a. The grit measure presented in this figure is actually weighted grit—where a cadet’s grit is weighted by the share of grit subquestions that he or she answered. Thus, the weight is 1 for cadets who answered all subquestions and less than 1 for all others.
Figure 2. Cadets’ locus-of-control distributions, before and after ChalleNGe
Source: Tabulations from CNA seven-site cadet survey. a. The locus-of-control measure presented in this figure is actually weighted locus-of-control—where a cadet’s locus-of-control is weighted by the share of locus-of-control subquestions that he or she answered. Thus, the weight is 1 for cadets who answered all subquestions and less than 1 for all others.
050
100150200250300350400450
5 10 15 20 25 30 35 40
Num
ber o
f obs
erva
tions
Grit scale
Initial grit
Initial grit, grads
Final grit, grads
0
50
100
150
200
250
1 2 3 4 5 6 7 8 9 10 11 12 13
Num
ber o
f obs
erva
tions
Locus-of-control
Initial locus
Initial locus, grads
Final locus, grads
18
Figure 3. Distribution of perceived math efficacy for cadets before and after ChalleNGe
Source: Tabulations of CNA seven-site cadet survey. a. The math efficacy measure presented in this figure is actually weighted math efficacy—where a cadet’s perceived efficacy is weighted by the share of subquestions that he or she answered. Thus, the weight is 1 for cadets who answered all math efficacy subquestions and less than 1 for all others.
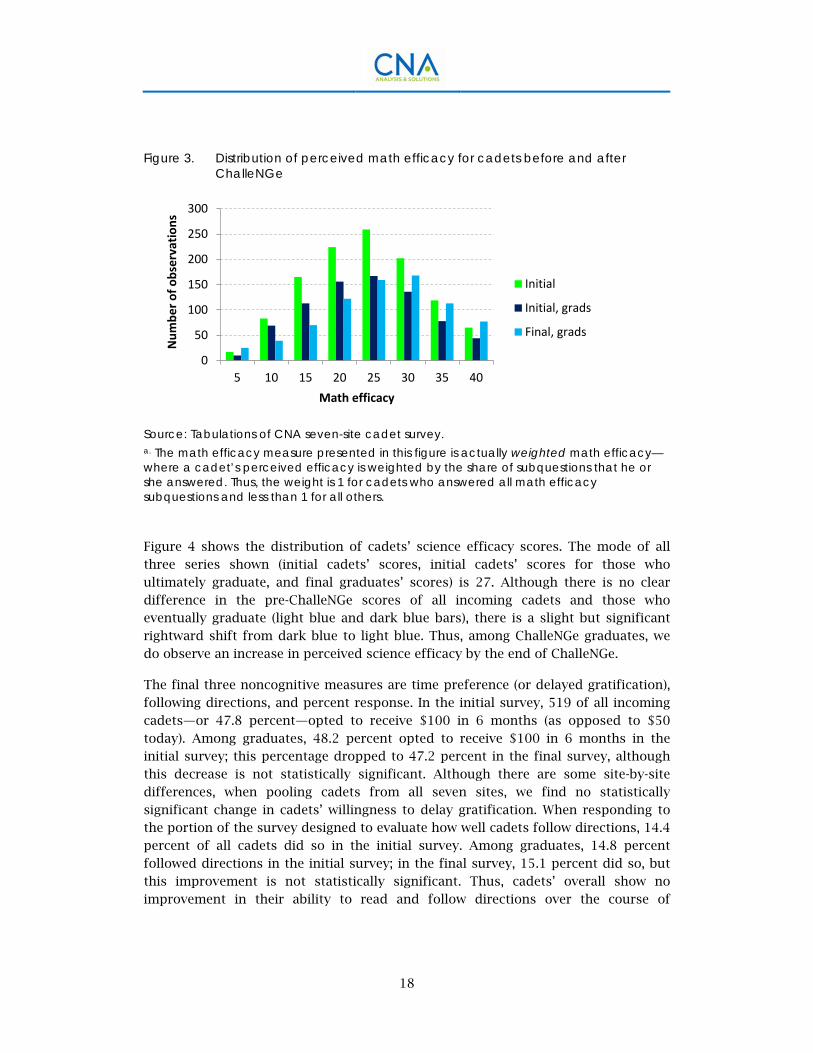
Figure 4 shows the distribution of cadets’ science efficacy scores. The mode of all three series shown (initial cadets’ scores, initial cadets’ scores for those who ultimately graduate, and final graduates’ scores) is 27. Although there is no clear difference in the pre-ChalleNGe scores of all incoming cadets and those who eventually graduate (light blue and dark blue bars), there is a slight but significant rightward shift from dark blue to light blue. Thus, among ChalleNGe graduates, we do observe an increase in perceived science efficacy by the end of ChalleNGe.
The final three noncognitive measures are time preference (or delayed gratification), following directions, and percent response. In the initial survey, 519 of all incoming cadets—or 47.8 percent—opted to receive $100 in 6 months (as opposed to $50 today). Among graduates, 48.2 percent opted to receive $100 in 6 months in the initial survey; this percentage dropped to 47.2 percent in the final survey, although this decrease is not statistically significant. Although there are some site-by-site differences, when pooling cadets from all seven sites, we find no statistically significant change in cadets’ willingness to delay gratification. When responding to the portion of the survey designed to evaluate how well cadets follow directions, 14.4 percent of all cadets did so in the initial survey. Among graduates, 14.8 percent followed directions in the initial survey; in the final survey, 15.1 percent did so, but this improvement is not statistically significant. Thus, cadets’ overall show no improvement in their ability to read and follow directions over the course of
0
50
100
150
200
250
300
5 10 15 20 25 30 35 40
Num
ber o
f obs
erva
tions
Math efficacy
Initial
Initial, grads
Final, grads
19
ChalleNGe. Finally, we do see small but statistically significant improvements in the percentage of the survey the cadets completed, among those who answered at least one question on the survey: these cadets completed 87 percent of the initial survey, on average, and 88 percent of the final survey.9
Figure 4. Distribution of perceived science efficacy for cadets before and after ChalleNGea
Source: Tabulations of CNA seven-site cadet survey. a. The science efficacy measure presented in this figure is actually weighted science efficacy—where a cadet’s perceived efficacy is weighted by the share of subquestions that he or she answered. Thus, the weight is 1 for cadets who answered all science efficacy subquestions and less than 1 for all others.
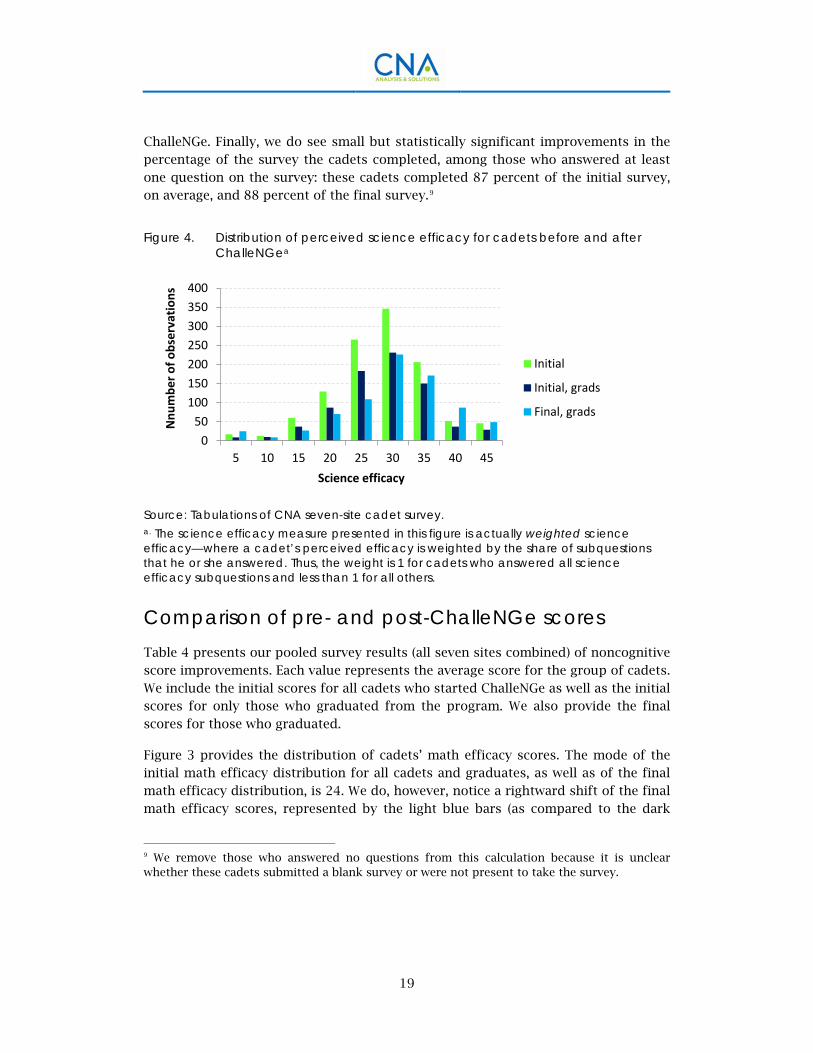
Comparison of pre- and post-ChalleNGe scores Table 4 presents our pooled survey results (all seven sites combined) of noncognitive score improvements. Each value represents the average score for the group of cadets. We include the initial scores for all cadets who started ChalleNGe as well as the initial scores for only those who graduated from the program. We also provide the final scores for those who graduated.
Figure 3 provides the distribution of cadets’ math efficacy scores. The mode of the initial math efficacy distribution for all cadets and graduates, as well as of the final math efficacy distribution, is 24. We do, however, notice a rightward shift of the final math efficacy scores, represented by the light blue bars (as compared to the dark
9 We remove those who answered no questions from this calculation because it is unclear whether these cadets submitted a blank survey or were not present to take the survey.
050
100150200250300350400
5 10 15 20 25 30 35 40 45
Nnu
mbe
r of o
bser
vatio
ns
Science efficacy
Initial
Initial, grads
Final, grads
20
blue bars) in Figure 3. Although there is no change in the mode, the rightward-shift of the distribution indicates an increase in cadets’ perceived math efficacy (and thus in their math-skill confidence), by the end of ChalleNGe.
Table 4. Average noncognitive measures, before and after ChalleNGea
Noncognitive measure Initial score Final scores,
graduates All cadets Graduates Grit 26.5 26.5 28.8*** Locus-of-control (internal) 8 8 8.1 Math efficacy 22.2 21.9 24.7*** Science efficacy 26.6 26.7 28.9*** Chose $100 in 6 months (%) 47.8 48.2 47.2 Followed directions (%) 14.4 14.9 15.1 Percent response (%)b 86.9 87.2 88.1***
Source: Analysis of CNA seven-site cadet-survey data. a. Sample sizes vary for the various metrics based on the number of survey respondents who answered at least one question for that metric. In all cases, the variation is minimal and does not affect interpretation of results. b. The percent response calculations are limited to those cadets who answered at least one question on the survey. *** Differences between graduates’ initial and final scores are statistically significant at the 1-percent level (likelihood of occurring by chance less than 1 in 100). Table 4 illustrates two main points, which are consistent with the analysis in [1] and [2]. The first is that, among those cadets who ultimately graduated from ChalleNGe, noncognitive skills improved on average. This can be seen by comparing the last two columns of Table 4. Cadets who finished the program had statistically significantly higher scores in grit (or fortitude) and greater perceived self-efficacy (or confidence) in both math and science at the end of the program than they did at the beginning. They also were more likely to complete more of the survey at the end of the program, perhaps suggesting that they acquired diligence or an improved attention span at ChalleNGe. No statistically significant change was found for locus-of-control, willingness to delay gratification, or ability to follow directions.10
10 The insignificant improvement in these noncognitive areas is inconsistent with what we found in [1] and [2]. When we compare pre- and post-ChalleNGe locus-of-control and expressed ability to delay gratification for cadets at WYA only, we do find that statistically significant gains are made. Thus, it seems that site-level differences are important—whether these be differences in site philosophies, differences in the emphasis they place on noncognitive skill development, or differences in behaviors and characteristics of their cadet populations.
21
The second point that Table 4 illustrates is that the initial measures of noncognitive skills do not appear to be good predictors of which cadets will complete ChalleNGe. Specifically, when comparing the first and second columns of the table (initial scores of the cadets who ultimately graduate compared with those of all cadets), we see that the average scores are almost identical in all noncognitive measures. This suggests that it is cadets’ experience at ChalleNGe, not the tendencies or characteristics they
have when they arrive, that is most important in predicting their likelihood of completing ChalleNGe. Despite some differences in the specific noncognitive skills in which cadets experience improvements, these results largely mirror the findings in [1] and [2]: ChalleNGe is having a positive impact on cadets’ noncognitive abilities, and cadets’ initial noncognitive skills cannot be used to predict ChalleNGe success.
Differences by cadet characteristics
The analysis presented thus far, as we have noted, has been based on a pooled sample of the ChalleNGe cadets at all seven sites. To the extent that the sites’ populations are composed of noticeably different cadets—based on both observable characteristics (such as race/ethnicity, gender, age, or cognitive abilities) and unobservable characteristics (such as motivation or goals)—we could expect site variation in cognitive and noncognitive skill improvement. To determine whether such site and characteristic-based variation is something our analysis should take into account, we now analyze whether there are differences in noncognitive skills by gender, age, or incoming TABE score.11
We first examine how noncognitive skills differ by gender. Table 5 shows the performance of male and female cadets on each of our noncognitive measures. The results in Table 5 show that male cadets begin ChalleNGe with significantly higher grit and perceived math efficacy, whereas female cadets begin the program with a greater ability to read and follow directions. In the final noncognitive scores, the same differences are evident. These gender differences may indicate that male and female cadets require different approaches to the noncognitive aspects of the ChalleNGe curriculum as related to these specific measures.
11 The results presented in this subsection are all based on univariate analysis; we are not controlling for other factors when determining if initial grit, for example, varies by gender. We use these findings to inform the inclusion of such factors as gender, age, and incoming TABE score in our later multivariate analyses. We then will analyze whether those characteristics found to be important in a univariate setting maintain their impact when other factors are introduced.

22
Table 5. Average Initial and final scores on noncognitive measures, by gendera
Noncognitive measure
Initial score of cadets, graduates
Final score of cadets, graduates
Male Female Male Female Grit 26.8 25.6*** 29.1 27.9*** Locus-of-control (internal) 8.1 8 8.2 8 Math efficacy 22.4 20.4*** 25.1 23.8* Science efficacy 26.5 27.1 28.7 29.3 Chose $100 in 6 months (%) 48 48.8 45.7 51.5 Followed directions (%) 12.5 21.1*** 11.9 23.8*** Percent responseb (%) 87.4 87.4 88.1 88.2
Source: Analysis of CNA seven-site cadet-survey data. a. Sample sizes vary for the various metrics based on the number of survey respondents who answered at least one question for that metric. In all cases, the variation is minimal and does not affect interpretation of results. b. The percent response calculations are limited to those cadets who answered at least one question on the survey. *** Differences between men and women are statistically significant at the 1-percent level (likelihood of occurring by chance less than 1 in 100). * Differences between men and women are statistically significant at the 10-percent level (likelihood of occurring by chance less than 1 in 10). We now illustrate how cadets’ noncognitive skills (both initially and at the end of ChalleNGe) vary by the cadets’ ages. In this and other age analysis, we had two choices for a cadet’s age—we could use his or her age on arrival at ChalleNGe or age at departure (whether age at time of drop or age at time of graduation). We decided to use age at departure because it incorporates information on whether a cadet arriving at ChalleNGe at a certain age was particularly “young” or “old” for that age. For example, a young 16-year-old (who had recently turned 16 when he or she started ChalleNGe) will still be 16 when leaving ChalleNGe. Conversely, an older 16-year-old will have a birthday while at ChalleNGe and leave as a 17-year-old.12 Table 6 shows how cadets’ noncognitive skills vary by age. All statistical significance shown in this table is relative to the 16-year-old age group (in other words, 17-, 18-, and 19-year-olds’ noncognitive skills are all compared with those of 16-year-olds). We do see a few trends by age. Namely, older cadets are grittier, have a more internal locus-of-control, and are noticeably more likely to choose $100 in 6 months over $50 today at the end of the program (although less likely at the beginning of the program) than their younger counterparts. These differences might suggest that the younger cadets
12 We ran our analysis both ways—using arriving age and leaving age—and found very little difference.
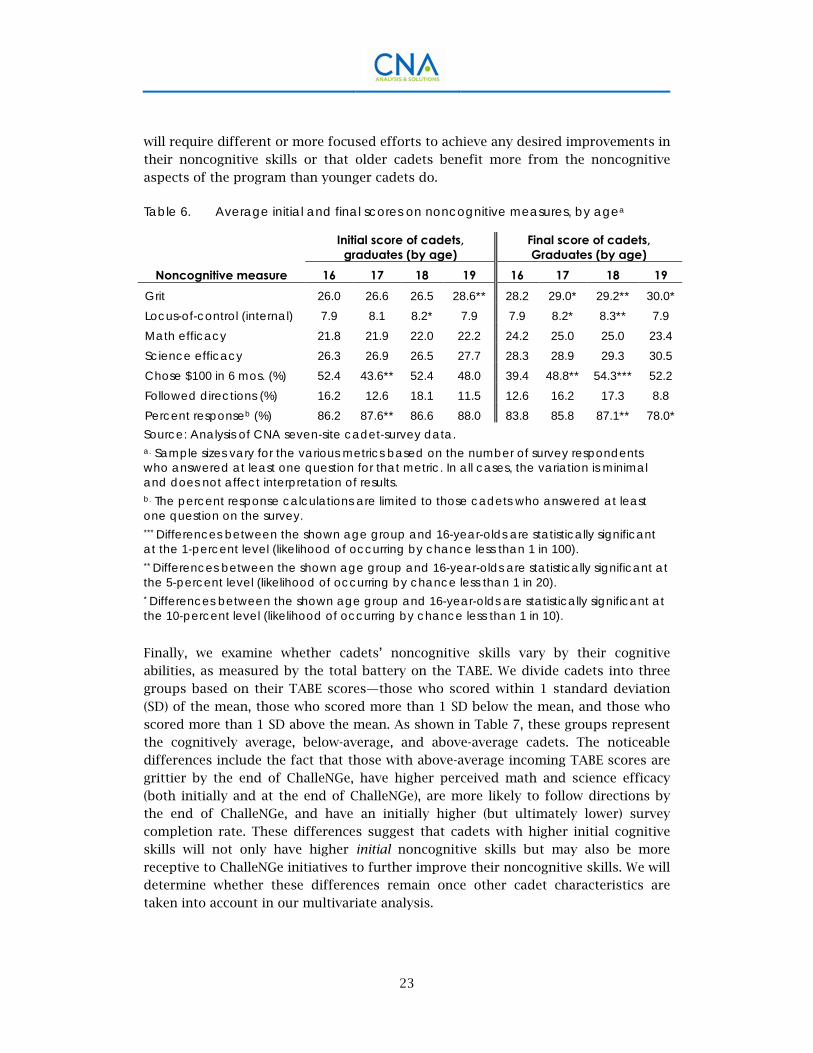
23
will require different or more focused efforts to achieve any desired improvements in their noncognitive skills or that older cadets benefit more from the noncognitive aspects of the program than younger cadets do.
Table 6. Average initial and final scores on noncognitive measures, by agea
Noncognitive measure
Initial score of cadets, graduates (by age)
Final score of cadets, Graduates (by age)
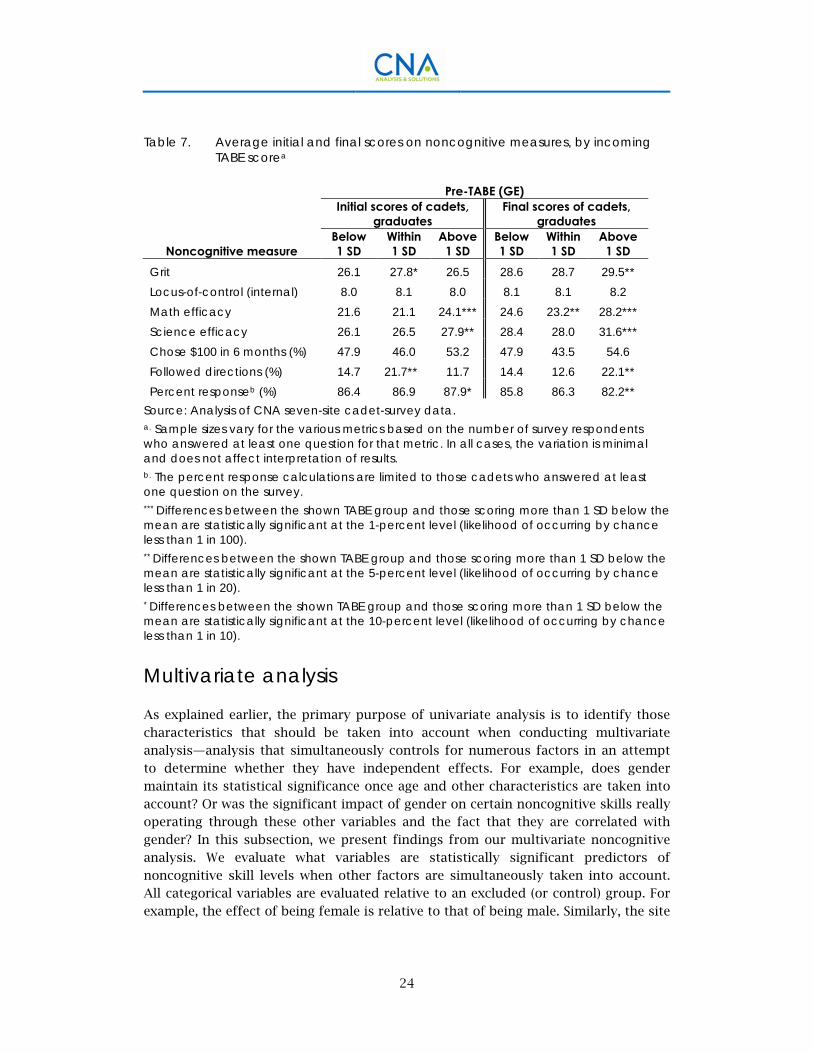
16 17 18 19 16 17 18 19 Grit 26.0 26.6 26.5 28.6** 28.2 29.0* 29.2** 30.0* Locus-of-control (internal) 7.9 8.1 8.2* 7.9 7.9 8.2* 8.3** 7.9 Math efficacy 21.8 21.9 22.0 22.2 24.2 25.0 25.0 23.4 Science efficacy 26.3 26.9 26.5 27.7 28.3 28.9 29.3 30.5 Chose $100 in 6 mos. (%) 52.4 43.6** 52.4 48.0 39.4 48.8** 54.3*** 52.2 Followed directions (%) 16.2 12.6 18.1 11.5 12.6 16.2 17.3 8.8 Percent responseb (%) 86.2 87.6** 86.6 88.0 83.8 85.8 87.1** 78.0* Source: Analysis of CNA seven-site cadet-survey data. a. Sample sizes vary for the various metrics based on the number of survey respondents who answered at least one question for that metric. In all cases, the variation is minimal and does not affect interpretation of results. b. The percent response calculations are limited to those cadets who answered at least one question on the survey. *** Differences between the shown age group and 16-year-olds are statistically significant at the 1-percent level (likelihood of occurring by chance less than 1 in 100). ** Differences between the shown age group and 16-year-olds are statistically significant at the 5-percent level (likelihood of occurring by chance less than 1 in 20). * Differences between the shown age group and 16-year-olds are statistically significant at the 10-percent level (likelihood of occurring by chance less than 1 in 10). Finally, we examine whether cadets’ noncognitive skills vary by their cognitive abilities, as measured by the total battery on the TABE. We divide cadets into three groups based on their TABE scores—those who scored within 1 standard deviation (SD) of the mean, those who scored more than 1 SD below the mean, and those who scored more than 1 SD above the mean. As shown in Table 7, these groups represent the cognitively average, below-average, and above-average cadets. The noticeable differences include the fact that those with above-average incoming TABE scores are grittier by the end of ChalleNGe, have higher perceived math and science efficacy (both initially and at the end of ChalleNGe), are more likely to follow directions by the end of ChalleNGe, and have an initially higher (but ultimately lower) survey completion rate. These differences suggest that cadets with higher initial cognitive skills will not only have higher initial noncognitive skills but may also be more
receptive to ChalleNGe initiatives to further improve their noncognitive skills. We will determine whether these differences remain once other cadet characteristics are taken into account in our multivariate analysis.
24
Table 7. Average initial and final scores on noncognitive measures, by incoming TABE scorea
Noncognitive measure
Pre-TABE (GE) Initial scores of cadets,
graduates Final scores of cadets,
graduates Below 1 SD
Within 1 SD
Above 1 SD
Below 1 SD
Within 1 SD
Above 1 SD
Grit 26.1 27.8* 26.5 28.6 28.7 29.5** Locus-of-control (internal) 8.0 8.1 8.0 8.1 8.1 8.2 Math efficacy 21.6 21.1 24.1*** 24.6 23.2** 28.2*** Science efficacy 26.1 26.5 27.9** 28.4 28.0 31.6*** Chose $100 in 6 months (%) 47.9 46.0 53.2 47.9 43.5 54.6 Followed directions (%) 14.7 21.7** 11.7 14.4 12.6 22.1** Percent responseb (%) 86.4 86.9 87.9* 85.8 86.3 82.2**
Source: Analysis of CNA seven-site cadet-survey data. a. Sample sizes vary for the various metrics based on the number of survey respondents who answered at least one question for that metric. In all cases, the variation is minimal and does not affect interpretation of results. b. The percent response calculations are limited to those cadets who answered at least one question on the survey. *** Differences between the shown TABE group and those scoring more than 1 SD below the mean are statistically significant at the 1-percent level (likelihood of occurring by chance less than 1 in 100). ** Differences between the shown TABE group and those scoring more than 1 SD below the mean are statistically significant at the 5-percent level (likelihood of occurring by chance less than 1 in 20). * Differences between the shown TABE group and those scoring more than 1 SD below the mean are statistically significant at the 10-percent level (likelihood of occurring by chance less than 1 in 10).
Multivariate analysis
As explained earlier, the primary purpose of univariate analysis is to identify those characteristics that should be taken into account when conducting multivariate analysis—analysis that simultaneously controls for numerous factors in an attempt to determine whether they have independent effects. For example, does gender maintain its statistical significance once age and other characteristics are taken into account? Or was the significant impact of gender on certain noncognitive skills really operating through these other variables and the fact that they are correlated with gender? In this subsection, we present findings from our multivariate noncognitive analysis. We evaluate what variables are statistically significant predictors of noncognitive skill levels when other factors are simultaneously taken into account. All categorical variables are evaluated relative to an excluded (or control) group. For example, the effect of being female is relative to that of being male. Similarly, the site

25
effects for Georgia, Illinois, Maryland, Louisiana, Washington, and Wisconsin are all relative to California. These findings are summarized in Table 8 and Table 9.
Each noncognitive measure has been estimated two ways: we first estimate determinants of the final noncognitive score (at the time of our final survey) and then determinants of the change in that score (from the initial survey to the final
survey).13 On the right-hand side of each multivariate regression equation are a number of cadet characteristics. Among the specific characteristics we included (in the different estimation specifications) are the following:
• Gender
• Age on program termination (dropping or graduating)
• An indicator for which site the cadet attended
• The initial value of the cadet’s noncognitive score (corresponding with whatever noncognitive variable is being estimated)
• The percentage of the noncognitive skill subquestions the cadet answered on the survey (corresponding with the noncognitive variable being estimated)14
• Indicators for whether cadets’ scores were within or above 1 SD of the mean:
o Pre-TABE total battery score o Pre-TABE subtest scores o Post-TABE total battery score o Post-TABE subtest scores
A number of interesting and policy-relevant findings emerge from these estimates. First, in most cases, initial noncognitive skills matter. Those cadets with higher initial grit, for example, are statistically significantly more likely to also have higher final grit at program completion. In addition, the higher the initial score, the smaller the grit change will be from initial to final. This is intuitive. The grit score has a
maximum value of 40; cadets with initial scores in the mid- to high-30s have less room for improvement than cadets with initial scores in the teens or 20s. These patterns also hold for all other noncognitive measures. When statistically significant,
13 For choosing the delay of gratification and following direction metrics, which take values of 0 or 1 (a cadet either delayed or did not delay gratification), we estimate both possible directions of change—from 0 to 1 and from 1 to 0 (i.e., from not following directions to following directions and from following directions to not following directions).
14 This is the weight applied to each noncognitive measure. As previously discussed, the weight takes a value of 1 if the cadet answered all of the subquestions, but it will be less than 1 if not all subquestions were answered. We control for this separately to distinguish between changes in the noncognitive weights from the initial to the final survey and changes in the noncognitive skills.
26
the initial score has a positive relationship with that metric’s final score but a negative relationship with the amount of change (typically an increase) achieved.
Second, by the end of ChalleNGe, female cadets have higher perceived science efficacy, are more likely improve in their ability to delay gratification (and less likely to worsen), are more likely to follow directions, and are more likely to improve in this ability. These are multivariate findings, indicating that they hold even when taking other cadet characteristics into account. That is, these are the effects of being a female cadet when all other characteristics are held at their average values. They suggest—as have our previous studies—that gender-tailored approaches may be appropriate for ChalleNGe since male and female cadets arrive at different stages of noncognitive development (Table 5) and seem to vary in their responsiveness to
noncognitive skill improvement approaches.
Third, age is largely insignificant, both in determining final noncognitive skills and the improvement (or change) experienced at ChalleNGe. There are only two exceptions: delaying gratification and overall survey completion. As compared with their 16-year-old counterparts, both 17- and 18-year-olds are more likely to choose $100 in 6 months (in lieu of $50 today) by the end of ChalleNGe. Similarly, among those 17- and 18-year-olds who initially delayed gratification, they are less likely to fail to do so by the time of the final survey. In addition, 17- and 18-year-olds are
more likely to complete a higher percentage of the survey (at the end of ChalleNGe). The general insignificance of age in determining other final noncognitive outcomes is important. It suggests that, in terms of cadets’ noncognitive development, there would be little to no gain from further restricting the ChalleNGe admission age range to exclude 16-year-olds (an analytical inquiry we were specifically asked to evaluate).
Fourth, there are varied and significant site effects across the noncognitive measures. These effects indicate that, when holding cadet characteristics at their average values, there is significant variation in final noncognitive skills and in the level of noncognitive growth achieved depending on which site a cadet attended. This is most likely due to the combined effects of two factors:
1. The sites differ substantially from each other, not only because they offer different educational options (high school diploma, GED, credit recovery), but also because the site directors are given significant leeway in deciding how to run their sites and what program goals to emphasize.
2. The sites serve very different cadet populations, in terms of both demographics and socioeconomics, as we illustrated using ACS data in a previous section of the paper. These differences could influence not only the noncognitive and cognitive skill levels with which cadets arrive at ChalleNGe, but also how receptive they are to the program’s efforts to influence their skills and outlooks.

27
Table 8. Multivariate analysis of noncognitive skill determinants (grit, locus-of-control, math efficacy, and science efficacy)a
Grit Grit change
Locus-of-control
Locus-of-control change Math efficacy
Math efficacy change
Science efficacy
Science efficacy change
Initial score >0 <0 >0 <0 >0 <0 >0 <0
Female Insig. <0 Insig. Insig. Insig. Insig. >0 >0
Age Insig. Insig. Insig. Insig. Insig. Insig. Insig. Insig.
Site WA>0, WI>0 WA>0, WI>0 IL<0, GA<0,
MD<0 IL<0, GA<0,
LA<0 IL<0, LA<0,
MD<0, WI<0 GA<0, IL<0, LA<0,
MD<0, WI<0 GA>0, WI>0,
WA<0 GA>0, WI>0,
WA<0
Pre-TABE within 1 SD Insig. Insig. Language<0 Language<0
Total battery<0, applied math>0, math comp. <0
Total battery<0, applied math>0, math comp. <0
Total battery<0, math
comp.<0
Total battery<0, math
comp.<0
Pre-TABE over 1 SD
Total battery>0;
applied math>0 Insig.
Insig. Insig.
Total battery>0,
applied math>0
Total battery>0,
applied math>0
Total battery>0, reading>0,
language>0
Total battery>0, reading>0,
language>0
Post-TABE within 1 SD
Total battery>0;
language>0
Total battery>0;
language>0 Insig. Insig. Math comp.>0 Applied math>0, math comp.>0 Insig. Reading>0
Post-TABE over 1 SD
Total battery>0;
language>0
Total battery>0;
language>0 Insig. Insig.
Total battery>0,
applied math>0, math comp.>0
Total battery>0,
applied math>0, math comp.>0
Total battery>0, reading>0,
applied math>0
Total battery>0, reading>0,
applied math>0
Observations 746 746 719 719 746 738 746 738 Source: Analysis of CNA seven-site cadet survey data. a. We have reduced our regression results to one column of output per final noncognitive skill (and another for the change in that skill level). For robustness, we analyzed a number of different models for each noncognitive skill: with demographics only on the right-hand-side, with demographics plus pre-TABE scores, and with demographics plus post-TABE scores. The results presented in each cell are the average result for all of these models. Full regression results are available on request.
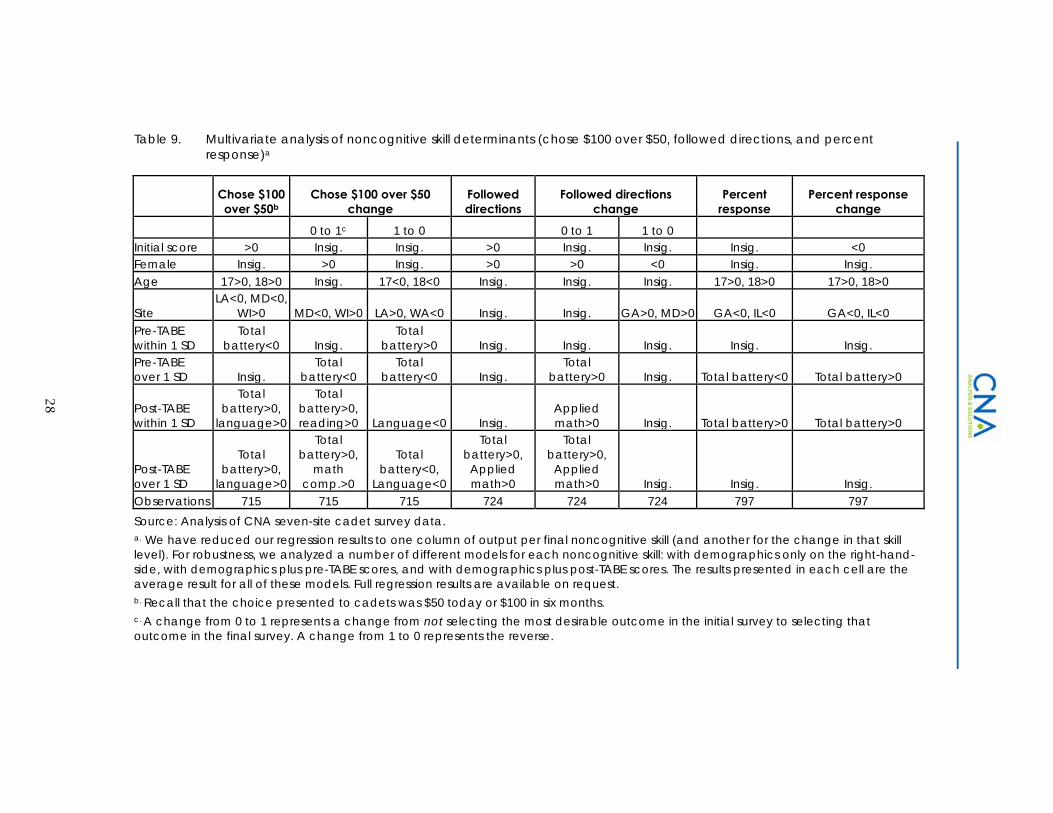
28
Table 9. Multivariate analysis of noncognitive skill determinants (chose $100 over $50, followed directions, and percent response)a
Chose $100 over $50b
Chose $100 over $50 change
Followed directions
Followed directions change
Percent response
Percent response change
0 to 1c 1 to 0 0 to 1 1 to 0 Initial score >0 Insig. Insig. >0 Insig. Insig. Insig. <0 Female Insig. >0 Insig. >0 >0 <0 Insig. Insig. Age 17>0, 18>0 Insig. 17<0, 18<0 Insig. Insig. Insig. 17>0, 18>0 17>0, 18>0
Site LA<0, MD<0,
WI>0 MD<0, WI>0 LA>0, WA<0 Insig. Insig. GA>0, MD>0 GA<0, IL<0 GA<0, IL<0 Pre-TABE within 1 SD
Total battery<0 Insig.
Total battery>0 Insig. Insig. Insig. Insig.
Insig.
Pre-TABE over 1 SD Insig.
Total battery<0
Total battery<0
Insig.
Total battery>0 Insig. Total battery<0 Total battery>0
Post-TABE within 1 SD
Total battery>0,
language>0
Total battery>0, reading>0 Language<0 Insig.
Applied math>0 Insig. Total battery>0 Total battery>0
Post-TABE over 1 SD
Total battery>0,
language>0
Total battery>0,
math comp.>0
Total battery<0,
Language<0
Total battery>0,
Applied math>0
Total battery>0,
Applied math>0 Insig. Insig. Insig.
Observations 715 715 715 724 724 724 797 797 Source: Analysis of CNA seven-site cadet survey data. a. We have reduced our regression results to one column of output per final noncognitive skill (and another for the change in that skill level). For robustness, we analyzed a number of different models for each noncognitive skill: with demographics only on the right-hand-side, with demographics plus pre-TABE scores, and with demographics plus post-TABE scores. The results presented in each cell are the average result for all of these models. Full regression results are available on request. b. Recall that the choice presented to cadets was $50 today or $100 in six months. c. A change from 0 to 1 represents a change from not selecting the most desirable outcome in the initial survey to selecting that outcome in the final survey. A change from 1 to 0 represents the reverse.
29
Finally, cadets’ TABE scores—both incoming and final—and how they compare to the average cadet’s TABE scores in our sample are important predictors of both final noncognitive skills and achievable noncognitive skill improvement. Note that we did not simultaneously control for the total battery and subtest scores or for the pre- and post-TABE scores. Thus, the TABE results shown in Table 8 and Table 9 include results from four separate estimations: one that controlled only for pre-TABE total battery (in the form of indicators for whether a cadet scored within or above 1 SD from the mean), one that controlled only for pre-TABE subtests, one that controlled only for the post-TABE battery, and one that controlled only for post-TABE subtests. Although there are a few unexpected results—namely, the negative relationship between the pre-TABE battery within 1 SD and perceived math and science efficacy—most results indicate that higher TABE scores, when significant, are correlated with higher noncognitive skills. These findings suggest that cognitive and noncognitive skills are best developed simultaneously. In addition, the variation and inconsistency in both the level of statistical significance and in which subtests matter suggest that great care should be taken before restricting ChalleNGe admissions based on test scores.15 Our findings indicate, however, that test-score restrictions would have different impacts on different metrics, some perhaps undesirable.
Recall that the primary goals of ChalleNGe are twofold: improving both noncognitive and cognitive skills. Thus, although our primary focus is on the development of noncognitive skills, we also evaluate ChalleNGe’s impact on cadets’ cognitive skills. We do this by analyzing changes in TABE test scores from the beginning of the program to the end, determining how these scores vary by cadet characteristics, and ultimately conducting a multivariate analysis of final TABE scores. These results are presented next.
Cognitive skills
In addition to using our survey to measure cadets’ noncognitive skills, we collected information on their cognitive skills (i.e., TABE scores) from the ChalleNGe sites. In this subsection, we present both descriptive information and findings from our multivariate analysis regarding the distribution of TABE scores and the cadet characteristics that are correlated with higher TABE scores.
15 The possible addition of a test-score restriction to admission criteria was something we were specifically asked to evaluate.
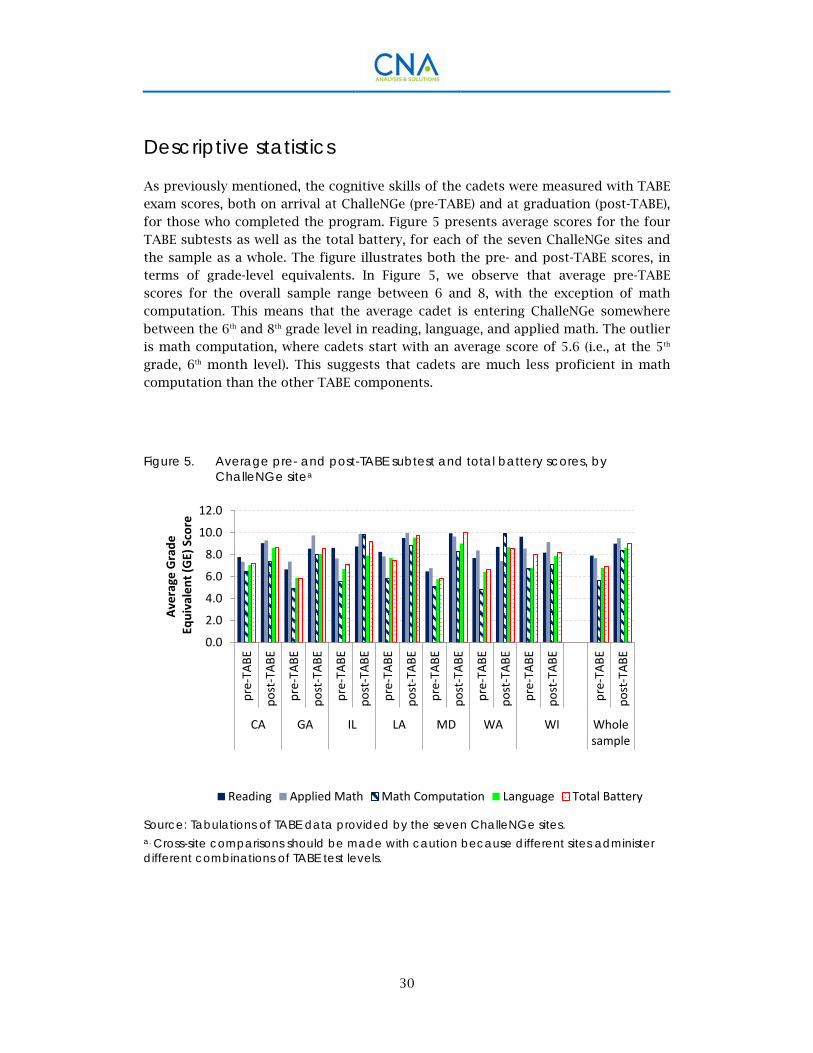
30
Descriptive statistics
As previously mentioned, the cognitive skills of the cadets were measured with TABE exam scores, both on arrival at ChalleNGe (pre-TABE) and at graduation (post-TABE), for those who completed the program. Figure 5 presents average scores for the four TABE subtests as well as the total battery, for each of the seven ChalleNGe sites and the sample as a whole. The figure illustrates both the pre- and post-TABE scores, in terms of grade-level equivalents. In Figure 5, we observe that average pre-TABE scores for the overall sample range between 6 and 8, with the exception of math computation. This means that the average cadet is entering ChalleNGe somewhere between the 6th and 8th grade level in reading, language, and applied math. The outlier is math computation, where cadets start with an average score of 5.6 (i.e., at the 5th grade, 6th month level). This suggests that cadets are much less proficient in math computation than the other TABE components.
Figure 5. Average pre- and post-TABE subtest and total battery scores, by ChalleNGe sitea
Source: Tabulations of TABE data provided by the seven ChalleNGe sites. a. Cross-site comparisons should be made with caution because different sites administer different combinations of TABE test levels.
0.0
2.0
4.0
6.0
8.0
10.0
12.0
pre-
TABE
post
-TAB
E
pre-
TABE
post
-TAB
E
pre-
TABE
post
-TAB
E
pre-
TABE
post
-TAB
E
pre-
TABE
post
-TAB
E
pre-
TABE
post
-TAB
E
pre-
TABE
post
-TAB
E
pre-
TABE
post
-TAB
E
CA GA IL LA MD WA WI Wholesample
Aver
age
Gra
de
Equ
ival
ent (
GE)
Sco
re
Reading Applied Math Math Computation Language Total Battery
31
Two other trends emerge from Figure 6: (1) scores do improve, on average, from the pre-TABE to the post-TABE (whether considering a specific subtest or the total battery), and (2) cadets tend to perform best in Reading, Applied Math, and/or Language, for both the pre- and the post-TABE. The figure also reveals a fair amount of variation across sites—not only in incoming TABE scores but also in the TABE growth achieved at ChalleNGe.
For each TABE subtest, there are various levels of the test, ranging from Easy (E) to Medium (M), Difficult (D), and Advanced (A). On the more difficult tests, fewer correct answers are required to achieve the same score as would be possible on an easier test. For example, 27 correct answers on the math computation level-M test result in a grade equivalent (GE) of 4.7, as do 10 correct answers on the math computation level-A test. The sites administer the tests differently. Some sites give all cadets the D-level tests, regardless of their ability levels, whereas others give tests of different difficulty levels to cadets of different ability levels. The variation in test levels across sites is illustrated in Figure 6.
We present levels for only four sites in Figure 7 because the Washington and Georgia sites administer D-level tests to all cadets, whereas the Wisconsin site uses TABE levels only during the post-TABE and not during the pre-TABE.16 As Figure 6 reveals, some trends are consistent across sites (e.g., the subtest with the highest share of A-level tests is reading and the subtest with the fewest A-level tests is language), while others vary by site. The Louisiana site, for example, appears to give cadets the same-level test for each subtest. That is, they wouldn’t give a student an E-level reading test and an M-level math computation test.
16 Specifically, the Wisconsin site administers a computerized version of the pre-TABE in which questions become increasingly harder (or easier) depending on how many questions a cadet answers correctly (or incorrectly). As a result, there is not one “level” of any given test.

32
Figure 6. TABE-level distribution, by subtest and site
Source: Tabulations of TABE data provided by the seven ChalleNGe sites.
0%10%20%30%40%50%60%70%80%90%
100%Re
adin
gAp
plie
d M
ath
Mat
h Co
mpu
tatio
nLa
ngua
geRe
adin
gAp
plie
d M
ath
Mat
h Co
mpu
tatio
nLa
ngua
geRe
adin
gAp
plie
d M
ath
Mat
h Co
mpu
tatio
nLa
ngua
geRe
adin
gAp
plie
d M
ath
Mat
h Co
mpu
tatio
nLa
ngua
geRe
adin
gAp
plie
d M
ath
Mat
h Co
mpu
tatio
nLa
ngua
geRe
adin
gAp
plie
d M
ath
Mat
h Co
mpu
tatio
nLa
ngua
geRe
adin
gAp
plie
d M
ath
Mat
h Co
mpu
tatio
nLa
ngua
geRe
adin
gAp
plie
d M
ath
Mat
h Co
mpu
tatio
nLa
ngua
ge
pre-TABE post-TABE pre-TABE post-TABE pre-TABE post-TABE pre-TABE post-TABE
CA IL LA MD
A
D
M
E

33
Comparison of pre- and post-ChalleNGe scores
In Table 10, we present the average GE scores for the four TABE subtests as well as the total battery, both on arrival at ChalleNGe and at graduation (for those who completed the program). We observe that ChalleNGe graduates make significant progress in all cognitive measures. The final GE scores, shown in the last column of
the table, represent nearly a two-grade-level improvement in all TABE subtests. This average two-grade level improvement across subtests was found in our previous studies as well. The WYA studies, however, revealed that the largest improvement occurred with the Reading subtest, where graduating cadets improve 1.7 or 3.5 grade levels, on average, from their GE initial scores [1-2]. In the seven-site pooled sample, the average reading improvement is 1.1. This is still a remarkable achievement over the course of a 5.5-month program. The largest gain now appears in math computation: ChalleNGe graduates entered the program with an average GE score of 5.6; it rose to 8.4 by the program’s end.
Table 10. Average cognitive measures
TABE score Initial score (GE) Final scores (GE),
graduatesa All cadets Graduates Reading 7.5 7.9 9.0*** Applied math 7.3 7.7 9.5*** Math computation 5.4 5.6 8.4*** Language 6.4 6.8 8.6*** Total Battery 6.6 6.9 9.0***
Source: Tabulations of TABE data provided by the seven ChalleNGe sites. *** Differences between initial and final score among graduates are statistically significant at the 1-percent level (likelihood of occurring by chance less than 1 in 100). a. Statistical significance shown in this column is for the whole sample. Differences between graduates’ initial and final scores are also statistically significant within each of the seven sites, with the exception of Illinois reading, Wisconsin math computation, and Wisconsin total battery.
Differences by cadet characteristics
As we did in the noncognitive skills discussion, we now evaluate whether cadets’ cognitive skills vary by cadets’ characteristics. For example, are there statistically significant differences in the TABE scores of male and female cadets or of cadets of different ages? This will inform whether we account for gender and/or age in our multivariate analysis. Table 11 shows the performance of male and female cadets in each of the TABE subtests. The results in Table 11 show that male cadets begin ChalleNGe with significantly higher applied math GE scores but significantly lower
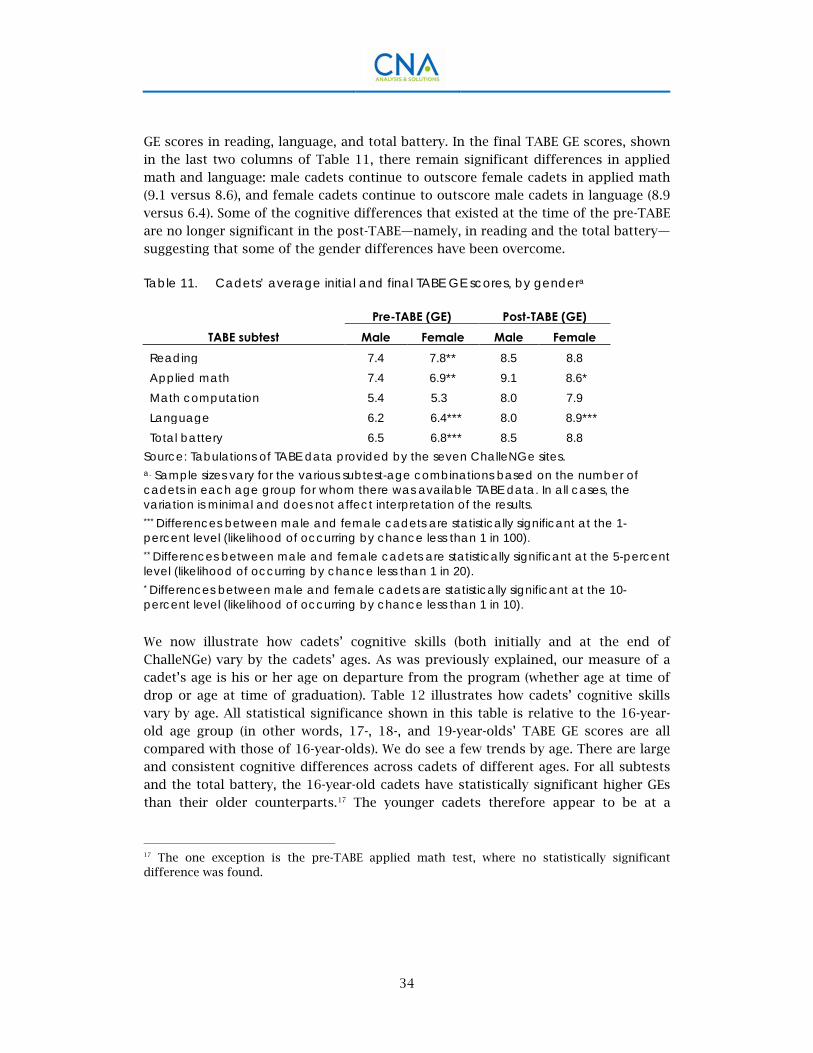
34
GE scores in reading, language, and total battery. In the final TABE GE scores, shown in the last two columns of Table 11, there remain significant differences in applied math and language: male cadets continue to outscore female cadets in applied math (9.1 versus 8.6), and female cadets continue to outscore male cadets in language (8.9 versus 6.4). Some of the cognitive differences that existed at the time of the pre-TABE are no longer significant in the post-TABE—namely, in reading and the total battery—suggesting that some of the gender differences have been overcome.
Table 11. Cadets’ average initial and final TABE GE scores, by gendera
TABE subtest Pre-TABE (GE) Post-TABE (GE)
Male Female Male Female Reading 7.4 7.8** 8.5 8.8 Applied math 7.4 6.9** 9.1 8.6* Math computation 5.4 5.3 8.0 7.9 Language 6.2 6.4*** 8.0 8.9*** Total battery 6.5 6.8*** 8.5 8.8
Source: Tabulations of TABE data provided by the seven ChalleNGe sites. a. Sample sizes vary for the various subtest-age combinations based on the number of cadets in each age group for whom there was available TABE data. In all cases, the variation is minimal and does not affect interpretation of the results. *** Differences between male and female cadets are statistically significant at the 1-percent level (likelihood of occurring by chance less than 1 in 100). ** Differences between male and female cadets are statistically significant at the 5-percent level (likelihood of occurring by chance less than 1 in 20). * Differences between male and female cadets are statistically significant at the 10-percent level (likelihood of occurring by chance less than 1 in 10). We now illustrate how cadets’ cognitive skills (both initially and at the end of ChalleNGe) vary by the cadets’ ages. As was previously explained, our measure of a cadet’s age is his or her age on departure from the program (whether age at time of drop or age at time of graduation). Table 12 illustrates how cadets’ cognitive skills vary by age. All statistical significance shown in this table is relative to the 16-year-old age group (in other words, 17-, 18-, and 19-year-olds’ TABE GE scores are all compared with those of 16-year-olds). We do see a few trends by age. There are large and consistent cognitive differences across cadets of different ages. For all subtests and the total battery, the 16-year-old cadets have statistically significant higher GEs than their older counterparts.17 The younger cadets therefore appear to be at a
17 The one exception is the pre-TABE applied math test, where no statistically significant difference was found.
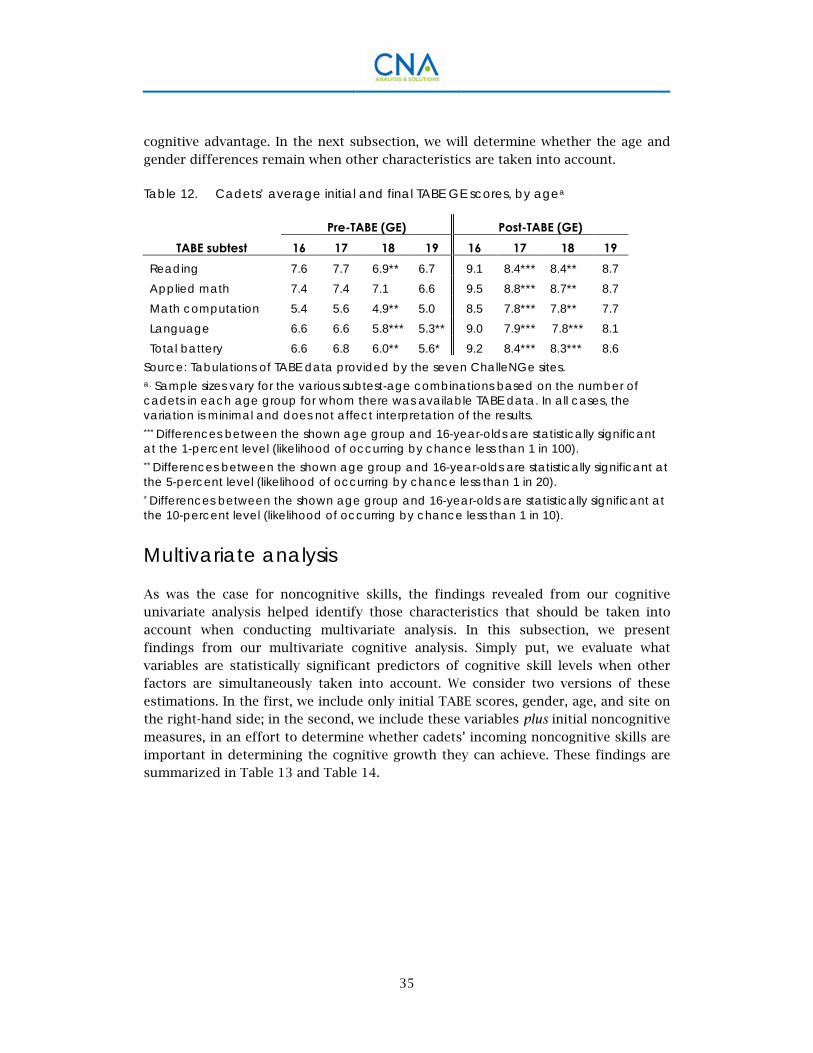
35
cognitive advantage. In the next subsection, we will determine whether the age and gender differences remain when other characteristics are taken into account.
Table 12. Cadets’ average initial and final TABE GE scores, by agea
TABE subtest Pre-TABE (GE) Post-TABE (GE)
16 17 18 19 16 17 18 19 Reading 7.6 7.7 6.9** 6.7 9.1 8.4*** 8.4** 8.7 Applied math 7.4 7.4 7.1 6.6 9.5 8.8*** 8.7** 8.7 Math computation 5.4 5.6 4.9** 5.0 8.5 7.8*** 7.8** 7.7 Language 6.6 6.6 5.8*** 5.3** 9.0 7.9*** 7.8*** 8.1 Total battery 6.6 6.8 6.0** 5.6* 9.2 8.4*** 8.3*** 8.6
Source: Tabulations of TABE data provided by the seven ChalleNGe sites. a. Sample sizes vary for the various subtest-age combinations based on the number of cadets in each age group for whom there was available TABE data. In all cases, the variation is minimal and does not affect interpretation of the results. *** Differences between the shown age group and 16-year-olds are statistically significant at the 1-percent level (likelihood of occurring by chance less than 1 in 100). ** Differences between the shown age group and 16-year-olds are statistically significant at the 5-percent level (likelihood of occurring by chance less than 1 in 20). * Differences between the shown age group and 16-year-olds are statistically significant at the 10-percent level (likelihood of occurring by chance less than 1 in 10).
Multivariate analysis
As was the case for noncognitive skills, the findings revealed from our cognitive univariate analysis helped identify those characteristics that should be taken into account when conducting multivariate analysis. In this subsection, we present findings from our multivariate cognitive analysis. Simply put, we evaluate what variables are statistically significant predictors of cognitive skill levels when other factors are simultaneously taken into account. We consider two versions of these estimations. In the first, we include only initial TABE scores, gender, age, and site on the right-hand side; in the second, we include these variables plus initial noncognitive
measures, in an effort to determine whether cadets’ incoming noncognitive skills are important in determining the cognitive growth they can achieve. These findings are summarized in Table 13 and Table 14.

36
Table 13. Determinants of final TABE scores: total battery and subtestsa
Total
battery
Total battery change Reading
Reading change
Applied math
Applied math
change Math
comp.
Math comp.
change Language Language change
Initial score >0 <0 >0 <0 >0 <0 >0 <0 >0 <0 Female Insig. Insig. Insig. Insig. Insig. Insig. Insig. Insig. Insig. Insig. Age 19>0 19>0 Insig. Insig. Insig. Insig. Insig. Insig. Insig. Insig. Site GA>0,
IL>0, LA>0, MD>0, WI<0
GA>0, IL>0, LA>0, MD>0, WI<0
IL<0, MD>0, WI<0
IL<0, MD>0, WI<0
MD>0, WA<0, WI<0
MD>0, WA<0, WI<0
GA>0, IL>0, LA>0, MD>0, WA>0, WI<0
GA>0, IL>0, LA>0, MD>0, WA>0, WI<0
LA>0, MD>0, WI<0
LA>0, MD>0, WI<0
Observations 833 833 833 833 833 833 833 833 832 832 Source: Analysis of CNA seven-site cadet survey data and TABE data.

37
Table 14. Determinants of final TABE scores (including initial noncognitive skills): total battery and subtests
Total
battery
Total battery change
Read-ing
Reading change
Applied math
Applied math
change Math
comp.
Math comp.
change Lan-
guage Language change
Initial scorea >0 <0 >0 <0 >0 <0 >0 <0 >0 <0 Female Insig. Insig. Insig. Insig. Insig. Insig. Insig. Insig. Insig. Insig. Age Insig. Insig. Insig. Insig. Insig. Insig. Insig. Insig. 17<0 17<0 Site GA>0,
IL>0, LA>0
MD>0, WI<0
GA>0, IL>0, LA>0
MD>0, WI<0
IL<0, MD>0, WI<0
IL<0, MD>0, WI<0
MD>0, WA<0, WI<0
MD>0, WA<0, WI<0
GA>0, IL>0, LA>0, MD>0, WA>0, WI<0
GA>0, IL>0, LA>0, MD>0, WA>0, WI<0
IL<0, MD>0, WI<0
IL<0, MD>0, WI<0
Gritb Insig. Insig. Insig. Insig. Insig. Insig. Insig. Insig. Insig. Insig. Locus-of-control Insig. Insig. Insig. Insig. Insig. Insig. Insig. Insig. Insig. Insig. Math efficacy Insig. Insig. Insig. Insig. Insig. Insig. >0 >0 Insig. Insig. Science efficacy Insig. Insig. >0 >0 Insig. Insig. <0 <0 Insig. Insig. Chose $100 Insig. Insig. Insig. Insig. Insig. Insig. Insig. Insig. Insig. Insig. Followed directions Insig. Insig. Insig. Insig. Insig. Insig. Insig. Insig. Insig. Insig. Percent response Insig. Insig. Insig. Insig. Insig. Insig. Insig. Insig. Insig. Insig. Observations 798 798 798 798 798 798 798 798 797 797 Source: Analysis of CNA seven-site cadet survey data and TABE data. a. In each estimation, the initial cognitive score included is the score that corresponds to the cognitive measure on the left-hand-side of the regression. Thus, when we are estimating determinants of total battery, this is the pre-TABE total battery; when estimating the determinants of final reading score, this is the pre-TABE reading score. b. For this and all other noncognitive measures included in these estimations, the included measure is the initial noncognitive measure, as calculated from the cadets’ responses on the initial survey.
38
A number of policy-relevant findings emerge from these estimations. First, in all cases, initial cognitive skills matter. Those cadets with higher cognitive skills, both on the total battery and the subtests, are statistically significantly more likely to have higher final cognitive skills. In addition, those with higher initial cognitive scores are less likely to experience a substantial change in their TABE scores from the beginning of the program to the time of graduation. These relationships are as expected—those cadets who arrive at ChalleNGe with higher cognitive skills should, by the program’s end, still have higher cognitive skills than their initially lower-scoring counterparts. In addition, those who initially have high cognitive skills will have less room for possible improvement, thus creating the negative relationship between initial cognitive scores and score changes.
Second, demographic characteristics are largely insignificant in predicting cadets’ final cognitive skills. Gender is statistically insignificant in all of the cognitive estimations, and age is almost always insignificant (the two exceptions include total battery in the more simplified estimations—where 19-year-olds have significantly higher scores than their 16-year-old counterparts—and language skills in the estimations that also include initial noncognitive skills—where 17-year-olds have significantly lower language scores than their 16-year-old counterparts). We suspect that these demographic characteristics are insignificant in the multivariate analysis—although significant in univariate analysis—because they are correlated with initial TABE scores, which are included in the multivariate estimations.
Finally, there are varied and significant site effects across the cognitive measures. When holding cadet characteristics at their average values, these effects indicate significant variation in final cognitive skills and in the level of cognitive growth achieved depending on which site a cadet attended. As was true of noncognitive differences, this is most likely due to the combined effects of two factors:
1. The sites differ substantially from each other.
2. The sites serve very different cadet populations, in terms of both demographics and socioeconomics.
We recommend that these site-level differences be further investigated to determine how many of the site-level effects we find are attributable to each of these sources. Such analysis could reveal site-specific practices that are particularly effective (or ineffective), thus resulting in important policy recommendations. Conversely, it could reveal that the majority of site differences are attributable to the fact that the populations the sites serve are different (in terms of demographic, socioeconomic,
39
and other characteristics) and thus confirm that the existing site-level variation and leeway are optimal.18
Predictive power of our noncognitive and cognitive measures
While it is informative to understand on which cognitive and noncognitive measures cadets experience the greatest improvements during ChalleNGe, an investigation into the relationship between these measures and ChalleNGe program completion is also important. If we were able to identify particular cognitive or noncognitive measures that are positively (or negatively) associated with program completion, ChalleNGe could select cadets on these characteristics (when concerned with their attrition rates) and/or spend additional program time working on improving these particular skills, to make program completion more likely.
Thus, we now present a simple model of ChalleNGe completion as a function of both cognitive and noncognitive measures, as well as a few basic demographics. Specifically, we explain the results of a regression model in which the dependent variable is dichotomous: cadets either complete ChalleNGe or they do not.19 We use a logistic (logit) regression model. To fully understand the relationship between our demographic, cognitive, or noncognitive measures and program completion, we estimate six different models, varying the measures included on the right-hand side. The first controls only for demographic characteristics (gender and age) and the site attended. The remaining five models include these variables as well as additional controls. On the right-hand sides of the six models are the following:
1. Gender, age, and site attended
2. Controls in model 1 plus initial noncognitive skills, as measured by our survey
3. Controls in model 1 plus initial cognitive subtest scores, from the TABE
4. Controls in model 1 plus initial cognitive total battery score
18 Using the ACS data, we intend to conduct preliminary analysis attempting to separate the socioeconomic/regional effects from those related to site differences.
19 Recall that our measure of ChalleNGe completion is based on whether a cadet took our second survey. If a cadet did not take the second survey and the program provided no explanation for why that cadet was absent (e.g., being at sick bay), we code that cadet as having dropped from the program. Any cadets who were present for our final survey are coded as having completed the program.
40
5. Controls in model 1 plus initial noncognitive skills and initial cognitive subtest score
6. Controls in model 1 plus initial noncognitive skills and initial cognitive total battery score
The findings from these estimations are displayed in Table 15. Column 1 represents the model (model 1 in the foregoing list) that includes only demographics and site controls; columns 2 through 6 correspond to models 2 through 6. The model presented in column 2, for example, includes demographics, site controls, and initial noncognitive skills, whereas the column 3 model includes demographics, site controls, and initial cognitive subtest scores.
A number of cadet characteristics emerge as significant predictors of program completion. First, before noncognitive or cognitive skills were added to the models, female cadets appeared significantly more likely than their male counterparts to complete ChalleNGe. But once noncognitive and/or cognitive skills are added to the estimation, gender becomes insignificant. This suggests that gender is correlated with both noncognitive and cognitive abilities and that part of the reason female cadets are more likely to complete the program is that they have stronger noncognitive and cognitive skills than male cadets do.
Second, age is a statistically significant determinant of program completion in all six model specifications and the results are consistent: older cadets are more likely to complete ChalleNGe. In all cases, cadets who leave the program as 18- or 19-year-olds are significantly more likely than their 16-year-old counterparts to leave the program due to graduation (vice dropping or being terminated). In many cases, this is also true of 17-year-olds. Thus, there appears to be a significant disadvantage for cadets who leave the program as 16-year-olds—they are more likely to have dropped out or to have been asked to leave. This might suggest that, among 16-year-olds, older 16-
year-olds are more likely to complete ChalleNGe; it may warrant consideration of a change in ChalleNGe’s admission policy. Perhaps those who enter ChalleNGe at age 16 should be older 16-year-olds who will be 17 at graduation.

41
Table 15. Predictors of ChalleNGe completiona
Column 1 Column 2 Column 3 Column 4 Column 5 Column 6 Female >0 Insig. Insig. Insig. Insig. Insig. Ageb 17>0,
18>0, 19>0 17>0,
18>0, 19>0 18>0, 19>0 18>0, 19>0 17>0, 18>0, 19>0 18>0, 19>0
Site GA<0, IL<0, LA<0,
MD<0, WI<0
GA<0, IL<0, LA<0,
MD<0, WI<0
GA<0, IL<0,
MD<0, WI<0
GA<0, IL<0,
MD<0, WI<0
GA<0, IL<0,
MD<0, WI<0
GA<0, IL<0, WI<0
Gritc -- Insig. -- -- Insig. Insig. Locus-of-control -- Insig. -- -- Insig. Insig.
Math efficacy -- <0 -- -- <0 <0
Science efficacy -- Insig. -- -- Insig. Insig.
Chose $100 -- Insig. -- -- Insig. Insig.
Followed directions -- Insig. -- -- Insig. Insig.
Reading GE -- -- >0 -- >0 --
Appl. Math GE -- -- >0 -- >0 --
Math Comp. GE -- -- Insig. -- Insig. --
Language GE -- -- Insig. -- Insig. --
Total battery GE -- -- -- >0 -- >0
N 1,126 1,059 1,014 1,014 954 954 Pseudo R-squared .091 .105 .117 .111 .133 .128
Source: Analysis of CNA seven-site cadet survey data and TABE data. a. “Insig.” denotes that the relationship between that particular variable and ChalleNGe program completion is insignificant at the 10-percent level. Any findings for which we show a relationship (either >0 or <0) are statistically significant at the 10-percent level at a minimum, and often at the 5 or 1 percent level. Complete regression results are available on request. b. The age measure used in these estimations is cadets’ age when leaving the program, whether due to termination or because they graduated. All age effects are relative to 16-year-old cadets. c. For this and all other noncognitive measures included in these estimations, the included measure is the initial noncognitive measure, as calculated from the cadets’ responses on the initial survey.

42
Third, there are significant and consistent site effects (note that all site effects are relative to California). Namely, when statistically significant, cadets at the Georgia, Illinois, Louisiana, Maryland, and Wisconsin sites are all less likely to complete ChalleNGe than are their California-site counterparts. There is no statistical difference, however, between completion probabilities for California and Washington cadets, all else equal. As we previously mentioned, these site differences are likely due to some combination of different practices at each location and the demographic and socioeconomic differences in the populations from which they recruit. Further research is required to separate these two effects.20
Fourth, initial noncognitive skills are largely insignificant in these estimations. This suggests that cadets’ incoming grit, locus-of-control, or perceived math and science efficacy, among other noncognitive skills, have little impact on whether they complete the program. The only exception is perceived math efficacy, which is statistically significant and has a negative relationship with ChalleNGe completion when the pre-TABE scores are also included in the estimation equation. This counterintuitive result is likely due to the fact that perceived math efficacy is correlated with actual math efficacy, as captured by the pre-TABE applied math and
math computation subtest scores. Thus, when both pre-TABE scores and perceived math efficacy are controlled for, this counterintuitive result emerges. Note that, in the absence of pre-TABE scores, math efficacy is statistically insignificant. That is, on its own, this noncognitive skill is not an important predictor of ChalleNGe completion.
Finally, there is a positive and statistically significant relationship between initial
cognitive skills and the likelihood of completing ChalleNGe. Specifically, the pre-TABE total battery is positively correlated with program completion, all else equal, and this effect is driven by the reading and applied math subtests. When, in lieu of the pre-TABE total battery, the subtest scores are included in the estimation equations, the reading and applied math GEs are consistently significant and positively correlated with program completion. These initial subtest scores might therefore be useful in identifying which cadets are lacking the cognitive skills necessary for ChalleNGe completion and could benefit from an extra emphasis on their cognitive development while at ChalleNGe.
20 Using the ACS data on the geographic home regions of the majority of the sites’ cadets together with information on differences in sites’ practices, we will attempt to separate these effects in follow-on work.

43
Conclusions and Recommendations
In this report, we have extended the work of previous CNA research on the success of ChalleNGe in achieving both noncognitive and cognitive gains for the cadets. Previous efforts have focused only on cadets attending the Washington Youth Academy; they were pilots for this larger effort, in which we surveyed and collected data on cadets at seven ChalleNGe sites: California, Georgia, Louisiana, Illinois, Maryland, Washington, and Wisconsin. Cadets in the spring FY15 classes were surveyed shortly after their arrival and again shortly before graduation. The larger sample size in this study—due to surveying cadets from seven different sites—allowed for analytical extensions and inquiries that were not feasible in the previous, WYA-only iterations of the survey. Specifically, we weighted cadets’ responses based on the percentage of subquestions they answered (in lieu of simply dropping those who did not answer all subquestions for a particular measure), we conducted more
robust multivariate analysis of ChalleNGe completion and outgoing TABE scores, and we evaluated the role of cadets’ ages and incoming TABE scores in determining their overall success at ChalleNGe. In addition, owing to the variation in the demographics and socioeconomics of the seven sites’ surrounding areas, we also included analysis of American Community Survey data to inform how the local populations differ (and thus why we might expect differences in ChalleNGe completion rates and cognitive
growth).
Our findings on noncognitive skill growth indicate that, although ChalleNGe does
have a significant impact on cadets’ noncognitive skills, the effects are not significant and consistent across all noncognitive measures. We do, for example, find that
cadets’ overall grit and perceived math and science efficacy increase over the course of the program. However, there is no statistically significant change in locus-of-control, expressed willingness to delay gratification, or ability to read and follow directions from the initial noncognitive survey to the final one. These differences from our previous WYA-only findings—where all noncognitive skills improved—highlight the importance of site differences. Our multivariate analysis revealed that, after taking gender, age, initial noncognitive skills, and initial TABE scores into account, there was still a statistically significant impact of the site attended on cadets’ final noncognitive skills. Thus, there are other site-level differences—perhaps in their teaching philosophies or some aspects of curricula—that lead to differing degrees of noncognitive skill-development across the sites. We also find that initial levels of noncognitive skills matter; for example, the higher a cadet’s initial perceived science efficacy, the higher will be his or her final perceived science efficacy, and the

44
lower will be the change in perceived science efficacy. These relationships held
across almost all noncognitive measures; in a few cases, the impacts were statistically insignificant. Finally, we found statistically significant impacts of cognitive skills (TABE) on noncognitive skills—in almost all cases, higher cognitive skills are associated with more developed noncognitive skills—suggesting that sites should continue their efforts to develop the two simultaneously.
We also analyzed the impact of two demographic characteristics on noncognitive skill development: gender and age. We find, overall, that there are statistically
significant effects of gender, even when holding all other variables constant. Specifically, female cadets have lower grit, have higher perceived science efficacy, are more willing to delay gratification, and are more able to read and follow directions than their male counterparts, all else equal. These findings confirm that gender-tailored approaches are likely appropriate for ChalleNGe since male and female cadets not only arrive at different stages of noncognitive development but also vary in their responsiveness to noncognitive skill improvement approaches at ChalleNGe. Conversely, we found cadet age to be largely insignificant, both in determining final noncognitive skills and the improvement (or change) experienced at ChalleNGe. Cadet age is, however, a significant predictor of ChalleNGe program completion: older cadets are more likely to complete the program than their 16-year-old counterparts. In determining whether to further restrict the ChalleNGe admission age, it is important to weigh these different findings; older cadets are no more likely to experience noncognitive skill improvement at ChalleNGe, but they are more likely
to complete the program.
In addition to analyzing noncognitive skill development, we analyzed the impact of ChalleNGe on cadets’ cognitive skills. Among ChalleNGe graduates, there are sizable and significant increases in all TABE subtests—an average increase of two grade levels, ranging from a low of 1.1 for reading to a high of 2.8 for math computation. Although we observe sizable and significant differences in TABE scores (both incoming and final) by gender and age, once other characteristics are controlled for, in the context of multivariate analysis, gender and age are insignificant predictors of final TABE scores.21 Once again, however, there are statistically significant site effects, indicating that the specific site attended matters more for a cadet’s final noncognitive skills than does the cadet’s gender or age. These site-level differences could emerge (a) because the sites differ substantially in their philosophies and practices, (b) because the sites serve very different populations (from a demographic
21 The one exception is that 19-year-olds have a statistically significantly higher total battery than their 16-year-old counterparts. There are no statistically significant differences for the other age groups or for any of the TABE subtests.
45
and socioeconomic standpoint), or (c) because of some combination of these two effects.
In an effort to determine whether the local populations the sites serve are, in fact, demographically and socioeconomically different, we consulted the American Community Survey. Using ACS data, we illustrated that there are numerous sizable differences in the populations from which the ChalleNGe sites receive the majority of their cadets. There is, for example, significant variation in the racial/ethnic makeup of the local population, which implies cultural differences in the households in which the ChalleNGe cadets were raised. Such differences could feasibly contribute to variation in cadets’ noncognitive skills and how perceptive they will be to attempts to improve their noncognitive skills at ChalleNGe. In addition, there is noticeable variation in the female share of the labor force, the female share of the unemployed, and the primary industry of employment. As a result, cadets’ parents and other influencers will likely have very different labor market experiences, depending on where they live; this could easily influence cadets’ outlook on their ability to find work and become productive, contributing members of society. Finally, there also were noticeable differences in the adolescent populations across the locations, primarily in the percentage of female adolescents who gave birth in the last 12 months and in the percentage living in any household (and in a married-couple household). The frequency of adolescent childbirth and adolescents’ living conditions are likely to affect their perspectives regarding the socioeconomic statuses that are achievable. Thus, there could be effects on the extent to which adolescents apply themselves in high school and value education. Overall, there are numerous differences across the surrounding areas’ local populations, implying that there are important socioeconomic and demographic differences. Such differences could affect the cognitive and noncognitive improvements that are achievable while the cadets are at ChalleNGe.
This evidence, however, is merely suggestive. We cannot confidently separate the effects of population differences from the effects of site differences without more detailed information. Specifically, we would need detailed data on the cadets’ demographics and socioeconomics, as well as information from site administrators on site philosophies and administration. We therefore recommend further study of this issue to identify why site differences exist. Is it because of the socioeconomic
and demographic characteristics of the cadet population? Or is it because of programmatic differences? If site-level differences in cadets’ cognitive and noncognitive development are being driven by the latter, there may be cause to enforce more consistent structure across the sites, in order to provide equal opportunities for improvement to all cadets.
Finally, we estimated the determinants of program completion, as a function of initial cognitive skills, initial noncognitive skills, and basic demographics. The most striking finding is the consistent statistical significance of a cadet’s age, regardless of

46
the model specification. In all cases, older cadets are more likely to complete ChalleNGe than their 16-year-old counterparts. In some cases, only those who were 18 or 19 at the end of the program were more likely to graduate; in other cases, 17-year-olds were more likely to graduate as well. The robustness of this finding to various econometric specifications suggests that age is an independently important predictor of program completion and that the maturity levels of the older cadets provide them with the fortitude necessary to complete ChalleNGe. This suggests that the younger cadets might benefit from the older cadets’ guidance and influence. We recommend that ChalleNGe evaluate this further and consider encouraging greater interaction across age levels and perhaps encourage the formation of mentor-mentee relationships among cadets. There also were significant site effects, again suggesting either that there are differences in the sites’ philosophies and practices or that the sites serve socioeconomically and demographically different populations. Relative to California, five of the seven remaining sites (Georgia, Illinois, Louisiana, Maryland, and Wisconsin) have lower completion rates, after the estimation’s other controls
have been taken into account. These findings confirm the need for analysis that can identify whether these site-level effects are being driven by changes in the local populations or are a result of differences in the ChalleNGe sites.
A few additional recommendations also emerged from our analysis:
• Our analysis has highlighted a number of cases in which there are differences in cognitive or noncognitive development (while at ChalleNGe) by gender or age. We therefore recommend that the sites work to leverage these differences; female cadets could help male cadets in areas in which they have a revealed advantage (and vice versa). Similarly, older cadets could work with younger cadets as necessary. In many cases, the establishment of direct mentoring relationships may not be necessary; the desired influence could be achieved simply via interaction and observation of one’s peers.
• The existing differences in TABE administration across ChalleNGe sites need to be well understood by the “consumers” of these statistics. Such differences include the levels of the TABE tests being administered and the socioeconomic and demographic differences in the sites’ populations. It is crucial that policy-makers and researchers understand that comparing growth across ChalleNGe sites is, for the reasons discussed here, not an “apples to apples” comparison.
47
References
[1] Sutton, Warren T., Lauren D. Malone, and Jennifer R. Atkin. 2014. Cognitive and Noncognitive Improvements Among Cadets at the Washington Youth Academy (WYA). CNA. DRM-2014-U-008846-Final.
[2] Wenger, Jennie W., and Jennifer R. Atkin. 2013. Cognitive and Noncognitive Changes From Participation in National Guard Youth ChalleNGe. CNA. DRM-2013-U-005201.
[3] National Guard Youth Foundation. 2016. "About Youth ChalleNGe." National Guard Youth Foundation. Accessed Mar. 3, 2016. http://www.ngyf.org/about-challenge-2/.
[4] Farkas, G. 2003. “Cognitive Skills and Noncognitive Traits and Behaviors in Stratification Processes.” Annual Review of Sociology 29: 541-562.
[5] Aronson, Joshua. 2002. “Improving Academic Achievement: Impact of Psychological Factors on Education.” In Educational Psychology Series. Edited by Gary D. Phye. San Diego: Academic Press.
[6] Farrington, C. A., M. Roderick, E. Allensworth, J. Nagaoka, T. S. Keyes, D. W. Johnson, and N. O. Beechum. 2012. Teaching Adolescents To Become Learners. The Role of Noncognitive Factors in Shaping School Performance: A Critical Literature Review. University of Chicago Consortium on Chicago School Research.
[7] Wigfield, Allan, Jacquelynne S. Eccles, and Paul R. Pintrich. 1996. “Development Between the Ages of 11 and 25.” In Handbook of Educational Psychology. 148-185. New York: Macmillan Library Reference.
[8] Roberts, Brent W., Kate E. Walton, and Wolfgang Viechtbauer. 2006. “Patterns of Mean-Level Change in Personality Traits Across the Life Course: A Meta-Analysis of Longitudinal Studies.” Psychological Bulletin 132 (1): 1-25.
[9] Heckman, James J., Seong Hyeok Moon, Rodrigo Pinto, Peter A. Savelyev, and Adam Yavitz. 2010. “The Rate of Return to the HighScope Perry Preschool Program.” Journal of Public Economics 92 (1-2): 114-128.
[10] Heckman, J. J. 2008. “Schools, Skills, and Synapses.” Economic Inquiry 46 (3): 289-324.

48
[11] Bowles, Samuel, Herbert Gintis, and Melissa Osbourne. 2001. “The Determinants of Earnings: A Behavioral Approach.” Journal of Economic Literature 39 (4): 1137-1167.
[12] Kirby, Kris N. 1997. “Bidding on the Future: Evidence Against Normative Discounting of Delayed Rewards.” Journal of Experimental Psychology 126 (1): 54-70.
[13] Reynolds, Brady, and Ryan Schiffbauer. 2005. “Delay of Gratification and Delay Discounting: A Unifying Feedback Model of Delay-Related Impulsive Behavior.” The Pscychological Record 55 (3): 439-460.
[14] Wenger, Jennie, Cathleen McHugh, Seema Sayla, and Robert Shuford. 2008. Variations in Participants and Policies Across ChalleNGe Programs. CNA. CRM D0016643.A2/Final.
CNA This report was written by CNA’s Resource Analysis Division (RAD).
RAD provides analytical services—through empirical research, modeling, and simulation—to help develop, evaluate, and implement policies, practices, and programs that make people, budgets, and assets more effective and efficient. Major areas of research include health research and policy; energy and environment; manpower management; acquisition and cost; infrastructure; and military readiness.
DRM-2016-U-013175-Final
www.cna.org ● 703-824-2000
3003 Washington Boulevard, Arlington, VA 22201
CNA is a not-for-profit research organization that serves the public interest by providing
in-depth analysis and result-oriented solutions to help government leaders choose
the best course of action in setting policy and managing operations.
Nobody gets closer— to the people, to the data, to the problem.