the role of cognitive and noncognitive skills in selecting ... · pdf filethe role of...
TRANSCRIPT
The Role of Cognitive and Noncognitive Skills in Selecting into
Migration∗
Aline Butikofer
Norwegian School of Economics
Giovanni Peri
University of California, Davis
April 27, 2016
Abstract
We assess the importance of cognitive and noncognitive (soft) skills on geographic migrating
using data that combine military enlistment information and administrative data for the male
population born in 1932 and 1933 in Norway. The data measure ‘sociability’ and ‘adaptability’
skills based on detailed interviews with a psychologist at age 18. We find that adaptability
has a significant and positive impact on the probability of moving out of one’s local labor
market or from rural to urban areas. High cognitive ability is also associated with a higher
propensity to migrate. We find that adaptability has a particularly strong impact on migration
for individuals with low cognitive skills implying a very strong positive selection of low skilled
with respect to the (previously unobserved) adaptability skill. We also present evidence that
adaptability has no significant effect on the earnings premium of those who migrate, while
cognitive skills have a strong positive effect on earnings returns to migration. This evidence
is consistent with adaptability skills mainly reducing the non-monetary migration costs, while
cognitive skill mainly increase the earnings returns to migration.
1 Introduction
Recent economic research has found that besides cognitive skills, also noncognitive skills, often
referred to as ‘soft skills’, such as the degree of sociability of an individual or his/her adaptability
to new people and situations, are valuable characteristics in the labor market. While the traditional
theory of human capital and schooling can be seen as emphasizing the role of cognitive abilities in
enhancing the productivity of individuals, we are just beginning to understand the role of other,
noncognitive abilities on labor productivity. These abilities may affect the marginal productivity
of individuals (see Lindqvist and Vestman, 2011; Lundborg, Nystedt, and Rooth, 2014; Gensowski,
∗Aline Butikofer, Department of Economics, Norwegian School of Economics, Helleveien 30, 5045 Bergen, Norway.Email: [email protected]. Giovanni Peri, Department of Economics, UC Davis, One Shields Avenue, Davis,CA 95616. Email: [email protected].
1
2014, among others), enhance their ability of accumulating human capital (Segal, 2013), or they may
affect their occupational choice and specialization (see, e.g., Bacolod, Blum, and Strange, 2009).
They may also differ between men and women more than cognitive abilities and hence drive, in
part, their productivity differentials (Beaudry and Lewis, 2014). In the wake of this literature, we
analyze how cognitive and noncognitive skills of individuals affect their geographic mobility. Inter-
regional and rural-urban migration is a crucial way of realizing one’s labor market potentials as well
as a very important economic investment. While the literature has recognized for a long time the
crucial importance of human capital (schooling) on increasing the propensity to migrate internally
and internationally,1 it is not known what part of this effect is due to cognitive and what part to
noncognitive soft skills. This paper analyzes how cognitive and noncognitive skills, measured at 18
years of age, affect the migration behavior of an individual over his/her working career.
Understanding how cognitive and noncognitive abilities affect geographic mobility advances two
lines of research. On one hand, we improve our understanding of migrant selection. If individual
skills that increase the probability of migrating also make individuals more productive then this
implies a positive selection of migrants along productivity measures. This suggests that migrants
could be important economic contributors in the destination and their departure is a larger cost to
the place of origin. In addition, if cognitive and noncognitive abilities that increase the probability to
migrate make people more likely to succeed in the destination, this bodes well for their assimilation
in the receiving economy. On the other hand, this paper improves our understanding of the channels
through which cognitive and noncognitive skills affect individual income. Migration is an important
investment and a mechanism through which people increase their permanent income. Migrants
pay a current cost to move where their skills are paid more and hence their returns to abilities are
higher. The connection between abilities and labor market success can be mediated by geographical
mobility. Skills that reduce the cost of moving or increase the economic returns to moving may, in
the long run, realize better employer-employee matches and more efficient allocation of productive
resources, via higher mobility.
Whereas the correlation between schooling and migration, and the selection of migrants along
the educational dimension have been studied extensively (see, e.g., Borjas, 1987; Borjas, Bronars,
and Trejo, 1992; Dahl, 2002; Grogger and Hanson, 2013), there are, to our knowledge, only very
few studies that analyze the connection between cognitive and noncognitive abilities and migra-
tion (Jaeger, Dohmen, Falk, Huffman, Sunde, and Bonin, 2010; Jokela, Elovainio, Kivimaki, and
Keltikangas-Jarvinen, 2008; Jokela, 2009). The main contribution of this paper is to analyze
whether two types of (soft) noncognitive skills that we define as ‘adaptability’ and ‘sociability’
and one (hard) cognitive skill, the ‘IQ’ (intelligence quotient), all measured at age 18, affect the
geographical mobility of individuals and in particular their probability to move out of their labor
market region of origin during their working life. We investigate these effects by using detailed
1See for instance Malamud and Wozniak (2012) on schooling and internal migration and Grogger and Hanson(2011) on schooling and international migration.
2
population registry data from Norway from 1960 until 2010, which include annual information on
the municipality of residence and labor market outcomes. These data can be linked to data on
military enlistment for all men. Military enlistment was mandatory for Norwegian men during the
considered period. The military enlistment data include an abundance of individual and family
background characteristics, several scores assessing the cognitive ability of individuals as well as
their psychological suitability to military service. The psychological suitability to military service
is evaluated by military psychologists in a personal interview and the psychologists assessed in par-
ticular the recruits’ adaptability and sociability.2 These data are available for all male individuals
reaching age 18 in year 1951 and 1953 and we can follow these individuals over their working life,
starting in 1960 until their retirement.
This information allows us to analyze how IQ, adaptability, and sociability scores at age 18 af-
fect the probability to migrate during the working life. We can also analyze whether the cognitive
and noncognitive attributes of an individual interact with each other as complement or substitutes
in determining the propensity to migrate. Besides establishing a link between skills and the prob-
ability to move out of one’s local labor market, we ask a second important question: through what
channels do adaptability, sociability, and cognitive ability affect migration? In particular, focusing
on the ‘soft’ noncognitive skills it is important to understand whether they mainly affect the mon-
etary return to migration or whether they reduce the (non-monetary) cost of migration. Within a
simple variation of the Roy (1951) model of migration and selection a rational individual decides to
emigrate if the expected returns from migration are larger than its (monetary plus non-monetary)
costs of moving. We derive different predictions of the model on the migration probability and on
the pre-post migration earnings differential depending on whether an individual’s skills affect the
returns to migration or if they affect the costs of migration. This model generates the robust pre-
diction that the intensity of a skill that increases productivity (and hence the returns to migration)
should affect positively the probability to migrate and the pre-post migration earnings differential.
To the contrary, a characteristic that mainly affects the non-monetary cost of migration should
have a positive impact on the migration probability but a negative or null impact on the pre-post
migration earnings differential of the migrant.
We find that both the IQ and the soft ‘adaptability’ skill have a significant and positive impact
on the probability to move across regions (or to move from rural to urban location) within the first
decades of working life. Sociability, instead, does not seem to have any impact on the propensity to
migrate. In addition, we find that adaptability has a particularly strong impact on migration for
individuals outside the top quintile of cognitive ability distribution, suggesting that adaptability
is relevant for deciding to migrate except when cognitive abilities are very high (and drive high
probability of migration). Moreover, our empirical analysis reveals that adaptability significantly
affects the probability of migrating but not the pre-post migration earnings differential consistently
2We follow previous work by Lindqvist and Vestman (2011) in considering that the military psychologists’ assess-ment offers a reasonable and objective measure of noncognitive abilities.
3
with a channel that reduced non-monetary migration costs.
These results seem reasonable and interesting. First, a soft skill like adaptability that can be
measured at age 18, turns out to be important in increasing the probability of migrating. Moving to
a different region requires the ability to deal with new situations, new people and therefore better
adaptability skills can certainly decrease adjustment costs and increase the propensity to migrate.
Second, the importance of adaptability skills raises the question whether they can be increased in
the population. The possibility of improving the adaptability skills of individuals through schooling,
by exposing students to a varied and changing environment and by allowing them to interact with
individuals with diverse and heterogeneous backgrounds, may increase the probability that they
decide to migrate later in life and realize their best labor market options. Adaptability that
spurs mobility would also improve the functioning of the labor markets by reducing the mobility
costs. While it is hard to know how education could improve adaptability, the significant effect on
migration that we find emphasizes the potential economic return in doing that.
The rest of the paper proceeds as follows. Section 2 summarizes previous literature analyzing
the effect of noncognitive abilities on labor market characteristics. Section 3 presents the theoretical
model. We discuss the data and provide descriptive statistics in Section 4. We describe our empirical
strategy in Section 5. We discuss our results and the robustness analysis in Section 6. Section 7
provides a brief conclusion.
2 Previous Literature
There exist abundant literature on the link between migration and human capital. Part of it is based
on variations of the selection model introduced by Roy (1951) and then developed by Borjas (1987)
and Grogger and Hanson (2013) to analyze the skill selection of international migrants. Those
models emphasize different type of selection across skills depending on the skill returns in the
sending and in the receiving economies. In the context of internal migration, Borjas, Bronars, and
Trejo (1992) find that persons are more likely to leave the state of origin if their skills are mismatched
with the reward structure offered by their current state and Dahl (2002) shows that differences in the
returns to education and amenities across states are important determinants of the relative state-
to-state migration flows of college versus high school educated individuals. Another strand of the
literature focuses more on documenting the higher geographic mobility of college educated relative
to less educated individuals, both internally (e.g. Malamud and Wozniak, 2012; Molloy, Smith,
and Wozniak, 2011) and internationally (e.g. Marfouk, 2007). Some studies analyze the selection
of migrants on observable and unobservable characteristics (e.g. Fernandez-Huertas Moraga, 2011;
Ambrosini and Peri, 2012), mainly relying on wages before migration as capturing the unobserved
human capital characteristics of migrants. Hence, these papers characterize the migrant selection
as positive or negative depending on the pre-migration wage relative to that of non-migrants.
Much less common is to investigate the connection between cognitive and noncognitive skills and
4
migration behavior. One reason is the extremely limited availability of measures of cognitive and
noncognitive skills at the individual level. In many cases the skill content of individuals is derived by
their occupational choice (e.g. Beaudry and Lewis, 2014), which is clearly an endogenous variable,
and cannot be used to analyze the effects on the propensity to migrate.
One of the few papers analyzing the impact of noncognitive skills of individuals on migration
is a study by Jaeger, Dohmen, Falk, Huffman, Sunde, and Bonin (2010), which looks at the re-
lationship between self-assessed risk attitudes and migration using data on risk aversion form the
German Socioeconomic Panel. The authors find that individuals who are more willing to take risks
are also more likely to migrate, confirming the theory that migration is a risky investment in human
capital. In addition, there are a couple of studies in the psychological literature investigating the
relationship of self-assessed personality traits and migration. Examples include Jokela, Elovainio,
Kivimaki, and Keltikangas-Jarvinen (2008) who examine whether sociability and emotionality pre-
dicted migration propensity, selective urban to rural migration, and migration distance in a 9-year
prospective study in Finland. The authors find that high sociability predicted migration to urban
areas and longer migration distances. In addition, Jokela (2009) examined the role of personality
in predicting the propensity to migrate within and between U.S. states. He shows that high open-
ness and low agreeableness increased within- and between-states migration, while high extraversion
increased within- but not between-states migration. Other mental traits were not related to migra-
tion probability. Our study is therefore the first using individual panel data from an administrative
sources, covering two whole male cohorts of a country (Norway), and using a measure of noncog-
nitive soft skills based on a personal interview (and not self-assessed or occupation-inferred) and
their impact on migration propensity. Moreover, as these abilities are measured at age 18 and the
individuals are followed over their whole working life, we can assess the long-run effects of different
cognitive and noncognitive abilities on mobility outcomes over a long period.
While few studies have connected soft skills and migration, there is a growing literature on
the impact of noncognitive skills on labor market outcomes of individuals. The majority of these
papers, however, measures noncognitive abilities based on self-reported questionnaires (Duncan and
Morgan, 1981; Murnane, Willett, Braatz, and Duhaldeborde, 2001; Goldsmith, Veum, and Jr., 1997;
Mueller and Plug, 2006; Borghans, Meijers, and ter Weel, 2008), or they infer noncognitive ability
from observed behavior (Heckman and Rubinstein, 2001; Heckman, Stixrud, and Urzua, 2006;
Kuhn and Weinberger, 2005). More recently, noncognitive ability has been measured using teacher
evaluations (Segal, 2013) or personal interviews with a psychologist (Lindqvist and Vestman, 2011).
In particular, Segal (2013) finds that eighth-grade misbehavior, assessed by a teacher, is negatively
correlated with earnings and associated with lower educational attainment even after controlling for
eighth-grade test scores and family background characteristics. Lindqvist and Vestman (2011) use
Swedish data from the military enlistment, similar to the data we use in this paper, and find that
low level of labor market attachment and low annual earnings depend more on lack of noncognitive
5
rather than cognitive skills in Swedish men. On the other hand, they present empirical evidence
showing that cognitive ability is a stronger predictor of earnings for highly skilled workers. Our
study uses data of quality comparable to Lindqvist and Vestman (2011) and it is the first to analyze,
within the simple framework of a Roy model, the impact of cognitive and noncognitive skills on
mobility of individuals.
3 Model
We consider a framework that modifies the typical model by Roy (1951). In this framework indi-
viduals differ in terms of a vector of observable productive characteristic s (think of cognitive skills
as s1, social skills as s2, adaptability as s3 and so on), and one unobservable productive charac-
teristic ε whose distribution, conditional on the other characteristics, is a random normal with 0
average and standard deviation of one.3 These individuals live in location H, they maximize their
wage income and they are considering whether to migrate or not to location F . For simplicity, we
consider that among all possible locations, F is the one that has the highest average productivity
and returns to all skills and hence individuals only compare that location to their current one. The
wage that individual i would receive if she remains in H and works there is:
wHi = µH + βH ∗ si + βHε εi, (1)
where ∗ indicates a vector product, µH is the average productivity of an individual in location
H while βH = (βH1 , βH2 , β
H3 , ...) is the vector of linear returns to units of each individual skill smi
in location H and si = (s1i, s2i, s3i, ...) is the endowment of each skill of individual i. In expression
(1), we assume that skills affect productivity linearly and independently of each other. This is a
simplification and can be removed to analyze the interactions across skills (as we do in the empirical
analysis). Similarly we assume that the parameter βHε ≥ 0 represents the return to one unit of the
unobservable skill and εi is individual i endowment of that skill. The wage that individual i gets if
she were to move to F is, instead:
wFi = µF + βF ∗ si + βFε εi, (2)
where µF is the average productivity of location F and βF ≥ 0 and βFε ≥ 0 are the returns to
individual observable and unobservable skills in location F . As a relevant case, we consider one
in which the best potential location for a person, outside the current one, has a larger average
productivity than location H (µF > µH), a larger return for the observable productive skills (each
component of βF is larger than the corresponding component of βH), and a larger return for the
unobservable skill (βFε > βHε ). This assumption is strong, but plausible and in line with what
3Skills may be correlated in their distribution across individuals. The term ε is the remaining skill, and conditionalon observable skill endowments it is randomly distributed across individuals with 0 mean.
6
is observed across economies. It presumes that a highly productive location has higher average
productivity and higher return to all skills than a lower productivity location.4 It also implies that
people move from low to high productivity locations and that the selection of migrants is positive
on the observed and unobserved skills. We also assume that the cost of moving to any location
for individual i is equal to Ci. Ci has two component CM representing monetary costs expressed
in units of labor income and common to all migrants and c(si) representing non-monetary costs
that may depend on some (or all) of the individual skills si. In particular, it is plausible to assume
that ∂c/∂si ≤ 0 for all i′s, so that higher endowment of cognitive, social or adaptability skills may
reduce the non-monetary (psychological) costs of migration or have no effects on them.
Given this very simple set-up the decision of migrating of an income maximizing agent is driven
by the comparison of the wage income at home (H) with the wage income at the most desirable
destination (F ) net of migration costs. Hence individual i migrates from H to F if:
wFi − wH
i − CM − c(si) > 0 (3)
Substituting (1) and (2) into (3) and solving for the variable εi one obtains that individual i
migrates if her unobservable skills εi satisfy the following condition:
εi > εT (si) =CM + c(si) − (µF − µH) − (βF − βH) ∗ si
(βFε − βHε ). (4)
The above expression implies that, given the assumptions on the parameters and on the function
c(.), the threshold εT for the non-observable skill so that individual i will migrate is decreasing in
each component of the vector si so that ∂εT /∂sMi ≤ 0 for each characteristic sMi. An individual
with higher ability of any kind will (possibly) gain more from migration and (possibly) have lower
costs of migrating. Hence, the unobserved productive component will have a lower threshold above
which the individual migrates.
Consider now individuals organized into groups that have a certain vector of observable charac-
teristics sG. Within each group there are individuals with different unobservable characteristics εi
and this characteristics are normally distributed across them with average 0 and standard deviation
1 and independently of the other characteristics. Then the probability that an individual in group
G (i.e. with observable characteristics sG) migrates is:
probMIGi (sG) = Pr(εi > εT (sG)) = 1 − Φ(εT (sG)), (5)
where Φ(.) is the cumulative density function of a standard normal distribution, whose first
derivative is strictly positive. Expression (5) implies that the probability of migrating probMIGi for
4Dustmann, Fadlon, and Weiss (2011) consider a model in which different location have different rates of returnsfor two separate skill. They consider all possible cases including one in which a location grants higher returns in oneand lower returns in the other skill. In that case, the predictions on selection on unobservables are less clear.
7
individual i in groupG is larger the larger any of the observable skill components sG is. Interestingly,
this simple model implies that looking at the probability of migrating of individuals as a function
of their (cognitive, social, adaptive) abilities that may have a productivity effect or a migration
cost reducing effect, one obtains a similar positive relation with migration probability.
Let us emphasize that there are two channels through which higher skills affect the probability
of migrating and they both imply a non-negative effect under the assumptions of the model. One
is through the term −(βF − βH) ∗ si in expression (4) that implies a higher return to migration for
individuals with higher value of any of the skill components si that have a positive productivity
effect. This term also reduced the unobserved skill threshold increasing the probability of migrating.
The other effect works through the term c(si) in expression (4) that implies a lower cost of migration
associated to higher skills, a reduction of the migration threshold, and an increase in migration
probability. Presumably, the impact of some skills, (possibly cognitive skills) on productivity is
larger than their impact on costs while the impact of other skills, (possibly adaptability skills) are
larger on moving costs than on productivity. Looking only at the direction of the impact on the
probability of migration, however, one would not be able to separate those channels.
However, we can analyze the prediction of the model on the relationship between different
skills si and the average migration premium for people who migrate to gain further insight. The
migration premium is the difference in wage when migrating relative to staying, for individual i in
group G, conditional on migrating. For individual i in group G that premium can be expressed as:
wFG − wH
G = (µF − µH) + (βF − βH) ∗ sG + (βFε − βHε )
∞∫εT (sG)
xdx. (6)
This expression allows us to characterize the impact that an increase in a specific skill sm for the
group will have on the expected return to migration for people who migrate. First, let’s consider a
skill sm whose impact on productivity is zero, βFm = βHm = 0, but has an impact through reducing
costs of migration ∂c/∂sm < 0. In this case, an increase in that skill will imply larger probability of
migrating in (5), as ∂εT /∂smi < 0. Moreover the only effect on the migration premium is through
the factor εT (sG) in the last term of (6). As that average of the normally distributed variable x,
conditional on x > εT (sG), is an increasing function of εT (sG), an increase in the skill sm will
reduce this term. Hence, if skill sm only affects the cost of migrating, by decreasing it, and not the
returns to migration the effect of an increase in such a skill on the expected return for people who
migrate is negative.
Consider another skill sm′ that only affects productivity and hence return to migration, so that,
βFm′ −βHm′ > 0 and ∂c/∂sm′ = 0. In this case the first effect of an increase in sm′ will be an increase
in the term (βF −βH)∗sG in expression (6). This term increases the expected returns to migration.
However the same increase will also have an effect on reducing εT (si) and hence the last term of
expression (6) would decrease. However, for a large enough value of (βF − βH), namely if the
8
effect on returns to migration is large enough, the first term will prevail and an increase in the
productivity-enhancing skill sm′ will have a positive impact on the average premium of migrants.
On the other hand, this skill will also have a positive impact on probability of migrating sm′ .
Finally, we consider the impact of a skill that affects both, productivity and migration costs.
The effect on expected returns to migration will depend on the relative strength of the two effects
on productivity and on costs. A larger impact of such skill on the cost of migrating will reduce
the expected return to migration. A larger impact on productivity will imply a positive effect on
expected returns. At the same time the increase in that type of skills will drive higher probability
of migration, through both channels.
Hence we can summarize the implications of the model above into these two points:
• Considering two groups G and G′ of workers with different levels of skill m so that sGm < sG′
m .
If this skill mainly affects productivity (positively) we should observe higher migration prob-
ability of group G′, probMIGi (sG′) > probMIG
i (sG), and higher expected return to migration
for group G′, wFG′ − wH
G′ > wFG − wH
G .
• Considering two groups G and G′ of workers with different levels of skill n so that sGn < sG′
n . If
this skill mainly affects migration costs (negatively) then we should observe higher migration
probability of group G′, probMIGi (sG′) > probMIG
i (sG), and equal or smaller expected return
to migration for group G′, wFG′ − wH
G′ ≤ wFG − wH
G .
Our empirical analysis will put to the test these two propositions for different types of skills
and we will infer from migration probabilities and from premium of migrants the role of different
individuals skills such as cognitive ability, sociability and adaptability on productivity and on
migration costs.
4 Data and Descriptive Statistics
The data we use are compiled from various sources. Our primary data source is the Norwegian
Registry Data (from Statistics Norway), a linked administrative dataset that covers the whole
population resident in Norway up to 2010. These data combine different administrative registers
including the central population register, the family register, the education register, and the tax and
earnings register.5 The data follow individuals over time in a longitudinal design and they provide
information about place of birth, place of residence, educational attainment, labor market status,
earnings, and a set of demographic variables as well as information on family background. This
information is collected for each individual every year. To have information on individual cognitive
and noncognitive skills we linked the registry data with detailed military enlistment data for two
5See Møen, Salvanes, and Sørensen (2003) for a detailed description of the data.
9
full cohorts of men born in 1932 and 1933 for whom these data are available. These two cohorts
of men include all male individuals born in Norway between 1932 and 1933 who were subject to
mandatory military enlistment in 1951 and 1953. They constitute our sample. We describe the
variables and summary statistics for our sample and some of the average characteristics in the
following sections.
4.1 Registry Data: Migration and Demographics
The central population register contains the municipality of birth and the municipality of residence
of each individual from 1960 onwards. In addition, the central population register includes an
indicator identifying individuals who emigrated permanently to a foreign country after 1960 (which
are a very small fraction of the cohorts under consideration). Moreover, the enlistment data also
includes the place of residence at enlistment, which represents the location where an individual
lived at age 18. Hence, from year 1960 (when individuals in the sample were 27 or 28 years old)
we know their residence and in particular, whether they moved from the municipality of residence
at age 18. Educational attainment is taken from the educational database provided by Statistics
Norway and from the enlistment records.6 The earnings measure is not top-coded and includes
labor earnings expressed in constant 2014 Norwegian Kroner (hence adjusted for inflation), taxable
sick benefits, unemployment benefits, parental leave payments, and pensions.
Table 1 contains the summary statistics for various migration outcomes used as dependent
variables in our analysis and summary statistics for demographics characteristics and skills for
male Norwegian individuals born in 1932-33. Looking at the years of schooling completed at age
18 and overall we clearly see that the majority of individuals had already completed their schooling
at enlistment: at enlistment, the average years of schooling were 8.4, the average completed years
of education are 9.5 for the same sample of individuals. This reflects the fact that in the two
considered cohorts only few individual had a college education. The average earnings in 1980 are
NOK 325,442 (in 2014 values); in 1967, the first year when income data is available, the average
earnings are NOK 239,388 (in 2014 values) reflecting the real growth in earnings for this group over
time.
We use several different indicators of mobility: the first captures mobility by age 27-28 and
it is a dummy equal to one if an individual resides in a different local labor market in 1960 than
when he was 18 (at enlistment). Labor market regions are an aggregation of municipalities (the
smallest political entity in Norway) based on commuting patterns between municipalities, subject
to the constraint that regions should be sufficiently large for empirical analysis (see Bhuller, 2009).7
6Since 1974, educational attainment is reported annually by the educational institutions directly to StatisticsNorway, thereby minimizing any measurement error. For individuals who completed their education before 1974(most of our sample), we use self-reported information from the 1970 Census that is considered to be very accurate(see, e.g., Black, Devereux, and Salvanes, 2005).
7We focus on migration across local labor markets rather than counties (Norwegian: fylke). Some large cities in
10
There are a total of 46 local labor market regions (see Figure A1).8 These local labor market regions
have no administrative or political purposes. We use an alternative mobility indicator, equal to a
dummy for living in a different local labor market as of year 1980, which captures overall mobility
by age 47-48. The average of these two variables (0.39 and 0.45 respectively) implies that 39%
of the Norwegian male population born in 1932-33 moved out of the local labor market where
they grew up (and resided at age 18) by age 28 and 45% of them had moved by age 48. These
statistics confirm that the large part of mobility takes place when individuals are young, and that
in this period Norwegian male individuals were quite mobile. Interestingly, 31% of individuals move
permanently. That is, they move out of the local labor market where they resided at age 18 and
never move back as of 2010 (or the year of death). The data also show that among those who
move out of their labor market region of origin, 74% moved only once as of 1980. Only 5% of the
movers moved three times or more. The average distance individuals move between age 18 and year
1980 is 470 kilometers which is a comparable to the distance between Paris and London or between
Milan and Munich. The median distance is with 225 kilometers, which is substantially less and
emphasizes that most of the moves are more local. In order to capture specifically mobility between
farther locations, we also consider as additional indicator, which is equal to one for having moved
to a different ‘macro-region’ (Norwegian: landsdeler) as of 1980. Norway is commonly divided
into five geographical ‘macro-region’ (see Figure A2). These regions have a mere geographical
characterization and no administrative purposes. As shown in Table 1, 19% of the Norwegian male
population born in 1932-33 moved out of the macro-region where they resided at age 18 years of age
by 1980. Hence, even if substantially lower than the shorter distance mobility, this longer distance
mobility involved a significant group of individuals.
Finally, in terms of migration outcomes we consider the dummy variable that captures rural-
urban migration. Statistics Norway divides municipalities in four different levels (on a scale from
0-3) in terms of centrality (see, e.g., SSB, 1994). We define municipalities as urban areas if they
have the highest level of centrality, while lower values are considered as ‘rural’. The highest level of
centrality includes urban settlements with a population of at least 50,000 as well as municipalities,
which are located within 75 minutes travelling time from the centre of an urban settlement with a
population of at least 50,000. By age 27-28, about 19 percent of individuals had moved from a rural
to an urban location and by age 47-8 about 23 percent had moved from a rural to an urban location.
Even more than overall mobility, rural-urban mobility takes place early in the working age of an
individual. These features are consistent with male migration in the age range between 18 and 48
being mainly job driven: it is easier to change job when one is young, urban environment provides
a larger opportunity for jobs, usually people move once or at most twice for a job opportunity.
Norway are situated right at county boarders and therefore across county migration might occur without substantialconsequences to the working and social life. Boundaries of local labor markets, however, represent a larger changesin earnings, factor productivity, and firm innovation than county boarders.
8The archipelagos in the Arctic Ocean, Svalbard and Jan Mayen, are ruled directly on national level and are notincluded in the labor market regions.
11
4.2 Military Enlistment Data
Military enlistment and military service was mandatory for men and not for women in 1951 and
1953. Hence, our enlistment data include every single male individual who was 18 year old in 1951
and 1953. Before these young men could join the military service, their medical and psychological,
suitability was assessed. In the 1950s, military enlistment centers called in about 20 men per day
to be examined in these enlistment sessions. Each conscript was interviewed individually by an
officer as well as a psychologist and examined by a doctor. Besides the interviews and medical
tests, the enlistment procedure also included tests for physical fitness and cognitive ability, and
a questionnaire aimed to reveal noncognitive skills and personality trains. Avoidance of military
service was not possible by obtaining a low score on cognitive or noncognitive abilities. Only serious
health issues such as tuberculosis infections or physical disabilities such as severe hearing problems
were reasons for being exempted from military service. Among those who received sufficient health
ratings, almost all served in the military. The test scores defined the type of service that conscripts
were selected for, ranging from the King’s Guard to support troops.
While medical tests were performed since the enlistment was instituted, tests of conscripts’
cognitive and noncognitive ability were introduced in 1950 and 1951 respectively. The tests have
changed substantially from their introduction until today. For each cohort of men, the tests are
however the same. As we focus on two subsequent cohorts only, the major test components are
highly comparable. The tests introduced in the 1950s for military sessions in Norway were developed
by Erik Adrian Lundgren at the department for psychology at the military (Thrane, 1977). The
tests lasted in total about 2 hours and 30 minutes including instructions and breaks and including
answering the questionnaire on the personal situation.
4.2.1 Cognitive and Noncognitive Skills
The tests administered to determine cognitive skills consisted of four different components. The
first two were aimed to assess general cognitive ability by testing logical-mathematical skills and
spatial visualization skills. The third part consisted of a mechanical comprehension test and was
aimed at assessing the knowledge of mechanics, that were important for military practices.9 The
last component was a test measuring processing speed (Thrane, 1977). As the first two tests are
those measuring more closely math and analytical skills as opposed to test learned knowledge,
we use them to measure cognitive ability in an index that mirrors IQ measures. The test for
logical-mathematical skills measured a conscript’s logic and abstract reasoning and the capacity
to understand the underlying principles of some kind of causal system. This type of verbally
formulated math problems have a long tradition in IQ tests for adults and were, for example,
9The mechanical comprehension test measured the conscripts’ technical and in particular mechanical knowledge.The test was based on the mechanical comprehension test introduced by G. K. Bennett to U.S. military sessionsduring World War II (see Anastasi, 1968, page 362). This test was included as for many military jobs for whichmechanical knowledge was important.
12
included in the Army Alpha test in order to evaluate U.S. military recruits during World War I.
The test for spatial visualization ability is based on the J. C. Ravens’ ‘Progressive Matrices’, which
was used to classify military recruits in Britain during World War II. The test includes problems
measuring abstract and inductive reasoning ability (see, e.g., Anastasi, 1968; Cronbach, 1964) and
was developed in a way that prior education or knowledge should affect the results as little as
possible. Only some verbal skills to understand the tasks are necessary.
Our data include the scores of these two subtest, which ranges from zero to 26 for the logical-
mathematical skills test and from zero to 24 for the spatial visualization ability test. We add the
two scores to construct the index for cognitive ability. The total score is then percentile rank-
transformed and converted by taking the inverse of the standard normal distribution (see also
Lindqvist and Vestman, 2011).
In 1951, a four-page questionnaire was introduced, which was aimed to reveal noncognitive
skills and personality traits of the conscript. The questionnaire is based on the test developed by
R. S. Woodworth for the U.S. military during World War I. The test was essentially an attempt to
standardize a psychiatric interview and to adapt the procedure for mass testing. The Norwegian
test included questions that elicit information to identify groups that may have problems adapting
to new situations (see Lundgren and Olsen, 1952). Adaptability to new situations was mostly
measures with so-called situational judgment tests, which were developed by the United States
Army in the 1920s (see McDaniel, Morgeson, Finnegan, Campion, and Braverman, 2001). These
tests present individuals with hypothetical but realistic scenarios and ask them to identify the
most appropriate response. Moreover, the questionnaire included questions on behavior deviations,
nightmare and other sleep disturbances, excessive fatigue and other psychosomatic symptoms,
feelings of unreality, and motor disturbance such as tics and tremors (see Anastasi, 1968, page 438).
The questionnaire also included questions on the living situation, education, job and satisfaction
and on father’s profession. The questionnaire is a standardized form of self-reported condition and
might be important for mental health, physical health and social adaptability. There is no time
limit to answer these questions and the conscripts are asked to answer as honestly as possible. For
each question, one answer category was classified as showing potentially neurotic behavior. The
psychologist analyzed conscripts with many answers hinting to some degree of neurotic disorder. In
a study using the 1951 session data, Riis (1955) shows that the answers to 20 of these questions were
a strong predictor for completing the fighter pilot education, or dropping out from it. Hence, some
of these questions may reveal important noncognitive skills and personality traits with consequences
on the future career.
As mentioned above, the conscripts are also individually interviewed by a psychologist. As a
basis of the interview, the psychologist has information about the health, physical fitness as well as
cognitive ability of a conscript and the answers to the questionnaire described above. The interview
was semi-structured. The goal of the interview was to analyze whether a conscript’s ability met
13

the psychological needs for military service. The psychologists assign each conscript’s sociability
on a scale from zero to ten. The variable follows a Stantine scale that approximates a normal
distribution. Characteristics such as willingness to take on responsibility, an outgoing personality,
independence, persistence, and emotional stability would increase the score. Motivation for military
service did not affect the score (see, e.g., Cronbach, 1964). The ability to interact with others, to
cooperate and to communicate effectively is a skill of potentially broad value. Psychologists found
that high sociability is linked to professional success. In the context of military service, sociability
was valued to increase a leader’s ability to interact with his subordinates (see, e.g., Goleman, 2011).
In addition, the psychologist assess a conscript’s ability to adjust to a new environment. Generally,
an individual is classified to be adaptable if she can modify her behavior to meet the demands
of a new situation (Pulakos, Arad, Donovan, and Plamondon, 2000). Hence, if the situation or
environment change, an individual must deal with the change in an effective manner. For the
military, adaptability was relevant to assess a conscript’s own ability to complete tasks and his
interest in learning new tasks.10 As sociability, adaptability may have a broad value as skill.
Adaptability is important in a working environment where technological change, innovation and,
in general, changes are paramount. An individual’s adaptability is valuable to firms (Griffin and
Hesketh, 2003) and may be an asset when people are exposes to new environments. Adaptability
is reported on a scale from zero to ten. We use these two measures of noncognitive ability based
on the psychologists’ interviews and normalize both 0 to 10 scores to distributions with mean zero
and unit variance.
Table 2 contains correlation coefficients for cognitive ability, sociability, adaptability all stan-
dardized to be have 0 average and standard deviation equal to 1, and the years of education at
age 18. These raw correlations are interesting as they show three important facts. First, the two
indices of noncognitive abilities have relatively low correlation (0.2 or lower) with cognitive skills at
the individual level.11 This is the first hint that they capture a genuinely different type of skills rel-
ative to cognitive ones, and cognitive and noncognitive skills are only mildly positively correlated.
Second, the index of adaptability has very low correlation with sociability. This skill, that we call
adaptability measures a trait that is not captured by the other indices and it is worth analyzing
by itself in terms of its impact on the probability of moving. While such a skill is not available in
most data, it seems that being able to deal with new situations, to adjust to new environments and
to cope with changing tasks can be particularly useful when moving to a new region. The third
interesting fact is that the correlation between cognitive skills and schooling is the highest. This
10In recent studies, self-efficacy, openness to new experiences, and interest in learning new tasks have been foundto be good predictors of adaptive performance (Griffin and Hesketh, 2003; Pulakos, Schmitt, Dorsey, Arad, Borman,and Hedge, 2002).
11The correlation of the cognitive and noncognitive measures is smaller compared to the correlation found byLindqvist and Vestman (2011), who focus on more recent cohorts of Swedish men born in 1965 or later. In a 2006working paper version, Heckman, Stixrud, and Urzua (2006) report correlation coefficients for a set of differentcognitive and noncognitive measures for men between 0.07 and 0.21.
14
reveals that education is mainly an indicator (or a result) of cognitive skills, but it does not proxy
noncognitive skills as well.
As final summary statistics, we report in Table 3 the average value for the cognitive, sociability
and adaptability indices separately for movers across counties and non-movers (as of year 1960).
For each of the three skills we see a significant positive difference in average values for movers
relative to non-movers (p-values for the difference are significant at 1% level). Once we standardize
the difference by the standard deviation of the skill variable, we see that average cognitive ability is
0.28 standard deviations higher for movers than non-movers, sociability is 0.08 standard deviations
higher for movers, and adaptability 0.07 standard deviations higher for movers. In general, it seems
that there is positive selection of migrants according to each of these skills and this is compatible
with our model of positive selection on all skills and it is compatible with the assumption that
those skills increase the returns to migration or decrease the cost of it.
4.2.2 Parental Background
Migration propensity might be affected by socioeconomic background. The military enlistment
data contains information on the conscripts’ parents. As proxy variables for parental background,
we use a dummy indicating whether both of the conscript’s parents were present in the household
where the conscript grew up and we also include the father’s work status and profession. We divide
professions into high, medium and low socioeconomic status. As high status profession, we classify
engineering and academic professions, and highly ranked jobs in the public administration. Skilled
labor professions as mechanics or carpenters are classified as medium status professions. Low status
professions include mostly professions related to agriculture, fishing, forestry, mining, and factory
work. About 12.4 percent of fathers have high status professions, 41.2 percent have a medium
status profession and about 96.3 percent of fathers were present in the household. We include these
parental backgrounds variable as controls in our regressions.
5 Empirical Strategy and Identification
Following the empirical predictions of the model in Section 3, we estimate the following basic
specification:
Mi,t = βCCi,t0 + βSSSi,t0 + βAAi,t0 + γXi,t0 + εi, (7)
whereas the variable Mi,t represents a migration outcome at time t (that could be year 1960 or
1980) for individual i who was 18 years of age at time t0. The migration outcome can either be a
dummy for living in a different local labor market than at t0, for living in a different ‘macro-region’
at t0, or for having moved from a rural to an urban location between t0 and t. The three linear terms
reported above, βCCi,t0, βSSSi,t0, βAAi,t0 capture the effect of cognitive skills, Ci,t0, sociability, Si,t0,
and adaptability, Ai,t0, as measured by the military recruitment test and standardized to have
15
mean 0 and standard deviation equal to 1. Cognitive and noncognitive skills, as well as the control
variables are measured at time t0, which represents the year of enlistment when the individual was
18 years old. In the basic specification, we consider cognitive and noncognitive skills affecting the
probability of migration via a linear term βCCi,t0 + βSSSi,t0 + βAAi,t0 consistently with the simple
structure of the theoretical model. We will also consider nonlinear forms and specifications with
interactions in robustness checks. Xi,t0 is a vector of controls for the individual i at time t0, which
includes region of residence at age 18, occupation of the father, indicator for death of the father, the
mother or both parents, parent’s civil status, height in centimeters at age 18, as a health indicator,
and year of birth. Hence, all control variables are predetermined at the time of military enlistment.
εi is a mean zero non observable idiosyncratic characteristic of individual i. The predictions of our
model on the signs of the coefficients are as follows: if skills have a positive effect on the productivity
of the individual, or a negative effect on the non-monetary costs of migrating, then the estimates of
βC, βS and βA will be positive. A zero estimate will reveal no impact of that skill on productivity
or on migration costs. We will also estimate a specification identical to (7) but with the variable
Pi,t,to = lnwi,t − lnwi,t0 as a dependent variable. This variable captures the logarithmic change in
wage, only for individuals who have migrated. This is a proxy for the ‘migration premium’, namely
for the difference in wage that an individual would get by migration relative to what he gets in
the place of origin. Here, the model predicts that the coefficient will be positive if the effect of a
specific ability mainly works through affecting productivity. If, however, a specific ability mainly
affect costs, the coefficient will be negative or zero as there will only be an effect through selection
of migrants over unobserved skills.
The estimated coefficients βC , βS , and βA in (7) should capture the impact on migration proba-
bility of increasing a specific skill keeping the other fixed. A concern affecting their interpretation is
that measurements of cognitive ability and adaptability or sociability could be positively correlated
(see Table 2). In our sample, the correlation between cognitive ability and sociability is 0.21 and
the correlation of cognitive ability and adaptability is 0.12. One one hand, it can happen that the
military psychologists knows the cognitive test scores of the conscript before assessing him, and
this would affect the psychological evaluation of noncognitive skills. So the positive correlation
only derives from measurement error and this could bring to measurement error bias and under-
estimate of the effect of noncognitive skills. On the other hand, higher noncognitive ability can
determine better performance in cognitive tests and hence by controlling for cognitive performance
one underestimates the effect of noncognitive ability. Borghans, Meijers, and ter Weel (2008), for
example, show that individual behavior at cognitive tests depends on noncognitive skills. To put
some bounds on these potential bias we estimate specifications that include either skill, cognitive
ability, sociability, or adaptability in turn and specifications in which we include them together to
provide bounds on the potential bias. Given their relative low correlation, it is unlikely that they
affect each other much what would imply similar estimates when included together or one skill at
16

a time.
6 Empirical Results
6.1 Effect of Cognitive and Noncognitive Ability on Migration
In this section, we show and discuss the basic association of cognitive and noncognitive ability
on different measures of migration. We consider six different outcomes: two dummy variables
indicating whether an individual changed local labor market between age 18 and 28 or between age
18 and 48, a dummy variable indicating whether an individual moved permanently after age 18,
the number of moves across local labor markets from age 18, a dummy variable indicating whether
an individual moved to a different macro-region after age 18, and a dummy variable indicating
whether an individual migrated from a rural to an urban area after age 18.
The results for Regression 7 are presented in Table 4. Columns 1 and 2 show the effect on the
probability of moving across local labor markets (as of 1960 or as of 1980). The estimated coefficients
show that cognitive ability is positively and significantly associated with migration across local
labor markets. In particular, an increase in cognitive ability by one standard deviation predicts
an increase in the probability to move across local labor markets before 1960 by 5 percentage
points. This is an increase of about 15 percent relative to the unconditional migration probability
of 39 percent between age 18 and 1960. Similarly, an increase in cognitive ability by one standard
deviation predicts an increase in the probability to move across counties before year 1980 by 6
percentage points or 13 percent relative to the unconditional migration probability over this time
range (that equals 47 percent). Sociability has, overall, no significant impact on mobility across
local labor markets. There is, however, more robust and statistically significant evidence that
individuals with high adaptability are also more likely to move. One standard deviation change in
adaptability increases the probability that an individual migrates between local labor markets before
1960 by 3.8 percentage point and the probability that an individual migrates between local labor
markets before 1980 by 4.2 percentage points. Relative to the unconditional migration probability
of 39 percent (Column 1) and 47 percent (Column 2), this indicates a 10 percent and a 9 percent
increase, respectively. When entered linearly, adaptability skills have an impact on the probability
of migration between two-thirds and three-quarter of the impact of cognitive skills.
In Column 3, we find similar results when investigating the probability of migrating permanently
to a different labor market region. An increase in cognitive skills by one standard deviation predicts
an increase in the probability to move out of the local labor market permanently, before 1980, by 5
percentage points. An increase in adaptability by one standard deviation increases that probability
of migrating by 3.5 percentage points. Similarly, in Column 4, we find that the number of moves
across labor market regions increases by about 0.06 when cognitive ability is increased by one
standard deviation and by 0.02 when adaptability is increased by one standard deviation. Column
17
5 focuses on moving to a different macro-region within Norway, which represents a more substantial
move. We find that this increases by about 4.4 percentage points when cognitive ability is increased
by one standard deviation and by 2.8 percentage point when adaptability is increased by one
standard deviation. Clearly, cognitive ability is the most important determinant of migration. As
it is highly correlated to academic and schooling skills, these results confirm previous findings on
positive selection of migrants in the literature. However, the new and equally interesting result is
that adaptability is highly significant and relatively important in determining the probability of
migrating. Sociability has a neglectible effect.
Columns 6 and 7 in Table 4 presents the results for Regression 7 with indicators for migration
from rural into urban areas. The sample here is different and only includes individuals, which were
growing up in rural areas. This group of individuals is certainly one for which economic success
is strongly correlated with their ability to move to a more productive urban environment. Hence,
mobility to a city may be a particularly important determinant of their working success. We find
that adaptability has a significant and positive effect on migration into an urban area: an increase
in adaptability by one standard deviation predicts an increase in the probability to move into an
urban area before 1980 by about 4.6 percentage points. This is an increase of about 18 percent
relative to the unconditional migration probability. The same change in cognitive ability predicts
an increase in the probability to move into an urban area before 1980 by 5.8 percentage points or
21 percent relative to the unconditional migration probability. Sociability is not a precise or robust
predictor of rural-urban migration propensity.
Overall, the linear regressions including cognitive and noncognitive skills confirm the findings
from the previous literature that there is a positive selection of immigrants in terms of cognitive
skills (see, e.g., Malamud and Wozniak, 2012). The new finding is that adaptability measured
at enlistment is also highly significant in determining the probability to migrate: one standard
deviation increase in adaptability results in a 4 percent higher probability of migrating across local
labor markets whereas the migration probability increases 5 to 6 percent for the same increase in
cognitive skills.
Are smarter people receiving a higher adaptability score, so that part of the cognitive effect
goes through higher adaptability and controlling for it underestimate the total effect of cognitive
skills? Or are people that are more adaptable also smarter so that we are underestimating the
total effect of adaptability? Or are these two skills not related to each other so that the partial
effect estimated in Table 4 is the total effect? Cognitive ability and adaptability are positively but
weakly correlated (0.123). The correlation between sociability and adaptability is even smaller and
negative (-0.056). These covariances may affect our interpretation of the results discussed above.
That is, if the adaptability test captures cognitive ability, controlling for adaptability will bias the
estimated effect of cognitive skills, and vice versa. We therefore estimate Regression 7 separately for
each measure. Table 5 present the estimated effects when cognitive, sociability, and adaptability
18
are each included separately in the regression. The estimated coefficients do not change much
for cognitive ability and for adaptability. The association between sociability and the migration
propensity is somewhat higher and significant if cognitive ability and adaptability are not included,
implying that in this case some of the impact of those variables may be captured by sociability.
The overall estimates are, however, unchanged and cognitive skills and adaptability turn out to
have larger and more significant effects on propensity to migrate.
The basic set of control variables included in Tables 4 and 5 does not include the schooling level
at time of enlistment. Schooling may have an important role in the formation and measurement of
skills (see, e.g., Lindqvist and Vestman, 2011). The mandatory years of schooling for the cohorts
born in 1931 and 1932 were seven. Hence, conscripts completed mandatory schooling about three
years before the enlistment date. Conscripts who are still in school at enlistment have received
substantially more schooling than conscripts with only mandatory schooling have. Conscripts with
only mandatory schooling, have a 1.1 standard deviation lower cognitive ability score than conscripts
with more than mandatory schooling. Men with more than mandatory education, score also higher
in terms of noncognitive ability. With a difference of 0.04 standard deviations for sociability and
0.42 standard deviations for adaptability, the gap between men with mandatory schooling and
men with more than mandatory schooling is however small. The significant correlation between
cognitive test scores and years of schooling can proceed from two factors. First high ability men
sort into higher education but years of schooling do not affect the cognitive ability of people. In this
case controlling for schooling will bias the total effect of cognitive ability on migration downward.
Second, schooling might increase cognitive skills and different schooling level may be correlated
to skills so not controlling for schooling may generate an upper bias of the effects of cognitive
skills. In short, if the differences in cognitive test scores are mostly driven by sorting, controlling
for education at time of enlistment could bias downward the partial effect of cognitive ability on
migration. If schooling increases the cognitive skills, not controlling for the education level at age
18 may bias upwards the coefficient of interest. We therefore estimate Equation 7 where we either
include a dummy variable for whether or not an individual has some education above mandatory
schooling at enlistment12 or the number of years of schooling at enlistment. Table 6 presents the
results. Controlling for a dummy variable for whether or not an individual has some education
above mandatory schooling at enlistment does not alter the results much (see Columns 2 and
6). When controlling for the number of years of education at enlistment the association between
cognitive ability and migration is much weaker (see Columns 3 and 7). These findings reveal the
high correlation between cognitive skills and schooling. If we believe that schooling is mainly
‘sorting’ individuals across cognitive skills and those are the only relevant skills determining return
and costs of migration then we should think that the effect of pure cognitive skills on migration is
0.06 (Column 1). If instead we believe that schooling itself increases productivity or reduces costs
12This specification reflects the main specification used by Lindqvist and Vestman (2011).
19

of migration then we should think that the pure impact of cognitive skills on migration probability
is 0.035 (Column 3). Similarly for rural-urban migration the impact of cognitive skills can be
as high as 0.06 (Column 5) not controlling for schooling, or 0.018 controlling for it (Column 7).
More interestingly, however, we see that the relationship between adaptability and migration is not
altered when controlling for different measures of schooling. Adaptability does not seem related to
the level of schooling at age 18 (or later) and its impact on the propensity to migrate is around
0.02 to 0.04 for each increase by one standard deviation. This result also confer that migrant
individuals are positively selected on this type of skills that are clearly different from cognitive
skills or academic skills.
In Columns 1-3 and 5-8 of Table 5, all included controls are predetermined at the time of the
draft. However, selection into higher education (for a relatively small group in this period as only
5% of people in our sample achieved college graduation) might be an important mechanism that
increases migration probabilities and is affected by cognitive and noncognitive skills. In Columns
4 and 8 of Table 6, we include completed education as a control variable. If the only way in which
skills affect mobility were by determining total schooling such a variable would absorb most of
the skill impact. This is true for cognitive skills. When controlling for the completed years of
education, the effect of cognitive ability becomes small. However, this is not true for adaptability.
The association between adaptability and migration is equally strong as when not controlling for
education at all. Hence, selection into higher education and into a job market for high-qualified
workers might be a fundamental channel by which cognitive ability affect the migration decision
but it is not likely to be a mechanism through which adaptability affects the migration.
6.2 Non-Linear Effects of Skills
The effect of cognitive ability and adaptability on the probability of migration may not be linear.
As we have detected a significant and robust effects of those two skills on the probability of moving,
we focus on those only in the rest of the analysis. While the existing literature has found positive
selection of internal migrants, it has also pointed out that there could be a stronger effect for
very high level of schooling (or IQ).13 Hence, we consider nonlinear forms for function f(·) in
Regression 7. Table 7 shows the results when we include quadratic terms of cognitive ability and
adaptability. We find that the probability of migration across local labor markets and migration
into cities is strictly convex in both cognitive ability and adaptability. However, the explained
variance is only slightly higher in the regression models with the quadratic term.
We examine nonlinearity further as we are interested to know whether individuals with par-
ticularly high degrees of adaptability drive the results while at low levels such a variable does not
really produce significant differences. We estimate a specification in which we split the cognitive
13For example, Glaeser and Mare (2001) discuss the selectivity of migrants in the context of rural-urban migrationand Butikofer, Salvanes, and Steskal (2015) discuss the positive selection on education and cognitive ability intourban migration in Norway.
20
ability measure and the adaptability measure into quintiles and we estimate a separate coefficient
for each quintile, omitting the lowest one. These results are presented in Table 8 and focus on four
migration outcomes. The two first Columns consider migration across labor market regions (before
1960 in Column 1 or before 1980 in Column 2), the third and the fourth Column focus on migration
from rural to urban locations. Interestingly, we find strong evidence of a generalized convexity for
cognitive ability. The estimates are increasing more than linearly in magnitude with quintile; in
fact, they have a geometric type of effect, doubling from each quintile to the next. Considering
Column 1, the probability of migrating is larger for individuals in the second quintile of cognitive
ability, relative to the first, by only 1.1 percentage points, it increases by 3.5 points in the third,
7.3 points in the fourth and 14 points in the fifth. The pattern is very similar for the probability
to migrate across labor market regions before 1980. For urban to rural migration, the increase is
less pronounced for the second, third, and fourth quintile but more than twice as large for the fifth
quintile. Adaptability looks different. While there is some positive effect on migration from being
in the second to fourth quintile of the adaptability distribution these effects are similar to each
other. People in the fifth (top) percentile of adaptability, instead, exhibit a much larger proba-
bility to migrate, significantly different from people in any other quintile. Whereas there is only
a slightly larger probability to migrate for individuals with adaptability in the second, third and
fourth quintile of the distribution relative to the propensity of individuals in the bottom quintile,
individuals in the top quintile of the adaptability distribution are much more likely to relocate.
The effect in this group is almost as large as the effect of being in the top cognitive skill group and
it is very precisely estimated. Hence, it is clear that the adaptability measure is capturing a very
specific skill and that people with very high endowment of such a skill are much more inclined to
migrate to a different labor market region or to a city relative to others. These people can really
have the spirit of ‘pioneers’. While not necessarily the smartest people, they may genuinely have
abilities that make them better at dealing with new environment and also more attracted by new
opportunities.
6.3 Interactions between Skills
So far, we have considered cognitive skills and adaptability as independently (i.e. additively)
affecting migration probability. It is however plausible that these two skills may interact with each
other in more complex ways. In particular, it may be that individuals with high cognitive abilities
are more likely to migrate, no matter what is their level adaptability. They may have large gains to
migrating, they may know about good opportunities for their skills and hence this may push them
to move independently of individual adaptability. To the contrary, individuals with lower cognitive
ability may be much more dependent on their degree of adaptability in their decisions to migrate
or not. Adaptability may reduce their discomfort in moving, may imply that they are looking more
pro-actively. It is plausible that when people do not have extremely high cognitive abilities then
21
having the extra advantage of high adaptability may be a crucial factor in their decision to migrate.
In order to explore this hypothesis we have partitioned the cognitive and adaptability skill
continuum in three ‘groups’ defined as the bottom quintile, the (three) intermediate quintiles and
the top quintile. Then we estimate a regression in which we include dummies for all the possible
interactions between the three groups of each ability (hence nine separate effects). We report
the coefficients after we standardize the coefficient on the dummy for the interaction between the
two bottom skill quintiles to zero. The estimated effect for each dummy are presented in Table 9.
Figure 1 visualizes these results by showing the estimated coefficient for the three different cognitive
skill groups in the bottom, intermediate, or top quintile of adaptability, arrayed from left to right.
We connect the estimates for those individuals in the bottom cognitive ability quintile (dashed
line), in the intermediate cognitive ability quintiles (dotted line), and in the top cognitive ability
quintile (solid line). The left panel of Figure 1 shows the estimated effect on migration across local
labor markets and the right panel shows the impact on probability of rural-urban migration. Three
clear patterns emerge: first, both cognitive ability and adaptability increase migration propensity
as the reported coefficients increase from left to right and going from the dashed to the dotted and
to the solid line. Second, increases in adaptability are much more relevant for individuals with low
(dashed line) and intermediate (dotted line) cognitive ability and much less relevant for individuals
with high cognitive ability (solid line). For the first two groups, going from the bottom quintile of
the adaptability distribution to the top quintile increases the probability of migration across local
labor markets before 1980 by 20 percentage points. This is a sizable effect compared to the average
probability to migrate for 47 percent. To the contrary, for individuals with cognitive ability in
the top quintile, the level of adaptability does not seem to make any significant difference at all
in their probability of migrating. The third important fact emerging from the estimates is that
individuals with cognitive ability in the top quintile are highly likely to migrate, independently
of their adaptability. These results are very interesting as they emphasize that, while there is a
positive selection overall of migrants along cognitive skills and, in general, individuals with very
high cognitive skills have higher probability to migrate, there is an even stronger selection of
migrants with low to intermediate cognitive abilities on a skill, completely unobserved in previous
studies, which is adaptability. Our results show that people with low cognitive skills are very
likely to be selected among migrants only if they have high levels of adaptability. If they do have
high adaptability, they are almost as likely to migrate as individuals with high cognitive skills
are. Hence, an important consequence of this result is that whereas cognitive skills have very high
correlation with schooling, adaptability does not. This implies that selection on one (previously)
unobserved characteristic, namely the adaptability of individuals, for low skilled migrants is much
more important than for high skilled migrants. If this characteristic helps individuals to adjust, to
integrate and assimilate in the receiving economy and to succeed in any way, then low skilled (i.e.
low cognitive skill) migrants have a much better chance, than comparable non-migrant, to do well
22
and to succeed economically. Moreover, this result shows that individuals select themselves into
migration with the same criteria that the receiving economy would use, if they could observe such
skill, to maximize their probability of assimilation to the new circumstances and to a new working
situation. Furthermore, this results compares well to the findings of Lindqvist and Vestman (2011)
who show that noncognitive skills are a stronger predictor of labor force participation and wages
of unskilled workers.
6.4 Early Mobility and Skills
Our data measure individual skills at age 18. While they certainly reflect some innate abilities,
these measures are also affected by experience of the individual in his family as a child, and at
school as a student. While we control for some characteristics of the family and we discuss the
effects of including schooling as controls, we are also interested in analyzing whether moving as
child, presumably with one’s family, between birth and age 18, affects the cognitive and adaptability
skills of a person. It is also important to analyze whether it increases the propensity of an individual
to migrate later in life. Through a process of positive feedback, experiencing a move with the family
could make individuals more adaptable and it may affect the likelihood of mobility as an adult. On
the other hand, if mobility disrupts the learning process it may also affect cognitive ability. If higher
adaptability is associated to early moves in life, than this skill may be transmitted to children of
migrants via their early childhood experience. To address this question we perform two regressions.
First, we analyze whether cognitive ability, sociability, and adaptability are significantly associated
with a dummy variable equal to one if an individual moved across local labor markets between
birth and the date of enlistment. Then we analyze if the inclusion of such a dummy affects the
coefficient on sociability, adaptability or cognitive ability on the probability of migrating. The
results, displayed in Table 10, show a significant positive association between cognitive ability
and the probability of moving during childhood. Sociability and adaptability are not significantly
affected by moving during childhood. Noncognitive ability does not seem to be affected by the
experience of migrating as a child. The second regression analyzes whether, controlling for childhood
moves reduced the impact of adaptability on the probability of migrating as an adult. In Table 11,
we include a dummy for having moved as a child in Regression 7. We find that moving during
childhood is significantly correlated with all migration measures considered. The coefficients on
cognitive ability, sociability, and adaptability are however only altered to a minor degree by the
inclusion of the dummy variable for moving during childhood. Hence, adaptability is not a less
important determinant of migration when controlling for childhood mobility.
6.5 Birth Order
The place of a man in the household’s birth order may influence his expectation of inheriting farm-
land in Norway and therefore his probability of migrating to another local labor market or into
23
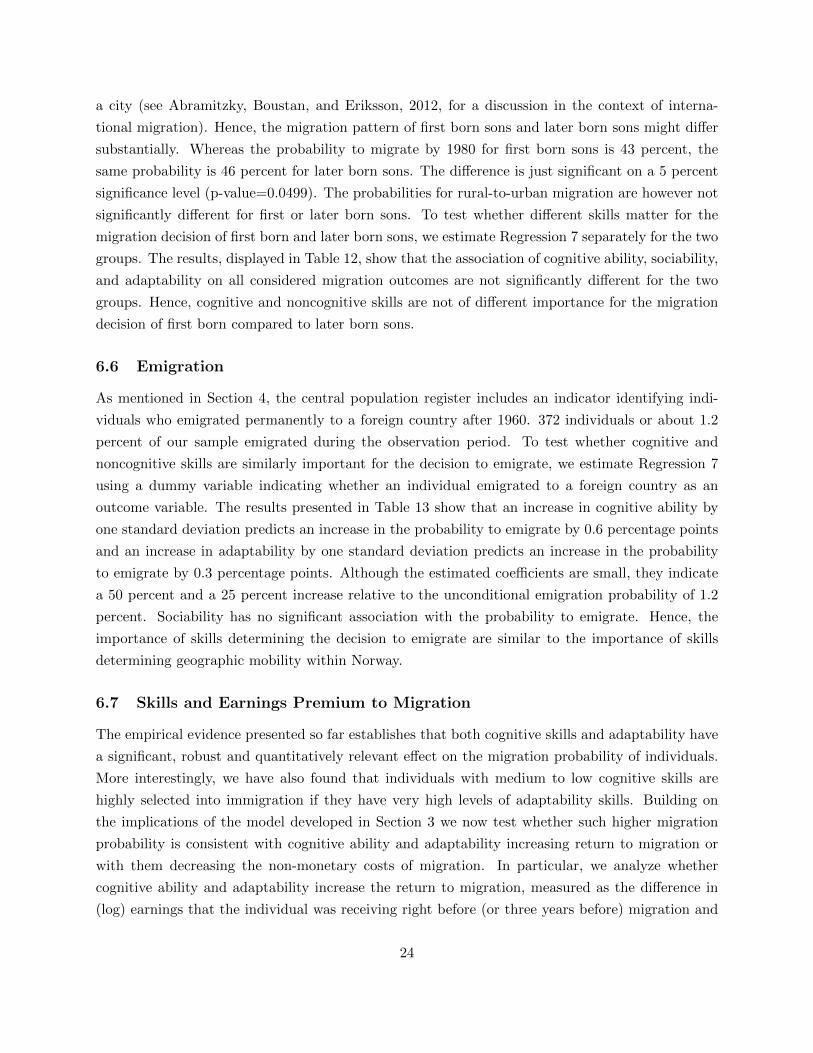
a city (see Abramitzky, Boustan, and Eriksson, 2012, for a discussion in the context of interna-
tional migration). Hence, the migration pattern of first born sons and later born sons might differ
substantially. Whereas the probability to migrate by 1980 for first born sons is 43 percent, the
same probability is 46 percent for later born sons. The difference is just significant on a 5 percent
significance level (p-value=0.0499). The probabilities for rural-to-urban migration are however not
significantly different for first or later born sons. To test whether different skills matter for the
migration decision of first born and later born sons, we estimate Regression 7 separately for the two
groups. The results, displayed in Table 12, show that the association of cognitive ability, sociability,
and adaptability on all considered migration outcomes are not significantly different for the two
groups. Hence, cognitive and noncognitive skills are not of different importance for the migration
decision of first born compared to later born sons.
6.6 Emigration
As mentioned in Section 4, the central population register includes an indicator identifying indi-
viduals who emigrated permanently to a foreign country after 1960. 372 individuals or about 1.2
percent of our sample emigrated during the observation period. To test whether cognitive and
noncognitive skills are similarly important for the decision to emigrate, we estimate Regression 7
using a dummy variable indicating whether an individual emigrated to a foreign country as an
outcome variable. The results presented in Table 13 show that an increase in cognitive ability by
one standard deviation predicts an increase in the probability to emigrate by 0.6 percentage points
and an increase in adaptability by one standard deviation predicts an increase in the probability
to emigrate by 0.3 percentage points. Although the estimated coefficients are small, they indicate
a 50 percent and a 25 percent increase relative to the unconditional emigration probability of 1.2
percent. Sociability has no significant association with the probability to emigrate. Hence, the
importance of skills determining the decision to emigrate are similar to the importance of skills
determining geographic mobility within Norway.
6.7 Skills and Earnings Premium to Migration
The empirical evidence presented so far establishes that both cognitive skills and adaptability have
a significant, robust and quantitatively relevant effect on the migration probability of individuals.
More interestingly, we have also found that individuals with medium to low cognitive skills are
highly selected into immigration if they have very high levels of adaptability skills. Building on
the implications of the model developed in Section 3 we now test whether such higher migration
probability is consistent with cognitive ability and adaptability increasing return to migration or
with them decreasing the non-monetary costs of migration. In particular, we analyze whether
cognitive ability and adaptability increase the return to migration, measured as the difference in
(log) earnings that the individual was receiving right before (or three years before) migration and
24
right after (or three years after) migration to a different local labor market or from a rural to a
urban location. The model in Section 3 predicts that if the skill under consideration mainly affects
productivity and hence returns to migration, one would find a positive correlation between such skill
and the earnings premium to migration. If the skill mainly affects non-monetary costs of migration,
one should find a negative or null correlation between the skill and the earnings premium from
migration, but still a positive effect on the migration probability. Table 14 presents the coefficients
from a specification similar to Regression 7 where the dependent variable is the pre-post migration
earnings difference for the individual.14 In Columns 1 and 2, we take the log difference between
year-before and the year-after migration (for migration across local labor markets or rural-urban
migration), while in Columns 3 and 4 we take the earnings differentials three years before and three
years after migration. Differences are taken in logs and we consider the three year distance as a way
of avoiding the effects of pre-migration recessions or an individual shock that could push people
to moving and, at the same time, affecting negatively the pre-migration earnings.15 The results
are very clear: cognitive ability affects significantly and positively the pre-post migration earnings
premium, conditional on individuals moving and having positive earnings prior to moving. This
implies that individuals with higher cognitive skills have higher returns to moving to a new local
labor market. The difference is between 0.2 and 0.4 logarithmic points (between 22 and 41 percent)
and highly significant. This is consistent with cognitive ability mainly affecting productivity and
through the channel of the earnings returns to migration. On the other hand, the measure of
adaptability does not affect the pre-post migration earnings difference. People that are more
adaptable are more likely to migrate but conditional on migrating and having positive earnings
prior to moving, higher adaptability does not provide higher earnings premium. This is consistent
with adaptability mainly affecting the non-monetary cost of migration instead. The effects is zero
rather than negative confirming that there is not strong negative selection of migrants on non-
observable productive characteristics (associated with higher adaptability), but adaptability per se
does not affect the pre-post earnings premium: This reveals that it must affect migration through
non-monetary costs.
Further analysis on the impact of adaptability on the post-migration assimilation and success
on the labor market is an interesting extension on which we are working.
7 Conclusion
In this paper, we combine measures of cognitive and noncognitive abilities of individuals, tested
at 18 years of age, and data on their subsequent working life. For the first time, characteristics
14Note that when estimating Regression 7 with log earnings as an outcome variable, all three skills, cognitive ability,sociability, and adaptability are significantly and positively correlate with earnings.
15If individuals migrate after having experienced some idiosyncratic shock, we would expect a pre-move wage dipsimilar to the Ashenfeter’s dip, which describes that mean earnings of participants in training programs generallydecline just prior to participation (Ashenfelter, 1978).
25
that have been considered as unobservable, but are potentially important in production and career
choices, such as sociability and adaptability can be observed and measured together with many
years of working experience. For our sample, the Norwegian male population born in 1932 and
1933 we have analyzed how cognitive and noncognitive skills affect their migration behavior. This
allows us to infer how migrants are selected on cognitive and (so far unobserved) noncognitive skills.
Our results confirm that cognitive skills, which are highly correlated with schooling, have a strong
positive effect on the probability of migrating, which was a known fact in the literature on internal
and international migration: migrants are positively selected on schooling and cognitive skills. We
are the first, however, to find a second important result, namely that people with high ‘adaptability’
skills, measured using tests assessing their ability to cope with the new environment and situations,
have also a much higher probability to migrate. In particular among low educated, low cognitive
ability people, those with high values of the adaptability skill are much more likely to migrate than
the rest of the population. In order to understand if cognitive skills and adaptability affect the
returns or the costs of migration we develop a simple variation of the Roy model that predicts
that a skill increasing the earnings returns to migration would increase probability of migration
and also increase, conditional on migrating, the pre-post migration earnings. To the contrary,
skills decreasing the (non-monetary) costs of migration increase the probability of migration but,
conditional on migrating, would not be associated with larger pre-post migration earnings premium.
We find that both cognitive ability and adaptability have a significant and positive impact on
the probability that the individual migrates to another location in the first decades of his working
life. In addition, we present empirical evidence that cognitive skills also have a significant positive
effect on the pre-post migration earnings differential, while adaptability does not. This evidence is
consistent with adaptability being a skill that mainly reduces the non-monetary migration costs of
migrants. Adaptability, however, may increase the capacity of a migrant to assimilate, to integrate
and to succeed in the long run. Hence, the strongly positive selection of migrants on ‘adaptability’,
especially strong for low skilled individuals, on bodes well for their ability to succeed and integrate
in the host economy.
26

References
Abramitzky, R., L. P. Boustan, and K. Eriksson (2012): “Europe’s Tired, Poor, Huddled
Masses: Self-Selection and Economic Outcomes in the Age of Mass Migration,” American Eco-
nomic Review, 102(5), 1832–56.
Ambrosini, J. W., and G. Peri (2012): “The Determinants and the Selection of Mexico-US
Migrants,” The World Economy, 35(2), 111–151.
Anastasi, A. (1968): Psychological testing. Macmillan, New York, 3rd edn.
Ashenfelter, O. (1978): “Estimating the Effect of Training Programs on Earnings,” The Review
of Economics and Statistics, 60(1), 47–57.
Bacolod, M., B. S. Blum, and W. Strange (2009): “Skills in the city,” Journal of Urban
Economics, 65(2), 136–153.
Beaudry, P., and E. Lewis (2014): “Do Male-Female Wage Differentials Reflect Differences in
the Return to Skill? Cross-City Evidence from 1980-2000,” American Economic Journal: Applied
Economics, 6(2), 178–94.
Bhuller, M. (2009): “Inndeling av norge i arbeidsmarkedsregioner,” Discussion Paper 24, Statis-
tisk Sentralbyra.
Black, S. E., P. J. Devereux, and K. G. Salvanes (2005): “The More the Merrier? The Effect
of Family Size and Birth Order on Children’s Education,” The Quarterly Journal of Economics,
120(2), 669–700.
Borghans, L., H. Meijers, and B. ter Weel (2008): “The Role of Noncognitive Skills in
Explaining Cognitive Test Scores,” Economic Inquiry, 46(1), 212.
Borjas, G. J. (1987): “Self-Selection and the Earnings of Immigrants,” The American Economic
Review, 77(4), 531–553.
Borjas, G. J., S. G. Bronars, and S. J. Trejo (1992): “Self-selection and internal migration
in the United States,” Journal of Urban Economics, 32(2), 159 – 185.
Butikofer, A., K. Salvanes, and D. Steskal (2015): “What is the City but the People?
Changes in Urban Wage Premium and Migrant Selection since 1967,” Discussion paper, mimeo.
Cronbach, L. J. (1964): Essentials of Psychological Testing. Harper and Row, London, UK, 2nd
edn.
Dahl, G. B. (2002): “Mobility and the Return to Education: Testing a Roy Model with Multiple
Markets,” Econometrica, 70(6), 2367–2420.
27

Duncan, G. J., and J. N. Morgan (1981): “Sense of Efficacy and Subsequent Change in
EarningsA Replication,” Journal of Human Resources, 16(4), 64957.
Dustmann, C., I. Fadlon, and Y. Weiss (2011): “Return migration, human capital accumula-
tion and the brain drain,” Journal of Development Economics, 95(1), 58–67.
Fernandez-Huertas Moraga, J. (2011): “New Evidence on Emigrant Selection,” The Review
of Economics and Statistics, 93(1), 72–96.
Gensowski, M. (2014): “Personality, IQ, and Lifetime Earnings,” IZA Discussion Paper Series
8235, IZA.
Glaeser, E. L., and D. C. Mare (2001): “Cities and Skills,” Journal of Labor Economics, 19(2),
316–42.
Goldsmith, A. H., J. R. Veum, and W. D. Jr. (1997): “The Impact of Psychological and
Human Capital on Wages,” Economic Inquiry, 35(4), 81529.
Goleman, D. (2011): The Essentials: HBRs 10 Must Reads. Harvard Business Review Press,
Boston, MA.
Griffin, B., and B. Hesketh (2003): “Adaptable behaviours for successful work and career
adjustment,” Australian Journal of Psychology, 55(2), 65–73.
Grogger, J., and G. Hanson (2013): “The Scale and Selectivity of Foreign-Born PhD Recipients
in the US,” American Economic Review, 103(3), 189–92.
Grogger, J., and G. H. Hanson (2011): “Income maximization and the selection and sorting
of international migrants,” Journal of Development Economics, 95(1), 42–57.
Heckman, J. J., and Y. Rubinstein (2001): “The Importance of Noncognitive Skills: Lessons
from the GED Testing Program,” American Economic Review, 91(1), 14549.
Heckman, J. J., J. Stixrud, and S. Urzua (2006): “The Effects of Cognitive and Noncognitive
Abilities on Labor Market Outcomes and Social Behavior,” Journal of Labor Economics, 24(3),
41182.
Jaeger, D. A., T. Dohmen, A. Falk, D. Huffman, U. Sunde, and H. Bonin (2010): “Direct
Evidence on Risk Attitudes and Migration,” The Review of Economics and Statistics, 92(3), 684–
689.
Jokela, M. (2009): “Personality predicts migration within and between U.S. states,” Journal of
Research in Personality, 43, 79–83.
28

Jokela, M., M. Elovainio, M. Kivimaki, and L. Keltikangas-Jarvinen (2008): “Temper-
ament and Migration Patterns in Finland,” Psychological Science, 19(9), 831–837.
Kuhn, P., and C. Weinberger (2005): “Leadership Skills and Wages,” Journal of Labor Eco-
nomics, 23(3), 395436.
Lindqvist, E., and R. Vestman (2011): “The Labor Market Returns to Cognitive and Noncog-
nitive Ability: Evidence from the Swedish Enlistment,” American Economic Journal: Applied
Economics, 3, 101–128.
Lundborg, P., P. Nystedt, and D.-O. Rooth (2014): “Height and Earnings: The Role of
Cognitive and Noncognitive Skills,” Journal of Human Resources, 49(1), 141–166.
Lundgren, E. A., and A. M. Olsen (1952): “Foreløpig veileding for deltakere ved sesjonsp-
sykologkurset 1952 i bruk av klinisk spørreskjema,” Discussion paper, Forsvarets Psykologiske
Avdeling.
Malamud, O., and A. Wozniak (2012): “The Impact of College on Migration: Evidence from
the Vietnam Generation,” Journal of Human Resources, 47(4), 913–950.
Marfouk, A. (2007): “Brain Drain in Developing Countries,” World Bank Economic Review,
21(2), 193–218.
McDaniel, M., F. Morgeson, E. Finnegan, M. Campion, and E. Braverman (2001):
“Use of situational judgment tests to predict job performance: A clarification of the literature,”
Journal of Applied Psychology, 86(4), 730–740.
Møen, J., K. G. Salvanes, and E. Ø. Sørensen (2003): “Documentation of the Linked Em-
poyer Employee Data Base at the Norwegian School of Economics,” Working paper, The Norwe-
gian School of Economics.
Molloy, R., C. L. Smith, and A. Wozniak (2011): “Internal Migration in the United States,”
Journal of Economic Perspectives, 25(3), 173–96.
Mueller, G., and E. Plug (2006): “Estimating the Effect of Personality on Male and Female
Earnings,” Industrial and Labor Relations Review, 60(1), 322.
Murnane, R. J., J. B. Willett, J. M. Braatz, and Y. Duhaldeborde (2001): “Do Different
Dimensions of Male High School Students’ Skills Predict Labor Market Success a Decade Later?
Evidence from the NLSY,” Economics of Education Review, 20(4), 31120.
Pulakos, E., S. Arad, M. Donovan, and K. Plamondon (2000): “Adaptability in the work-
place: Development of a taxonomy of adaptive performance,” Journal of Applied Psychology,
85(4), 612–624.
29

Pulakos, E., N. Schmitt, D. Dorsey, S. Arad, W. Borman, and J. Hedge (2002): “Pre-
dicting Adaptive Performance: Further Tests of a Model of Adaptability,” Human Performance,
15(4), 299–323.
Riis, E. (1955): “Psyologisk utvelging av flygere. Etterundersøkelser.,” Discussion Paper F-2,
Forsvarets Psykologiske Avdeling.
Roy, A. (1951): “Some Thoughts on the Distribution of Earnings,” Oxford Economic Papers, 87,
S7–S36.
Segal, C. (2013): “Misbehavior, Edication, and Labor Market Outcomes,” Journal of the Euro-
pean Economic Association, 11(4), 743779.
SSB (1994): “Standard for Kommuneklassifisering 1994 (Standard Classification of Municipalities
1994),” Norges offisielle statistikk (Official Statistics of Norway): Oslo-Kongsvinger.
Thrane, V. C. (1977): “Evneprøving av Utskrivingspliktige i Norge 1950-53,” Discussion Paper 2,
INAS.
30
8 Tables and Figures
Figure 1: Probability of Moving Across Counties and Moving into Cities: Interactions of CognitiveAbility and Adjustability
0.1
.2.3
.4ef
fect
on
prob
abili
ty to
mig
rate
acr
oss
LLM
Adapt. bottom quintile Adapt. 2nd−4th quintile Adapt. top quintile
IQ bottom quintile IQ 2nd−4th quintileIQ top quintile
0.0
5.1
.15
.2.2
5ef
fect
on
prob
abili
ty to
mig
rate
into
citi
es
Adapt. bottom quintile Adapt. 2nd−4th quintile Adapt. top quintile
IQ bottom quintile IQ 2nd−4th quintileIQ top quintile
Notes: The figures reflect the estimated associations of cognitive ability (IQ) and adaptability on the probability of
moving across local labor markets or into cities as reported in Table 9. The left figure shows how the probability of
moving across counties changes with adaptability for different levels of cognitive ability. The right figure shows how
the probability of moving into cities changes with adaptability for different levels of cognitive ability.
31
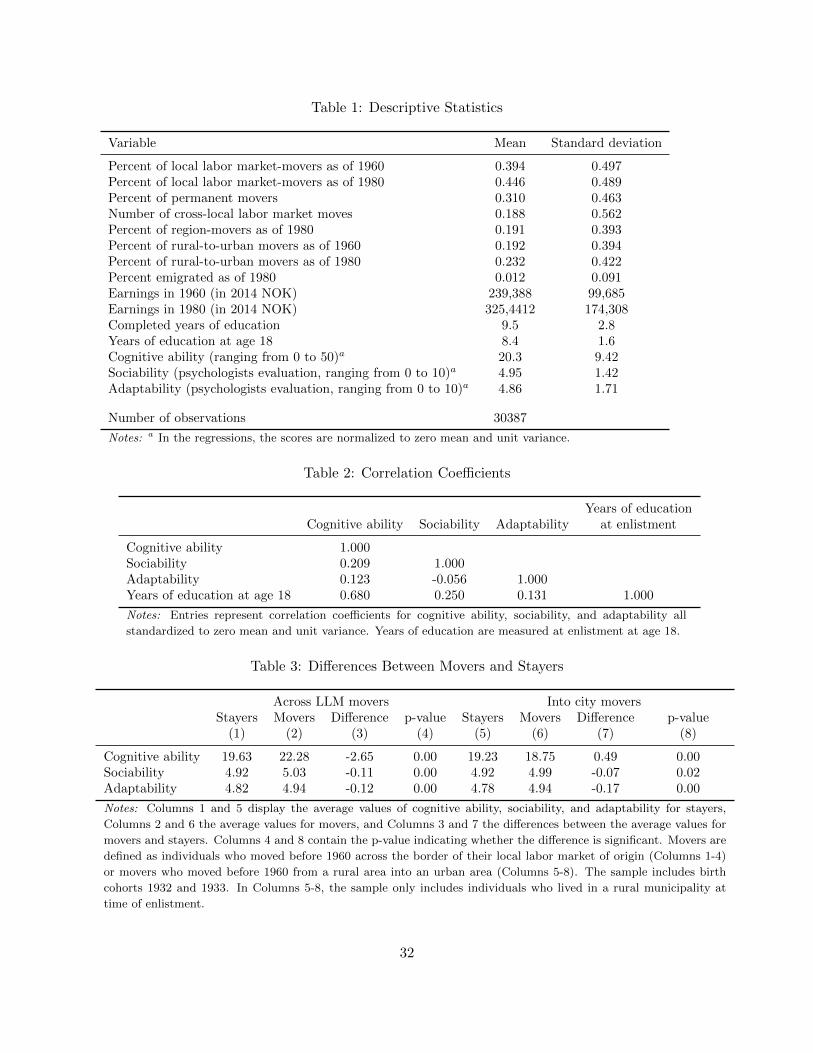
Table 1: Descriptive Statistics
Variable Mean Standard deviation
Percent of local labor market-movers as of 1960 0.394 0.497Percent of local labor market-movers as of 1980 0.446 0.489Percent of permanent movers 0.310 0.463Number of cross-local labor market moves 0.188 0.562Percent of region-movers as of 1980 0.191 0.393Percent of rural-to-urban movers as of 1960 0.192 0.394Percent of rural-to-urban movers as of 1980 0.232 0.422Percent emigrated as of 1980 0.012 0.091Earnings in 1960 (in 2014 NOK) 239,388 99,685Earnings in 1980 (in 2014 NOK) 325,4412 174,308Completed years of education 9.5 2.8Years of education at age 18 8.4 1.6Cognitive ability (ranging from 0 to 50)a 20.3 9.42Sociability (psychologists evaluation, ranging from 0 to 10)a 4.95 1.42Adaptability (psychologists evaluation, ranging from 0 to 10)a 4.86 1.71
Number of observations 30387
Notes: a In the regressions, the scores are normalized to zero mean and unit variance.
Table 2: Correlation Coefficients
Years of educationCognitive ability Sociability Adaptability at enlistment
Cognitive ability 1.000Sociability 0.209 1.000Adaptability 0.123 -0.056 1.000Years of education at age 18 0.680 0.250 0.131 1.000
Notes: Entries represent correlation coefficients for cognitive ability, sociability, and adaptability all
standardized to zero mean and unit variance. Years of education are measured at enlistment at age 18.
Table 3: Differences Between Movers and Stayers
Across LLM movers Into city moversStayers Movers Difference p-value Stayers Movers Difference p-value
(1) (2) (3) (4) (5) (6) (7) (8)
Cognitive ability 19.63 22.28 -2.65 0.00 19.23 18.75 0.49 0.00Sociability 4.92 5.03 -0.11 0.00 4.92 4.99 -0.07 0.02Adaptability 4.82 4.94 -0.12 0.00 4.78 4.94 -0.17 0.00
Notes: Columns 1 and 5 display the average values of cognitive ability, sociability, and adaptability for stayers,
Columns 2 and 6 the average values for movers, and Columns 3 and 7 the differences between the average values for
movers and stayers. Columns 4 and 8 contain the p-value indicating whether the difference is significant. Movers are
defined as individuals who moved before 1960 across the border of their local labor market of origin (Columns 1-4)
or movers who moved before 1960 from a rural area into an urban area (Columns 5-8). The sample includes birth
cohorts 1932 and 1933. In Columns 5-8, the sample only includes individuals who lived in a rural municipality at
time of enlistment.
32
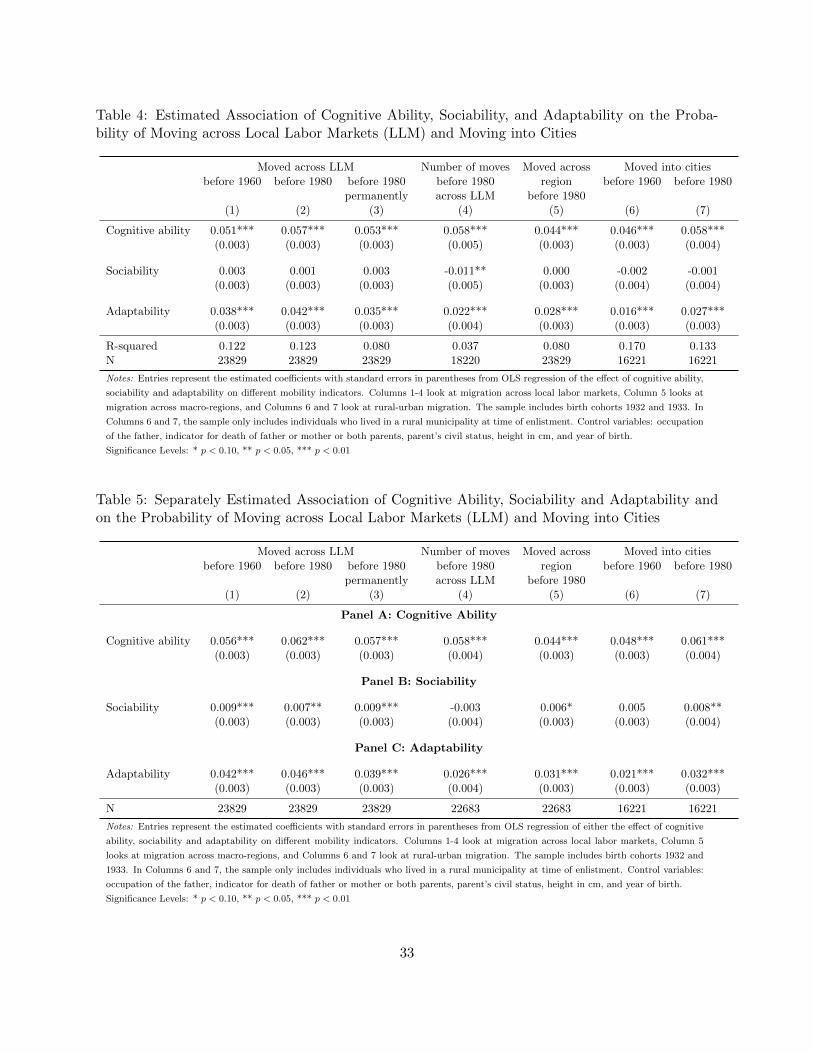
Table 4: Estimated Association of Cognitive Ability, Sociability, and Adaptability on the Proba-bility of Moving across Local Labor Markets (LLM) and Moving into Cities
Moved across LLM Number of moves Moved across Moved into citiesbefore 1960 before 1980 before 1980 before 1980 region before 1960 before 1980
permanently across LLM before 1980(1) (2) (3) (4) (5) (6) (7)
Cognitive ability 0.051*** 0.057*** 0.053*** 0.058*** 0.044*** 0.046*** 0.058***(0.003) (0.003) (0.003) (0.005) (0.003) (0.003) (0.004)
Sociability 0.003 0.001 0.003 -0.011** 0.000 -0.002 -0.001(0.003) (0.003) (0.003) (0.005) (0.003) (0.004) (0.004)
Adaptability 0.038*** 0.042*** 0.035*** 0.022*** 0.028*** 0.016*** 0.027***(0.003) (0.003) (0.003) (0.004) (0.003) (0.003) (0.003)
R-squared 0.122 0.123 0.080 0.037 0.080 0.170 0.133N 23829 23829 23829 18220 23829 16221 16221
Notes: Entries represent the estimated coefficients with standard errors in parentheses from OLS regression of the effect of cognitive ability,
sociability and adaptability on different mobility indicators. Columns 1-4 look at migration across local labor markets, Column 5 looks at
migration across macro-regions, and Columns 6 and 7 look at rural-urban migration. The sample includes birth cohorts 1932 and 1933. In
Columns 6 and 7, the sample only includes individuals who lived in a rural municipality at time of enlistment. Control variables: occupation
of the father, indicator for death of father or mother or both parents, parent’s civil status, height in cm, and year of birth.
Significance Levels: * p < 0.10, ** p < 0.05, *** p < 0.01
Table 5: Separately Estimated Association of Cognitive Ability, Sociability and Adaptability andon the Probability of Moving across Local Labor Markets (LLM) and Moving into Cities
Moved across LLM Number of moves Moved across Moved into citiesbefore 1960 before 1980 before 1980 before 1980 region before 1960 before 1980
permanently across LLM before 1980(1) (2) (3) (4) (5) (6) (7)
Panel A: Cognitive Ability
Cognitive ability 0.056*** 0.062*** 0.057*** 0.058*** 0.044*** 0.048*** 0.061***(0.003) (0.003) (0.003) (0.004) (0.003) (0.003) (0.004)
Panel B: Sociability
Sociability 0.009*** 0.007** 0.009*** -0.003 0.006* 0.005 0.008**(0.003) (0.003) (0.003) (0.004) (0.003) (0.003) (0.004)
Panel C: Adaptability
Adaptability 0.042*** 0.046*** 0.039*** 0.026*** 0.031*** 0.021*** 0.032***(0.003) (0.003) (0.003) (0.004) (0.003) (0.003) (0.003)
N 23829 23829 23829 22683 22683 16221 16221
Notes: Entries represent the estimated coefficients with standard errors in parentheses from OLS regression of either the effect of cognitive
ability, sociability and adaptability on different mobility indicators. Columns 1-4 look at migration across local labor markets, Column 5
looks at migration across macro-regions, and Columns 6 and 7 look at rural-urban migration. The sample includes birth cohorts 1932 and
1933. In Columns 6 and 7, the sample only includes individuals who lived in a rural municipality at time of enlistment. Control variables:
occupation of the father, indicator for death of father or mother or both parents, parent’s civil status, height in cm, and year of birth.
Significance Levels: * p < 0.10, ** p < 0.05, *** p < 0.01
33
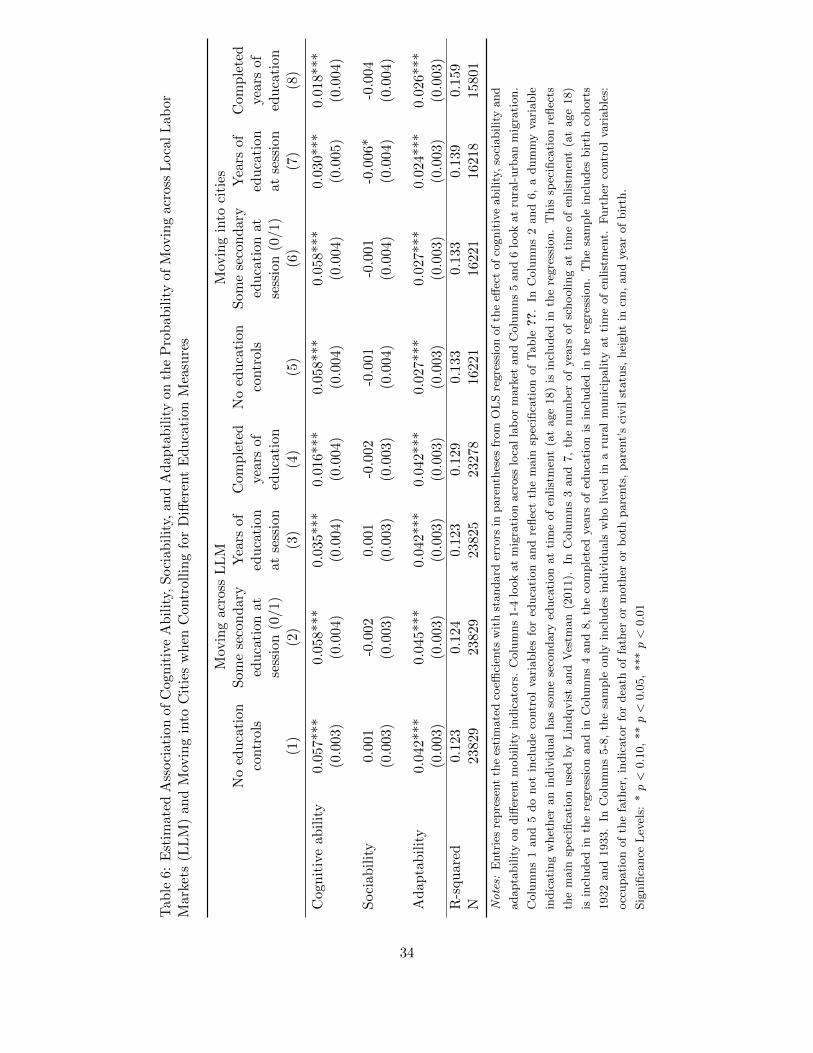
Tab
le6:
Est
imat
edA
ssoci
ati
on
of
Cog
nit
ive
Ab
ilit
y,S
oci
abil
ity,
and
Ad
apta
bil
ity
onth
eP
rob
abil
ity
ofM
ovin
gac
ross
Loca
lL
abor
Mar
kets
(LL
M)
and
Mov
ing
into
Cit
ies
wh
enC
ontr
olli
ng
for
Diff
eren
tE
du
cati
onM
easu
res
Mov
ing
acro
ssL
LM
Mov
ing
into
citi
esN
oed
uca
tion
Som
ese
con
dar
yY
ears
ofC
omp
lete
dN
oed
uca
tion
Som
ese
con
dar
yY
ears
ofC
omp
lete
dco
ntr
ols
edu
cati
onat
edu
cati
onye
ars
ofco
ntr
ols
edu
cati
onat
edu
cati
onye
ars
ofse
ssio
n(0
/1)
atse
ssio
ned
uca
tion
sess
ion
(0/1
)at
sess
ion
edu
cati
on(1
)(2
)(3
)(4
)(5
)(6
)(7
)(8
)
Cogn
itiv
eab
ilit
y0.0
57*
**
0.05
8***
0.03
5***
0.01
6***
0.05
8***
0.05
8***
0.03
0***
0.01
8***
(0.0
03)
(0.0
04)
(0.0
04)
(0.0
04)
(0.0
04)
(0.0
04)
(0.0
05)
(0.0
04)
Soci
abil
ity
0.00
1-0
.002
0.00
1-0
.002
-0.0
01-0
.001
-0.0
06*
-0.0
04(0
.003)
(0.0
03)
(0.0
03)
(0.0
03)
(0.0
04)
(0.0
04)
(0.0
04)
(0.0
04)
Ad
ap
tab
ilit
y0.0
42*
**
0.04
5***
0.04
2***
0.04
2***
0.02
7***
0.02
7***
0.02
4***
0.02
6***
(0.0
03)
(0.0
03)
(0.0
03)
(0.0
03)
(0.0
03)
(0.0
03)
(0.0
03)
(0.0
03)
R-s
qu
ared
0.12
30.
124
0.12
30.
129
0.13
30.
133
0.13
90.
159
N2382
923
829
2382
523
278
1622
116
221
1621
815
801
Notes:
Entr
ies
repre
sent
the
esti
mate
dco
effici
ents
wit
hst
andard
erro
rsin
pare
nth
eses
from
OL
Sre
gre
ssio
nof
the
effec
tof
cognit
ive
abilit
y,so
ciabilit
yand
adapta
bilit
yon
diff
eren
tm
obilit
yin
dic
ato
rs.
Colu
mns
1-4
look
at
mig
rati
on
acr
oss
loca
lla
bor
mark
etand
Colu
mns
5and
6lo
ok
at
rura
l-urb
an
mig
rati
on.
Colu
mns
1and
5do
not
incl
ude
contr
ol
vari
able
sfo
red
uca
tion
and
reflec
tth
em
ain
spec
ifica
tion
of
Table
??.
InC
olu
mns
2and
6,
adum
my
vari
able
indic
ati
ng
whet
her
an
indiv
idual
has
som
ese
condary
educa
tion
at
tim
eof
enlist
men
t(a
tage
18)
isin
cluded
inth
ere
gre
ssio
n.
This
spec
ifica
tion
reflec
ts
the
main
spec
ifica
tion
use
dby
Lin
dqvis
tand
Ves
tman
(2011).
InC
olu
mns
3and
7,
the
num
ber
of
yea
rsof
schooling
at
tim
eof
enlist
men
t(a
tage
18)
isin
cluded
inth
ere
gre
ssio
nand
inC
olu
mns
4and
8,
the
com
ple
ted
yea
rsof
educa
tion
isin
cluded
inth
ere
gre
ssio
n.
The
sam
ple
incl
udes
bir
thco
hort
s
1932
and
1933.
InC
olu
mns
5-8
,th
esa
mple
only
incl
udes
indiv
iduals
who
lived
ina
rura
lm
unic
ipality
at
tim
eof
enlist
men
t.F
urt
her
contr
ol
vari
able
s:
occ
upati
on
of
the
fath
er,
indic
ato
rfo
rdea
thof
fath
eror
moth
eror
both
pare
nts
,pare
nt’
sci
vil
statu
s,hei
ght
incm
,and
yea
rof
bir
th.
Sig
nifi
cance
Lev
els:
*p<
0.1
0,
**p<
0.0
5,
***p<
0.0
1
34
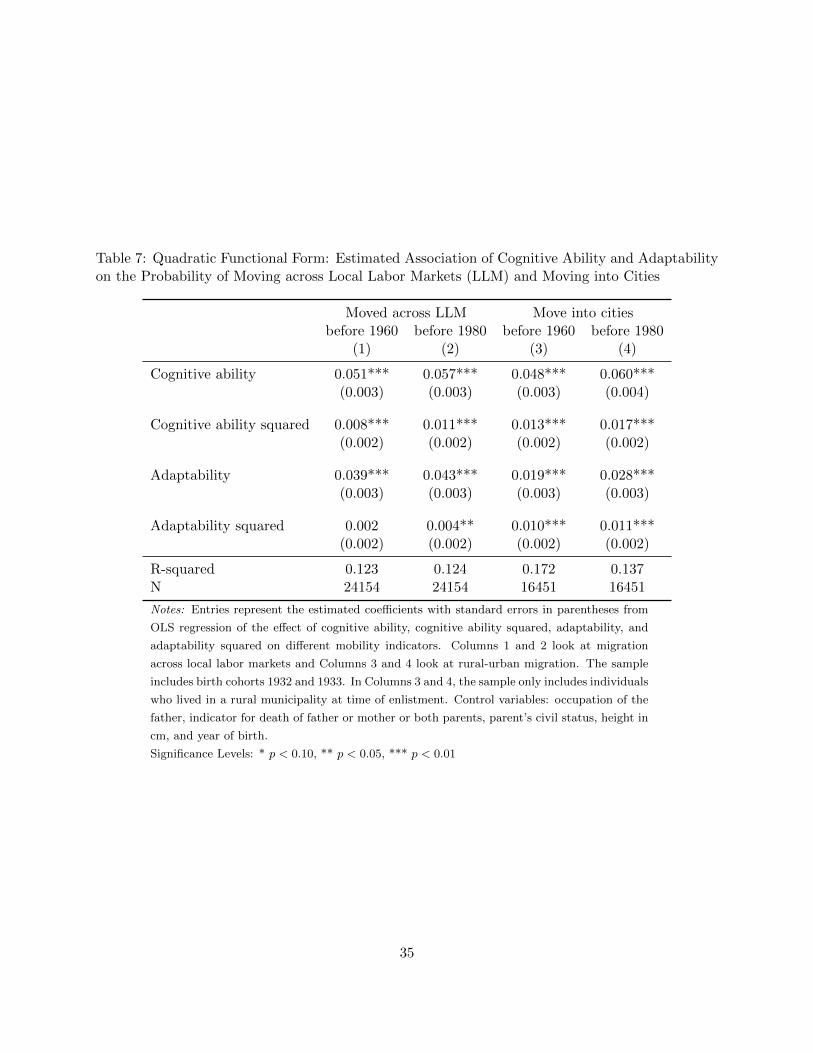
Table 7: Quadratic Functional Form: Estimated Association of Cognitive Ability and Adaptabilityon the Probability of Moving across Local Labor Markets (LLM) and Moving into Cities
Moved across LLM Move into citiesbefore 1960 before 1980 before 1960 before 1980
(1) (2) (3) (4)
Cognitive ability 0.051*** 0.057*** 0.048*** 0.060***(0.003) (0.003) (0.003) (0.004)
Cognitive ability squared 0.008*** 0.011*** 0.013*** 0.017***(0.002) (0.002) (0.002) (0.002)
Adaptability 0.039*** 0.043*** 0.019*** 0.028***(0.003) (0.003) (0.003) (0.003)
Adaptability squared 0.002 0.004** 0.010*** 0.011***(0.002) (0.002) (0.002) (0.002)
R-squared 0.123 0.124 0.172 0.137N 24154 24154 16451 16451
Notes: Entries represent the estimated coefficients with standard errors in parentheses from
OLS regression of the effect of cognitive ability, cognitive ability squared, adaptability, and
adaptability squared on different mobility indicators. Columns 1 and 2 look at migration
across local labor markets and Columns 3 and 4 look at rural-urban migration. The sample
includes birth cohorts 1932 and 1933. In Columns 3 and 4, the sample only includes individuals
who lived in a rural municipality at time of enlistment. Control variables: occupation of the
father, indicator for death of father or mother or both parents, parent’s civil status, height in
cm, and year of birth.
Significance Levels: * p < 0.10, ** p < 0.05, *** p < 0.01
35
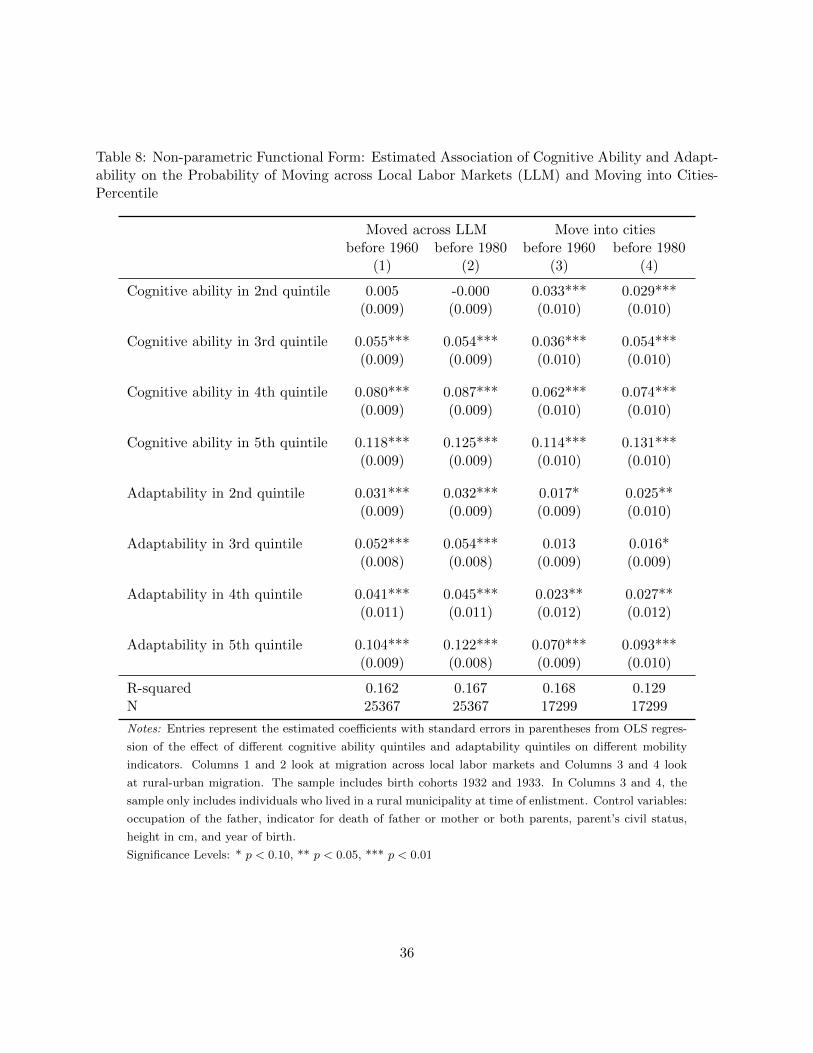
Table 8: Non-parametric Functional Form: Estimated Association of Cognitive Ability and Adapt-ability on the Probability of Moving across Local Labor Markets (LLM) and Moving into Cities-Percentile
Moved across LLM Move into citiesbefore 1960 before 1980 before 1960 before 1980
(1) (2) (3) (4)
Cognitive ability in 2nd quintile 0.005 -0.000 0.033*** 0.029***(0.009) (0.009) (0.010) (0.010)
Cognitive ability in 3rd quintile 0.055*** 0.054*** 0.036*** 0.054***(0.009) (0.009) (0.010) (0.010)
Cognitive ability in 4th quintile 0.080*** 0.087*** 0.062*** 0.074***(0.009) (0.009) (0.010) (0.010)
Cognitive ability in 5th quintile 0.118*** 0.125*** 0.114*** 0.131***(0.009) (0.009) (0.010) (0.010)
Adaptability in 2nd quintile 0.031*** 0.032*** 0.017* 0.025**(0.009) (0.009) (0.009) (0.010)
Adaptability in 3rd quintile 0.052*** 0.054*** 0.013 0.016*(0.008) (0.008) (0.009) (0.009)
Adaptability in 4th quintile 0.041*** 0.045*** 0.023** 0.027**(0.011) (0.011) (0.012) (0.012)
Adaptability in 5th quintile 0.104*** 0.122*** 0.070*** 0.093***(0.009) (0.008) (0.009) (0.010)
R-squared 0.162 0.167 0.168 0.129N 25367 25367 17299 17299
Notes: Entries represent the estimated coefficients with standard errors in parentheses from OLS regres-
sion of the effect of different cognitive ability quintiles and adaptability quintiles on different mobility
indicators. Columns 1 and 2 look at migration across local labor markets and Columns 3 and 4 look
at rural-urban migration. The sample includes birth cohorts 1932 and 1933. In Columns 3 and 4, the
sample only includes individuals who lived in a rural municipality at time of enlistment. Control variables:
occupation of the father, indicator for death of father or mother or both parents, parent’s civil status,
height in cm, and year of birth.
Significance Levels: * p < 0.10, ** p < 0.05, *** p < 0.01
36
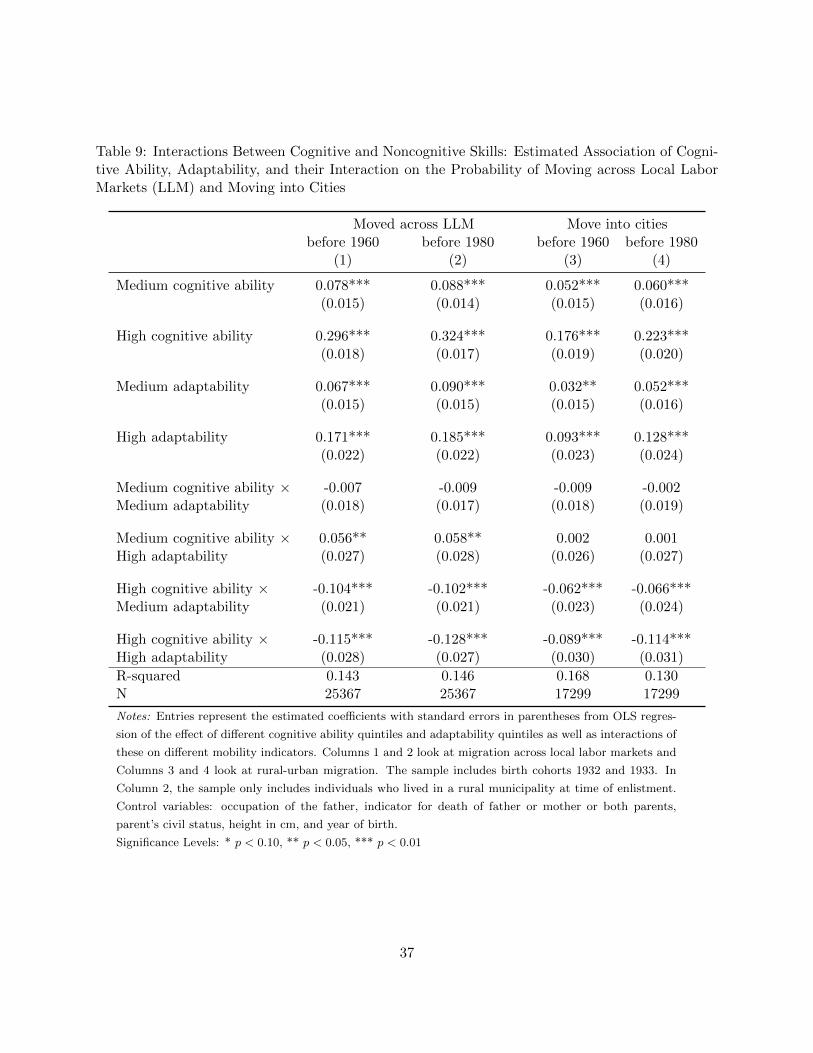
Table 9: Interactions Between Cognitive and Noncognitive Skills: Estimated Association of Cogni-tive Ability, Adaptability, and their Interaction on the Probability of Moving across Local LaborMarkets (LLM) and Moving into Cities
Moved across LLM Move into citiesbefore 1960 before 1980 before 1960 before 1980
(1) (2) (3) (4)
Medium cognitive ability 0.078*** 0.088*** 0.052*** 0.060***(0.015) (0.014) (0.015) (0.016)
High cognitive ability 0.296*** 0.324*** 0.176*** 0.223***(0.018) (0.017) (0.019) (0.020)
Medium adaptability 0.067*** 0.090*** 0.032** 0.052***(0.015) (0.015) (0.015) (0.016)
High adaptability 0.171*** 0.185*** 0.093*** 0.128***(0.022) (0.022) (0.023) (0.024)
Medium cognitive ability × -0.007 -0.009 -0.009 -0.002Medium adaptability (0.018) (0.017) (0.018) (0.019)
Medium cognitive ability × 0.056** 0.058** 0.002 0.001High adaptability (0.027) (0.028) (0.026) (0.027)
High cognitive ability × -0.104*** -0.102*** -0.062*** -0.066***Medium adaptability (0.021) (0.021) (0.023) (0.024)
High cognitive ability × -0.115*** -0.128*** -0.089*** -0.114***High adaptability (0.028) (0.027) (0.030) (0.031)
R-squared 0.143 0.146 0.168 0.130N 25367 25367 17299 17299
Notes: Entries represent the estimated coefficients with standard errors in parentheses from OLS regres-
sion of the effect of different cognitive ability quintiles and adaptability quintiles as well as interactions of
these on different mobility indicators. Columns 1 and 2 look at migration across local labor markets and
Columns 3 and 4 look at rural-urban migration. The sample includes birth cohorts 1932 and 1933. In
Column 2, the sample only includes individuals who lived in a rural municipality at time of enlistment.
Control variables: occupation of the father, indicator for death of father or mother or both parents,
parent’s civil status, height in cm, and year of birth.
Significance Levels: * p < 0.10, ** p < 0.05, *** p < 0.01
37
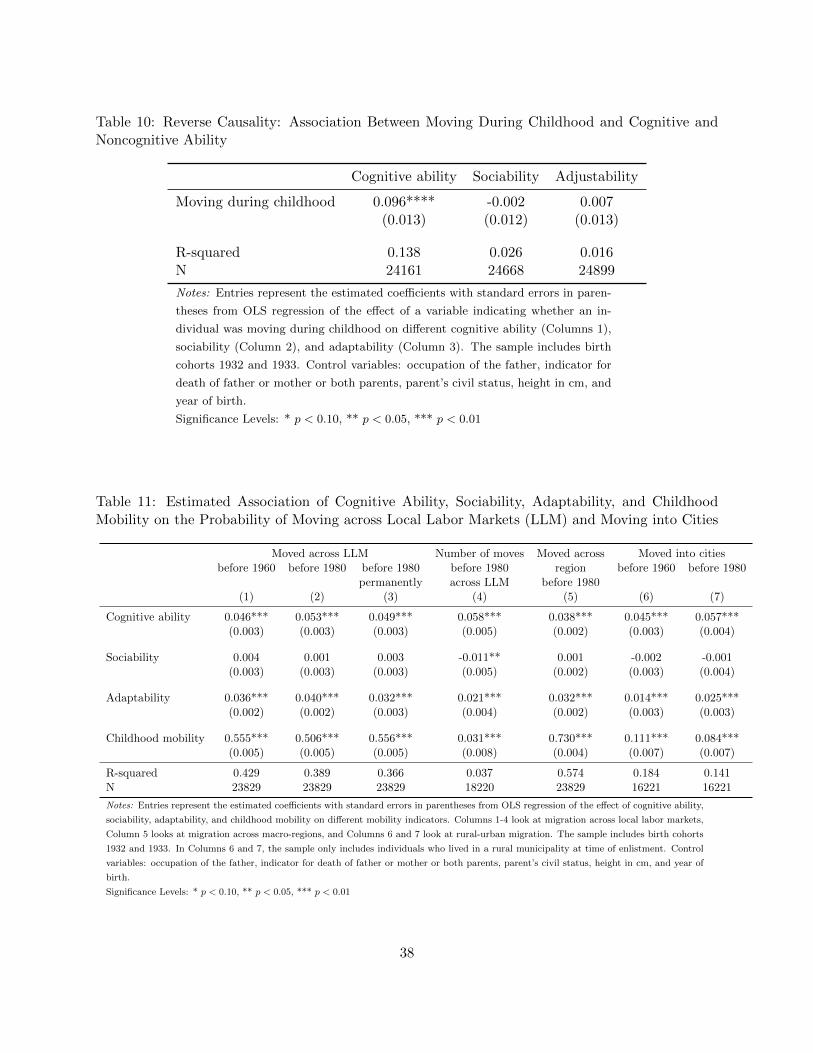
Table 10: Reverse Causality: Association Between Moving During Childhood and Cognitive andNoncognitive Ability
Cognitive ability Sociability Adjustability
Moving during childhood 0.096**** -0.002 0.007(0.013) (0.012) (0.013)
R-squared 0.138 0.026 0.016N 24161 24668 24899
Notes: Entries represent the estimated coefficients with standard errors in paren-
theses from OLS regression of the effect of a variable indicating whether an in-
dividual was moving during childhood on different cognitive ability (Columns 1),
sociability (Column 2), and adaptability (Column 3). The sample includes birth
cohorts 1932 and 1933. Control variables: occupation of the father, indicator for
death of father or mother or both parents, parent’s civil status, height in cm, and
year of birth.
Significance Levels: * p < 0.10, ** p < 0.05, *** p < 0.01
Table 11: Estimated Association of Cognitive Ability, Sociability, Adaptability, and ChildhoodMobility on the Probability of Moving across Local Labor Markets (LLM) and Moving into Cities
Moved across LLM Number of moves Moved across Moved into citiesbefore 1960 before 1980 before 1980 before 1980 region before 1960 before 1980
permanently across LLM before 1980(1) (2) (3) (4) (5) (6) (7)
Cognitive ability 0.046*** 0.053*** 0.049*** 0.058*** 0.038*** 0.045*** 0.057***(0.003) (0.003) (0.003) (0.005) (0.002) (0.003) (0.004)
Sociability 0.004 0.001 0.003 -0.011** 0.001 -0.002 -0.001(0.003) (0.003) (0.003) (0.005) (0.002) (0.003) (0.004)
Adaptability 0.036*** 0.040*** 0.032*** 0.021*** 0.032*** 0.014*** 0.025***(0.002) (0.002) (0.003) (0.004) (0.002) (0.003) (0.003)
Childhood mobility 0.555*** 0.506*** 0.556*** 0.031*** 0.730*** 0.111*** 0.084***(0.005) (0.005) (0.005) (0.008) (0.004) (0.007) (0.007)
R-squared 0.429 0.389 0.366 0.037 0.574 0.184 0.141N 23829 23829 23829 18220 23829 16221 16221
Notes: Entries represent the estimated coefficients with standard errors in parentheses from OLS regression of the effect of cognitive ability,
sociability, adaptability, and childhood mobility on different mobility indicators. Columns 1-4 look at migration across local labor markets,
Column 5 looks at migration across macro-regions, and Columns 6 and 7 look at rural-urban migration. The sample includes birth cohorts
1932 and 1933. In Columns 6 and 7, the sample only includes individuals who lived in a rural municipality at time of enlistment. Control
variables: occupation of the father, indicator for death of father or mother or both parents, parent’s civil status, height in cm, and year of
birth.
Significance Levels: * p < 0.10, ** p < 0.05, *** p < 0.01
38
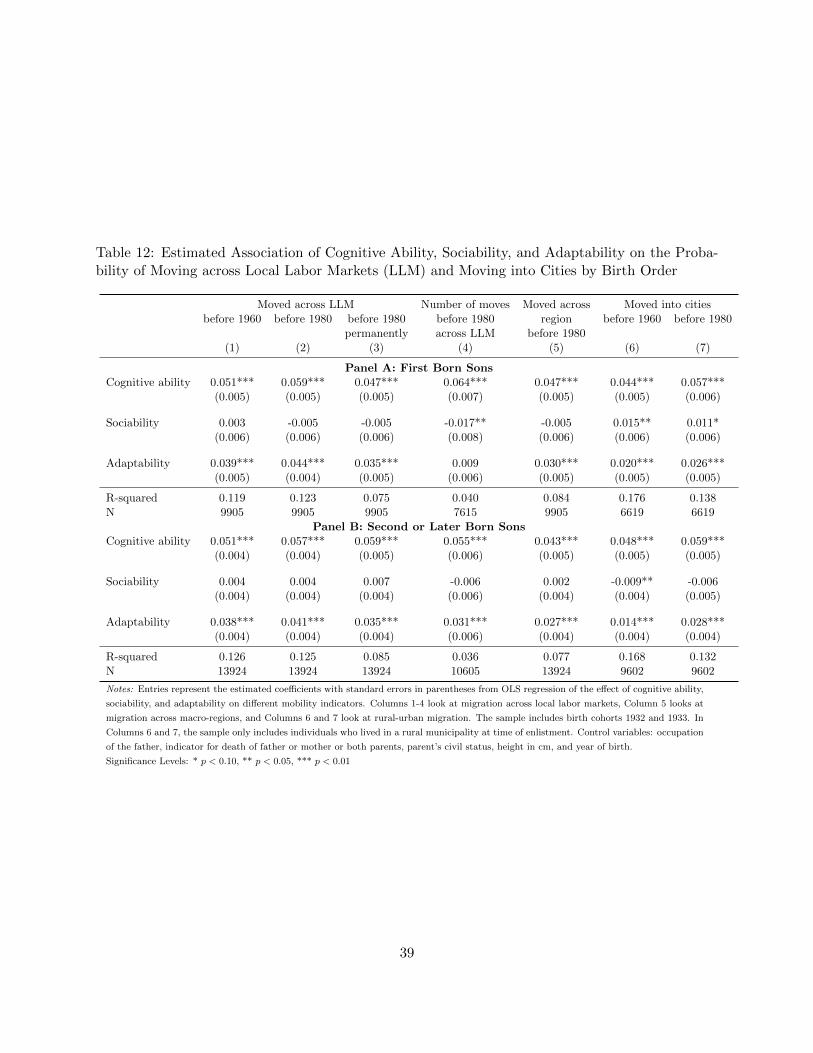
Table 12: Estimated Association of Cognitive Ability, Sociability, and Adaptability on the Proba-bility of Moving across Local Labor Markets (LLM) and Moving into Cities by Birth Order
Moved across LLM Number of moves Moved across Moved into citiesbefore 1960 before 1980 before 1980 before 1980 region before 1960 before 1980
permanently across LLM before 1980(1) (2) (3) (4) (5) (6) (7)
Panel A: First Born SonsCognitive ability 0.051*** 0.059*** 0.047*** 0.064*** 0.047*** 0.044*** 0.057***
(0.005) (0.005) (0.005) (0.007) (0.005) (0.005) (0.006)
Sociability 0.003 -0.005 -0.005 -0.017** -0.005 0.015** 0.011*(0.006) (0.006) (0.006) (0.008) (0.006) (0.006) (0.006)
Adaptability 0.039*** 0.044*** 0.035*** 0.009 0.030*** 0.020*** 0.026***(0.005) (0.004) (0.005) (0.006) (0.005) (0.005) (0.005)
R-squared 0.119 0.123 0.075 0.040 0.084 0.176 0.138N 9905 9905 9905 7615 9905 6619 6619
Panel B: Second or Later Born SonsCognitive ability 0.051*** 0.057*** 0.059*** 0.055*** 0.043*** 0.048*** 0.059***
(0.004) (0.004) (0.005) (0.006) (0.005) (0.005) (0.005)
Sociability 0.004 0.004 0.007 -0.006 0.002 -0.009** -0.006(0.004) (0.004) (0.004) (0.006) (0.004) (0.004) (0.005)
Adaptability 0.038*** 0.041*** 0.035*** 0.031*** 0.027*** 0.014*** 0.028***(0.004) (0.004) (0.004) (0.006) (0.004) (0.004) (0.004)
R-squared 0.126 0.125 0.085 0.036 0.077 0.168 0.132N 13924 13924 13924 10605 13924 9602 9602
Notes: Entries represent the estimated coefficients with standard errors in parentheses from OLS regression of the effect of cognitive ability,
sociability, and adaptability on different mobility indicators. Columns 1-4 look at migration across local labor markets, Column 5 looks at
migration across macro-regions, and Columns 6 and 7 look at rural-urban migration. The sample includes birth cohorts 1932 and 1933. In
Columns 6 and 7, the sample only includes individuals who lived in a rural municipality at time of enlistment. Control variables: occupation
of the father, indicator for death of father or mother or both parents, parent’s civil status, height in cm, and year of birth.
Significance Levels: * p < 0.10, ** p < 0.05, *** p < 0.01
39
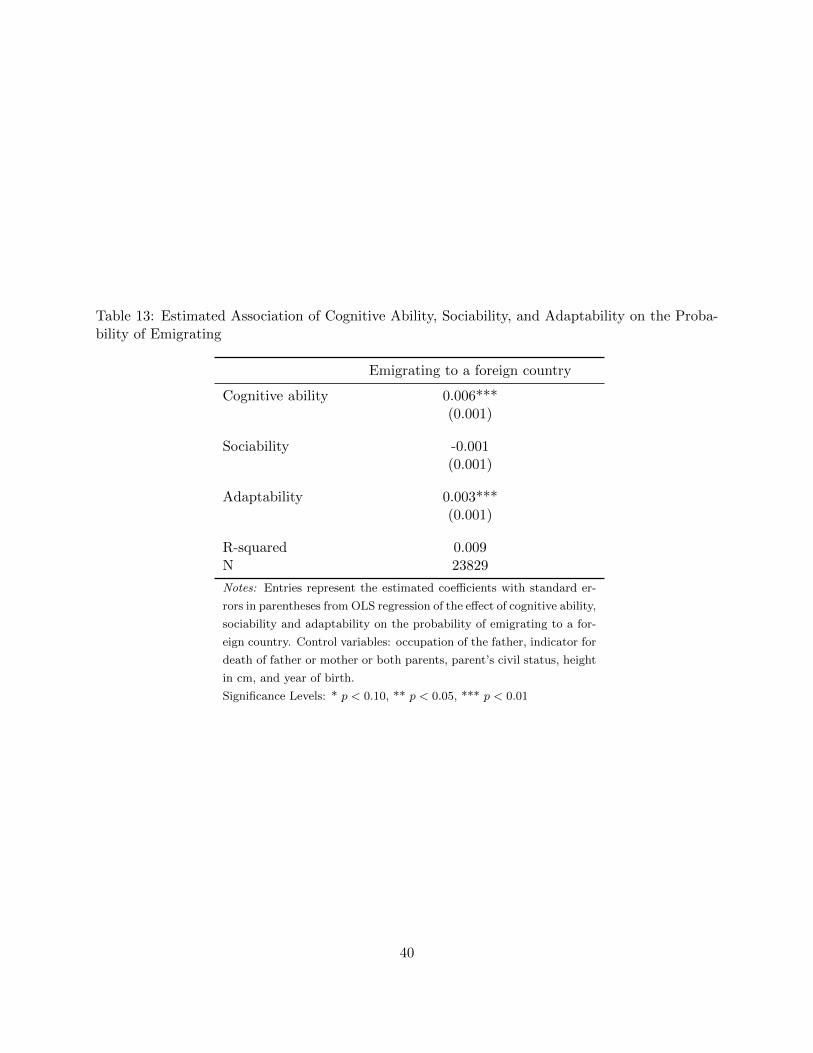
Table 13: Estimated Association of Cognitive Ability, Sociability, and Adaptability on the Proba-bility of Emigrating
Emigrating to a foreign country
Cognitive ability 0.006***(0.001)
Sociability -0.001(0.001)
Adaptability 0.003***(0.001)
R-squared 0.009N 23829
Notes: Entries represent the estimated coefficients with standard er-
rors in parentheses from OLS regression of the effect of cognitive ability,
sociability and adaptability on the probability of emigrating to a for-
eign country. Control variables: occupation of the father, indicator for
death of father or mother or both parents, parent’s civil status, height
in cm, and year of birth.
Significance Levels: * p < 0.10, ** p < 0.05, *** p < 0.01
40
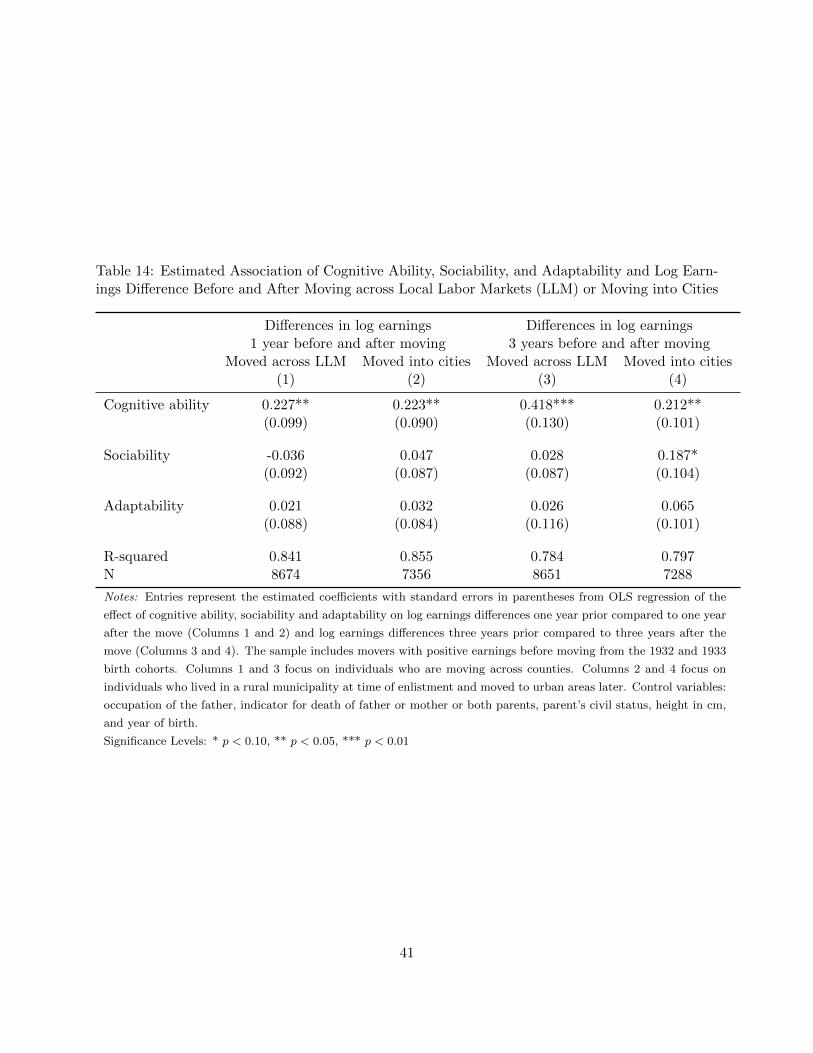
Table 14: Estimated Association of Cognitive Ability, Sociability, and Adaptability and Log Earn-ings Difference Before and After Moving across Local Labor Markets (LLM) or Moving into Cities
Differences in log earnings Differences in log earnings1 year before and after moving 3 years before and after moving
Moved across LLM Moved into cities Moved across LLM Moved into cities(1) (2) (3) (4)
Cognitive ability 0.227** 0.223** 0.418*** 0.212**(0.099) (0.090) (0.130) (0.101)
Sociability -0.036 0.047 0.028 0.187*(0.092) (0.087) (0.087) (0.104)
Adaptability 0.021 0.032 0.026 0.065(0.088) (0.084) (0.116) (0.101)
R-squared 0.841 0.855 0.784 0.797N 8674 7356 8651 7288
Notes: Entries represent the estimated coefficients with standard errors in parentheses from OLS regression of the
effect of cognitive ability, sociability and adaptability on log earnings differences one year prior compared to one year
after the move (Columns 1 and 2) and log earnings differences three years prior compared to three years after the
move (Columns 3 and 4). The sample includes movers with positive earnings before moving from the 1932 and 1933
birth cohorts. Columns 1 and 3 focus on individuals who are moving across counties. Columns 2 and 4 focus on
individuals who lived in a rural municipality at time of enlistment and moved to urban areas later. Control variables:
occupation of the father, indicator for death of father or mother or both parents, parent’s civil status, height in cm,
and year of birth.
Significance Levels: * p < 0.10, ** p < 0.05, *** p < 0.01
41
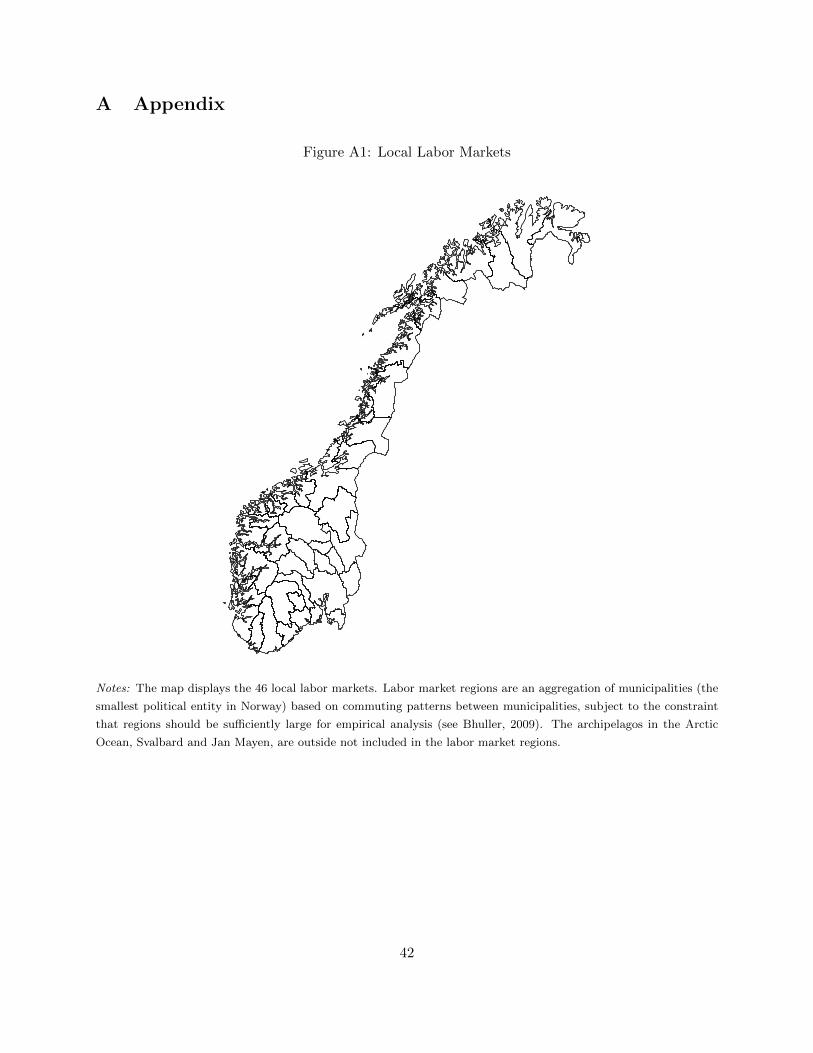
A Appendix
Figure A1: Local Labor Markets
Notes: The map displays the 46 local labor markets. Labor market regions are an aggregation of municipalities (the
smallest political entity in Norway) based on commuting patterns between municipalities, subject to the constraint
that regions should be sufficiently large for empirical analysis (see Bhuller, 2009). The archipelagos in the Arctic
Ocean, Svalbard and Jan Mayen, are outside not included in the labor market regions.
42
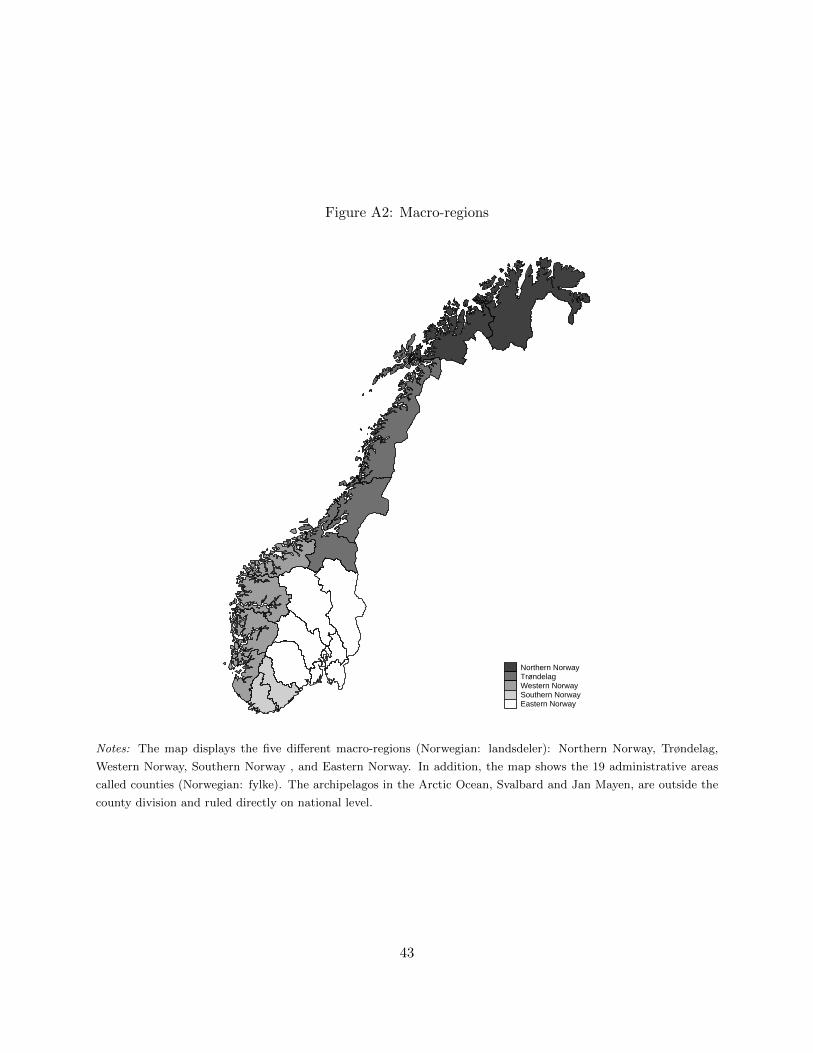
Figure A2: Macro-regions
Northern NorwayTrøndelagWestern NorwaySouthern NorwayEastern Norway
Notes: The map displays the five different macro-regions (Norwegian: landsdeler): Northern Norway, Trøndelag,
Western Norway, Southern Norway , and Eastern Norway. In addition, the map shows the 19 administrative areas
called counties (Norwegian: fylke). The archipelagos in the Arctic Ocean, Svalbard and Jan Mayen, are outside the
county division and ruled directly on national level.
43