commissioning of a gafchromic ebt film dosimetry protocol...
TRANSCRIPT
Commissioning of a GafChromic EBT film dosimetry protocol at Ionizing
Radiation Standards group of National Research Council
Ling Bin Xu
Medical Physics Unit
McGill University, Montreal
Submitted on June 2009
A thesis submitted to Mcgill University in partial fulfillment of the requirements
of the degree of master of Science
©Ling Bin Xu 2009
1

Abstract
A GafChromic EBT film dosimetry protocol was established at the Ionizing
Radiation Standards group of National Research Council. After a literature view,
several aspects of EBT film dosimetry were investigated. The energy and
radiation modality independence of EBT film was confirmed at the 2 % level. A
calibration curve was established using a 32 point calibration curve described by a
four-parameter polynomial. The darkening of EBT film is found to be significant
after the first 24 hours, and up to 5 % darkening was observed over three months,
which rules out the use of EBT film as an audit dosimeter. We confirmed the
need for scanner uniformity correction and devised a single equation correction
technique. The film homogeneity was found to be the dominant factor in dose
measurement uncertainty. After establishing the film dosimetry protocol, the
EBT film was used as a two-dimensional dosimeter in Monte Carlo benchmarking
experiments.
Un protocol dosimétrie utilisant du film Gafchromic EBT a été établi d’en le
groupe des Étalons de rayonnements ionisants du Conseil national de recherches.
Après une vue de la littérature, plusieurs aspects de la dosimétrie du film EBT ont
été étudiés. L'indépendance de l'énergie et le tipe de rayonnement du film EBT a
été confirmé avec une precision de 2%. Une courbe d'étalonnage a été établie en
utilisant une courbe d'étalonnage de 32 point décrite par un polynôme a quatre
paramètres. Le noircissement du film EBT a ete jugée significative après les
premières 24 heures, et jusqu'à 5% a été observé au cours d’assombrissement de
trios mois, ce qui exclut l'utilisation du film EBT comme un dosimètre audit.
Nous avons confirmé la nécessité de faire un correction pour l'uniformité du
scanner et concu une seule equation pour la correction. L'homogénéité du film a
été le facteur dominant dans l'incertitude de la mesure du dose. Après avoir établi
le protocole du film, le film EBT a été utilisé comme un dosimètre à deux
dimensions pour des experiences de confirmation des techniques Monte Carlo.
2

Abstract.................................................................................................................. 1
Acknowledgements ............................................................................................... 5
Chapter 1 Introduction......................................................................................... 6
Chapter 2 Literature Review ............................................................................... 9
2.1 Background and characteristics of EBT film................................................ 9
2.2 General EBT dosimetry work flow............................................................. 15
2.3 Scanners used in literature .......................................................................... 17
2.4 Scanner lamp darkening.............................................................................. 23
2.5 Scanner warm-up and fluctuation ............................................................... 25
2.6 Scanner noise and pre-scanning.................................................................. 27
2.7 Calibration curve reported in literature....................................................... 29
2.8 Energy and radiation type dependence of EBT film................................... 35
2.9 Scanner uniformity - light scattering effect ................................................ 38
2.10 Film development process ........................................................................ 42
2.11 Humidity effect ......................................................................................... 44
2.12 Applications in 1D profile measurement .................................................. 44
2.13 Applications in 2D profile measurement - IMRT..................................... 46
2.14 Aim of this thesis project .......................................................................... 47
Chapter 3 EBT protocol established at NRC ................................................... 49
3.1 Overview of protocol .................................................................................. 49
3.2 Investigation of repeated scanning and temperature effects of 10000XL .. 51
3.3 Two-state fluctuation and reference piece correction................................. 53
3.4 Resolution and uncertainties of EBT film .................................................. 56
3.5 Calibration curve of EBT film .................................................................... 66
3.6 Energy and beam modality dependence of EBT film................................. 73
3.7 Scanner uniformity investigation................................................................ 76
3.8 Long and short term darkening of EBT film .............................................. 81
3.9 Humidity effect and TinyTag humidity logger........................................... 86
Chapter 4 Applications....................................................................................... 87
4.1 Comparison with 1D detectors.................................................................... 88
3
4.2 Measurement of Theratron Junior Co-60 field and benefits of a 2D
dosimeter........................................................................................................... 92
4.3 Vickers electron experiment ....................................................................... 94
4.4 Vickers X-ray measurements.................................................................... 107
4.5 Conclusions on Vickers experiment ......................................................... 113
Chapter 5 Conclusion ....................................................................................... 114
Bibliography ...................................................................................................... 116
4

Acknowledgements
I would like to thank my supervisors, Dr. Malcolm McEwen and Dr. Jan
Seuntjens, for their guidance in this M.Sc. thesis project. I would like to thank Dr.
Carl Ross and Dr. Claudiu Cojocauru for their collaboration in the Vickers
measurements and for providing Monte-Carlo simulation results. Prior to starting
my project at NRC, I received EBT dosimetry training with Dr. Slobodan Devic.
Dr. Erwin Podgorsak's dosimetry classes provided academic preparation for this
project. Brad Downton performed Cobalt Junior irradiation. David Marchington
constructed various equipments essential to his project. David Marchington and
Matt Kosaki were vital in keeping the Vickers accelerator running. Stewart
Walker provided electronic support in the Vickers experiment. Feridoun
Farahvash provided computer support during this project. Dr. David Lewis
provided useful comments on the properties of EBT film. During this project, I
received financial support from the National Research Council of Canada. This
project is partially funded by a CIHR Master's award.
5

Chapter 1 Introduction
Ionizing radiation has been used in the treatment of cancer for more than 100
years. The ability of ionizing radiation to kill cells was recognized almost
immediately and within two years of the discovery by Roentgen in 1895, x-rays
were being used for therapeutic purposes. Advances in radiotherapy have
concentrated on accurately delivering the prescribed tumor dose while sparing
surrounding healthy tissue. Advances in imaging techniques have allowed
accurate location of the tumor, while improved dose delivery techniques such as
Intensity Modulated Radiotherapy (IMRT) have enabled highly conformal dose
delivery. In conventional radiotherapy employing simple field setups, quality
assurance (QA) can be performed with single point dose measurements by
measuring the dose delivered at a representative point in the treatment volume,
usually with an ionization chamber. As imaging and dose delivery techniques
advance, increasingly complex treatment plans are employed, and therefore
rigorous quality assurance programs of both the treatment machines and
individual patient treatment plans are required. The complexity means that
single-point dose measurements are not adequate for QA purposes.
Since the goal of contemporary radiotherapy is to deliver uniform and conformal
dose to the target volume while sparing nearby critical organs, it would be ideal to
obtain three-dimensional dose information for each treatment plan. Three-
dimensional dosimeters such as dosimetry gels have been developed for this
purpose, but they have not progressed beyond the research phase. When a three-
dimensional dosimeter is not available, one and two-dimensional dose profile
measurements are needed. For this purpose, various dose profile measurement
devices have been commercially introduced, and GafChromic® EBT 1 , which
stands for External Beam Therapy, film is one of them.
Besides radiotherapy clinics, research institutes such as National Research
Council (NRC) also have needs for two-dimensional dosimeters. For routine QA
of machines, it is desirable to obtain complete two-dimensional dose profiles of
1 ISP corp, Wayne, NJ
6
high energy beams produced by the Cobalt-60 teletherapy machine or the Elekta
clinical linear accelerator (Linac). Compared to ionization chamber based
detectors, EBT films can obtain complete dose profiles in one irradiation, instead
of scanning the entire field with a scanning water tank. For Monte-Carlo
benchmarking, various dose profile measurement devices have been employed to
measure both relative and absolute dose profiles in one and two dimensions, in
order to validate predictions made by Monte Carlo simulations. For such
measurements, it is desirable to employ different types of dosimetry detectors, in
order to shed light on any discrepancies between experimental measurements and
theoretical predictions. In this case, EBT film's chemistry-based dose
measurement mechanism can provide a valuable alternative to ionization
chambers traditionally employed in such investigations.
Since GafChromic EBT's introduction in 2005, more than 100 peer-reviewed
articles have been published about this detector, and it is now a relatively mature
field. Unfortunately, as a dosimeter designed for clinical applications, most
investigations on EBT film have been clinically oriented. Currently, film
dosimetry protocols described in literature tend to focus on ease of use and high
patient throughput rather than higher accuracy, with IMRT QA as the primary
purpose of the protocols. Currently, clinical protocols generally result in 3 % in
dose measurements, while lower uncertainties are desired in a research
environment. Unlike a clinical environment, IMRT QA is not the purpose of an
EBT film dosimetry protocol at NRC. Instead, it is desirable to have low
uncertainties (1 % or less) in absolute dose measurement, even if that means a
more cumbersome and labor-intensive film dosimetry protocol. In a standards lab,
it is also desirable to have higher confidence on the results of our measurements.
Therefore it would be necessary to verify the claims made by the vendor of the
film, rather than taking them at face value. For reasons listed above, it is
necessary to establish a film dosimetry protocol unique to NRC, with every step
geared towards higher accuracy rather than shorter experiment time.
This M.Sc. thesis will describe the commissioning of a highly accurate
GafChromic EBT film dosimetry protocol at Ionizing Radiation Standards of
7

NRC. A thorough literature review will present most aspects of EBT film
dosimetry reported in the literature, and the results section will describe our
experimental verification of claims made in the literature and our approaches in
implementing the protocol. The applications section will present sample
applications of our EBT film dosimetry protocol.
The commissioning of the EBT film dosimetry protocol is my work under the
guidance of my supervisor. The Cobalt Junior work presented in the applications
section is a collaboration with Brad Downton. The Vickers accelerator work
presented in the applications section is a collaboration with Dr. Claudiu Cojocaru
and Dr. Carl Ross.
8
Chapter 2 Literature Review
2.1 Background and characteristics of EBT film 2.1.1 The need for a two dimensional dosimeter
Other than primary dosimeters used in primary standards labs, the gold standard
of measuring dose in high-energy radiation is the ionization chamber. In high
energy beams, a Farmer type or parallel plate ionization chamber calibrated at a
primary or secondary standards lab is usually the instrument that links all other
dosimeters to a primary dose standard. The reference-class ionization chambers
provide highly accurate dose measurements at the 0.5 % level, but they can only
measure dose at one point. When dose distribution measurements are desired,
reference class ionization chambers can be used in a scanning water tank, but their
relatively large measurement volume and the high cost of replacing them make
them unattractive for scanning work. Instead, smaller ionization chambers not
designed for reference dosimetry are often used. In addition, diodes can also be
used with a scanning tank to achieve high spatial resolution. Whether a scanning
chamber or diode is used in a water tank, the sequential measurement leads to
long measurement time when measuring two dimensional dose profiles. The
difficulties in setting up a water tank also makes chamber or diode scans
undesirable in routine clinical application or everyday research.
2.1.2 The drawbacks of chamber and diode based 1-D and 2-D arrays.
One and two-dimensional arrays based on multiple ionization chambers or diodes
are a popular choice for measuring dose profiles in high energy radiation.
Compared to water tank based solutions, detector arrays such as SunNuclear2
Profiler™ or DoseMap™ can be used in plastic phantoms, making the
experimental setup easier. The simultaneous measurement of doses at multiple
positions leads to much smaller monitor unit (MU)’s required for sufficient
statistics, therefore reducing measuring time significantly. The detector arrays,
however, suffer their own setbacks. Since all detectors are fixed in position, the
2 SunNuclear
9

spatial resolution of detector arrays is limited by the detector spacing. Moving the
entire array by a small offset helps improve spatial resolution, but such an
approach is limited by mechanical positioning accuracy. For chamber based
arrays, the need for a relatively large air volume means that high spatial resolution
can only be achieved in one dimension. These large detectors also make dose
measurements in high gradient two-dimensional fields difficult. Due to the cost
of producing each individual detector, detector arrays either have high 1-D
resolution and limited number of lines, such as the PTW3 Starcheck, or have a
complete Cartesian grid but lower spatial resolution, such as the SunNuclear
MapCheck™ or PTW Seven-29. Therefore, a dosimetry device that provides
high resolution two-dimensional dose distribution in a field is desired. Currently,
film is the only option available.
2.1.3 Brief history of radiochromic films
Radiographic films used in diagnostic radiology were used widely before
affordable radiochromic films were introduced. Based on silver halide film
technology of the photographic industry, radiographic films were designed
primarily for detecting low energy kilovoltage radiation. The drawbacks of
radiographic films are the need for dedicated developers and darkrooms and the
presence of silver which causes strong energy dependence in film response. For
quantitative dose measurements in megavoltage beams, radiochromic films were
developed. Radiochromic films change color when exposed to ionizing radiation,
and do not require a developer or a darkroom facility. Earlier versions of
radiochromic films required dose levels of 1000 Gy, and were limited to industrial
irradiation facility use (Lewis, 2009). As film production technology improved,
radiochromic films like the MD-55 were introduced to clinical and research
environment for megavoltage beams, as they required doses in the 50-100 Gy
range. However, across a sheet of MD-55 film, the sensitivity varies by up to
15 %. Such sensitivity variation makes MD-55 unattractive for accurate dose
distribution measurement. The latest model of radiochromic film, GafChromic
3 PTW Freiburg GmbH
10
EBT claims high sensitivity at the 2 to 8 Gy level, uniformity at 1.5 % level, and
energy independence from Co-60 to megavoltage Linac beams.
2.1.4 Introduction of EBT film
Introduced in 2005, GafChromic EBT (External Beam Therapy) film is the latest
generation of radiochromic film. Since radiochromic film dosimetry is a
relatively small field, ISP is the only provider at the time of writing. ISP’s
previous models of RCF include HD-810, MD-55, and HS. Such models have
been used in 2-D dose distribution measurements, but their low sensitivity
prevented their routine use in the clinical environment. With the introduction of
model EBT, clinical applications such as patient-specific IMRT verification
became feasible and extensive literature has been published on the characteristics
and applications of EBT film.
2.1.5 Current state of EBT film dosimetry
Unlike the radiographic films conventionally used in the clinical environment,
irradiated EBT film does not absorb the visible light spectrum uniformly. As it
turns blue after irradiation, the strongest absorption occurs in the red part of the
spectrum. Therefore, conventional radiographic scanners such as the Vidar
scanner have been shown to be inferior for EBT film dosimetry, while flatbed
scanners such as the Espon 1680Pro and 10000XL have been recommended by
ISP. Currently EBT film is primarily used for IMRT plan verification, with the
gamma index set to 3 % in dose, 3 mm distance to agreement for most clinical
environment (Saur et al 2008, Chung et al 2008). Lower uncertainties have been
claimed by various authors, but the published results have been limited to one
dimensional comparisons between film and ionization chamber scans. Averaging
of multiple films irradiated in the same field have been shown to reduce
uncertainty significantly, as the film uniformity is the dominating factor in
measured dose uncertainty (Battum et al, 2008). Due to the water-equivalent
nature of EBT films, multiple film pieces can be stacked to obtain 3-D dose
distributions (Chiu-Tsao et al, 2008).
11
2.1.6 Composition of EBT film
Unlike silver-halide based radiographic films, the active component of EBT film
is based on a low-Z material and has an estimated effective atomic number, Zeff,
of 6.98 (Lewis, 2009). This makes EBT film water-equivalent for dosimetry
purposes, as water has an effective atomic number of 7.3. The elemental
composition of the active layer of EBT film has been reported by the
manufacturer as: Carbon (42.3 %), Hydrogen (39.7 %), Oxygen (16.2 %),
Nitrogen (1.1 %), Lithium (0.3 %), and Chlorine (0.3 %). Note that Chlorine has
an atomic number of 17 and is not desirable in a water-equivalent dosimeter.
Small amounts of Chlorine was added to improve energy independence in film’s
response to beams with lower energies. (Devic, private conversation). Due to its
low Zeff, EBT film has shown much lower energy dependence than silver-halide
based Kodak4 EDR-2 radiographic film. (Fuss et al, 2007) In fact, no literature to
date has reported a significant energy dependence of EBT film. The expected
energy independence of EBT film in photon beams is based on the relative
contributions of photoelectric effect and Compton interaction. For high-Z
materials such as silver used in radiographic films, the photoelectric effect is the
dominant interaction in the kV energy range, while Compton interaction is the
dominant interaction in the MV energy range. The changing dominance of the
two interactions from low to high energy photons for high-Z materials causes
significant energy dependence of radiographic films. For low-Z materials, on the
other hand, Compton interactions are dominant in both kV (30 keV and up) and
MV energy ranges. Therefore little energy dependence is expected for EBT film.
Note that the water equivalent design of EBT film causes it to have relatively low
sensitivity compared to radiographic films, especially in the kilovoltage range.
Therefore, EBT film is not suitable for radiology purposes, as it requires a very
large dose to form an image. For such applications, ISP offers another line of
film, the XR-QA, where high-Z materials are added to the sensitive layer
composition to enhance film sensitivity in the kilovoltage range. XR-QA film
will not be discussed further in this thesis.
4 Eastman Kodak Company, Rochester, NY
12
Structurally, EBT film contains two active layers of 34 µm each separated by a
6 µm surface layer. A Polyester base of 97 µm was added to each side to protect
the active layer and provide mechanical rigidity. EBT film has a reported density
of 1.1 g/cm3 (Chiu-Tsao et al, 2005), which is close to the density of water. The
film was designed with two active layers to achieve maximum sensitivity without
compromising uniformity. Note that such design may potentially cause problems
in very high spatial resolution dosimetry work, as the point of measurement is not
at the center of film in a radiation field with steep dose gradients. At time of
writing, this dual-layer feature of EBT film has not been a limiting factor in
spatial resolution of film dosimetry, as most authors in literature report spatial
resolutions of 1 mm or worse.
2.1.7 Comparison of EBT and MD-55
Before the model EBT, MD-55 provided by ISP was the dominant radiochromic
film used in both industrial and clinical environments. Its primary drawback was
the low sensitivity, slow development, and poor uniformity. MD-55 and EBT are
both based on monomer crystals that turn into polymer crystals upon radiation,
which have different light absorption properties (Rink et al, 2005). As shown in
Figure 2.1, the MD-55 crystals are sand-like structures while EBT crystals are
stick-like structures. The elongated crystals found in EBT films are responsible
for the much shorter development time compared to MD-55. The non-circular
crystals are also the cause of the polarizing nature of EBT film. When used in a
film reading device with a polarized light source or detector such as a flatbed
scanner, the orientation of EBT film becomes critical.
13

Figure 2.1. Microscope images of MD-55(top) and EBT (bottom) films,
published by Rink et al (2005).
14

2.2 General EBT dosimetry work flow 2.2.1 Calibration phase
The calibration phase of EBT dosimetry refers to establishing the sensitivity
curve of a batch of EBT films. EBT film does not respond linearly to radiation,
requiring an empirical calibration that produces a non-linear calibration curve.
No consensus has been reached on the ideal equation, but a second or higher
order polynomial is often used as the calibration equation, based on Taylor's
theorem (Devic et al 2005, Battum et al 2008, and Saur et al 2008). Since there
is no physical reason for the film to have a dose threshold, the constant term of
the calibration equation is generally assumed to be zero. With that in mind, the
general calibration procedure as described in the literature comprises the
following steps:
1. Cut a sheet of film into multiple pieces. Standard clinical practice uses
eight, but research work often uses ten or more pieces.
2. Deliver a known dose to each piece. This is usually done in a solid
phantom, using either Linac MU reading or Farmer-type chamber to
measure the dose delivered.
3. Wait a fixed length of time, read the film with scanner. Correct for
scanner artifacts such as scanner fluctuation and light scattering effect.
Get the change of optical density in the film due to each specific dose.
4. Obtain a calibration data set consisting of multiple dose-optical density
(OD) pairs.
5. Fit the calibration data with an equation containing two to four parameters.
There is considerable difference between authors in the number of
parameters and the particular equations used. This will be investigated
further in this thesis.
2.2.2 Measurement phase
In the measurement phase, a blank EBT film is irradiated in the radiation field
of interest, and scanned in the same scanner as used for calibration. Since this
15

film needs to be larger than the field being investigated, a large sheet of film is
usually used. The large size of the film requires further corrections due to the
scanner lamp light scattering effect. This effect will be discussed in detail in
subsequent sections of the literature review. The steps in the measurement
phase are as follows:
1. Irradiate the experimental film in the unknown radiation field.
2. Wait the same time, and then scan the film.
3. Correct the image for any scanner artifacts. Note that different types of
scanner artifacts need to be addressed in measurement phase compared to
calibration phase.
4. Convert the corrected image into a dose distribution, by converting optical
density values into dose, and pixel index into spatial position.
2.2.3 The topics of interest in this literature review.
In this literature review, I will focus on the steps and choices that influence the
accuracy of EBT film dosimetry. The following topics will be introduced:
• Choice of scanner
• Darkening due to scanner lamp
• Scanner fluctuation
• Scanner noise and pre-scanning
• Calibration curves and the equations used to describe them in literature
• Energy and beam modality dependence of EBT film
• Scanner uniformity effect (light scattering effect)
• EBT film development after irradiation
• Humidity effect
• Application of EBT film in one-dimensional dose measurement
• Application of EBT film in two-dimensional dose measurement
16

2.3 Scanners used in literature Although the currently recommended scanner for EBT film is a flat bed scanner
designed for professional photographic use, other film optical density measuring
devices have been investigated in the literature. Within the realm of flat bed
scanners, various models have been investigated by various authors before the
Epson 1680Pro and its successor 10000XL were recommended as the ideal
scanner for EBT film dosimetry. In this chapter, we will review the various
types of film readers reported in the literature.
2.3.1 Film readers other than linear CCD-array based scanners.
Unlike radiographic films, radiochromic films such as GafChromic EBT do not
absorb all visible light uniformly. Even more importantly, the absorption
spectra of radiochromic films change significantly after exposure to ionizing
radiation. This effect means an ideal film reader should be most sensitive to the
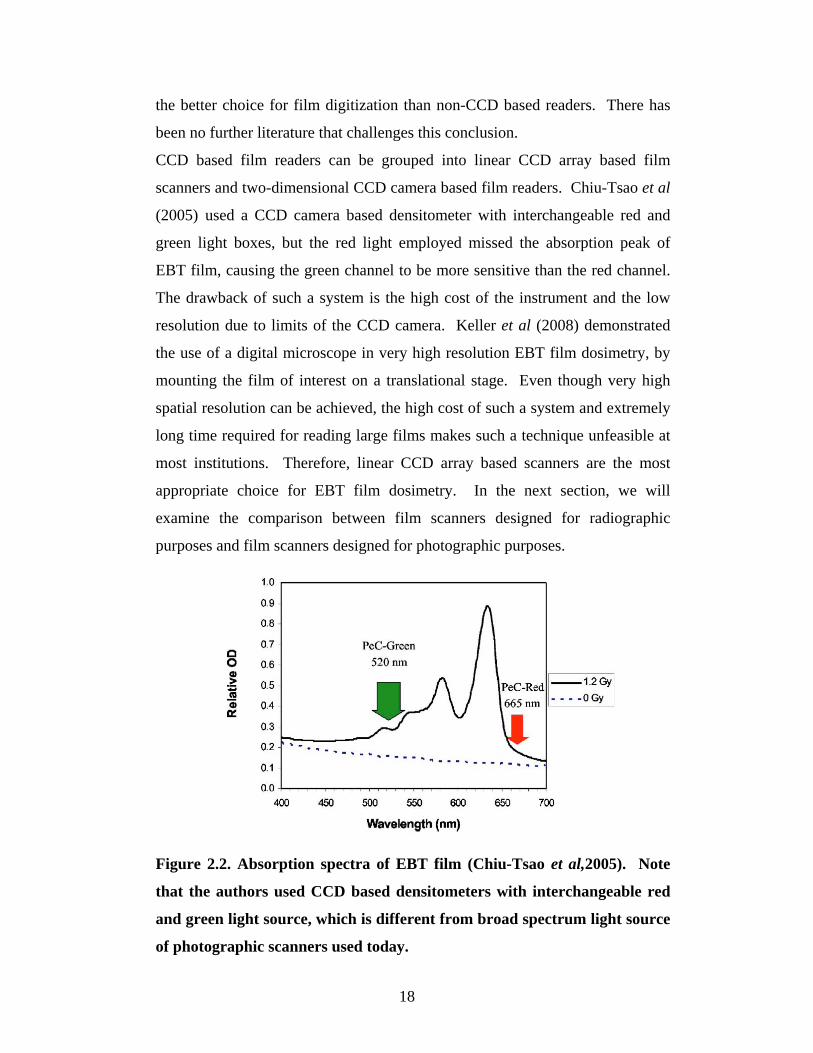
absorption peak of the EBT film. Figure 2.2 illustrates the absorption spectrum
of EBT film before and after exposure to radiation, where a strong peak in the
red visible light region suggests that the ideal EBT film reader should have
maximum sensitivity in the red region.
In Devic et al's 2004 paper, seven film digitizers were compared for use in
reading the GafChromic HS model film, which is a radiochromic film similar to
the EBT model. The film digitizers investigated were LKB Pharmacia
UltroScan XL, Molecular Dynamics Personal Densitometer, Nuclear Associates
Radiochromic Densitometer Model 37-443, Photoelectron Corporation CMR-
604, Laser Pro 16, Vidar VXR-16, and AGFA Arcus II document scanner. Of
these seven, the four digitizers including Victoreen, LaserPro16, Molecular
Dynamics, and LKB pharmacia were non-CCD based digitizers. These
detectors are more expensive than a CCD based scanner and are cumbersome to
use. The investigation showed that non-CCD based film readers show similar
or inferior performance to CCD based scanners in spatial resolution, sensitivity,
and measurement accuracy. The conclusion is that CCD based film readers are
17
the better choice for film digitization than non-CCD based readers. There has
been no further literature that challenges this conclusion.
CCD based film readers can be grouped into linear CCD array based film
scanners and two-dimensional CCD camera based film readers. Chiu-Tsao et al
(2005) used a CCD camera based densitometer with interchangeable red and
green light boxes, but the red light employed missed the absorption peak of
EBT film, causing the green channel to be more sensitive than the red channel.
The drawback of such a system is the high cost of the instrument and the low
resolution due to limits of the CCD camera. Keller et al (2008) demonstrated
the use of a digital microscope in very high resolution EBT film dosimetry, by
mounting the film of interest on a translational stage. Even though very high
spatial resolution can be achieved, the high cost of such a system and extremely
long time required for reading large films makes such a technique unfeasible at
most institutions. Therefore, linear CCD array based scanners are the most
appropriate choice for EBT film dosimetry. In the next section, we will
examine the comparison between film scanners designed for radiographic
purposes and film scanners designed for photographic purposes.
Figure 2.2. Absorption spectra of EBT film (Chiu-Tsao et al,2005). Note
that the authors used CCD based densitometers with interchangeable red
and green light source, which is different from broad spectrum light source
of photographic scanners used today.
18

2.3.2 Scanners designed for radiographic films
Before the introduction of affordable and sensitive radiochromic films,
radiographic films such as the Kodak EDR2 were used for dose measurement in
clinical environments. Specially designed clinical film scanners such as the
Vidar VXR-16 were used to read the black and white radiographic films.
Compared to color scanners, greyscale scanners such as the Vidar VXR-16 offer
superior performances in measuring black and white films. For radiochromic
films, however, clinical scanners do not offer any advantage compared to
inexpensive flatbed scanners such as the Epson 1680Pro. In Devic et al's 2004
paper comparing seven scanners, the Vidar VXR-16 was shown to be inferior to
the AGFA Arcus II photo scanner. Various other papers have confirmed that
the Vidar VXR-16 is inferior to flatbed color scanners such as the Epson
1680Pro (Wilcox et al, 2007). The primary drawback of greyscale scanners
such as the Vidar VXR-16 are their broad spectrum sensitivity. By averaging
over the entire visible light spectrum, radiographic scanners are far less
sensitive than the red channel of color scanners, which use red filters in front of
CCD elements to selectively capture red light. This lack of spectrum sensitivity
can be improved by installing a red filter in front of the Vidar's scanner lamp, as
suggested by ISP (www.isp.com). For institutions that do not already own a
radiographic scanner, however, buying a flat bed color scanner is a far more
economical solution. The Vidar VXR-16 costs more than $20,000, while the
best flat bed color scanner, the Epson 10000XL, presently costing $3000.
Another drawback of the Vidar scanner is the use of rollers instead of a glass
bed in the scanning mechanism. The mechanical movement of film produces
additional artifacts (www.isp.com). Given the high cost and various issues
associated with radiographic scanners, they are not recommended for EBT film
dosimetry.
19

2.3.3 General design of flatbed scanners
Given the drawbacks of radiographic scanners, the recommended scanner for
EBT film dosimetry is a flat bed photo scanner. Flatbed scanners record an
image by moving both a light source and a linear CCD array along the scanner
bed to record the object on the glass bed. All flatbed scanners are capable of
reflection mode, in which a light source is located next to the CCD array and
light reflected from an opaque object is recorded by the CCD array. For film
measurements, however, canners capable of transmission mode are preferred,
since scanning in transmission mode reduces light scattering due to the white
reflection backing. In this case, the scanner is equipped with a light source
above the glass bed, while the CCD array is underneath the glass bed. The light
source and the CCD array are moved along the scanner bed, and light
transmitted through the film is recorded by the CCD. This requirement rules
out scanners in the $100 range, as they do not have transmission mode
capability. For the image produced, it is desirable to have as little image
processing done by the scanner software as possible. Therefore flatbed scanners
will need to have a “professional mode”, where all image enhancement and
manipulation can be turned off manually. The image file need to be saved in
uncompressed format to avoid compression artifacts, and “positive film”
scanning mode is used to avoid artifacts introduced in the image inversion
process. Such requirements limits the scanners used in EBT film dosimetry to
the “photo scanner” class, which starts at around $500 and goes up to $3000.
2.3.4 Flatbed scanners recommended in the literature - Epson 1680Pro and
10000XL
Among the many models of flat bed photo scanners available, the Epson
1680Pro is the most commonly used in literature, as it was recommended by
ISP. Currently the Epson 10000XL is the scanner recommended by ISP, as the
1680Pro has been discontinued. Both scanners are designed for professional
photographic purposes, and offer the capability of scanning an entire 8 ×10 inch
EBT film at once in transmission mode. The difference between such high-end
20

scanners and cheaper consumer models is that a cold Xenon lamp is used in
professional models while a fluorescent lamp is used in consumer models.
(www.epson.com) Even though most articles in literature use the 1680Pro
model, recent literature have shown similar performance for the 10000XL.
Chung et al (2008) established a basic EBT protocol using both 1680Pro and
10000XL, but did not address most of the artifacts presented in the literature.
The results were comparable within experimental uncertainty. Martisikova et al
(2008) reported a more comprehensive GafChromic EBT dosimetry protocol
utilizing the 10000XL, and the characteristics of the scanner are similar to that
of 1680Pro reported in the literature. Therefore, reported characteristics of the
1680Pro when used in EBT dosimetry can be expected of the 10000XL. In this
literature review, most results were obtained using 1680Pro, as the 10000XL
was only recently introduced by Epson and not enough literature is available at
the time of writing. Note that even though HP is a prominent manufacturer of
office scanners, its scanners often lack the transmission scan capability.
However, Epson’s Expression line of photographic scanners has been very
popular among professional photographers who need to scan negatives of color
films. This may be why Epson scanners are the only ones reported in literature
for EBT film dosimetry.
Compared to the Epson 1680Pro and other scanners, the Epson 10000XL has a
significantly larger scanning area. The 10000XL has scanning bed of 310 mm
by 437 mm, while the Epson’s other photo scanner, the V700, has a scanning
bed size of 216 mm by 297 mm. Such large scanning area offers greater
potential in ignoring scanner uniformity corrections, as the film edges are far
away from the edge of scanning bed. In clinical environments, this is desirable
because it offers a simplified protocol and saves time.
2.3.5 More economical scanners
Other than the Epson 1680Pro and 10000XL, other photo scanners have also
been reported in the literature, often due to their availability at a particular
institution or low cost. Devic et al (2006) reported an EBT protocol using the
21
AGFA Arcus II, while Menegotti et al (2008) reported a comparison of Epson
1680Pro and V750 scanners when used in EBT film dosimetry. In Menegotti et
al's report, the V750 and 1680Pro both resulted in 98 % passing pixel for 3 %,
3 mm gamma index of less than 1 %. The AGFA scanner has been
discontinued for a few years, but the V750 represents a class of photo scanners
designed for non-professional use. These scanners are inexpensive compared to
professional models, but the fluorescent lamp used in these scanners is a major
drawback for EBT dosimetry. Prolonged exposure to indoor fluorescent light is
also not recommended (Devic, private conversation). Even though
radiochromic films are designed to be insensitive to visible light, they have been
found to be sensitive to direct sunlight. The sensitivity to sunlight is due to the
UV component of sunlight. Scanner lamps that contain UV components are not
suitable for EBT film dosimetry. The next section is devoted to the scanner
lamp darkening effect of professional class scanners.
22

2.4 Scanner lamp darkening Since EBT film is known to be sensitive to sunlight and prolonged indoor
fluorescent light exposure, the effect of scanner light on the EBT film is a valid
concern. Various authors have acknowledged the potential darkening effect of
the scanner lamp when reporting their EBT film dosimetry protocol utilizing the
Epson 1680Pro (Battum et al, 2008), but few have investigated this effect in
detail.
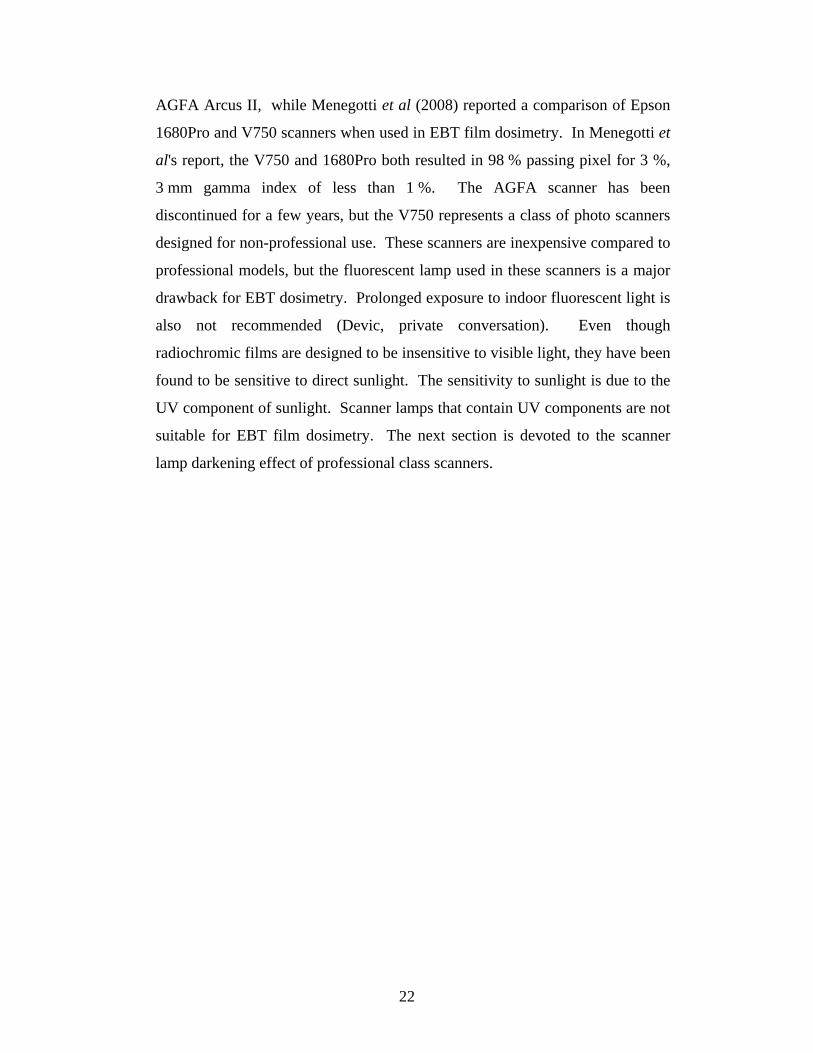
In Paelinck et al's 2006 paper, increasing optical density as a piece of EBT film
is successively scanned was reported. The scanner used in this case is the
1680Pro. This result has been quoted by some authors as the reason to avoid
scanning EBT film multiple times. The reported effect is shown in Figure 2.3,
where increasing optical density in each successive scan is evident. The
conclusion that the film is darkened by the scanner lamp, however, has been
challenged by Lynch et al (2006) .
Lynch et al also reported increasing optical density with successive scans, but
they investigated this effect in more detail by measuring the scanner bed
temperature during each scan. The result is shown in Figure 2.4, where optical
density and scanner bed temperature show a linear relationship. The authors
noted that this effect is temporary, and repeated scanning of up to 1000 times
does not result in permanent film optical density change. This project also
investigated the multiple scanning and the scanner temperature effect for the
10000XL.
23
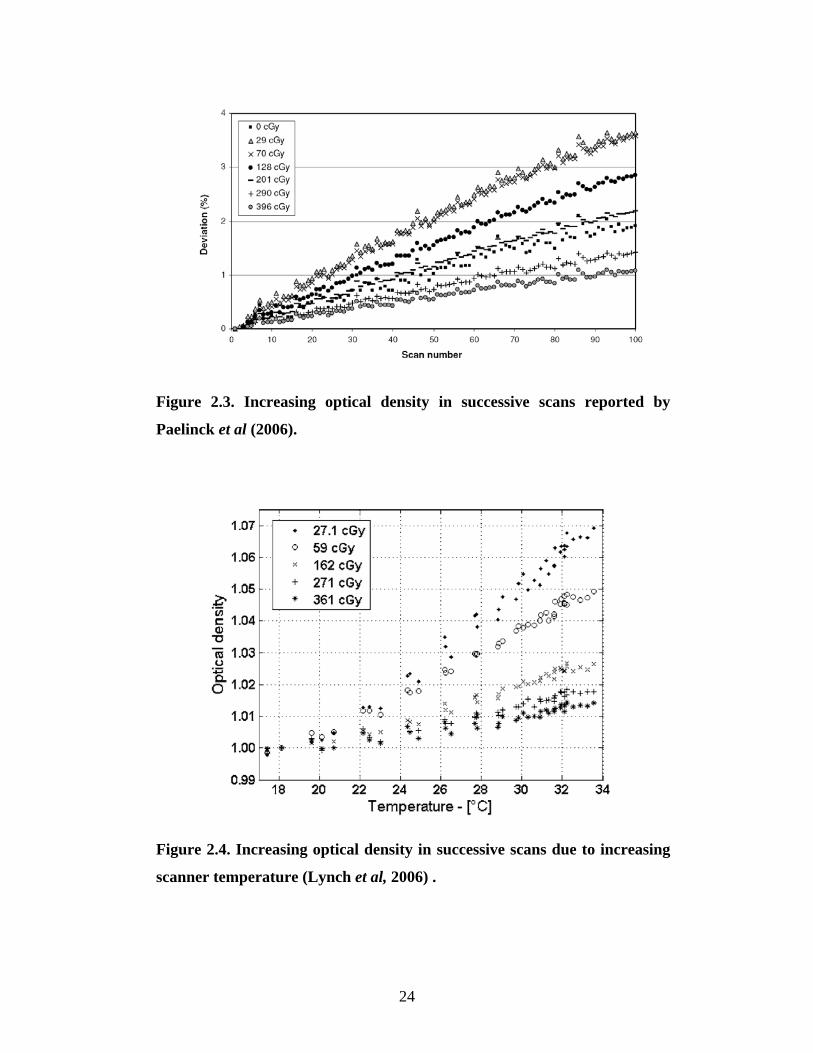
Figure 2.3. Increasing optical density in successive scans reported by
Paelinck et al (2006).
Figure 2.4. Increasing optical density in successive scans due to increasing
scanner temperature (Lynch et al, 2006) .
24

2.5 Scanner warm-up and fluctuation 2.5.1 Scanner warm-up
When the scanner lamp is first turned on, it is expected that the lamp requires a
finite time to reach a stable temperature, as the heat accumulation from the
scanner lamp reaches an equilibrium with heat loss into surrounding air. In
certain models of scanners such as the AGFA Arcus II, the scanner lamp can be
kept on by leaving the scanner cover up at all times. For newer scanners
however, the supplied scanner software does not allow the lamp to be kept on
all the time. Therefore, the first few scans after a scanner has been idling for a
few hours could be unstable. Various authors have reported scanner warm-up
effect and implemented corresponding procedures in their protocols. For
scanners based on fluorescent lamps, up to three scans were required for the
lamp to become stable (Devic et al, 2004). For the Epson 1680Pro, it has been
shown that the lamp warm-up effect can be reduced to negligible level by
performing a preview before actual scanning. Figure 2.5 provides an example
(Paelinck et al, 2007). Given that a preview is already required to verify the
positioning of the film, scanner warm-up effects for the Epson 1680Pro can be
ignored. Other authors have confirmed that scanner warm-up effect for Epson
1680Pro is not significant (Battum et al, 2008). Recent literature using
10000XL have shown similar behavior, as shown in figure 2.6 (Martisikova et
al, 2008).
2.5.2 Scanner fluctuation
Various authors have reported scan-to-scan stability of the 1680Pro, with values
ranging from 0.2 %(Martisikova et al, 2008) to 0.7 %. Note that the larger
fluctuations are reported for day to day scanner fluctuations (Fuss et al, 2007).
It is interesting to note that Fuss et al reported 0.03 % fluctuation over the time
scale of a few minute, but 0.7 % fluctuation over the time scale of days. This
suggests that scanner fluctuation may not be a Gaussian process, and detailed
characterization of scanner fluctuation is necessary. This project will study the
25

fluctuation of scanner in detail, and devise a correction to account for the lack
of scanner stability over many days.
Figure 2.5. Scanner warm-up effect reported by Paelinck et al (2007). A
preview action reduces the scanner warm-up effect to less than 0.2 %,
when 1680Pro is used.
Figure 2.6. Scanner warm-up effect reported by Martisikova et al (2008),
using 10000XL. Note that the authors did not perform a preview. Even
though the scanner response reaches a minimum after four scans, the
difference between second and fourth scans is less than 0.5 %.
26
2.6 Scanner noise and pre-scanning 2.6.1 Scanner noise and multiple scans
At the single pixel level, noise determines the limiting spatial resolution of a
film dosimetry protocol. Unlike artifacts, noise can not be corrected because it
is unpredictable. Noise in measured dose using radiochromic film has two
sources: noise due to scanner electronics and noise due to film grain. Noise due
to scanner refers to electronic noise inherent to CCD detectors, and can
potentially be reduced through repeated scanning. Noise due to film grain, on
the other hand, cannot be reduced by repeated scanning. Note that today’s
flatbed scanners natively scan at extremely high resolution, on the order of 4800
DPI (dot per inch). Scanning at such high resolution, however, is very slow.
Therefore most protocols reported in the literature scan at between 72 to 100
DPI, or about 0.2 to 0.3 mm pixel size. Such resolution implies inherent
averaging of raw data from CCD. Earlier protocols utilizing older scanners
have demonstrated the significance of scanner electronic noise and incorporated
repeated scanning to reduce uncertainty due to noise (Devic et al, 2005).
Researchers using the Epson 1680Pro scanners, however, have not
demonstrated significant scanner electronic noise at the 100 DPI resolution.
Some protocols utilizing the 1680Pro do employ multiple scanning techniques
due to previously published protocols utilizing older scanners. Most recent
protocols utilizing 1680Pro or 10000XL, however, do not average multiple
scans to lower scanner electronic noise. Battum et al (2009) scanned multiple
neutral density filters using a 1680Pro scanner at 72 dpi, and reported single
pixel scan accuracy of 0.5 % (2 SD) for filters whose optical density are
between 0.3 and 2.5. Since EBT film’s optical density is generally less than 1,
this result indicates that scanner electronic noise can be neglected for 1680Pro,
and likely for 10000XL as well. Note that the Epson 1680Pro and 10000XL are
the same class of scanners and utilize the same type of lamp. Their similarities
in light source and target user group, combined with the expectation that
electronics generally get better with subsequent releases, suggest that
10000XL’s electronic noise is at the same level as, or lower than, the 1680Pro.
27

2.6.2 Pre-scanning techniques described in literature and background
correction reported by various authors
In EBT film dosimetry, the measured absolute dose is related to net optical
density via a calibration curve. The net optical density describes the change in
optical density before and after exposure to ionizing radiation, therefore it is
necessary to measure the optical density of blank EBT film in order to obtain
net optical density measurements. However, it is interesting to note that in the
literature, more than one background signal has been defined. Devic et al (2005)
suggested that the background pixel value should be defined as the measured
pixel value of black opaque cardboard. Other authors such as Battum et al
described the pixel values measured when scanning the scanning bed without
anything on the glass, and incorporated a correction factor for it. The following
equation was reported by Devic et al, and adopted by Martisikova et al as their
definition of net optical density:
where PVunexp refers to the pixel value of blank EBT film, PVexp refers to pixel
value of exposed EBT film, and PVbckg refers to pixel value of opaque black
cardboard. In such protocols, it is necessary to pre-scan each EBT film before
irradiation, to correct for lack of homogeneity in the protective layer of EBT
film. However, there is no consensus on the need for pre-scanning. Saur et al
(2008), for example, did not perform any pre-scanning or background correction
of the glass plate.
28
2.7 Calibration curve reported in literature For a non-linear detector such as EBT film that does not have theoretical
models describing its expected response, the calibration curve provides a link
between delivered dose and measured film response through empirical data.
GafChromic EBT films are sold in boxes, with 25 sheets per box. Each box has
a batch number, but different boxes can have the same batch number.
According to ISP, every batch of EBT film meets or exceeds a minimum
sensitivity, but no maximum sensitivity is specified for a particular batch of film.
Therefore it is necessary to calibrate each batch. Since the calibration curve is
an empirical fit with arbitrary equations, it is desirable to have a large number
of data points in order to investigate the goodness of fit. On the other hand, due
to the small number of films contained in each box, it would be labor intensive
to perform a calibration with many points for each batch in a clinical
environment. As a compromise, the most popular clinical protocol involves
eight pieces of film, of which seven are irradiated one at a time. This provides
seven data points for fitting with a two or three-parameter equation that crosses
the origin. Even with this approach, various protocols reported in the literature
differ in dose delivery and curve fitting. This section will investigate these two
aspects of establishing a calibration curve as reported in literature. Before such
comparison, the issue of film orientation will be introduced, even though a
consensus has been reached in the literature on this topic.
2.7.1 Film orientation
EBT film response in a flatbed scanner has been shown to depend on the film
orientation. This dependence arises from the coating direction of the needle-
like polymer used as the active component in EBT film (Saur et al, 2008). The
film is supplied as 8 x 10 inch rectangular sheets, and the designation of
orientation is shown in Figure 2.7. The portrait orientation refers to aligning the
long edge of the film against the long edge of the scanner bed, while the
landscape orientation refers to aligning the short edge of the film against the
long edge of the scanner bed. Extensive literature has been published on this
29

subject, with the same conclusion that it is important to maintain the same
orientation in the calibration and the dose measurement phase. One example of
the effect of rotating the film is shown in Figure 2.8. When the film is rotated
180 degrees or flipped from one side to the other, no measurable effects have
been reported (Battum et al, 2008). Note that Lynch et al (2006) reported a
very large (up to factor of five) effect on measured optical density when a piece
of EBT film is rotated 90 degrees in a Microtek ScanMaker i900 flatbed
document scanner, while the Epson 1680Pro only suffered 15 % change in
optical density when the film is rotated. This reinforces the notion that a
particular type of flatbed scanner needs to be thoroughly investigated before an
EBT film dosimetry protocol is established with it.
Note that ISP recommends landscape orientation for EBT film scanning in
flatbed scanners, due to its higher signal to noise ratio. In this project we chose
the portrait orientation because it reduced the magnitude of the lateral correction
needed when a whole sheet of EBT film is scanned. Our investigation revealed
that the higher signal to noise ratio does not reduce the dose uncertainty
significantly, as the uncertainty is dominated by film sensitivity fluctuations.
30

Figure 2.7. Illustration of EBT film coating and the designation of film
orientation when scanned in a flatbed scanner (Saur et al, 2008). Note that
this designation is widely used in literature and will be adopted in this
thesis.
31

Figure 2.8 Example of film orientation’s impact on calibration curve
reported (Saur et al, 2008).
2.7.2 Dose delivery
EBT film calibration is generally carried out in a plastic phantom, where EBT
films are irradiated to a known dose. The most accurate approach involves
cutting an 8 x 10 sheet of EBT film into several pieces, and each piece is
irradiated in a solid phantom. In this case, the dose to a particular area of film
can be accurately measured with an ionization chamber, which is placed in the
position of the film and exposed to the same beam as the film. This is done
before film irradiation is performed. The drawback of such approach, however,
is the relatively long (1 hour or more) experimental time, as each data point
corresponds to entering the linear accelerator room and replacing the film.
Since each box contains only 25 sheets of film, it is desirable to have a faster
calibration procedure in clinical environment. Various authors have reported
techniques of delivering different doses to different parts of a sheet of film at
once. Battum et al employed a dynamic step and shoot dose step-wedge field
with 8 dose steps. The experiment was performed in water and the dose step
wedge was calibrated with an ionization chamber in water (Battum et al, 2008).
Menegotti et al (2008) irradiated a single film to six levels of dose using
asymmetric fields. The dose delivered was verified with a PTW Seven29™ 2D
32

chamber array and a PTW 31013 ionization chamber. Such techniques
significantly shorten the calibration time, but the authors have not demonstrated
good dosimetric accuracy of their approach. Currently most reported protocols
still irradiate different pieces of EBT film sequentially. Such approach requires
entering the linear accelerator room multiple times, but dosimetry accuracy can
be better than 1 %, based on the clinical implementation of the TG-51 protocol
(Almond et al, 1999).
We would like to draw the attention to the difference between dose to EBT film
and dose to water in absence of EBT film. For ionization chambers, cavity
theory is used to convert dose to air inside the chamber cavity to dose to water
in absence of a chamber cavity. For film dosimetry, the EBT film is assumed to
be water equivalent, and its effect on absorbed dose is neglected. The relatively
low atomic number and relative thinness of EBT film allows this approximation
to be made. Therefore dose to water measured by a Farmer-type chamber using
TG-51 protocol is assumed to be the dose to film. Note that all authors neglect
the difference between dose to water and dose to film, due to the lack of air
cavity and the relatively low accuracy of film dosimetry compared to ionization
chamber measurements.
2.7.3 Curve fitting
Since no consensus has been reached on the ideal equation of the EBT film
calibration curve, various non-linear equations have been attempted. A popular
method of searching for the best empirical equation is to input the data points
into the software TableCurve5 2D™, which attempts to fit the data points with a
large number of equations. According to Devic, (private conversation) if the
standard eight point data set is used, and constraint is set to two parameters, a
good choice is
5 Systat Software Inc. www.sigmaplot.com
33

Where n may be 2 or 2.5. Note that the value of n was not set as a parameter,
but several equations with different values of n commonly used in data analysis
were used to fit the data set. Since this equation was published shortly after the
EBT film became commercially available, it is very popular in the literature.
For literatures that report more than 8 points in calibration, the value of n is
often set as a parameter. For example, Martisikova et al (2008) employed the
above equation with a, b, and n as free parameters in a 12 point fit.
Other than the above equation introduced by Devic et al, other non-linear, non-
polynomial equations have been attempted. For example, Battum et al reported
a calibration equation based on exponential behavior:
Where ODmax is a global parameter for all batches of EBT film, and c1 is a
parameter that describes each individual film batch. This equation is then
inverted to a polynomial function of the fourth degree to obtain an equation that
calculates dose based on optical density.
The drawback of non-polynomial equations is the difficulty in predicting the
behavior of their uncertainty. Polynomial equations may require more
parameters to describe the calibration properly, but Taylor's theorem provides
the mathematical support for their application. Crop et al (2008) performed
extensive analysis on the fitting of EBT film calibration by first obtaining a
calibration curve with 38 points, and then repeating the standard 7 dose point
calibration 12 times. The authors reported that when care is taken in data
weighting during the fitting process, adequate results can be obtained using a
three parameter polynomial with 7 dose points.
A recent article by Bouchard et al presented a theoretical analysis of different
types of equations used in fitting EBT film’s calibration curve (Bouchard et al,
2009). It could potentially provide the theoretical framework for choosing the
best equation for describing the calibration curve. Unfortunately, this thesis
project is unable to utilize such framework, as the article is published near the
end of my thesis writing.
34

2.8 Energy and radiation type dependence of EBT film GafChromic EBT film has been claimed to be insensitive to beam energy and
radiation type. Unlike ionization chambers which introduce an air cavity into a
phantom, EBT film's density and effective atomic number are similar to water,
therefore it does not cause a significant perturbation of the radiation field. At
the time of writing, no literature has reported any energy dependence on the
sensitivity of the EBT film. However, it is expected that the EBT film is energy
dependent below the 75 kV energy level, due to the presence of Chlorine. This
change in composition of EBT film was meant to make the film suitable for
dosimetry in water, as previous version of EBT film can only be used in solid
phantoms. The challenge of verifying this claim lies in the lack of accuracy in
low energy dosimetry. In this project, we are primarily interested in energy
dependence of EBT film at the megavoltage level and especially on the transfer
of the calibration curve obtained in photon beams into electron measurements.
In the current literature, there is a lack of accurate film sensitivity measurements
in electron beams. This may be due to the lack of EBT use in clinical electron
beams, as IMRT does not use electron beams.
2.8.1 Energy dependence at or above Cobalt-60
Various authors have shown that EBT film is energy independent in mega
voltage x-ray beams at the level of their respective experimental uncertainty.
Butson et al (2006) reported that the sensitivity difference between 6 MV and
18 MV photons beams is less than 1 %. Although EBT applications in Cobalt
beam have been reported (Martisikova et al, 2008), direct comparison of Cobalt
and Linac calibrations have not been reported at the time of writing. For
electron beams, Su et al (2007) reported energy dependence to be within ±4 %
for electron energies from 6 to 22 MeV, but the authors were reluctant to report
an energy dependence of EBT film. Note that literature about EBT use in
electron beams is of special interest in this project, as we intend to use EBT film
in electron beams produced by Vickers experimental accelerator. Figure 2.9
shows electron energy dependence of EBT film as reported by Su et al. A
35

glance of the results suggests that the authors may have underestimated their
uncertainty, as they used the relative standard deviation of scan values as their
error bars. Such approach only addresses uncertainties due to the scanner, and
ignores film uniformity effects.
2.8.2 Energy dependence below Cobalt-60
Due to its very high spatial resolution, EBT film dosimetry in brachytherapy is
an active research topic. Despite the introduction of Chlorine into the film,
energy dependence has not been reported in peer-reviewed literature. Chiu-
Tsao et al (2008) compared EBT dose response between an 125I seed, which has
a mean energy of 28.4 keV, and a 6 MV photon beam, and found the difference
in film sensitivities measured in the two radiation modalities to be less than the
experimental uncertainty of measuring dose delivered by 125I seeds. Figure 2.10
shows 125I and a 6 MV photon beam calibration comparison reported by Chiu-
Tsao et al. It is interesting to note that a visual inspection of Figure 2.10 would
suggest an energy dependence of EBT film as the 125I calibration curve seemed
less sensitive than the 6 MV curve. The authors were reluctant to suggest this,
as they reported a 7 % uncertainty for both green and red light dose conversion.
This example highlights the difficulty of accurate EBT film dosimetry in
radiation modalities other than megavoltage photon beams. Other work on EBT
application with low energy photons has generally assumed energy
independence of EBT film, due to the difficulty of measuring dose accurately in
low energy radiation. For example, Keller et al (2008) used EBT film for
dosimetry in 100 kVp, 300 kVp x rays, and 192Ir gamma rays by applying the 6
MV Linac beam calibration to the above energies.
36

Figure 2.9. Energy dependence of EBT film in electron beam (Su et al,
2007).
Figure 2.10. Comparison of EBT calibration in 125I and 6MV X-ray,
reported by Chiu-Tsao et al (2008).
37

2.9 Scanner uniformity - light scattering effect 2.9.1 Background Theory
Systematic lateral inhomogeneity of flat-bed scanners when scanning EBT films
has been reported in the literature. It is believed to rise from the different length
of light tube a given detector "sees". A detector at the center receives light from
both sides, while a detector near the edge only receives light from one side.
Therefore, one would expect a symmetric inhomogeneity in the lateral direction,
with the deviation increasing as one moves further away from center. This
behaviour has been confirmed by literature, but reports vary on the detailed
behaviour. The light output is not assumed to be uniform along the lamp, but a
calibration slit was built into the scanner to correct for non-uniform light output
along the lamp. All results quoted in the literature review use the 1680pro
scanner. Figure 2.11 shows an illustration of film scanning geometry. In this
project, we refer to the direction parallel to scanner lamp as lateral direction,
and direction perpendicular to scanner lamp as longitudinal direction.
Figure 2.11. Film scanning geometry, not drawn to scale. CCD detectors at
the center are expected to receive more scattered light than detectors at the
edge. A illustration of lateral and longitudinal directions are included.
38

2.9.2 Types of corrections presented in literature
Corrections presented in the literature can be divided into two groups. Some
authors de-couple the lateral and longitudinal direction, and generally consider the
longitudinal direction to be uniform, i.e. no correction is required. Other authors
produce two-dimensional correction matrixes by measuring scanner responses at
various points of the scanner bed. Note that such an approach is very
cumbersome. Because this correction is expected to be optical density dependent,
the resulting correction matrix will be three dimensional and difficult to present.
2.9.3 De-coupling approaches presented in literature
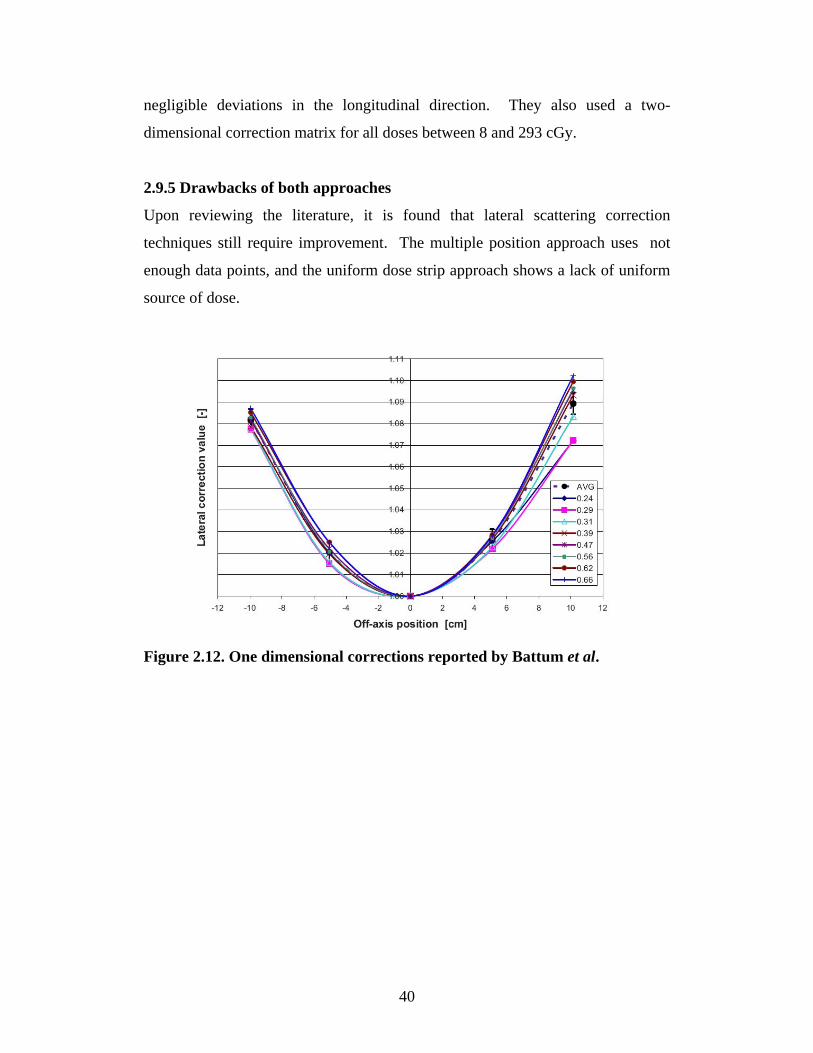
Battum et al (2008) applied lateral correction curves based on optical density,
measuring relative OD at five positions along the scanner width for each optical
density. Based on their result, the claim is that a single, averaged correction
factor can be used for all optical densities. Figure 2.12 shows the data. Note that
only five data points are collected to describe a second order polynomial that have
three free parameters. This is a common problem found in literature, where a
very small number of data points are collected to describe the lateral uniformity
correction of flatbed scanners. Lynch et al (2006) created a stepwedge by
exposing a sheet of EBT film to sunlight incrementally in 1.5 × 25 cm strips. 16
steps were created over approximately 20 min. Such step wedge was used to
evaluate scanner homogeneity. Figure 2.13 shows the figure presented by Lynch
et al. Menegotti et al (2008) used a similar approach to Lynch et al, but using a
Linac instead of sunlight to produce a dose wedge.
2.9.4 Correction matrix approaches presented in literature
Paelinck et al (2007) reported a correction technique using 11 x 7 positions for
four different dose levels. Their figures (shown in Figure 2.14) showed a large
deviation along the longitudinal direction. In their protocol, an average correction
factor was used for all optical densities. Saur and Frengen used a 5x5 matrix for
correcting inhomogeneity in their 2008 paper. They measured small, but non-
39
negligible deviations in the longitudinal direction. They also used a two-
dimensional correction matrix for all doses between 8 and 293 cGy.
2.9.5 Drawbacks of both approaches
Upon reviewing the literature, it is found that lateral scattering correction
techniques still require improvement. The multiple position approach uses not
enough data points, and the uniform dose strip approach shows a lack of uniform
source of dose.
Figure 2.12. One dimensional corrections reported by Battum et al.
40
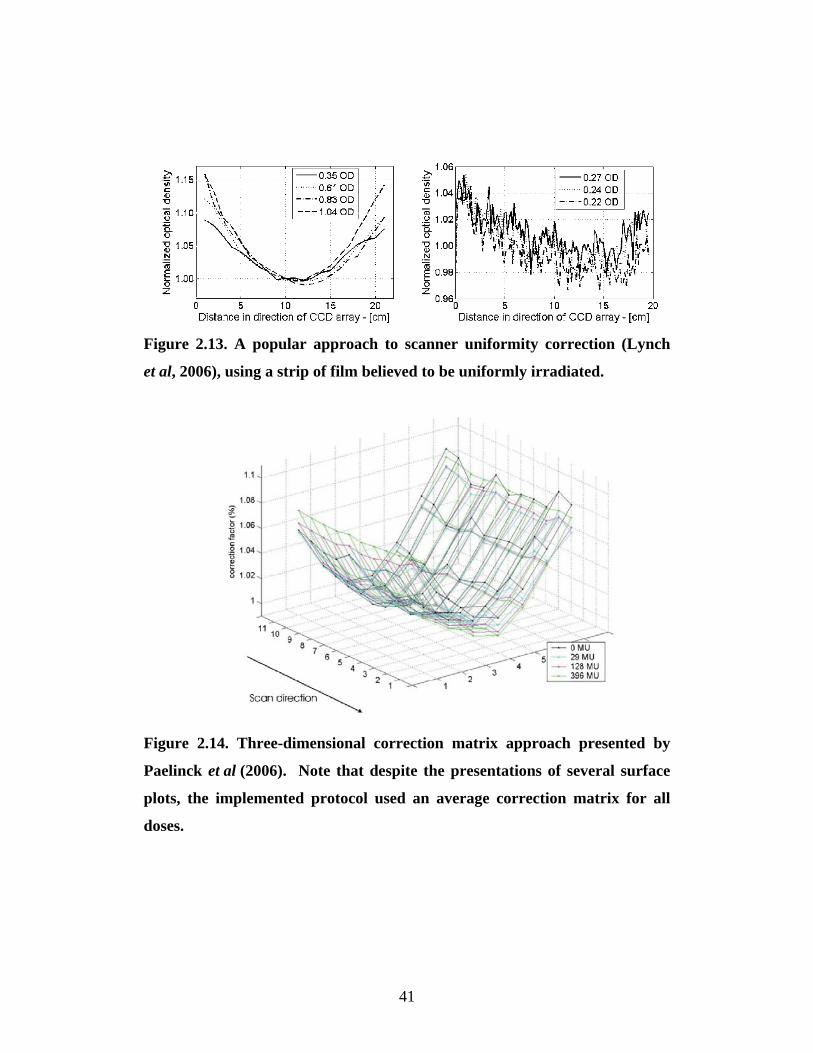
Figure 2.13. A popular approach to scanner uniformity correction (Lynch
et al, 2006), using a strip of film believed to be uniformly irradiated.
Figure 2.14. Three-dimensional correction matrix approach presented by
Paelinck et al (2006). Note that despite the presentations of several surface
plots, the implemented protocol used an average correction matrix for all
doses.
41
2.10 Film development process Unlike radiographic films, radiochromic films are self-developing and do not
require a dedicated developer. The drawback of the self-developing feature is
the relatively long development time. Earlier versions of radiochromic films
had a development time on the order of a week, while EBT films’ optical
density has been shown to stabilize after a few hours. Currently, the consensus
in the literature is that the film development effect becomes negligible after 24
hours, and the conservative protocols in the literature wait at least a day after
irradiation before scanning is performed (Battum et al, 2008). Since most of the
development happens within the first few hours after irradiation, some clinical
protocols wait only 6 hours (Saur et al, 2008). In this chapter, literature
regarding film development after irradiation is reviewed, based on the time
scale investigated. Most studies in the literature focuses on EBT film
development during the first 24 hours after irradiation, but a recent paper
(Martisikova 2008) has investigated the darkening of film after the first day.
2.10.1 Film development during the first 24 hours
Early literature showed that the opacity of EBT film stabilizes to the level of
scanner reproducibility after about 12 hours, but this observation was limited by
the difficulty in reading the same piece of film in a reproducible fashion.
2.10.2 Film development after the first day
Until recently, there is a lack of literature describing the long-term development
of irradiated EBT films after the first day. Martisikova et al (2008) showed that
film development continues for at least seven days, with a total increase in
optical density of up to 5 %. This darkening effect was also shown to be
temperature and dose dependent. A film development figure taken from this
PMB paper is shown in figure 2.15. Note that the authors showed 1 % scanner
stability from one day to another, which is better than scanner stability reported
for the Epson 1690Pro Scanner .
42
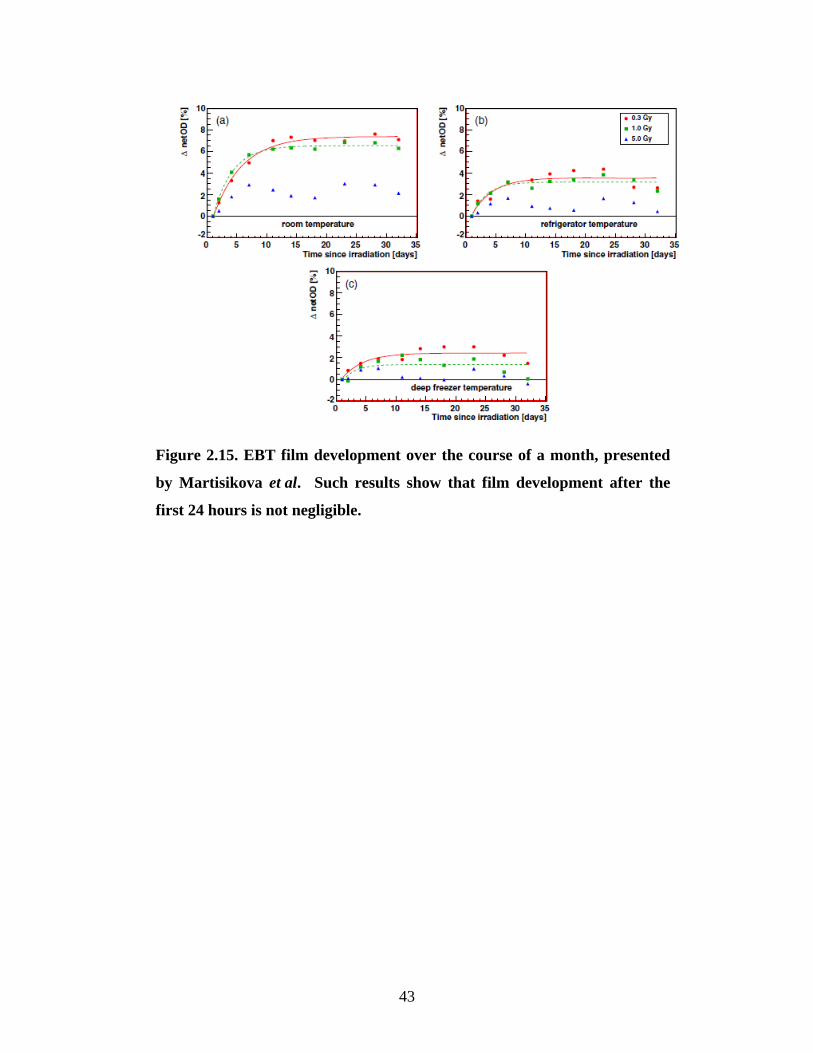
Figure 2.15. EBT film development over the course of a month, presented
by Martisikova et al. Such results show that film development after the
first 24 hours is not negligible.
43

2.11 Humidity effect GafChromic EBT film is designed for use in both solid phantom and water, but
limited literature is available for the effect of humidity and use of EBT film in
water. Battum et al’s 2008 paper is so far the only literature where EBT film is
immersed in water. Rink et al (2008) reported a 20 % drop in EBT film
sensitivity after baking the film in a drying oven for 24 hours at 50 ºC. This raises
the possibility that EBT film sensitivity is dependent on its storage history in
terms of temperature and humidity. Since water is a critical component of both
EBT crystals and the gelatine that EBT crystals are suspended in, a change of
water content in EBT film is expected to have an effect on film sensitivity.
2.12 Applications in 1D profile measurement Despite various authors claiming the EBT film as a two-dimensional reference
dosimeter, there is limited literature comparing EBT film measurement with
established dosimeters at the level of claimed film dosimetry uncertainty. Most
literatures focus on comparison between dose profiles corrected for scanner
uniformity effect and profiles not corrected for scanner uniformity effect and
emphasize that corrected dose profiles agree with known 1D detectors much
better than uncorrected profiles (Paelinck et al 2006, Menegotti et al 2008, Chung
et al 2008). The strongest comparison between EBT film and ionization
chamber-based measurement is by Battum et al (2008), where PDD and dose
profiles were measured with both EBT films and scanning ionization chamber.
The dose profile measurement is shown in figure 2.16. The profiles obtained with
both dosimeters were compared and the differences shown in a graph. This result
showed that variations in film sensitivity within a sheet of film and between
different sheets in the same batch are the dominant contribution to uncertainties in
EBT film dosimetry. Such variation is considered to be “not random but
unpredictable” (Battum et al, 2008). Since the distribution is not Gaussian,
reducing the spatial resolution does not reduce the uncertainty due to sensitivity
variation, and averaging over several films is the only solution to such a problem.
44
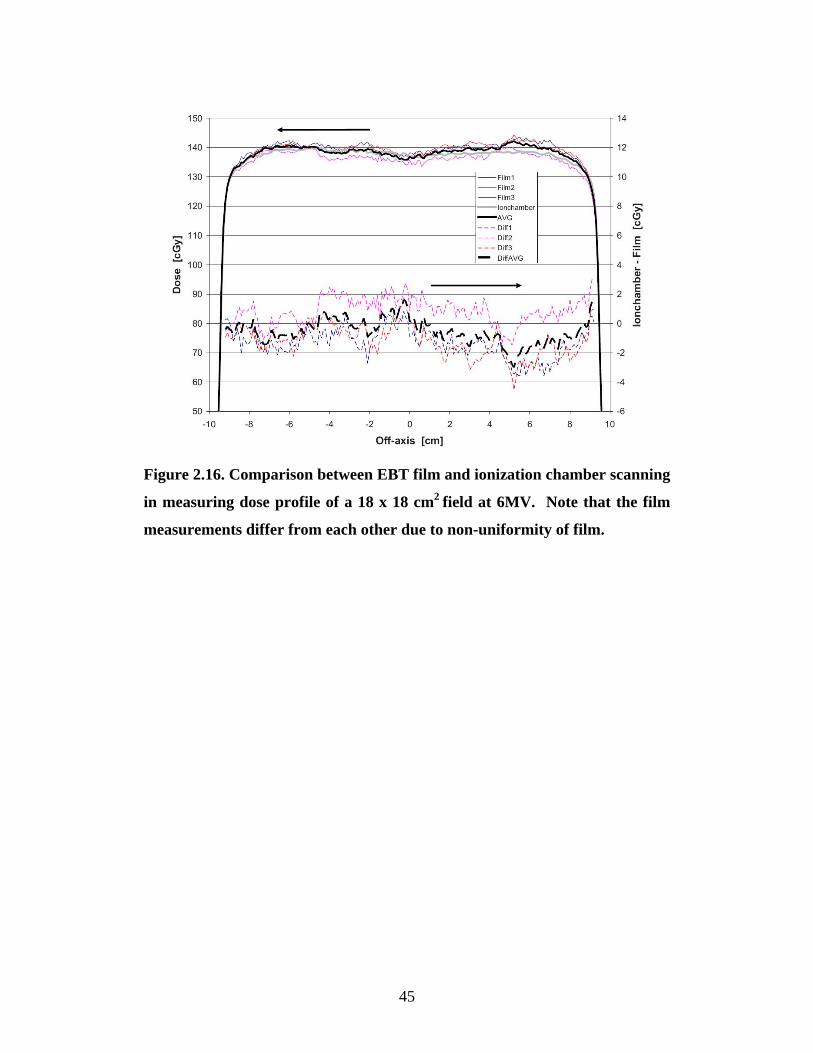
Figure 2.16. Comparison between EBT film and ionization chamber scanning
in measuring dose profile of a 18 x 18 cm2 field at 6MV. Note that the film
measurements differ from each other due to non-uniformity of film.
45

2.13 Applications in 2D profile measurement - IMRT Current 2D dose measurements of EBT film presented in literature is limited to
IMRT plan verification. The results reported are percentage of pixels passing the
gamma index at a certain level. The gamma quantity is the minimum distance in
the renormalized multidimensional space between the evaluated distribution and
the reference point. The algorithm for calculating Gamma Index is usually built
into the clinical software, but detailed explanation is available in the literature
(Low et al, 2003). Although this is the target market of EBT films, it is not
relevant to this project. Nevertheless, IMRT verification results can serve as the
ultimate test of EBT film dosimetry protocols reported in literature, as it compares
dose distributions in an entire field, rather than just a single point or a line.
2.13.1 Literature that compare EBT distributions to treatment simulation
distribution
Chung et al (2008) compared dose distribution measured by film to dose
distribution from the Pinnacle treatment planning system. Passing pixels were in
the 92 % to 95 % range. Note that the authors did not perform scanner
uniformity correction, as the aim of the project was to establish a protocol that
ignores scanner uniformity correction.
2.13.2 Literature that compare EBT distributions to another 2D dose
distribution measurement device.
Menegotti et al (2008) reported the comparison between dose distributions
measured by EBT film and by a PTW Seven 29™ 2D array. At 3 %, 3 mm, with
gamma value set to less than 1 %, 91 % of pixels agree for an inverse pyramid
pattern, and 98 % of pixels agree for an open field.
46

2.14 Aim of this thesis project In this M.Sc. thesis project, we will investigate the various areas of EBT film
dosimetry in a rigorous manner and establish an EBT film dosimetry protocol that
measures 2D dose distributions accurate to 2 % level. Film measurements will be
compared directly to conventional dosimeters, and the protocol will be used on
the NRC Vickers linear accelerator experiments. The measurements made using
EBT film will be added to measurements made by ion chambers that will verify
the accuracy of Monte Carlo simulations. In other words, EBT film will be used
as an additional dosimeter in Monte-Carlo benchmarking. Based on the published
results, the following effects can cause an error of 5 % or more if not correctly
addressed:
1. Film orientation effect due to polarity of film and scanner.
2. Scanner uniformity in the lateral direction, due to scattering of scanner
lamp light.
With the goal of 1 % overall standard uncertainty in mind, we plan to investigate
the areas that contribute anywhere from 0.5 % to 5 % to the dose uncertainty, but
do not yet have a consensus on the optimal approach:
1. Darkening due to scanner lamp
2. Scanner fluctuation
3. Scanner noise and pre-scanning
4. Mathematical description of calibration curve
5. Scanner uniformity in the lateral direction
6. EBT film development after irradiation
As a relatively new but rapidly maturing field, the literature has reached
consensus on the following subject:
1. EBT film is superior to earlier versions of radiochromic films.
47

2. The use of film readers other than flatbed scanners is not recommended.
3. EBT film is expected to be energy and radiation type independent for
megavoltage photon and electron beams, due to a lack of literature
claiming otherwise. The energy independence claim in literature, however,
is often at the 5 % level, which is not acceptable for a standards lab, or
even clinical applications. The energy independence of EBT film will be
verified in this project.
In this project, films other than the EBT model or film readers other than the
Epson 10000XL will not be investigated, but the energy independence of the
EBT film will be verified. After addressing individual aspects of EBT film
dosimetry, we plan to compare dose distributions measured with EBT film with
dose distributions measured with other one or two-dimensional dosimeters.
Rather than simply extracting a Gamma Index, we plan to measure the
differences between different methods of dose measurement quantitatively and
see how EBT film compares with other instruments. Both absolute and relative
dose measurement using EBT film will be investigated.
48

Chapter 3 EBT protocol established at NRC
3.1 Overview of protocol The GafChromic EBT film dosimetry protocol established at NRC utilizes the
Epson 10000XL scanner, as it is the model recommended by ISP. This protocol
follows the general EBT dosimetry workflow described in the literature, but each
step is customized for the highest accuracy possible rather than high throughput.
3.1.1 Overview of experiment In the calibration phase, a piece of film is cut into 8 pieces, and each piece is
given a dose between 0 and 8 Gy. Approximately 24 hours after irradiation, the
film is read with the 10000XL scanner, using a PMMA template to ensure that all
films are positioned at the same place. A preview is generally performed to
reduce the effect of scanner lamp warm-up effect and ensure accurate positioning
of film on the scanner bed. In both calibration and measurement phase, a piece of
blank film is retained from the particular sheet of EBT film as a reference piece.
This reference piece is placed in the same environment as the irradiated pieces,
but never exposed to any ionization radiation. Currently all film experiments are
performed in Virtual Water™ phantom6, where the environment of the film does
not have any significant effect on measurement. In the future, EBT film may be
used in a water phantom, and the effect of water on EBT film can be accounted
for by submerging the reference piece in water for the same length of time as the
irradiated piece, without the radiation exposure. In analysis, the reference piece is
defined as zero optical density. This approach was inspired by Devic et al
(2005)'s environmental effect correction technique, but we do not use the opaque
cardboard in our protocol (see page 25). The scanned calibration pieces resulted
in 8-bit RGB images in TIFF format, which are analyzed to produce a calibration
curve.
In the measurement phase, a large piece of film is cut from a blank EBT film of
the same batch, and exposed in the radiation field of interest. This film is then
scanned approximately 24 hours after irradiation with its reference piece. The
6 Med-Cal, Verona, WI
49

scanned image is then converted to an optical density map, as optical density,
rather than pixel value, is the parameter used in the calibration curve. This optical
density map is then corrected for scanner uniformity effects, and converted to a
dose map using the calibration curve. Since the film is scanned at 96 dpi, or
0.265 mm/pixel, the dose map is often re-sampled to reduce individual pixel
uncertainty at the expense of spatial resolution. The typical pixel size in the final
dose map is 1.3 × 1.3 mm2.
3.1.2 Software packages used in this protocol
Matlab®7 is the software package most commonly reported in the literature (Devic
et al 2005, Battum et al 2008). In this project, Matlab 2008a with the add-on
image analysis package was installed on a PC running Windows Vista Ultimate
64 bit edition. The 64 bit edition was chosen to utilize the eight gigabytes of
memory available on the PC. Custom-written Matlab scripts were used for both
calibration and dose measurement phases. A specific script is written for each
task, and no Graphical User Interface (GUI) was designed. This approach was to
ensure that all data manipulation is known before a script is executed, to protect
the integrity of measurement. The software EpsonScan, shipped with the scanner,
was used to operate the scanner and acquire the image. The scanner was also
shipped with the SilverScan software, which some authors in the literature have
used to automatically repeat a scan multiple times (Battum et al, 2008).
Unfortunately, such software was not compatible with the 64-bit Vista; therefore
repeated scans were performed by hand. In the literature, ImageJ is another
popular software package in image analysis, but it was also not compatible with
64 bit Vista, and not used in this project. Microsoft Excel was used to analyze
both calibration curve and dose profiles produced by custom-written Matlab
scripts.
7 The Mathworks Inc. Natick, MA
50

3.2 Investigation of repeated scanning and temperature effects of 10000XL 3.2.1 Measured temperature effect
In the literature, increasing optical density with repeated scanning has been
reported, but no consensus has been reached about the cause of this effect. The
primary concern is whether this effect is due to a permanent darkening of the film
by the scanner lamp or whether it is a temporary effect due to increasing
temperature of scanner bed. To verify this, we attached the sensor of a Digi-
Sense8 thermometer to the scanner bed using tape, and repeatedly scanned a piece
of film while recording the temperature. The Digi-Sense thermometer is traceable
to a primary standard and has temperature accuracy of better than 0.5 ºC. Figure
3.1 shows the temperature effect on EBT film measurement. Compared to effects
reported in the literature about the 1680Pro, the temperature effect on the
10000XL is less than 0.6 % when measured in pixel values. The steep drop in the
beginning is due to lamp start-up effect, as no preview was performed.
3.2.2 Significance of temperature effect
In the experiment described by Figure 3.1, 100 scans at 300 DPI resolution were
required to bring the temperature from room temperature to 30 ºC. At the 96 DPI
used in this protocol, the scanner lamp stayed on for a much shorter time, and 100
consecutive scans of the entire scanner bed produced a significantly lower
temperature than 30 ºC. Since our scan involves only one scan per film, we
expect the temperature effect to be insignificant.
8 Thermo Fisher Scientific, Waltham, MA
51
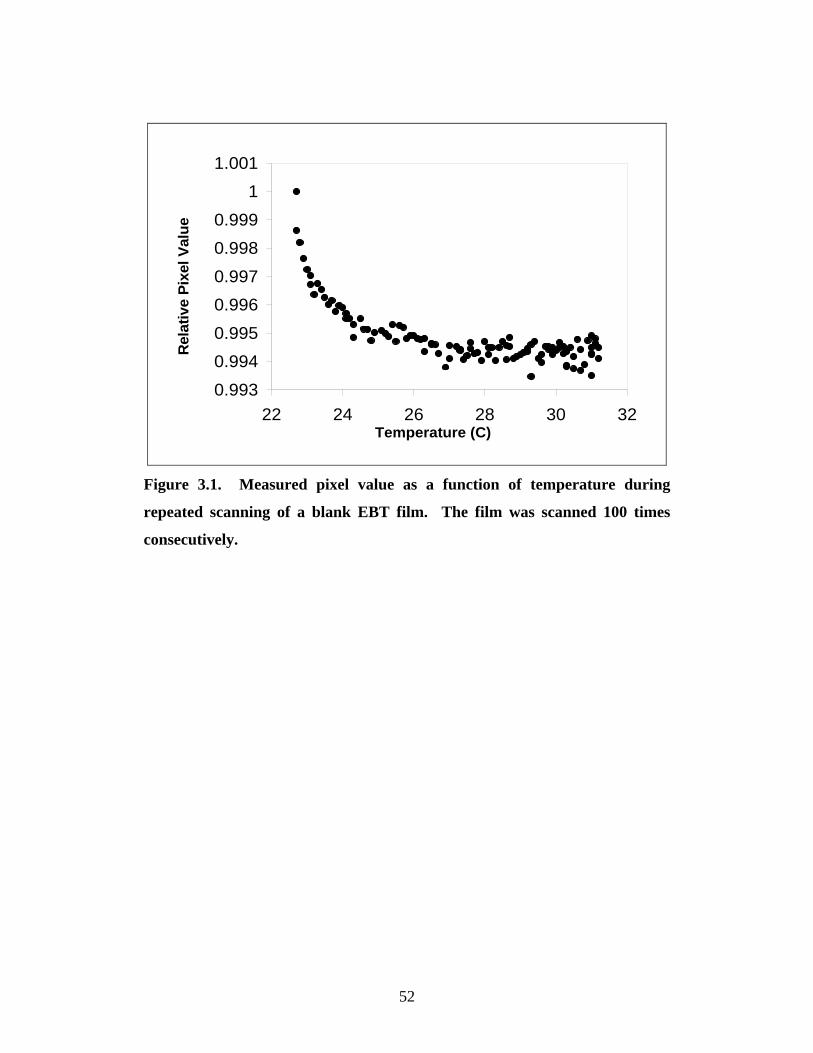
0.993
0.9940.995
0.9960.997
0.9980.999
11.001
22 24 26 28 30 32Temperature (C)
Rel
ativ
e Pi
xel V
alue
Figure 3.1. Measured pixel value as a function of temperature during
repeated scanning of a blank EBT film. The film was scanned 100 times
consecutively.
52
3.3 Two-state fluctuation and reference piece correction 3.3.1 Evidence of scanner response fluctuation
The investigation of repeated scanning in literature only focuses on gradual
changes in scanner response, instead of a distribution of responses when there is
no systematic trend. We repeatedly scanning a blank film at 96 DPI over all small
area, which does not cause any significant scanner warm-up effect due to the short
scan duration. Without the scanner warm-up effect, we observed a two-state
fluctuation behaviour of the 10000XL scanner, as shown in Figure 3.2. Further
investigation showed that this fluctuation is non-random and unpredictable and
averaging of multiple scans can not reduce this effect. If this effect is not
corrected, it would add up to 1.3 % to the uncertainty in the measured dose. This
finding is consistent with “day to day” scanner stability reported in literature,
where up to 0.7 % (1 SD) uncertainty was reported. To correct this effect, a
reference piece scanning approach was implemented in our protocol.
3.3.2 Reference piece correction implemented in our protocol
Further investigation showed that this fluctuation affects measurements of all
doses in the same directions and about the same magnitude, and the fluctuation is
uniform across the scanner bed. To correct for it, a reference piece of blank film
is placed next to the film of interest. Figure 3.3 shows an example of this
approach, where a PMMA template is placed on the scanner bed and aligned to
the edge of scanner bed. This template also ensures that the calibration film is
always placed at the same position on the scanner bed and does not get
accidentally rotated. In calibration phase, because the film pieces are scanned
sequentially, a separate piece of EBT film cut from another sheet is placed next to
the film of interest to serve as the reference piece. This extra piece of film from
another sheet is necessary because the unirradiated film piece cut from the
calibration sheet is scanned at the same position as the irradiated pieces. In the
measurement phase, the unirradiated piece cut from the same sheet of EBT film as
the experimental piece is used as the reference piece and placed next to the
experimental piece in scanning. This unirradiated piece serves as both the
53
reference and the zero-dose piece. Note that the unirradiated piece is not scanned
at the same position of scanner bed as the experimental piece in the measurement
phase, because we desire a simpler protocol. This difference was found to have
negligible effect on measurement accuracy.
Note that although this behaviour is unpredictable, the magnitude of fluctuation is
still small compared to uncertainties reported in the literature. We believe that
this fluctuation can be attributed to the scanner lamp calibration process, rather
than ADC instability of the scanner. Such fluctuations can also be observed in
Figure 2.15, which showed day-to-day fluctuations of the scanner at the 0.7 %
level.
3.3.3 Reference piece correction’s contribution to EBT film dosimetry
protocol.
The reference piece correction technique was employed in all EBT film
measurements, including the study of temperature effect presented in section 3.2.
The results shown in Figure 3.1 were already corrected for scanner fluctuation,
allowing the scanner start-up effect and temperature effect to be observed. The
long term darkening effect investigation of EBT film presented in section 3.8 was
also made possible by the reference piece correction technique. By removing
scanner fluctuation effects, we measured the small increases in optical density
after the first 24 hours. Without this technique, it would not be possible to
measure the optical density of the same piece of film with an accuracy of 0.3 % or
better over the course of three months.
54
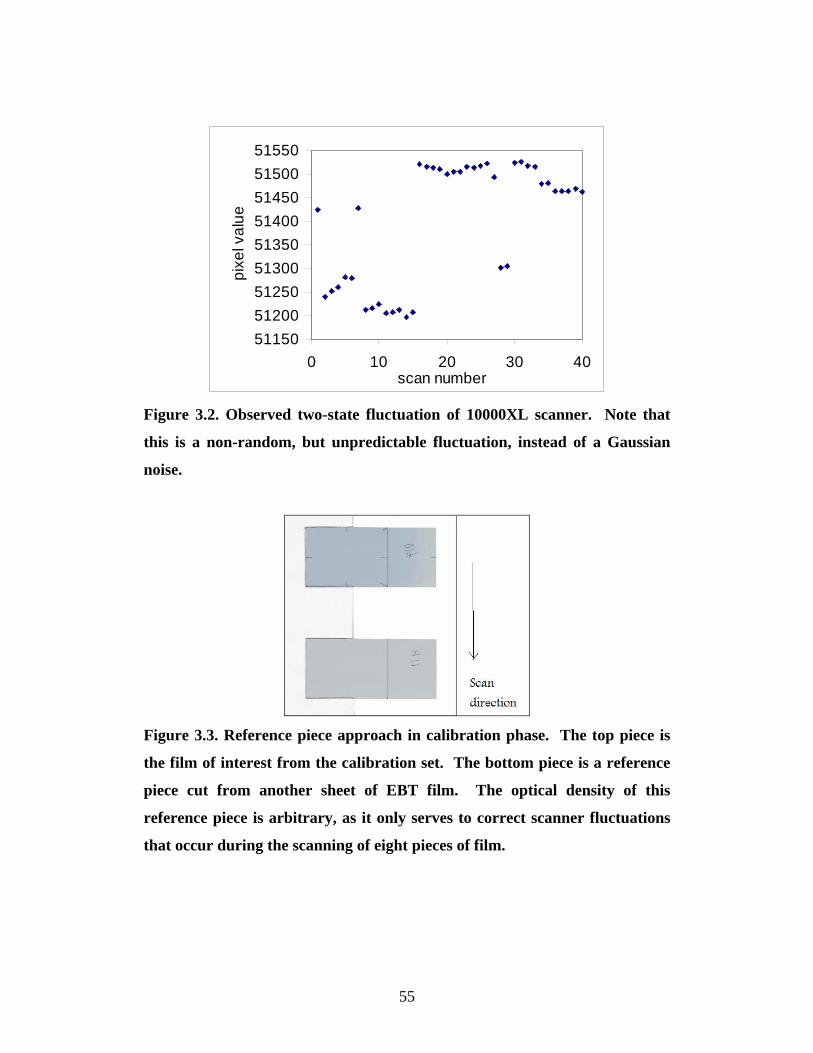
511505120051250513005135051400514505150051550
0 10 20 30 40scan number
pixe
l val
ue
Figure 3.2. Observed two-state fluctuation of 10000XL scanner. Note that
this is a non-random, but unpredictable fluctuation, instead of a Gaussian
noise.
Figure 3.3. Reference piece approach in calibration phase. The top piece is
the film of interest from the calibration set. The bottom piece is a reference
piece cut from another sheet of EBT film. The optical density of this
reference piece is arbitrary, as it only serves to correct scanner fluctuations
that occur during the scanning of eight pieces of film.
55

3.4 Resolution and uncertainties of EBT film 3.4.1 Sources of noise and impact on resolution
Extensive literature has been published on the single-pixel uncertainty of EBT
film dosimetry. What the literature lacks is the de-coupling of the three
components of noise: noise from scanner, noise in a blank piece of EBT film (e.g.
due to the polyester cover), and noise due to the active component of EBT film.
In this project, we studied each component separately, and arrived at the
conclusion that the dominant effect is the noise due to the active component of
EBT film. In other words, the finite size of EBT crystals produce noise that is
higher than electronic noise of scanner or the noise exhibited by a blank piece of
EBT film. Since this effect only surfaces after a piece of film is irradiated, pre-
scanning the film before irradiation does not significantly reduce the single-pixel
noise of EBT film measurement. The low electronic noise of the scanner
compared to film grain noise also makes repeated scanning unnecessary; therefore
we only scan the film once in this protocol. The noise due to film crystal size is
the ultimate limiting factor in resolution of our EBT film dosimetry protocol. In
the following sections, we will present the levels of scanner electronic noise,
blank film noise, and irradiated film noise.
3.4.2 Scanner electronic noise
To isolate noise from the 10000XL scanner, a blank transparency slide was
scanned at 96 DPI, which is the scanning resolution used in EBT film scanning.
A line profile was taken through the resulting image to provide detailed
information on noise levels of a blank media. In this experiment, we consider a
worst case scenario where all noise measured in scanning a blank transparency
slide is attributed to the scanner electronic noise, rather than any non-uniformity
of transparency slide. In other words, we attempt to find the upper limit of
scanner electronic noise. As shown in Figure 3.4, the image pixels showed no
systematic trends through a 7 cm line, starting at the 7 cm position and ending at
the 14 cm position, and the distribution of pixel values appeared to be random. A
histogram of the same data, shown in Figure 3.5, demonstrated that the noise is
56

Gaussian, with a standard deviation of 0.4 %. The lack of systematic trend and
the Gaussian distribution of noise indicates that single-pixel noise level due to the
scanner can be reduced by reducing the spatial resolution. Since the targeted
spatial resolution of this protocol is 1 mm2, 25 pixels in a 96 DPI image can be
averaged to reduce the spatial resolution to 1 mm2 and noise level to the order of
0.1 %.
scanner noise in scanning a transparency
0.99
0.995
1
1.005
1.01
75 85 95 105 115 125 135 145
position (mm)
rela
tive
pixe
l val
ue
Figure 3.4. Relative pixel value of a line profile through the image of a
transparency.
Figure 3.5. Histogram of scanner electronic noise at 96 DPI. A Gaussian fit
of the histogram was also shown in the figure.
57
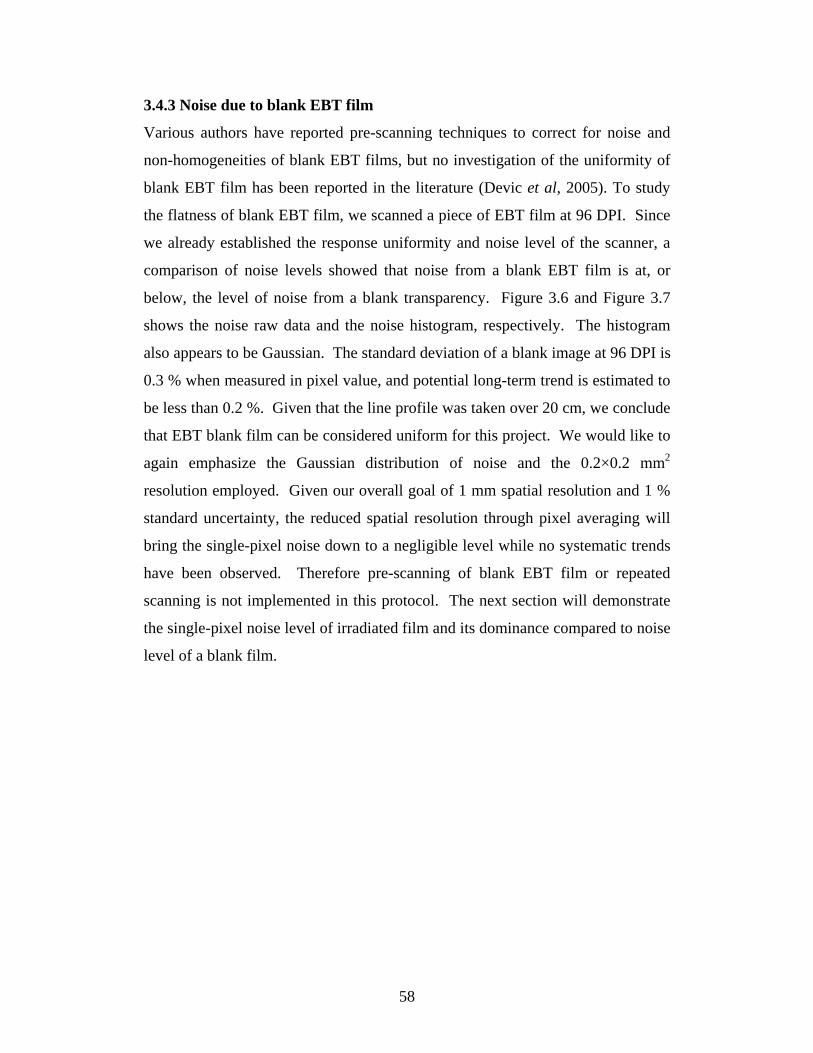
3.4.3 Noise due to blank EBT film
Various authors have reported pre-scanning techniques to correct for noise and
non-homogeneities of blank EBT films, but no investigation of the uniformity of
blank EBT film has been reported in the literature (Devic et al, 2005). To study
the flatness of blank EBT film, we scanned a piece of EBT film at 96 DPI. Since
we already established the response uniformity and noise level of the scanner, a
comparison of noise levels showed that noise from a blank EBT film is at, or
below, the level of noise from a blank transparency. Figure 3.6 and Figure 3.7
shows the noise raw data and the noise histogram, respectively. The histogram
also appears to be Gaussian. The standard deviation of a blank image at 96 DPI is
0.3 % when measured in pixel value, and potential long-term trend is estimated to
be less than 0.2 %. Given that the line profile was taken over 20 cm, we conclude
that EBT blank film can be considered uniform for this project. We would like to
again emphasize the Gaussian distribution of noise and the 0.2×0.2 mm2
resolution employed. Given our overall goal of 1 mm spatial resolution and 1 %
standard uncertainty, the reduced spatial resolution through pixel averaging will
bring the single-pixel noise down to a negligible level while no systematic trends
have been observed. Therefore pre-scanning of blank EBT film or repeated
scanning is not implemented in this protocol. The next section will demonstrate
the single-pixel noise level of irradiated film and its dominance compared to noise
level of a blank film.
58

0.99
0.995
1
1.005
1.01
0 50 100 150 200 250
position (mm)
norm
aliz
ed p
ixel
val
ue
Figure 3.6. Relative pixel value of blank EBT film through a line profile of 20
cm. A comparison of this figure and figure 3.4.2 showed that blank EBT film
does not introduce additional noise.
Figure 3.7. Histogram of pixel value distribution of blank EBT film, taken
through a line profile at 96 DPI over a distance of 20 cm. The histogram
also appears to be Gaussian.
59

3.4.4 Noise due to irradiated film
Based on existing literature, the grain size of EBT film is expected to be larger
than radiographic films and previous versions of radiochromic films, as the
crystals used in model EBT are elongated. Such microstructure of EBT crystals
leads to a non-uniform distribution of sensitive material at the 0.2 mm level.
Since both clinical linear accelerators and Cobalt-60 machines produce radiations
that are expected to be smooth at the millimetre level, an inspection of noise level
of an EBT film irradiated in an expected flat field can provide information about
the noise and spatial resolution of EBT film. To do so, we irradiated a 10x10 cm2
sheet of EBT film at 5 cm depth in a virtual water phantom in the 6 MV Elekta
beam at 1 m. The field size is 10 x 10 cm2 and dose gradient is expected to be
small for a flattened open field. A 1.3 x 1.3 cm2 square at the centre of field was
chosen as area of interest, because the small area reduces the effect of dose
gradients. Existing data on field flatness indicate that the dose gradient over
1.3 cm is negligible. When scanned at 96 DPI, the relative pixel values showed
Gaussian behaviour, with standard deviation of 0.8 %. The histogram of the
normalized pixel value is shown in Figure 3.8. A Gaussian fit of the histogram
was also shown in Figure 3.8, demonstrating the Gaussian shape of the noise.
Compared to the pixel noise of a blank EBT film, the pixel noise of an irradiated
EBT film is the dominant effect. Further investigation of irradiated films scanned
at 300 DPI showed much higher noise levels, and confirmed the fact that noise
due to EBT film crystals is the limiting factor on the spatial resolution of EBT
film dosimetry. Based on this result, all films are scanned at 96 DPI, and 0.2 mm
is established as the limiting spatial resolution of EBT films. Note that the
approximately Gaussian distribution of the noise would suggest that reducing
spatial resolution can improve the accuracy of EBT film dosimetry to better than
0.5 %. Unfortunately, another limiting effect, the sensitivity fluctuations due to
manufacturing defects, becomes a dominant factor in dose measurements at the
centimetre level. The next section is dedicated to this effect.
60

Figure 3.8. Relative pixel value of irradiated EBT film measured over a
1.3 cm by 1.3 cm square, where dose was known to be flat. A Gaussian fit of the
histogram is also shown.
61

3.4.5 EBT film uniformity due to coating process
Various authors have reported that the ultimate limit of any EBT film dosimetry
protocol is the uniformity of EBT film (Battum et al, 2008). The non-uniformity
of EBT film is “non-random and unpredictable”, and cannot be known before
irradiation was performed. To investigate the behaviour of non-uniformity, we
irradiated four 5 cm × 25 cm strips of EBT film cut from the same sheet in a
virtual water phantom at 5 cm depth in a 10 × 10 cm2 wedge field, with the long
edge of film strip along the wedge direction. All four strips were given exactly
the same dose, with an Exradin9 A19 Farmer-type chamber positioned at 13 cm
depth as a monitor. The measurements from the A19 chamber showed that doses
delivered to the four film strips were identical at the 0.2 % level. All films were
irradiated within one hour and scanned more than 24 hours after. The films were
stored in the same envelope at all times. Therefore film darkening and
environmental effects can be assumed to be the same. The measured optical
density profiles of the four films showed differences between film strips of up to
2 %, and film uniformity behaved like an unpredictable step function. Figure 3.9
shows the four optical density profiles of the four strips irradiated in the same
wedge field. Further analysis of the dose wedge data showed that EBT film
sensitivity has a peak-to-peak range of 2.5 %, with a non-Gaussian distribution.
In Figure 3.9, pieces A and B showed the largest difference, with consistent
sensitivity differences between 2 and 2.5 % through the entire dose wedge, while
pieces C and D showed fluctuating sensitivities that lie between pieces A and B.
The non-uniformities of film show a patch-like pattern, with each drop or rise of
sensitivity lasting 1 cm or more. Such observation shows that film uniformity can
not be improved by reducing spatial resolution, as the film sensitivity does not
show a Gaussian behaviour. Note that a 2.5 % peak-to-peak sensitivity does not
contradict our stated goal of 1 %, 1 SD standard uncertainty, as it translates to
1.3 % peak-to-mean range. Assuming a uniform distribution of uniformity, the
standard uncertainty is still less than 1 %. Such behaviour of uniformity is of
great concern in relative dose distribution; however, as relative dose profiles are
9 Standard Imaging, Middleton, WI
62

generally normalized to an arbitrary point on the film, usually the point of
maximum dose. If the film sensitivity at the point of maximum dose differs from
sensitivity at the point of interest by 2 % or more, such as pieces A and B in
Figure 3.9, an error of 2 % can be introduced in relative dose profiles. In this case,
averaging of several pieces of film is the only solution in reducing uncertainties
due to film uniformity.
The film strips in the wedge field experiment provide an example of film non-
uniformity, but it is still desirable to have a direct demonstration using a known
uniform dose. Unfortunately, we do not currently have square fields that are flat
to the 0.5 % level, as the Elekta 6MV photon beam is only flat at the 3 % level for
a 10 × 10 cm open field, while 10 MV and 25 MV show larger variations.
Therefore we chose to use a one-dimensional uniform dose source, a Strontium-
90 check source mounted on a Velmex™ linear translational stage. The linear
stage was controlled by a computer and the Strontium-90 source moves slowly
along a 12 cm long strip of EBT film. Since the output of the Sr-90 source is
constant, and the distance between source and film is also constant, a uniform line
of dose is expected. As shown in figure 3.10, however, we observed a 2 %
sudden drop between the first and second half of the film, when we take a dose
profile along the direction of travel. Such fluctuation can only be attributed to the
lack of uniformity of EBT film.
Having demonstrated the dominance of a "non-random and unpredictable" non-
uniformity due to coating, it is desirable to devise a method of reducing the
uncertainty caused by this non-uniformity. Since this non-uniformity only
surfaces after irradiation, a potential solution is the double exposure technique,
introduced by Klassen et al for the MD-55 film. (1997) In this technique, one or
more blank EBT films are exposed to a radiation field known to be flat within
0.5%. This exposure is called the pre-irradiation. After pre-irradiation, the films
are left in storage for a day, and then scanned. Such scanning reveals the non-
uniformity introduced in the film coating process. Here we assume that the non-
uniformity correspond to fluctuations in the concentration of EBT crystal across
the film surface, therefore the scanned image of the pre-irradiated film provides a
63

first-order correction that can be applied in the experimental irradiation. Such a
technique can be applied to both absolute and relative dose measurements. In the
case of absolute dose measurement, it is necessary to accurately measure the
absolute dose delivered in the pre-irradiation process. In addition, it is also
necessary to account for the darkening effect of EBT film. Section 3.8 will
explain the darkening effect in detail, but the conclusion was that environmental
conditions caused unpredictable darkening of EBT film even after 24 hours post
irradiation. The magnitude of long-term darkening is up to 5 % over the period of
3 months. Such effects make pre-irradiation approach difficult to implement in
absolute dose measurements, as the darkening effect of both pre-irradiation and
actual field of interest is combined in the final film optical density measurement.
For relative dose measurements, darkening of film is less of a concern, as a
uniformly irradiated EBT film will darken uniformly. The remaining obstacle for
pre-irradiation of EBT film used in relative dose measurement is difficulty in
achieving a radiation field flat to the level of 0.5 % or better. The best candidate
at this institution is the NRC Co-60 beam, which can potentially achieve such
flatness if source-surface distance is increased to 2 meters or more.
Although the pre-irradiation technique has the potential to further reduce
uncertainties in dose measurements, we do not have access to the Co-60 beam
during this project, and this technique was not implemented. The alternative to
this approach is repeating the measurement two or more times using different
films and taking the average of measured dose distributions. Battum et al (2008)
provided detailed analysis of uncertainty reductions achieved in utilizing three
sheets of film in dose distribution measurements, and showed that the reduction in
uncertainty is consistent with the central limit theorem. Despite the extra cost in
film, averaging of multiple films is an attractive alternative to pre-irradiation if
the desired measurement is one-dimensional, because film strips, rather than
whole sheets of film, can be used.
64

0.27
0.29
0.31
0.33
0.35
0.37
0.39
0.41
-60.0 -40.0 -20.0 0.0 20.0 40.0
position (mm)
net O
D
Piece APiece BPiece CPiece D
Figure 3.9. Net optical density of four film strips irradiated to identical doses
in a wedge field. Note the consistent difference between piece A and B, while
piece C and D fluctuate in between the two.
0.97
0.98
0.99
1
1.01
1.02
1.03
30 50 70 90 110 130 150
distance (mm)
rela
tive
dose
Figure 3.10. Dose profile produced by a Strontium 90 check source mounted
on a Velmex linear translational stage.
65
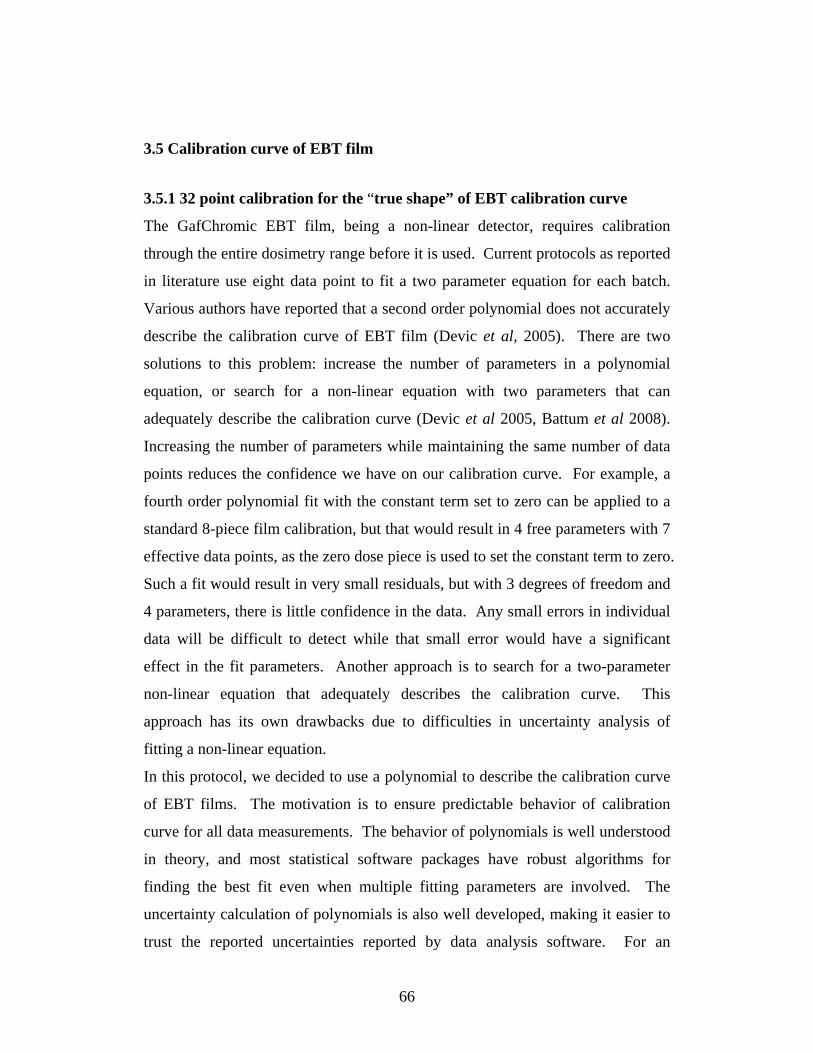
3.5 Calibration curve of EBT film
3.5.1 32 point calibration for the “true shape” of EBT calibration curve
The GafChromic EBT film, being a non-linear detector, requires calibration
through the entire dosimetry range before it is used. Current protocols as reported
in literature use eight data point to fit a two parameter equation for each batch.
Various authors have reported that a second order polynomial does not accurately
describe the calibration curve of EBT film (Devic et al, 2005). There are two
solutions to this problem: increase the number of parameters in a polynomial
equation, or search for a non-linear equation with two parameters that can
adequately describe the calibration curve (Devic et al 2005, Battum et al 2008).
Increasing the number of parameters while maintaining the same number of data
points reduces the confidence we have on our calibration curve. For example, a
fourth order polynomial fit with the constant term set to zero can be applied to a
standard 8-piece film calibration, but that would result in 4 free parameters with 7
effective data points, as the zero dose piece is used to set the constant term to zero.
Such a fit would result in very small residuals, but with 3 degrees of freedom and
4 parameters, there is little confidence in the data. Any small errors in individual
data will be difficult to detect while that small error would have a significant
effect in the fit parameters. Another approach is to search for a two-parameter
non-linear equation that adequately describes the calibration curve. This
approach has its own drawbacks due to difficulties in uncertainty analysis of
fitting a non-linear equation.
In this protocol, we decided to use a polynomial to describe the calibration curve
of EBT films. The motivation is to ensure predictable behavior of calibration
curve for all data measurements. The behavior of polynomials is well understood
in theory, and most statistical software packages have robust algorithms for
finding the best fit even when multiple fitting parameters are involved. The
uncertainty calculation of polynomials is also well developed, making it easier to
trust the reported uncertainties reported by data analysis software. For an
66

unknown function known to cross the origin, such as the calibration curve of EBT
films, Taylor’s theorem also states that a polynomial can accurately describe a
finite portion of the equation. Non-linear equations, on the other hand, do not
enjoy such mathematical support.
If we want to accurately describe the calibration curve with a polynomial, one
approach would be to have a large number of calibration data points, and apply a
higher order polynomial fit. Such an approach would provide robust fitting that
sufficiently describes the calibration curve of the film. Figure 3.11 shows an
example of such approach, using the 6 MV beam of an Elekta Precise linear
accelerator. The 32 pieces of film were cut from a single sheet of 8 inch by 10
inch EBT film, irradiated individually and scanned one day after irradiation.
From the graph, we can see that the 4 parameter polynomial adequately describes
the shape of the calibration curve. A further inspection of residuals in Figure 3.11
showed no trend in residuals. The residuals are shown in Figure 3.12. Note that
the residual shows a non-Gaussian distribution, as demonstrated by the histogram
shown in Figure 3.13, because the film uniformity distribution is non-Gaussian.
In contrast, the residual of a two-parameter fit using the same data set showed a
strong systematic trend, while a three-parameter fit showed local trends and
residuals twice as large as that of 4-parameter fit. Given the large degree of
freedom and relatively small number of parameters, we conclude that this
approach produces an accurate calibration curve with high degree of confidence.
The drawback of this approach is that each 32-point calibration requires three
hours of experimental time. Given that each batch of EBT film may have
different calibration curve, it is not practical to perform routine calibrations using
a 32 piece approach. Therefore, a hybrid calibration approach was considered.
Such an approach was inspired by Battum et al’s EBT calibration protocol, where
a two-parameter equation was used to describe each batch of EBT film, but one of
the two parameters was a global parameter fixed for all EBT films, and only the
second parameter was allowed to change for each batch. In our hybrid calibration
approach, individual batch calibration is also limited to one floating parameter.
67
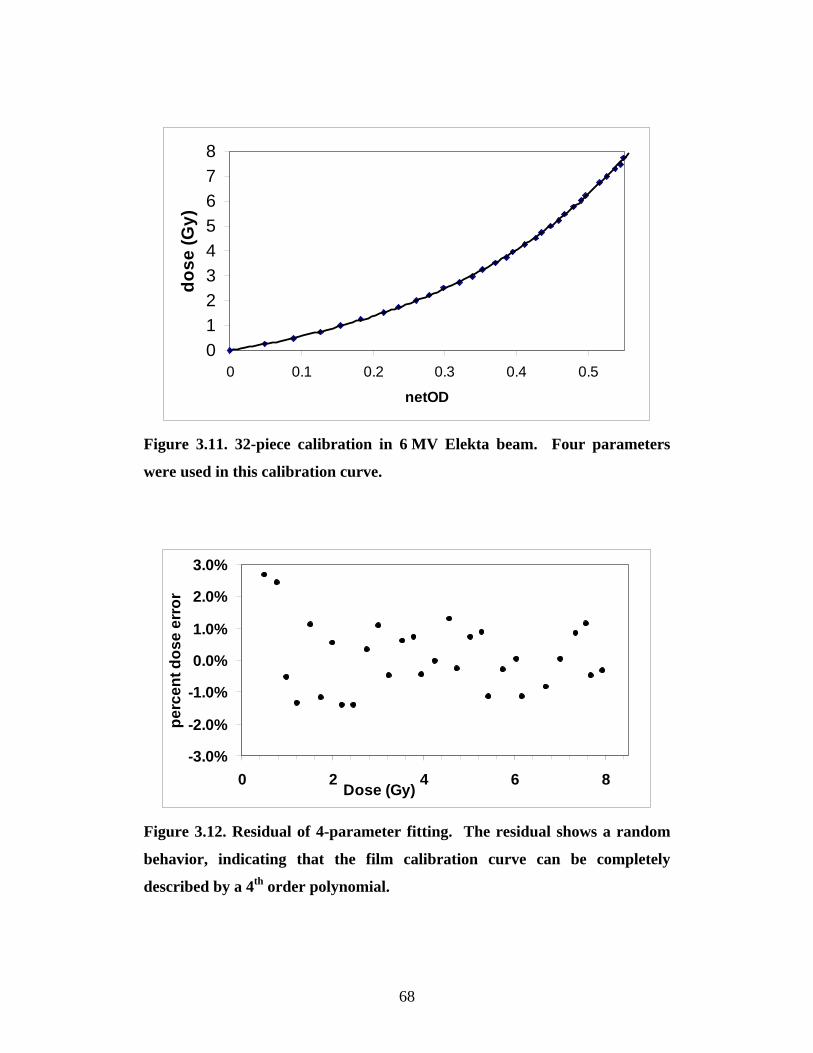
012345678
0 0.1 0.2 0.3 0.4 0.5
netOD
dose
(Gy)
Figure 3.11. 32-piece calibration in 6 MV Elekta beam. Four parameters
were used in this calibration curve.
-3.0%
-2.0%
-1.0%
0.0%
1.0%
2.0%
3.0%
0 2 4 6 8Dose (Gy)
perc
ent d
ose
erro
r
Figure 3.12. Residual of 4-parameter fitting. The residual shows a random
behavior, indicating that the film calibration curve can be completely
described by a 4th order polynomial.
68

Figure 3.13. Histogram of the residual shown in Figure 3.12. It is not a
Gaussian distribution.
69
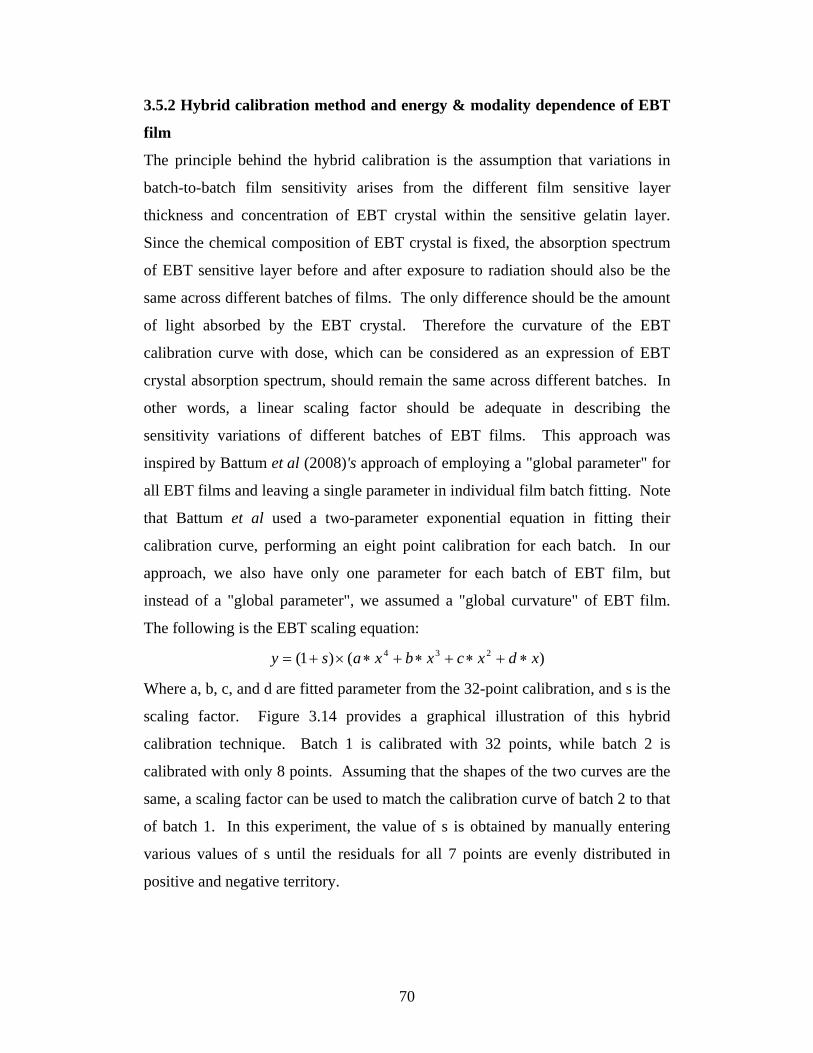
3.5.2 Hybrid calibration method and energy & modality dependence of EBT
film
The principle behind the hybrid calibration is the assumption that variations in
batch-to-batch film sensitivity arises from the different film sensitive layer
thickness and concentration of EBT crystal within the sensitive gelatin layer.
Since the chemical composition of EBT crystal is fixed, the absorption spectrum
of EBT sensitive layer before and after exposure to radiation should also be the
same across different batches of films. The only difference should be the amount
of light absorbed by the EBT crystal. Therefore the curvature of the EBT
calibration curve with dose, which can be considered as an expression of EBT
crystal absorption spectrum, should remain the same across different batches. In
other words, a linear scaling factor should be adequate in describing the
sensitivity variations of different batches of EBT films. This approach was
inspired by Battum et al (2008)'s approach of employing a "global parameter" for
all EBT films and leaving a single parameter in individual film batch fitting. Note
that Battum et al used a two-parameter exponential equation in fitting their
calibration curve, performing an eight point calibration for each batch. In our
approach, we also have only one parameter for each batch of EBT film, but
instead of a "global parameter", we assumed a "global curvature" of EBT film.
The following is the EBT scaling equation:
)()1( 234 xdxcxbxasy ∗+∗+∗+∗×+=
Where a, b, c, and d are fitted parameter from the 32-point calibration, and s is the
scaling factor. Figure 3.14 provides a graphical illustration of this hybrid
calibration technique. Batch 1 is calibrated with 32 points, while batch 2 is
calibrated with only 8 points. Assuming that the shapes of the two curves are the
same, a scaling factor can be used to match the calibration curve of batch 2 to that
of batch 1. In this experiment, the value of s is obtained by manually entering
various values of s until the residuals for all 7 points are evenly distributed in
positive and negative territory.
70

Figure 3.14. A graphical illustration of the principle behind hybrid
calibration technique. The dose measured by batch 2 is scaled to the curve of
batch 1 through the scaling factor s introduced above.
The results of scaling are shown in figure 3.15 where the residuals of scaling the
eight-point calibrations of three batches were plotted against the dose given.
Batch one is from the same batch as the 32 point calibration, while batch three
contains two boxes. Table 1 shows the magnitude of scaling applied for each
batch. Batch one and two show film sensitivity differences below the film
uniformity variation level. The two calibration curves of batch three showed
strong trends in residuals when scaled to the equation derived from 32 point
calibration, and their film sensitivity different from batch one and two by more
than two percent. To make a comparison, we deliberated scaled the calibration
curves of the two boxes of batch three so that their 8 Gy point match. The rest of
their fitting residuals differ by up to 2 %. This large difference suggests that the
difficulty in scaling calibration curve of batch three may be attributed to poor film
uniformity of the third batch. An email inquiry with EBT film supplier indicated
that there has been no change to film production process. Results from more
71

batches of films will be needed before this hybrid calibration method can be used
to obtain uncertainties below 1 %.
-2.0%
-1.0%
0.0%
1.0%
2.0%
3.0%
4.0%0 2 4 6 8
Dose (Gy)D
iffer
ence
6 MV Batch 1 6 MV Batch 2 6MV batch 3, box 1 6MV batch 3, box 2
Figure 3.15. Residual of various batch's calibration when scaled to 32-point
calibration curve.
Beam and film batch s ( % )
6 MV photon batch 1 0.63
6 MV photon batch 2 -0.2
6 MV photon batch 3, Box 1 -3.0
6 MV photon batch 3, Box 2 -2.3
Table 1. Scaling percentage factors for various 8-point calibrations. S is the
parameter introduced in section 3.5.2. Note that batch 1 and 2 have
sensitivity differences below the level of film uniformity. The two boxes of
batch 3 show similar sensitivity, which is expected as they have the same
batch number.
72
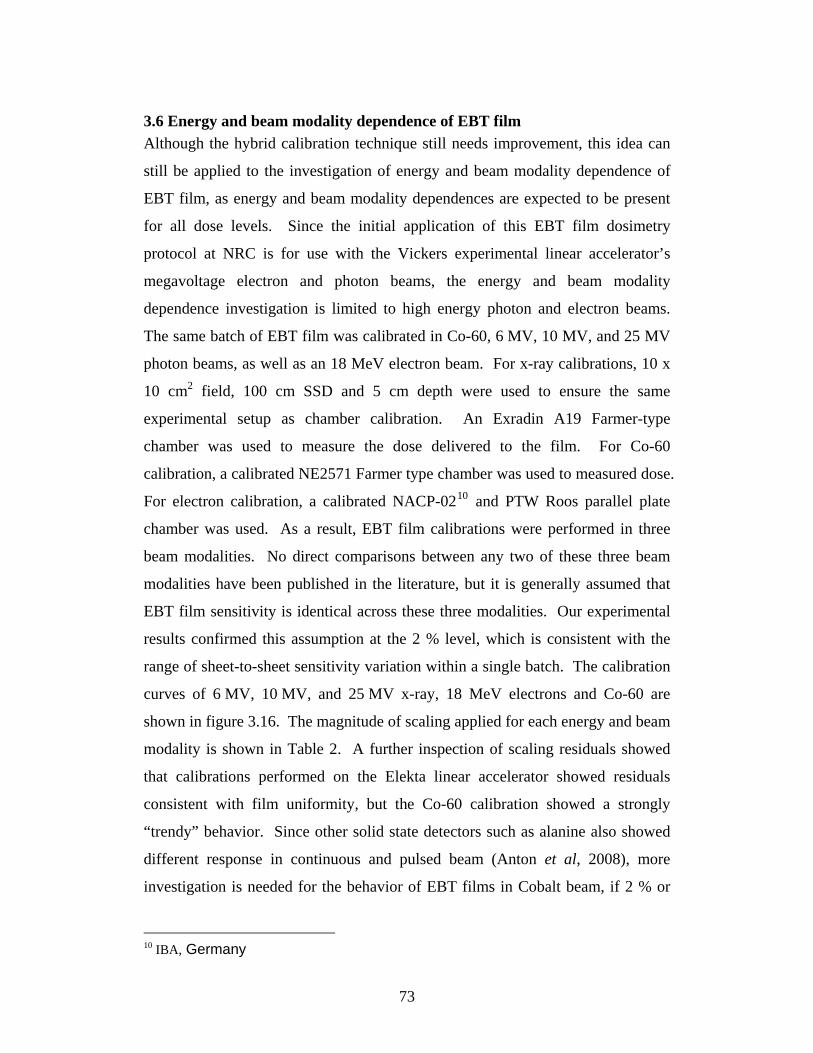
3.6 Energy and beam modality dependence of EBT film Although the hybrid calibration technique still needs improvement, this idea can
still be applied to the investigation of energy and beam modality dependence of
EBT film, as energy and beam modality dependences are expected to be present
for all dose levels. Since the initial application of this EBT film dosimetry
protocol at NRC is for use with the Vickers experimental linear accelerator’s
megavoltage electron and photon beams, the energy and beam modality
dependence investigation is limited to high energy photon and electron beams.
The same batch of EBT film was calibrated in Co-60, 6 MV, 10 MV, and 25 MV
photon beams, as well as an 18 MeV electron beam. For x-ray calibrations, 10 x
10 cm2 field, 100 cm SSD and 5 cm depth were used to ensure the same
experimental setup as chamber calibration. An Exradin A19 Farmer-type
chamber was used to measure the dose delivered to the film. For Co-60
calibration, a calibrated NE2571 Farmer type chamber was used to measured dose.
For electron calibration, a calibrated NACP-0210 and PTW Roos parallel plate
chamber was used. As a result, EBT film calibrations were performed in three
beam modalities. No direct comparisons between any two of these three beam
modalities have been published in the literature, but it is generally assumed that
EBT film sensitivity is identical across these three modalities. Our experimental
results confirmed this assumption at the 2 % level, which is consistent with the
range of sheet-to-sheet sensitivity variation within a single batch. The calibration
curves of 6 MV, 10 MV, and 25 MV x-ray, 18 MeV electrons and Co-60 are
shown in figure 3.16. The magnitude of scaling applied for each energy and beam
modality is shown in Table 2. A further inspection of scaling residuals showed
that calibrations performed on the Elekta linear accelerator showed residuals
consistent with film uniformity, but the Co-60 calibration showed a strongly
“trendy” behavior. Since other solid state detectors such as alanine also showed
different response in continuous and pulsed beam (Anton et al, 2008), more
investigation is needed for the behavior of EBT films in Cobalt beam, if 2 % or
10 IBA, Germany
73

better accuracy is required. Figure 3.17 illustrates the residuals of the various
energies’ calibration curve after scaling to the 32 point curve.
Based on this finding and the consensus in the literature on the energy and beam
modality independence of EBT film, we conclude that the calibration curves
established using the Elekta 6 MV photon beam can be used on the Vickers
photon and electron beams. Note that the EBT film’s insensitivity to photon
beam quality is very attractive, as the Vickers accelerator can produce X-rays
using various target material such as Al, Cu, and Pb, where beam quality may not
be known.
0
0.1
0.2
0.3
0.4
0.5
0.6
0 2 4 6 8dose (Gy)
netO
D
32 points
6 MV
10MV
Cobalt
18MeV
25MV
Poly. (32points)
Figure 3.16. EBT film calibration in three X-ray energies and Cobalt. The 8
point measurements fall on the 32 point curve. The line drawn is a fourth-
order fit of 32 point data set. The data presented here is not scaled (e.g.
original data).
74
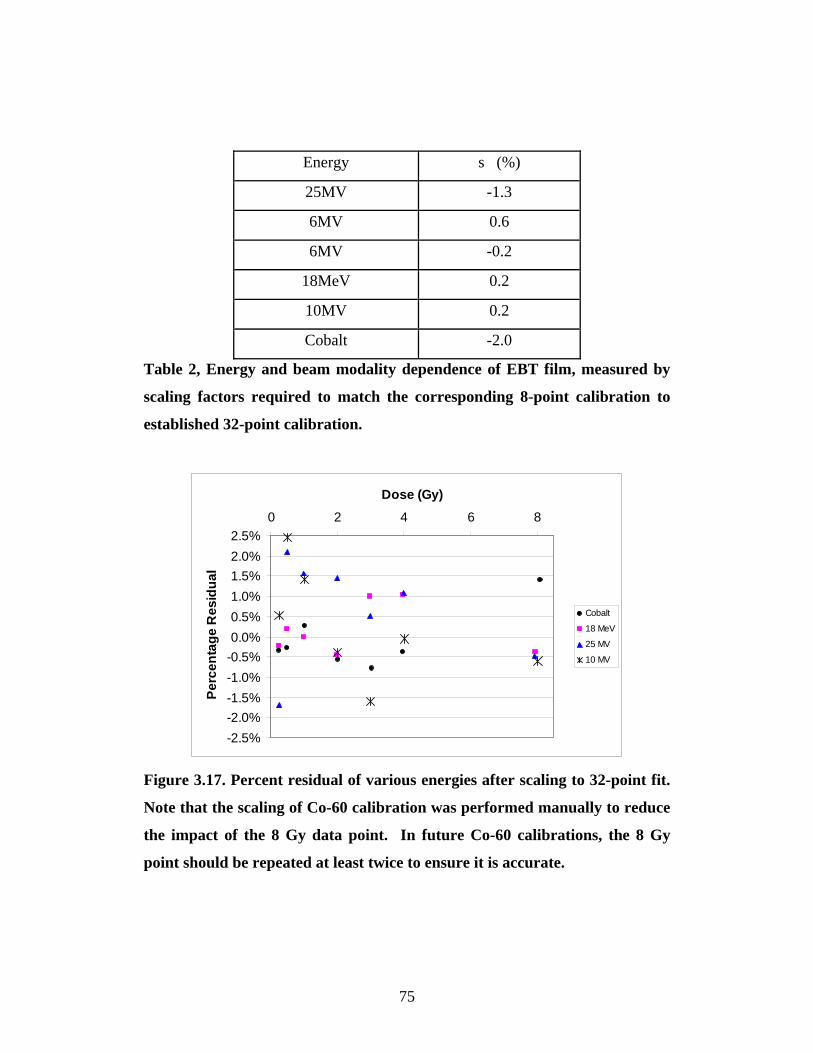
Energy s (%)
25MV -1.3
6MV 0.6
6MV -0.2
18MeV 0.2
10MV 0.2
Cobalt -2.0
Table 2, Energy and beam modality dependence of EBT film, measured by
scaling factors required to match the corresponding 8-point calibration to
established 32-point calibration.
-2.5%-2.0%-1.5%-1.0%-0.5%0.0%0.5%1.0%1.5%2.0%2.5%
0 2 4 6 8
Dose (Gy)
Per
cent
age
Res
idua
l
Cobalt
18 MeV
25 MV
10 MV
Figure 3.17. Percent residual of various energies after scaling to 32-point fit.
Note that the scaling of Co-60 calibration was performed manually to reduce
the impact of the 8 Gy data point. In future Co-60 calibrations, the 8 Gy
point should be repeated at least twice to ensure it is accurate.
75

3.7 Scanner uniformity investigation The scanner uniformity is a well-known artifact of flat-bed color scanners when
used in EBT film dosimetry, but no consensus has been reached on this subject.
This section will present our investigation of this subject.
3.7.1 Lateral uniformity correction
Eight film pieces irradiated to between 0 and 8 Gy were scanned at various lateral
positions of the scanner, one piece at a time, while maintaining the same
longitudinal position. Another unirradiated film was placed on the lower center
part of the scanner bed, to account for the two-state fluctuation behavior of the
scanner, as documented in section 3.3. The position of the film of interest was
obtained from the image file, using the resolution reported by the manufacturer.
The geometric accuracy of the scanner was verified in a separate experiment and
confirmed to be better than 1 %. The average pixel value in the ROI was
converted to net optical density and plotted against the x-position on the scanner
bed. Between 15 and 20 points were obtained for each dose level. Note that
unlike existing literature, this approach does not assume the middle of scanner
bed to be the minimum OD position. Instead, the position of minimum OD was
experimentally determined, and found to be close to, but not exactly at, the
geometric mid-point of the scanner bed. The results of this measurement showed
a strong lateral non-uniformity as expected. In the literature, various authors have
assumed the lateral correction to be symmetric and could be described by a
second order polynomial equation (Battum et al 2008, Saur et al 2008). Further
inspection of data showed that the lateral uniformity correction is not symmetric
and can not be adequately described by a second order polynomial. Figure 3.18
showed the symmetry of 2 Gy lateral uniformity measurement by plotting the
relative OD values against distance from the minimum point. The left and right
sides of the curve does not exhibit the same curvature. Therefore a third order
polynomial was used as the correction equation in this protocol. Figure 3.19
shows the same 2 Gy uniformity measurement fitted with a third order polynomial.
The fit adequately describes the data points at the 0.5 % level.
76

Having found the correction equation for one particular dose level, we proceeded
to search for a universal correction equation for all dose levels. If the lateral
correction was expressed as the difference between the OD at a given position and
the minimum OD in the line, the correction was strongly OD-dependent, requiring
multiple correction equations and interpolation in-between. Based on this result,
we expressed the lateral uniformity correction as relative optical density. When
expressed as relative optical density, lateral correction curves for doses from 1 Gy
to 8 Gy agree within 1 %, as shown in Figure 3.20. The differences in lateral
correction factors for different doses decrease as we get closer to the middle of
scanner bed. Based on the desire for a simple scanner correction, we used the
lateral correction equation of 2 Gy for all doses between 1 Gy and 8 Gy. Note
that this approach is based on the current limited film uniformity, where up to 2 %
fluctuation in film sensitivity can occur within a sheet. If a more accurate
correction is desired, different correction equations can be employed for different
optical densities, and interpolation techniques can be implemented for doses not
measured in this experiment. Currently no correction is applied for doses below 1
Gy, because the relative lateral correction for doses below 1 Gy is dose dependent
and large, even though the absolute value of the correction is small. Therefore
current dose measurements for the Vickers experiment are limited to between 1
and 8 Gy.
After confirming that the lateral correction can be described by a single equation
for optical densities of 1 Gy or above, we investigated the lateral inhomogeneity
at different longitudinal positions. Figure 3.21 showed the two lateral correction
curves obtained at two positions, one is 605 pixels from the top of scanning area,
and the second is 1088 pixels from the top of the scanning area. Therefore the
lateral correction for the entire scanning bed can be described by an equation for
each optical density. In other words, the lateral and longitudinal corrections are
de-coupled.
77

1
1.02
1.04
1.06
1.08
1.1
0 20 40 60 80 100
Distance from minimum (mm)
rela
tive
OD
right side
left side
Poly. (right side)
.
Figure 3.18. Symmetry test of lateral homogeneity correction, measured with
a 2 Gy film piece. A second order polynomial fit of the right side indicates
that the correction is not symmetric and can not be adequately described by
a second order polynomial.
Third order polynomial fit
1
1.02
1.04
1.06
1.08
1.1
-120 -80 -40 0 40 80 120
Distance from minimum (mm)
rela
tie O
D
Figure 3.19. Third order polynomial fit of 2 Gy film lateral uniformity
correction. Due to the lack of symmetry, a third order polynomial correction
was implemented in our protocol.
78

11.021.041.061.08
1.11.121.141.161.18
1.2
0 100 200 300Positon (mm)
rela
tive
OD
4 Gy0.5 Gy3 Gy0.25 Gy8 Gy1 Gy2 Gy
Figure 3.20. Lateral non-homogeneity as expressed in relative OD.
0.98
1
1.02
1.04
1.06
1.08
1.1
1.12
1.14
0 50 100 150 200 250 300
X (mm)
rela
tive
OD Y=605
y=1088Poly. (y=1088)
Figure 3.21. Lateral non-uniformity for film irradiated to 8 Gy. The shape
and position of minimum of the two curves agree within noise level. A fourth
order polynomial fit was added to demonstrate the level of agreement
compared to noise.
79

3.7.2 Longitudinal correction
Only a handful of papers in the literature report a significant longitudinal non-
homogeneity (Paelinck et al, 2006), but those papers that ignore such
inhomogeneity do not provide evidence of homogeneity satisfactorily (Battum et
al, 2008). By measuring the OD of a single piece of film along the central axis of
the scanner, we confirmed that any longitudinal inhomogeneity would be
comparable to experimental error introduced by scanning and replacing a film
multiple times. Figure 3.22 shows the longitudinal dependence of optical density
for a film irradiated to 2 Gy. The points are normalized to their mean. A linear fit
revealed a trend in observed data, but total deviation over a distance of 20 cm will
be less than 0.2 %. Given the 20 x 20 cm2 maximum size of EBT film used in
this protocol, any longitudinal correction is ignored. Note that the longitudinal
correction measurements also showcase the results of scanner fluctuation
correction technique and the reproducibility of our protocol in reading the same
piece of film after mechanically disturbing it.
0.995
0.996
0.997
0.998
0.999
1
1.001
1.002
1.003
0 100 200 300 400Longitudinal position (mm)
rela
tive
OD
Figure 3.22. Longitudinal uniformity measured with a 2 Gy film piece.
80

3.8 Long and short term darkening of EBT film 3.8.1 Summary of literature review and techniques employed for this work.
GafChromic EBT film is known to require curing time in order to reach a stable
optical density. The reason behind the need of film development time is poorly
documented in the literature, but Dr. David Lewis of ISP Corp provided some
basic explanation in a recent presentation. Put in a simplified manner, EBT film’s
change of color is a result of the connection of many monomers into a polymer.
As monomers are added to the polymer chain, the polymer “shrinks”. As the
polymer gets longer, the additional monomers are further away from it, making
subsequent reaction less likely. Therefore, although the polymerization process
never completely stops, its speed approaches zero exponentially as time goes on.
Such a theoretical explanation suggests that EBT’s post-irradiation development
may be best viewed on a log-linear scale.
Current literature generally covers the first 24 hours of darkening, and various
authors have shown that darkening effects are sufficiently small for clinical
purposes after 24 hours. Therefore most protocols recommend 24 hour or longer
development time, with the stipulation that scanning is performed at fixed time
after irradiation. There is very limited data on long-term darkening, even though
it has been acknowledged that a long-term darkening effect is present. The only
literature so far is by Martisikova et al (2008), which suggests that film darkening
stops after 10 days. The newest model of scanner recommended by ISP, the
Epson Expression 10000 XL, has been shown to have optical density
reproducibility of better than 0.2 %, if a reference piece is used to correct for
scanner fluctuation. Such improvement has made darkening effect study beyond
the first 24 hours feasible.
3.8.2 Darkening within 24 hours
Various authors have reported on the darkening of EBT film for the first 24 hours
after irradiation. The typical curve showed dramatic OD increases for the first 2
to 4 hours post irradiation, and much slower increases between 4 and 24 hours.
We have also reproduced such data, and plotted it in log-linear scale. The results
81

are shown in Figure 3.23. Note that the first measurement of optical density was
not taken immediately after irradiation, due to the different pieces irradiated at
different time. The log-linear behavior of darkening within the first 24 hours is
evident in this figure.
0.930.940.950.960.970.980.9911.011.02
0.1 1 10 100Time after irradiation (hour)
Rel
ativ
e ne
tOD 0.5 Gy
3 Gy4 Gy8 Gy1 Gy2 Gy
Figure 3.23. Short term darkening of EBT film. Note that as the irradiation
of all 7 pieces of film takes in excess of one hour, we do not have data for the
first few minute post-irradiation.
82

3.8.2 Darkening beyond first day and up to 3 months
The approach of scanning after 24 hours is a sensible approach, as a few hours of
error will not cause any systematic error of more than one percent, which is
satisfactory for clinical purposes. The lack of information on long-term darkening,
however, means that the image file is the only archive available for the dose
distribution. As the film darkens over time, it would be desirable to read the film
several days or weeks after, and re-construct the dose. Doing such would require
detailed knowledge of the film darkening process beyond the first day and this
section documents our investigation of such behavior.
The strongest evidence of long-term darkening comes from our 32 point
calibration, which is the calibration with the most data points in this project. The
calibration film set was kept in a metal cabinet at room temperature, in a
basement, to avoid sunlight exposure. Up to 5 % darkening was observed over
the course of three months, and the darkening is approximately linear. Figure
3.24 demonstrates such behavior. Measurements at two weeks and one month,
however, showed that darkening is not always linear. Note that unlike the
experiment of 24 hour darkening, the films were removed from scanner bed
between each scan in order to avoid prolonged exposure to ambient light. This
measurement is therefore made possible by our Lucite template designed for
scanning calibration film pieces, and our scanner fluctuation correction technique.
The 0.2 % reproducibility in scanning the same piece of film in different days
allowed us to detect the small changes in optical density as the film darkens.
After demonstrating the long-term darkening of EBT film, we investigated the
reproducibility of EBT film’s long term darkening. The long-term darkening
study of 32 point calibration set showed that the darkening effect is an increasing
function of net optical density, and that the net optical density increase is not
always a linear function. Use of EBT film itself as dose information archive
requires knowledge about both the rate of darkening and the shape of the
darkening curve. For this purpose, a 6 MV X-Ray calibration film set and an
18 MeV electron calibration film set were irradiated at the same day, and both
were scanned one day after. They were then scanned again 30 days after to obtain
83
the darkening curve over 30 days. A 25 MV x-ray calibration film set were
irradiated at a different day. This film set was scanned at one day and after 40
days to obtain its darkening curve. The result is shown in Figure 3.25. The 6 MV
x-ray and 18 MeV electron calibration sets showed a very similar darkening curve
after 30 days, while the 25 MV x-ray data showed much lower level of darkening
after 40 days. Such results indicate that long-term darkening of EBT film may be
dependent on the environmental history of the film after the irradiation, while the
energy and beam modality of the film does not play any significant role. Such
behaviors make using EBT film itself as a dose archive in a clinical environment
unfeasible, as strict environmental control will likely be required if accurate long-
term darkening is to be predicted. If storage in an environmental chamber was to
be implemented in the future, however, film-to-film variations of long-term
darkening would still need to be investigated.
84
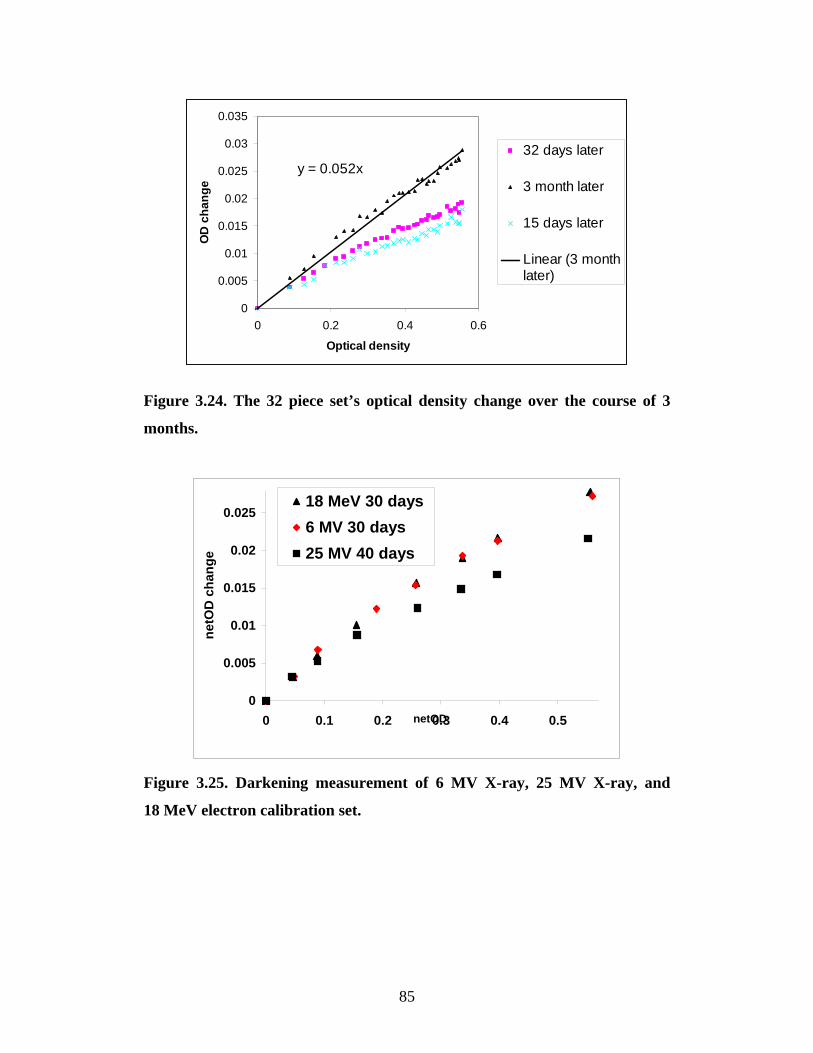
y = 0.052x
0
0.005
0.01
0.015
0.02
0.025
0.03
0.035
0 0.2 0.4 0.6
Optical density
OD
cha
nge
32 days later
3 month later
15 days later
Linear (3 monthlater)
Figure 3.24. The 32 piece set’s optical density change over the course of 3
months.
0
0.005
0.01
0.015
0.02
0.025
0 0.1 0.2 0.3 0.4 0.5netOD
netO
D c
hang
e
18 MeV 30 days6 MV 30 days25 MV 40 days
Figure 3.25. Darkening measurement of 6 MV X-ray, 25 MV X-ray, and
18 MeV electron calibration set.
85

3.9 Humidity effect and TinyTag humidity logger
3.9.1 Background
Rink et al (2008)’s paper on the humidity effect of EBT films reported that drying
a film in a drying oven at 50 ºC for 24 hours can cause a 20 % reduction in
sensitivity. Such a result raises the concern of a dry storage environment’s impact
on film sensitivity, given the low indoor humidity caused by low outside
temperature at NRC during winter.
3.9.2 Measurement
A batch of EBT film was stored in its standard cabinet during the NRC winter
shutdown, and a TinyTag™ humidity logger 11 was used to record the
environmental history. During this three week period, humidity levels between
5 % and 8 % were observed during most evenings, while the temperature
remained between 20 ºC and 25 ºC. After the winter break, one sheet of film from
this batch was used in a 8-piece calibration, and the results showed that no change
in sensitivity can be detected. As seen in Figure 3.26, the change in sensitivity
was less than 1.5 %, below the film uniformity level. This preliminary result
indicates that the humidity effect is likely not a concern for normal clinical
applications.
0
0.1
0.2
0.3
0.4
0.5
0.6
0 2 4 6 8dose (Gy)
netO
D
32 points
before dry weather
after dry environment
Figure 3.26. Film sensitivity comparison before and after three weeks of
relatively dry weather.
11 Gemini Data Loggers Ltd, West Sussex, UK
86

Chapter 4 Applications
Having established our own EBT protocol for two-dimensional reference and
relative dose distribution measurements, it is necessary to verify its accuracy in
measuring such one and two dimensional dose distributions. In the previous
section, measurements were focused on small pieces of film. For practical
applications, long strips or large sheets of EBT films up to 20 x 20 cm are
typically used. Before we can measure an unknown dose using a long strip or a
large sheet of EBT film, we need to test the accuracy of our EBT film dosimetry
protocol in measuring one and two dimensional dose profiles. In such tests,
profiles measured by EBT films will be compared to profiles measured by
ionization chamber scans in a water tank and a PTW12 Starcheck™ 2D ionization
chamber array. The results will provide a measure of actual accuracy of EBT
protocol when used in measuring unknown dose profiles.
After establishing the precision of our EBT film dosimetry protocol, we will
apply it to the measurement of dose distributions from the NRC Vickers
accelerator. This application will demonstrate EBT film's capability as a high
resolution dosimeter that provides complete two-dimensional dose information.
We would like to emphasize that the experiments in this section are initial
investigations on the feasibility of using EBT film in such scientific experiments.
The results presented here are meant to demonstrate the capability of our EBT
film dosimetry protocol, rather than to provide conclusive results for each
particular investigation. For all experiments in the following sections, future
work is required before any definite conclusions can be derived.
12 PTW Freiburg GmbH, Germany
87
4.1 Comparison with 1D detectors Before EBT film can be used as a dosimeter in dose profile measurements, it is
necessary to verify the accuracy of our film dosimetry protocol using established
detectors. Among conventional detectors, ionization chamber scanning using a
water tank is considered to be the most accurate, as the same chamber is used in
all positions. A Multidata Multiscan™ water tank13 with a scanning ionization
chamber was used to measure dose profiles in the left-right direction of an Elekta
6 MV X-ray open field, at 5 cm depth in water. The left-right direction is also
called the A-B direction, which is perpendicular to the gun-target directions in
vertical beam setup of clinical Linac experiment. Figure 4.1 shows the directions
with regard to the Elekta control system. A 20 x 20 cm square sheet of EBT film
was irradiated in the same field at 5 cm depth in a Virtual Water phantom. The
results are shown in Figure 4.2, where relative dose profiles were compared. Note
that the net optical density of the film was extracted from the scanned image, and
the net optical density was converted to absolute dose profile using the calibration
curve. This absolute dose profile is then normalized to the beam axis, and the
resulting relative dose profile is compared with relative profiles obtained from
chamber scanning. Film and water tank measurements agreed within the film
uniformity level, with the film showing a 2 % drop in measured dose at the
positive edge of the field. This result is consistent with our Strontium-90
experiment, where a 2 % fluctuation in film response was observed. The 20 x 20
square sheet of EBT film allowed us to measure dose profiles in two orthogonal
directions, and profiles measured by EBT film agree with scanning chamber
measurements in both directions. This provides one evidence that our scanner
uniformity correction technique is accurate to the level of film uniformity.
13 Multidata St Louis, Missouri
88

Figure 4.1. The Gun-target and Left-right directions referred to in this
section.
0.98
0.985
0.99
0.995
1
1.005
1.01
-50 -40 -30 -20 -10 0 10 20 30 40 50position (mm)
rela
tive
dose
water tankfilm
Figure 4.2. Comparison of 6 MV X-Ray open field profiles measured by EBT
film and scanning water tank. Note that both profiles are normalized to the
beam axis, where the value of position is zero.
89

After comparing film measurements with water tank measurements, we also want
to compare dose profiles measured by EBT film with profiles measured by
ionization chamber arrays commonly seen in a clinic. Compared to ionization
chamber scanning in water tank, ionization chamber arrays can be used in a solid
phantom, making the experimental setup easier. In this experiment, both EBT
film and the PTW Starcheck were used in relative dose profile measurements in
an Elekta 25 MV x-ray open field at 5 cm depth in virtual water. Unlike the 6
MV beam, the 25 MV beam was not flat and showed significant structure. For
further comparison, the relative dose profile was also measured by ionization
chamber scanning in water tank. The comparison between Starcheck and EBT
film in Virtual Water, and ionization chamber scan in water tank are shown in
Figure 4.3. In this figure, relative dose profiles measured by Starcheck and water
tank agreed within 1 %. Dose profile measured by EBT film agreed with the
other two detectors for part of the profile, but a 2 % jump in film measurement
was observed and this can be attributed to the poor uniformity of film. Taking
film uniformity into account, EBT film accurately measures dose profile at the 2
% level.
In relative dose profile comparisons, attention needs to be drawn to the process of
normalizing the dose profile. For figures presented in this section, EBT dose
profiles are normalized to the average of the two data points closest to zero. Since
the same area of EBT film is never irradiated twice, the fluctuation in EBT film
sensitivity can cause systematic shifts in the normalized dose profile if the area of
film used for normalizing the dose profile suffers large sensitivity fluctuations.
Better agreement with chamber profile measurements can be obtained if dose
points over a larger area is used for normalizing the dose profile, but such
approach can not be extended to applications where the dose distribution of
interest in unknown. Therefore we chose to normalize the EBT absolute dose
profile to the beam axis, and accept the worse agreements with conventional
detectors as the result of poor uniformity.
Note that the Starcheck ionization chamber array is marketed as a two-
dimensional array, but it does not provide complete two-dimensional dose
90

information, but rather four one-dimensional profiles arranged in a star-like
pattern. Such chamber arrangement provided higher one-dimensional spatial
resolution, but does not allow direct comparison of complete two-dimensional
dose profiles between Starcheck and EBT film. For complete two-dimensional
profiles, a uniformly distributed two-dimensional ionization chamber array such
as PTW Seven29™ would be required.
0.98
0.99
1
1.01
1.02
1.03
1.04
1.05
1.06
-50 -40 -30 -20 -10 0 10 20 30 40 50
position (mm)
rela
tive
dose
starcheck
film
watertank
Figure 4.3. Comparison of 25 MV x-ray open field dose profile measured by
EBT film, Starcheck, and ionization chamber scan in water tank, all at 5 cm
water equivalent depth. Note that Starcheck appeared to underestimate the
dose near the edge, but the difference between Starcheck and water tank
profiles are within the calibration uncertainty of Starcheck.
91

4.2 Measurement of Theratron Junior Co-60 field and benefits of a 2D dosimeter The previous section had shown that for 1D profile measurements, EBT film does
not yet provide the same level of accuracy as ionization chamber scans in water
tank or ionization chamber arrays such as Starcheck. EBT film’s shortcoming in
measurement accuracy arises from the fact that an area of film is never irradiated
twice; therefore it is not possible to calibrate a piece of film before using it. On
the other hand, film does provide complete two-dimensional information with 1-
mm or better spatial resolution. Such an advantage was demonstrated in the
Theratron Junior Co-60 beam’s open field measurement.
The Theratron Junior Radiotherapy Unit14 (serial #15) at NRC has been used for
measurements related to radiation protection purposes, as its dose rate is low. As
part of QA process, it was desirable to obtain a complete dose profile of the beam.
Due to its low dose rate, scanning the beam with a 3D water tank would be a
cumbersome and time-consuming process, as a long dwell time at each position
will be required to obtain enough signal for an accurate measurement. In this case,
EBT film is a better choice. A piece of EBT film was positioned at 5 cm depth in
a Virtual Water phantom, which was placed 1 m from the source. In the first
experiment, 2 hours of irradiation produced approximately 1 Gy of dose at the
film. Surprisingly, a strip of higher dose was observed on the film. Further
investigation revealed that a plate of Virtual Water with a hole designed for
ionization chamber has been used in the experiment by mistake. Figure 4.4 shows
an optical density map of the EBT film irradiated in this experiment. By
adjusting the window level of the graph, we were able to confirm that the shape of
the dose artifact matches the shape of the hole in Virtual Water plate. In a
subsequent measurement, this mistake was corrected, and EBT film was used to
verify that no visible structure was present in the Theratron Junior beam. Such an
incident showed the advantage of a complete 2D detector compared to 1D
detectors. The dose difference between the area covered by the hole and the rest
of the field is 3 %, and the width of the artifact is 6 mm. If a one-dimensional
14 AECL, Ottawa, Canada
92

dose profile was measured with ionization chamber scanning, such a mistake may
go unnoticed. With complete two-dimensional dose information and the ability to
display dose in false color, the shape of the artifact can easily be distinguished by
eye. Therefore despite the lower accuracy provided by EBT film, its ability to
provide complete two-dimensional dose information is valuable in many
situations.
Figure 4.4. Optical density map of EBT film irradiated in Cobalt Junior
beam. A strip of higher dose was visible at the center, which was eventually
traced to the mistake of using a plate of Virtual water with a hole drilled in it.
93
4.3 Vickers electron experiment 4.3.1 Introduction to Vickers experimental accelerator
Having established and verified our EBT film dosimetry protocol, we applied this
technique to the Vickers dose profile measurement. The Vickers experimental
linear accelerator at NRC was commissioned in 1968 for research, rather than
clinical, purposes. Figure 4.5 shows a sample picture of a Vickers experiment.
We present this photo to emphasize that the Vickers accelerator is significantly
different from a clinical Linac. Based on a modular design, custom-made
scattering foils and targets of different materials can be mounted on the beam exit
window, where an electron pencil beam of up to 40 MeV comes out. As an
experimental accelerator, the Vickers has well known geometry and does not have
clinical components such as flattening filter or mirror in the path of the beam. Its
simple and well known geometry allows accurate description of the accelerator in
Monte Carlo simulations. These features of the Vickers makes it an ideal tool
for benchmarking Monte Carlo software, because few free parameters are needed
in simulating the Vickers beam. Therefore the Vickers accelerator has been used
for the purpose of Monte Carlo benchmarking (Ross et al, 2008). The Vickers
accelerator also has the unique capability of measuring beam current. In other
words, the total number of electrons leaving the exit window can be measured.
This feature enables the measurement of dose per electron, which is the quantity
calculated by Monte Carlo simulations.
94

Figure 4.5. Vickers electron experimental setup. The Vickers accelerator is
significantly different from a clinical Linac. The monitor chamber provides
feedback to the accelerator control system to maintain beam current at a
desired level. The helium bag reduces electron scatter in air. The film is
mounted on a PMMA plate to provide mechanical support.
95
4.3.2 Vickers electron beam experimental setup and the motivation for film
measurement.
In Vickers electron profile measurements, electron scattering foils made of Al, Cu,
Ti, and Au were mounted in front of the exit window one at a time to produce a
scattered electron field at the detector plane. For EBT film measurements, 20
MeV electron beam was used, as both ionization chamber measurements and
Monte-Carlo simulation results were available for the energy of 20 MeV. The
experimental setup is shown in Figure 4.6, where a helium bag is positioned
between scattering foil and detector plane to reduce the scattering in air, and a
monitor chamber was placed in the beam axis to provide beam control feedback.
Compared to a clinical Linac, the elements in the beam path are kept to a
minimum to allow accurate description of every element in a Monte Carlo
simulation using EGSnrc (Kawrakow, 2000). In previous work, one-dimensional
dose profiles were measured with an Exradin A16 ionization chamber mounted on
a Velmex linear translation stage. Relative dose profiles were recorded and
compared to dose to water profiles calculated in the Monte Carlo simulation.
Both ionization chamber measurements and Monte Carlo simulations were
normalized to the peak, as the beam was assumed to be circular. The drawback
of ionization chamber scanning is the difficulty in measuring two-dimensional
dose profiles. Mounting the Velmex translational stage vertically is inconvenient
and is not performed for every scattering foil. Even when the vertical dose profile
is measured, the collection of only two orthogonal profiles can still miss
unexpected structures in the beam. Therefore, complete two-dimensional dose
matrixes were desired for verifying the circular symmetry assumed in the Monte
Carlo simulations.
Another motivation for EBT film dosimetry is the reported disagreement between
Monte Carlo simulations and ionization chamber scan measurements. As
reported by Ross et al, relative dose profiles predicted by EGSnrc were on
average 1.5 % narrower than profiles measured by ionization chamber scan. It is
therefore desirable to measure dose profile with another detector to provide
further insight on this disagreement.
96
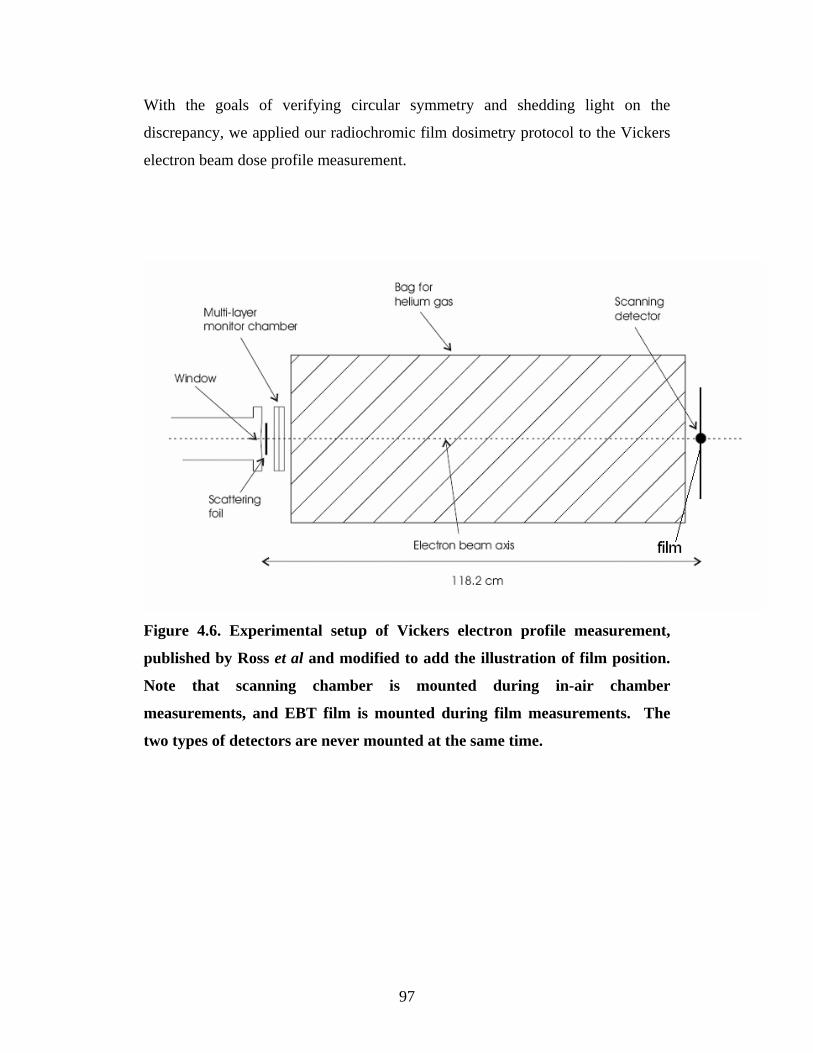
With the goals of verifying circular symmetry and shedding light on the
discrepancy, we applied our radiochromic film dosimetry protocol to the Vickers
electron beam dose profile measurement.
Figure 4.6. Experimental setup of Vickers electron profile measurement,
published by Ross et al and modified to add the illustration of film position.
Note that scanning chamber is mounted during in-air chamber
measurements, and EBT film is mounted during film measurements. The
two types of detectors are never mounted at the same time.
97

4.3.3 Vickers electron beam dose profile measurement using EBT films
As seen in Figure 4.6, a 20 x 20 cm sheet of EBT film was mounted perpendicular
to the beam axis at the same distance from the beam exit window as the center of
the A16 ionization chamber in previous experiments. To provide mechanical
support, EBT films were taped to a 1 mm thick sheet of PMMA. The PMMA
backing is expected to have an effect on the backscatter conditions of the beam,
but this effect should be negligible for relative dose profile measurements. To
confirm our assumption, the effect of this PMMA sheet was investigated by
comparing a relative dose profile measured with a PMMA backing against a
relative dose profile measured without a PMMA backing. In the measurement
without a PMMA backing, a rectangular PMMA sheet with the center portion
removed was used to provide support for the EBT film. A dose profile of the
beam without any scattering foil (i.e. accelerator exit window only) was measured
with both setups, and the results are shown in Figure 4.7a and 4.7b, where both
profiles were normalized to the center of beam and folded around the origin to
magnify any differences observed. The differences between the two profiles were
on the level of film uniformity. Based on this result, we concluded that the
PMMA has no significant effect on the measured dose profile. Due to the better
mechanical support provided by a PMMA backing, it was used in all subsequent
measurements.
Before quantitative analysis was performed, we visually inspected two-
dimensional dose profiles produced by each scattering foil, looking for
unexpected structures in the beam. Each 20 x 20 cm sheet of EBT film was
scanned 24 hours after irradiation, and the image was first converted into a net
optical density matrix. A two-dimensional dose matrix with 1.3 x 1.3 mm2 spatial
resolution was then derived from the optical density matrix. The level of spatial
resolution was chosen to minimize the single-pixel noise caused by
microstructures of EBT crystal. Using the value of dose as the z-axis, three-
dimensional plots were produced in Matlab. Visual inspection of all dose profiles
produced by various scattering foils showed no detectable structures in the beam,
and the dose profile appeared circular for all measurements. To help locate the
98

center of the beam, a contour of the dose matrix at a level equal to 50 % of peak
dose was obtained using Matlab's contour feature. The contours obtained in all
dose matrixes were highly circular, which allowed us to fit the contour line to a
circle and locate the exact center of the beam. An example of contour provided
by Matlab is shown in Figure 4.8. Using the beam center located by the contour
and circle fit method, the horizontal and vertical dose profiles were extracted from
the dose matrix. The extracted profiles were compared to each other to verify the
circular symmetry of the beam in a quantitative manner. Figure 4.9a and 4.9b
showed the typical extracted profiles and the result of their subtraction. After
examining dose profiles produced by all scattering foils, we concluded that all
scattered electron profiles are circular to the level of film uniformity and the
circular symmetry assumed in Monte Carlo was valid. Note that the complete
two-dimensional dose profile obtained in EBT measurements helped us locate the
center of the beam after the experiment, rather than relying on laser alignment
techniques during the experiment, as it was done for the ionization chamber scans.
Therefore EBT measurements provide higher levels of confidence on spatial
accuracy, as it does not rely on accurate positioning of detector during the
experiment.
99
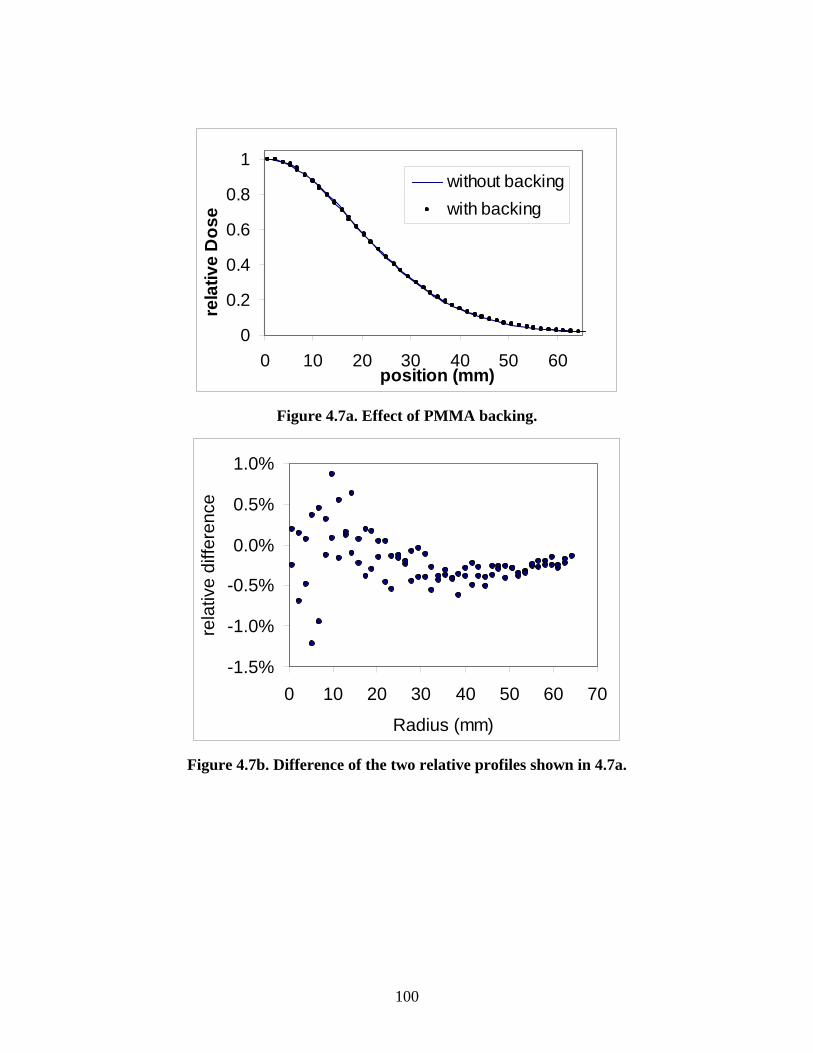
0
0.2
0.4
0.6
0.8
1
0 10 20 30 40 50 60position (mm)
rela
tive
Dos
ewithout backingwith backing
Figure 4.7a. Effect of PMMA backing.
-1.5%
-1.0%
-0.5%
0.0%
0.5%
1.0%
0 10 20 30 40 50 60 70
Radius (mm)
rela
tive
diffe
renc
e
Figure 4.7b. Difference of the two relative profiles shown in 4.7a.
100

Figure 4.8. Typical contour produced by Matlab's contouring algorithm.
The x-y scale shown corresponds to pixels and is arbitrary. The false color
scale has unit of Gray.
1.21.41.61.822.22.42.62.8
-60 -40 -20 0 20 40 60position (mm)
dose
(Gy)
vertical
horizontal
Figure 4.9a. Comparison of vertical and horizontal dose profiles from Al
scattering foil experiment. The gap on the graph was due to a scratch on the
EBT film
101

-1.5%-1.0%-0.5%0.0%0.5%1.0%1.5%
-60 -40 -20 0 20 40 60position (mm)
orth
ogon
al d
iffer
ence
Figure 4.9b. Difference of vertical and horizontal dose profiles shown in
above figure. The beam is circular to the level of film uniformity.
102

4.3.4 Comparison of EBT profile measurements with ionization chamber
measurements & Monte-Carlo simulation
Having confirmed the circular symmetry assumed in Monte Carlo simulations, we
proceeded to compare dose profiles measured with EBT film with ionization
chamber measurements & Monte Carlo simulation. Electron dose profiles
extracted from the 2D dose matrix measured by EBT films were normalized to the
peak and compared to relative dose profiles measured by ionization chamber
scans and Monte-Carlo simulations. In Ross et al’s paper (2008), the difference
between ionization chamber and Monte-Carlo profiles were quantified by
comparing the distances required for the relative dose to fall to 1/e. The EBT
film’s 20 x 20 cm form factor means that profiles don’t extend to relative dose
levels as low as 1/e for many of the scattering foils used. Due to this dimensional
limit, the section of relative dose profiles between 0.4 and 0.7 is used for
matching EBT film profiles and Monte-Carlo simulations, because the broadest
electron dose distribution extends to 40 % of peak dose at the edge of the EBT
film. A scaling factor was applied to the spatial dimension of the EBT film’s
relative dose profile so that this region of the film dose profile achieves the best
agreement with Monte Carlo simulation. Figure 4.10a and Figure 4.10b showed
the relative dose profiles from EBT film measurement, scanning ionization
chamber measurement, and Monte Carlo simulation. On average, dose profiles
measured by EBT films appear narrower than that predicted by Monte Carlo
simulations, while profiles measured by ionization chamber scans are broader
than Monte Carlo simulations. Note that due to the limited uniformity of the EBT
film, the difference between EBT measurements and Monte Carlo simulations are
not statistically significant. The difference between EBT film and ionization
chamber measurements, however, is statistically significant. Table 4.3 provides a
summary of scaling factors needed to match ionization chamber scans to Monte
Carlo simulations. The positive values of scaling indicate that film profiles are
narrower than Monte Carlo simulation results. Based on the four materials
investigated, no obvious trend with atomic number of foil was observed. The
103

reason behind the discrepancies between film and ionization chamber
measurements remains to be resolved.
Note that the Monte Carlo simulation does not include the presence of film or the
composition of the film. Instead, the EBT film is assumed to be a particle fluence
detector. Further work is required to further investigate the effect of film
thickness and composition on the dosimetry.
We would like to raise the issue of the cost of film for this experiment. For each
scattering foil, at least one sheet of EBT film is required for measurement. If
uncertainties lower than the uniformity of the film is desired, three or four sheets
of film will be required for each foil. Ross et al (2008) reported electron
scattering measurements with more than 20 foils of different atomic numbers and
thicknesses, using ionization chamber scans in air. Repeating the experiments for
all foils with EBT film is a costly proposal, as each sheet of film costs $20 CDN
at time of writing. Therefore only four foils of different atomic numbers are
investigated in this experiment.
In future work, strips of EBT film can be used instead of whole sheets of film. By
irradiating several strips of EBT film at the same time and taking the average of
dose profiles measured, we can reduce the uncertainty due to film uniformity
fluctuations without using too many sheets of films.
104

0
0.2
0.4
0.6
0.8
1
1.2
-150 -50 50 150Distance from beam axis (mm)
rela
tive
dose
Chamber in airMC simulationFilm 1Film 2Film 3
Figure 4.10a. Comparison of Aluminum foil's relative dose profile obtained
from film, ionization chamber, and Monte Carlo simulation. All profiles are
normalized to the center of the beam.
105

0.4
0.45
0.5
0.55
0.6
0.65
0.7
40 45 50 55 60 65 70 75Distance from beam axis (mm)
rela
tive
dose
Chamber in air
MC simulation
Film 1
Film 2
Film 3
Figure 4.10b. A zoom-in view of the Figure 4.10 a.
Foil Scaling Factor
Al 1.013
Ti 1.020
Cu 1.015
Au 0.997
Table 4.3 Scaling factor required to match the EBT film measurement with
the Monte Carlo simulations. The scaling factor refers to the number
multiplied to the X-axis of the film profile in order to match Monte-Carlo
simulation.
106
4.4 Vickers X-ray measurements 4.4.1 Vickers X-ray relative dose profile measurements using EBT film
Besides electron profile measurements, the Vickers linear accelerator has been
used to produce x-ray beams for Monte-Carlo benchmarking. In x-ray
experiments, the electron scattering foils were replaced by thick, full-stopping x-
ray targets of various materials. In this experiment, dose profiles of x-ray beams
produced by Be, Al, Cu, Ta, and Pb targets were measured. The Helium bag
shown in Figure 4.6 was removed, as in-air scattering was not a concern for x-ray
beams.
A Farmer-type ionization chamber was used to measure the relative dose profile
in-air. Unlike electron measurements, however, the ionization chamber was
equipped with a 4 cm radius cylindrical PMMA build-up cap to provide sufficient
build-up. To mimic this experimental geometry, a 20 x 20 cm sheet of EBT film
was placed inside a Virtual Water phantom with 5 cm buildup and more than 5
cm of Virtual Water backscatter. Although the geometries are not identical in
ionization chamber scans and EBT film measurements, the condition of full build-
up allows us to assume that, to first approximation, both detectors are measuring
the relative photon fluence of the beam. At the very least, EBT film can provide
validations of circular symmetry assumed in Monte-Carlo simulations. Due to the
weight of the build-up cap, no vertical profiles have been measured in the x-ray
ionization chamber scan experiments.
4.4.2 Circular symmetry validation with EBT films
Similar to EBT film measurements in electron beams, the complete 2D dose
profiles obtained by EBT films can be used to verify the circular symmetry
assumed in Monte-Carlo simulations. A typical two-dimensional x-ray dose
profile is shown in Figure 4.11. The two-dimensional dose profiles were visually
inspected to check for unexpected structures in the beam. Overall, the x-ray
profiles are broader than electron scatter profiles, and the profiles do not resemble
a Gaussian distribution. A comparison of electron and x-ray dose profiles is
shown in Figure 4.12. The reduced gradient in the profile means that fluctuations
107

due to film uniformity have a larger effect in contouring algorithms. After failing
to obtain a circular contour of the beam, we resorted to recording the beam center
provided by a laser positioning system with ink marks during the experiment.
Vertical and horizontal dose profiles were extracted from the two-dimensional
dose profiles based on the ink markers and compared against each other. The x-
ray beams were confirmed to be circularly symmetric at the level of film
uniformity.
Figure 4.11. Typical example of two-dimensional dose profile measured by
EBT film. Note that such “eye candies” only provide qualitative information
about circular symmetry of beam.
0.40.50.60.70.80.9
1
-80 -60 -40 -20 0 20 40 60 80Distance from beam axis (mm)
rela
tive
dose
electron,Al foilx-ray Leadtarget
Figure 4.12. Comparison of electron and x-ray relative dose profiles.
Aluminum foil and Lead target profiles are shown here.
108

4.4.3 Introduction of PTW Starcheck™
To provide another method of dose profile measurement, an ionization chamber
based detector array, the PTW Starcheck, was also used for dose profile
measurements in the Vickers x-ray beams. The Starcheck consists of four arrays
of parallel plate chambers arranged in a star-like pattern. Each detector is 2 mm
by 8 mm in length and width, and 5 mm in height. Detector spacing is 3 mm for
all detector arrays. The Starcheck is pre-calibrated by the vendor with quoted
relative response uncertainty of 0.5 %. In this experiment, the Starcheck was used
to measure relative dose profiles of the Vickers x-ray beam at 5 cm depth in a
Virtual Water phantom. The profiles measured by Starcheck provided additional
comparison with ionization chamber scans and Monte-Carlo simulations. For
absolute dose measurements, the Starcheck was supplied with a calibration in Co-
60 beam, with uncertainty of 1.1 %. In order to use Starcheck for absolute dose
measurements on the Vickers accelerator, we calibrated it in the Elekta 25 MV
beam using a calibrated Exradin A19 Farmer type chamber, as it has beam quality
closest to x-ray beam produced by various targets in Vickers x-ray experiment.
4.4.4 Dose profile measurements using EBT film strips
Due to the broader dose profiles produced by the Vickers x-ray beam, film
sensitivity fluctuations had a greater impact on relative dose profiles in X-ray
measurements than in electron measurements. To offset this effect, averaging of
four film strips were used in the quantitative X-ray profile measurement. Four
pieces of film, 5 cm by 20 cm each, were stacked one on top of another and
irradiated at once. These films were then scanned sequentially at the same
position on the scanner 24 hours after the irradiation. A dose profile is extracted
over an 8 mm strip to match the detector width of Starcheck. EBT film profiles
were compared to Starcheck measurements, ionization chamber scans, and Monte
Carlo simulations. Compared to other detectors, EBT films provided the best
agreement with Monte-Carlo simulations for all five targets investigated.
However, the different geometries employed in EBT film measurements and
Monte-Carlo simulations meant that Monte Carlo simulations based on
109

geometries employed in film experiments are needed before any definite
conclusions can be made. Currently Monte Carlo simulations are performed
using the geometries employed in in-air ionization chamber scans with a build-up
cap, but simulations of virtual water phantom setup can be performed in the future.
Figure 4.13 shows a typical example of dose profile comparison between Monte-
Carlo, EBT, in-air scan, and Starcheck. Dose profiles measured by EBT films
also agreed with profiles measured by Starcheck, within the calibration
uncertainty of Starcheck. Here we demonstrated the lower potential uncertainties
achievable by EBT film, due to the ability to use multiple films for a single
measurement and taking the average of the results to reduce the effect of poor
film uniformity.
0.4
0.45
0.5
0.55
0.6
0.65
40 50 60 70 80Distance from beam axis (mm)
rela
tive
dose
Monte-Carlo
EBT film
scanning chamber
Starcheck
Figure 4.13. Dose profile comparison between EBT film, in-air chamber
scans, Starcheck, and Monte-Carlo. All profiles are normalized to the beam
axis.
110

4.4.5 Comparison of absolute dose per electron measurements in photon
beam
As we described previously, the Vickers accelerator is capable of measuring the
beam current, or the total number of electrons leaving the exit window. In this
experiment, we measured the dose per electron values using both EBT film and
the Starcheck beam profiler in a Virtual Water phantom. Due to the dose gradient
of the Vickers X-ray beam, we used the averaged dose over a 2 mm by 8 mm area
in the center of the beam to match the dimension of Starcheck's central chamber.
Figure 4.14 displays a summary of dose per electron measurements using film and
Starcheck for all five targets. The unit on the Y-axis is Gy per µC. Note that the
absolute dose per electron increases from Be to Ta, but goes down for Pb. This
variation is due to the mass-thicknesses of the different targets, which are not
matched to the energy of the incident electron pencil beam. The important result
of Figure 4.14 is the difference between the two data sets representing Starcheck
and film. The dose difference increases with the atomic number of the target.
By taking 2 mm by 8 mm dose averages at various positions near the peak in film
dose profile, we determined that a 2 mm uncertainty in Starcheck alignment
results in a 0.7 % uncertainty in measured absolute dose. Therefore we estimated
that the absolute dose measured by Starcheck has an uncertainty of less than 1 %.
A single piece of film has a 1.5 % uncertainty in absolute dose measurement,
largely due to film sensitivity fluctuations, but in this experiment, averaging of
four pieces of film reduces this to 0.9 %. The observed difference between EBT
film and Starcheck absolute dose per electron measurement varies from 1.3 % for
Be to 5.4 % for Pb, with film showing higher doses. The observed difference in
dose per electron is greater than our estimated uncertainty, and the cause of this
difference requires further investigation. However, one potential cause is the
beam quality dependence of Starcheck calibration. This result demonstrates the
benefits of EBT film’s energy and beam modality independence, as it can be used
to measure absolute dose of beams whose spectrum is unknown.
111
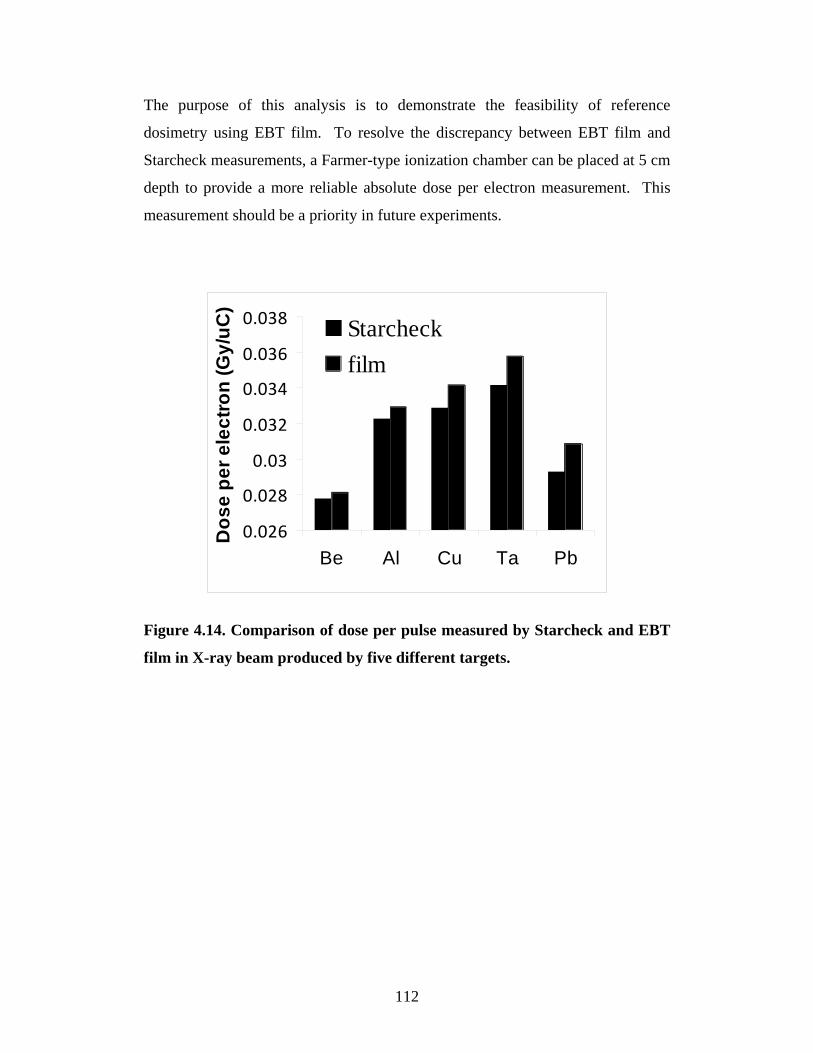
The purpose of this analysis is to demonstrate the feasibility of reference
dosimetry using EBT film. To resolve the discrepancy between EBT film and
Starcheck measurements, a Farmer-type ionization chamber can be placed at 5 cm
depth to provide a more reliable absolute dose per electron measurement. This
measurement should be a priority in future experiments.
0.026
0.028
0.03
0.032
0.034
0.036
0.038
Be Al Cu Ta Pb
Dos
e pe
r ele
ctro
n (G
y/uC
)
Starcheckfilm
Figure 4.14. Comparison of dose per pulse measured by Starcheck and EBT
film in X-ray beam produced by five different targets.
112

4.5 Conclusions on Vickers experiment This EBT film dosimetry protocol was established for reference and relative dose
profile measurements in Vickers electron and photon beams. Our initial results
have demonstrated that EBT film provides direct experimental evidence of the
circular symmetry of both electron and photon beam. For quantitative dose
profile measurements, EBT film provides an alternative method of dose
measurement to in-air ionization chamber scans.
For future work on this project, the effort should be concentrated on the x-ray
measurements. Monte Carlo simulation of the x-ray measurements using EBT
films should be performed. By matching the geometries employed in experiments
and simulations, we can potentially resolve the discrepancy between simulations
and ionization chamber measurements. The absolute dose per electron profiles
calculated by Monte Carlo simulation can be compared to that measured by EBT
film, rather than normalizing both profiles to the center of the beam. The direct
comparison of absolute dose profiles in simulation and measurement can help
shed light on the currently unresolved discrepancy between ionization chamber
scans and Monte Carlo simulations.
The two drawbacks of EBT films are the high cost and limited size of the film.
The high cost can be reduced by using a single strip of film rather than a whole
sheet of film, but reliable spatial positioning techniques need to be developed
before thin strips of film can replace whole sheets of film. The limited size of the
film can be partially offset by mounting a square sheet of EBT film diagonally, so
that the width of the dose profiles measured can be increased by a factor of 1.4.
The geometric accuracy of such approach should be verified before the result can
be trusted.
113

Chapter 5 Conclusion
We successfully commissioned a GafChromic EBT protocol at NRC. Several
aspects of EBT film dosimetry presented in the literature have been investigated.
An EBT film dosimetry system consists of the EBT films and a scanner. We
purchased the Epson Expression 10000XL scanner, which is recommended by the
vendor of EBT film, and our measurements revealed that the 10000XL showed
equal or better performances than that reported for the Epson 1680Pro scanner,
which is the most widely reported scanner in the literature. We confirmed that the
scanner lamp does not permanently darken the EBT film in any measurable way,
and any apparent darkening during repeated scanning can be attributed to the
effect of rising temperature of the scanner bed. For the Epson 10000XL scanner,
this temperature effect can be ignored at our chosen scanning resolution. By
repeatedly scanning a single piece of EBT film, we characterized the scanner
fluctuation described in the literature, and found it to be a two-state process that
can be corrected with a reference piece procedure. Such correction allowed us to
achieve a 0.3 % or better reproducibility in scanning the same piece of film. This
excellent reproducibility in scanning allowed us to investigate the darkening of
EBT film in both the first 24 hours and up to three months after irradiation. We
confirmed that most of the darkening of EBT film occurs during the first 24 hours,
as reported in literature. We also showed that up to a 5 % increase in net optical
density can be observed after the first 24 hours, and this long-term darkening
appears to be dependent on the environmental history of EBT film after
irradiation. The good reproducibility in scanning a single piece of film also
allowed the accurate characterization of the scanner uniformity, a topic that has
been extensively reported in literature but no consensus has been reached. We
reported that longitudinal correction of scanner is negligible at the 0.2 % level.
The lateral correction of the scanner was found to be non-symmetric, which is
contrary to current assumptions. We also discovered that a single equation can be
used to describe the lateral corrections for all dose levels between 1 Gy and 8 Gy,
and this allowed us to implement a scanner uniformity correction protocol with a
single equation. We established a calibration protocol similar to ones reported in
114

the literature, and confirmed that a four parameter polynomial can be used to
accurately describe the calibration curve. We confirmed the energy and beam
modality independence of EBT film in megavoltage x-ray and electron beams,
which was assumed in the literature and claimed by the vendor. This energy
independence allowed us to apply EBT films calibrated in the Elekta accelerator
to Vickers accelerator experiments. After applying all corrections reported in the
literature, we concluded that the dominant limit to the accuracy of EBT film
dosimetry is the uniformity of EBT film's sensitive layer. This fluctuation in EBT
film's sensitivity is at the 2 % level and can not be reduced through pre-scanning.
Currently the solution to this sensitivity fluctuation is irradiating multiple pieces
of EBT films and averaging of the results.
Having established a protocol, we applied it in several situations: Cobalt Junior
QA work and Vickers accelerator experiments in Monte Carlo benchmarking. In
Vickers experiments, EBT films provided direct validation of circular symmetry
of both electron and photon beams produced by the accelerator, which has been
assumed in Monte Carlo simulations. In addition, EBT film measurements
provided an alternative method of measuring relative dose profiles of the Vickers
accelerator, serving as a complement to ionization chamber based measurements.
115

Bibliography
P. R. Almond, P. J. Biggs, B. M. Coursey, W. F. Hanson, M. Saiful Huq, R. Nath,
and D. W. O. Rogers, “AAPM's TG-51 protocol for clinical reference dosimetry
of high-energy photon and electron beams”, Med. Phys. 26, 1847-1870 (1999)
M. Anton, R. Peter Kapsch, M. Krystek and F. Renner, “Response of the alanine
/ESR dosimetry system to MV x-rays relative to 60Co radiation”, Phys. Med. Biol.
53 2753-2770 (2008)
L. J. van Battum, D. Hoffmans, H. Piersma, and S. Heukelom, “Accurate
dosimetry with GafChromicTM EBT film of a 6 MV photon beam in water:
What level is achievable?”, Med. Phys. 35, 704-716 (2008)
H. Bouchard, F. Lacroix, G. Beaudoin, J. Carrier, and I. Kawrakow, “On the
characterization and uncertainty analysis of radiochromic film dosimetry”, Med.
Phys. 36, 1931-1946 (2009)
M. J. Butson, T. Cheung, and P. K. N. Yu, “Absorption spectra variations of EBT
radiochromic film from radiation exposure,” Phys. Med. Biol. 50, N135–N140
(2005).
M. J. Butson, T. Cheung, and P. K. N. Yu, “Weak energy dependence of EBT
gafchromic film dose response in the 50 kVp-10 MVp x-ray range,” Appl. Radiat.
Isot. 64, 60–62 (2006).
S. Chiu-Tsao, T. Duckworth, C. Zhang, N. S. Patel, C. Hsiung, L. Wang, J. A.
Shih, and L. B. Harrison, “Dose response characteristics of new models of
GafCHromic films: Dependence on densitometer light source and radiation
energy,” Med. Phys. 31, 2501–2508 (2004).
S. Chiu-Tsao, Y. Ho, R. Shankar, L. Wang, and L. B. Harrison, “Energy
dependence of response of new high sensitivity radiochromic films for
megavoltage and kilovoltage radiation energies,” Med. Phys. 32, 3350– 3354
(2005).
116

S. Chiu-Tsao, Medich, and Munro III, “GAFCHROMIC® EBT film for 125I seed
dosimetry” Med. Phys. 35, 704-716 ( 2008).
S. Chiu-Tsao and M Chan, “Depth Dose and Profile Characteristics in the
Superficial Buildup Region Near Air Interface”, Med. Phys. 35 2727 (2008)
H Chung, B Lynch, and S Samant, “High precision GafChromic based clinical
dosimetry using standard flat bed scanner”, Med. Phys. 35 2786 (2008)
F Crop, B Van Rompaye, L Paelinck, L Vakaet, H Thierens and C De Wagter,
“On the calibration process of film dosimetry: OLS inverse regression versus
WLS inverse prediction”, Phys. Med. Biol. 53, 3971-3984 (2008)
S. Devic, J. Seuntjens, G. Hegyi, E. B. Podgorsak, C. G. Soares, A. S. Kirov, I.
Ali, J. F. Williamson, and A. Elizondo, “Dosimetric properties of improved
GafChromic films for seven different digitizers”, Med. Phys. 31, 2392–2401
(2004).
S. Devic, J. Seuntjens, E. Sham, E. B. Podgorsak, C. Ross Schmidtlein, A. S.
Kirov, and C. G. Soares, “Precise radiochromic film dosimetry using a flat-bed
document scanner”, Med. Phys. 32, 2245–2253 (2005)
S. Devic, J. Seuntjens, W. Abdel-Rahman, M. Evans, M. Olivares, E. B.
Podgorsak, Té Vuong, and C. G. Soares, “Accurate skin dose measurements using
radiochromic film in clinical applications,” Med. Phys. 33, 1116–1124 (2006).
S. Devic, N. Tomic, Z. Pang, J. Seuntjens, E. B. Podgorsak, and C. G. Soares,
“Absorption spectroscopy of EBT model GafChromic film,” Med. Phys. 34, 112–
118 (2007).
C. Fiandra, U. Ricardi, R. Ragona, S. Anglesio, F. R. Giglioli, E. Calamia, and F.
Lucio, “Clinical use of EBT model GafChromic film in radiotherapy,” Med. Phys.
33, 4314–4319 (2006).
M. Fuss, E. Sturtewagen, C. deWagter, and D. Georg, “Dosimetric
characterization of GafChromic EBT film and its implication on film dosimetry
quality assurance,” Phys. Med. Biol. 52, 4211–4225 (2007).
117

P. W. Hoban, M. Heydarian, W. A. Beckham and A. H. Beddoe, “Dose rate
dependence of a PTW diamond detector in the dosimetry of a 6 MV photon
beam”, Phys Med Biol. 39, 1219-1229 (1994)
B. M. Keller, C. Peressotti, and J. Pignol, “Optical imaging analysis of
microscopic radiation dose gradients in Gafchromic EBT film using a digital
microscope”, Med. Phys. 35, 3740-3747 (2008)
I. Kawrakow, "Accurate condensed history Monte Carlo simulation of electron
transport. I. EGSnrc, the new EGS4 version", Med. Phys. 27, 485-498 (2000)
N. V. Klassen , L. van der Zwan, and J. Cygler, “GafChromic MD-55:
Investigated as a precision dosimeter”, Med. Phys. 24, 1924-1934 (1997)
D. Lewis, “Gafchromic® EBT self-developing film for radiotherapy dosimetry,”
International Specialty Products, Wayne, NJ, accessed August 2007,
http://www.ispcorp.com
D. Lewis, “From EBT to EBT2”, invited talk at Ottawa General Hospital, April
2009
D. A. Low and J. F. Dempsey, “Evaluation of the gamma dose distribution
comparison method,” Med. Phys. 30, 2455–2464 (2003).
B. D. Lynch, J. Kozelka, M. K. Ranade, J. G. Li, W. E. Simon, and J. F. Dempsey,
“Important considerations for radiochromic film dosimetry with flatbed CCD
scanners and EBT GafChromic film,” Med. Phys. 33, 4551–4556 (2006)
M. Martišíková, B. Ackermann and O. Jäkel, “Analysis of uncertainties in
Gafchromic® EBT film dosimetry of photon beams”, Phys Med Biol, 53 7013-
7027 (2008)
M. R. McEwen and D. Niven, “Characterization of the phantom material Virtual
Water in high-energy photon and electron beams”, Med. Phys. 33, 876–887
(2006).
L. Menegotti, A. Delana and A. Martignano, “Radiochromic film dosimetry with
flatbed scanners: A fast and accurate method for dose calibration and uniformity
correction with single film exposure”, Med. Phys. 35, 3078-3085 (2008)
118
L. Paelinck, W. De Neve and C. De Wagter, “Precautions and strategies in using a
commercial flatbed scanner for radiochromic film dosimetry”, Phys. Med. Biol.
52, 231–242 (2007).
C. K. Ross, M. R. McEwen, A. F. McDonald, C. D. Cojocaru and B. A. Faddegon,
“Measurement of multiple scattering of 13 and 20 MeV electrons by thin foils",
Med. Phys. 35, 4121-4131 (2008)
A. Rink, I. Alex Vitkin, and D. A. Jaffray, “Energy dependence (75 kVp to 18
MV) of radiochromic films assessed using a real-time optical dosimeter” Med.
Phys. 34, 458–463 (2007)
A. Rink, D. F. Lewis, S. Varma, I. Alex Vitkin and D. A. Jaffray, “Temperature
and hydration effects on absorbance spectra and radiation sensitivity of a
radiochromic medium” Med. Phys. 35, 4545-4555 (2008)
S. Saur and J. Frengen, “GafChromic EBT film dosimetry with flatbed CCD
scanner: A novel background correction method and full dose uncertainty
analysis” Med. Phys. 35, 3094-3101 (2008)
F. Su, Y. Liu, S. Stathakisa, C. Shia, C. Esquivela, and N. Papanikolaoua,
"Dosimetry characteristics of GAFCHROMICs EBT film responding to
therapeutic electron beams", Applied Radiation and Isotopes 65, 1187–1192
(2007)
E Wilcox, G Daskalov, and L Nedialkova, “The Influence of Scanner Parameters
On the Accuracy of Film Dosimetry: A Comparison of the Epson Expression
1680 Flatbed and the Vidar VXR-16 Dosimetry PRO Film Scanners” Med. Phys.
34, 2496-2496 (2007).
O. A. Zeidan, S. Stephenson, S. Meeks, T. Wagner, T. Willoughby, P. Kupelian,
and K. Langen, “Characterization and use of EBT radiochromic film for IMRT
dose verification,” Med. Phys. 33, 4064–4072 (2006).
119