committee and public meeting notes
TRANSCRIPT

Attachment 1
Committee and Public Meeting Notes
DRAFT MEETING NOTES ROUTE 116 CORRIDOR STUDY: HINESBURG
Kick off Meeting – June 26, 2013, 4:00 p.m. at the Hinesburg Town Office. Present: Name: Representing: Alex Weinhagen Hinesburg Town Planner Andrea Morgante Hinesburg Selectboard Dennis Place Hinesburg Development Review Board Frank Koss Hinesburg Police Department John Roos Robert Bast Rolf Kiehlman Schuyler Jackson Joe Colangelo Hinesburg Town Administrator Christine Forde CCRPC Sai Sarapelli CCRPC Lucy Gibson Dubois & King, Inc. The meeting began with introductions Alex – defined the study area and goals of the study:
‐ Suggest actions, improvements, refinements ‐ Avoid future problems
‐ Specifics to include:
Should town take over? Stormwater – streams that define village need to be considered Traffic – peak hour congestion
Christine – the CCRPC has access to federal funds for studies. The town requested funds with a 20% match. In‐kind match can be used, incluing time for unpaid volunteers . Process includes 3 public meetings Sai – explained how the CCRPC travel demand model will be used for this study Rob – how much to stake or model?
‐ This study should focus on‐walking‐ is it factored in? Christine – model can tell us about all modes of travel, and CVU RD – has bike counts. Alex asked each person to provide their goals and issues for the study.
Rob – the study should focus on walkability of Hinesburg. The new book Walkable City provides some guidance and ideas. Dennis – DRB is always concerned about traffic, and the Westside Road will be his focus . Will it be moving problem from one spot to another? All traffic will funnel to CVU/116 intersection.
‐ There are two choke points – will new road help? ‐ Should West Side Road extend to Silver Street?
Rolf – there must be solutions that have worked in other communities.
‐ Quality of Life to promote living in town, walking, biking – ‐ Need this to expand village. ‐ Bypasses are not the answer ‐ Network of connected streets ‐ Wants to make village a nice place to live.
Rob ‐ Quality of Life – if we increase throughput, it will fill up.
‐ We might purposefully limit capacity. ‐ Roundabout – even mini‐roundabouts can work. ‐ US2/302 works really well now, back‐ups eliminated. ‐ CVU – intersections – could we have series thru town? ‐ Traffic Furniture – Gateways to reduce speeds
Andrea – need conversation of is RT 116 a Main Street? Or a corridor arterial?
‐ Land use – density – how do we get the density while protecting water quality? Parking? Fabric? Architectural Styles? Infrastructure needs to define what development would work.
‐ Lead towards Form Based Code – Frank – commute – Charlotte light – so few cars get thru.
‐ Signals don’t talk ‐ CVU Road intersections being worked on –
o Roundabout was rejected – but not unanimous o Planned for construction in 2016
‐ Need bike parking @ bus stations ‐ Not enough green time on 116. ‐ Need longer queue, detectors.
John – sidewalks, safety, minutia
‐ Lack of connectivity of sidewalks. ‐ Safety @ Silver St, especially in the PM – hard to turn North from Silver St. ‐ New sidewalk on West side of 116 – how do they cross Silver? How to safely cross
Rte. 116? ‐ Sidewalk at Commerce to go from Bakery to Mobil – need to use 3 crosswalks –
northern leg doesn’t have crosswalk. ‐ Exclusive pedestrian phase – not enough time for slower crossers.

‐ Traffic Divisions to Mechanicsville Road – then courtesy. ‐ To North Road, on East side – accidents Q lengths on 116 – Ruggs Road – does it
need roundabout? Growth? Should that be a roundabout? ‐ Bike lanes – needed, not safe to ride, need to consider buses.
Schuyler – concerned about planning for access
‐ We should get ahead of the game by planning ‐ New roads – need access plans.
Judy (guest)– is impressed by conversation, lives on 116, 5 houses north of Lantmans, white picket fence was knocked down by snow plow, wanted to live where she could walk everywhere, access to stores, restaurants, etc. not realizing how heavy traffic is. Speeding – a problem off peak 4:30 a.m. Sidewalks – concern – washout lands on sidewalk – mud – slippery – she fell once. People avoid sidewalks and divert out to street. Russell Hill – Soil washing out. Getting worse – (more rainfall) Patching is not working – is not safe for walking – Loves sidewalk on Mechanicsville to CVU Road Other comments: Maintenance costs should be evaluated. . Andrea – concerned about stormwater. There is a report that reviews impervious surface – available from Alex. Discussion of the role of Steering Committee
‐ Town and D&K hosts public meetings, not committee ‐ Committee should make recommendation to the selectboard
Other topics:
‐ Where is traffic coming from? ‐ No major development has been proposed to south, so why so much traffic? ‐ Route 116 is a shortcut – bypass of Route 7 from Addison County ‐ How should we measure traffic? Delay? ‐ What is cost of maintaining signals? ‐ VTrans manages lights – hard to get their attention to re‐time lights ‐ Detectors – need ones that pick up bicycles
Closing comments;
‐ Let’s look for opportunities to get ahead of these issues ‐ Make most of what the village has
Next meeting: Planned for August to review existing conditions.
Route 116 Corridor Study Steering Committee Meeting August 15,2013 6:00 PM Hinesburg, VT Town Office Attendees: Tyler Billingsley Schuyler Jackson Rolf Kielman Frank Koss Andrea Morgante Dennis Place John Roos Cathy Ryan Alex Weinhagen Christine Forde Sai Sarepalli Lucy Gibson Paul Greilich Absent: Rob Bast The meeting began with introductions, and Alex provided some background for the study. Lucy Gibson went through a powerpoint on project goals and an assessment of existing conditions. The following were points of discussion during this presentation. Project Goals ! Change transportation planning terminology in project goals
i.e. ‘multi modal’ and ‘arterial’ ! Differentiate 116 corridor study from Hinesburg as a whole
! “Plans and strategies that will provide for planned growth”
Several steering committee members expressed concerns that “planned growth” may give the public the impression that the town is actively promoting development, which is not the case
! Revised goal: Provide for a set of goals and strategies that will accommodate
for projected growth ! Alex: goals should not be too generic, and existing conditions should be
mentioned in goals

Project Vision ! Should be worded proactively
i.e. “Route 116 will provide transportation options…” instead of “Transportation options and choices are available…”
! Explain ‘choice of modes’ Break down planning/engineering terms for the
purposes of the public meeting Traffic counts ! Include counts/graphics south of study area, especially on 116 and North Rd.
! Safety issues on 116 associated with trucking raised
Trucks should be included in counts ! Do we have any data on which cars are single occupant vehicles? Would be
interesting to see ! Attach numbers to pedestrian volume map
Ongoing and Planned Projects ! Possibly avoid using the term “intersection improvements”; not everyone
perceives them as improvements ! 116 resurfacing project: shoulder widths say to be 4‐6 feet but are less in
places ! Discuss Hannaford project in detail, give a general overview
! Attach specific dates to planned and ongoing projects
! Sidewalks: differentiate between planned and desired sidewalk projects
! Silver street project: Add dates to before and after slides for reference; discuss
fixes didn’t address congestion issues, just safety Intersection Conditions ! Consider omitting delay statistics for public meeting

! Left turn into Lantman’s issue addressed; mentioned in Hannaford project ! Moving sidewalk to enable right turn out of Lantman’s (currently no right on
red) ! Some congestion caused by students being dropped off at school rather than
taking the bus, intensifies issue ! Add safe routes to school to presentation
Future Growth/Employment in Hinesburg ! Population and employment projections are inflated, should be omitted for
public meeting ! Revised projections will be coming from CCRPC – will break central TAZ into
15 sub zones ! Examine population growth around Hinesburg, particularly to the south
! Growth visioning scenario (maximum build out): recently posted to town
website, remains to be seen how it has been received, not popular with some already
! Maximum build out not keeping with Hinesburg’s character and is not feasible
in terms of infrastructure ! 80%/20% growth boundary development split is a County‐wide benchmark
and does not necessarily apply to Hinesburg alone ! Determine density of Hinesburg’s village as a whole for comparison at public
meeting
Towards the Public Meeting ! We need to be sure to clearly define the ultimate goal/deliverable for the study
! Outline how the plan will translate to results and how it will be useful rather
than never be implemented ! Include case studies to illustrate that the study can feasibly come to fruition
! Public meeting should be informational but also welcome input and ideas from residents
! Current resurfacing project on 116 may complicate public perception of the
problem ! Public meeting set for a Thursday in September (19th or 26th); cap at two hours
(7‐9 PM) ! 2nd meeting should be shortly after, either 9/30 or 10/2
Meeting adjourned at 8:30 p.m.
Public Meeting Notes
Rt. 116 Corridor Study Hinesburg Town Hall 9/24/13, 7:00‐9:00 Introduction by Alex Wienhagen
Brief introduction to the corridor study Context within the previous 116 corridor study (2004) that used data gathered in the late 1990s Elements of the plan that were implemented i.e. Silver Street intersection Of about 20 attendees at the meeting, 1/3 live in the village center; almost all drive through on Rt. 116
Presentation by Lucy Gibson Topics included description of a corridor study, outcomes of last Hinesburg corridor study, and a review of data on existing conditions from the corridor on transportation for all modes, land uses, growth trends, and safety The following questions and concerns were expressed during the presentation:
Concerns raised about the Hannaford project PM peak hour traffic affected by drivers letting each other go ‐ not reflected in the models Clarify LOS refers to vehicles in this case Concerns about Level of Service as an accurate measure of the quality and condition of Hinesburg’s
streets ‐ not just trying to move cars efficiently Congestion is limited almost exclusively to rush hour How does 11,000 AADT compare to neighboring towns Traffic lights increase aggressive driving as opposed to blinking red lights Higher density in Village could be contributing to congestion and causes safety issues with younger
children crossing the road We need to balance the needs of pedestrians and cars, but they have conflicting goals; vehicle travel time
is a quality of life issue Traffic congestion is jeopardizing Hinesburg's future, especially with the added development Congestion can easily worsen in the future
Following the presentation, specific issues regarding the corridor were solicited. The following lists the issues grouped by topic rather than in the exact chronological order. Walkability
Walking through village to CVU can't be done legally because there are no crosswalks There should be a pedestrian path at Mechanicsville Rd across 116 Walking to Public House up Mechanicsville; can't cross Route 116 legally (it was clarified that it is not
illegal to cross the road, but there is not a crosswalk provided to guide pedestrians to the safest crossing place).
Look at the unconventional ways in which people travel through town i.e. footpaths Walking from village to library should be possible

Density is a good thing, resident lives in Lyman Meadows, benefits of proximity and walking to various destinations
How about complete streets, creative solutions? Look for innovative ways to improve 116 and focus on walkability/livability
West Side Road
Is the project actually feasible? Reluctance on behalf of the land owners but it is needed, especially in light of future development in the
northwest portion of town The easiest part to complete is the northern terminus of the road There is also a portion of it being built during the next phase of a development to the south The issue is connecting them; there are some environmental concerns, wetlands, and some neighbors
would rather not see a new road Also it needs to bisect large parcel The purpose is not a bypass road See west side road feasibility study ‐ 2002? How about West side road south of Charlotte Rd to Silver Street? off the table Big believer in west side road Should be a bypass, get traffic off of 116 that is heading for Burlington
Safety
Bike and pedestrian safety crossing at Silver St and 116, especially after sidewalk construction Consider pedestrian lights ‐ south Burlington example where sidewalk goes into a school parking lot Pedestrians crossing more than two lanes have problems, especially elderly Needs to be pedestrian refuges for safer crossings
Congestion
Vermont is behind the curve on traffic congestion See us duplicating the blunders of other cities around the country by adding turn lanes and signals etc. Worried that there is a box we think in and need to think outside of; don't shy away from radical
solutions, give alternative forms of transportation a serious chance Concerns with how congested Commerce St and 116 intersection will become Make Mechanicsville Rd between commerce and 116 one way and possibly signalized
Monkton traffic — different option to access to CVU rd./Shelburne rd.
Projections/Models
Would like to see some more concrete projections and models for the next 20‐30 years Population AND traffic models because the two are interrelated; population will have a direct impact on
traffic congestion Make sure we account for those not commuting and are driving to destinations within Hinesburg‐ look at
Taft Corners, no one lives there but it is congested. How will this number grow if a business like Hannaford were to be located in Hinesburg?
Lucy: models distinguish between the two Sai: they are able to account for this from a regional perspective
Parking
If we want the village green to function as one, shouldn't we have more off street parking? A municipal parking lot would make it easier to find parking than looking for on street spaces
Alex: a lot had been proposed but needs to be looked at closer to determine the actual need for such a facility
School traffic
Traffic issues from both schools ‐ we need to coordinate with the schools and see what kind of strategies we can implement i.e. increased school bus ridership
During peak morning traffic when school is not in session there is no congestion (school vacation) Some can't afford to drive their children to school each day Current route is inefficient i.e. students who live a mile away may get picked up an hour early Explore other routes In light of population growth, how about separating the middle school and the high school Alex: demographically having less kids, not much immigration thus no foreseeable need to separate
schools Enrollment has fluctuated, frustrates administration Charlotte's population is dropping significantly, talks of a possible regional school
Signalization
Silver St and 116 should be signalized, is dysfunctional in current state Explore different signal timing for different times of the day
Town character
Moved to Hinesburg because it is small quaint town; we can't make the town an extension of Burlington Reinforce the reason we came here, retain small town feel, efforts should focus on that
Constraints/obstacles
Hydrology/geology of village may constrain these innovative solutions What if Hinesburg took ownership of 116? Could the study look into this and possibly provide a cost
estimate? Alex: cost biggest obstacle Look at underground utilities in relation to street trees so that trees are not impacted each time there is
construction


Hinesburg – Route 116 Corridor Study
Steering Committee Meeting 9/30/13 6:00 – 8:00
Introduction by Lucy Gibson
Steps taken so far in the process, results of public meeting, building consensus as we
move forward
Tentative goals of the 116 Corridor Study and feedback from Committee
Support of not increasing vehicular capacity
Alex: Like the focus, about making network more efficient; psychologically slow and
steady is preferable
People will alter their travel behavior accordingly by taking alternate routes
VTRANS claims courtesy intensifies congestion – steady flow of traffic will reduce this
courtesy
Silver Street – ideal location for a roundabout, grade issues
Improved transit and school bus service can translate to increased walkability
There are many different types of cycling ie family cycling vs. competitive cycling that
have different needs
Shoulders along the sides of 116 can be dangerous for cycling because of the debris that
is tossed by passing motorists
Side stripes are helpful for cycling, particularly for improved visibility for older riders
Issue is peak traffic though; how many residents are actually cycling to Burlington?
Sai: Most cycling will likely occur outside of peak hours
Alex: the issue is that we have a linear village that is sometimes too long for walking but
in many ways ideal for cycling; 116 should accommodate bikes and a family should be
able to cycle to and from different destinations within town
Revised Goal: Make village more walkable AND bikable

Walkability can increase property values; these types of investments are usually
worthwhile
Does walkability consider the elderly? Yes, improvements will be up to ADA standards;
these investments naturally aid elderly mobility
Danville, VT Streetscape project: only complaint is there wasn’t enough attention paid
to islands, traffic calming in town not locally responsive enough, but lots of good lessons
to take home from the project
Flashing pedestrian lights – experimental at this point; potential location at
Mechanicsville and 116 and also consider narrowing this intersection
Silver St. and 116 – Crossing issues, improved safety would also coincide with
reconfiguration of school bus route
School buses have a significant impact on traffic congestion
Night classes at CVU potentially complicating traffic as well
Investment Priorities – Areas of Focus
Future Village Center
Depends on outcome of Hannaford project
Commerce Street intersection south to fire station a potential location for future town
center area
Alex: how about Charlotte and 116 intersection? Depends on Lantmans; but will likely
still be a commercial building
Establish 2 main nodes/cores
Mechanicsville Rd and Route 116 Intersection
Crosswalk at Mechanicsville; also HAWK signal an option
Potentially making Mechanicsville one way or partially one way
Mechanicsville/116 intersection is problematic, some divert to Commerce Street to
avoid

Would allow the town to do something with the old fire station
One way conversion: relatively inexpensive change, but should be packaged as a benefit
for local landowners
Possible partial one way for business access and circulation
Silver Street and Rt. 116 Intersection
Lot acquired to the east and west in order to build a roundabout
Converging streets in a roundabout should have similar volumes
‘Bookending Roundabouts’ – potential roundabouts at CVU and Silver Street would
mark a clear entrance and exit to and from Hinesburg
Safety concerns with existing Silver Street intersection
But still, will not solve the issues at the Lantman’s intersection
Charlotte and Rt. 116
Coordination with VTRANS for Lantman’s intersection
We should try altering the signal timing at this intersection before we implement a
roundabout
Right now this intersection is dangerous for pedestrians
Right turn onto Charlotte
Would have significant decrease on peak traffic; would involving removing handicapped
parking spaces outside of town offices
Cheese factory road – could be accessed by public and integrated into the village street
network to relieve some congestion, explore different ways to utilize the site more
efficiently

Westside Road
How should it be designed?
Creekside (development) wasn’t built before the feasibility study was conducted
There is an emergency response time issue as well, police/ambulance can’t reach scene
of accident on 116 in a timely manner
West side road could be designed with short blocks with frequent stop signs to
discourage speeding
Was never meant to be a high speed connector; rather envisioned to be a low speed
street carrying local traffic
Lucy: needs to be simulated by traffic models in order to assess its impact on traffic
Potential parking issues along West Side Road
Moving Forward
Signal timing first priority
Explore the costs and benefits of local ownership of Rt. 116
Contact Redstone about parcel
CCTA for ridership statistics
Next steering committee meeting: Early November
Public Meeting – December to present different courses of action

Hinesburg, VT 116 Corridor Study
Steering Committee Meeting 11/6/13
Introduction by Alex Weinhagen
Welcome to our 4th meeting Purpose of tonight’s meeting: review alternatives and to supplement them with local knowledge Modeling still in progress, should have results in a week or so Likely not ready for a public meeting in December, should push the meeting to January and have
another steering committee meeting in December instead
Presentation by Lucy Gibson
Review of project goals: efficient vehicular movement, walkability, minimize stormwater, increase transit, provide a safe and efficient bicycle network
Silver Street
Peak hour traffic at this intersection is not as bad as it could be because people are letting each other go
Hard to gauge the speeds of oncoming cars through intersection Dealing with unintended consequences of the current design A signal here would be useless – traffic already backed up from Charlotte/116 intersection Concerns over proposed crosswalk; crossing 2 lanes of traffic, 3 lanes of pavement Let’s look at alternatives, should be flagged Silver Street would be an ideal location for a roundabout as a gateway to town – however, grade
issues for roundabout strategy – been talked about for 20 years
116/Charlotte
L&D recommendations – supported by VTRANS Has already been pursued and urged by the town Current signals are not advanced enough to deal with the intersection Backups at Lantman’s not always at peak hours Green phase extremely short There is an issue with the detector, new technology, identifies dark colored cars as shadows and
does not trigger a change This is the worst intersection but it’s not isolated in the transportation network Hannaford’s proposal rejected left turn lanes, informal turning arrangement

Room for up to 4 lanes, lanes would be narrow Lantman’s will likely be leased as retail space if Hannaford’s opens (80‐90 spaces in lot) Longer green phases will worsen backups on 116 VTRANS: looking at models and finding ways to optimize signals at this intersection Right on red @ Lantman’s: pedestrian sight issue Roundabouts need to be a solution for slow and efficient vehicle movement VTRANS: there are contaminated soils at the 116 and Charlotte Rd. intersection
Mechanicsville/116
Possible one way strategy – not much support from steering committee More of an opportunity rather than solving a specific problem Mechanicsville Rd not a top priority of this study However, the issue with the intersection is its design – wide and allows for speeds up to 50 mph Pedestrian safety issue, maybe this alternative could focus on this instead No need for on‐street parking or bike/pedestrian mobility on Mechanicsville Fix here should go forward only if it has positive impacts on other intersections Most people on this road are commuters or dropping their children off at school
Commerce Street
Diagonal pedestrian crossings should be explored, scramble phase On street parking configuration – there is currently a bioswale that would need to be moved Also: on‐street parking in this location would have no relation to surrounding development
because the adjacent plaza has a large parking lot along 116 There should be a sidewalk though that eventually extends to Mechanicsville State/Main in Montpelier example Textured crossings: problematic with traffic Expensive and needs to be installed on hot pavement; can last 10‐12 years with the right
conditions Stamped concrete could be a feasible option – Danville example Rendering of this for public meeting would be helpful VTRANS: consider town ownership – would allow much greater innovation and flexibility and
would still be under state paving program and eligible for federal funding 116 in village area: about 9/10 of a mile, eligible for about $10,000 class 1 funds CVU: still eligible as a high crash location If roadway is town owned, things like on street parking and narrower lane widths can be
explored Biggest issue: snow removal, signal maintenance

CVU/116
ROW process is currently underway, but will take around 18 months Latest outlook: late 2016, early 2017 Temporary fixes to help pedestrian crossings at this intersection should be explored
West Side Street
Si: modeling will be completed in phases Models should account for projected growth in the area Connection to Silver Street: off the table because of new development
Farmall Drive
Never planned for on‐street parking With on‐street parking, there isn’t any room for bikes, even at 24 feet We would like to see sharrows over on street parking, or 9 ft. travel lanes and bike lane(s) Less a need for parking, more concerns about volume, speed, and safety Speed humps are a possible option for controlling speeds, but can be problematic for fire and
emergency response vehicles Rumble strips will likely upset neighbors because of loud noise generated VTRANS: design of this road should depend on who is using it – locals wont speed, but if it’s a
through street expect higher speeds What about other additions to the street network, i.e. Central Road Phase “1b”, Cheese Factory Rd. already exists Issues with wetlands, will be costly For West Side Street as a bicycle option – it would be great to maintain a consistent feel for
cyclists Experimental striping on Charlotte – 12 to 9 ft. was a success, resulted in safer driving conditions
Traffic Calming
Can function as gateways to Hinesburg It may be a good strategy to start where there isn’t a lot of development Could be potentially included in current CVU/116 intersection project Traffic calming may be effective, but as soon as people are familiar they may resume fast speeds
Roundabouts
Let’s focus on intersections that need it most from a functional standpoint Balanced flows entering roundabouts a concern Riggs Road has potential for a roundabout; and cheaper than a light for a developer to build

Drivers along 116 may think that they always have priority Alex: moving towards the public meeting, the ‘general’ roundabout discussion is of limited
value, instead lets target a location with a solid recommendation, should be determined after obtaining relevant traffic data
Barre/Montpelier roundabout may be a better example because it is a commuter roundabout
Moving Forward
All agree to push public meeting, next steering committee meeting to be determined Next steering committee meeting early December, before 12/16

Public Meeting Notes
Rt. 116 Corridor Study Hinesburg Town Hall 2/11/14
Introduction by Alex Wienhagen, Director of Planning and Zoning Presentation by Lucy Gibson , Dubois and King
o Questions and comments welcome during the presentation o Open forum after presentation
Comments during presentation:
o Traffic Modeling: Do traffic forecasts assume continuation of existing behavior? o Discussion on modeling process, which does account for transit, bicycling and walking, but is also
based in part on past observed travel behavior, and may not account for significant demographic shifts. Current trends show decline in traffic volumes in many locations.
Bridge Options: The following options were presented for consideration, and attendees asked to voice
their preference. 1.) Build both bridges for all traffic – 8 votes 2.) Build Patrick Creek bridge for bike/pedestrians, Build canal bridge for all traffic – No votes 3.) Build both bridges for bike/pedestrians only – 2 votes 4.) No bridges – 6 votes o Depends largely on both cost and environmental impact o 2nd option: shouldn’t it be bike/ped connection to the south and bridge for traffic to the north? o Opportunity to integrate a larger bridge and floodway into this project
Reclassification
o Revenue to town should nearly offset additional annual expenses o More autonomy for design and priorities but more responsibility for maintenance, traffic signals,
bridges/culverts, pavement markings o VTrans Design Constraints make it difficult for traffic calming measures, mid‐block crosswalks, lane
and shoulder widths, on street parking, posted speed limits o VTrans starting to integrate smart growth designs but have legitimate concerns regarding
maintenance, will likely encourage town ownership of 116 so they do not have to make comprehensive policy changes
o We need to be careful of using federal money in the event of takeover, will run into regulatory obstacles to desired changes
o Town takeover will not necessitate extra staff, but may require overtime and an additional vehicle o Danville Project: was difficult to have progressive changes implemented, town has not taken over
ownership of roadway
Mechanicsville Road o Was Mechanicsville looked at being made a one way?

o Yes, but not a lot of support for this idea and was not pursued o Mechanicsville is LOS F during peak hours, but better most hours of the day it is fine. o Traffic analysis indicated that a signal or roundabout here would create an additional point of
queuing that would interfere with upstream intersections. o Allowing to remain unsignalized is mitigated by the alternate route available via Commerce St.
Silver Street Roundabout o Town owns considerable amount of land at Silver/116 intersection o A lot of room to work with in terms of design o Is it advisable to build a roundabout close to a traffic signal (ie Silver and Charlotte) – should have
some distance between the two o Silver St. intersection is dangerous, always close calls, drivers not always on the same page o Roundabout at Silver Street may worsen traffic moving north in the morning
General o Was school traffic considered in this study? o School is clearly the problem – there is no traffic when school is not in session o We should encourage more walking to school, remote pick up and drop off etc. o Money invested in Hinesburg’s transportation infrastructure will undoubtedly benefit people from
other towns, i.e. commuters, thus we need to balance cost of improvements with who will be seeing the benefits
Corridor Plan
o The following summarizes the comments received on the corridor plan.

CVU to Riggs
CVU Road Vtrans Project ‐ New Signal and Turning Lanes
Set aside 20 feet of right‐of‐way for shared use path
Mini Roundabouts for neighborhood traffic calming
Roundabout at Riggs Rd.
Riggs to Commerce
Address under‐sized culvert
Mini Roundabouts for neighborhood traffic calming
Raised textured intersection at Commerce Street
Northbound lane diet and bioswale with sidewalk
Curb extensions for traffic calming and stormwater
Commerce to Mechanicsville
Access Management and Sidewalk (west side of 116)
Sidewalk and Stormwater Swale (east side of 116)
Enhanced Crosswalks
Local Street Bridge (northwest of Cheese Factory)
Street Connection (Cheese Factory)
Charlotte to Silver
Raised textured intersection at Charlotte Rd.
Roundabout or Signal at Si lver St.
Silver to Buck Hill
Raised textured crosswalks
Shared Use path or new street connection
Extend Sidewalk to BuckHill Rd.
Mini roundabout or other gateway for traffic calming
Show sidewalk south of school on south side of Route 116
Visual cue? Line of trees south of intersection
Tiny bit of sidewalk needed at southern terminus
Corridor Recommendations ‐ Public Input Dot Exercise
Theres a pedestrian bridge planned by the developer of Kinney drugs, how will this impact planning?
Comments
Should be one path on each side of road instead of one extra wide path on one side For walkability we need sidewalks down Richmond Road
Island at center?
Consider no left turn at peak hours
Consider metered entry to intersection during peak hours instead of changing elevations
0
0
4
1
3
3
0
0
0
0
0
3
0
1
1
5
7
5
7
9
1
0
1
3
9
3
4
5
18
3
6
0
6
7
4
7
5
4
Support Oppose
5
9


Attachment 2
Traffic Level of Service Analyses

HCM Unsignalized Intersection Capacity Analysis 2019 AM Existing Geometry1: Route 116 & Silver St 2/8/2014
HInesburg Route 116 9/24/2013 Baseline Synchro 8 Report
Page 1
Movement EBL EBR NBL NBT SBT SBR
Lane Configurations
Volume (veh/h) 392 18 20 534 226 196
Sign Control Stop Free Free
Grade 0% 0% 0%
Peak Hour Factor 1.00 1.00 1.00 1.00 1.00 1.00
Hourly flow rate (vph) 392 18 20 534 226 196
Pedestrians
Lane Width (ft)
Walking Speed (ft/s)
Percent Blockage
Right turn flare (veh) 8
Median type None None
Median storage veh)
Upstream signal (ft)
pX, platoon unblocked
vC, conflicting volume 800 226 422
vC1, stage 1 conf vol
vC2, stage 2 conf vol
vCu, unblocked vol 800 226 422
tC, single (s) 6.4 6.2 4.1
tC, 2 stage (s)
tF (s) 3.5 3.3 2.2
p0 queue free % 0 98 98
cM capacity (veh/h) 348 813 1137
Direction, Lane # EB 1 NB 1 SB 1 SB 2
Volume Total 410 554 226 196
Volume Left 392 20 0 0
Volume Right 18 0 0 196
cSH 361 1137 1700 1700
Volume to Capacity 1.14 0.02 0.13 0.12
Queue Length 95th (ft) 396 1 0 0
Control Delay (s) 123.3 0.5 0.0 0.0
Lane LOS F A
Approach Delay (s) 123.3 0.5 0.0
Approach LOS F
Intersection Summary
Average Delay 36.7
Intersection Capacity Utilization 72.7% ICU Level of Service C
Analysis Period (min) 15

HCM Unsignalized Intersection Capacity Analysis 2019 AM Existing Geometry11: Route 116 & Mechanicsville 2/8/2014
HInesburg Route 116 9/24/2013 Baseline Synchro 8 Report
Page 2
Movement WBL WBR NBT NBR SBL SBT
Lane Configurations
Volume (veh/h) 138 8 852 307 8 378
Sign Control Stop Free Free
Grade 0% 0% 0%
Peak Hour Factor 1.00 1.00 1.00 1.00 1.00 1.00
Hourly flow rate (vph) 138 8 852 307 8 378
Pedestrians
Lane Width (ft)
Walking Speed (ft/s)
Percent Blockage
Right turn flare (veh)
Median type None None
Median storage veh)
Upstream signal (ft)
pX, platoon unblocked
vC, conflicting volume 1400 1006 1159
vC1, stage 1 conf vol
vC2, stage 2 conf vol
vCu, unblocked vol 1400 1006 1159
tC, single (s) 6.4 6.2 4.1
tC, 2 stage (s)
tF (s) 3.5 3.3 2.2
p0 queue free % 10 97 99
cM capacity (veh/h) 153 293 603
Direction, Lane # WB 1 NB 1 SB 1
Volume Total 146 1159 386
Volume Left 138 0 8
Volume Right 8 307 0
cSH 157 1700 603
Volume to Capacity 0.93 0.68 0.01
Queue Length 95th (ft) 169 0 1
Control Delay (s) 111.7 0.0 0.4
Lane LOS F A
Approach Delay (s) 111.7 0.0 0.4
Approach LOS F
Intersection Summary
Average Delay 9.7
Intersection Capacity Utilization 78.3% ICU Level of Service D
Analysis Period (min) 15

Lanes, Volumes, Timings 2019 AM Existing Geometry1: Route 116 & Silver St 2/8/2014
HInesburg Route 116 9/24/2013 Baseline Synchro 8 Report
Page 1
Lane Group EBL EBR NBL NBT SBT SBR
Lane Configurations
Volume (vph) 392 18 20 534 226 196
Ideal Flow (vphpl) 1900 1900 1900 1900 1900 1900
Lane Width (ft) 12 12 12 12 12 12
Grade (%) 0% 0% 0%
Storage Length (ft) 0 200 0 200
Storage Lanes 1 1 0 1
Taper Length (ft) 25 25
Lane Util. Factor 1.00 1.00 1.00 1.00 1.00 1.00
Ped Bike Factor
Frt 0.850 0.850
Flt Protected 0.950 0.998
Satd. Flow (prot) 1770 1583 0 1859 1863 1583
Flt Permitted 0.950 0.998
Satd. Flow (perm) 1770 1583 0 1859 1863 1583
Link Speed (mph) 30 30 30
Link Distance (ft) 372 388 542
Travel Time (s) 8.5 8.8 12.3
Confl. Peds. (#/hr)
Confl. Bikes (#/hr)
Peak Hour Factor 1.00 1.00 1.00 1.00 1.00 1.00
Growth Factor 100% 100% 100% 100% 100% 100%
Heavy Vehicles (%) 2% 2% 2% 2% 2% 2%
Bus Blockages (#/hr) 0 0 0 0 0 0
Parking (#/hr)
Mid-Block Traffic (%) 0% 0% 0%
Adj. Flow (vph) 392 18 20 534 226 196
Shared Lane Traffic (%)
Lane Group Flow (vph) 392 18 0 554 226 196
Sign Control Stop Free Free
Intersection Summary
Area Type: Other
Control Type: Unsignalized
Intersection Capacity Utilization 72.7% ICU Level of Service C
Analysis Period (min) 15
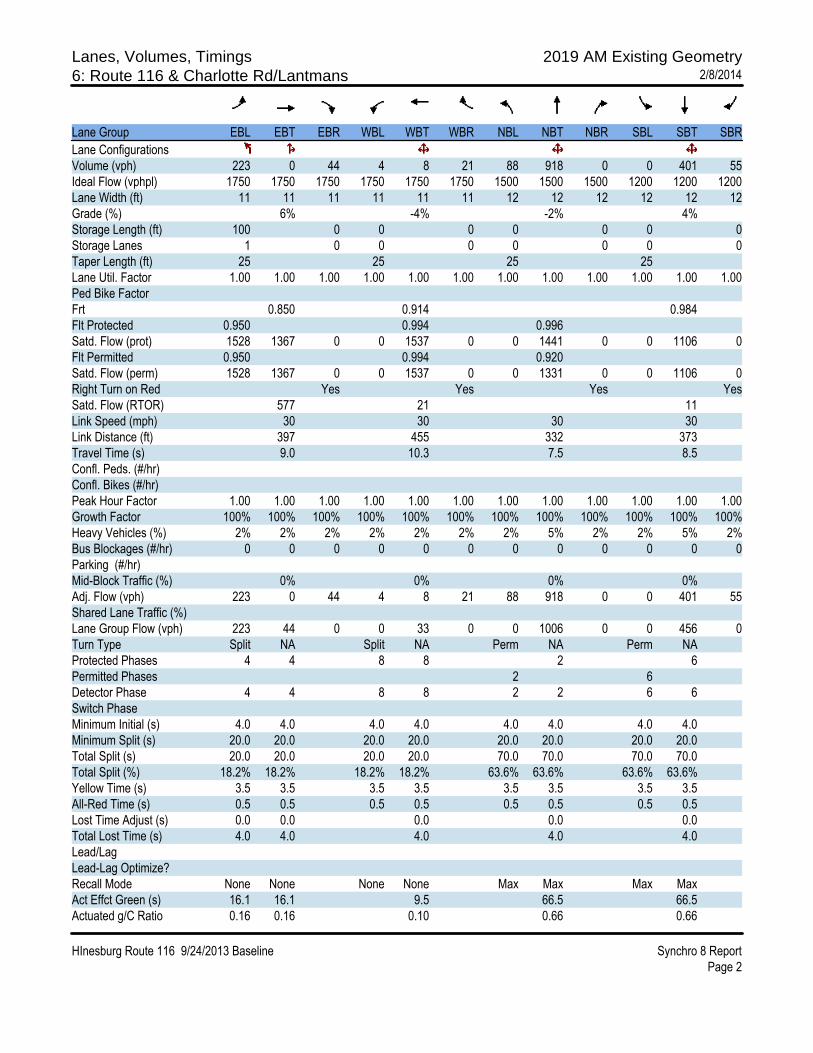
Lanes, Volumes, Timings 2019 AM Existing Geometry6: Route 116 & Charlotte Rd/Lantmans 2/8/2014
HInesburg Route 116 9/24/2013 Baseline Synchro 8 Report
Page 2
Lane Group EBL EBT EBR WBL WBT WBR NBL NBT NBR SBL SBT SBR
Lane Configurations
Volume (vph) 223 0 44 4 8 21 88 918 0 0 401 55
Ideal Flow (vphpl) 1750 1750 1750 1750 1750 1750 1500 1500 1500 1200 1200 1200
Lane Width (ft) 11 11 11 11 11 11 12 12 12 12 12 12
Grade (%) 6% -4% -2% 4%
Storage Length (ft) 100 0 0 0 0 0 0 0
Storage Lanes 1 0 0 0 0 0 0 0
Taper Length (ft) 25 25 25 25
Lane Util. Factor 1.00 1.00 1.00 1.00 1.00 1.00 1.00 1.00 1.00 1.00 1.00 1.00
Ped Bike Factor
Frt 0.850 0.914 0.984
Flt Protected 0.950 0.994 0.996
Satd. Flow (prot) 1528 1367 0 0 1537 0 0 1441 0 0 1106 0
Flt Permitted 0.950 0.994 0.920
Satd. Flow (perm) 1528 1367 0 0 1537 0 0 1331 0 0 1106 0
Right Turn on Red Yes Yes Yes Yes
Satd. Flow (RTOR) 577 21 11
Link Speed (mph) 30 30 30 30
Link Distance (ft) 397 455 332 373
Travel Time (s) 9.0 10.3 7.5 8.5
Confl. Peds. (#/hr)
Confl. Bikes (#/hr)
Peak Hour Factor 1.00 1.00 1.00 1.00 1.00 1.00 1.00 1.00 1.00 1.00 1.00 1.00
Growth Factor 100% 100% 100% 100% 100% 100% 100% 100% 100% 100% 100% 100%
Heavy Vehicles (%) 2% 2% 2% 2% 2% 2% 2% 5% 2% 2% 5% 2%
Bus Blockages (#/hr) 0 0 0 0 0 0 0 0 0 0 0 0
Parking (#/hr)
Mid-Block Traffic (%) 0% 0% 0% 0%
Adj. Flow (vph) 223 0 44 4 8 21 88 918 0 0 401 55
Shared Lane Traffic (%)
Lane Group Flow (vph) 223 44 0 0 33 0 0 1006 0 0 456 0
Turn Type Split NA Split NA Perm NA Perm NA
Protected Phases 4 4 8 8 2 6
Permitted Phases 2 6
Detector Phase 4 4 8 8 2 2 6 6
Switch Phase
Minimum Initial (s) 4.0 4.0 4.0 4.0 4.0 4.0 4.0 4.0
Minimum Split (s) 20.0 20.0 20.0 20.0 20.0 20.0 20.0 20.0
Total Split (s) 20.0 20.0 20.0 20.0 70.0 70.0 70.0 70.0
Total Split (%) 18.2% 18.2% 18.2% 18.2% 63.6% 63.6% 63.6% 63.6%
Yellow Time (s) 3.5 3.5 3.5 3.5 3.5 3.5 3.5 3.5
All-Red Time (s) 0.5 0.5 0.5 0.5 0.5 0.5 0.5 0.5
Lost Time Adjust (s) 0.0 0.0 0.0 0.0 0.0
Total Lost Time (s) 4.0 4.0 4.0 4.0 4.0
Lead/Lag
Lead-Lag Optimize?
Recall Mode None None None None Max Max Max Max
Act Effct Green (s) 16.1 16.1 9.5 66.5 66.5
Actuated g/C Ratio 0.16 0.16 0.10 0.66 0.66

Lanes, Volumes, Timings 2019 AM Existing Geometry6: Route 116 & Charlotte Rd/Lantmans 2/8/2014
HInesburg Route 116 9/24/2013 Baseline Synchro 8 Report
Page 3
Lane Group EBL EBT EBR WBL WBT WBR NBL NBT NBR SBL SBT SBR
v/c Ratio 0.91 0.06 0.20 1.14 0.62
Control Delay 82.0 0.2 25.8 96.0 16.0
Queue Delay 0.0 0.0 0.0 0.0 0.0
Total Delay 82.0 0.2 25.8 96.0 16.0
LOS F A C F B
Approach Delay 68.5 25.8 96.0 16.0
Approach LOS E C F B
Stops (vph) 180 0 16 704 265
Fuel Used(gal) 5 0 0 26 4
CO Emissions (g/hr) 378 10 26 1828 299
NOx Emissions (g/hr) 74 2 5 356 58
VOC Emissions (g/hr) 88 2 6 424 69
Dilemma Vehicles (#) 0 0 0 0 0
Queue Length 50th (ft) 142 0 7 ~759 148
Queue Length 95th (ft) #319 0 36 #1141 328
Internal Link Dist (ft) 317 375 252 293
Turn Bay Length (ft) 100
Base Capacity (vph) 246 704 265 885 739
Starvation Cap Reductn 0 0 0 0 0
Spillback Cap Reductn 0 0 0 0 0
Storage Cap Reductn 0 0 0 0 0
Reduced v/c Ratio 0.91 0.06 0.12 1.14 0.62
Intersection Summary
Area Type: Other
Cycle Length: 110
Actuated Cycle Length: 100
Natural Cycle: 150
Control Type: Semi Act-Uncoord
Maximum v/c Ratio: 1.14
Intersection Signal Delay: 69.8 Intersection LOS: E
Intersection Capacity Utilization 136.1% ICU Level of Service H
Analysis Period (min) 15
~ Volume exceeds capacity, queue is theoretically infinite.
Queue shown is maximum after two cycles.
# 95th percentile volume exceeds capacity, queue may be longer.
Queue shown is maximum after two cycles.
Splits and Phases: 6: Route 116 & Charlotte Rd/Lantmans

Lanes, Volumes, Timings 2019 AM Existing Geometry11: Route 116 & Mechanicsville 2/8/2014
HInesburg Route 116 9/24/2013 Baseline Synchro 8 Report
Page 4
Lane Group WBL WBR NBT NBR SBL SBT
Lane Configurations
Volume (vph) 138 8 852 307 8 378
Ideal Flow (vphpl) 1900 1900 1900 1900 1900 1900
Lane Width (ft) 12 12 12 12 12 12
Grade (%) 0% 0% 0%
Storage Length (ft) 0 0 0 0
Storage Lanes 1 0 0 0
Taper Length (ft) 25 25
Lane Util. Factor 1.00 1.00 1.00 1.00 1.00 1.00
Ped Bike Factor
Frt 0.993 0.964
Flt Protected 0.955 0.999
Satd. Flow (prot) 1766 0 1796 0 0 1861
Flt Permitted 0.955 0.999
Satd. Flow (perm) 1766 0 1796 0 0 1861
Link Speed (mph) 30 30 30
Link Distance (ft) 340 232 263
Travel Time (s) 7.7 5.3 6.0
Confl. Peds. (#/hr)
Confl. Bikes (#/hr)
Peak Hour Factor 1.00 1.00 1.00 1.00 1.00 1.00
Growth Factor 100% 100% 100% 100% 100% 100%
Heavy Vehicles (%) 2% 2% 2% 2% 2% 2%
Bus Blockages (#/hr) 0 0 0 0 0 0
Parking (#/hr)
Mid-Block Traffic (%) 0% 0% 0%
Adj. Flow (vph) 138 8 852 307 8 378
Shared Lane Traffic (%)
Lane Group Flow (vph) 146 0 1159 0 0 386
Sign Control Stop Free Free
Intersection Summary
Area Type: Other
Control Type: Unsignalized
Intersection Capacity Utilization 78.3% ICU Level of Service D
Analysis Period (min) 15

Lanes, Volumes, Timings 2019 AM Existing Geometry15: Route 116 & Farmall/Commerce 2/8/2014
HInesburg Route 116 9/24/2013 Baseline Synchro 8 Report
Page 5
Lane Group EBL EBT EBR WBL WBT WBR NBL NBT NBR SBL SBT SBR
Lane Configurations
Volume (vph) 105 13 195 29 10 26 6 747 116 51 301 8
Ideal Flow (vphpl) 1900 1900 1900 1900 1900 1900 1900 1900 1900 1900 1900 1900
Lane Width (ft) 12 12 12 12 12 12 12 12 12 12 12 12
Grade (%) 0% 0% 0% 0%
Storage Length (ft) 0 80 0 0 80 80 80 0
Storage Lanes 0 1 0 0 1 1 1 0
Taper Length (ft) 25 25 25 25
Lane Util. Factor 1.00 1.00 1.00 1.00 1.00 1.00 1.00 1.00 1.00 1.00 1.00 1.00
Ped Bike Factor
Frt 0.850 0.946 0.850 0.996
Flt Protected 0.957 0.978 0.950 0.950
Satd. Flow (prot) 0 1783 1583 0 1723 0 1770 1810 1583 1770 1804 0
Flt Permitted 0.707 0.784 0.950 0.950
Satd. Flow (perm) 0 1317 1583 0 1382 0 1770 1810 1583 1770 1804 0
Right Turn on Red Yes Yes Yes Yes
Satd. Flow (RTOR) 195 26 183 1
Link Speed (mph) 30 30 30 30
Link Distance (ft) 287 333 237 255
Travel Time (s) 6.5 7.6 5.4 5.8
Confl. Peds. (#/hr)
Confl. Bikes (#/hr)
Peak Hour Factor 1.00 1.00 1.00 1.00 1.00 1.00 1.00 1.00 1.00 1.00 1.00 1.00
Growth Factor 100% 100% 100% 100% 100% 100% 100% 100% 100% 100% 100% 100%
Heavy Vehicles (%) 2% 2% 2% 2% 2% 2% 2% 5% 2% 2% 5% 2%
Bus Blockages (#/hr) 0 0 0 0 0 0 0 0 0 0 0 0
Parking (#/hr)
Mid-Block Traffic (%) 0% 0% 0% 0%
Adj. Flow (vph) 105 13 195 29 10 26 6 747 116 51 301 8
Shared Lane Traffic (%)
Lane Group Flow (vph) 0 118 195 0 65 0 6 747 116 51 309 0
Turn Type Perm NA Perm Perm NA Prot NA Perm Prot NA
Protected Phases 4 8 5 2 1 6
Permitted Phases 4 4 8 2
Detector Phase 4 4 4 8 8 5 2 2 1 6
Switch Phase
Minimum Initial (s) 4.0 4.0 4.0 4.0 4.0 4.0 4.0 4.0 4.0 4.0
Minimum Split (s) 20.0 20.0 20.0 39.5 39.5 8.0 20.0 20.0 8.0 20.0
Total Split (s) 39.5 39.5 39.5 39.5 39.5 8.0 37.5 37.5 8.0 37.5
Total Split (%) 35.9% 35.9% 35.9% 35.9% 35.9% 7.3% 34.1% 34.1% 7.3% 34.1%
Yellow Time (s) 3.5 3.5 3.5 3.5 3.5 3.5 3.5 3.5 3.5 3.5
All-Red Time (s) 0.5 0.5 0.5 10.0 10.0 0.5 0.5 0.5 0.5 0.5
Lost Time Adjust (s) 0.0 0.0 0.0 0.0 0.0 0.0 0.0 0.0
Total Lost Time (s) 4.0 4.0 13.5 4.0 4.0 4.0 4.0 4.0
Lead/Lag Lead Lag Lag Lead Lag
Lead-Lag Optimize? Yes Yes Yes Yes Yes
Recall Mode None None None None None None Max Max None Max
Act Effct Green (s) 17.6 17.6 7.8 4.1 34.6 34.6 4.1 39.7
Actuated g/C Ratio 0.25 0.25 0.11 0.06 0.49 0.49 0.06 0.56

Lanes, Volumes, Timings 2019 AM Existing Geometry15: Route 116 & Farmall/Commerce 2/8/2014
HInesburg Route 116 9/24/2013 Baseline Synchro 8 Report
Page 6
Lane Group ø9
Lane Configurations
Volume (vph)
Ideal Flow (vphpl)
Lane Width (ft)
Grade (%)
Storage Length (ft)
Storage Lanes
Taper Length (ft)
Lane Util. Factor
Ped Bike Factor
Frt
Flt Protected
Satd. Flow (prot)
Flt Permitted
Satd. Flow (perm)
Right Turn on Red
Satd. Flow (RTOR)
Link Speed (mph)
Link Distance (ft)
Travel Time (s)
Confl. Peds. (#/hr)
Confl. Bikes (#/hr)
Peak Hour Factor
Growth Factor
Heavy Vehicles (%)
Bus Blockages (#/hr)
Parking (#/hr)
Mid-Block Traffic (%)
Adj. Flow (vph)
Shared Lane Traffic (%)
Lane Group Flow (vph)
Turn Type
Protected Phases 9
Permitted Phases
Detector Phase
Switch Phase
Minimum Initial (s) 4.0
Minimum Split (s) 25.0
Total Split (s) 25.0
Total Split (%) 23%
Yellow Time (s) 3.5
All-Red Time (s) 0.5
Lost Time Adjust (s)
Total Lost Time (s)
Lead/Lag
Lead-Lag Optimize?
Recall Mode None
Act Effct Green (s)
Actuated g/C Ratio

Lanes, Volumes, Timings 2019 AM Existing Geometry15: Route 116 & Farmall/Commerce 2/8/2014
HInesburg Route 116 9/24/2013 Baseline Synchro 8 Report
Page 7
Lane Group EBL EBT EBR WBL WBT WBR NBL NBT NBR SBL SBT SBR
v/c Ratio 0.36 0.36 0.37 0.06 0.84 0.13 0.50 0.30
Control Delay 28.2 6.5 28.1 39.2 29.7 1.0 54.7 12.8
Queue Delay 0.0 0.0 0.0 0.0 0.0 0.0 0.0 0.0
Total Delay 28.2 6.5 28.1 39.2 29.7 1.0 54.7 12.8
LOS C A C D C A D B
Approach Delay 14.7 28.1 26.0 18.7
Approach LOS B C C B
Stops (vph) 92 27 39 9 520 2 43 159
Fuel Used(gal) 1 1 1 0 9 0 1 2
CO Emissions (g/hr) 101 59 53 8 613 17 63 161
NOx Emissions (g/hr) 20 11 10 1 119 3 12 31
VOC Emissions (g/hr) 23 14 12 2 142 4 15 37
Dilemma Vehicles (#) 0 0 0 0 0 0 0 0
Queue Length 50th (ft) 39 0 15 2 237 0 21 49
Queue Length 95th (ft) 115 55 62 17 #778 8 #95 227
Internal Link Dist (ft) 207 253 157 175
Turn Bay Length (ft) 80 80 80 80
Base Capacity (vph) 685 917 542 103 888 870 103 1017
Starvation Cap Reductn 0 0 0 0 0 0 0 0
Spillback Cap Reductn 0 0 0 0 0 0 0 0
Storage Cap Reductn 0 0 0 0 0 0 0 0
Reduced v/c Ratio 0.17 0.21 0.12 0.06 0.84 0.13 0.50 0.30
Intersection Summary
Area Type: Other
Cycle Length: 110
Actuated Cycle Length: 70.4
Natural Cycle: 125
Control Type: Actuated-Uncoordinated
Maximum v/c Ratio: 0.84
Intersection Signal Delay: 22.2 Intersection LOS: C
Intersection Capacity Utilization 67.4% ICU Level of Service C
Analysis Period (min) 15
# 95th percentile volume exceeds capacity, queue may be longer.
Queue shown is maximum after two cycles.
Splits and Phases: 15: Route 116 & Farmall/Commerce

Lanes, Volumes, Timings 2019 AM Existing Geometry15: Route 116 & Farmall/Commerce 2/8/2014
HInesburg Route 116 9/24/2013 Baseline Synchro 8 Report
Page 8
Lane Group ø9
v/c Ratio
Control Delay
Queue Delay
Total Delay
LOS
Approach Delay
Approach LOS
Stops (vph)
Fuel Used(gal)
CO Emissions (g/hr)
NOx Emissions (g/hr)
VOC Emissions (g/hr)
Dilemma Vehicles (#)
Queue Length 50th (ft)
Queue Length 95th (ft)
Internal Link Dist (ft)
Turn Bay Length (ft)
Base Capacity (vph)
Starvation Cap Reductn
Spillback Cap Reductn
Storage Cap Reductn
Reduced v/c Ratio
Intersection Summary

Lanes, Volumes, Timings 2019 AM Existing Geometry20: Route 116 & Shelburne Falls/CVU 2/8/2014
HInesburg Route 116 9/24/2013 Baseline Synchro 8 Report
Page 9
Lane Group EBL EBT EBR WBL WBT WBR NBL NBT NBR SBL SBT SBR
Lane Configurations
Volume (vph) 40 236 70 49 136 189 159 615 27 117 241 24
Ideal Flow (vphpl) 1900 1900 1900 1900 1900 1900 1900 1900 1900 1900 1900 1900
Lane Width (ft) 12 12 12 12 12 12 12 12 12 12 12 12
Grade (%) 0% 0% 0% 0%
Storage Length (ft) 0 0 0 0 0 0 0 0
Storage Lanes 0 0 0 0 0 0 0 0
Taper Length (ft) 25 25 25 25
Lane Util. Factor 1.00 1.00 1.00 1.00 1.00 1.00 1.00 1.00 1.00 1.00 1.00 1.00
Ped Bike Factor
Frt 0.973 0.932 0.995 0.992
Flt Protected 0.994 0.993 0.990 0.985
Satd. Flow (prot) 0 1802 0 0 1724 0 0 1794 0 0 1787 0
Flt Permitted 0.884 0.870 0.845 0.697
Satd. Flow (perm) 0 1602 0 0 1510 0 0 1532 0 0 1264 0
Right Turn on Red Yes Yes Yes Yes
Satd. Flow (RTOR) 21 84 5 10
Link Speed (mph) 30 30 30 30
Link Distance (ft) 320 305 340 300
Travel Time (s) 7.3 6.9 7.7 6.8
Confl. Peds. (#/hr)
Confl. Bikes (#/hr)
Peak Hour Factor 1.00 1.00 1.00 1.00 1.00 1.00 1.00 1.00 1.00 1.00 1.00 1.00
Growth Factor 100% 100% 100% 100% 100% 100% 100% 100% 100% 100% 100% 100%
Heavy Vehicles (%) 2% 2% 2% 2% 2% 2% 2% 5% 2% 2% 5% 2%
Bus Blockages (#/hr) 0 0 0 0 0 0 0 0 0 0 0 0
Parking (#/hr)
Mid-Block Traffic (%) 0% 0% 0% 0%
Adj. Flow (vph) 40 236 70 49 136 189 159 615 27 117 241 24
Shared Lane Traffic (%)
Lane Group Flow (vph) 0 346 0 0 374 0 0 801 0 0 382 0
Turn Type Perm NA Perm NA Perm NA Perm NA
Protected Phases 4 8 2 6
Permitted Phases 4 8 2 6
Detector Phase 4 4 8 8 2 2 6 6
Switch Phase
Minimum Initial (s) 4.0 4.0 4.0 4.0 4.0 4.0 4.0 4.0
Minimum Split (s) 20.0 20.0 20.0 20.0 20.0 20.0 20.0 20.0
Total Split (s) 20.0 20.0 20.0 20.0 40.0 40.0 40.0 40.0
Total Split (%) 33.3% 33.3% 33.3% 33.3% 66.7% 66.7% 66.7% 66.7%
Yellow Time (s) 3.5 3.5 3.5 3.5 3.5 3.5 3.5 3.5
All-Red Time (s) 0.5 0.5 0.5 0.5 0.5 0.5 0.5 0.5
Lost Time Adjust (s) 0.0 0.0 0.0 0.0
Total Lost Time (s) 4.0 4.0 4.0 4.0
Lead/Lag
Lead-Lag Optimize?
Recall Mode None None None None Max Max Max Max
Act Effct Green (s) 14.6 14.6 36.0 36.0
Actuated g/C Ratio 0.25 0.25 0.61 0.61

Lanes, Volumes, Timings 2019 AM Existing Geometry20: Route 116 & Shelburne Falls/CVU 2/8/2014
HInesburg Route 116 9/24/2013 Baseline Synchro 8 Report
Page 10
Lane Group EBL EBT EBR WBL WBT WBR NBL NBT NBR SBL SBT SBR
v/c Ratio 0.83 0.85 0.85 0.49
Control Delay 39.3 36.8 21.3 9.1
Queue Delay 0.0 0.0 0.0 0.0
Total Delay 39.3 36.8 21.3 9.1
LOS D D C A
Approach Delay 39.3 36.8 21.3 9.1
Approach LOS D D C A
Stops (vph) 279 252 570 198
Fuel Used(gal) 5 5 9 3
CO Emissions (g/hr) 362 355 612 189
NOx Emissions (g/hr) 70 69 119 37
VOC Emissions (g/hr) 84 82 142 44
Dilemma Vehicles (#) 0 0 0 0
Queue Length 50th (ft) 108 97 209 66
Queue Length 95th (ft) #232 #231 #458 126
Internal Link Dist (ft) 240 225 260 220
Turn Bay Length (ft)
Base Capacity (vph) 452 473 942 780
Starvation Cap Reductn 0 0 0 0
Spillback Cap Reductn 0 0 0 0
Storage Cap Reductn 0 0 0 0
Reduced v/c Ratio 0.77 0.79 0.85 0.49
Intersection Summary
Area Type: Other
Cycle Length: 60
Actuated Cycle Length: 58.7
Natural Cycle: 60
Control Type: Actuated-Uncoordinated
Maximum v/c Ratio: 0.85
Intersection Signal Delay: 25.2 Intersection LOS: C
Intersection Capacity Utilization 86.5% ICU Level of Service E
Analysis Period (min) 15
# 95th percentile volume exceeds capacity, queue may be longer.
Queue shown is maximum after two cycles.
Splits and Phases: 20: Route 116 & Shelburne Falls/CVU

Queues Recommended Projects6: Route 116 & Charlotte Rd/Lantmans 2/8/2014
HInesburg Route 116 9/24/2013 Baseline Synchro 8 Report
Page 1
Lane Group EBL EBT EBR WBL WBT WBR NBL NBT NBR SBL SBT SBR
Lane Configurations
Volume (vph) 223 0 44 4 8 21 55 918 14 0 401 55
Ideal Flow (vphpl) 1750 1750 1750 1750 1750 1750 1500 1500 1500 1200 1200 1200
Lane Width (ft) 11 11 11 11 11 11 14 14 14 12 12 12
Grade (%) 6% -4% -2% 4%
Storage Length (ft) 80 0 0 0 0 0 0 0
Storage Lanes 1 0 0 0 0 0 0 0
Taper Length (ft) 25 25 25 25
Lane Util. Factor 1.00 1.00 1.00 1.00 1.00 1.00 1.00 1.00 1.00 1.00 1.00 1.00
Frt 0.850 0.914 0.998 0.984
Flt Protected 0.950 0.994 0.997
Satd. Flow (prot) 1528 1367 0 0 1537 0 0 1576 0 0 1134 0
Flt Permitted 0.736 0.972 0.953
Satd. Flow (perm) 1184 1367 0 0 1503 0 0 1507 0 0 1134 0
Right Turn on Red Yes Yes Yes Yes
Satd. Flow (RTOR) 517 21 2 18
Link Speed (mph) 30 30 30 30
Link Distance (ft) 397 455 332 373
Travel Time (s) 9.0 10.3 7.5 8.5
Peak Hour Factor 1.00 1.00 1.00 1.00 1.00 1.00 1.00 1.00 1.00 1.00 1.00 1.00
Adj. Flow (vph) 223 0 44 4 8 21 55 918 14 0 401 55
Shared Lane Traffic (%)
Lane Group Flow (vph) 223 44 0 0 33 0 0 987 0 0 456 0
Turn Type Perm NA Perm NA Perm NA Perm NA
Protected Phases 4 8 2 6
Permitted Phases 4 8 2 6
Detector Phase 4 4 8 8 2 2 6 6
Switch Phase
Minimum Initial (s) 4.0 4.0 4.0 4.0 4.0 4.0 4.0 4.0
Minimum Split (s) 22.0 22.0 22.0 22.0 22.0 22.0 22.0 22.0
Total Split (s) 22.0 22.0 22.0 22.0 68.0 68.0 68.0 68.0
Total Split (%) 24.4% 24.4% 24.4% 24.4% 75.6% 75.6% 75.6% 75.6%
Yellow Time (s) 4.0 4.0 4.0 4.0 4.0 4.0 4.0 4.0
All-Red Time (s) 2.0 2.0 2.0 2.0 2.0 2.0 2.0 2.0
Lost Time Adjust (s) 0.0 0.0 0.0 0.0 0.0
Total Lost Time (s) 6.0 6.0 6.0 6.0 6.0
Lead/Lag
Lead-Lag Optimize?
Recall Mode None None None None Max Max Max Max
Act Effct Green (s) 16.1 16.1 16.1 64.5 64.5
Actuated g/C Ratio 0.17 0.17 0.17 0.70 0.70
v/c Ratio 1.09 0.07 0.12 0.94 0.57
Control Delay 126.6 0.2 18.7 31.1 10.4
Queue Delay 0.0 0.0 0.0 0.0 0.0
Total Delay 126.6 0.2 18.7 31.1 10.4
LOS F A B C B
Approach Delay 105.8 18.7 31.1 10.4
Approach LOS F B C B
Stops (vph) 183 0 17 730 220

Queues Recommended Projects6: Route 116 & Charlotte Rd/Lantmans 2/8/2014
HInesburg Route 116 9/24/2013 Baseline Synchro 8 Report
Page 2
Lane Group EBL EBT EBR WBL WBT WBR NBL NBT NBR SBL SBT SBR
Fuel Used(gal) 7 0 0 13 4
CO Emissions (g/hr) 521 10 24 898 245
NOx Emissions (g/hr) 101 2 5 175 48
VOC Emissions (g/hr) 121 2 5 208 57
Dilemma Vehicles (#) 0 0 0 0 0
Queue Length 50th (ft) ~141 0 6 437 111
Queue Length 95th (ft) #281 0 31 #797 195
Internal Link Dist (ft) 317 375 252 293
Turn Bay Length (ft) 80
Base Capacity (vph) 205 664 277 1050 795
Starvation Cap Reductn 0 0 0 0 0
Spillback Cap Reductn 0 0 0 0 0
Storage Cap Reductn 0 0 0 0 0
Reduced v/c Ratio 1.09 0.07 0.12 0.94 0.57
Intersection Summary
Area Type: Other
Cycle Length: 90
Actuated Cycle Length: 92.6
Natural Cycle: 90
Control Type: Semi Act-Uncoord
Maximum v/c Ratio: 1.09
Intersection Signal Delay: 36.9 Intersection LOS: D
Intersection Capacity Utilization 139.9% ICU Level of Service H
Analysis Period (min) 15
~ Volume exceeds capacity, queue is theoretically infinite.
Queue shown is maximum after two cycles.
# 95th percentile volume exceeds capacity, queue may be longer.
Queue shown is maximum after two cycles.
Splits and Phases: 6: Route 116 & Charlotte Rd/Lantmans

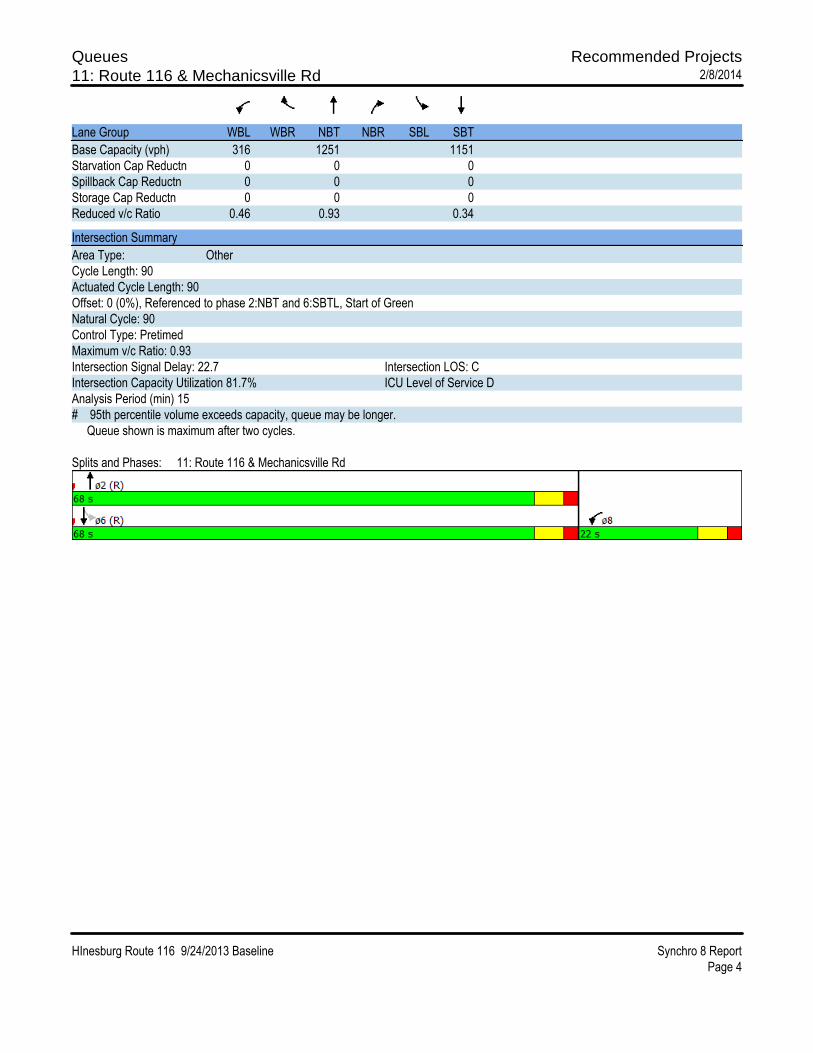
Queues Recommended Projects11: Route 116 & Mechanicsville Rd 2/8/2014
HInesburg Route 116 9/24/2013 Baseline Synchro 8 Report
Page 3
Lane Group WBL WBR NBT NBR SBL SBT
Lane Configurations
Volume (vph) 138 8 852 307 8 378
Ideal Flow (vphpl) 1900 1900 1900 1900 1900 1900
Lane Util. Factor 1.00 1.00 1.00 1.00 1.00 1.00
Frt 0.993 0.964
Flt Protected 0.955 0.999
Satd. Flow (prot) 1766 0 1796 0 0 1861
Flt Permitted 0.955 0.897
Satd. Flow (perm) 1766 0 1796 0 0 1671
Right Turn on Red Yes Yes
Satd. Flow (RTOR) 3 46
Link Speed (mph) 30 30 30
Link Distance (ft) 340 232 263
Travel Time (s) 7.7 5.3 6.0
Peak Hour Factor 1.00 1.00 1.00 1.00 1.00 1.00
Adj. Flow (vph) 138 8 852 307 8 378
Shared Lane Traffic (%)
Lane Group Flow (vph) 146 0 1159 0 0 386
Turn Type NA NA Perm NA
Protected Phases 8 2 6
Permitted Phases 6
Minimum Split (s) 22.0 22.0 22.0 22.0
Total Split (s) 22.0 68.0 68.0 68.0
Total Split (%) 24.4% 75.6% 75.6% 75.6%
Yellow Time (s) 4.0 4.0 4.0 4.0
All-Red Time (s) 2.0 2.0 2.0 2.0
Lost Time Adjust (s) 0.0 0.0 0.0
Total Lost Time (s) 6.0 6.0 6.0
Lead/Lag
Lead-Lag Optimize?
Act Effct Green (s) 16.0 62.0 62.0
Actuated g/C Ratio 0.18 0.69 0.69
v/c Ratio 0.46 0.93 0.34
Control Delay 37.9 26.2 6.6
Queue Delay 0.0 0.0 0.0
Total Delay 37.9 26.2 6.6
LOS D C A
Approach Delay 37.9 26.2 6.6
Approach LOS D C A
Stops (vph) 125 848 144
Fuel Used(gal) 2 13 2
CO Emissions (g/hr) 154 906 147
NOx Emissions (g/hr) 30 176 29
VOC Emissions (g/hr) 36 210 34
Dilemma Vehicles (#) 0 0 0
Queue Length 50th (ft) 74 475 77
Queue Length 95th (ft) 132 #874 119
Internal Link Dist (ft) 260 152 183
Turn Bay Length (ft)
Queues Recommended Projects11: Route 116 & Mechanicsville Rd 2/8/2014
HInesburg Route 116 9/24/2013 Baseline Synchro 8 Report
Page 4
Lane Group WBL WBR NBT NBR SBL SBT
Base Capacity (vph) 316 1251 1151
Starvation Cap Reductn 0 0 0
Spillback Cap Reductn 0 0 0
Storage Cap Reductn 0 0 0
Reduced v/c Ratio 0.46 0.93 0.34
Intersection Summary
Area Type: Other
Cycle Length: 90
Actuated Cycle Length: 90
Offset: 0 (0%), Referenced to phase 2:NBT and 6:SBTL, Start of Green
Natural Cycle: 90
Control Type: Pretimed
Maximum v/c Ratio: 0.93
Intersection Signal Delay: 22.7 Intersection LOS: C
Intersection Capacity Utilization 81.7% ICU Level of Service D
Analysis Period (min) 15
# 95th percentile volume exceeds capacity, queue may be longer.
Queue shown is maximum after two cycles.
Splits and Phases: 11: Route 116 & Mechanicsville Rd

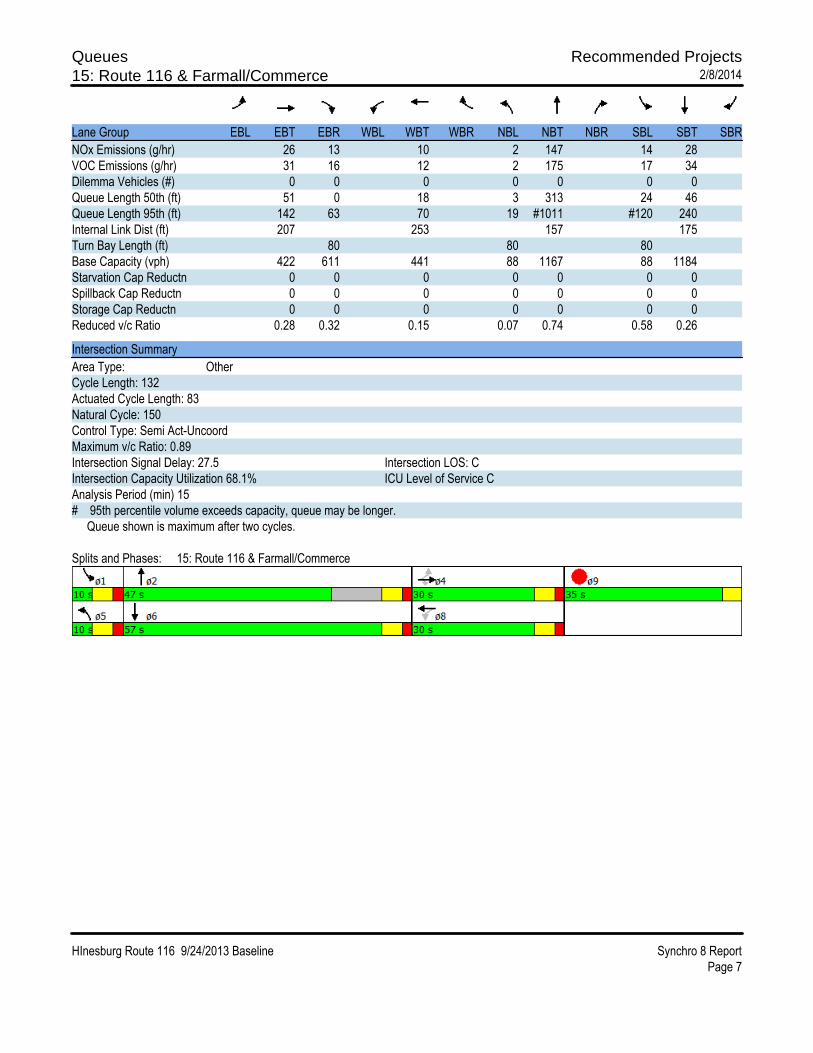
Queues Recommended Projects15: Route 116 & Farmall/Commerce 2/8/2014
HInesburg Route 116 9/24/2013 Baseline Synchro 8 Report
Page 5
Lane Group EBL EBT EBR WBL WBT WBR NBL NBT NBR SBL SBT SBR
Lane Configurations
Volume (vph) 105 13 195 29 10 26 6 747 116 51 304 8
Ideal Flow (vphpl) 1900 1900 1900 1900 1900 1900 1900 1900 1900 1900 1900 1900
Storage Length (ft) 0 80 0 0 80 0 80 0
Storage Lanes 0 1 0 0 1 0 1 0
Taper Length (ft) 25 25 25 25
Lane Util. Factor 1.00 1.00 1.00 1.00 1.00 1.00 1.00 1.00 1.00 1.00 1.00 1.00
Frt 0.850 0.946 0.980 0.996
Flt Protected 0.957 0.978 0.950 0.950
Satd. Flow (prot) 0 1783 1583 0 1723 0 1770 1825 0 1770 1855 0
Flt Permitted 0.755 0.806 0.950 0.950
Satd. Flow (perm) 0 1406 1583 0 1420 0 1770 1825 0 1770 1855 0
Right Turn on Red Yes Yes Yes Yes
Satd. Flow (RTOR) 195 22 7 1
Link Speed (mph) 30 30 30 30
Link Distance (ft) 287 333 237 255
Travel Time (s) 6.5 7.6 5.4 5.8
Peak Hour Factor 1.00 1.00 1.00 1.00 1.00 1.00 1.00 1.00 1.00 1.00 1.00 1.00
Adj. Flow (vph) 105 13 195 29 10 26 6 747 116 51 304 8
Shared Lane Traffic (%)
Lane Group Flow (vph) 0 118 195 0 65 0 6 863 0 51 312 0
Turn Type Perm NA Perm Perm NA Prot NA Prot NA
Protected Phases 4 8 5 2 1 6
Permitted Phases 4 4 8
Detector Phase 4 4 4 8 8 5 2 1 6
Switch Phase
Minimum Initial (s) 1.0 1.0 1.0 4.0 4.0 4.0 4.0 4.0 4.0
Minimum Split (s) 30.0 30.0 30.0 30.0 30.0 10.0 22.0 10.0 22.0
Total Split (s) 30.0 30.0 30.0 30.0 30.0 10.0 47.0 10.0 57.0
Total Split (%) 22.7% 22.7% 22.7% 22.7% 22.7% 7.6% 35.6% 7.6% 43.2%
Yellow Time (s) 4.0 4.0 4.0 4.0 4.0 4.0 4.0 4.0 4.0
All-Red Time (s) 2.0 2.0 2.0 2.0 2.0 2.0 2.0 2.0 2.0
Lost Time Adjust (s) 0.0 0.0 0.0 0.0 0.0 0.0 0.0
Total Lost Time (s) 6.0 6.0 6.0 6.0 6.0 6.0 6.0
Lead/Lag Lead Lag Lead Lag
Lead-Lag Optimize? Yes Yes Yes Yes
Recall Mode None None None None None None Max None Max
Act Effct Green (s) 12.8 12.8 12.8 4.2 44.0 4.2 53.0
Actuated g/C Ratio 0.15 0.15 0.15 0.05 0.53 0.05 0.64
v/c Ratio 0.54 0.48 0.27 0.07 0.89 0.58 0.26
Control Delay 44.0 9.7 27.2 47.5 32.7 69.2 11.1
Queue Delay 0.0 0.0 0.0 0.0 0.0 0.0 0.0
Total Delay 44.0 9.7 27.2 47.5 32.7 69.2 11.1
LOS D A C D C E B
Approach Delay 22.7 27.2 32.8 19.3
Approach LOS C C C B
Stops (vph) 102 26 38 8 632 43 135
Fuel Used(gal) 2 1 1 0 11 1 2
CO Emissions (g/hr) 132 68 52 8 757 74 145

Queues Recommended Projects15: Route 116 & Farmall/Commerce 2/8/2014
HInesburg Route 116 9/24/2013 Baseline Synchro 8 Report
Page 6
Lane Group ø9
Lane Configurations
Volume (vph)
Ideal Flow (vphpl)
Storage Length (ft)
Storage Lanes
Taper Length (ft)
Lane Util. Factor
Frt
Flt Protected
Satd. Flow (prot)
Flt Permitted
Satd. Flow (perm)
Right Turn on Red
Satd. Flow (RTOR)
Link Speed (mph)
Link Distance (ft)
Travel Time (s)
Peak Hour Factor
Adj. Flow (vph)
Shared Lane Traffic (%)
Lane Group Flow (vph)
Turn Type
Protected Phases 9
Permitted Phases
Detector Phase
Switch Phase
Minimum Initial (s) 4.0
Minimum Split (s) 35.0
Total Split (s) 35.0
Total Split (%) 27%
Yellow Time (s) 4.0
All-Red Time (s) 0.0
Lost Time Adjust (s)
Total Lost Time (s)
Lead/Lag
Lead-Lag Optimize?
Recall Mode None
Act Effct Green (s)
Actuated g/C Ratio
v/c Ratio
Control Delay
Queue Delay
Total Delay
LOS
Approach Delay
Approach LOS
Stops (vph)
Fuel Used(gal)
CO Emissions (g/hr)
Queues Recommended Projects15: Route 116 & Farmall/Commerce 2/8/2014
HInesburg Route 116 9/24/2013 Baseline Synchro 8 Report
Page 7
Lane Group EBL EBT EBR WBL WBT WBR NBL NBT NBR SBL SBT SBR
NOx Emissions (g/hr) 26 13 10 2 147 14 28
VOC Emissions (g/hr) 31 16 12 2 175 17 34
Dilemma Vehicles (#) 0 0 0 0 0 0 0
Queue Length 50th (ft) 51 0 18 3 313 24 46
Queue Length 95th (ft) 142 63 70 19 #1011 #120 240
Internal Link Dist (ft) 207 253 157 175
Turn Bay Length (ft) 80 80 80
Base Capacity (vph) 422 611 441 88 1167 88 1184
Starvation Cap Reductn 0 0 0 0 0 0 0
Spillback Cap Reductn 0 0 0 0 0 0 0
Storage Cap Reductn 0 0 0 0 0 0 0
Reduced v/c Ratio 0.28 0.32 0.15 0.07 0.74 0.58 0.26
Intersection Summary
Area Type: Other
Cycle Length: 132
Actuated Cycle Length: 83
Natural Cycle: 150
Control Type: Semi Act-Uncoord
Maximum v/c Ratio: 0.89
Intersection Signal Delay: 27.5 Intersection LOS: C
Intersection Capacity Utilization 68.1% ICU Level of Service C
Analysis Period (min) 15
# 95th percentile volume exceeds capacity, queue may be longer.
Queue shown is maximum after two cycles.
Splits and Phases: 15: Route 116 & Farmall/Commerce

Queues Recommended Projects15: Route 116 & Farmall/Commerce 2/8/2014
HInesburg Route 116 9/24/2013 Baseline Synchro 8 Report
Page 8
Lane Group ø9
NOx Emissions (g/hr)
VOC Emissions (g/hr)
Dilemma Vehicles (#)
Queue Length 50th (ft)
Queue Length 95th (ft)
Internal Link Dist (ft)
Turn Bay Length (ft)
Base Capacity (vph)
Starvation Cap Reductn
Spillback Cap Reductn
Storage Cap Reductn
Reduced v/c Ratio
Intersection Summary

Queues Recommended Projects20: Route 116 & Shelburne Falls Rd/CVU Road 2/8/2014
HInesburg Route 116 9/24/2013 Baseline Synchro 8 Report
Page 9
Lane Group EBL EBT EBR WBL WBT WBR NBL NBT NBR SBL SBT SBR
Lane Configurations
Volume (vph) 40 236 70 49 136 189 159 615 27 117 241 24
Ideal Flow (vphpl) 1900 1900 1900 1900 1900 1900 1900 1900 1900 1900 1900 1900
Storage Length (ft) 0 200 0 140 0 200 0 140
Storage Lanes 0 1 0 1 1 0 1 0
Taper Length (ft) 25 25 25 25
Lane Util. Factor 1.00 1.00 1.00 1.00 1.00 1.00 1.00 1.00 1.00 1.00 1.00 1.00
Frt 0.850 0.850 0.994 0.986
Flt Protected 0.993 0.987 0.950 0.950
Satd. Flow (prot) 0 1850 1583 0 1839 1583 1770 1852 0 1770 1837 0
Flt Permitted 0.918 0.724 0.596 0.316
Satd. Flow (perm) 0 1710 1583 0 1349 1583 1110 1852 0 589 1837 0
Right Turn on Red Yes Yes Yes Yes
Satd. Flow (RTOR) 70 189 6 13
Link Speed (mph) 30 30 30 30
Link Distance (ft) 320 305 340 300
Travel Time (s) 7.3 6.9 7.7 6.8
Peak Hour Factor 1.00 1.00 1.00 1.00 1.00 1.00 1.00 1.00 1.00 1.00 1.00 1.00
Adj. Flow (vph) 40 236 70 49 136 189 159 615 27 117 241 24
Shared Lane Traffic (%)
Lane Group Flow (vph) 0 276 70 0 185 189 159 642 0 117 265 0
Turn Type Perm NA Perm Perm NA Perm Perm NA Perm NA
Protected Phases 4 8 2 6
Permitted Phases 4 4 8 8 2 6
Detector Phase 4 4 4 8 8 8 2 2 6 6
Switch Phase
Minimum Initial (s) 4.0 4.0 4.0 4.0 4.0 4.0 4.0 4.0 4.0 4.0
Minimum Split (s) 22.0 22.0 22.0 22.0 22.0 22.0 22.0 22.0 22.0 22.0
Total Split (s) 22.0 22.0 22.0 22.0 22.0 22.0 38.0 38.0 38.0 38.0
Total Split (%) 36.7% 36.7% 36.7% 36.7% 36.7% 36.7% 63.3% 63.3% 63.3% 63.3%
Yellow Time (s) 4.0 4.0 4.0 4.0 4.0 4.0 4.0 4.0 4.0 4.0
All-Red Time (s) 2.0 2.0 2.0 2.0 2.0 2.0 2.0 2.0 2.0 2.0
Lost Time Adjust (s) 0.0 0.0 0.0 0.0 0.0 0.0 0.0 0.0
Total Lost Time (s) 6.0 6.0 6.0 6.0 6.0 6.0 6.0 6.0
Lead/Lag
Lead-Lag Optimize?
Recall Mode None None None None None None Max Max Max Max
Act Effct Green (s) 13.3 13.3 13.3 13.3 32.1 32.1 32.1 32.1
Actuated g/C Ratio 0.23 0.23 0.23 0.23 0.56 0.56 0.56 0.56
v/c Ratio 0.70 0.17 0.59 0.37 0.26 0.62 0.36 0.26
Control Delay 30.2 6.3 28.0 5.7 8.6 12.4 11.8 7.6
Queue Delay 0.0 0.0 0.0 0.0 0.0 0.0 0.0 0.0
Total Delay 30.2 6.3 28.0 5.7 8.6 12.4 11.8 7.6
LOS C A C A A B B A
Approach Delay 25.4 16.7 11.6 8.9
Approach LOS C B B A
Stops (vph) 239 17 156 30 80 412 67 122
Fuel Used(gal) 4 0 2 1 1 6 1 2
CO Emissions (g/hr) 259 25 165 58 80 391 65 119

Queues Recommended Projects20: Route 116 & Shelburne Falls Rd/CVU Road 2/8/2014
HInesburg Route 116 9/24/2013 Baseline Synchro 8 Report
Page 10
Lane Group EBL EBT EBR WBL WBT WBR NBL NBT NBR SBL SBT SBR
NOx Emissions (g/hr) 50 5 32 11 16 76 13 23
VOC Emissions (g/hr) 60 6 38 14 19 91 15 28
Dilemma Vehicles (#) 0 0 0 0 0 0 0 0
Queue Length 50th (ft) 87 0 57 0 26 138 21 41
Queue Length 95th (ft) 156 25 112 40 60 248 58 81
Internal Link Dist (ft) 240 225 260 220
Turn Bay Length (ft) 200 140
Base Capacity (vph) 478 492 376 578 620 1037 329 1032
Starvation Cap Reductn 0 0 0 0 0 0 0 0
Spillback Cap Reductn 0 0 0 0 0 0 0 0
Storage Cap Reductn 0 0 0 0 0 0 0 0
Reduced v/c Ratio 0.58 0.14 0.49 0.33 0.26 0.62 0.36 0.26
Intersection Summary
Area Type: Other
Cycle Length: 60
Actuated Cycle Length: 57.4
Natural Cycle: 55
Control Type: Semi Act-Uncoord
Maximum v/c Ratio: 0.70
Intersection Signal Delay: 14.6 Intersection LOS: B
Intersection Capacity Utilization 85.0% ICU Level of Service E
Analysis Period (min) 15
Splits and Phases: 20: Route 116 & Shelburne Falls Rd/CVU Road

HCM Unsignalized Intersection Capacity Analysis Recommended Projects1: Route 116 NB/Route 116 SB` & Silver Street 2/8/2014
HInesburg Route 116 9/24/2013 Baseline Synchro 8 Report
Page 1
Movement EBL EBR NBL NBT SBT SBR
Lane Configurations
Volume (veh/h) 392 18 20 534 226 196
Sign Control Yield Free Free
Grade 0% 0% 0%
Peak Hour Factor 1.00 1.00 1.00 1.00 1.00 1.00
Hourly flow rate (vph) 392 18 20 534 226 196
Pedestrians
Lane Width (ft)
Walking Speed (ft/s)
Percent Blockage
Right turn flare (veh)
Median type None None
Median storage veh)
Upstream signal (ft)
pX, platoon unblocked
vC, conflicting volume 800 226 422
vC1, stage 1 conf vol
vC2, stage 2 conf vol
vCu, unblocked vol 800 226 422
tC, single (s) 6.4 6.2 4.1
tC, 2 stage (s)
tF (s) 3.5 3.3 2.2
p0 queue free % 0 98 98
cM capacity (veh/h) 348 813 1137
Direction, Lane # EB 1 NB 1 SB 1 SB 2
Volume Total 410 554 226 196
Volume Left 392 20 0 0
Volume Right 18 0 0 196
cSH 357 1137 1700 1700
Volume to Capacity 1.15 0.02 0.13 0.12
Queue Length 95th (ft) 404 1 0 0
Control Delay (s) 128.2 0.5 0.0 0.0
Lane LOS F A
Approach Delay (s) 128.2 0.5 0.0
Approach LOS F
Intersection Summary
Average Delay 38.1
Intersection Capacity Utilization 73.8% ICU Level of Service D
Analysis Period (min) 15

HCM 2010 Roundabout Recommended Projects1: Route 116 NB/Route 116 SB` & Silver Street 2/8/2014
HInesburg Route 116 9/24/2013 Baseline Synchro 8 Report
Page 1
Intersection
Intersection Delay, s/veh 13.0
Intersection LOS B
Approach EB NB SB
Entry Lanes 1 1 2
Conflicting Circle Lanes 1 1 1
Adj Approach Flow, veh/h 410 554 422
Demand Flow Rate, veh/h 418 565 431
Vehicles Circulating, veh/h 231 400 20
Vehicles Exiting, veh/h 220 249 945
Follow-Up Headway, s 3.186 3.186 3.186
Ped Vol Crossing Leg, #/h 0 0 0
Ped Cap Adj 1.000 1.000 1.000
Approach Delay, s/veh 9.9 21.4 5.1
Approach LOS A C A
Lane Left Left Left Right
Designated Moves LR LT LT R
Assumed Moves LR LT LT R
RT Channelized
Lane Util 1.000 1.000 0.536 0.464
Critical Headway, s 5.193 5.193 5.193 5.193
Entry Flow, veh/h 418 565 231 200
Cap Entry Lane, veh/h 897 757 1108 1108
Entry HV Adj Factor 0.981 0.981 0.980 0.980
Flow Entry, veh/h 410 554 226 196
Cap Entry, veh/h 880 743 1086 1085
V/C Ratio 0.466 0.746 0.209 0.181
Control Delay, s/veh 9.9 21.4 5.2 4.9
LOS A C A A
95th %tile Queue, veh 3 7 1 1

HCM 2010 Roundabout Recommended Projects11: Route 116 & Mechanicsville Rd 2/8/2014
HInesburg Route 116 9/24/2013 Baseline Synchro 8 Report
Page 2
Intersection
Intersection Delay, s/veh 45.3
Intersection LOS E
Approach WB NB SB
Entry Lanes 1 1 1
Conflicting Circle Lanes 1 1 1
Adj Approach Flow, veh/h 146 1159 386
Demand Flow Rate, veh/h 149 1182 394
Vehicles Circulating, veh/h 869 8 141
Vehicles Exiting, veh/h 321 527 877
Follow-Up Headway, s 3.186 3.186 3.186
Ped Vol Crossing Leg, #/h 0 0 0
Ped Cap Adj 1.000 1.000 1.000
Approach Delay, s/veh 12.8 61.8 8.2
Approach LOS B F A
Lane Left Left Left
Designated Moves LR TR LT
Assumed Moves LR TR LT
RT Channelized
Lane Util 1.000 1.000 1.000
Critical Headway, s 5.193 5.193 5.193
Entry Flow, veh/h 149 1182 394
Cap Entry Lane, veh/h 474 1121 981
Entry HV Adj Factor 0.980 0.981 0.981
Flow Entry, veh/h 146 1159 386
Cap Entry, veh/h 464 1099 962
V/C Ratio 0.314 1.054 0.401
Control Delay, s/veh 12.8 61.8 8.2
LOS B F A
95th %tile Queue, veh 1 25 2
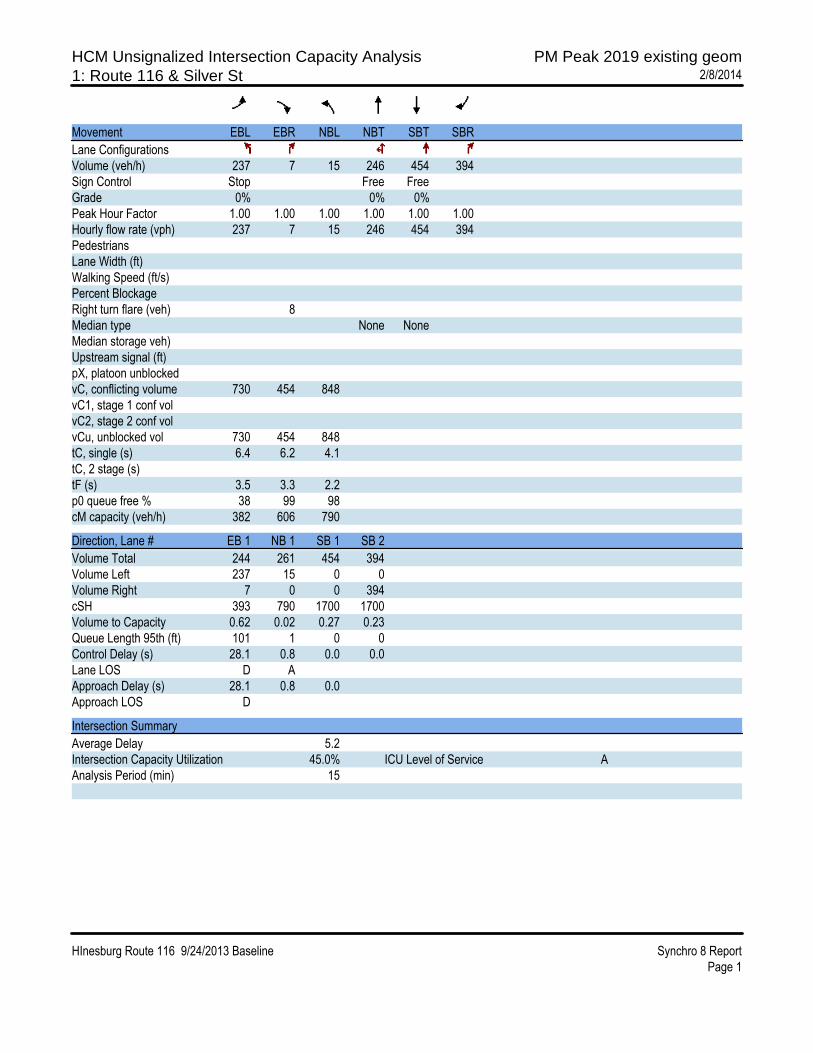
HCM Unsignalized Intersection Capacity Analysis PM Peak 2019 existing geom1: Route 116 & Silver St 2/8/2014
HInesburg Route 116 9/24/2013 Baseline Synchro 8 Report
Page 1
Movement EBL EBR NBL NBT SBT SBR
Lane Configurations
Volume (veh/h) 237 7 15 246 454 394
Sign Control Stop Free Free
Grade 0% 0% 0%
Peak Hour Factor 1.00 1.00 1.00 1.00 1.00 1.00
Hourly flow rate (vph) 237 7 15 246 454 394
Pedestrians
Lane Width (ft)
Walking Speed (ft/s)
Percent Blockage
Right turn flare (veh) 8
Median type None None
Median storage veh)
Upstream signal (ft)
pX, platoon unblocked
vC, conflicting volume 730 454 848
vC1, stage 1 conf vol
vC2, stage 2 conf vol
vCu, unblocked vol 730 454 848
tC, single (s) 6.4 6.2 4.1
tC, 2 stage (s)
tF (s) 3.5 3.3 2.2
p0 queue free % 38 99 98
cM capacity (veh/h) 382 606 790
Direction, Lane # EB 1 NB 1 SB 1 SB 2
Volume Total 244 261 454 394
Volume Left 237 15 0 0
Volume Right 7 0 0 394
cSH 393 790 1700 1700
Volume to Capacity 0.62 0.02 0.27 0.23
Queue Length 95th (ft) 101 1 0 0
Control Delay (s) 28.1 0.8 0.0 0.0
Lane LOS D A
Approach Delay (s) 28.1 0.8 0.0
Approach LOS D
Intersection Summary
Average Delay 5.2
Intersection Capacity Utilization 45.0% ICU Level of Service A
Analysis Period (min) 15

HCM Unsignalized Intersection Capacity Analysis PM Peak 2019 existing geom11: Route 116 & Mechanicsville 2/8/2014
HInesburg Route 116 9/24/2013 Baseline Synchro 8 Report
Page 2
Movement WBL WBR NBT NBR SBL SBT
Lane Configurations
Volume (veh/h) 171 9 420 175 3 806
Sign Control Stop Free Free
Grade 0% 0% 0%
Peak Hour Factor 1.00 1.00 1.00 1.00 1.00 1.00
Hourly flow rate (vph) 171 9 420 175 3 806
Pedestrians
Lane Width (ft)
Walking Speed (ft/s)
Percent Blockage
Right turn flare (veh)
Median type None None
Median storage veh)
Upstream signal (ft)
pX, platoon unblocked
vC, conflicting volume 1320 508 595
vC1, stage 1 conf vol
vC2, stage 2 conf vol
vCu, unblocked vol 1320 508 595
tC, single (s) 6.4 6.2 4.1
tC, 2 stage (s)
tF (s) 3.5 3.3 2.2
p0 queue free % 1 98 100
cM capacity (veh/h) 173 565 981
Direction, Lane # WB 1 NB 1 SB 1
Volume Total 180 595 809
Volume Left 171 0 3
Volume Right 9 175 0
cSH 179 1700 981
Volume to Capacity 1.01 0.35 0.00
Queue Length 95th (ft) 207 0 0
Control Delay (s) 122.1 0.0 0.1
Lane LOS F A
Approach Delay (s) 122.1 0.0 0.1
Approach LOS F
Intersection Summary
Average Delay 13.9
Intersection Capacity Utilization 61.5% ICU Level of Service B
Analysis Period (min) 15

Lanes, Volumes, Timings PM Peak 2019 existing geom1: Route 116 & Silver St 2/8/2014
HInesburg Route 116 9/24/2013 Baseline Synchro 8 Report
Page 1
Lane Group EBL EBR NBL NBT SBT SBR
Lane Configurations
Volume (vph) 237 7 15 246 454 394
Ideal Flow (vphpl) 1900 1900 1900 1900 1900 1900
Lane Width (ft) 12 12 12 12 12 12
Grade (%) 0% 0% 0%
Storage Length (ft) 0 200 0 200
Storage Lanes 1 1 0 1
Taper Length (ft) 25 25
Lane Util. Factor 1.00 1.00 1.00 1.00 1.00 1.00
Ped Bike Factor
Frt 0.850 0.850
Flt Protected 0.950 0.997
Satd. Flow (prot) 1770 1583 0 1807 1810 1583
Flt Permitted 0.950 0.997
Satd. Flow (perm) 1770 1583 0 1807 1810 1583
Link Speed (mph) 30 30 30
Link Distance (ft) 372 388 542
Travel Time (s) 8.5 8.8 12.3
Confl. Peds. (#/hr)
Confl. Bikes (#/hr)
Peak Hour Factor 1.00 1.00 1.00 1.00 1.00 1.00
Growth Factor 100% 100% 100% 100% 100% 100%
Heavy Vehicles (%) 2% 2% 2% 5% 5% 2%
Bus Blockages (#/hr) 0 0 0 0 0 0
Parking (#/hr)
Mid-Block Traffic (%) 0% 0% 0%
Adj. Flow (vph) 237 7 15 246 454 394
Shared Lane Traffic (%)
Lane Group Flow (vph) 237 7 0 261 454 394
Sign Control Stop Free Free
Intersection Summary
Area Type: Other
Control Type: Unsignalized
Intersection Capacity Utilization 45.0% ICU Level of Service A
Analysis Period (min) 15

Lanes, Volumes, Timings PM Peak 2019 existing geom6: Route 116 & Charlotte Rd/Lantmans 2/8/2014
HInesburg Route 116 9/24/2013 Baseline Synchro 8 Report
Page 2
Lane Group EBL EBT EBR WBL WBT WBR NBL NBT NBR SBL SBT SBR
Lane Configurations
Volume (vph) 117 0 55 70 14 62 33 417 22 0 844 130
Ideal Flow (vphpl) 1750 1750 1750 1750 1750 1750 1500 1500 1500 1500 1500 1500
Lane Width (ft) 11 11 11 11 11 11 14 14 14 12 12 12
Grade (%) 6% -4% -2% 4%
Storage Length (ft) 100 0 0 0 0 0 0 0
Storage Lanes 1 0 0 0 0 0 0 0
Taper Length (ft) 25 25 25 25
Lane Util. Factor 1.00 1.00 1.00 1.00 1.00 1.00 1.00 1.00 1.00 1.00 1.00 1.00
Ped Bike Factor
Frt 0.850 0.943 0.994 0.982
Flt Protected 0.950 0.977 0.997
Satd. Flow (prot) 1528 1367 0 0 1559 0 0 1530 0 0 1380 0
Flt Permitted 0.950 0.977 0.597
Satd. Flow (perm) 1528 1367 0 0 1559 0 0 916 0 0 1380 0
Right Turn on Red Yes No Yes Yes
Satd. Flow (RTOR) 236 4 11
Link Speed (mph) 30 30 30 30
Link Distance (ft) 397 455 332 373
Travel Time (s) 9.0 10.3 7.5 8.5
Confl. Peds. (#/hr)
Confl. Bikes (#/hr)
Peak Hour Factor 1.00 1.00 1.00 1.00 1.00 1.00 1.00 1.00 1.00 1.00 1.00 1.00
Growth Factor 100% 100% 100% 100% 100% 100% 100% 100% 100% 100% 100% 100%
Heavy Vehicles (%) 2% 2% 2% 2% 2% 2% 2% 5% 2% 2% 5% 2%
Bus Blockages (#/hr) 0 0 0 0 0 0 0 0 0 0 0 0
Parking (#/hr)
Mid-Block Traffic (%) 0% 0% 0% 0%
Adj. Flow (vph) 117 0 55 70 14 62 33 417 22 0 844 130
Shared Lane Traffic (%)
Lane Group Flow (vph) 117 55 0 0 146 0 0 472 0 0 974 0
Turn Type Split NA Split NA Perm NA Perm NA
Protected Phases 4 4 8 8 2 6
Permitted Phases 2 6
Detector Phase 4 4 8 8 2 2 6 6
Switch Phase
Minimum Initial (s) 4.0 4.0 4.0 4.0 4.0 4.0 4.0 4.0
Minimum Split (s) 22.0 22.0 22.0 22.0 22.0 22.0 20.0 20.0
Total Split (s) 22.0 22.0 22.0 22.0 76.0 76.0 76.0 76.0
Total Split (%) 18.3% 18.3% 18.3% 18.3% 63.3% 63.3% 63.3% 63.3%
Yellow Time (s) 4.0 4.0 4.0 4.0 4.0 4.0 4.0 4.0
All-Red Time (s) 2.0 2.0 2.0 2.0 2.0 2.0 2.0 2.0
Lost Time Adjust (s) 0.0 0.0 0.0 0.0 0.0
Total Lost Time (s) 6.0 6.0 6.0 6.0 6.0
Lead/Lag
Lead-Lag Optimize?
Recall Mode None None None None Max Max Max Max
Act Effct Green (s) 13.1 13.1 14.3 70.2 70.2
Actuated g/C Ratio 0.11 0.11 0.12 0.61 0.61

Lanes, Volumes, Timings PM Peak 2019 existing geom6: Route 116 & Charlotte Rd/Lantmans 2/8/2014
HInesburg Route 116 9/24/2013 Baseline Synchro 8 Report
Page 3
Lane Group EBL EBT EBR WBL WBT WBR NBL NBT NBR SBL SBT SBR
v/c Ratio 0.68 0.15 0.76 0.85 1.16
Control Delay 69.2 0.9 74.5 36.1 108.5
Queue Delay 0.0 0.0 0.0 0.0 0.0
Total Delay 69.2 0.9 74.5 36.1 108.5
LOS E A E D F
Approach Delay 47.3 74.5 36.1 108.5
Approach LOS D E D F
Stops (vph) 111 0 132 359 748
Fuel Used(gal) 3 0 3 7 28
CO Emissions (g/hr) 183 13 242 467 1990
NOx Emissions (g/hr) 36 2 47 91 387
VOC Emissions (g/hr) 43 3 56 108 461
Dilemma Vehicles (#) 0 0 0 0 0
Queue Length 50th (ft) 86 0 108 284 ~895
Queue Length 95th (ft) 150 0 #203 #537 #1174
Internal Link Dist (ft) 317 375 252 293
Turn Bay Length (ft) 100
Base Capacity (vph) 211 392 215 557 841
Starvation Cap Reductn 0 0 0 0 0
Spillback Cap Reductn 0 0 0 0 0
Storage Cap Reductn 0 0 0 0 0
Reduced v/c Ratio 0.55 0.14 0.68 0.85 1.16
Intersection Summary
Area Type: Other
Cycle Length: 120
Actuated Cycle Length: 115.6
Natural Cycle: 150
Control Type: Semi Act-Uncoord
Maximum v/c Ratio: 1.16
Intersection Signal Delay: 80.3 Intersection LOS: F
Intersection Capacity Utilization 92.1% ICU Level of Service F
Analysis Period (min) 15
~ Volume exceeds capacity, queue is theoretically infinite.
Queue shown is maximum after two cycles.
# 95th percentile volume exceeds capacity, queue may be longer.
Queue shown is maximum after two cycles.
Splits and Phases: 6: Route 116 & Charlotte Rd/Lantmans
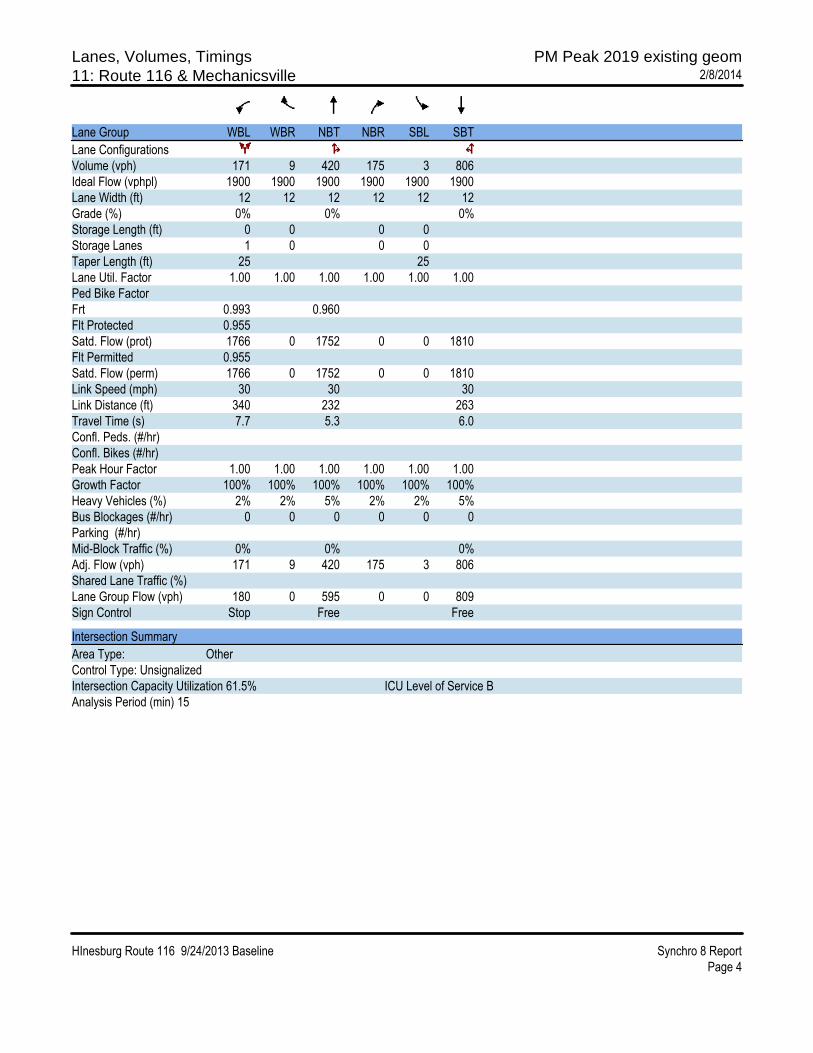
Lanes, Volumes, Timings PM Peak 2019 existing geom11: Route 116 & Mechanicsville 2/8/2014
HInesburg Route 116 9/24/2013 Baseline Synchro 8 Report
Page 4
Lane Group WBL WBR NBT NBR SBL SBT
Lane Configurations
Volume (vph) 171 9 420 175 3 806
Ideal Flow (vphpl) 1900 1900 1900 1900 1900 1900
Lane Width (ft) 12 12 12 12 12 12
Grade (%) 0% 0% 0%
Storage Length (ft) 0 0 0 0
Storage Lanes 1 0 0 0
Taper Length (ft) 25 25
Lane Util. Factor 1.00 1.00 1.00 1.00 1.00 1.00
Ped Bike Factor
Frt 0.993 0.960
Flt Protected 0.955
Satd. Flow (prot) 1766 0 1752 0 0 1810
Flt Permitted 0.955
Satd. Flow (perm) 1766 0 1752 0 0 1810
Link Speed (mph) 30 30 30
Link Distance (ft) 340 232 263
Travel Time (s) 7.7 5.3 6.0
Confl. Peds. (#/hr)
Confl. Bikes (#/hr)
Peak Hour Factor 1.00 1.00 1.00 1.00 1.00 1.00
Growth Factor 100% 100% 100% 100% 100% 100%
Heavy Vehicles (%) 2% 2% 5% 2% 2% 5%
Bus Blockages (#/hr) 0 0 0 0 0 0
Parking (#/hr)
Mid-Block Traffic (%) 0% 0% 0%
Adj. Flow (vph) 171 9 420 175 3 806
Shared Lane Traffic (%)
Lane Group Flow (vph) 180 0 595 0 0 809
Sign Control Stop Free Free
Intersection Summary
Area Type: Other
Control Type: Unsignalized
Intersection Capacity Utilization 61.5% ICU Level of Service B
Analysis Period (min) 15

Lanes, Volumes, Timings PM Peak 2019 existing geom15: Route 116 & Farmall/Commerce 2/8/2014
HInesburg Route 116 9/24/2013 Baseline Synchro 8 Report
Page 5
Lane Group EBL EBT EBR WBL WBT WBR NBL NBT NBR SBL SBT SBR
Lane Configurations
Volume (vph) 24 8 51 214 9 122 36 283 152 147 573 43
Ideal Flow (vphpl) 1900 1900 1900 1900 1900 1900 1900 1900 1900 1900 1900 1900
Lane Width (ft) 12 12 12 12 12 12 12 12 12 12 12 12
Grade (%) 0% 0% 0% 0%
Storage Length (ft) 0 80 0 0 80 80 80 0
Storage Lanes 0 1 0 0 1 1 1 0
Taper Length (ft) 25 25 25 25
Lane Util. Factor 1.00 1.00 1.00 1.00 1.00 1.00 1.00 1.00 1.00 1.00 1.00 1.00
Ped Bike Factor
Frt 0.850 0.952 0.850 0.990
Flt Protected 0.964 0.970 0.950 0.950
Satd. Flow (prot) 0 1796 1583 0 1720 0 1770 1810 1583 1770 1795 0
Flt Permitted 0.733 0.792 0.950 0.950
Satd. Flow (perm) 0 1365 1583 0 1404 0 1770 1810 1583 1770 1795 0
Right Turn on Red Yes Yes Yes Yes
Satd. Flow (RTOR) 130 22 130 3
Link Speed (mph) 30 30 30 30
Link Distance (ft) 287 333 237 255
Travel Time (s) 6.5 7.6 5.4 5.8
Confl. Peds. (#/hr)
Confl. Bikes (#/hr)
Peak Hour Factor 1.00 1.00 1.00 1.00 1.00 1.00 1.00 1.00 1.00 1.00 1.00 1.00
Growth Factor 100% 100% 100% 100% 100% 100% 100% 100% 100% 100% 100% 100%
Heavy Vehicles (%) 2% 2% 2% 2% 2% 2% 2% 5% 2% 2% 5% 2%
Bus Blockages (#/hr) 0 0 0 0 0 0 0 0 0 0 0 0
Parking (#/hr)
Mid-Block Traffic (%) 0% 0% 0% 0%
Adj. Flow (vph) 24 8 51 214 9 122 36 283 152 147 573 43
Shared Lane Traffic (%)
Lane Group Flow (vph) 0 32 51 0 345 0 36 283 152 147 616 0
Turn Type Perm NA Perm Perm NA Prot NA Perm Prot NA
Protected Phases 4 8 5 2 1 6
Permitted Phases 4 4 8 2
Detector Phase 4 4 4 8 8 5 2 2 1 6
Switch Phase
Minimum Initial (s) 7.0 7.0 7.0 7.0 7.0 7.0 7.0 7.0 7.0 7.0
Minimum Split (s) 20.0 20.0 20.0 43.5 43.5 13.0 20.0 20.0 13.0 20.0
Total Split (s) 43.5 43.5 43.5 43.5 43.5 13.0 32.5 32.5 17.0 38.5
Total Split (%) 34.5% 34.5% 34.5% 34.5% 34.5% 10.3% 25.8% 25.8% 13.5% 30.6%
Yellow Time (s) 4.0 4.0 4.0 4.0 4.0 4.0 4.0 4.0 4.0 4.0
All-Red Time (s) 2.0 2.0 2.0 2.0 2.0 2.0 2.0 2.0 2.0 2.0
Lost Time Adjust (s) 0.0 0.0 0.0 0.0 0.0 0.0 0.0 0.0
Total Lost Time (s) 6.0 6.0 6.0 6.0 6.0 6.0 6.0 6.0
Lead/Lag Lead Lag Lag Lead Lag
Lead-Lag Optimize? Yes Yes Yes Yes Yes
Recall Mode None None None None None None Max Max None Max
Act Effct Green (s) 25.3 25.3 25.3 7.2 28.5 28.5 11.4 38.8
Actuated g/C Ratio 0.29 0.29 0.29 0.08 0.33 0.33 0.13 0.44
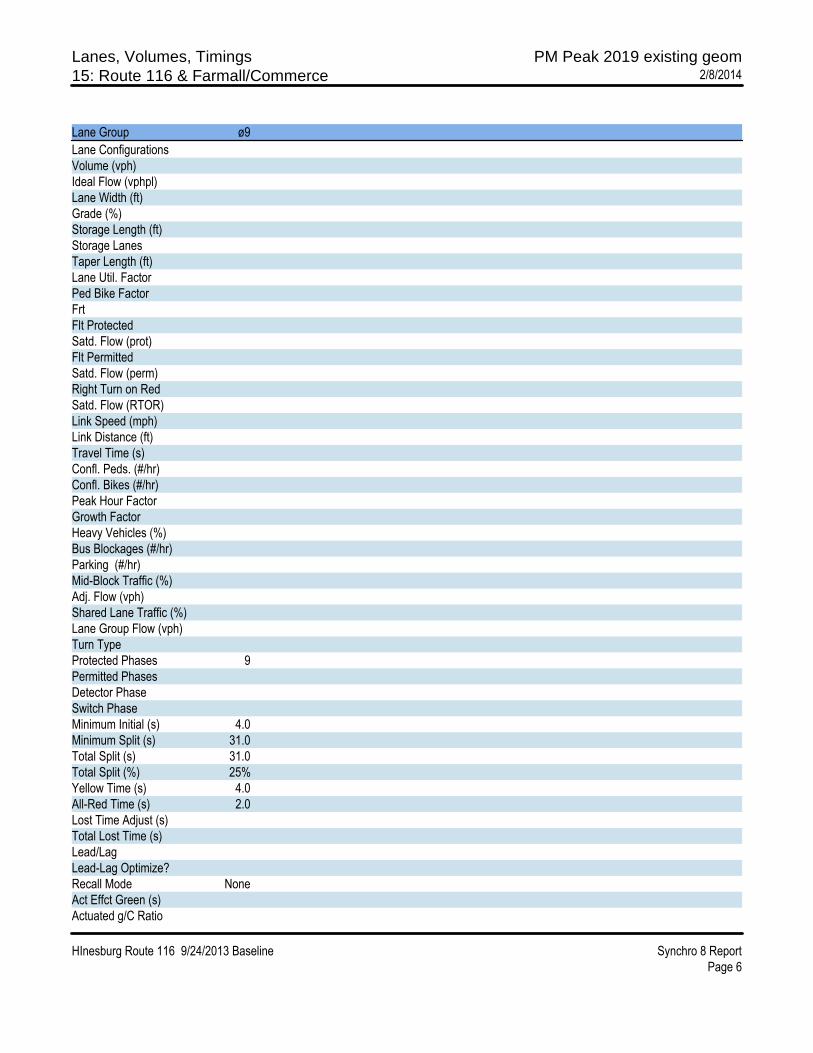
Lanes, Volumes, Timings PM Peak 2019 existing geom15: Route 116 & Farmall/Commerce 2/8/2014
HInesburg Route 116 9/24/2013 Baseline Synchro 8 Report
Page 6
Lane Group ø9
Lane Configurations
Volume (vph)
Ideal Flow (vphpl)
Lane Width (ft)
Grade (%)
Storage Length (ft)
Storage Lanes
Taper Length (ft)
Lane Util. Factor
Ped Bike Factor
Frt
Flt Protected
Satd. Flow (prot)
Flt Permitted
Satd. Flow (perm)
Right Turn on Red
Satd. Flow (RTOR)
Link Speed (mph)
Link Distance (ft)
Travel Time (s)
Confl. Peds. (#/hr)
Confl. Bikes (#/hr)
Peak Hour Factor
Growth Factor
Heavy Vehicles (%)
Bus Blockages (#/hr)
Parking (#/hr)
Mid-Block Traffic (%)
Adj. Flow (vph)
Shared Lane Traffic (%)
Lane Group Flow (vph)
Turn Type
Protected Phases 9
Permitted Phases
Detector Phase
Switch Phase
Minimum Initial (s) 4.0
Minimum Split (s) 31.0
Total Split (s) 31.0
Total Split (%) 25%
Yellow Time (s) 4.0
All-Red Time (s) 2.0
Lost Time Adjust (s)
Total Lost Time (s)
Lead/Lag
Lead-Lag Optimize?
Recall Mode None
Act Effct Green (s)
Actuated g/C Ratio

Lanes, Volumes, Timings PM Peak 2019 existing geom15: Route 116 & Farmall/Commerce 2/8/2014
HInesburg Route 116 9/24/2013 Baseline Synchro 8 Report
Page 7
Lane Group EBL EBT EBR WBL WBT WBR NBL NBT NBR SBL SBT SBR
v/c Ratio 0.08 0.09 0.82 0.25 0.48 0.25 0.64 0.77
Control Delay 25.0 0.3 44.9 48.6 30.7 9.0 54.0 34.0
Queue Delay 0.0 0.0 0.0 0.0 0.0 0.0 0.0 0.0
Total Delay 25.0 0.3 44.9 48.6 30.7 9.0 54.0 34.0
LOS C A D D C A D C
Approach Delay 9.8 44.9 25.0 37.9
Approach LOS A D C D
Stops (vph) 23 0 282 33 217 30 118 422
Fuel Used(gal) 0 0 6 1 3 1 3 8
CO Emissions (g/hr) 25 8 392 42 244 51 179 547
NOx Emissions (g/hr) 5 2 76 8 47 10 35 106
VOC Emissions (g/hr) 6 2 91 10 57 12 41 127
Dilemma Vehicles (#) 0 0 0 0 0 0 0 0
Queue Length 50th (ft) 12 0 152 18 112 7 73 285
Queue Length 95th (ft) 43 0 #371 64 300 69 #243 #839
Internal Link Dist (ft) 207 253 157 175
Turn Bay Length (ft) 80 80 80 80
Base Capacity (vph) 604 773 634 146 609 619 229 797
Starvation Cap Reductn 0 0 0 0 0 0 0 0
Spillback Cap Reductn 0 0 0 0 0 0 0 0
Storage Cap Reductn 0 0 0 0 0 0 0 0
Reduced v/c Ratio 0.05 0.07 0.54 0.25 0.46 0.25 0.64 0.77
Intersection Summary
Area Type: Other
Cycle Length: 126
Actuated Cycle Length: 87.5
Natural Cycle: 140
Control Type: Semi Act-Uncoord
Maximum v/c Ratio: 0.82
Intersection Signal Delay: 34.3 Intersection LOS: C
Intersection Capacity Utilization 80.1% ICU Level of Service D
Analysis Period (min) 15
# 95th percentile volume exceeds capacity, queue may be longer.
Queue shown is maximum after two cycles.
Splits and Phases: 15: Route 116 & Farmall/Commerce

Lanes, Volumes, Timings PM Peak 2019 existing geom15: Route 116 & Farmall/Commerce 2/8/2014
HInesburg Route 116 9/24/2013 Baseline Synchro 8 Report
Page 8
Lane Group ø9
v/c Ratio
Control Delay
Queue Delay
Total Delay
LOS
Approach Delay
Approach LOS
Stops (vph)
Fuel Used(gal)
CO Emissions (g/hr)
NOx Emissions (g/hr)
VOC Emissions (g/hr)
Dilemma Vehicles (#)
Queue Length 50th (ft)
Queue Length 95th (ft)
Internal Link Dist (ft)
Turn Bay Length (ft)
Base Capacity (vph)
Starvation Cap Reductn
Spillback Cap Reductn
Storage Cap Reductn
Reduced v/c Ratio
Intersection Summary
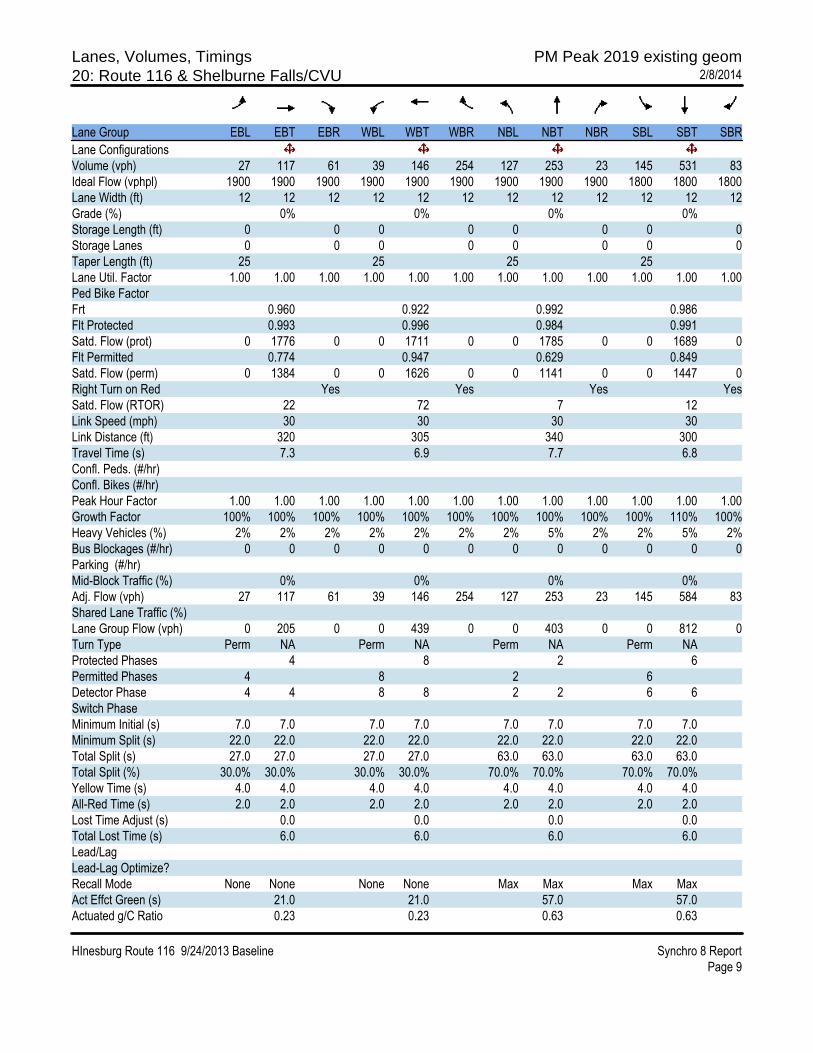
Lanes, Volumes, Timings PM Peak 2019 existing geom20: Route 116 & Shelburne Falls/CVU 2/8/2014
HInesburg Route 116 9/24/2013 Baseline Synchro 8 Report
Page 9
Lane Group EBL EBT EBR WBL WBT WBR NBL NBT NBR SBL SBT SBR
Lane Configurations
Volume (vph) 27 117 61 39 146 254 127 253 23 145 531 83
Ideal Flow (vphpl) 1900 1900 1900 1900 1900 1900 1900 1900 1900 1800 1800 1800
Lane Width (ft) 12 12 12 12 12 12 12 12 12 12 12 12
Grade (%) 0% 0% 0% 0%
Storage Length (ft) 0 0 0 0 0 0 0 0
Storage Lanes 0 0 0 0 0 0 0 0
Taper Length (ft) 25 25 25 25
Lane Util. Factor 1.00 1.00 1.00 1.00 1.00 1.00 1.00 1.00 1.00 1.00 1.00 1.00
Ped Bike Factor
Frt 0.960 0.922 0.992 0.986
Flt Protected 0.993 0.996 0.984 0.991
Satd. Flow (prot) 0 1776 0 0 1711 0 0 1785 0 0 1689 0
Flt Permitted 0.774 0.947 0.629 0.849
Satd. Flow (perm) 0 1384 0 0 1626 0 0 1141 0 0 1447 0
Right Turn on Red Yes Yes Yes Yes
Satd. Flow (RTOR) 22 72 7 12
Link Speed (mph) 30 30 30 30
Link Distance (ft) 320 305 340 300
Travel Time (s) 7.3 6.9 7.7 6.8
Confl. Peds. (#/hr)
Confl. Bikes (#/hr)
Peak Hour Factor 1.00 1.00 1.00 1.00 1.00 1.00 1.00 1.00 1.00 1.00 1.00 1.00
Growth Factor 100% 100% 100% 100% 100% 100% 100% 100% 100% 100% 110% 100%
Heavy Vehicles (%) 2% 2% 2% 2% 2% 2% 2% 5% 2% 2% 5% 2%
Bus Blockages (#/hr) 0 0 0 0 0 0 0 0 0 0 0 0
Parking (#/hr)
Mid-Block Traffic (%) 0% 0% 0% 0%
Adj. Flow (vph) 27 117 61 39 146 254 127 253 23 145 584 83
Shared Lane Traffic (%)
Lane Group Flow (vph) 0 205 0 0 439 0 0 403 0 0 812 0
Turn Type Perm NA Perm NA Perm NA Perm NA
Protected Phases 4 8 2 6
Permitted Phases 4 8 2 6
Detector Phase 4 4 8 8 2 2 6 6
Switch Phase
Minimum Initial (s) 7.0 7.0 7.0 7.0 7.0 7.0 7.0 7.0
Minimum Split (s) 22.0 22.0 22.0 22.0 22.0 22.0 22.0 22.0
Total Split (s) 27.0 27.0 27.0 27.0 63.0 63.0 63.0 63.0
Total Split (%) 30.0% 30.0% 30.0% 30.0% 70.0% 70.0% 70.0% 70.0%
Yellow Time (s) 4.0 4.0 4.0 4.0 4.0 4.0 4.0 4.0
All-Red Time (s) 2.0 2.0 2.0 2.0 2.0 2.0 2.0 2.0
Lost Time Adjust (s) 0.0 0.0 0.0 0.0
Total Lost Time (s) 6.0 6.0 6.0 6.0
Lead/Lag
Lead-Lag Optimize?
Recall Mode None None None None Max Max Max Max
Act Effct Green (s) 21.0 21.0 57.0 57.0
Actuated g/C Ratio 0.23 0.23 0.63 0.63

Lanes, Volumes, Timings PM Peak 2019 existing geom20: Route 116 & Shelburne Falls/CVU 2/8/2014
HInesburg Route 116 9/24/2013 Baseline Synchro 8 Report
Page 10
Lane Group EBL EBT EBR WBL WBT WBR NBL NBT NBR SBL SBT SBR
v/c Ratio 0.60 1.01 0.56 0.88
Control Delay 36.0 76.9 12.8 27.2
Queue Delay 0.0 0.0 0.0 0.0
Total Delay 36.0 76.9 12.8 27.2
LOS D E B C
Approach Delay 36.0 76.9 12.8 27.2
Approach LOS D E B C
Stops (vph) 162 316 220 610
Fuel Used(gal) 3 10 3 10
CO Emissions (g/hr) 203 676 233 683
NOx Emissions (g/hr) 40 131 45 133
VOC Emissions (g/hr) 47 157 54 158
Dilemma Vehicles (#) 0 0 0 0
Queue Length 50th (ft) 93 ~220 115 341
Queue Length 95th (ft) 168 #416 197 #641
Internal Link Dist (ft) 240 225 260 220
Turn Bay Length (ft)
Base Capacity (vph) 339 434 725 920
Starvation Cap Reductn 0 0 0 0
Spillback Cap Reductn 0 0 0 0
Storage Cap Reductn 0 0 0 0
Reduced v/c Ratio 0.60 1.01 0.56 0.88
Intersection Summary
Area Type: Other
Cycle Length: 90
Actuated Cycle Length: 90
Natural Cycle: 80
Control Type: Actuated-Uncoordinated
Maximum v/c Ratio: 1.01
Intersection Signal Delay: 36.8 Intersection LOS: D
Intersection Capacity Utilization 93.5% ICU Level of Service F
Analysis Period (min) 15
~ Volume exceeds capacity, queue is theoretically infinite.
Queue shown is maximum after two cycles.
# 95th percentile volume exceeds capacity, queue may be longer.
Queue shown is maximum after two cycles.
Splits and Phases: 20: Route 116 & Shelburne Falls/CVU

Lanes, Volumes, Timings PM Peak with Recommmendations1: Route 116 NB/Route 116 SB & Silver Street 2/8/2014
HInesburg Route 116 9/24/2013 Baseline Synchro 8 Report
Page 1
Lane Group EBL EBR NBL NBT SBT SBR
Lane Configurations
Volume (vph) 237 7 15 246 454 394
Ideal Flow (vphpl) 1900 1900 1900 1900 1900 1900
Storage Length (ft) 0 0 0 200
Storage Lanes 1 0 0 1
Taper Length (ft) 25 25
Lane Util. Factor 1.00 1.00 1.00 1.00 1.00 1.00
Frt 0.996 0.850
Flt Protected 0.954 0.997
Satd. Flow (prot) 1770 0 0 1807 1810 1583
Flt Permitted 0.954 0.997
Satd. Flow (perm) 1770 0 0 1807 1810 1583
Link Speed (mph) 30 30 30
Link Distance (ft) 315 428 407
Travel Time (s) 7.2 9.7 9.3
Peak Hour Factor 1.00 1.00 1.00 1.00 1.00 1.00
Heavy Vehicles (%) 2% 2% 2% 5% 5% 2%
Adj. Flow (vph) 237 7 15 246 454 394
Shared Lane Traffic (%)
Lane Group Flow (vph) 244 0 0 261 454 394
Sign Control Stop Free Free
Intersection Summary
Area Type: Other
Control Type: Unsignalized
Intersection Capacity Utilization 45.4% ICU Level of Service A
Analysis Period (min) 15

Lanes, Volumes, Timings PM Peak with Recommmendations6: Route 116 & Charlotte Rd/Lantmans 2/8/2014
HInesburg Route 116 9/24/2013 Baseline Synchro 8 Report
Page 2
Lane Group EBL EBT EBR WBL WBT WBR NBL NBT NBR SBL SBT SBR
Lane Configurations
Volume (vph) 117 0 55 70 14 60 33 417 22 0 844 130
Ideal Flow (vphpl) 1750 1750 1750 1750 1750 1750 1500 1500 1500 1500 1500 1500
Lane Width (ft) 11 11 11 11 11 11 14 14 14 12 12 12
Grade (%) 6% -4% -2% 4%
Storage Length (ft) 100 0 0 0 0 0 0 0
Storage Lanes 1 0 0 0 0 0 0 0
Taper Length (ft) 25 25 25 25
Lane Util. Factor 1.00 1.00 1.00 1.00 1.00 1.00 1.00 1.00 1.00 1.00 1.00 1.00
Frt 0.850 0.944 0.994 0.982
Flt Protected 0.950 0.976 0.997
Satd. Flow (prot) 1528 1367 0 0 1559 0 0 1530 0 0 1380 0
Flt Permitted 0.640 0.818 0.899
Satd. Flow (perm) 1030 1367 0 0 1306 0 0 1380 0 0 1380 0
Right Turn on Red Yes Yes Yes Yes
Satd. Flow (RTOR) 220 35 6 20
Link Speed (mph) 30 30 30 30
Link Distance (ft) 397 455 332 373
Travel Time (s) 9.0 10.3 7.5 8.5
Peak Hour Factor 1.00 1.00 1.00 1.00 1.00 1.00 1.00 1.00 1.00 1.00 1.00 1.00
Heavy Vehicles (%) 2% 2% 2% 2% 2% 2% 2% 5% 2% 2% 5% 2%
Adj. Flow (vph) 117 0 55 70 14 60 33 417 22 0 844 130
Shared Lane Traffic (%)
Lane Group Flow (vph) 117 55 0 0 144 0 0 472 0 0 974 0
Turn Type Perm NA Perm NA Perm NA Perm NA
Protected Phases 4 8 2 6
Permitted Phases 4 8 2 6
Detector Phase 4 4 8 8 2 2 6 6
Switch Phase
Minimum Initial (s) 7.0 7.0 7.0 7.0 7.0 7.0 7.0 7.0
Minimum Split (s) 22.0 22.0 22.0 22.0 22.0 22.0 22.0 22.0
Total Split (s) 22.0 22.0 22.0 22.0 68.0 68.0 68.0 68.0
Total Split (%) 24.4% 24.4% 24.4% 24.4% 75.6% 75.6% 75.6% 75.6%
Yellow Time (s) 4.0 4.0 4.0 4.0 4.0 4.0 4.0 4.0
All-Red Time (s) 2.0 2.0 2.0 2.0 2.0 2.0 2.0 2.0
Lost Time Adjust (s) 0.0 0.0 0.0 0.0 0.0
Total Lost Time (s) 6.0 6.0 6.0 6.0 6.0
Lead/Lag
Lead-Lag Optimize?
Recall Mode None None None None Max Max Max Max
Act Effct Green (s) 13.8 13.8 13.8 64.9 64.9
Actuated g/C Ratio 0.15 0.15 0.15 0.72 0.72
v/c Ratio 0.75 0.14 0.63 0.48 0.98
Control Delay 64.8 0.7 39.3 7.9 39.5
Queue Delay 0.0 0.0 0.0 0.0 0.0
Total Delay 64.8 0.7 39.3 7.9 39.5
LOS E A D A D
Approach Delay 44.3 39.3 7.9 39.5
Approach LOS D D A D
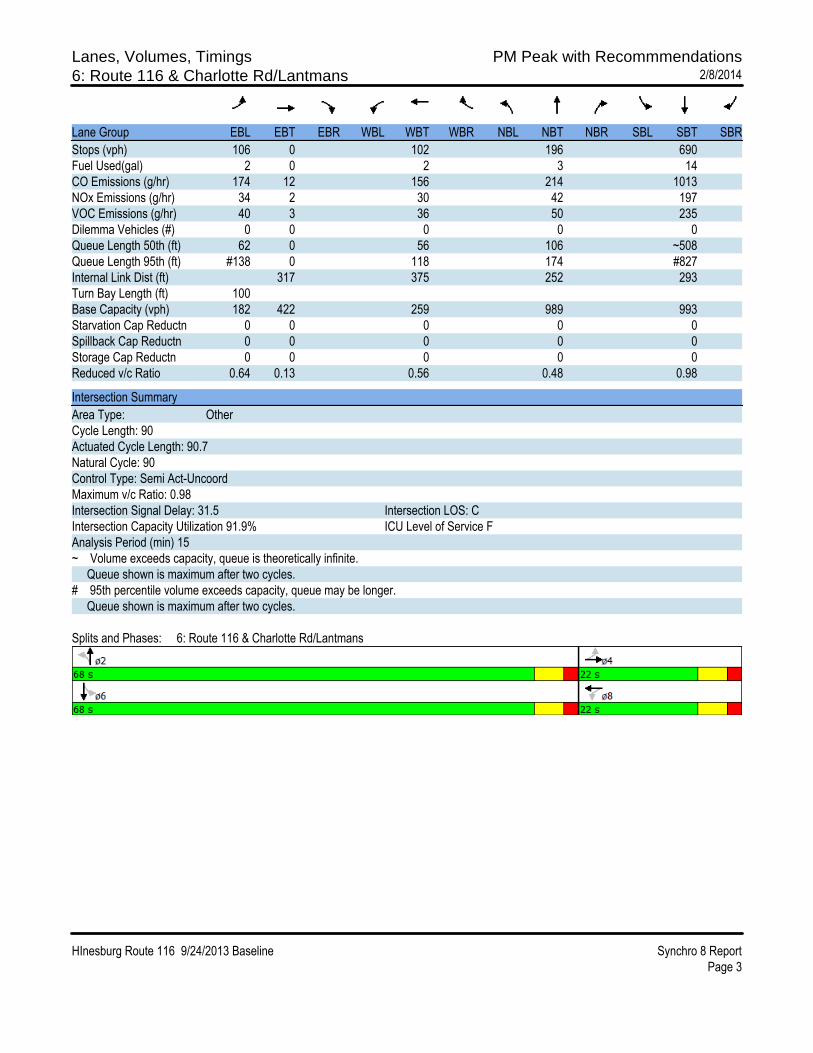
Lanes, Volumes, Timings PM Peak with Recommmendations6: Route 116 & Charlotte Rd/Lantmans 2/8/2014
HInesburg Route 116 9/24/2013 Baseline Synchro 8 Report
Page 3
Lane Group EBL EBT EBR WBL WBT WBR NBL NBT NBR SBL SBT SBR
Stops (vph) 106 0 102 196 690
Fuel Used(gal) 2 0 2 3 14
CO Emissions (g/hr) 174 12 156 214 1013
NOx Emissions (g/hr) 34 2 30 42 197
VOC Emissions (g/hr) 40 3 36 50 235
Dilemma Vehicles (#) 0 0 0 0 0
Queue Length 50th (ft) 62 0 56 106 ~508
Queue Length 95th (ft) #138 0 118 174 #827
Internal Link Dist (ft) 317 375 252 293
Turn Bay Length (ft) 100
Base Capacity (vph) 182 422 259 989 993
Starvation Cap Reductn 0 0 0 0 0
Spillback Cap Reductn 0 0 0 0 0
Storage Cap Reductn 0 0 0 0 0
Reduced v/c Ratio 0.64 0.13 0.56 0.48 0.98
Intersection Summary
Area Type: Other
Cycle Length: 90
Actuated Cycle Length: 90.7
Natural Cycle: 90
Control Type: Semi Act-Uncoord
Maximum v/c Ratio: 0.98
Intersection Signal Delay: 31.5 Intersection LOS: C
Intersection Capacity Utilization 91.9% ICU Level of Service F
Analysis Period (min) 15
~ Volume exceeds capacity, queue is theoretically infinite.
Queue shown is maximum after two cycles.
# 95th percentile volume exceeds capacity, queue may be longer.
Queue shown is maximum after two cycles.
Splits and Phases: 6: Route 116 & Charlotte Rd/Lantmans

Lanes, Volumes, Timings PM Peak with Recommmendations11: Route 116 & Mechanicsville Rd 2/8/2014
HInesburg Route 116 9/24/2013 Baseline Synchro 8 Report
Page 4
Lane Group WBL WBR NBT NBR SBL SBT
Lane Configurations
Volume (vph) 171 9 420 175 3 806
Ideal Flow (vphpl) 1900 1900 1900 1900 1900 1900
Lane Util. Factor 1.00 1.00 1.00 1.00 1.00 1.00
Frt 0.993 0.960
Flt Protected 0.955
Satd. Flow (prot) 1766 0 1752 0 0 1810
Flt Permitted 0.955 0.998
Satd. Flow (perm) 1766 0 1752 0 0 1806
Right Turn on Red Yes Yes
Satd. Flow (RTOR) 4 54
Link Speed (mph) 30 30 30
Link Distance (ft) 340 232 263
Travel Time (s) 7.7 5.3 6.0
Peak Hour Factor 1.00 1.00 1.00 1.00 1.00 1.00
Heavy Vehicles (%) 2% 2% 5% 2% 2% 5%
Adj. Flow (vph) 171 9 420 175 3 806
Shared Lane Traffic (%)
Lane Group Flow (vph) 180 0 595 0 0 809
Turn Type NA NA Perm NA
Protected Phases 8 2 6
Permitted Phases 6
Minimum Split (s) 22.0 22.0 22.0 22.0
Total Split (s) 22.0 38.0 38.0 38.0
Total Split (%) 36.7% 63.3% 63.3% 63.3%
Yellow Time (s) 4.0 4.0 4.0 4.0
All-Red Time (s) 2.0 2.0 2.0 2.0
Lost Time Adjust (s) 0.0 0.0 0.0
Total Lost Time (s) 6.0 6.0 6.0
Lead/Lag
Lead-Lag Optimize?
Act Effct Green (s) 16.0 32.0 32.0
Actuated g/C Ratio 0.27 0.53 0.53
v/c Ratio 0.38 0.62 0.84
Control Delay 20.4 12.3 22.4
Queue Delay 0.0 0.0 0.0
Total Delay 20.4 12.3 22.4
LOS C B C
Approach Delay 20.4 12.3 22.4
Approach LOS C B C
Stops (vph) 138 363 615
Fuel Used(gal) 2 5 9
CO Emissions (g/hr) 139 320 612
NOx Emissions (g/hr) 27 62 119
VOC Emissions (g/hr) 32 74 142
Dilemma Vehicles (#) 0 0 0
Queue Length 50th (ft) 52 122 224
Queue Length 95th (ft) 100 213 #446
Internal Link Dist (ft) 260 152 183

Lanes, Volumes, Timings PM Peak with Recommmendations11: Route 116 & Mechanicsville Rd 2/8/2014
HInesburg Route 116 9/24/2013 Baseline Synchro 8 Report
Page 5
Lane Group WBL WBR NBT NBR SBL SBT
Turn Bay Length (ft)
Base Capacity (vph) 473 959 963
Starvation Cap Reductn 0 0 0
Spillback Cap Reductn 0 0 0
Storage Cap Reductn 0 0 0
Reduced v/c Ratio 0.38 0.62 0.84
Intersection Summary
Area Type: Other
Cycle Length: 60
Actuated Cycle Length: 60
Offset: 0 (0%), Referenced to phase 2:NBT and 6:SBTL, Start of Green
Natural Cycle: 60
Control Type: Pretimed
Maximum v/c Ratio: 0.84
Intersection Signal Delay: 18.4 Intersection LOS: B
Intersection Capacity Utilization 64.8% ICU Level of Service C
Analysis Period (min) 15
# 95th percentile volume exceeds capacity, queue may be longer.
Queue shown is maximum after two cycles.
Splits and Phases: 11: Route 116 & Mechanicsville Rd

Lanes, Volumes, Timings PM Peak with Recommmendations15: Route 116 & Farmall/Commerce 2/8/2014
HInesburg Route 116 9/24/2013 Baseline Synchro 8 Report
Page 6
Lane Group EBL EBT EBR WBL WBT WBR NBL NBT NBR SBL SBT SBR
Lane Configurations
Volume (vph) 24 8 51 214 9 122 36 283 152 147 573 43
Ideal Flow (vphpl) 1900 1900 1900 1900 1900 1900 1900 1900 1900 1900 1900 1900
Storage Length (ft) 0 80 0 100 80 0 120 0
Storage Lanes 0 1 0 1 1 0 1 0
Taper Length (ft) 25 25 25 25
Lane Util. Factor 1.00 1.00 1.00 1.00 1.00 1.00 1.00 1.00 1.00 1.00 1.00 1.00
Frt 0.850 0.850 0.948 0.990
Flt Protected 0.964 0.954 0.950 0.950
Satd. Flow (prot) 0 1796 1583 0 1777 1583 1770 1733 0 1770 1795 0
Flt Permitted 0.759 0.711 0.950 0.950
Satd. Flow (perm) 0 1414 1583 0 1324 1583 1770 1733 0 1770 1795 0
Right Turn on Red Yes Yes Yes Yes
Satd. Flow (RTOR) 158 122 18 3
Link Speed (mph) 30 30 30 30
Link Distance (ft) 287 333 237 255
Travel Time (s) 6.5 7.6 5.4 5.8
Peak Hour Factor 1.00 1.00 1.00 1.00 1.00 1.00 1.00 1.00 1.00 1.00 1.00 1.00
Heavy Vehicles (%) 2% 2% 2% 2% 2% 2% 2% 5% 2% 2% 5% 2%
Adj. Flow (vph) 24 8 51 214 9 122 36 283 152 147 573 43
Shared Lane Traffic (%)
Lane Group Flow (vph) 0 32 51 0 223 122 36 435 0 147 616 0
Turn Type Perm NA Perm Perm NA pm+ov Prot NA Prot NA
Protected Phases 4 8 1 5 2 1 6
Permitted Phases 4 4 8 8
Detector Phase 4 4 4 8 8 1 5 2 1 6
Switch Phase
Minimum Initial (s) 7.0 7.0 7.0 1.0 1.0 7.0 7.0 7.0 7.0 7.0
Minimum Split (s) 14.0 14.0 14.0 29.0 29.0 14.0 14.0 14.0 14.0 14.0
Total Split (s) 52.0 52.0 52.0 52.0 52.0 21.0 14.0 46.0 21.0 53.0
Total Split (%) 35.9% 35.9% 35.9% 35.9% 35.9% 14.5% 9.7% 31.7% 14.5% 36.6%
Yellow Time (s) 4.0 4.0 4.0 4.0 4.0 4.0 4.0 4.0 4.0 4.0
All-Red Time (s) 2.0 2.0 2.0 24.0 24.0 2.0 2.0 2.0 2.0 2.0
Lost Time Adjust (s) 0.0 0.0 0.0 0.0 0.0 0.0 0.0 0.0
Total Lost Time (s) 6.0 6.0 28.0 6.0 6.0 6.0 6.0 6.0
Lead/Lag Lag Lag Lead Lag Lead
Lead-Lag Optimize? Yes Yes Yes Yes Yes
Recall Mode None None None None None None None Max None Max
Act Effct Green (s) 46.3 46.3 24.2 66.4 7.6 40.3 14.0 52.2
Actuated g/C Ratio 0.38 0.38 0.20 0.54 0.06 0.33 0.11 0.42
v/c Ratio 0.06 0.07 0.86 0.13 0.33 0.75 0.73 0.81
Control Delay 28.3 0.2 78.2 3.5 66.9 46.0 75.0 43.0
Queue Delay 0.0 0.0 0.0 0.0 0.0 0.0 0.0 0.0
Total Delay 28.3 0.2 78.2 3.5 66.9 46.0 75.0 43.0
LOS C A E A E D E D
Approach Delay 11.1 51.8 47.6 49.1
Approach LOS B D D D
Stops (vph) 21 0 188 11 35 348 130 479
Fuel Used(gal) 0 0 5 0 1 7 3 9

Lanes, Volumes, Timings PM Peak with Recommmendations15: Route 116 & Farmall/Commerce 2/8/2014
HInesburg Route 116 9/24/2013 Baseline Synchro 8 Report
Page 7
Lane Group ø9
Lane Configurations
Volume (vph)
Ideal Flow (vphpl)
Storage Length (ft)
Storage Lanes
Taper Length (ft)
Lane Util. Factor
Frt
Flt Protected
Satd. Flow (prot)
Flt Permitted
Satd. Flow (perm)
Right Turn on Red
Satd. Flow (RTOR)
Link Speed (mph)
Link Distance (ft)
Travel Time (s)
Peak Hour Factor
Heavy Vehicles (%)
Adj. Flow (vph)
Shared Lane Traffic (%)
Lane Group Flow (vph)
Turn Type
Protected Phases 9
Permitted Phases
Detector Phase
Switch Phase
Minimum Initial (s) 7.0
Minimum Split (s) 26.0
Total Split (s) 26.0
Total Split (%) 18%
Yellow Time (s) 4.0
All-Red Time (s) 2.0
Lost Time Adjust (s)
Total Lost Time (s)
Lead/Lag
Lead-Lag Optimize?
Recall Mode None
Act Effct Green (s)
Actuated g/C Ratio
v/c Ratio
Control Delay
Queue Delay
Total Delay
LOS
Approach Delay
Approach LOS
Stops (vph)
Fuel Used(gal)

Lanes, Volumes, Timings PM Peak with Recommmendations15: Route 116 & Farmall/Commerce 2/8/2014
HInesburg Route 116 9/24/2013 Baseline Synchro 8 Report
Page 8
Lane Group EBL EBT EBR WBL WBT WBR NBL NBT NBR SBL SBT SBR
CO Emissions (g/hr) 26 8 361 33 52 476 228 647
NOx Emissions (g/hr) 5 2 70 6 10 93 44 126
VOC Emissions (g/hr) 6 2 84 8 12 110 53 150
Dilemma Vehicles (#) 0 0 0 0 0 0 0 0
Queue Length 50th (ft) 15 0 166 0 27 281 109 428
Queue Length 95th (ft) 48 0 #395 37 73 #575 #254 #874
Internal Link Dist (ft) 207 253 157 175
Turn Bay Length (ft) 80 100 80 120
Base Capacity (vph) 531 693 260 892 115 579 217 761
Starvation Cap Reductn 0 0 0 0 0 0 0 0
Spillback Cap Reductn 0 0 0 0 0 0 0 0
Storage Cap Reductn 0 0 0 0 0 0 0 0
Reduced v/c Ratio 0.06 0.07 0.86 0.14 0.31 0.75 0.68 0.81
Intersection Summary
Area Type: Other
Cycle Length: 145
Actuated Cycle Length: 123.2
Natural Cycle: 145
Control Type: Actuated-Uncoordinated
Maximum v/c Ratio: 0.86
Intersection Signal Delay: 47.4 Intersection LOS: D
Intersection Capacity Utilization 90.9% ICU Level of Service E
Analysis Period (min) 15
# 95th percentile volume exceeds capacity, queue may be longer.
Queue shown is maximum after two cycles.
Splits and Phases: 15: Route 116 & Farmall/Commerce

Lanes, Volumes, Timings PM Peak with Recommmendations15: Route 116 & Farmall/Commerce 2/8/2014
HInesburg Route 116 9/24/2013 Baseline Synchro 8 Report
Page 9
Lane Group ø9
CO Emissions (g/hr)
NOx Emissions (g/hr)
VOC Emissions (g/hr)
Dilemma Vehicles (#)
Queue Length 50th (ft)
Queue Length 95th (ft)
Internal Link Dist (ft)
Turn Bay Length (ft)
Base Capacity (vph)
Starvation Cap Reductn
Spillback Cap Reductn
Storage Cap Reductn
Reduced v/c Ratio
Intersection Summary

Lanes, Volumes, Timings PM Peak with Recommmendations20: Route 116 & Shelburne Falls Rd/CVU Road 2/8/2014
HInesburg Route 116 9/24/2013 Baseline Synchro 8 Report
Page 10
Lane Group EBL EBT EBR WBL WBT WBR NBL NBT NBR SBL SBT SBR
Lane Configurations
Volume (vph) 39 146 254 27 117 61 127 253 23 145 531 83
Ideal Flow (vphpl) 1900 1900 1900 1900 1900 1900 1900 1900 1900 1900 1900 1900
Storage Length (ft) 0 200 0 140 200 0 140 0
Storage Lanes 0 1 0 1 1 0 1 0
Taper Length (ft) 25 25 25 25
Lane Util. Factor 1.00 1.00 1.00 1.00 1.00 1.00 1.00 1.00 1.00 1.00 1.00 1.00
Frt 0.850 0.850 0.987 0.980
Flt Protected 0.990 0.991 0.950 0.950
Satd. Flow (prot) 0 1844 1583 0 1846 1583 1770 1790 0 1770 1780 0
Flt Permitted 0.888 0.897 0.351 0.590
Satd. Flow (perm) 0 1654 1583 0 1671 1583 654 1790 0 1099 1780 0
Right Turn on Red Yes Yes Yes Yes
Satd. Flow (RTOR) 254 61 12 20
Link Speed (mph) 30 30 30 30
Link Distance (ft) 320 305 340 300
Travel Time (s) 7.3 6.9 7.7 6.8
Peak Hour Factor 1.00 1.00 1.00 1.00 1.00 1.00 1.00 1.00 1.00 1.00 1.00 1.00
Heavy Vehicles (%) 2% 2% 2% 2% 2% 2% 2% 5% 2% 2% 5% 2%
Adj. Flow (vph) 39 146 254 27 117 61 127 253 23 145 531 83
Shared Lane Traffic (%)
Lane Group Flow (vph) 0 185 254 0 144 61 127 276 0 145 614 0
Turn Type Perm NA Perm Perm NA Perm Perm NA Perm NA
Protected Phases 4 8 2 6
Permitted Phases 4 4 8 8 2 6
Detector Phase 4 4 4 8 8 8 2 2 6 6
Switch Phase
Minimum Initial (s) 4.0 4.0 4.0 4.0 4.0 4.0 4.0 4.0 4.0 4.0
Minimum Split (s) 22.0 22.0 22.0 22.0 22.0 22.0 22.0 22.0 22.0 22.0
Total Split (s) 22.0 22.0 22.0 22.0 22.0 22.0 38.0 38.0 38.0 38.0
Total Split (%) 36.7% 36.7% 36.7% 36.7% 36.7% 36.7% 63.3% 63.3% 63.3% 63.3%
Yellow Time (s) 4.0 4.0 4.0 4.0 4.0 4.0 4.0 4.0 4.0 4.0
All-Red Time (s) 2.0 2.0 2.0 2.0 2.0 2.0 2.0 2.0 2.0 2.0
Lost Time Adjust (s) 0.0 0.0 0.0 0.0 0.0 0.0 0.0 0.0
Total Lost Time (s) 6.0 6.0 6.0 6.0 6.0 6.0 6.0 6.0
Lead/Lag
Lead-Lag Optimize?
Recall Mode None None None None None None Max Max Max Max
Act Effct Green (s) 11.4 11.4 11.4 11.4 32.6 32.6 32.6 32.6
Actuated g/C Ratio 0.20 0.20 0.20 0.20 0.58 0.58 0.58 0.58
v/c Ratio 0.55 0.48 0.42 0.16 0.33 0.26 0.23 0.59
Control Delay 26.1 6.4 22.9 6.8 10.4 7.1 7.8 10.9
Queue Delay 0.0 0.0 0.0 0.0 0.0 0.0 0.0 0.0
Total Delay 26.1 6.4 22.9 6.8 10.4 7.1 7.8 10.9
LOS C A C A B A A B
Approach Delay 14.7 18.1 8.1 10.3
Approach LOS B B A B
Stops (vph) 154 37 115 16 69 124 68 367
Fuel Used(gal) 2 1 2 0 1 2 1 5

Lanes, Volumes, Timings PM Peak with Recommmendations20: Route 116 & Shelburne Falls Rd/CVU Road 2/8/2014
HInesburg Route 116 9/24/2013 Baseline Synchro 8 Report
Page 11
Lane Group EBL EBT EBR WBL WBT WBR NBL NBT NBR SBL SBT SBR
CO Emissions (g/hr) 161 82 115 22 69 127 66 338
NOx Emissions (g/hr) 31 16 22 4 13 25 13 66
VOC Emissions (g/hr) 37 19 27 5 16 29 15 78
Dilemma Vehicles (#) 0 0 0 0 0 0 0 0
Queue Length 50th (ft) 55 0 42 0 19 37 20 107
Queue Length 95th (ft) 106 46 84 23 60 86 54 234
Internal Link Dist (ft) 240 225 260 220
Turn Bay Length (ft) 200 140 200 140
Base Capacity (vph) 474 634 478 497 380 1045 639 1043
Starvation Cap Reductn 0 0 0 0 0 0 0 0
Spillback Cap Reductn 0 0 0 0 0 0 0 0
Storage Cap Reductn 0 0 0 0 0 0 0 0
Reduced v/c Ratio 0.39 0.40 0.30 0.12 0.33 0.26 0.23 0.59
Intersection Summary
Area Type: Other
Cycle Length: 60
Actuated Cycle Length: 56
Natural Cycle: 55
Control Type: Semi Act-Uncoord
Maximum v/c Ratio: 0.59
Intersection Signal Delay: 11.8 Intersection LOS: B
Intersection Capacity Utilization 77.5% ICU Level of Service D
Analysis Period (min) 15
Splits and Phases: 20: Route 116 & Shelburne Falls Rd/CVU Road

Lanes, Volumes, Timings PM Peak with Recommmendations25: Route 116 & Bissonette/Riggs Road 2/8/2014
HInesburg Route 116 9/24/2013 Baseline Synchro 8 Report
Page 12
Lane Group EBL EBT EBR WBL WBT WBR NBL NBT NBR SBL SBT SBR
Lane Configurations
Volume (vph) 0 0 0 0 0 0 0 0 0 0 0 0
Ideal Flow (vphpl) 1900 1900 1900 1900 1900 1900 1900 1900 1900 1900 1900 1900
Lane Util. Factor 1.00 1.00 1.00 1.00 1.00 1.00 1.00 1.00 1.00 1.00 1.00 1.00
Frt
Flt Protected
Satd. Flow (prot) 0 1863 0 0 1863 0 0 1863 0 0 1863 0
Flt Permitted
Satd. Flow (perm) 0 1863 0 0 1863 0 0 1863 0 0 1863 0
Link Speed (mph) 30 30 30 30
Link Distance (ft) 390 427 360 368
Travel Time (s) 8.9 9.7 8.2 8.4
Peak Hour Factor 1.00 1.00 1.00 1.00 1.00 1.00 1.00 1.00 1.00 1.00 1.00 1.00
Adj. Flow (vph) 0 0 0 0 0 0 0 0 0 0 0 0
Shared Lane Traffic (%)
Lane Group Flow (vph) 0 0 0 0 0 0 0 0 0 0 0 0
Sign Control Stop Stop Free Free
Intersection Summary
Area Type: Other
Control Type: Unsignalized
Intersection Capacity Utilization 0.0% ICU Level of Service A
Analysis Period (min) 15

HCM Unsignalized Intersection Capacity Analysis PM Peak unsig with Rec's1: Route 116 NB/Route 116 SB & Silver Street 2/8/2014
HInesburg Route 116 9/24/2013 Baseline Synchro 8 Report
Page 1
Movement EBL EBR NBL NBT SBT SBR
Lane Configurations
Volume (veh/h) 237 7 15 246 454 394
Sign Control Stop Free Free
Grade 0% 0% 0%
Peak Hour Factor 1.00 1.00 1.00 1.00 1.00 1.00
Hourly flow rate (vph) 237 7 15 246 454 394
Pedestrians
Lane Width (ft)
Walking Speed (ft/s)
Percent Blockage
Right turn flare (veh)
Median type None None
Median storage veh)
Upstream signal (ft)
pX, platoon unblocked
vC, conflicting volume 730 454 848
vC1, stage 1 conf vol
vC2, stage 2 conf vol
vCu, unblocked vol 730 454 848
tC, single (s) 6.4 6.2 4.1
tC, 2 stage (s)
tF (s) 3.5 3.3 2.2
p0 queue free % 38 99 98
cM capacity (veh/h) 382 606 790
Direction, Lane # EB 1 NB 1 SB 1 SB 2
Volume Total 244 261 454 394
Volume Left 237 15 0 0
Volume Right 7 0 0 394
cSH 386 790 1700 1700
Volume to Capacity 0.63 0.02 0.27 0.23
Queue Length 95th (ft) 104 1 0 0
Control Delay (s) 29.0 0.8 0.0 0.0
Lane LOS D A
Approach Delay (s) 29.0 0.8 0.0
Approach LOS D
Intersection Summary
Average Delay 5.4
Intersection Capacity Utilization 45.4% ICU Level of Service A
Analysis Period (min) 15

HCM Unsignalized Intersection Capacity Analysis PM Peak unsig with Rec's25: Route 116 & Bissonette/Riggs Road 2/8/2014
HInesburg Route 116 9/24/2013 Baseline Synchro 8 Report
Page 2
Movement EBL EBT EBR WBL WBT WBR NBL NBT NBR SBL SBT SBR
Lane Configurations
Volume (veh/h) 0 0 0 0 0 0 0 0 0 0 0 0
Sign Control Stop Stop Free Free
Grade 0% 0% 0% 0%
Peak Hour Factor 1.00 1.00 1.00 1.00 1.00 1.00 1.00 1.00 1.00 1.00 1.00 1.00
Hourly flow rate (vph) 0 0 0 0 0 0 0 0 0 0 0 0
Pedestrians
Lane Width (ft)
Walking Speed (ft/s)
Percent Blockage
Right turn flare (veh)
Median type None None
Median storage veh)
Upstream signal (ft)
pX, platoon unblocked
vC, conflicting volume 0 0 0 0 0 0 0 0
vC1, stage 1 conf vol
vC2, stage 2 conf vol
vCu, unblocked vol 0 0 0 0 0 0 0 0
tC, single (s) 7.1 6.5 6.2 7.1 6.5 6.2 4.1 4.1
tC, 2 stage (s)
tF (s) 3.5 4.0 3.3 3.5 4.0 3.3 2.2 2.2
p0 queue free % 100 100 100 100 100 100 100 100
cM capacity (veh/h) 1023 896 1085 1023 896 1085 1623 1623
Direction, Lane # EB 1 WB 1 NB 1 SB 1
Volume Total 0 0 0 0
Volume Left 0 0 0 0
Volume Right 0 0 0 0
cSH 1700 1700 1700 1700
Volume to Capacity 0.00 0.00 0.00 0.00
Queue Length 95th (ft) 0 0 0 0
Control Delay (s) 0.0 0.0 0.0 0.0
Lane LOS A A
Approach Delay (s) 0.0 0.0 0.0 0.0
Approach LOS A A
Intersection Summary
Average Delay 0.0
Intersection Capacity Utilization 0.0% ICU Level of Service A
Analysis Period (min) 15

HCM 2010 Roundabout PM Peak roundabouts1: Route 116 NB/Route 116 SB & Silver Street 2/8/2014
HInesburg Route 116 9/24/2013 Baseline Synchro 8 Report
Page 1
Intersection
Intersection Delay, s/veh 8.0
Intersection LOS A
Approach EB NB SB
Entry Lanes 1 1 2
Conflicting Circle Lanes 1 1 1
Adj Approach Flow, veh/h 244 261 848
Demand Flow Rate, veh/h 249 273 879
Vehicles Circulating, veh/h 477 242 15
Vehicles Exiting, veh/h 417 484 500
Follow-Up Headway, s 3.186 3.186 3.186
Ped Vol Crossing Leg, #/h 0 0 0
Ped Cap Adj 1.000 1.000 1.000
Approach Delay, s/veh 9.9 7.7 7.5
Approach LOS A A A
Lane Left Left Left Right
Designated Moves LR LT LT R
Assumed Moves LR LT LT R
RT Channelized
Lane Util 1.000 1.000 0.543 0.457
Critical Headway, s 5.193 5.193 5.193 5.193
Entry Flow, veh/h 249 273 477 402
Cap Entry Lane, veh/h 701 887 1113 1113
Entry HV Adj Factor 0.980 0.955 0.952 0.980
Flow Entry, veh/h 244 261 454 394
Cap Entry, veh/h 687 847 1060 1091
V/C Ratio 0.355 0.308 0.429 0.361
Control Delay, s/veh 9.9 7.7 8.1 7.0
LOS A A A A
95th %tile Queue, veh 2 1 2 2

HCM 2010 Roundabout PM Peak roundabouts11: Route 116 & Mechanicsville Rd 2/8/2014
HInesburg Route 116 9/24/2013 Baseline Synchro 8 Report
Page 2
Intersection
Intersection Delay, s/veh 20.6
Intersection LOS C
Approach WB NB SB
Entry Lanes 1 1 1
Conflicting Circle Lanes 1 1 1
Adj Approach Flow, veh/h 180 595 809
Demand Flow Rate, veh/h 183 619 849
Vehicles Circulating, veh/h 441 3 174
Vehicles Exiting, veh/h 181 1020 450
Follow-Up Headway, s 3.186 3.186 3.186
Ped Vol Crossing Leg, #/h 0 0 0
Ped Cap Adj 1.000 1.000 1.000
Approach Delay, s/veh 8.0 10.0 31.2
Approach LOS A B D
Lane Left Left Left
Designated Moves LR TR LT
Assumed Moves LR TR LT
RT Channelized
Lane Util 1.000 1.000 1.000
Critical Headway, s 5.193 5.193 5.193
Entry Flow, veh/h 183 619 849
Cap Entry Lane, veh/h 727 1127 949
Entry HV Adj Factor 0.984 0.961 0.953
Flow Entry, veh/h 180 595 809
Cap Entry, veh/h 715 1083 904
V/C Ratio 0.252 0.549 0.894
Control Delay, s/veh 8.0 10.0 31.2
LOS A B D
95th %tile Queue, veh 1 3 12

Attachment 3
Hinesburg Stormwater and Hydrology Resources

Attachment 4
Class 1 Town Highway Reclassification Resources

Considerations for the Reclassification of Route 116
The Town of Hinesburg is considering taking jurisdiction of Route 116 through all or some of its
designated Village Growth Area. This would reclassify Route 116 as a Class 1 Town Highway, which has
several implications:
Additional funding from VTrans Town Highway funds, on the order of $10,000 to $15,000 per
year.
Greater autonomy for the Town of Hinesburg in terms of design, maintenance, and priorities for
projects.
Responsibility to maintain the roadway, including pavement, markings, traffic signals, signs, and
drainage structures.
The attached map shows two options for possible limits of the reclassification. The exact limits should
be discussed in more detail with VTrans, as it may be more appropriate to have the Class 1 limits extend
to include the functional area of any intersections for which the Town would like to have jurisdiction.
Case Studies Two communities in Vermont provide case studies for reclassification.
Essex Junction has historically had jurisdiction in the Five Corners area of Vermont Routes 15, 2A and
117. Pearl Street (VT Route 15) west of around Summit Street had been state controlled until the Village
requested jurisdiction several years ago. The primary motivation for this was to provide for more design
flexibility of a streetscape project extending towards Susie Wilson Road. The Village’s goal was to
implement a “road diet,” converting a four lane section of Route 15 into a three lane section with bicycle
lanes. Because the Village already maintains the roads and traffic signals of it’s existing Class 1 Town
Highways, taking on this additional burden was not considered significant.
Norwich has been considering taking jurisdiction of US Route 5 through its village center, with the
primary goal being greater design flexibility for travel lane widths, sidewalk design, crosswalks, speed
limits, and possible future streetscape enhancements. The Town began the process through their
legislative representative, who introduced legislation to reclassify a portion of US Route 5 and VT Route
10A. VTrans required the Town to accept a longer segment of Route 10A than the Town was interested
in, which required the Town to maintain three traffic signals and a large number of streetlights at a
highway interchange. In their analysis of economics, the revenue received from Class 1 designation was
more than sufficient to cover maintenance needs of the smaller segment, but possible not sufficient for
the larger segment, due to the higher (and somewhat unknown) costs of signal maintenance and
electricity. At this time, the Town is still in discussions with VTrans about the limits of jurisdiction. If the
Town’s only option to accept the longer segment, including the signals and lights, they will not likely
proceed with taking on the road. The town is willing to accept a shorter segment and has concluded that
the costs will be within the additional revenue received.

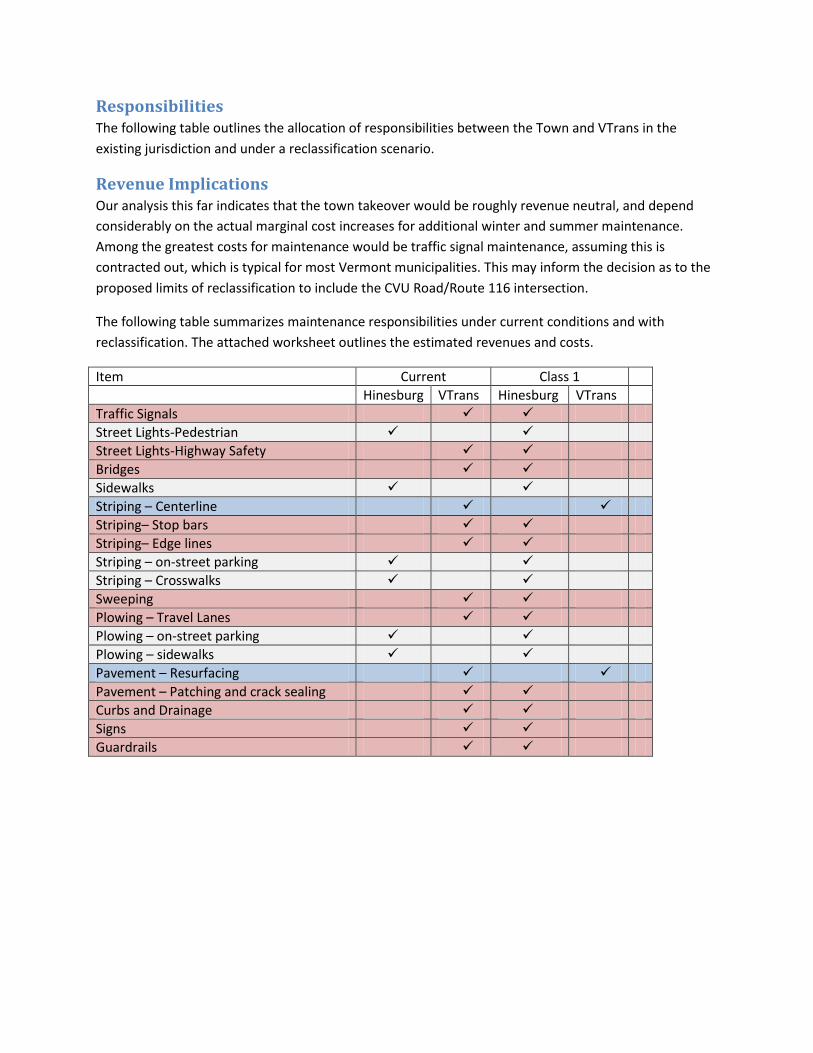
Responsibilities The following table outlines the allocation of responsibilities between the Town and VTrans in the
existing jurisdiction and under a reclassification scenario.
Revenue Implications Our analysis this far indicates that the town takeover would be roughly revenue neutral, and depend
considerably on the actual marginal cost increases for additional winter and summer maintenance.
Among the greatest costs for maintenance would be traffic signal maintenance, assuming this is
contracted out, which is typical for most Vermont municipalities. This may inform the decision as to the
proposed limits of reclassification to include the CVU Road/Route 116 intersection.
The following table summarizes maintenance responsibilities under current conditions and with
reclassification. The attached worksheet outlines the estimated revenues and costs.
Item Current Class 1
Hinesburg VTrans Hinesburg VTrans
Traffic Signals
Street Lights-Pedestrian
Street Lights-Highway Safety
Bridges
Sidewalks
Striping – Centerline
Striping– Stop bars
Striping– Edge lines
Striping – on-street parking
Striping – Crosswalks
Sweeping
Plowing – Travel Lanes
Plowing – on-street parking
Plowing – sidewalks
Pavement – Resurfacing
Pavement – Patching and crack sealing
Curbs and Drainage
Signs
Guardrails

Considerations for Reclassification Design Control . Reclassification would provide the Town of Hinesburg with greater autonomy for many
street design features. In particular, the Town would have greater flexibility for the following features,
which are not always welcomed by VTrans on street design projects
lane widths
shoulder widths
on-street parking
The following street design elements would be subject to MUTCD regulations, as these are adopted by
State law, although the Town would have greater leeway in interpretation.
Posted speed limits
Crosswalk locations
Signal warrants
Other road signs as indicated
Project Funding. Under town jurisdiction, VTrans will provide funding for Route 116 for the following
types of projects:
Class 1 Town Highway Resurfacing. Resurfacing projects will be conducted by VTrans at no cost
to the Town. With the completion of the recent resurfacing, it will be quite some time before
resurfacing is needed again.
Town Highway Bridge Program. Bridge structures will be eligible for funding under this program,
with matching funds of 10% for replacement and 5% for rehabilitation. The Town’s goal to
replace the undersized culvert just north of Commerce Street would be subject to this matching
requirement if conducted through this program.
Transportation Alternatives and Bicycle-Pedestrian Grants. There would be no changes to
funding responsibility or priorities for these grant funded programs. However, the design
flexibility afforded by local jurisdiction could allow for more context sensitive and efficient
design. These programs do all include VTrans design review.
Access Management. Reclassification would allow greater Town authority over the granting of
access permits.
The following provides relevant excerpts from Vermont Statutes for Class 1 Town Highways for
information.
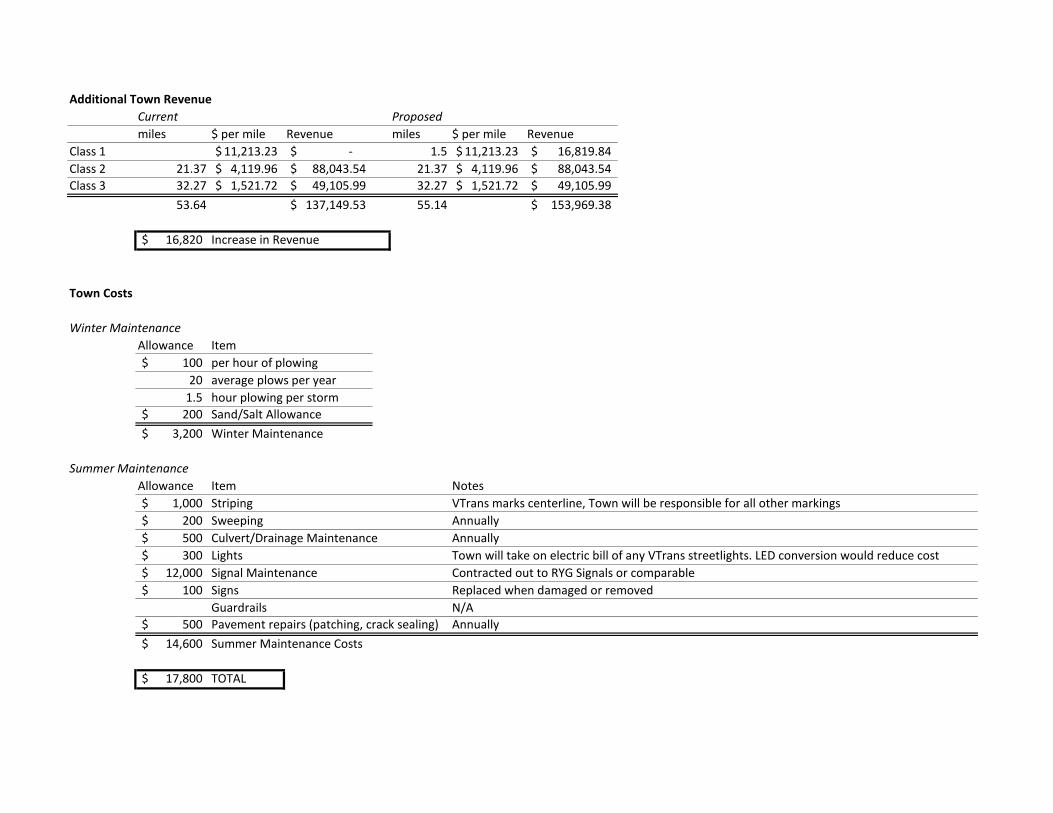
Additional Town Revenue
Current Proposed
miles $ per mile Revenue miles $ per mile Revenue
Class 1 11,213.23$ -$ 1.5 11,213.23$ 16,819.84$
Class 2 21.37 4,119.96$ 88,043.54$ 21.37 4,119.96$ 88,043.54$
Class 3 32.27 1,521.72$ 49,105.99$ 32.27 1,521.72$ 49,105.99$
53.64 137,149.53$ 55.14 153,969.38$
16,820$ Increase in Revenue
Town Costs
Winter Maintenance
Allowance Item
100$ per hour of plowing
20 average plows per year
1.5 hour plowing per storm
200$ Sand/Salt Allowance
3,200$ Winter Maintenance
Summer Maintenance
Allowance Item Notes
1,000$ Striping VTrans marks centerline, Town will be responsible for all other markings
200$ Sweeping Annually
500$ Culvert/Drainage Maintenance Annually
300$ Lights Town will take on electric bill of any VTrans streetlights. LED conversion would reduce cost
12,000$ Signal Maintenance Contracted out to RYG Signals or comparable
100$ Signs Replaced when damaged or removed
Guardrails N/A
500$ Pavement repairs (patching, crack sealing) Annually
14,600$ Summer Maintenance Costs
17,800$ TOTAL

19 VSA § 306. Appropriation; state aid for town highways
(a) General state aid to town highways. An annual appropriation to class 1, 2 and 3 town highways shall be made. This appropriation shall increase or decrease over the previous year's appropriation by the same percentage as any increase or decrease in the transportation agency's total appropriations funded by transportation fund revenues, excluding the town highway appropriations for that year. The funds appropriated shall be distributed to towns as follows: (1) six percent of the state's annual town highway appropriation shall be apportioned to class 1 town highways. The apportionment for each town shall be that town's percentage of class 1 town highways of the total class 1 town highway mileage in the state; (2) forty-four percent of the state's annual town highway appropriation shall be apportioned to class 2 town highways. The apportionment for each town shall be that town's percentage of class 2 town highways of the total class 2 town highway mileage in the state; (3) fifty percent of the state's annual town highway appropriation shall be apportioned to class 3 town highways. The apportionment for each town shall be that town's percentage of class 3 town highways of the total class 3 town highway mileage in the state; (4) moneys apportioned under subdivisions (1), (2), and (3) shall be distributed to each town in quarterly payments beginning July 15 in each year; (5) each town shall use the monies apportioned to it solely for town highway construction, improvement, and maintenance purposes or as the nonfederal share for public transit assistance. These funds may also be used for the establishment and maintenance of bicycle routes. The members of the selectboard shall be personally liable to the state, in a civil action brought by the attorney general, for making any unauthorized expenditures from money apportioned to the town under this section. 19 VSA § 306a. Class 1 town highways; agency responsibility for scheduled surface maintenance
(a) Unless otherwise directed by the legislative body of a municipality, the agency shall assume direct responsibility for scheduled surface maintenance of all class 1 town highways, at no expense to the municipality. The class 1 town highways shall be included in the agency's pavement management system and analyzed for resurfacing needs and considered for programming of available federal and state funds on the same basis as state highways. (b) The provisions of this section shall not affect any legislative body's jurisdiction over class 1 town highways or any municipality's responsibility for general maintenance of class 1 town highways, including, but not limited to, spot patching, traffic control devices, curbs, sidewalks, drainage, and snow removal. (c) Notwithstanding the provisions of this section, major reconstruction of class 1 town highways, beyond the usual scope of resurfacing, shall continue to be a municipal responsibility, subject to availability of federal and state aid under chapter 15 of this title and payment of the uniform local share under section 309a of this title. (Added 1993, No. 61, § 11, eff. June 3, 1993; amended 1995, No. 183 (Adj. Sess.), § 18c, eff. May 22, 1996.)
19 VSA § 1101. Concurrent authority; class 1 highways On all class 1 highways, and the bridges on class 1 highways the agency shall have concurrent authority and jurisdiction with selectmen in all matters within the authority and jurisdiction of the selectmen under the provisions of this chapter. If a person named in an order made by the agency under the authority of this section, neglects or refuses to comply with the order within the time prescribed by law, the agency may report the neglect or refusal to the state's attorney of the county where the highway or bridge mentioned in the order is located. (Added 1985, No. 269 (Adj. Sess.), § 1.) 23 VSA § 1393. Limits in incorporated villages and cities (a) On all highways in an incorporated village or city the legal load shall be as prescribed for the state highway system, unless otherwise restricted and posted by the local authorities, as provided in this subchapter. With the approval of the secretary of transportation, the selectboard of a town may designate any highway in the town to carry the same legal load as specified in section 1392 of this title for state highways. When a certain highway has been approved by the secretary as to the legal load limit, then the secretary shall have the highway posted for the legal load limit. Notwithstanding the provisions of this chapter, state highway weight limits as specified in section 1392 of this title shall apply to class 1 town highways; however, when the legislative body of a municipality requests in writing, the secretary of transportation may set the weight limit on a class 1 town highway at less than the state highway limit under section 1392 of this title, if a reasonable alternative route is available for those vehicles traveling at the state highway limit. (b) In making the determination as to whether a reasonable alternative route is available, the secretary of transportation shall, at a minimum, consider the following factors: (1) Whether the alternative routing will reduce or relieve traffic congestion in a downtown area. (2) Whether the alternative routing will enhance safety. (3) The length of the alternative route, and any increase in time made necessary by use of the
alternative route. (4) Whether an adverse effect has been created relative to the quiet enjoyment and property values of people living along the alternative route. (c) Any decision of the secretary made under this section may be appealed, in writing, to the transportation board within 30 days of the secretary's decision. The transportation board shall decide the question within 45 days of receipt of the appeal, and may take evidence or testimony. (Amended 1991, No. 214 (Adj. Sess.), § 3, eff. May 27, 1992; 1993, No. 186 (Adj. Sess.), § 2; 1995, No. 119 (Adj. Sess.), § 7.)
23 VSA § 1394. Designation of class 1 town highways The class 1 town highways connecting the state highways through cities, villages, or municipalities shall be designated by the state transportation board and marked by the state secretary of transportation. The state secretary of transportation shall have signs erected on each road which leads off the state highway system stating the legal load of the highway leading from the state highway system. (Amended 1975, No. 7, eff. Feb. 14, 1975.)