commodities as financial assets - ieor.columbia.edu · commodities are different, because… they...
TRANSCRIPT
Commodities as Financial Assets
Commodities are different, because…
They are produced, consumed, They are produced, consumed, transported, and stored, so…transported, and stored, so…
Market inventory swings wildlyMarket inventory swings wildlyOwning a commodity at one place and time is a Owning a commodity at one place and time is a completely different financial asset from owning it completely different financial asset from owning it at another. Enforcing arbitrage relationships at another. Enforcing arbitrage relationships between them is expensive or impossiblebetween them is expensive or impossible

Examples of Traded Commodities
EnergyEnergycrude oil, gasoline, heating oil, natural gas, electric power, ecrude oil, gasoline, heating oil, natural gas, electric power, etctc
Precious MetalsPrecious Metalsgold, silver, platinum, palladium etcgold, silver, platinum, palladium etc
Base MetalsBase Metalsaluminum, copper, nickel, zinc, etc.aluminum, copper, nickel, zinc, etc.
AgriculturalAgriculturalgrains, soy beans, coffee, pork bellies, etcgrains, soy beans, coffee, pork bellies, etc
OthersOtherspulp, paper, weather, chemicals, etcpulp, paper, weather, chemicals, etc
Specifications need to be standardized to create trading volume.Specifications need to be standardized to create trading volume.
The customers of commodity derivatives are The customers of commodity derivatives are industrial producers and consumers, and industrial producers and consumers, and sometimes governments who depend on the sometimes governments who depend on the revenue. revenue.
Particularly in energy, these customers are Particularly in energy, these customers are particularly risk averse, because of legal particularly risk averse, because of legal sanctions for failure to deliver. sanctions for failure to deliver.
The customers of commodity derivatives

The underlying assets for commodity derivatives are forwards and futures, not spotThis is a reflection of the statement that the This is a reflection of the statement that the
same commodity at a different place or same commodity at a different place or time is a different financial asset. time is a different financial asset.
In addition, hedging with spot is impractical, In addition, hedging with spot is impractical, because spot is much less liquid, and because spot is much less liquid, and it is impossible to short the spot it is impossible to short the spot commodity. commodity.

Forwards and Futures on Commodities have special featuresForwards and Futures traded in the marketForwards and Futures traded in the market
Physical forward delivers physical every day for a Physical forward delivers physical every day for a month, like an average of the spot pricemonth, like an average of the spot priceNYMEX futures, settles on physical forwardsNYMEX futures, settles on physical forwardsNYMEX NYMEX LookalikeLookalike forwards, settles on NYMEX future forwards, settles on NYMEX future price at expiryprice at expiryPublication forwards, e.g. Platt’s, settle on the Publication forwards, e.g. Platt’s, settle on the monthly average of the Platt’s poll of closing spot monthly average of the Platt’s poll of closing spot pricespricesCalendar Swap settles on monthly average of closing Calendar Swap settles on monthly average of closing NYMEX pricesNYMEX prices
The first nearby is simply the forward contract The first nearby is simply the forward contract closest to expiry. The second nearby is the closest to expiry. The second nearby is the second closest, etc. second closest, etc.
When a forward contract expires, it is said to When a forward contract expires, it is said to “roll off”. The second nearby becomes the “roll off”. The second nearby becomes the first, the third becomes the second, etc. first, the third becomes the second, etc.
Most exotic derivatives e.g. barriers and Most exotic derivatives e.g. barriers and average rates, are written on average rates, are written on nearbysnearbys, rather , rather than on particular forwards, so that they than on particular forwards, so that they actually refer to several different forwards. actually refer to several different forwards.
Forwards are referred to in terms of nearbys

The Shape of the Forward Curve
There are no curve flattening arbitrages There are no curve flattening arbitrages available in commodities. available in commodities. If the curve is upward sloping, then buy the If the curve is upward sloping, then buy the earlier forward and sell the later, but earlier forward and sell the later, but one has to take delivery, and store it. Can one has to take delivery, and store it. Can only make money if price difference is greater only make money if price difference is greater than storage costs, defines the than storage costs, defines the ““contango contango limitlimit””. . If the curve is downward sloping, need to If the curve is downward sloping, need to short the spot commodity short the spot commodity –– impossible.impossible.
Behavior of the Forward CurveAlmost all commodities forward curve Almost all commodities forward curve have a stable long end, and a violent, have a stable long end, and a violent, whipping short end. whipping short end. Long end sits near marginal cost of Long end sits near marginal cost of productionproductionShort end governed by short term Short end governed by short term supply and demandsupply and demand
If short end is below long end we are If short end is below long end we are in glut == in glut == ““contangocontango””If short end is above long end we are If short end is above long end we are in shortage == in shortage == ““backwardationbackwardation””

What is special about commodities forward curves?BackwardationBackwardation
30Aug02
23.524.024.525.025.526.026.527.027.528.028.529.0
1Aug02 1Aug051Jan03 1Jul03 1Jan04 1Jul04 1Jan05

ContangoContango
10Dec98
10.511.011.512.012.513.013.514.014.515.015.516.016.517.017.5
1Dec98 1Dec021Jul99 1Jan00 1Jul00 1Jan01 1Jul01 1Jan02 1Jul02
What is special about commodities forward curves?

Bias of the forward curveMost trading volume takes place at the long end of Most trading volume takes place at the long end of the curve the curve –– industry buys well in advance.industry buys well in advance.Short end of the curve is used to cover unanticipated Short end of the curve is used to cover unanticipated demanddemandBecause industry in general, and utilities in particular Because industry in general, and utilities in particular suffer out of proportion to the trading gain/loss if they suffer out of proportion to the trading gain/loss if they fail to deliver, the front of the forward curve is almost fail to deliver, the front of the forward curve is almost always bid up, i.e. backwardated. In financial terms, always bid up, i.e. backwardated. In financial terms, this translates to extreme riskthis translates to extreme risk--aversionaversionInvestor indices such as GSCI have been invented to Investor indices such as GSCI have been invented to allow investors to enter this market, and ride up the allow investors to enter this market, and ride up the forward curveforward curveRecently, hedge funds have entered the market, Recently, hedge funds have entered the market, generating a large net speculative length generating a large net speculative length

Forward curves display seasonalityIntermediate points on commodities forward curves Intermediate points on commodities forward curves tend to have humps at points of anticipated high tend to have humps at points of anticipated high demand, or supply constraint, and valleys where low demand, or supply constraint, and valleys where low demand or high supply are anticipateddemand or high supply are anticipatedThis is mitigated when there is storage capacity This is mitigated when there is storage capacity covering many more days than the length of the covering many more days than the length of the hump or valley. hump or valley. Natural gas has a large hump in winter, a small one Natural gas has a large hump in winter, a small one in summerin summerGasoline has a large hump in the Gasoline has a large hump in the ““summer driving summer driving seasonseason””Electricity has yearly humps in summer and winter, Electricity has yearly humps in summer and winter, humps on weekdays, and humps during working humps on weekdays, and humps during working hourshours
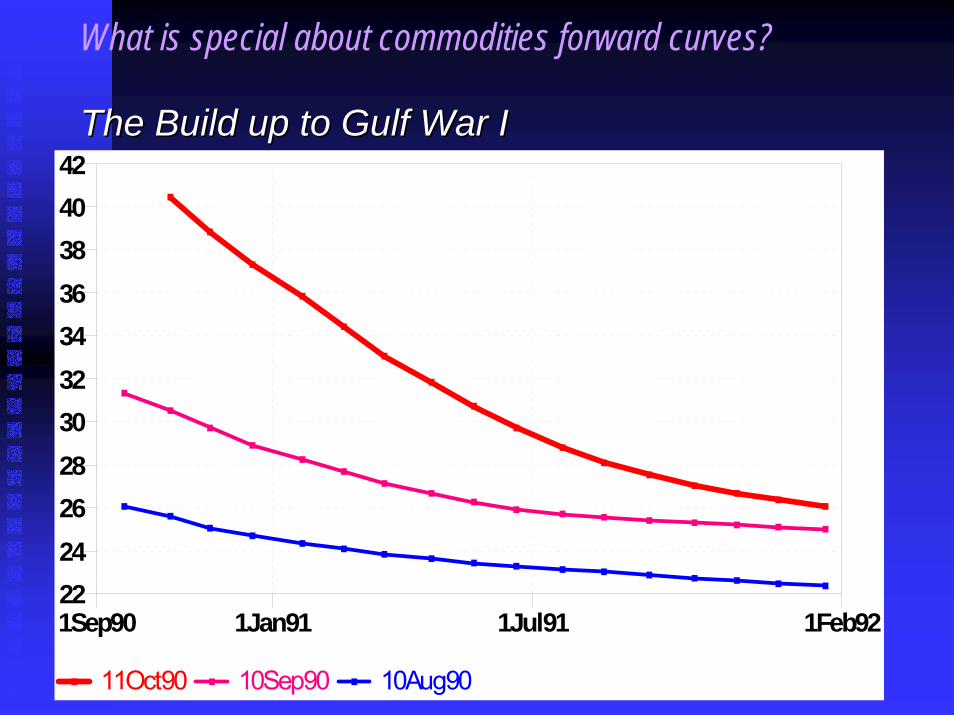
The Build up to Gulf War IThe Build up to Gulf War I
11Oct90 10Sep90 10Aug90
2224262830323436384042
1Sep90 1Feb921Jan91 1Jul91
What is special about commodities forward curves?

Finer pointsFiner points
Shape of forward curve affected by available storage and transpoShape of forward curve affected by available storage and transportationrtation
Sufficient shortSufficient short--term supply & transport implies shortterm supply & transport implies short--term contangoterm contangoAluminum marketAluminum market
1555
1560
1565
1570
1575
1580
1585
1590
1595
1600
1605
1610
1615
1Mar00 1Jul021Jul00 1Jan01 1Jul01 1Jan02
What is special about commodities forward curves?
Example: Storage and Seasonality in the US Natural Gas Market
US Natural gas production and consumption average US Natural gas production and consumption average 550bcf/mth.550bcf/mth.We withdraw from NovemberWe withdraw from November--April (April (““winterwinter””) and store from ) and store from AprilApril--November (November (““injection seasoninjection season””))Total NG storage is 3.2 Total NG storage is 3.2 tcftcf, with a minimum of 500bcf. , with a minimum of 500bcf. NG forwards are contango in fall leading up to January, and NG forwards are contango in fall leading up to January, and backwardation in spring, with a small summer peak. backwardation in spring, with a small summer peak. Extreme volatility in the March contract, if it looks like we miExtreme volatility in the March contract, if it looks like we might ght not have enoughnot have enoughBut April contract does not reflect this at all!But April contract does not reflect this at all!If it looks like storage tanks will fill completely before NovemIf it looks like storage tanks will fill completely before November, ber, can have downward spikes in supply, if it has nowhere to go. can have downward spikes in supply, if it has nowhere to go. Transport costs around $0.03/MMBTU, losses around 2%.Transport costs around $0.03/MMBTU, losses around 2%.
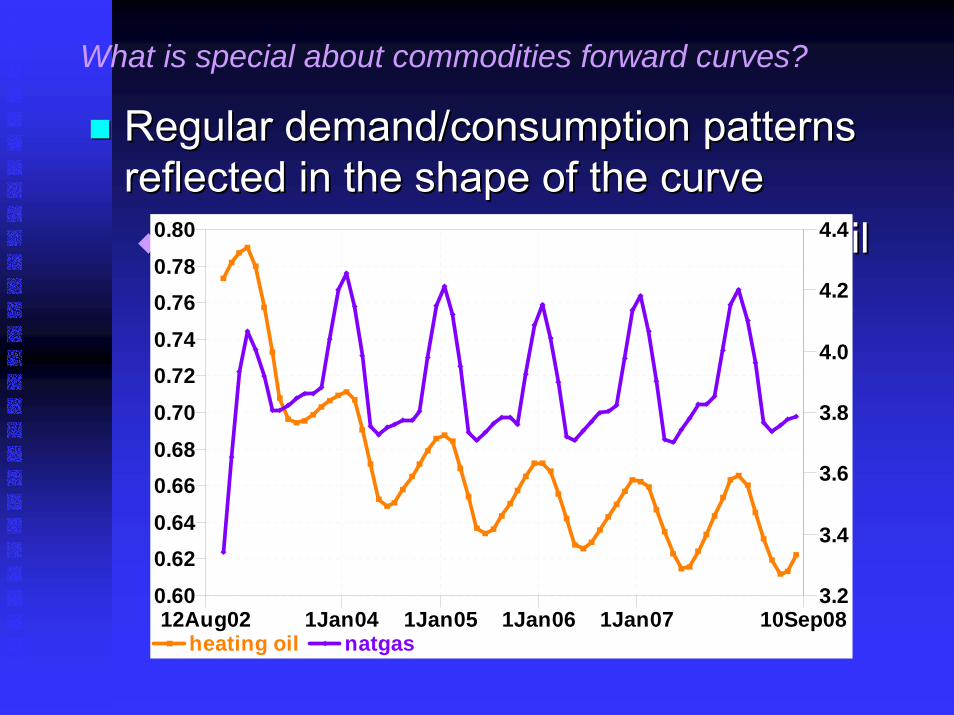
Regular demand/consumption patterns Regular demand/consumption patterns reflected in the shape of the curve reflected in the shape of the curve
Seasonality in natural gas, heating oilSeasonality in natural gas, heating oil
heating oil natgas
0.60
0.620.64
0.660.68
0.70
0.720.74
0.760.78
0.80
3.2
3.4
3.6
3.8
4.0
4.2
4.4
12Aug02 10Sep081Jan04 1Jan05 1Jan06 1Jan07
What is special about commodities forward curves?
Example: Storage and Seasonality in the US Oil Markets
US consumes 22mm bbls/day, and produces about 5mm US consumes 22mm bbls/day, and produces about 5mm bbls/daybbls/dayExtraction costs range from $2.50/bbl to $12/bblExtraction costs range from $2.50/bbl to $12/bblStorage costs $0.15/bbl Storage costs $0.15/bbl mthmth -- $0.30/bbl $0.30/bbl mthmth, total storage , total storage capacity 350mm bbls, with a minimum of 265mm bbls. In capacity 350mm bbls, with a minimum of 265mm bbls. In addition, there is the US Strategic Petroleum Reserve, but this addition, there is the US Strategic Petroleum Reserve, but this is is held out of the market most of the time. held out of the market most of the time. Transport costs are about $0.20/ bbl/ Transport costs are about $0.20/ bbl/ kmilekmile..Little seasonality in crude oil, but there is seasonality in heaLittle seasonality in crude oil, but there is seasonality in heating ting oil, gasoline, etc. oil, gasoline, etc.

Example: Storage and Seasonality in the US Power Markets
Power is segmented into separate markets by time of day.Power is segmented into separate markets by time of day.You can buy either On Peak, or Off Peak, there is a smaller You can buy either On Peak, or Off Peak, there is a smaller market in individual hours. market in individual hours. These different times of day have such different properties and These different times of day have such different properties and pricing that they are regarded as different assets. pricing that they are regarded as different assets. Seasonalities are intraSeasonalities are intra--day, intraday, intra--week, and intraweek, and intra--year. year. Power supply is generated by plants with varying efficiencies Power supply is generated by plants with varying efficiencies and start up times, arranged in a generation stack. The most and start up times, arranged in a generation stack. The most efficient longest startup time plants are at the bottom, and theefficient longest startup time plants are at the bottom, and theothers are arranged in descending order of efficiency, in a others are arranged in descending order of efficiency, in a ““generation stackgeneration stack””Power price jumps with demand as we move up the generation Power price jumps with demand as we move up the generation stack. stack. It is also possible to transport, if there is spare capacity, buIt is also possible to transport, if there is spare capacity, but t transport between neighboring markets costs 1transport between neighboring markets costs 1--5$/MW5$/MW--hr, out of hr, out of $35/MW$35/MW--hr for a typical plant. Also 3% is lost in transmission hr for a typical plant. Also 3% is lost in transmission wires.wires.

Monthly, weekly, daily Monthly, weekly, daily ““seasonalityseasonality”” for power for power
peak offpeak weekends+holidays
15
20
25
30
35
40
45
50
55
12Aug02 10Sep071Jan04 1Jan05 1Jan06 1Jan07
What is special about commodities forward curves?
Example: Storage and Seasonality in London Base Metals
Storage for base metals is cheap, and plentifulStorage for base metals is cheap, and plentifulTransport costs around $0.05/lb Transport costs around $0.05/lb -- $0.08/lb$0.08/lbCertain metals have seasonality of demand, but this Certain metals have seasonality of demand, but this does not show up in forward curve, possibly because does not show up in forward curve, possibly because of plentiful storage. of plentiful storage. Aluminum is demanded in summer, by beverage Aluminum is demanded in summer, by beverage makersmakersLead is demanded in winter, by battery makersLead is demanded in winter, by battery makers

Forward Curves are Frequency-limited by trading from storage operators.
In order to move the markets for a single futures contract, it In order to move the markets for a single futures contract, it takes trading in a volume of size with the same magnitude as takes trading in a volume of size with the same magnitude as the daily usage. the daily usage. To stamp out a peak of width T in the forward curve, we need To stamp out a peak of width T in the forward curve, we need around T days usage in storage (roughly).around T days usage in storage (roughly).To stamp out a trough of width T in the forward curve, we need To stamp out a trough of width T in the forward curve, we need around T days usage of storage capacity (roughly). around T days usage of storage capacity (roughly). Thus, we expect to see details in the forward curve no smaller Thus, we expect to see details in the forward curve no smaller than the number of days usage in storage, in normal situations. than the number of days usage in storage, in normal situations. When close to the lower limit of storage, we can see finer detaiWhen close to the lower limit of storage, we can see finer details ls in peaks, when close to the upper limit of storage, we can see in peaks, when close to the upper limit of storage, we can see finer details in troughs.finer details in troughs.
The Volatility Surface Constituents
The volatility surface is made up of options on The volatility surface is made up of options on futures, one option maturity for each futures futures, one option maturity for each futures contract, maturing within a few days (up to a contract, maturing within a few days (up to a week or two) of the futures maturity. In most week or two) of the futures maturity. In most markets, the liquid options can range in markets, the liquid options can range in moneynessmoneyness from 0.5 to 2, and possibly more.from 0.5 to 2, and possibly more.Because these futures are really different Because these futures are really different assets, this is not a volatility surface in the assets, this is not a volatility surface in the usual senseusual sense

Volatilities in commodities markets are almost always backwardated
Long end moves with long term Long end moves with long term demand, determined by weather, demand, determined by weather, gdpgdpgrowth. Very slow, little volatility, 2growth. Very slow, little volatility, 2--10% 10% instantaneous volatilityinstantaneous volatilityShort end whips around with short term Short end whips around with short term supply and demand (200%supply and demand (200%--300%)300%)Reversion occurs over a few weeks. Reversion occurs over a few weeks.
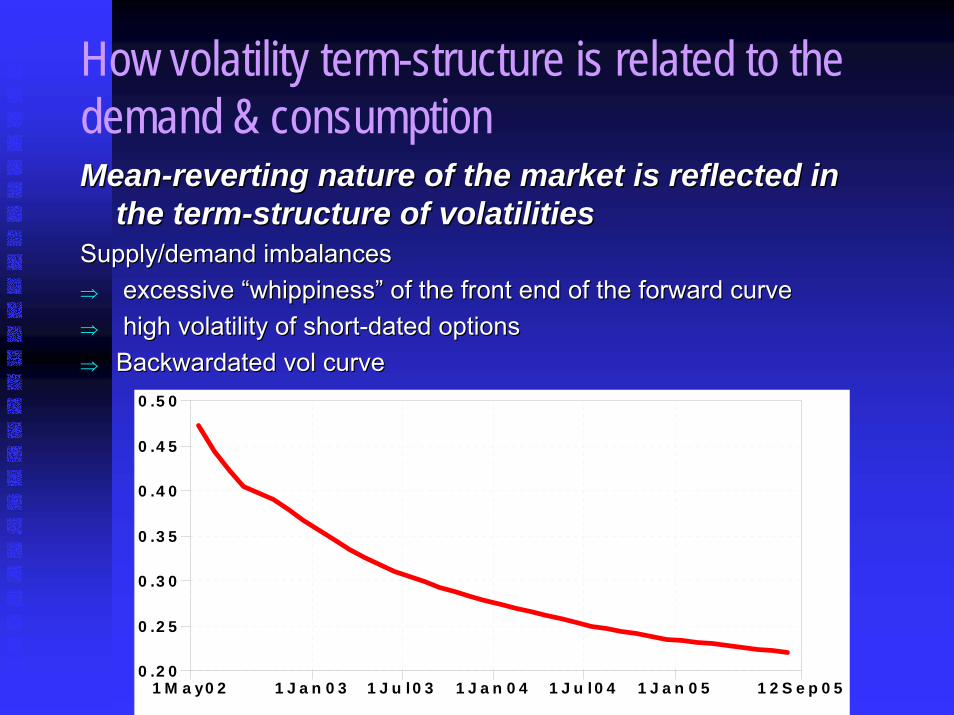
How volatility term-structure is related to the demand & consumptionMeanMean--reverting nature of the market is reflected in reverting nature of the market is reflected in
the termthe term--structure of volatilitiesstructure of volatilitiesSupply/demand imbalances Supply/demand imbalances ⇒⇒ excessive “whippiness” of the front end of the forward curve excessive “whippiness” of the front end of the forward curve ⇒⇒ high volatility of shorthigh volatility of short--dated optionsdated options⇒⇒ Backwardated vol curveBackwardated vol curve
0 .2 0
0 .2 5
0 .3 0
0 .3 5
0 .4 0
0 .4 5
0 .5 0
1 M a y0 2 1 2 S e p 0 51 J a n 0 3 1 J u l 0 3 1 J a n 0 4 1 J u l 0 4 1 J a n 0 5
In crises, volatility can become contangoAnd variance can backwardate!!!
On occasion there is a supply crunch which On occasion there is a supply crunch which affects one month, and not the succeeding one. affects one month, and not the succeeding one. Implied Volatilities explode for the affected Implied Volatilities explode for the affected month, but then drop back down for the month, but then drop back down for the succeeding month. This can even go to the succeeding month. This can even go to the extent of backwardating the variances. Because extent of backwardating the variances. Because one cannot short spot, this cannot be arbitraged. one cannot short spot, this cannot be arbitraged. In March 2003, this happened in the US Natural In March 2003, this happened in the US Natural Gas markets, because it was a cold winter and we Gas markets, because it was a cold winter and we ran out of Natural gas in Texas. ran out of Natural gas in Texas.
The volatility skew is primarily determined by inventory effects
Most market participants are industrial, extremely risk Most market participants are industrial, extremely risk averse, hedging exposure. averse, hedging exposure. Producers want OTM puts, Consumers want OTM Producers want OTM puts, Consumers want OTM calls. calls. Market is rarely in balance, and in some cases it is Market is rarely in balance, and in some cases it is extreme. extreme. Electricity hedging is only done by producers, vol Electricity hedging is only done by producers, vol surface is a diagonal line. ITM puts can be bought at surface is a diagonal line. ITM puts can be bought at or close to intrinsic value, because dealers are so full or close to intrinsic value, because dealers are so full of them, they cannot bear further risk. of them, they cannot bear further risk. Nat Gas hedging is only done by consumers. Skew Nat Gas hedging is only done by consumers. Skew is very heavy the other way, because the market is all is very heavy the other way, because the market is all one way. one way.

What is volatility skew, and how is it related to who dominates the marketScenario 1.Scenario 1.
Market dominated by Market dominated by ““producersproducers””..““positivepositive”” put skew, put skew, ““negativenegative”” call skewcall skew..
Quick Delta
WTIF03 EXCHANGE Vol Skew [Graph #10]
0.38
0.40
0.42
0.44
0.46
0.48
0.0 0.2 0.4 0.6 0.8 1.0

What is volatility skew, and how is it related to who dominates the marketScenario 2.Scenario 2.
Market dominated by Market dominated by ““consumersconsumers””..““positivepositive”” call skew, call skew, ““negativenegative”” put skewput skew..
Quick Delta
NGJ03 EXCHANGE Vol Skew [Graph #9]
0.37
0.38
0.39
0.40
0.41
0.42
0.43
0.44
0.45
0.46
0.0 0.2 0.4 0.6 0.8 1.0
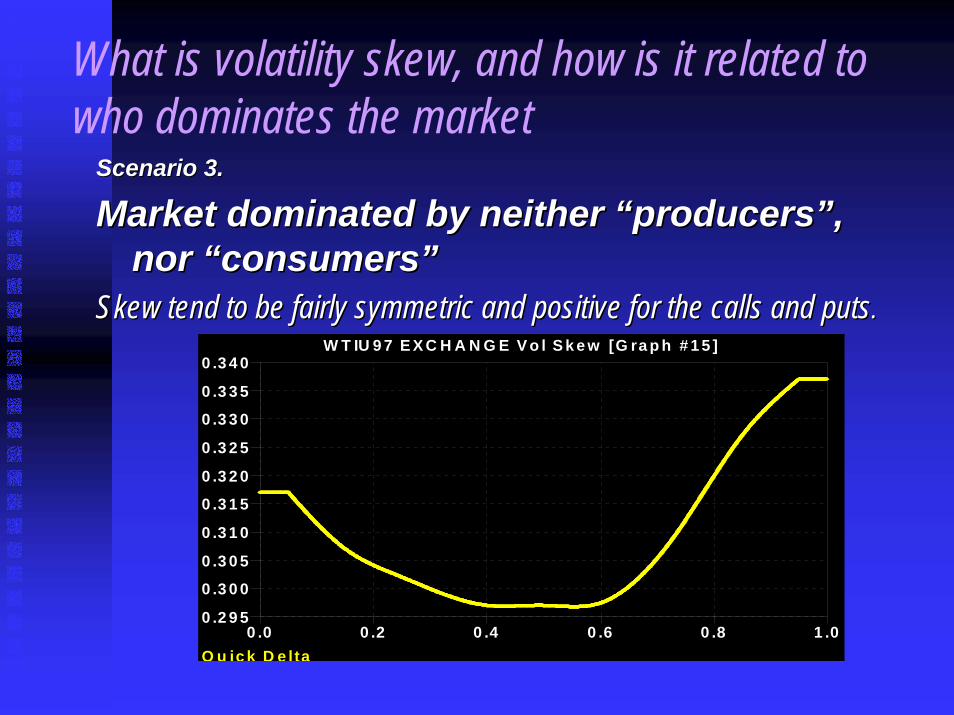
What is volatility skew, and how is it related to who dominates the market
Scenario 3.Scenario 3.
Market dominated by neither Market dominated by neither ““producersproducers””, , nor nor ““consumersconsumers””
Skew tend to be fairly symmetric and positive for the calls and Skew tend to be fairly symmetric and positive for the calls and putsputs..
Q u ic k D e lta
W T IU 9 7 E X C H A N G E V o l S k e w [G ra p h # 1 5 ]
0 .2 9 5
0 .3 0 0
0 .3 0 5
0 .3 1 0
0 .3 1 5
0 .3 2 0
0 .3 2 5
0 .3 3 0
0 .3 3 5
0 .3 4 0
0 .0 0 .2 0 .4 0 .6 0 .8 1 .0

Kurtosis appears immediately , and lasts a long time
Jumpy behavior visible in observation of futures Jumpy behavior visible in observation of futures trading, and in option prices close to expiry. trading, and in option prices close to expiry. Kurtosis is jumpKurtosis is jump--like, in that it appears immediately, like, in that it appears immediately, does not build up. does not build up. Kurtosis is also StochasticKurtosis is also Stochastic--volvol--like, in that it lasts a like, in that it lasts a long time (more than a year). long time (more than a year). Spikes are present, but do not affect vanilla option Spikes are present, but do not affect vanilla option value that much.value that much.
Comes about when a stored supply is Comes about when a stored supply is exhausted, or when demand outruns exhausted, or when demand outruns production capacityproduction capacityBehavior is difficult to model with Behavior is difficult to model with Markov models, requires regimeMarkov models, requires regime--switching, or extreme mean reversionswitching, or extreme mean reversionDoes not really influence value of Does not really influence value of vanillas, but very important for barriers. vanillas, but very important for barriers.
Non-Black-Scholes Behavior: Spiking
Non-Black-Scholes Behavior: Negative Prices
Happens in the power markets, Happens in the power markets, because there is no storage, and because there is no storage, and because it costs a lot of money to shut because it costs a lot of money to shut down and start up certain kinds of down and start up certain kinds of plants (nuclear, coal).plants (nuclear, coal).Happens in natural gas markets, but Happens in natural gas markets, but very rarely. very rarely.

Common Commodity Exotics: Transport Options
A simple option on the difference A simple option on the difference between prices in two locations. between prices in two locations. Sold as a strip. Sold as a strip. Incorporates a loss rateIncorporates a loss rateCan be tricky to model, as correlation is Can be tricky to model, as correlation is close to 1, yet poorly known, most close to 1, yet poorly known, most models are singular at models are singular at ρρ=1=1
Common Commodity Exotics: Load Serving Deals
Power Utilities would like to hedge not just the power price, buPower Utilities would like to hedge not just the power price, but t the demand as well, because they cannot refuse to serve. the demand as well, because they cannot refuse to serve. The load is also highly correlated with the power price, as wellThe load is also highly correlated with the power price, as well as as with weather, and with long term economic growth. with weather, and with long term economic growth. There is no market in load, so crude models are marked to There is no market in load, so crude models are marked to historic datahistoric dataThere are no satisfactory models of load, and There are no satisfactory models of load, and andand almost no almost no work has been done to model it, even though it is critical to mawork has been done to model it, even though it is critical to many ny people. people.
Common Commodity Exotics: Crack Spread Options
Payoff is the difference between Oil Payoff is the difference between Oil Product (Heating Oil, Fuel Oil) and Product (Heating Oil, Fuel Oil) and Crude, minus strike. Crude, minus strike. The natural hedge for a refinery. The natural hedge for a refinery.

Common Commod Exotics: Spark Spread Options
The natural hedge for a gas burning power The natural hedge for a gas burning power plant, the payoff is Payoff = max( P plant, the payoff is Payoff = max( P –– H * H * G,0)G,0)Heat rate H represents efficiency of the Heat rate H represents efficiency of the plant, and varies from deal to deal, and from plant, and varies from deal to deal, and from plant to plant. plant to plant. For less efficient plants, higher up the For less efficient plants, higher up the generation stack, a strike is sometimes generation stack, a strike is sometimes included. included.
Common Commodity Exotics: Swing Options
This is an option to hedge out the flexibility that a This is an option to hedge out the flexibility that a customer has in buying natural gas. customer has in buying natural gas. A customer contracts to buy a certain quantity of A customer contracts to buy a certain quantity of natural gas over a series of periods. He has the natural gas over a series of periods. He has the option to take a certain amount each day, at the option to take a certain amount each day, at the floating rate. He must buy at least a minimum floating rate. He must buy at least a minimum amount within the period, or there are penalties. amount within the period, or there are penalties. There is rebating in the next period if he buys more There is rebating in the next period if he buys more than the maximum in a period. than the maximum in a period. This has a lot of optionality, and is very timeThis has a lot of optionality, and is very time--consuming to evaluate, even in a simple model. consuming to evaluate, even in a simple model. This is another interesting problem for academics.This is another interesting problem for academics.
Common Commodity Exotics: Storage Options
Very similar to Swing optionsVery similar to Swing optionsA user is rented a storage tank. He has the option each day to A user is rented a storage tank. He has the option each day to buy buy natgasnatgas and inject into the tank, or withdraw and sell and inject into the tank, or withdraw and sell natgasnatgasfrom the tank, or do nothing.from the tank, or do nothing.He pays operating fees to inject or withdraw. He pays operating fees to inject or withdraw. He must return the tank at some level of fill.He must return the tank at some level of fill.He has a daily injection limit and a daily withdrawal limit.He has a daily injection limit and a daily withdrawal limit.This option has a lot of optionality, is difficult and timeThis option has a lot of optionality, is difficult and time--consuming to evaluate, even in a simple modelconsuming to evaluate, even in a simple modelThis is another place where academics can make a real This is another place where academics can make a real contribution to the business.contribution to the business.
Commodities Models: Basic FeaturesSpot Price ModelsSpot Price Models
Evaluate futures as Evaluate futures as F_tTF_tT = E( S_T | = E( S_T | S_tS_t ), almost ), almost always a smooth function (Can’t have discontinuous always a smooth function (Can’t have discontinuous forward curve!)forward curve!)Almost always have mean reversionAlmost always have mean reversionparametrizeparametrize forward curve with convenience yield yforward curve with convenience yield y
F_tTF_tT = = S_tS_t exp( (r + u exp( (r + u –– y)(Ty)(T--tt) ), u = storage rate.) ), u = storage rate.Spot models are limited, can’t have negative forward Spot models are limited, can’t have negative forward variance in futures. Hard to put in sharply varying variance in futures. Hard to put in sharply varying forward curves.forward curves.But Spot models are much more tractable, with fewer But Spot models are much more tractable, with fewer factors.factors.
Commodity Models: Basic Features
Models of whole curve (i.e. 1 factor for Models of whole curve (i.e. 1 factor for each futures maturity) are capable of each futures maturity) are capable of encompassing most observed encompassing most observed phenomena, but have many more phenomena, but have many more factors, and so are hard to evaluate. factors, and so are hard to evaluate. BGMBGM--like Factor models are a kind of like Factor models are a kind of compromise. compromise.

Commodities Models: Basic Features
Should have some form of mean reversionShould have some form of mean reversionShould be Should be generalizablegeneralizable to a multito a multi--commodity model, commodity model, or multior multi--location modellocation modelA model capturing the vol smile should be A model capturing the vol smile should be calibratablecalibratable to oddto odd--shaped vol surfaces, distorted by shaped vol surfaces, distorted by inventory effects. inventory effects. A model capturing the vol smile should probably A model capturing the vol smile should probably contain jumps.contain jumps.A model of storage, transport, or refineryA model of storage, transport, or refinery--capacity capacity constrained commodities should include these constrained commodities should include these variables, and their relation to their limits. variables, and their relation to their limits.
Commodities Models: Basic Features
Market Specific: Natural Gas models may Market Specific: Natural Gas models may want to use the storage limits, and current want to use the storage limits, and current value of storage as a parameter, controlling value of storage as a parameter, controlling jumpiness, now that there is a forward market jumpiness, now that there is a forward market in storage numbers.in storage numbers.Market Specific: Electricity markets should Market Specific: Electricity markets should separate different parts of the curve into separate different parts of the curve into different assets, hour, daydifferent assets, hour, day--ofof--week, seasonweek, season

Some example models: Gibson-Schwartz Model
A spot model for electricity, with A spot model for electricity, with stochastic convenience yield. stochastic convenience yield. Cannot accommodate sharply varying Cannot accommodate sharply varying forward curves, kurtosis, skew, negative forward curves, kurtosis, skew, negative forward variance.forward variance.Does not meanDoes not mean--revert, so variance revert, so variance grows too fast at long times.grows too fast at long times.

Some example models: Schwartz-Smith Model
A spot model for electricity, modeling spot as a lowA spot model for electricity, modeling spot as a low--vol long term rate, plus a rapidly varying difference, vol long term rate, plus a rapidly varying difference, mean reverting to zero.mean reverting to zero.ddχχ = = -- k k χχ dtdt + + σσ__χχ dZdZ__χχddζζ = = µµ__ζζ dtdt + + σσ__ζζ dZdZ__ζζSpot = Spot = ζζ++χχCannot accommodate sharply varying forward Cannot accommodate sharply varying forward curves, kurtosis, skew, negative forward variance.curves, kurtosis, skew, negative forward variance.Has some deHas some de--correlation of futures, for time spread correlation of futures, for time spread optionsoptions
Some example models: Gabillon Model
A spot model for energy, modeling spot as a A spot model for energy, modeling spot as a single factor Gaussian process that mean single factor Gaussian process that mean reverts to a lognormal long term ratereverts to a lognormal long term ratedSdS/S/S = = ββ( ( lnln L L –– lnln S ) S ) dtdt + + σσ_S _S dZ_SdZ_SdLdL/L = /L = µµ_L _L dtdt + + σσ_L _L dZ_LdZ_LCannot accommodate sharply varying Cannot accommodate sharply varying forward curves, kurtosis, skew, negative forward curves, kurtosis, skew, negative forward variance.forward variance.Has some deHas some de--correlation of futures, for time correlation of futures, for time spread optionsspread options
Some example models: Deng Model
A spot model for electricity and natural gas together, modeling A spot model for electricity and natural gas together, modeling them as 2 meanthem as 2 mean--reverting models with jumps, and either reverting models with jumps, and either stochastic vol, or regime switchingstochastic vol, or regime switchingdXdX = K ( θ = K ( θ –– X ) X ) dtdt + M + M dWdW + ∆Z^1_t+ ∆Z^2_t, + ∆Z^1_t+ ∆Z^2_t, where X is a 2where X is a 2--vector containing prices, M is Cholesky vector containing prices, M is Cholesky decompdecomp, , ∆Z^i∆Z^i are two R^2 Poisson processes, one for up and one for are two R^2 Poisson processes, one for up and one for down. down. Has kurtosis, skew, spikes!Has kurtosis, skew, spikes!Cannot accommodate sharply varying forward curves, negative Cannot accommodate sharply varying forward curves, negative forward variance.forward variance.Has some deHas some de--correlation of futures, for time spread optionscorrelation of futures, for time spread optionsA heavy model to evaluate.A heavy model to evaluate.

Some example models: Model of Audet, Heiskanen, Keppo and Vehvilainen
An HJMAn HJM--like curve model for electricity, in which each like curve model for electricity, in which each forward is a meanforward is a mean--reverting lognormal process. reverting lognormal process. dF_{tT}/F_{tTdF_{tT}/F_{tT}=exp(}=exp(--α(Tα(T--t))σ(T)dB_{T}(tt))σ(T)dB_{T}(t))with with dB_T(tdB_T(t) ) dB_T’(tdB_T’(t) = exp() = exp(--ρρ*|T’*|T’--T|) T|) dtdtAccomodatesAccomodates singular forward curves, and negative singular forward curves, and negative forward variance,forward variance,Easy to generalize to multiEasy to generalize to multi--commoditycommodityForwards nicely deForwards nicely de--correlatedcorrelatedEasy to solveEasy to solveHas no skew, kurtosis, jumps, spikes.Has no skew, kurtosis, jumps, spikes.

BibliographyPlatt’s Gas Daily, Platt’s Electricity DailyPlatt’s Gas Daily, Platt’s Electricity DailyEydelandEydeland, A. and Wolyniec, K. “Energy and Power , A. and Wolyniec, K. “Energy and Power Risk Management”, Wiley Finance, 2003Risk Management”, Wiley Finance, 2003GemanGeman & & VasicekVasicek “Plugging into Electricity”, Risk, “Plugging into Electricity”, Risk, Aug. 2001.Aug. 2001.ShijieShijie Deng, “Stochastic Models of Energy Deng, “Stochastic Models of Energy Commodity Prices and Their Applications: MeanCommodity Prices and Their Applications: Mean--reversion with Jumps and Spikes”reversion with Jumps and Spikes”CavusCavus, Mustafa and , Mustafa and PaxsonPaxson, Dean A. “The Valuation , Dean A. “The Valuation and Effectiveness of Long Term Forward Contracts”. and Effectiveness of Long Term Forward Contracts”. AudetAudet, N., , N., HeiskanenHeiskanen, P., , P., KeppoKeppo, J. and , J. and VehvilainenVehvilainen, , I “I “ModellingModelling of Electricity forward curve dynamics”. of Electricity forward curve dynamics”.

Acknowledgments: I would like to express my gratitude to the following I would like to express my gratitude to the following people for their willing and able help. Jamie Coxpeople for their willing and able help. Jamie Cox--Jones, Ben Freeman, Michael Jones, Ben Freeman, Michael KirchKirch, Ilya Ustilovsky, , Ilya Ustilovsky, Dan Dan SharfmanSharfman, Elisha Wiesel, Alex , Elisha Wiesel, Alex LesinLesin, Roberto , Roberto Caccia, Derek Yi, Sofia Caccia, Derek Yi, Sofia CheidvasserCheidvasser, Karhan , Karhan Akcoglu, Bill Cowieson, Jeremy Glick, Akcoglu, Bill Cowieson, Jeremy Glick, LavanyaLavanyaViswanathanViswanathan, Alan Yamamura and Pavel Langer for , Alan Yamamura and Pavel Langer for their advice and criticisms. I would also like to thank their advice and criticisms. I would also like to thank Peter Carr, Marco Avellaneda, Bob Kohn, Emanuel Peter Carr, Marco Avellaneda, Bob Kohn, Emanuel Derman, as well as Valerie Perugini. Derman, as well as Valerie Perugini.