common agent or double agent? pharmacy bene t managers …
TRANSCRIPT

Common Agent or Double Agent? PharmacyBenefit Managers in the Prescription Drug Market
Rena Conti,∗ Brigham Frandsen,† Michael Powell,‡
James B. Rebitzer§
January 25, 2021
Abstract
Pharmacy benefit managers (PBMs) are intermediaries that manage pre-scription drug purchases for health plans and other payers. PBMs play a cen-tral, but little analyzed, role in the U.S. market for prescription drugs. Drugmakers selling branded pharmaceuticals bid for desirable slots on the PBM’sformulary by offering rebates off of a drug’s list price. These formularies op-erate like all-pay contests. We find that PBMs enhance market efficiency, butthe efficiency gains do not accrue to consumers or drug makers. Our anal-ysis offers insights into otherwise puzzling questions. Why do drug makerspay rebates to PBMs? Why do payers delegate the critical formulary functionto PBMs? Why is the market dominated by a small number of very largePBMs acting as the common agent for many payers? Why are the list pricesof branded drugs so high? Why might PBMs vertically integrate with pay-ers? Our framework also offers insights into policy proposals for reforming themarket for prescription drugs.
1 Introduction
In 2020, the Food and Drug Administration (FDA) approved fifty-three new drugs—the largest number in more than two decades. The years 2017, 2018 and 2019 were
∗Boston University†Brigham Young University‡Northwestern University§Boston University
1

also highly productive years in terms of new drug development. While many ofthese therapies embody novel treatment approaches and offer substantial clinicalbenefits, their prices can be very high. Launch prices of new drugs are commonly setabove $100,000 per course of treatment by drug companies. In May 2019 Novartislaunched the “world’s most expensive drug,” onasemnogene abeparvovec-xioi, a genetherapy for spinal muscular atrophy that costs $2.1M per treated patient. Highprices for drugs protected from competition by patents and other types of marketexclusivities provide incentives for pharmaceutical companies to conduct researchand development, but they also limit access to treatment.
Every national healthcare system relies on a set of policies and institutions tobalance the tricky tradeoff between innovation incentives and access to innovativedrugs (Scherer, 2000).1 A peculiar feature of the U.S. system is a set of organizationscalled pharmacy benefit managers (PBMs). PBMs are for-profit, non-governmentalcompanies that manage pharmacy benefits on behalf of health plans and other payers.Virtually every commercial health insurance plan in the U.S. uses a PBM to manageprescription drug purchases. Medicare, the government insurance program providingmedical coverage for the elderly and disabled, relies on PBM services to managedrugs purchased under Medicare Part D drug plans and Medicare Advantage plans.Many states also use PBMs in managing their Medicaid prescription drug programcovering vulnerable individuals including children, pregnant women and the poor(Kaiser Family Foundation, 2020; Yost, 2018; Royce et al., 2019).
In this paper, we offer a microeconomic analysis of the role of PBMs in the U.S.market for prescription drugs. Our focus is on PBMs’ management of on-patentdrugs, which are also known in the industry as branded drugs. While non-patented“generic” drugs make up the bulk of prescriptions sold in the U.S., branded drugsaccount for nearly three quarters of total drug spending (IQVIA Institute for HumanData Science, 2018).
PBMs are market intermediaries who operate formularies on behalf of theirclients, health plans and other payers. In their role as formulary operators, PBMsallocate branded drugs to different formulary tiers. A branded drug assigned to afavorable tier will enjoy lower copays and hence higher demand.2
1The U.S. healthcare market also faces well known principal-agent challenges: physicians act asagents for patients in their demand for medical care and health insurance plans act a payers formedical services provided by physicians and other medical providers to patients (McGuire, 2000;Pauly, 2000).
2Generally, PBMs allocate generic drugs to the most favorable tier. PBMs do more than struc-ture competition between the makers of branded drugs. They also develop generic substitution poli-cies, prior authorization programs, and disease management services. PBMs also strike agreementswith pharmacies over the amount and timing of professional fees for dispensing drugs (Feldman,
2
Branded drug makers compete for favorable formulary placement for their drugby offering PBMs rebates off the drug’s list price. Rebates are quite controversial andraise pointed questions. Are drug rebates a kind of side-payment that underminesPBM incentives to negotiate drug prices aggressively on behalf of their clients? If so,then why do payers rely on such potentially compromised representatives? If not,why do branded drug makers pay the rebates at all? Would consumers be betterserved if rebates were prohibited altogether or, alternatively, directly handed over toinsurers or to consumers themselves?
Another set of controversies results from the enormous size of PBMs and thehigh degree of concentration in the industry. In 2018, three PBMs (Express Scripts,CVS Health/Caremark, and OptumRX) accounted for 80 percent of prescriptiondrug volume and six PBMs account for 95 percent of the prescription drug market(Fein, 2019; Feldman, 2020). The CVS-Health/Caremark PBM alone reports nearly90 million members in its PBM business—and so negotiates on behalf of a customerpopulation larger than the population of Germany (CVS Health, 2017). Do suchlarge PBMs in a highly concentrated industry obtain lower drug prices on behalf ofpayers and consumers, or do they leverage their monopsony position to gain at theexpense of consumers, health plans and branded drug makers?
We offer a microeconomic model of the role PBMs play in the prescription drugmarket that sheds light on these questions and controversies. Our model builds onthree observations about the operation of PBMs. The first concerns the incentivesimplicit in formularies. Formularies assign branded drugs to tiers. If a branded drugis assigned to a generous tier, enrollees in the formulary pay little or nothing for thedrug. Enrollees using drugs assigned to a less generous tier pay more. Thus brandeddrug makers who win a spot in a favored tier gain a boost in sales. Drug makerscompete for a preferred spot on the formulary by offering per unit rebates off ofthe list price of the drug. From this perspective, tiered formularies have the sameincentive structure as all-pay contests: the per unit rebates constitute the “bid” andthe prize for winning the contest is a favored position in the formulary.
Our second observation is that PBMs are market intermediaries who have to offervalue to both upstream branded drug manufacturers and downstream health plansor consumers. Branded drug makers will participate in formularies if doing so is atleast as profitable as the alternative of selling at list price. Payers and consumerswill, similarly, seek out formulary services to the extent that the formulary offers netprices below list. Any account of PBMs as market intermediaries must also explainwhy payers delegate formulary operation to large PBMs who act as a common agentfor many payers.
2020). We do not include these auxiliary functions in our model of PBMs.
3

Our third observation concerns the high list prices of branded drugs sold onformularies administered by PBMs.3 In a drug market without rebates, list pricesare transaction prices. With rebates, however, few transactions may take place atlist price. In an extension to our baseline model, we find that high list prices matterfor overall market efficiency and consumer welfare even if very few transactions takeplace at list price.4
Our theoretical framework is stylized and abstract, but it nevertheless helps usunderstand formulary incentives, the PBM’s role as intermediary and the impor-tance of high list prices. As a result of their incentive structure, formularies arefar more efficient than the alternative of selling branded drugs at their monopolyprices. Indeed under the simplifying assumptions in our baseline model, formulariesare nearly first-best efficient. The surplus generated by these near-efficient contestscould, in principle, improve consumer welfare or make more resources available todrug makers for innovation but instead they accrue as rents to PBMs. On this basis,the challenges PBMs pose for economic policy have more to do with distributionthan static efficiency.
Our framework also offers insights into why a health plan would delegate theformulary function to very large PBMs who act as a common agent across manycommercial and government payers. In an extension to our baseline model, we findefficiency gains when all the payers delegate the operation of the formulary to asingle, very large, PBM. These efficiency gains are not the result of economies ofscale or scope. Neither do they rely on any relationship between bargaining powerand the size of the intermediary. Rather efficiency increases because a very largePBM can better internalize externalities resulting from the widespread use of mostfavored nation provisions that promise purchasers the lowest net drug price offeredanywhere in the market.
Our analysis also clarifies the economic significance of list prices in the marketfor branded prescription drugs. The central insight is that rebates are availableonly for drugs sold on the formulary. Otherwise, branded drugs sell at their listprice. Thus, when a branded drug maker sets a high list price for their drug theyare, all else equal, increasing the value to consumers of purchasing the drug on the
3IQVIA Institute for Human Data Science (2020), for example, documents a growing disconnectbetween the list prices for branded drugs and their net price accounting for rebates.
4The term list price often refers to the Average Wholesale Price (AWP). A joke in the industryrefers to AWP as “Ain’t What’s Paid,” underscoring the divergence between list and transactionprices. As an empirical matter, previous studies suggest a significant number of insured Americanspay list price for at least some of their drugs because their health plan provides incomplete coverage.In addition, individuals who are uninsured for prescription drugs also pay list prices (Augustineet al., 2018).
4

formulary at a discount. If participating in the formulary becomes more valuable,the PBM can extract more value from consumers than would be possible with lowerlist prices. In an extension to our baseline model we find that in equilibrium, somebranded drug makers will set list prices very far above monopoly prices, and PBMswill bias their formulary contest to favor such high list price branded drugs. Biasedformularies make the pharmaceutical market less efficient and consumers less welloff, while increasing the surplus accruing to PBMs and branded drug makers.
Finally our analysis of PBMs as a common agent for many payers sheds some lighton the benefits of vertical integration. In the past several years, large PBMs havevertically consolidated with health insurers, including UnitedHealth Plans (healthplan) with OptumRx (PBM), Aetna (health plan) with CVS Caremark (PBM), andBlue Cross Blue Shield plans (health plan) with PrimeTherapeutics (PBM). Verti-cal integration can enhance efficiency or it can be anti-competitive. Understandingwhich outcome prevails requires an institutionally informed applied theoretical model(Gaynor, 2006). In the case of mergers between an agent (the PBM) and its princi-pal (the payer), the central theoretical issue is what problems a merger solves thataren’t solved by a contract between the parties. In a setting where a PBM capturesthe joint surplus produced by itself and a payer, there is little economic reason tovertically integrate because there is an easy alignment of interests between principaland agent as separate entities. In a richer setting, a payer may want to induce thePBM to take actions that may benefit the payer but not the PBM. A payer may,for example, wish to promote the use of low price generic drugs that offer no rebatesto PBMs. In a conventional principal-agent relationship, both parties would realizebenefits from enhanced generic use and there would also be little reason to verticallyintegrate. Common agency, in contrast, can severely limit the use and effectivenessof such contracts. In this setting, vertical integration between a PBM and payersmay benefit both parties without making the market less competitive.
We are not the first to observe that auction-like competition can help make mar-kets for patented innovations more efficient. Kremer (1998), for example, proposesthat governments offer to purchase patents at their estimated private value as deter-mined by an auction. Selling these products to consumers at a price equal to marginalcost would eliminate monopoly price distortions while still providing innovation in-centives. Formularies in our model similarly reduce monopoly price distortions tothe extent that they offer copays for drugs that approximate marginal cost. Con-trary to Kremer’s analysis, however, the bidding for favorable formulary slots aimsto generate large rebates rather than to elicit the branded drug maker’s private in-formation about the value of their product. Formularies more closely resemble theall-pay contests analyzed in Siegel (2009) in which players make irreversible bids
5

before the outcome of the competition is known.Our primary theoretical contribution to the literature on contests is that we
derive the equilibrium structure of prizes and rules for selecting winners when thecontest is operated by a market intermediary. Creating value for both upstream anddownstream players shapes equilibrium contest design for market intermediaries inways that haven’t been previously studied. So too does the contracting externalitythat causes payers to delegate formulary operations to a single large PBM who actsas a common agent for many payers.5 We are not aware of any other formal modelsof contest design by market intermediaries.
The paper proceeds in four sections. In the next section we describe the PBMbusiness model. Section 3 sets up our analytical framework. In Section 4, we presentthe baseline model in which a single third party payer designs the formulary and drugmakers choose rebates for their branded drugs. In Section 5, we show the approximateefficiency of formularies by extending the model to include many branded drugs.In Section 6, we extend the model to allow for multiple payers and contractingexternalities. Section 7 modifies the baseline model by allowing branded drug makersto endogenously determine both rebates and list prices. Section 8 discusses howvertical integration results from common agency. We conclude by discussing somebroad policy implications of our results as well as directions for further research.
2 Institutional Setting: The PBM Business Model
PBMs are intermediaries between drug makers and payers, and operate formulariesfor their clients, health plans and other payers. Figure 1 offers a visual depictionof the PBM’ s business model. For clarity this depiction is highly stylized and itomits a number of features of real-world markets. For example, we ignore the roleplayed by large wholesale drug distributors such as McKesson. Similarly we omitthe interactions between PBMs and pharmacies.
Branded drug manufacturers sell drugs to PBMs at a posted unit list price, butthen provide a rebate for each purchase.6 The list price minus the per unit rebate—what we call the net price—is the effective wholesale price that the PBM pays foreach drug sale. When enrollees purchase a branded drug from the PBM, they pay a
5For a general analysis of contracting externalities see Segal (1999). For prior analyses of commonagency in other aspects of healthcare see Frandsen et al. (2019); Glazer and McGuire (2002); Einavet al. (2020). The foundational analysis of the general theory of common agency is Bernheim andWhinston (1986).
6Market participants will sometimes refer to the list price as the Average Wholesale Price (AWP)or alternatively the Wholesale Acquisition Cost (WAC).
6
copay and also perhaps some coinsurance rate which is not presented in the Figure.The PBM bills the insurer the reimbursement price for the drug minus the amountthat the enrollee already paid. In addition to copays, enrollees also pay insurancepremiums and the coverage they receive entitles them to participate in the formularyand enjoy the drug subsidies that accompany insurance.
The contracts between health plans and PBMs are closely held trade secrets.We learned about these contracts from a sample of these contracts that we couldexamine directly, from the release of three government reports on PBM businesspractices (Grassley and Wyden, 2021; Government Accountability Office, 2019; Yost,2018), and from some other reports (Feldman, 2019; Ciaccia, 2020). In the contractsand other reports we examined, drugs are assigned to different formulary tiers andthe PBM commits to delivering these drugs to the payer at a discount off of thedrug’s unit list prices. A contract might, for example, commit the PBM to provideall branded drugs in the formulary to the payer at an average reimbursement pricethat is 11 percent below AWP. Suppose that the PBM’s net price for branded drugsaveraged 30 percet below list; then the PBM earns a profit equal to 19 percent of thelist price on each unit of a branded drug sold.7 Generics were supplied at prices evenfurther below their unit list price on average—in the neighborhood of 50 percentbelow list.8
In the industry, the difference between the reimbursement price of the drug andthe net price accounting for rebates at which the PBM acquires the drug is calledthe spread. The spread on branded drugs is generally presumed to be an importantsource of PBM profits. Industry reports estimate that the total value of manufac-turer’s gross-to-net reductions for brand name drugs was $175 billion in 2019—ofwhich about two-thirds comes from rebates (Fein, 2020).9
Finally, the U.S. prescription drug industry features most favored nation rules(MFNs). MFNs are provisions that guarantee purchasers the lowest net price of-fered to any purchasers of the drug. There are two types of MFNs that are relevantto our work, those that originate from administrative pricing rules and those that
7The contracts also specified a different average reimbursement price for generic drugs.8Many contracts also contain commitments to dispense the majority of drugs as generics rather
than brands. These contract features are called “generic effective rates” and are calculated inaggregate across all dispensed drugs. The contracts we examined also included per member feesand transaction charges to payers for the handling of drugs. These charges differ depending onwhether the drug order was filled by mail order, in house, or other pharmacies. Fees can be paidper unit of drug sold or in aggregate. Industry reports suggest these fees may be a growing sourceof revenues for PBMs. (Feldman, 2020; Fein, 2017). We do not include these fees in our analysis.
9PBMs can also make money on a variety of fees which are not set to reflect any specific drug’slist price or sales volume.
7

originate in contracts between private actors. Administrative pricing rules entitlesafety net providers to the lowest prices on prescription drugs. The most importantof these sets of rules is the Medicaid Prescription Drug Rebate Program (MDRP)(Scott Morton, 1996; Congressional Budget Office, 2005). In 1990 the Federal Gov-ernment included a Most Favored Customer (MFC) clause in the contract (OBRA90) which would govern the prices paid to firms for pharmaceutical products sup-plied to Medicaid recipients. Under the program, a drug maker who wants its drugcovered under Medicaid must enter into a rebate agreement with the Secretary ofHealth and Human Services stating that it will rebate a specified portion of theMedicaid payment for the drug to the states, who in turn share the rebates with thefederal government. Drug makers must also enter into agreements with other federalprograms that serve vulnerable populations. In exchange, Medicaid programs covernearly all of the drug maker’s FDA-approved drugs, and the drugs are eligible forfederal matching funds.10 State Medicaid programs provide coverage for prescrip-tion drugs for those who qualify. As of August 2020, the Medicaid program enrolledover 75 million individuals—roughly one in five Americans (Centers for Medicareand Medicaid Services, 2020).11 The Medicaid rebate amount is set in statute andensures that the program gets the lowest price (with some exceptions).12
Medicaid’s MDRP influences prices paid by other payers for a branded drug. A
10Though the pharmacy benefit is a state option, all states cover it, but, within federal guidelinesabout pricing and rebates, administer pharmacy benefits in somewhat different ways.
11Medicaid enrollees are diverse in their reasons for eligibility and medical needs: Medicaid coversmany infants, children, pregnant women, and some parents of Medicaid eligible children, but alsomany people with disabilities, and elderly people with very low incomes. The ACA expandedMedicaid coverage of low-income, non-disabled, childless adults. The Affordable Care Act (ACA)made significant changes to the MDRP. The law increased the rebate amount for both branddrugs and generic drugs. It also extended rebates to outpatient drugs purchased for beneficiariescovered by Medicaid managed care organizations (MCOs). Previously only drugs purchased throughMedicaid fee-for-service were eligible for rebates even though most states contract with MCOs toprovide services to Medicaid beneficiaries.
12The formula for rebates varies by type of drug: brand or generic. The rebate formula is the sameregardless of whether states pay for drugs on a fee-for-service basis or through payments to managedcare plans. The specific rebate on a given drug is considered proprietary. For brand name drugs,the rebate is 23.1 percent of average manufacturer price (AMP) or the difference between AMP and“best price,” whichever is greater. Certain pediatric and clotting drugs have a lower rebate amountof 17.1 percent. Best price is defined as the lowest available price to any wholesaler, retailer, orprovider, excluding certain government programs, such as the health program for veterans. AMP isdefined as the average price paid to drug makers by wholesalers and retail pharmacies. For genericdrugs, the rebate amount is 13 percent of AMP, and there is no best price provision. Drug makersmust report AMP for all covered outpatient drugs to HHS and report their best price for brandname drugs. HHS uses this price data to calculate the unit rebate amount (URA) based on therebate formula and inflationary component and provides the URA to states. States multiply the
8

recent Congressional investigation of drug pricing stated “Internal memoranda andcorrespondence collected for this investigation suggest that manufacturers seek toavoid triggering Medicaid ‘best price’ when developing their bids for commercialplans (Grassley and Wyden, 2021, p.68).”13
The MDRP is the basis of at least one other most favored nation rule governingprescription drugs, 340B drug discounts (Conti et al., 2019). As a condition of par-ticipation in the Medicaid Drug Rebate program, drug makers must also participatein the Federal 340B program. The 340B program offers discounted drugs to cer-tain safety net providers that serve vulnerable or underserved populations, includingMedicaid beneficiaries. 340B ceiling prices are calculated to match Medicaid pricesnet of the rebate (Dolan, 2019). Arguably, the 340B drug discount is more impor-tant than the Medicaid MFN, because many more drug purchases are entitled to340B discounts than Medicaid rebates. The U.S. Government Accountability Officeestimated that more than 50 percent of total sales of some drugs were 340B eligible(2015).
In addition to administratively based rules, many contracts between drug makersand PBMs are reported to have MFN clauses. While the contracts between drugmakers and PBMs are closely guarded trade secrets, details are sometimes madeavailable in litigation—often in contractual disputes between PBMs and drug mak-ers when “best price” is at issue. We learned from discussions with lawyers andeconomists who have been intimately involved in such litigation that MFN clausesare common. Specifically, the contracts between PBMs and drug makers will statethat the PBM is entitled to rebate amounts that reflect the contracts drug makersmake with their peers.14 These arrangements are also described in Feldman andFrondorf (2017) and Feldman (2019).
3 Model Setup
Our model describes a stylized setting in which multiple makers of branded drugssell their products on formularies run by intermediaries. The intermediaries in oursetup are either health insurers (payers) or a PBM hired by the payers. In eithercase, customers must enroll in an insurance plan and pay the plan’s premium to
units of each drug purchased by the URA and invoice the drug maker for that amount. Drug makersthen pay states the statutory rebate amount as well as any negotiated supplemental rebates.
13Earlier studies of the MDRP program have found that MDRP modestly increased the price ofsome drugs Scott Morton (1996)
14These clauses tend to be included in the first contract with the drug maker, but may not bementioned in the contract renewals or “amendments.”
9
gain access to drugs sold on the formulary. Drug makers compete for a favorableformulary position by offering higher rebates, i.e., by lowering the net price at whichthey sell drugs to the intermediary.
3.1 Drug Makers
Each drug maker produces a drug targeted at a distinct disease. The drugs areproduced at zero marginal cost, but each is patent protected so that the drug makeris a monopolist in its own product market.15 Drug maker i has a list price, p̄i atwhich it sells its drug to the uninsured who lack access to a formulary. We initiallytreat the list prices as exogenous, but allow them to be chosen endogenously in anextension to the basic model.
Drug makers compete for a favorable position in the formulary by selling drugsto the intermediary at a net price that is below their list price. Thus the net pricefor drug i is pi ≤ p̄i. The difference between the list price and the net price at whichthe drug is sold to the formulary is the per unit rebate. Because the drugs treatseparate and unrelated diseases, each drug’s demand is independent of the other’s—clinically they are neither substitutes nor complements.16 Drug makers choose pricesto maximize profit, which is equal to the net price times the quantity of drug sold.The quantity, of course, depends on the copay in the formulary tier to which theintermediary assigns the drug. In most of our analyses there are two drug makers;in an extension we also consider the general case with m ≥ 2 drug makers.
3.2 Payers, PBMs, and Formularies
Each payer is also assumed to be a monopolist in its market. Payers receive a pre-mium payment, p0, from enrollees, and subsidize drug transactions on the formulary.The magnitude of the per transaction subsidy is the difference between the pricethey are charged for the drug and the copay in the formulary tier to which the drugis assigned.
Should payers themselves act as the intermediary between drug makers and con-sumers, they are charged the net price for each drug. When a payer delegates oper-
15Here we follow Scherer (1993); Scott Morton (1999, 2000); Grabowski and Vernon (1992) intreating drug makers as monopolists in their own market.
16This assumption simplifies our model of the competition for formulary tiers. For example, iftwo drugs were imperfect substitutes and both landed in a favorable tier, one might expect drugmakers to encourage the PBM to promote one drug or another through additional discounts linkedto sales volume. Indeed these sort of discounts are reported by industry observers as in Feldman(2020). Our current setup abstracts from these concerns.
10

ation of the formulary to a PBM, the flow of funds is altered. The PBM pays thenet price for the drugs to the drug maker but charges the payer a (possibly higher)reimbursement price, ri, for drug i. When a consumer purchases a drug, he or shepays a copay to the PBM. The PBM then charges the payer the difference betweenthe reimbursement price and the copay. By setting a high reimbursement price, thePBM can transfer surplus from the payer to itself.
In some versions of our model, payers will operate the formulary and in othersthe PBM takes on this role. Indeed part of the purpose of the model is to explainwhy payers may delegate the formulary function to PBMs. The entity in chargeof the formulary specifies a copay amount for each tier: cL is the copay for the“low” or favorable tier, and cH is the copay for the “high” or unfavorable tier. Theformulary operator also decides the rules assigning drugs to tiers. The greater thedifference in copays across tiers, the greater the value to the drug makers of winninga favorable formulary position. As we will show, the formulary assigns drugs to tiersby comparing the net prices (or equivalently, rebates) offered by the drug companies.In this way, the formulary creates an “all-pay” contest where the bidding takes theform of drug makers offering rebates off of list prices. Abusing notation slightly, wedenote the copay assigned to drug d by cd, where cd takes on the value cL if drug dwas assigned to the generous tier, or cH otherwise.
When a payer is the intermediary, it chooses the premium p0, copays cL and cH ,and drug tier assignments that maximize its profit. Payer profit in this case is equalto the revenues they get from premiums minus the cost of drug subsidies. Drugsubsidy costs are the product of net price minus copay and the volume of drug sold.
3.3 Consumers
Consumers purchase health insurance when healthy and then become patients in needof treatment. Treatments take the form of purchasing one of the two branded drugs,depending on which illness becomes manifest. We model uncertainty over the type ofmedical condition as a discrete random variable D ∈ {1, . . . ,m} with Pr (D = i) =1/m for i ∈ {1, . . . ,m}. Consumer willingness to pay for the treatment dependson illness severity, which we denote by random variable V with complementary cdfdenoted by q (p) := Pr (V > p), independent of D. We refer to q (p) as the consumerdemand function and assume that it is strictly downward sloping and differentiableon the support of V . In some illustrative special cases we assume it is uniform onthe unit interval, which corresponds to a linear demand curve. Our baseline modeldoes not rely on this assumption.
Consumers who purchase insurance pay a premium p0 to gain access to the for-
11
mulary. If the drug that becomes relevant for their condition ends up in the generoustier, the consumer pays the low copay, cL. If the relevant drug is in the other tier,they pay a high copay, cH ≥ cL. Thus consumers using the formulary face a two-partpricing schedule for accessing drugs: an upfront fixed premium and a copay per unitof drug purchased. Contrary to conventional two-part pricing, however, the marginalcost of the drug to the formulary is endogenous to the copays the intermediary assignsto the formulary tiers.
Consumers, regardless of insured status, also have the option to purchase a drugat its list price out of pocket. In our baseline model, we assume that these list pricesare identical and exogenously determined to be p̄. In subsequent sections we relaxthis assumption in order to examine more fully the economics of list prices.
Consumers decide whether to purchase health insurance and whether to purchasea drug by maximizing expected utility. Utility is equal to V minus the sum of theamount paid for the drug (if he or she purchases the drug relevant to his or herclinical condition) and the premium (if he or she purchases insurance coverage), andzero otherwise.
We make two other noteworthy assumptions regarding consumers. The first isthat they are all identical before their health shocks are realized. This assumptionrules out any problems with adverse selection. The second assumption may seemmore unusual given the centrality of insurers to the model—consumers are all as-sumed to be risk neutral. Why do risk neutral consumers purchase health insuranceat all? Because insurance subsidizes consumer drug purchases.17
4 Baseline model: Payer operates the formulary
In the baseline model, a single payer operates a formulary with two tiers. We developthe model in two steps. First we solve for the equilibrium when two drugs competefor a single slot in the favorable formulary tier. We then allow for m ≥ 2 drugs.This extension allows us to analyze how many “slots” the payer will create for drugsin the favored tier. As we shall see, as the number of slots allowed in the generoustier increases, the closer the formulary approximates efficient two part pricing forpatented drugs.
In our baseline model, the list prices for drugs are exogenously set to p̄, themonopoly price of the drug. The timing is as follows:
17Assuming that consumers were either risk averse (Rothschild and Stiglitz, 1976; Zeckhauser,1970) and / or liquidity constrained (Ericson and Sydnor, 2018) would greatly complicate the modelwithout altering the basic message. Risk aversion and liquidity constraints would likely have theeffect of reducing the less generous copay on the formulary.
12

1. the payer chooses the formulary copays cL and cH ;
2. drug makers set net prices p1 and p2;
3. the payer assigns drugs to formulary tiers and sets the premium, p0;
4. consumers decide whether to purchase insurance;
5. nature chooses the consumer’s medical condition, D, and its intensity, V ;
6. consumers decide whether to purchase the drug relevant to their condition.
4.1 Equilibrium
We describe each player’s equilibrium strategy by working backwards. Consumersdecide whether to purchase a drug, taking list prices, copays, tier assignments, theirhealth insurance enrollment decision, their medical condition D, and its intensity Vas given. Consumers who enrolled in insurance purchase the drug corresponding totheir medical condition if either the copay or the list price is less than their willingnessto pay for the drug, V . Consumers who do not enroll in insurance purchase the drugif the list price is less than V . Consumers decide whether to enroll in insurancetaking list prices, copays, tier assignments, and the premium as given. Consumersenroll in insurance if their expected utility with insurance exceeds their expectedutility without insurance by the amount of the premium. Expected utility withoutinsurance is
U0 := E [(V − p̄) 1 (V > p̄)] .
Expected utility with insurance is
U1 =1
2
2∑i=1
E [(V −min {ci, p̄}) 1 (V > min {ci, p̄})] .
The following lemma formalizes the consumer’s equilibrium strategies.
Lemma 1 (Consumer insurance and drug purchase decisions). In the baselinemodel with the payer operating the formulary, in every subgame-perfect Nash equilib-rium, drug purchasing and insurance enrollment decisions are as follows. Consumerswho enrolled in the insurance plan and have medical condition D = d purchase drugd if and only if V ≥ min {cd, p̄}. They purchase it through the formulary if cd ≤ p̄and out-of-pocket otherwise. Consumers who did not enroll in insurance purchasedrug d if and only if D = d and V ≥ p̄. Consumers enroll in insurance if and only if
p0 ≤ U1 − U0. (1)
13

Next, consider the payer’s choice of premium and tier assignment. The payerchooses the premium taking list prices, net prices, and the tier assignment as given,and does so to maximize its expected profit, which is equal to the premium minusdrug subsidies,
πpayer (p0, c1, c2, p1, p2) = p0 −1
2((p1 − c1) q (c1) + (p2 − c2) q (c2)) ,
if consumers purchase insurance, and equal to zero otherwise. The payer will setthe premium so the consumer’s enrollment condition, (1), binds, if the profit fromdoing so is nonnegative; otherwise it will set a premium that is higher, resulting in aprofit of zero. The payer makes the tier assignment taking list prices and net pricesas given. The payer assigns drug 1 to the generous tier (that is, sets c1 = cL andc2 = cH) if the profit from doing so is greater than the profit from setting c2 = cLand c1 = cH . That is, drug 1 is assigned to the generous tier if and only if
πpayer (p0, cL, cH , p1, p2) ≥ πpayer (p0, cH , cL, p1, p2) .
This turns out to be satisfied if and only if p1 ≤ p2. The following lemma formalizesthese results.
Lemma 2 (Payer’s choice of premium and tier assignment). In the baselinemodel with the payer operating the formulary, in every subgame-perfect Nash equi-librium, strategies for premium and tier assignment are as follows. The payer setspremium p0 = U1 − U0 if
πpayer (U1 − U0, c1, c2, p1, p2) ≥ 0 (2)
and p0 > U1 − U0 otherwise. The payer assigns drug 1 to the generous tier (that is,sets c1 = cL and c2 = cH) if and only if p1 ≤ p2.
Next, each drug maker takes list prices and copays as given and sets its net priceto maximize expected profit, anticipating, of course, the resulting tier assignment.Drug maker 1’s expected profit as a function of p1, taking p2 as given is
π1 (p1; p2) =
{12p1q (cL) , p1 ≤ p2
12p1q (cH) , p1 > p2
,
provided the payer’s participation condition (2) is satisfied and p̄q (p̄) /2 otherwise.Drug maker 2’s profit is similar. Because q (cL) > q (cH) whenever cL < cH (as willbe the case in equilibrium), a drug maker’s profit discretely increases as it undercuts
14
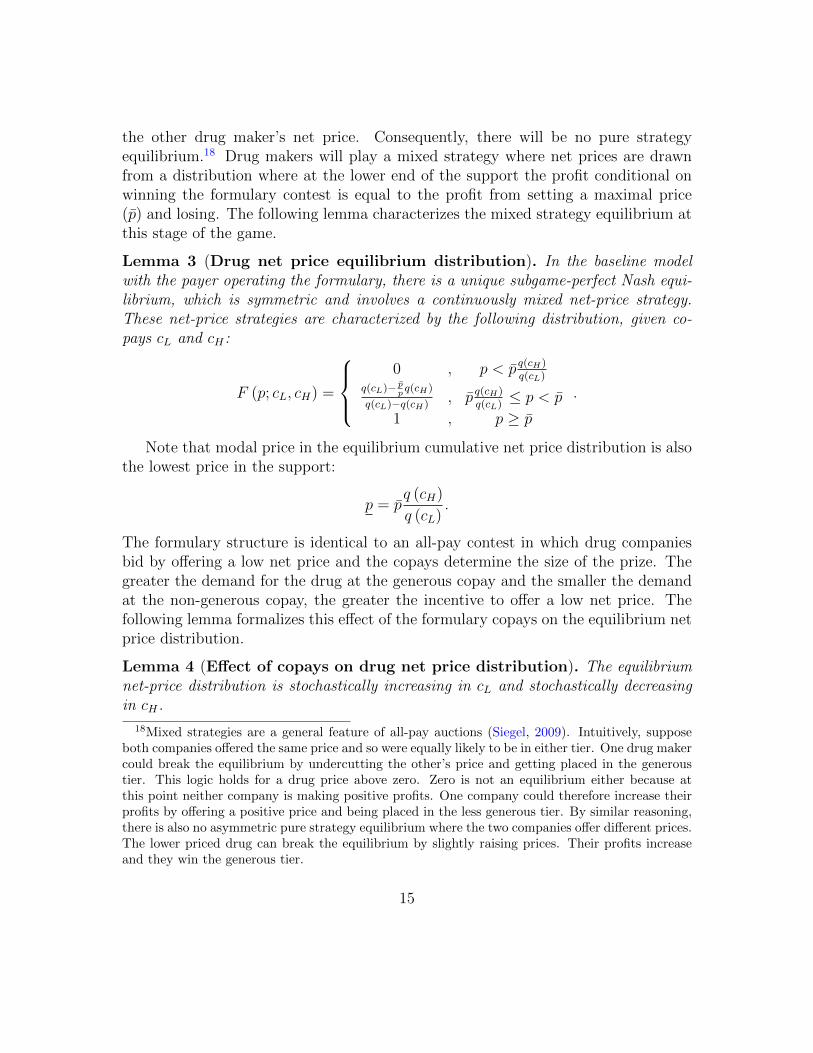
the other drug maker’s net price. Consequently, there will be no pure strategyequilibrium.18 Drug makers will play a mixed strategy where net prices are drawnfrom a distribution where at the lower end of the support the profit conditional onwinning the formulary contest is equal to the profit from setting a maximal price(p̄) and losing. The following lemma characterizes the mixed strategy equilibrium atthis stage of the game.
Lemma 3 (Drug net price equilibrium distribution). In the baseline modelwith the payer operating the formulary, there is a unique subgame-perfect Nash equi-librium, which is symmetric and involves a continuously mixed net-price strategy.These net-price strategies are characterized by the following distribution, given co-pays cL and cH :
F (p; cL, cH) =
0 , p < p̄ q(cH)
q(cL)q(cL)− p̄
pq(cH)
q(cL)−q(cH), p̄ q(cH)
q(cL)≤ p < p̄
1 , p ≥ p̄
.
Note that modal price in the equilibrium cumulative net price distribution is alsothe lowest price in the support:
p = p̄q (cH)
q (cL).
The formulary structure is identical to an all-pay contest in which drug companiesbid by offering a low net price and the copays determine the size of the prize. Thegreater the demand for the drug at the generous copay and the smaller the demandat the non-generous copay, the greater the incentive to offer a low net price. Thefollowing lemma formalizes this effect of the formulary copays on the equilibrium netprice distribution.
Lemma 4 (Effect of copays on drug net price distribution). The equilibriumnet-price distribution is stochastically increasing in cL and stochastically decreasingin cH .
18Mixed strategies are a general feature of all-pay auctions (Siegel, 2009). Intuitively, supposeboth companies offered the same price and so were equally likely to be in either tier. One drug makercould break the equilibrium by undercutting the other’s price and getting placed in the generoustier. This logic holds for a drug price above zero. Zero is not an equilibrium either because atthis point neither company is making positive profits. One company could therefore increase theirprofits by offering a positive price and being placed in the less generous tier. By similar reasoning,there is also no asymmetric pure strategy equilibrium where the two companies offer different prices.The lower priced drug can break the equilibrium by slightly raising prices. Their profits increaseand they win the generous tier.
15
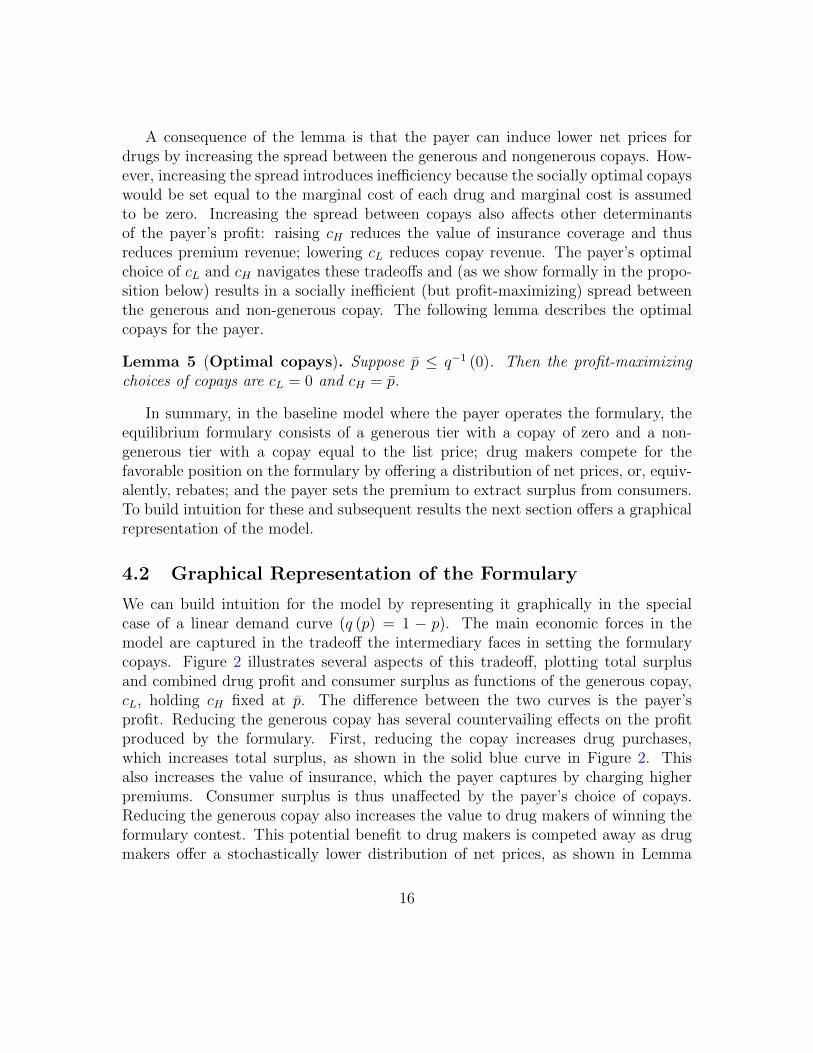
A consequence of the lemma is that the payer can induce lower net prices fordrugs by increasing the spread between the generous and nongenerous copays. How-ever, increasing the spread introduces inefficiency because the socially optimal copayswould be set equal to the marginal cost of each drug and marginal cost is assumedto be zero. Increasing the spread between copays also affects other determinantsof the payer’s profit: raising cH reduces the value of insurance coverage and thusreduces premium revenue; lowering cL reduces copay revenue. The payer’s optimalchoice of cL and cH navigates these tradeoffs and (as we show formally in the propo-sition below) results in a socially inefficient (but profit-maximizing) spread betweenthe generous and non-generous copay. The following lemma describes the optimalcopays for the payer.
Lemma 5 (Optimal copays). Suppose p̄ ≤ q−1 (0). Then the profit-maximizingchoices of copays are cL = 0 and cH = p̄.
In summary, in the baseline model where the payer operates the formulary, theequilibrium formulary consists of a generous tier with a copay of zero and a non-generous tier with a copay equal to the list price; drug makers compete for thefavorable position on the formulary by offering a distribution of net prices, or, equiv-alently, rebates; and the payer sets the premium to extract surplus from consumers.To build intuition for these and subsequent results the next section offers a graphicalrepresentation of the model.
4.2 Graphical Representation of the Formulary
We can build intuition for the model by representing it graphically in the specialcase of a linear demand curve (q (p) = 1 − p). The main economic forces in themodel are captured in the tradeoff the intermediary faces in setting the formularycopays. Figure 2 illustrates several aspects of this tradeoff, plotting total surplusand combined drug profit and consumer surplus as functions of the generous copay,cL, holding cH fixed at p̄. The difference between the two curves is the payer’sprofit. Reducing the generous copay has several countervailing effects on the profitproduced by the formulary. First, reducing the copay increases drug purchases,which increases total surplus, as shown in the solid blue curve in Figure 2. Thisalso increases the value of insurance, which the payer captures by charging higherpremiums. Consumer surplus is thus unaffected by the payer’s choice of copays.Reducing the generous copay also increases the value to drug makers of winning theformulary contest. This potential benefit to drug makers is competed away as drugmakers offer a stochastically lower distribution of net prices, as shown in Lemma
16

4. In equilibrium therefore drug makers always receive a payoff equal to what theywould earn if they lose the tournament and are assigned to the unfavorable tier. Forthis reason, drug maker profit is also unaffected by payer’s choice of copays. Theconstant consumer surplus and drug maker profit is represented by the horizontaldashed red curve in the figure. The difference between the two curves is the payer’sprofit from operating the formulary. Because total surplus increases as the favorablecopay becomes more generous, while consumer surplus and drug maker profit remainflat, the payer’s profit is maximized at cL = 0.
5 Formularies with Many Drugs: Approximately
Efficient
Intermediaries in the drug market can attract consumers and drug makers becausethe formulary generates a larger economic surplus than the alternative of drug makersselling directly to consumers at monopoly prices. Indeed, if this were not so, it wouldbe hard to explain the presence of intermediaries in the drug market.
In principle, intermediaries could generate even more surplus by adopting anefficient two-part pricing strategy where consumers pay a premium for access to theformulary plus a copay equal to the marginal cost of each drug (which in our modelis zero). In the previous section, however, we showed this was not the case in ourbaseline model: instead, the payer sets one of the copays to the list price which is setat the monopoly price. The result is some deadweight loss. Some consumers withwillingness to pay higher than the marginal cost of producing the drug do not receivethe drug.
The inefficiency of our formulary is entirely due to the high copay for the drug as-signed to the non-generous tier. This raises the question of how many slots the payerwill optimally create for drugs in the non-generous tier. Extending our model to thecase where there are many drugs we find that in equilibrium only one drug is as-signed to the non-generous tier. The remaining drugs are sold using the efficient twopart pricing. This result suggests that formulary tournaments are “approximately”efficient. Indeed, when the clinical conditions treated by the drugs are equally dis-tributed in the population, the allocation approaches full efficiency as the number ofdrugs grows.
The timing of the model extension with m ≥ 2 drugs is as follows:
1. the payer chooses the copays associated with each of m formulary tiers, c1 ≤c2 ≤ · · · ≤ cm;
17
2. drug makers set net prices p1, . . . , pm;
3. the payer assigns drugs to formulary tiers and sets p0;
4. consumers decide whether to purchase insurance;
5. nature chooses the consumer’s medical condition, D ∈ {1, . . . ,m}, and itsintensity, V ;
6. consumers decide whether to purchase the drug.
We assume the medical condition D is distributed uniformly over the m medicalconditions, so that Pr (D = i) = 1/m, for i ∈ {1, . . . ,m}. The payer’s assignment ofdrugs to tiers is formally a choice of permutation, t, on {1, . . . ,m}, so that the copaycharged to a consumer for drug i is ct(i).
As before, we describe each player’s equilibrium strategy working backwards.Consumers’ drug purchasing decisions and insurance enrollment decisions are un-changed from the baseline case (see Lemma 1); that is, the consumer enrolls if thepremium is less than the utility surplus from insurance:
p0 ≤ U1 − U0,
where the only change is that now the expression for utility under insurance accom-modates several drugs:
U1 =1
m
m∑i=1
E[(V −min
{ct(i), p̄
})1(V > min
{ct(i), p̄
})].
The payer’s choice of premium is also unchanged:
p0 = U1 − U0,
as long as its profit is positive. Tier assignment is similar to the baseline case: drugsare placed in tiers in order of their net prices, as the following lemma states.
Lemma 6 (Tier assignment with m drugs). The equilibrium tier assignment tsorts drugs by net prices; that is, t is the permutation on {1, . . . ,m} such that forany i and i′ in {1, . . . ,m},
pi < pi′ =⇒ t (i) < t (i′) ,
and ties are broken randomly.
18

Like the two-drug case, the formulary structure induces an all pay contest amongthe drug makers in which net prices are chosen according to a symmetric mixedstrategy equilibrium, as the following result shows.
Lemma 7 (Equilibrium net-price distribution with m drugs). There existsa symmetric equilibrium. Any symmetric equilibrium involves continuously mixedstrategies with an interval support
[p, p̄]
for some p < p̄, where p̄ is the list price.
As in the two-drug case, lower copays in more favorable formulary tiers providethe incentive for drug companies to offer discounts off list price to the intermediary.Lower copays also increase the value of insurance, and thus premium revenue, butalso increase drug subsidy costs. The payer’s profit-maximizing choice of copays setsthe least-favorable copay to the list price, and the remaining to zero, as the followinglemma shows.
Lemma 8 (Equilibrium copays with m drugs). Equilibrium copays with m drugsare as follows:
c1 = c2 = · · · = cm−1 = 0;
cm = p̄.
The fact that all but one of the drugs are assigned a copay of zero means theequilibrium is approximately efficient: as the number of drugs m increases, the equi-librium converges to full efficiency. The following proposition formalizes this result.
Proposition 1 (Formulary equilibrium is approximately efficient). The sym-metric subgame-perfect Nash equilibrium with m drugs yields total surplus
TS = E [V ]− 1
mE [1 (V ≤ p̄)V ] .
Because the first-best surplus is E [V ], the result means that as m increases,equilibrium surplus converges to full efficiency. For any given number of drugs, m,however, the equilibrium is inefficient. The inefficiency stems entirely from the drugassigned to the least favorable tier where the copay is nonzero. Why doesn’t theintermediary assign all drugs to a tier with a copay of zero and thereby achieve afully efficient equilibrium? The reason is that the possibility of being relegated toan unfavorable tier, even if the probability is only 1/m, induces drug makers to offersubstantial rebates off of list price, increasing profit for the intermediary. If all tiershad a copay of zero, drug makers would offer no rebates.
19

6 Why Do Payers Delegate Formulary Operations
to a PBM Acting as a Common Agent for Many
Payers?
We have argued that formularies generate economic surplus relative to the alterna-tive of selling drugs at monopoly prices. Nothing in our analysis so far suggests thatthese formularies need to be operated by PBMs. In this section we pose the follow-ing question: why would payers delegate such a critical and potentially profitablefunction to a PBM acting as a common agent for many payers?
Our answer builds on a contracting externality found in pharmaceutical markets,most favored nation (MFN) clauses. As described in Section 2, MFN clauses requirethat the net prices offered to a specific purchaser be at least as low as those offeredto any other purchaser in the market. MFN clauses create the following externality.If one formulary manages to win lower average net drug prices, the average netdrug prices offered to other formularies with MFN clauses in their contracts mustalso decline. Since higher powered incentives are costly to the formulary operator,when the formulary does not capture all the benefits of a reduction in net prices,equilibrium formulary incentives are weakened. Weaker formulary incentives increaseaverage net drug prices and also reduce the efficiency of drug markets. Large PBMsacting as a common agent for many payers can better internalize this externality. Asa result, equilibrium incentives become more powerful, average net drug prices falland market efficiency increases. These efficiency gains favor delegation of formularyoperations to PBMs acting as a common agent for many payers.
Industry observers typically assert that MFN clauses are widespread, but theterms of these contracts are closely held secrets and so these assertions are rarelybased on direct knowledge. We have consulted, however, with economists and lawyerswho work directly with these contracts and they confirm that MFN clauses areubiquitous. In addition to these private contractual clauses, Medicaid and the 340Bprogram have statutorily mandated MFN clauses, as described in Section 2. Thesealso introduce contracting externalities because purchasers under these programs usethe same PBMs.
In what follows we analyze the effects of this contracting externality in detail.We first consider the case with several payers and no PBM, and then the case witha single PBM acting as a common agent. In both cases we revert to our baselineassumptions that there are only two drugs and that the list prices for these drugsare exogenously set to p̄.
20

6.1 Equilibrium with Several Payers: Contracting External-ities in the Absence of PBMs
We return to the baseline model with two drugs but extend it to two payers, indexedby j ∈ {1, 2}. Each payer is a monopolist in its own segment of the insurance marketand serves consumers with mass 1/2. The timing is as follows:
1. Each payer j ∈ {1, 2} sets formulary copays cjL and cjH ;
2. drug makers set net prices p1 and p2;
3. each payer assigns drugs to formulary tiers and sets pj0;
4. consumers decide whether to purchase insurance;
5. nature chooses the consumer’s medical condition, D ∈ {1, 2}, and its intensity,V ;
6. consumers decide whether to purchase the drug.
At each stage, these choices are made simultaneously and noncooperatively withthe other payer. To reflect the existence of MFN clauses or other frictions, drugmakers continue to set net prices p1 and p2, which apply to all payers. As before,we describe each player’s equilibrium strategy in the usual way, working backwards.Consumers’ drug purchasing decisions and insurance enrollment decisions are un-changed from the single payer case (see Lemma 1), except naturally consumers inpayer j’s market make their decision based on pj0, cj1 and cj2. That is, a consumer inpayer j’s market enrolls in insurance if and only if
pj0 ≤ U j1 − U0,
where
U j1 =
1
2
2∑i=1
E[(V −min
{cji , p̄
})1(V > min
{cji , p̄
})].
Each payer’s choice of premium and tier assignment also unchanged from theresult in Lemma 2: payer j’s premium is
pj0 = U j1 − U0,
as long as its profit is positive, and it assigns cj1 = cjL and cj2 = cjH if p1 ≤ p2.
21
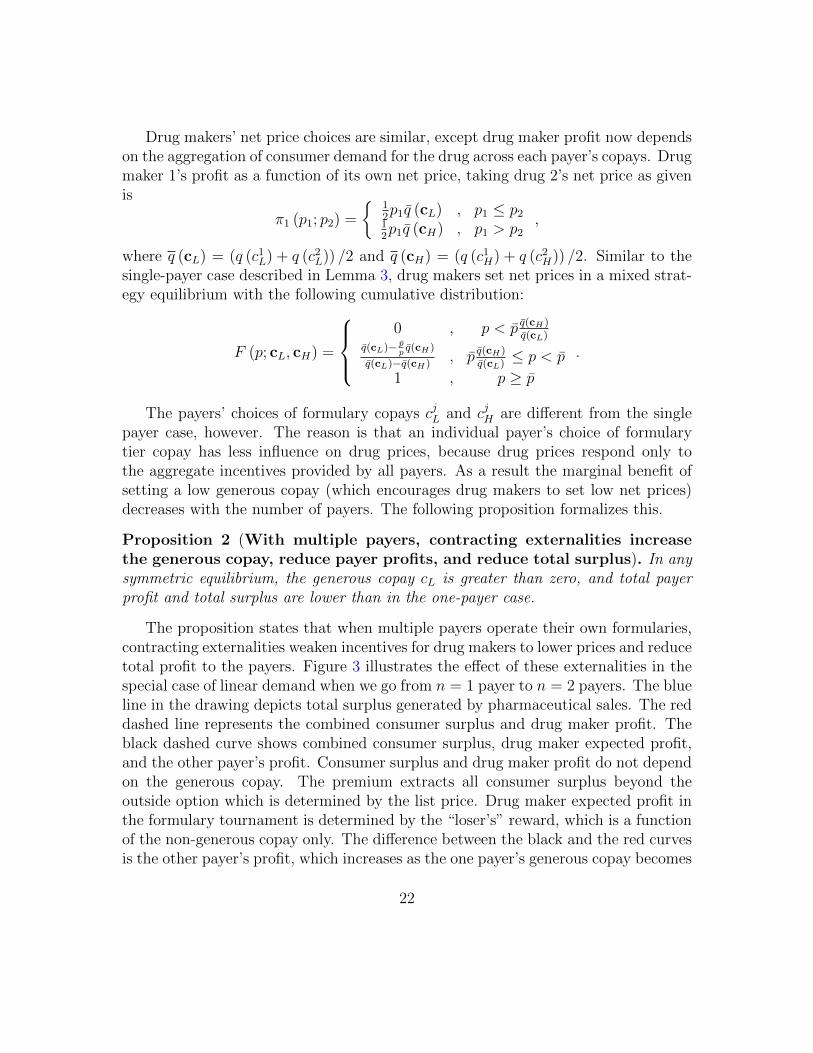
Drug makers’ net price choices are similar, except drug maker profit now dependson the aggregation of consumer demand for the drug across each payer’s copays. Drugmaker 1’s profit as a function of its own net price, taking drug 2’s net price as givenis
π1 (p1; p2) =
{12p1q̄ (cL) , p1 ≤ p2
12p1q̄ (cH) , p1 > p2
,
where q (cL) = (q (c1L) + q (c2
L)) /2 and q (cH) = (q (c1H) + q (c2
H)) /2. Similar to thesingle-payer case described in Lemma 3, drug makers set net prices in a mixed strat-egy equilibrium with the following cumulative distribution:
F (p; cL, cH) =
0 , p < p̄ q̄(cH)
q̄(cL)q̄(cL)− p̄
pq̄(cH)
q̄(cL)−q̄(cH), p̄ q̄(cH)
q̄(cL)≤ p < p̄
1 , p ≥ p̄
.
The payers’ choices of formulary copays cjL and cjH are different from the singlepayer case, however. The reason is that an individual payer’s choice of formularytier copay has less influence on drug prices, because drug prices respond only tothe aggregate incentives provided by all payers. As a result the marginal benefit ofsetting a low generous copay (which encourages drug makers to set low net prices)decreases with the number of payers. The following proposition formalizes this.
Proposition 2 (With multiple payers, contracting externalities increasethe generous copay, reduce payer profits, and reduce total surplus). In anysymmetric equilibrium, the generous copay cL is greater than zero, and total payerprofit and total surplus are lower than in the one-payer case.
The proposition states that when multiple payers operate their own formularies,contracting externalities weaken incentives for drug makers to lower prices and reducetotal profit to the payers. Figure 3 illustrates the effect of these externalities in thespecial case of linear demand when we go from n = 1 payer to n = 2 payers. The blueline in the drawing depicts total surplus generated by pharmaceutical sales. The reddashed line represents the combined consumer surplus and drug maker profit. Theblack dashed curve shows combined consumer surplus, drug maker expected profit,and the other payer’s profit. Consumer surplus and drug maker profit do not dependon the generous copay. The premium extracts all consumer surplus beyond theoutside option which is determined by the list price. Drug maker expected profit inthe formulary tournament is determined by the “loser’s” reward, which is a functionof the non-generous copay only. The difference between the black and the red curvesis the other payer’s profit, which increases as the one payer’s generous copay becomes
22
more generous. This reflects the contracting externality: as one payer’s generouscopay falls, other payers benefit from lower net drug prices. Because formulariesdo not capture the full benefit of lower drug prices, the payer’s profit is no longermaximized at cL = 0, but rather at a strictly higher value. Higher generous copaysalso reduce consumers’ consumption and consequently reduce efficiency.
6.2 PBM Acting as a Common Agent Internalizes the Ex-ternality
The previous section found that when several payers operate their own formularies,externalities lead to reduced profits, high drug net prices, and lower total surplus. Inthis section we consider how a PBM acting as a common agent for many payers caninternalize the externality and so raise joint profits among payers and the PBM, andimprove market efficiency. To make this argument we introduce a single PBM thatoperates a formulary on behalf of many payers. The PBM specifies copays, assignsdrugs to tiers, and sets reimbursement prices r1 and r2 which payers must remit tothe PBM for each drug transaction.
An important feature of this version of the model is that the price of drugs topayers (reimbursement prices) may differ from the net price a drug company chargesthe PBM. Indeed the spread between reimbursement prices and net prices is animportant source of profits for PBMs. A second key feature is that the PBM offers acontract to each payer in which the payer delegates operation of the formulary to thePBM in exchange for a transfer. The contract offer to each payer is contingent on allother payers accepting the contract. This set up allows for the possibility of trivialequilibria in which all or some payers refuse the contract. We focus our analysis onthe principal’s preferred equilibrium in which all payers accept the contract (Segal,1999). We continue to assume that there are only two drugs and that list prices areset exogenously at the monopoly price of the patented drugs. The timing of eventsis as follows:
1. the PBM simultaneously offers a contract to each payer in which the payerdelegates formulary operation to the PBM and the PBM in exchange makes atransfer of π0 to each payer; each payer chooses whether to accept the PBMcontract or to reject in favor of acting as its own intermediary;
2. the PBM chooses the formulary copays cL and cH ; these copays are commonfor all payers contracting with the PBM;
3. drug makers set net prices p1 and p2;
23

4. the PBM assigns drugs to formulary tiers and sets reimbursement prices r1 andr2;
5. the payer sets the premium p0;
6. consumers decide whether to purchase insurance;
7. nature chooses the consumer’s medical condition, D, and its intensity, V ;
8. consumers decide whether to purchase the drug.
As before, consumers purchase insurance if the premium is less than the utilitygain from doing so:
p0 ≤ U1 − U0,
where utilities are the following:
U0 = E [(V − p̄) 1 (V > p̄)]
U1 =1
2
2∑i=1
E [(V −min {ci, p̄}) 1 (V > min {ci, p̄})] .
The payer chooses the premium to maximize its profit:
πpayer (p0, c1, c2, r1, r2) = p0 +1
2
2∑i=1
q (ci) (ci − ri) .
Because profit is increasing in the premium, the payer chooses the premium so thatthe consumer’s insurance decision condition binds, as in Lemma 2:
p0 = U1 − U0,
as long as its profit is nonnegative.The PBM sets reimbursement prices and makes tier assignments to maximize its
profit,
πPBM (c1, c2, r1, r2; p1, p2) =1
2
2∑i=1
q (ci) (ri − pi) , (3)
subject to the constraint that the payer’s profit is nonnegative, and taking net pricesas given. The PBM’s profit is increasing in the reimbursement prices, meaning thePBM will set r1 and r2 so that the payer’s profit condition binds. This determinesthe weighted average reimbursement price, but does not pin down the individual
24
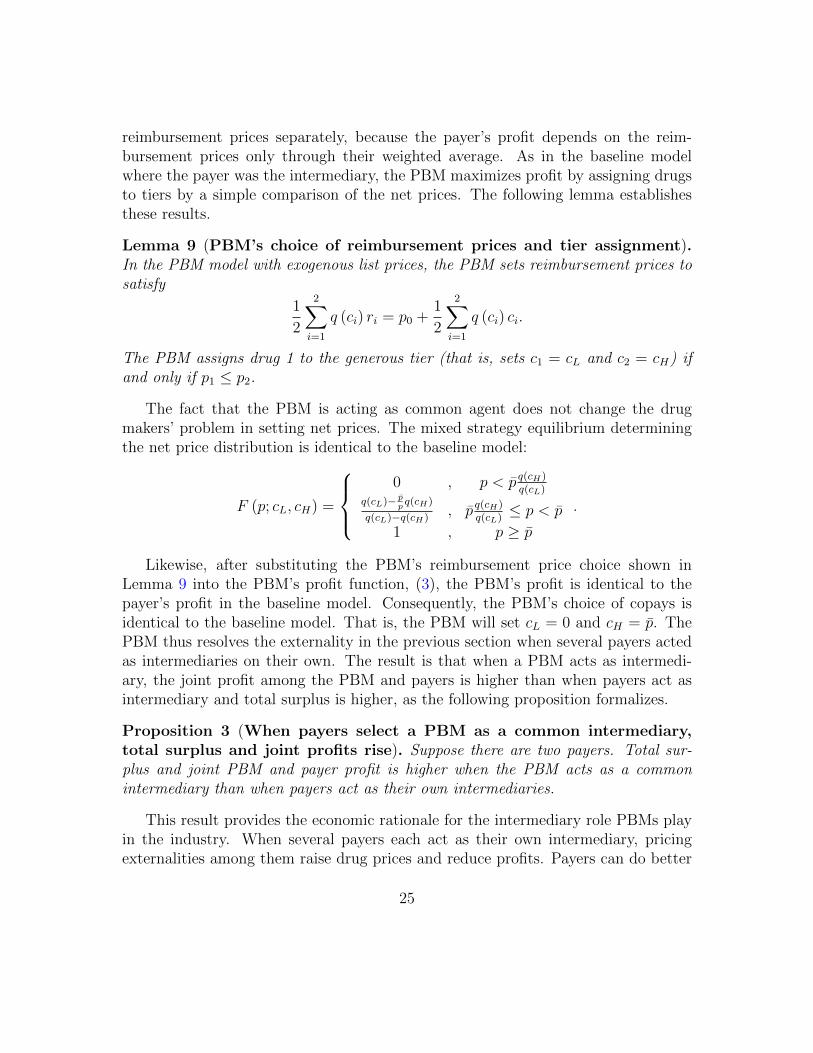
reimbursement prices separately, because the payer’s profit depends on the reim-bursement prices only through their weighted average. As in the baseline modelwhere the payer was the intermediary, the PBM maximizes profit by assigning drugsto tiers by a simple comparison of the net prices. The following lemma establishesthese results.
Lemma 9 (PBM’s choice of reimbursement prices and tier assignment).In the PBM model with exogenous list prices, the PBM sets reimbursement prices tosatisfy
1
2
2∑i=1
q (ci) ri = p0 +1
2
2∑i=1
q (ci) ci.
The PBM assigns drug 1 to the generous tier (that is, sets c1 = cL and c2 = cH) ifand only if p1 ≤ p2.
The fact that the PBM is acting as common agent does not change the drugmakers’ problem in setting net prices. The mixed strategy equilibrium determiningthe net price distribution is identical to the baseline model:
F (p; cL, cH) =
0 , p < p̄ q(cH)
q(cL)q(cL)− p̄
pq(cH)
q(cL)−q(cH), p̄ q(cH)
q(cL)≤ p < p̄
1 , p ≥ p̄
.
Likewise, after substituting the PBM’s reimbursement price choice shown inLemma 9 into the PBM’s profit function, (3), the PBM’s profit is identical to thepayer’s profit in the baseline model. Consequently, the PBM’s choice of copays isidentical to the baseline model. That is, the PBM will set cL = 0 and cH = p̄. ThePBM thus resolves the externality in the previous section when several payers actedas intermediaries on their own. The result is that when a PBM acts as intermedi-ary, the joint profit among the PBM and payers is higher than when payers act asintermediary and total surplus is higher, as the following proposition formalizes.
Proposition 3 (When payers select a PBM as a common intermediary,total surplus and joint profits rise). Suppose there are two payers. Total sur-plus and joint PBM and payer profit is higher when the PBM acts as a commonintermediary than when payers act as their own intermediaries.
This result provides the economic rationale for the intermediary role PBMs playin the industry. When several payers each act as their own intermediary, pricingexternalities among them raise drug prices and reduce profits. Payers can do better
25

by delegating formulary design to a common agent, the PBM. The presence of aPBM not only raises joint profit among the payers and the PBM, but also improvesefficiency because the PBM will choose a lower generous copay than payers would ontheir own. Thus, in the first step of the model, all payers accept the PBM’s contractso long as the transfer, π0, is greater than the equilibrium profit when each payeroperates its own formulary.
7 Endogenous List Prices
In this section we analyze the economics of list prices by allowing the two drugmakers to set list prices endogenously. We will find that list prices matter becausethey determine consumers’ outside options. High list prices reduce the value ofpurchasing drugs outside the formulary and so make participating in the formularymore valuable for consumers. PBMs can capture this increase in value and so willbias formulary incentives in favor of drugs offering high list prices. The result isan equilibrium in which the list prices of some drugs become detached from theirunderlying clinical value and the average list price exceeds the monopoly price. Thesehigh list prices increase the joint surplus of drug makers and PBMs, but reduceconsumer surplus and make drug markets less efficient.
To accommodate endogenous list prices, we extend our baseline model by allowingdrug makers to choose their respective list prices, p̄1 and p̄2, before the formularydesign is chosen. For ease of exposition, we assign the label “drug 1” to the drugwith the (weakly) lower list price, so that without loss of generality p̄1 ≤ p̄2. Unequallist prices allow for the possibility that cH may be lower than one list price, but notthe other. In this case, if the drug with the lower list price is placed in the non-generous tier, we assume that the effective copay reverts to that drug’s list price.19
For example, if p̄1 < cH ≤ p̄2, and drug 1 “loses” the formulary tournament so thatit is assigned to the unfavorable tier, we assume the copay charged consumers wouldbe p̄1, while if drug 2 were to lose, the copay would be cH . To simplify our analysis,we return to our baseline assumption that a single payer operates a single formulary.
The timing is as follows:
1. drug makers simultaneously choose list prices p̄1 and p̄2;
19This assumption is without loss of generality: it is optimal for payers to set copays no higherthan the list price because consumers have the option to purchase at the list price out of pocket.The substantive assumption here is that consumers cannot commit to giving up their option topurchase at the list price.
26

2. the payer chooses the formulary copays cL and cH , where 0 ≤ cL ≤ cH ≤ p̄2;
3. drug makers set net prices p1 and p2;
4. the payer assigns drugs to formulary tiers and sets the premium p0;
5. consumers decide whether to purchase insurance;
6. nature chooses the consumer’s medical condition, D, and its intensity, V ;
7. consumers decide whether to purchase the drug.
As before, consumers purchase insurance if the premium is less than the utilitygain from doing so, that is, if p0 ≤ U1−U0, where utilities now are functions of bothlist prices:
U0 =1
2
2∑i=1
E [(V − p̄i) 1 (V > p̄i)] ,
U1 =1
2
2∑i=1
E [(V −min {ci, p̄i}) 1 (V > min {ci, p̄i})] .
The payer’s choice of premium is unchanged from the result in Lemma 2: p0 =U1−U0, as long as its profit is positive. Tier assignment, however, differs importantly:the possibility of different list prices means the rule for tier assignment is not a simplecomparison of net prices. Instead, the formulary tournament may be tilted in favorof one drug or the other, as the following result shows:
Lemma 10 (Choice of tier assignment with endogenous list prices). Theformulary assigns drug 1 to the generous tier (that is, sets c1 = cL and c2 = cH) ifand only if p2 ≥ φ (p1), where φ (p) = p if cH ≤ min {p̄1, p̄2} (Case 1), and
φ (p) =q (cL)− q (p̄1)
q (cL)− q (cH)p+
E [V |V > p̄1] q (p̄1)− E [V |V > cH ] q (cH)
q (cL)− q (cH)
if p̄1 < cH ≤ p̄2 (Case 2).
The lemma shows that when list prices differ, the intermediary may bias theformulary contest. When both list prices exceed the non-generous copay (Case 1),the tier assignment is as before: the drug with the lower net price is placed in thegenerous tier. But when one of the list prices is lower than the non-generous copay,the formulary compares the higher list-price drug’s net price, p2, to a transformation
27
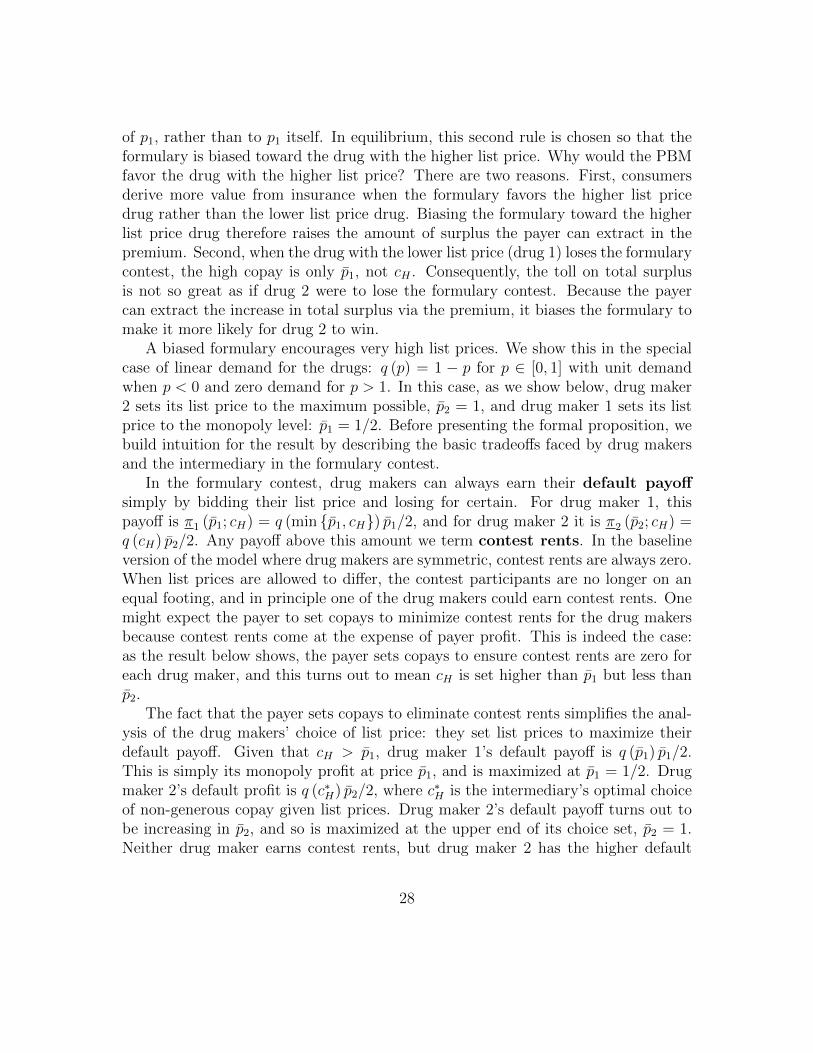
of p1, rather than to p1 itself. In equilibrium, this second rule is chosen so that theformulary is biased toward the drug with the higher list price. Why would the PBMfavor the drug with the higher list price? There are two reasons. First, consumersderive more value from insurance when the formulary favors the higher list pricedrug rather than the lower list price drug. Biasing the formulary toward the higherlist price drug therefore raises the amount of surplus the payer can extract in thepremium. Second, when the drug with the lower list price (drug 1) loses the formularycontest, the high copay is only p̄1, not cH . Consequently, the toll on total surplusis not so great as if drug 2 were to lose the formulary contest. Because the payercan extract the increase in total surplus via the premium, it biases the formulary tomake it more likely for drug 2 to win.
A biased formulary encourages very high list prices. We show this in the specialcase of linear demand for the drugs: q (p) = 1 − p for p ∈ [0, 1] with unit demandwhen p < 0 and zero demand for p > 1. In this case, as we show below, drug maker2 sets its list price to the maximum possible, p̄2 = 1, and drug maker 1 sets its listprice to the monopoly level: p̄1 = 1/2. Before presenting the formal proposition, webuild intuition for the result by describing the basic tradeoffs faced by drug makersand the intermediary in the formulary contest.
In the formulary contest, drug makers can always earn their default payoffsimply by bidding their list price and losing for certain. For drug maker 1, thispayoff is π1 (p̄1; cH) = q (min {p̄1, cH}) p̄1/2, and for drug maker 2 it is π2 (p̄2; cH) =q (cH) p̄2/2. Any payoff above this amount we term contest rents. In the baselineversion of the model where drug makers are symmetric, contest rents are always zero.When list prices are allowed to differ, the contest participants are no longer on anequal footing, and in principle one of the drug makers could earn contest rents. Onemight expect the payer to set copays to minimize contest rents for the drug makersbecause contest rents come at the expense of payer profit. This is indeed the case:as the result below shows, the payer sets copays to ensure contest rents are zero foreach drug maker, and this turns out to mean cH is set higher than p̄1 but less thanp̄2.
The fact that the payer sets copays to eliminate contest rents simplifies the anal-ysis of the drug makers’ choice of list price: they set list prices to maximize theirdefault payoff. Given that cH > p̄1, drug maker 1’s default payoff is q (p̄1) p̄1/2.This is simply its monopoly profit at price p̄1, and is maximized at p̄1 = 1/2. Drugmaker 2’s default profit is q (c∗H) p̄2/2, where c∗H is the intermediary’s optimal choiceof non-generous copay given list prices. Drug maker 2’s default payoff turns out tobe increasing in p̄2, and so is maximized at the upper end of its choice set, p̄2 = 1.Neither drug maker earns contest rents, but drug maker 2 has the higher default
28

payoff and so enjoys higher equilibrium profit.The following result formalizes this intuition:
Proposition 4 (High equilibrium list price when list prices are endoge-nous). Suppose drug demand is linear. Without loss of generality let p̄1 ≤ p̄2. Thenin the endogenous list price model the unique subgame-perfect Nash equilibrium listprices are p̄∗1 = 1/2 (the monopoly price) and p̄∗2 = 1 (the maximum possible price).Drug maker 2 earns higher profit than drug maker 1, and combined drug maker profitis higher and the formulary’s profit is higher than when list prices are exogenouslyfixed at the monopoly level.
It may not seem surprising that one of the list prices is set to the monopoly level,since the drug maker’s payoff is tied to revenues in the non-generous tier, which ismaximized at the monopoly list price. But the extremely high value for the other listprice is a surprising result: demand at that price is zero, so no transactions actuallyoccur at that price. Instead, the extremely high list price on the part of one drugmaker is a response to the biased formulary incentives that tilt the contest in favor ofthe drug with the higher list price. This triggers a “race to the top” in list prices inwhich one drug company sets a list price as high as possible, while the other choosesthe monopoly level.20
Figure 4 depicts the list price equilibrium graphically. The figure plots each drugmaker’s best response list price as a function of the other’s list price. The bluepoints show that when drug maker 1 sets a low enough list price, drug maker 2 willoptimally set its list price as high as possible. When drug maker 1’s list price is high,however, drug maker 2 optimally sets its list price to the monopoly level (one-half).The figure shows two equilibria where the best response functions intersect: onewhere drug maker 2 sets p̄2 = 1 and drug maker 1 sets p̄1 = 1/2 and another wherethey are reversed.
8 Common Agency and Vertical Integration
Our analysis so far takes a rosy view of the problem of aligning the interests ofPBMs and payers. Formularies, we argue, enable “near” efficient pharmaceuticalmarkets that benefit formulary operators. Contracting externalities reduce these
20This race to the top follows from the logic of our model, but industry observers note closelyrelated price dynamics. For example Feldman (2020, p. 327) comments that drug makers have anincentive to offer high list prices because this allows the PBM to offer their clients what appears tobe a more attractive discount
29

benefits when numerous payers operate their own formularies, but near efficiencycan be restored when payers delegate the operation of formularies to a single PBMacting as a common agent.
Because PBMs in our model capture the joint surplus produced by themselvesand payers, there is an easy alignment of interests between principal and agent. Thissimplifies the analysis but at the cost of downplaying the possibility that the PBMmay take actions that are not in the interest of payers. For example, suppose thatcontrary to our prior analysis, PBMs do not have full information about the demandfor drugs within each payer’s population. This information asymmetry prevents thePBM from capturing all the joint surplus and breaks the alignment between PBMsand payers. To illustrate the issues created by asymmetric information, consider aPBM decision that we did not include in our baseline model: Payers would preferif the PBM promoted generics so that they could offer their members lower-pricedformulary services. The surplus resulting from these lower cost services, however,need not flow to the PBM.21
One way to resolve this agency problem is through a contract. We have alreadyreported that contracts between PBMs and payers include penalties if the aggregateuse of generics falls below some pre-specified threshold. Aggregate caps are, however,a crude instrument for promoting the use of generics. In a conventional principalagent setting, a payer could motivate the PBM to do more by writing a shared savingsincentive contract with the PBM. Under common agency, however, such agreementsmay not be workable. To see this consider that when a PBM invests in the softwareand information systems that improve generic substitution, this will likely enablemore generic usage by all its payer clients. This externality leads to inefficientlyweak equilibrium incentives. Indeed, if investments in generic substitution involvesubstantial fixed costs, the equilibrium can be one in which no payers will write anyincentive contracts at all (Frandsen et al., 2019).
Vertical mergers between PBMs and payers may reduce or eliminate the con-tracting inefficiencies resulting from common agency. The merged entity’s profitswill include the value created by enhanced use of generics. As the stock of genericdrugs grows, the benefits of substitution likely increase, and so PBMs will comeunder increasing pressures to integrate vertically. Consistent with this logic, in thepast several years, large PBMs have vertically consolidated with substantial insurers,
21Similar problems can arise within the market for branded drugs. Feldman (2020) describes howthe use of volume-based rebates for individual drugs or bundled rebates for groups of drugs caninduce PBMs to exclude less expensive or more clinically desirable drugs from a favored formularyposition. Here again, payers would benefit if the PBM promoted the less expensive or clinicallydesirable drug, but these benefits needn’t flow to the PBM.
30

including UnitedHealth Plans (health plan) with OptumRx (PBM), Aetna (healthplan) with CVSCaremark (PBM), and many Blue Cross Blue Shield plans (healthplan) with PrimeTherapeutics (PBM).
In justifying vertical integration between PBMs and payers, the business pressoften emphasizes the returns to better integrating the information held separatelyby PBMs and payers. For example, in the press release announcing the final mergerof CVS with Aetna, the CVS Health President and CEO, Larry Merlo, is quoted assaying,
By fully integrating Aetna’s medical information and analytics with CVSHealth’s pharmacy data, we can develop new ways to engage consumersin their total health and wellness through personal contacts and deepercollaboration with their primary care physicians. As a result, we ex-pect patients will benefit from earlier interventions and better-connectedcare, leading to improved health outcomes and low medical costs. (CVSHealth, 2018)
Recent research finds that the incentives to integrate information systems are alsoinfluenced by the limits that common agency imposes on incentive contracts (Frand-sen et al., 2019, Section 5). To see this, consider that both CVS and Aetna likelybenefit from having sole control over their own information systems, but informationsharing becomes more efficient when they sacrifice some of this autonomy and op-erate their systems in close concert. As separate organizations, the weak incentivesinduced by common agency may provide inadequate compensation for giving up thisautonomy. Under integrated governance, however, these distortions are removed,and incentives for maximizing the value created by integrated information systemsincrease. In this way, common agency creates a complementarity between verticallyintegrated governance structures and integrating information systems.
9 Conclusion
Pharmacy benefit managers (PBMs) dominate the market for branded pharmaceu-ticals in the US. Our analysis offers insights into otherwise puzzling questions aboutthe economics of PBMs. First, why do drug makers pay rebates to PBMs? Rebatesare drug maker bids in an all pay contest for placement in favorable formulary tiers.The additional surplus generated by these near-efficient tournaments accrues as rentsto the PBM rather than to consumers or pharmaceutical manufacturers. This re-sult suggests that the challenges PBMs pose for economic policy have more to do
31
with distribution than static efficiency. Secondly, why do payers delegate the crucialand potentially profitable formulary function to an independent actor and why dolarge PBMs acting as a common agent for many other payers dominate the market?Payers delegate because a common agent PBM is better able to internalize the con-tracting externality created by most favored nation arrangements. By internalizingthis externality, large PBMs can deliver lower net drug prices and improved marketefficiency. Third, what role do high list prices play in a pharmaceutical market whererelatively few transactions actually take place at list price? Because drugs can bepurchased outside of the formulary at list price, high list prices increase the value ofparticipating in the PBM’s formulary. If PBMs can capture this surplus, they maybias formulary contests in favor of drugs with high list prices. In equilibrium, somedrug makers will set list prices at the monopoly price while others will choose muchhigher list prices. The net result is an increase in joint surplus for drug makers andPBMs, but consumers are worse off and markets become less efficient.
Our framework may have implications for efforts to reform and regulate the mar-ket for branded pharmaceuticals. Some reform proposals focus on altering who re-ceives rebates from drug makers or propose eliminating them entirely.22 Our analysissuggests that such an approach may prove disappointing. In our baseline model,passing rebates through to payers or consumers, for example, would not improve theefficiency of formularies or alter the distribution of economic benefits. This is be-cause payers would respond to such a transfer by raising their premiums and PBMswould respond to payers’ higher premiums by increasing the reimbursement pricesthey charge payers. A richer model that allows for more consumer heterogeneity mayproduce a less stark distributional result, but our findings are sufficient to suggestthat the ultimate distributional effects may not work as planned.
Efforts to eliminate rebates altogether are similarly likely to have negative effectsbecause the all-pay contest that reduces the net price of pharmaceuticals cannotoperate without rebates or their equivalent. Some observers have noted that thesecrecy surrounding net prices puts payers and consumers at a disadvantage relativeto PBMs and should therefore be eliminated (Feldman, 2020). Our analysis suggestsa slightly different approach. A well functioning formulary requires that the rebatesoffered on any given drug be kept secret—otherwise the competition driving thedesireable consequences of the all-pay contest would stop. There is, however, noequivalent economic rationale for keeping the total rebates received by the PBM asecret.
22The Trump Administration in Fall 2020 finalized an administrative rule that would requirerebates paid to PBMs by branded drug makers to be passed through to consumers (Department ofHealth and Human Services, 2020).
32

Other approaches to reform are motivated by the enormous market power ac-cumulated by large PBMs and recommend creating greater competition between alarger number of smaller PBMs (Garthwaite and Scott Morton, 2017). Our analysisdoes not explicitly model competition between PBMs, but it suggests that some pro-competitive reforms will be more effective than others. Breaking up PBMs withouteliminating the contracting externality resulting from most favored nation arrange-ments may directly reduce market efficiency and increase drug prices. Eliminatingmost favored nation arrangements, however, will reduce the efficiency advantagesenjoyed by large PBMs and so make the PBM market place more competitive in away that benefits consumers.
The mergers of large PBMs and large payers also raises questions for competitionpolicy. We find that under common agency, vertical integration creates value becauseit can mitigate otherwise severe contracting and coordination problems between aPBM and payers. It is of course also possible that vertical integration between largePBMs and large payers has anti-competitive effects that lie outside of our model. Un-derstanding any potentially anti-competitive consequences of vertical integration andhow these may interact with the efficiency enhancing consequences is an importantarea for future research.
References
Norman R. Augustine, Guru Madhavan, and Sharyl J. Nass. Making medicines af-fordable: A national imperative, 2018. A Consensus Study Report of The NationalAcademies of Sciences, Engineering, Medicine.
Yasar Barut and Dan Kovenock. The symmetric multiple prize all-pay auction withcomplete information. European Journal of Political Economy, 14(4):627 – 644,1998.
B. Douglas Bernheim and Michael D. Whinston. Common agency. Econometrica,54(4):923–942, 1986.
Centers for Medicare and Medicaid Services. September 2020 Medicaid &CHIP enrollment data highlights, 2020. URL (https://www.medicaid.gov/
medicaid/program-information/medicaid-and-chip-enrollment-data/
report-highlights/index.html.
Antonio Ciaccia. Uncovering U.S. drug pricing distortions, 2020. URL https://www.
legis.state.pa.us/WU01/LI/TR/Transcripts/2020_0024_0001_TSTMNY.pdf.
33
Congressional Budget Office. The rebate Medicaid receives on brand-name prescrip-tion drugs, 2005.
Rena M. Conti, Sayeh S. Nikpay, and Melinda B. Buntin. Revenues and profits frommedicare patients in hospitals participating in the 340b drug discount program,2013-2016. JAMA Network Open, 2, 2019.
CVS Health. 2018 formulary strategy, 2017.
CVS Health. CVS health completes acquisition of Aetna, mark-ing the start of transforming the consumer health experience, 2018.URL https://cvshealth.com/news-and-insights/press-releases/
cvs-health-completes-acquisition-of-aetna-marking-the-start-of.retrieved from the World Wide Web December 28, 2020.
Department of Health and Human Services. Fact sheet: Trumpadministration finalizes proposal to lower drug costs by target-ing backdoor rebates and encouraging direct discounts to pa-tients, 2020. URL https://www.hhs.gov/about/news/2020/11/20/
fact-sheet-trump-administration-finalizes-proposal-to-lower-drug-costs.
html. U.S. Department of Health and Human Services News Release.
Rachel Dolan. Understanding the Medicaid prescription drug rebate program, 2019.Henry J. Kaiser Family Foundation Issue Brief.
Liran Einav, Amy Finkelstein, Yunan Ji, and Neale Mahoney. Randomized trialshows healthcare payment reform has equal-sized spillover effects on patients nottargeted by reform. Proceedings of the National Academy of Sciences, 117(32):18939–18947, 2020. ISSN 0027-8424.
Keith Marzilli Ericson and Justin R Sydnor. Liquidity constraints and the value ofinsurance. Working Paper 24993, National Bureau of Economic Research, Septem-ber 2018. URL http://www.nber.org/papers/w24993.
Adam J. Fein. Dir fees, rebates, pharmacy economics, and the future of medi-care part d (rerun), 2017. URL https://www.drugchannels.net/2017/05/
dir-fees-rebates-pharmacy-economics-and.html. Drug Channnels Institute.
Adam J. Fein. CVS, Express Scripts, and the evolution of the PBMbusiness model, 2019. URL https://www.drugchannels.net/2019/05/
cvs-express-scripts-and-evolution-of.html. Drug Channels Institute.
34

Adam J. Fein. The gross-to-net bubble hit $175 billion in 2019: Why patientsneed rebate reform, 2020. URL https://www.drugchannels.net/2020/08/
the-gross-to-net-bubble-hit-175-billion.html. Drug Channnels Institute.
Robin Feldman. Drugs, Money, and Secret Handshakes: The Unstoppable Growthof Prescription Drug Prices. Cambridge University Press, 2019. doi: 10.1017/9781108687676.
Robin Feldman. Perverse incentives: Why everyone prefers high drug prices–exceptfor those who pay the bills. Harvard Journal on Legislation, 57(2):303–376, 2020.
Robin Feldman and Evan Frondorf. Drug Wars: How Big Pharma Raises Prices andKeeps Generics off the Market. Cambridge University Press, 2017. doi: 10.1017/9781316717424.
Brigham Frandsen, Michael Powell, and James B. Rebitzer. Sticking points:common-agency problems and contracting in the us healthcare system. The RANDJournal of Economics, 50(2):251–285, 2019.
Craig Garthwaite and Fiona Scott Morton. Perverse market incentives encouragehigh prescription drug prices, 2017. URL https://promarket.org/2017/11/01/
perverse-market-incentives-encourage-high-prescription-drug-prices/.posted on ProMarket, the publication of the Stigler Center at the University ofChicago Booth School of Business.
Martin Gaynor. Is vertical integration anticompetitive?: Definitely maybe (butthat’s not final). Journal of Health Economics, 25(1):175 – 180, 2006. ISSN0167-6296. doi: https://doi.org/10.1016/j.jhealeco.2005.10.004. URL http:
//www.sciencedirect.com/science/article/pii/S0167629605001050.
Jacob Glazer and Thomas G. McGuire. Setting health plan premiums to ensureefficient quality in health care: minimum variance optimal risk adjustment. Journalof Public Economics, 84(2):153–173, 2002.
Government Accountability Office. Medicare part B drugs: Action needed to reducefinancial incentives to prescribe 340B drugs at participating hospitals, 2015. Reportto Congressional Requesters.
Government Accountability Office. Medicare part D: Use of pharmacy benefit man-agers and efforts to manage drug expenditures and utilization, 2019. Report toCongressional Requesters.
35

Henry G. Grabowski and John M. Vernon. Brand loyalty, entry, and price competi-tion in pharmaceuticals after the 1984 drug act. The Journal of Law & Economics,35(2):331–350, 1992.
Charles E. Grassley and Ron Wyden. Insulin: Examining the factors driving therising cost of a century old drug, 2021. United States Senate Finance CommitteeStaff Report.
IQVIA Institute for Human Data Science. Medicine use and spending in the u.s.: Areview of 2017 and outlook to 2022, 2018. Parsippany, NJ, p. 14.
IQVIA Institute for Human Data Science. Medicine use and spending in the u.s.:Understanding patients’ costs for medicines, 2020.
Kaiser Family Foundation. Medicaid pharmacy benefits statefact sheets, 2020. URL https://www.kff.org/statedata/
medicaid-pharmacy-benefits-state-fact-sheets/.
Michael Kremer. Patent Buyouts: A Mechanism for Encouraging Innovation*. TheQuarterly Journal of Economics, 113(4):1137–1167, 11 1998.
Thomas G. McGuire. Physician agency. In A. J. Culyer and J. P. Newhouse, editors,Handbook of Health Economics, volume 1, chapter 09, pages 461–536. Elsevier, 1edition, 2000.
Mark V. Pauly. Insurance reimbursement. In A. J. Culyer and J. P. Newhouse,editors, Handbook of Health Economics, volume 1, chapter 10, pages 537–560.Elsevier, 1 edition, 2000.
Michael Rothschild and Joseph Stiglitz. Equilibrium in competitive insurance mar-kets: An essay on the economics of imperfect information. The Quarterly Jour-nal of Economics, 90(4):629–649, 1976. URL https://EconPapers.repec.org/
RePEc:oup:qjecon:v:90:y:1976:i:4:p:629-649.
Trevor J. Royce, Sheetal Kircher, and Rena M. Conti. Pharmacy benefit managerreform: Lessons from Ohio. Journal of the American Medical Association, 2019.
F. M. Scherer. Pricing, profits, and technological progress in the pharmaceuticalindustry. Journal of Economic Perspectives, 7(3):97–115, September 1993.
F.M. Scherer. The pharmaceutical industry. In A. J. Culyer and J. P. Newhouse,editors, Handbook of Health Economics, volume 1, chapter 25, pages 1297–1336.Elsevier, 1 edition, 2000.
36

Fiona Scott Morton. The strategic response by pharmaceutical firms to the medicaidmost-favored-customer rules. Working Paper 5717, National Bureau of EconomicResearch, August 1996.
Fiona M. Scott Morton. Entry decisions in the generic pharmaceutical industry.The RAND Journal of Economics, 30(3):421–440, 1999. ISSN 07416261. URLhttp://www.jstor.org/stable/2556056.
Fiona M. Scott Morton. Barriers to entry, brand advertising, and generic entry inthe us pharmaceutical industry. International Journal of Industrial Organization,18(7):1085 – 1104, 2000.
Ilya Segal. Contracting with Externalities. The Quarterly Journal of Economics, 114(2):337–388, 05 1999.
Ron Siegel. All-pay contests. Econometrica, 77(1):71–92, 2009.
Dave Yost. Ohio’s Medicaid managed care pharmacy services, 2018. Ohio Auditorof State Report.
Richard Zeckhauser. Medical insurance: A case study of the tradeoff between riskspreading and appropriate incentives. Journal of Economic Theory, 2(1):10–26,1970.
Appendix
Proof of Lemma 1. First consider the consumer’s drug purchasing decision. Theconsumer receives zero utility when not purchasing a drug. The consumer whosemedical condition is D = d receives V − p̄ when purchasing drug d out of pocketand V − cd when purchasing it through the formulary if she purchased insurance.The consumer’s utility is therefore maximized by purchasing the drug if and only ifV ≥ min {cd, p̄}, and, if the consumer purchases the drug, she will do so at the lowerprice: through the formulary if cd ≤ p̄ and out of pocket otherwise. If she did notenroll in insurance she purchases the drug if and only iff V ≥ p̄. Now consider theconsumer’s insurance enrollment decision. Her net utility if not enrolling is U0 andif enrolling is U1 − p0. She therefore enrolls if and only if p0 ≤ U1 − U0.
Proof of Lemma 2. First consider the payer’s premium choice. The payer can guar-antee zero profit by setting p0 > U1 − U0. Subject to the consumer enrolling in
37
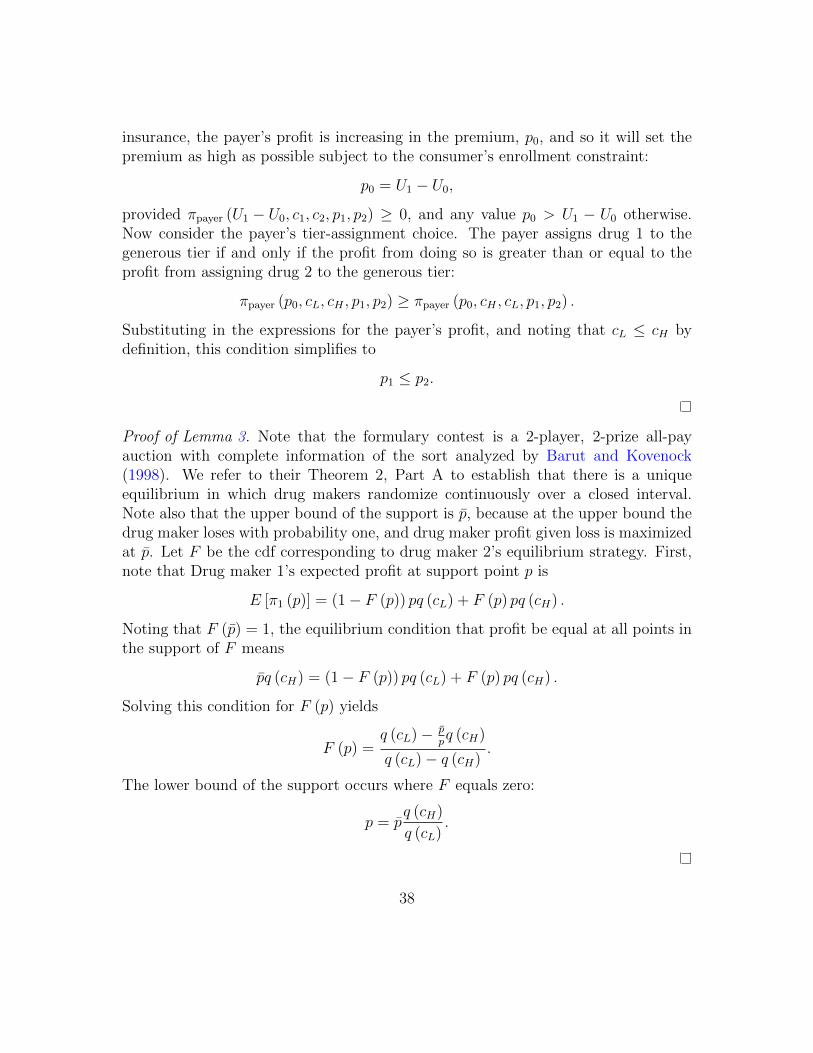
insurance, the payer’s profit is increasing in the premium, p0, and so it will set thepremium as high as possible subject to the consumer’s enrollment constraint:
p0 = U1 − U0,
provided πpayer (U1 − U0, c1, c2, p1, p2) ≥ 0, and any value p0 > U1 − U0 otherwise.Now consider the payer’s tier-assignment choice. The payer assigns drug 1 to thegenerous tier if and only if the profit from doing so is greater than or equal to theprofit from assigning drug 2 to the generous tier:
πpayer (p0, cL, cH , p1, p2) ≥ πpayer (p0, cH , cL, p1, p2) .
Substituting in the expressions for the payer’s profit, and noting that cL ≤ cH bydefinition, this condition simplifies to
p1 ≤ p2.
Proof of Lemma 3. Note that the formulary contest is a 2-player, 2-prize all-payauction with complete information of the sort analyzed by Barut and Kovenock(1998). We refer to their Theorem 2, Part A to establish that there is a uniqueequilibrium in which drug makers randomize continuously over a closed interval.Note also that the upper bound of the support is p̄, because at the upper bound thedrug maker loses with probability one, and drug maker profit given loss is maximizedat p̄. Let F be the cdf corresponding to drug maker 2’s equilibrium strategy. First,note that Drug maker 1’s expected profit at support point p is
E [π1 (p)] = (1− F (p)) pq (cL) + F (p) pq (cH) .
Noting that F (p̄) = 1, the equilibrium condition that profit be equal at all points inthe support of F means
p̄q (cH) = (1− F (p)) pq (cL) + F (p) pq (cH) .
Solving this condition for F (p) yields
F (p) =q (cL)− p̄
pq (cH)
q (cL)− q (cH).
The lower bound of the support occurs where F equals zero:
p = p̄q (cH)
q (cL).
38
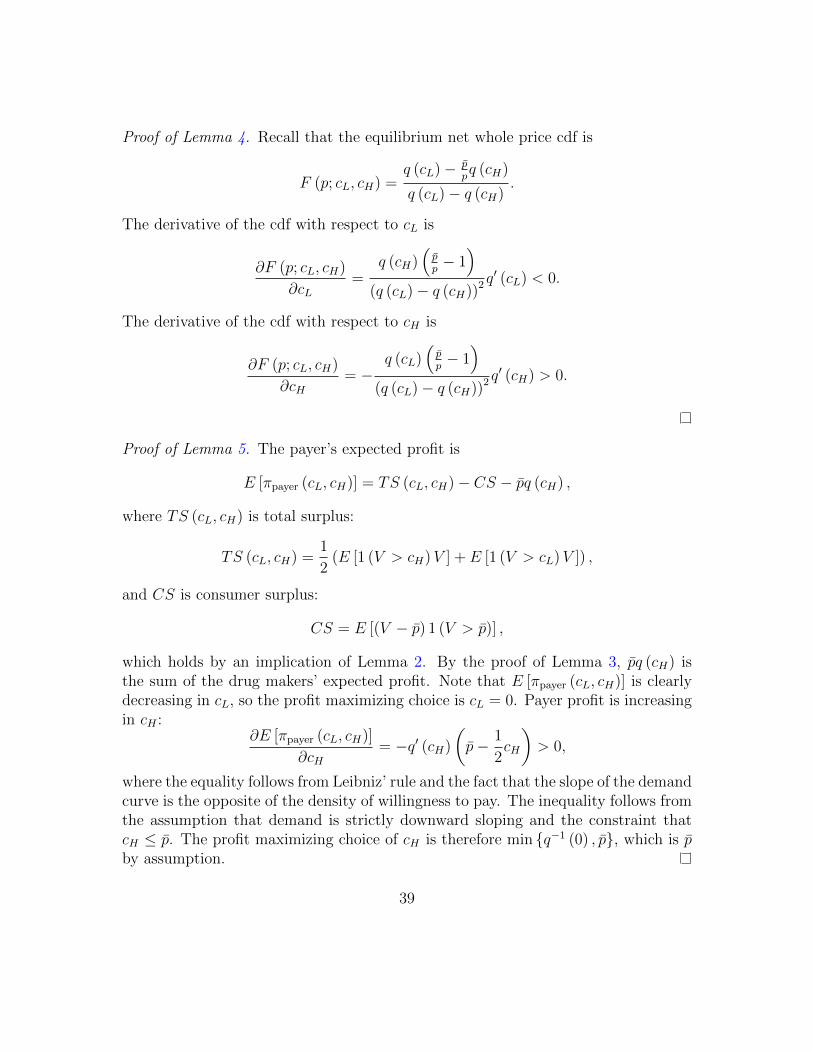
Proof of Lemma 4. Recall that the equilibrium net whole price cdf is
F (p; cL, cH) =q (cL)− p̄
pq (cH)
q (cL)− q (cH).
The derivative of the cdf with respect to cL is
∂F (p; cL, cH)
∂cL=
q (cH)(p̄p− 1)
(q (cL)− q (cH))2 q′ (cL) < 0.
The derivative of the cdf with respect to cH is
∂F (p; cL, cH)
∂cH= −
q (cL)(p̄p− 1)
(q (cL)− q (cH))2 q′ (cH) > 0.
Proof of Lemma 5. The payer’s expected profit is
E [πpayer (cL, cH)] = TS (cL, cH)− CS − p̄q (cH) ,
where TS (cL, cH) is total surplus:
TS (cL, cH) =1
2(E [1 (V > cH)V ] + E [1 (V > cL)V ]) ,
and CS is consumer surplus:
CS = E [(V − p̄) 1 (V > p̄)] ,
which holds by an implication of Lemma 2. By the proof of Lemma 3, p̄q (cH) isthe sum of the drug makers’ expected profit. Note that E [πpayer (cL, cH)] is clearlydecreasing in cL, so the profit maximizing choice is cL = 0. Payer profit is increasingin cH :
∂E [πpayer (cL, cH)]
∂cH= −q′ (cH)
(p̄− 1
2cH
)> 0,
where the equality follows from Leibniz’ rule and the fact that the slope of the demandcurve is the opposite of the density of willingness to pay. The inequality follows fromthe assumption that demand is strictly downward sloping and the constraint thatcH ≤ p̄. The profit maximizing choice of cH is therefore min {q−1 (0) , p̄}, which is p̄by assumption.
39

Proof of Lemma 6. Let i and i′ index two drugs such that pi < pi′ . Fix the tierassignments for all other drugs at {tj}j 6=i,i′ . Without loss of generality, let ca andcb be the copays corresponding to the tiers to be assigned to either i or i′, whereca ≤ cb. The portion of the payer’s revenue that depends on the net prices and tierassignments of drugs i and i′ is:
B(ct(i), ct(i′)
)=
1
m
[(ct(i) − pi
)q(ct(i))
+(ct(i′) − pi′
)q(ct(i′)
)].
It suffices to show that pi < pi′ implies B (ca, cb) ≥ B (cb, ca) with the inequalitystrict when ca < cb. The condition B (ca, cb) ≥ B (cb, ca) simplifies to
(pi′ − pi) (q (ca)− q (cb)) ≥ 0,
which holds with strict inequality with ca < cb.
Proof of Lemma 7. First, we will argue that there are no mass points. Suppose therewas a mass point at some price p. Then with strictly positive probability, all drugmakers will simultaneously choose price p, and at that price, they would have anequal chance of winning each of the prizes. One of the drug makers could deviate byallocating all that mass instead to price p− ε for ε arbitrarily small and for sure winq (c1) (p− ε), so there is a profitable deviation. So there cannot be any mass points.
Next, suppose the upper bound of the price distribution is p̃ < p̄. Then sincethere are no mass points, by choosing price pi = p̃, drug maker i can only getrevenues of q (ci) p̃. It could obtain q (ci) p̄ by bidding pi = p̄ and would get strictlyhigher profits since p̄ > p̃. So the upper bound of the price distribution must be p̄.A similar argument establishes that the support of the distribution is an interval:suppose p̂1 and p̂2 > p̂1 are in the support of the distribution, but there is a gap inthe support between these two points. Then drug maker i would strictly prefer tochoose price p̂2 over p̂1, which again is a contradiction. So any symmetric equilibriumprice distribution is continuous and has support
[p, p̄]
for some p < p̄.The preceding shows that if there is a symmetric equilibrium price distribution
F ∗, it is continuous and has support[p, p̄]. Let F (p) be the cdf of a candidate
equilibrium mixing distribution. Let
F k,m−1 (p) =
(m− 1
k
)F (p)k (1− F (p))m−1−k
be the probability that exactly k of the other m − 1 prices is less than p if all drugmakers mix with continuous distribution F on
[p, p̄]. Then the expected profit for
40
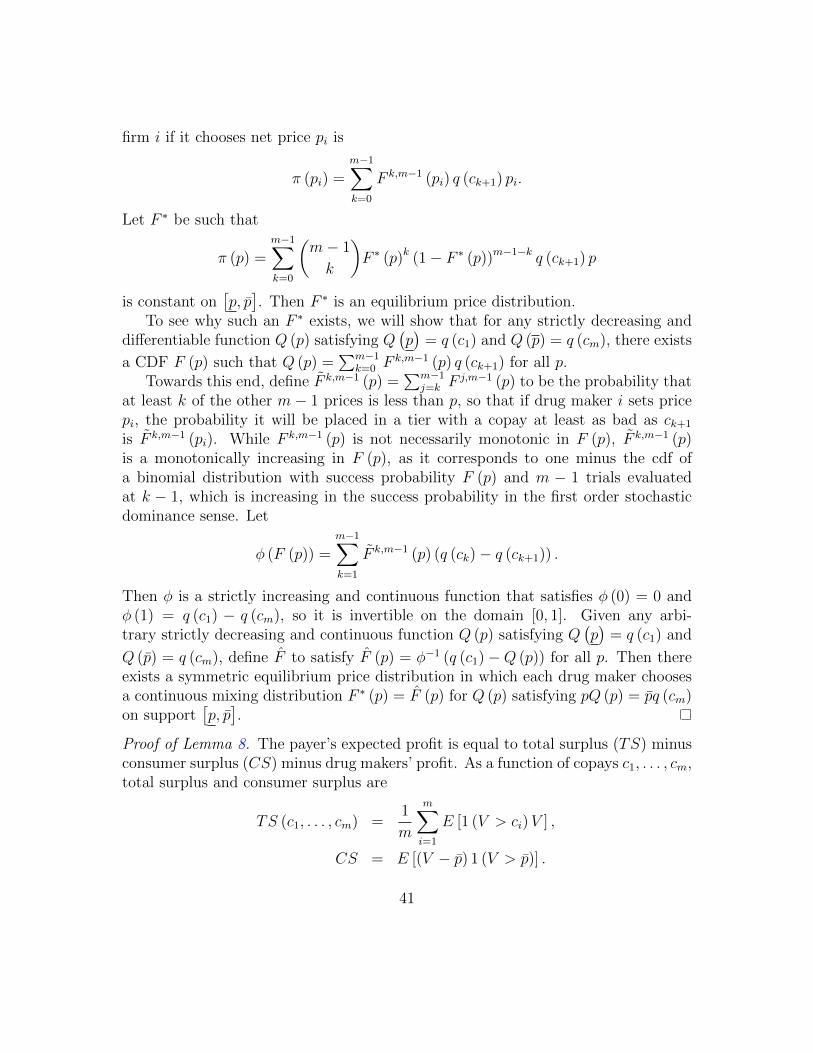
firm i if it chooses net price pi is
π (pi) =m−1∑k=0
F k,m−1 (pi) q (ck+1) pi.
Let F ∗ be such that
π (p) =m−1∑k=0
(m− 1
k
)F ∗ (p)k (1− F ∗ (p))m−1−k q (ck+1) p
is constant on[p, p̄]. Then F ∗ is an equilibrium price distribution.
To see why such an F ∗ exists, we will show that for any strictly decreasing anddifferentiable function Q (p) satisfying Q
(p)
= q (c1) and Q (p) = q (cm), there exists
a CDF F (p) such that Q (p) =∑m−1
k=0 Fk,m−1 (p) q (ck+1) for all p.
Towards this end, define F̃ k,m−1 (p) =∑m−1
j=k Fj,m−1 (p) to be the probability that
at least k of the other m− 1 prices is less than p, so that if drug maker i sets pricepi, the probability it will be placed in a tier with a copay at least as bad as ck+1
is F̃ k,m−1 (pi). While F k,m−1 (p) is not necessarily monotonic in F (p), F̃ k,m−1 (p)is a monotonically increasing in F (p), as it corresponds to one minus the cdf ofa binomial distribution with success probability F (p) and m − 1 trials evaluatedat k − 1, which is increasing in the success probability in the first order stochasticdominance sense. Let
φ (F (p)) =m−1∑k=1
F̃ k,m−1 (p) (q (ck)− q (ck+1)) .
Then φ is a strictly increasing and continuous function that satisfies φ (0) = 0 andφ (1) = q (c1) − q (cm), so it is invertible on the domain [0, 1]. Given any arbi-trary strictly decreasing and continuous function Q (p) satisfying Q
(p)
= q (c1) and
Q (p̄) = q (cm), define F̂ to satisfy F̂ (p) = φ−1 (q (c1)−Q (p)) for all p. Then thereexists a symmetric equilibrium price distribution in which each drug maker choosesa continuous mixing distribution F ∗ (p) = F̂ (p) for Q (p) satisfying pQ (p) = p̄q (cm)on support
[p, p̄].
Proof of Lemma 8. The payer’s expected profit is equal to total surplus (TS) minusconsumer surplus (CS) minus drug makers’ profit. As a function of copays c1, . . . , cm,total surplus and consumer surplus are
TS (c1, . . . , cm) =1
m
m∑i=1
E [1 (V > ci)V ] ,
CS = E [(V − p̄) 1 (V > p̄)] .
41
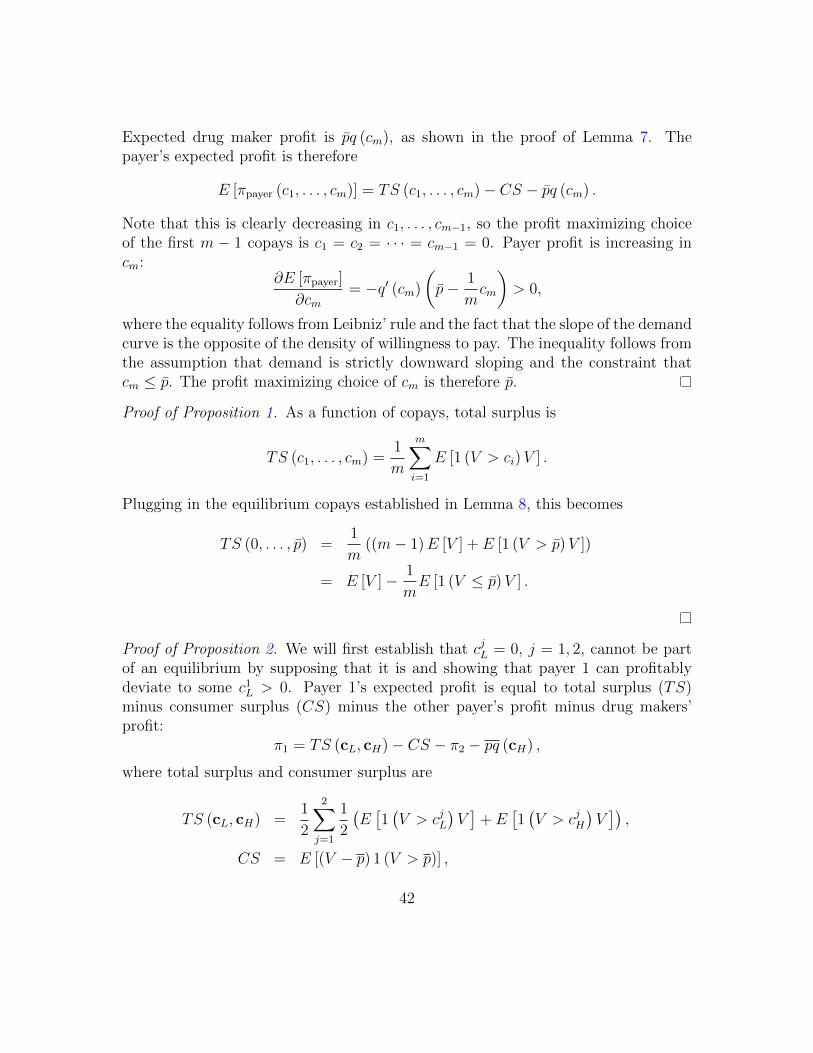
Expected drug maker profit is p̄q (cm), as shown in the proof of Lemma 7. Thepayer’s expected profit is therefore
E [πpayer (c1, . . . , cm)] = TS (c1, . . . , cm)− CS − p̄q (cm) .
Note that this is clearly decreasing in c1, . . . , cm−1, so the profit maximizing choiceof the first m − 1 copays is c1 = c2 = · · · = cm−1 = 0. Payer profit is increasing incm:
∂E [πpayer]
∂cm= −q′ (cm)
(p̄− 1
mcm
)> 0,
where the equality follows from Leibniz’ rule and the fact that the slope of the demandcurve is the opposite of the density of willingness to pay. The inequality follows fromthe assumption that demand is strictly downward sloping and the constraint thatcm ≤ p̄. The profit maximizing choice of cm is therefore p̄.
Proof of Proposition 1. As a function of copays, total surplus is
TS (c1, . . . , cm) =1
m
m∑i=1
E [1 (V > ci)V ] .
Plugging in the equilibrium copays established in Lemma 8, this becomes
TS (0, . . . , p̄) =1
m((m− 1)E [V ] + E [1 (V > p̄)V ])
= E [V ]− 1
mE [1 (V ≤ p̄)V ] .
Proof of Proposition 2. We will first establish that cjL = 0, j = 1, 2, cannot be partof an equilibrium by supposing that it is and showing that payer 1 can profitablydeviate to some c1
L > 0. Payer 1’s expected profit is equal to total surplus (TS)minus consumer surplus (CS) minus the other payer’s profit minus drug makers’profit:
π1 = TS (cL, cH)− CS − π2 − pq (cH) ,
where total surplus and consumer surplus are
TS (cL, cH) =1
2
2∑j=1
1
2
(E[1(V > cjL
)V]
+ E[1(V > cjH
)V]),
CS = E [(V − p) 1 (V > p)] ,
42
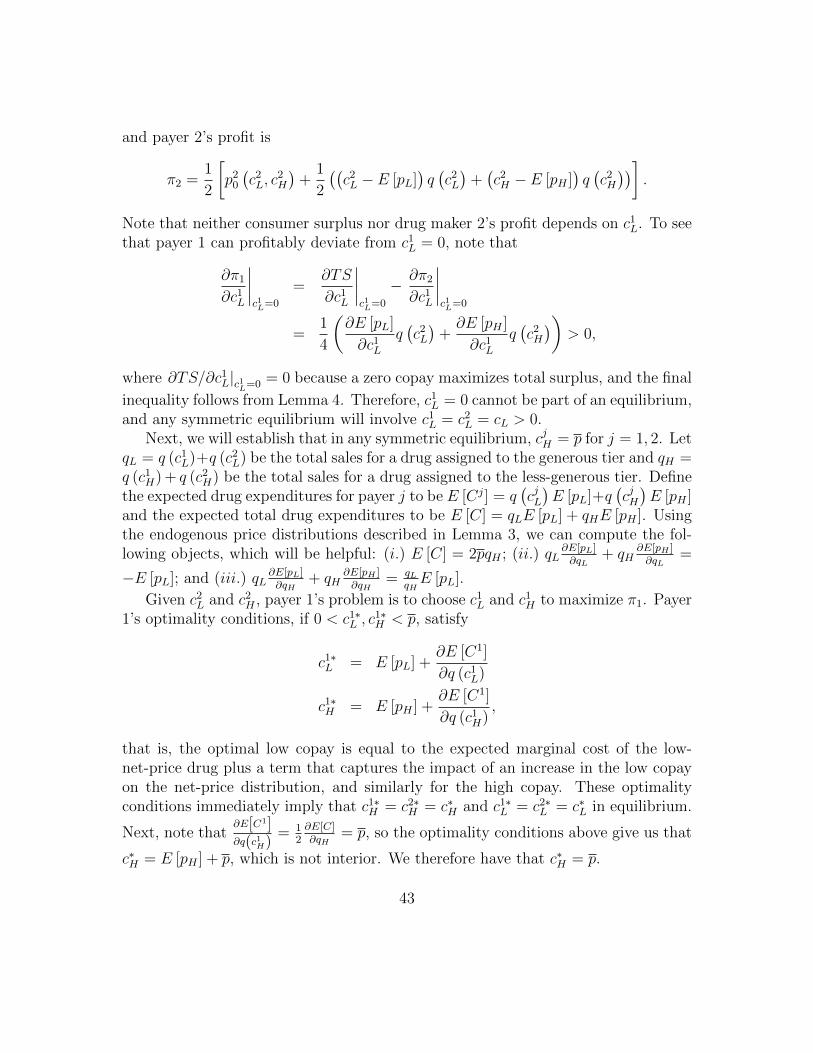
and payer 2’s profit is
π2 =1
2
[p2
0
(c2L, c
2H
)+
1
2
((c2L − E [pL]
)q(c2L
)+(c2H − E [pH ]
)q(c2H
))].
Note that neither consumer surplus nor drug maker 2’s profit depends on c1L. To see
that payer 1 can profitably deviate from c1L = 0, note that
∂π1
∂c1L
∣∣∣∣c1L=0
=∂TS
∂c1L
∣∣∣∣c1L=0
− ∂π2
∂c1L
∣∣∣∣c1L=0
=1
4
(∂E [pL]
∂c1L
q(c2L
)+∂E [pH ]
∂c1L
q(c2H
))> 0,
where ∂TS/∂c1L|c1L=0 = 0 because a zero copay maximizes total surplus, and the final
inequality follows from Lemma 4. Therefore, c1L = 0 cannot be part of an equilibrium,
and any symmetric equilibrium will involve c1L = c2
L = cL > 0.Next, we will establish that in any symmetric equilibrium, cjH = p for j = 1, 2. Let
qL = q (c1L)+q (c2
L) be the total sales for a drug assigned to the generous tier and qH =q (c1
H) + q (c2H) be the total sales for a drug assigned to the less-generous tier. Define
the expected drug expenditures for payer j to be E [Cj] = q(cjL)E [pL]+q
(cjH)E [pH ]
and the expected total drug expenditures to be E [C] = qLE [pL] + qHE [pH ]. Usingthe endogenous price distributions described in Lemma 3, we can compute the fol-lowing objects, which will be helpful: (i.) E [C] = 2pqH ; (ii.) qL
∂E[pL]∂qL
+ qH∂E[pH ]∂qL
=
−E [pL]; and (iii.) qL∂E[pL]∂qH
+ qH∂E[pH ]∂qH
= qLqHE [pL].
Given c2L and c2
H , payer 1’s problem is to choose c1L and c1
H to maximize π1. Payer1’s optimality conditions, if 0 < c1∗
L , c1∗H < p, satisfy
c1∗L = E [pL] +
∂E [C1]
∂q (c1L)
c1∗H = E [pH ] +
∂E [C1]
∂q (c1H)
,
that is, the optimal low copay is equal to the expected marginal cost of the low-net-price drug plus a term that captures the impact of an increase in the low copayon the net-price distribution, and similarly for the high copay. These optimalityconditions immediately imply that c1∗
H = c2∗H = c∗H and c1∗
L = c2∗L = c∗L in equilibrium.
Next, note that∂E[C1]∂q(c1H)
= 12∂E[C]∂qH
= p, so the optimality conditions above give us that
c∗H = E [pH ] + p, which is not interior. We therefore have that c∗H = p.
43

Finally, note that the symmetric equilibrium values c∗L > 0 and c∗H = p were inthe payer’s choice set in the one-payer model but were dominated by c∗L = 0 andc∗H = p. Therefore total payer profit is reduced when n = 2. Note also that totalsurplus is strictly decreasing in cL and cH . Because cL is strictly higher when n = 2,and cH is the same, total surplus is also reduced.
Proof of Lemma 9. The PBM’s profit as a function of copays and reimbursementprices, taking net prices as given is
πPBM (c1, c2, r1, r2; p1, p2) =1
2
2∑i=1
q (ci) (ri − pi) .
Profit is increasing in the reimbursement prices r1 and r2. The PBM will thereforeset them so that the payers’ zero profit condition binds. Profit for payer j is
πj =1
2
(p0 +
1
2
2∑i=1
q (ci) (ci − ri)
).
Setting this equal to zero gives the following expression for the weighted averagereimbursement price:
1
2
2∑i=1
q (ci) ri = p0 +1
2
2∑i=1
q (ci) ci,
as stated in the lemma.Substituting this condition into the PBM’s profit function gives
πPBM (c1, c2; p1, p2) = p0 +1
2
2∑i=1
q (ci) (ci − pi) ,
which is identical to the payer’s profit function in the one-payer case. Tier assignmentis therefore identical to the one-payer case established in Lemma 2.
Proof of Proposition 3. As established in the proof to Lemma 9, the PBM’s profitfunction after substituting in the profit-maximizing choice of reimbursement prices, isidentical to the payer’s profit in the one-payer case. Therefore the PBM’s equilibriumchoice of copays and the drug makers’ net price strategies coincide with the one-payer case. The result of Proposition 2 therefore means that total surplus and jointPBM and payer profit is higher with a PBM than when each payer acts as its ownintermediary.
44

Proof of Lemma 10. The intermediary’s profit as a function of copays assignmentsc1 and c2, taking net prices as given, is
π (c1, c2; p1, p2) = p0 +1
2
2∑i=1
q (min {ci, p̄i}) (min {ci, p̄i} − pi) ,
where p0 = U1 − U0 and
U0 =1
2
2∑i=1
E [(V − p̄i) 1 (V > p̄i)] ,
U1 =1
2
2∑i=1
E [(V −min {ci, p̄i}) 1 (V > min {ci, p̄i})] .
The intermediary assigns c1 = cL and c2 = cH if its profit from doing so is greaterthan its profit from doing otherwise; that is, it assigns drug 1 to the generous tierif and only if π (cL, cH ; p1, p2) ≥ π (cH , cL; p1, p2). In Case 1 (cH ≤ min {p̄1, p̄2}) thiscondition becomes
p1 ≤ p2,
as in Lemma 2. In Case 2 (p̄1 < cH ≤ p̄2), the condition becomes
p2 ≥q (cL)− q (p̄1)
q (cL)− q (cH)p1 +
E [V |V > p̄1] q (p̄1)− E [V |V > cH ] q (cH)
q (cL)− q (cH).
Proof of Proposition 4. The equilibrium list price vector (p̄∗1, p̄∗2)′ is a fixed point of
the drug makers’ best response function:
BR
((p̄1
p̄2
))=
(arg maxx πD (c∗ (x, p̄2) , x, p̄2)arg maxx πD (c∗ (p̄1, x) , x, p̄1)
),
where πD (c, p̄i, p̄−i) is drug maker i’s expected profit given formulary copays c =(cL, cH)′, own list price p̄i and the other drug maker’s list price p̄−i. The functionc∗ (p̄1, p̄2) gives the intermediary’s equilibrium choice of (cL, cH)′ given list prices:
c∗ (p̄1, p̄2) = arg maxcπI (c, p̄1, p̄2) .
The intermediary’s expected profit in turn is given by total surplus minus consumersurplus minus combined drug maker profit:
πI (c, p̄1, p̄2) = TS (c, p̄1, p̄2)− CS (p̄1, p̄2)− (πD (c,p̄1, p̄2) + πD (c,p̄2, p̄1)) .
45
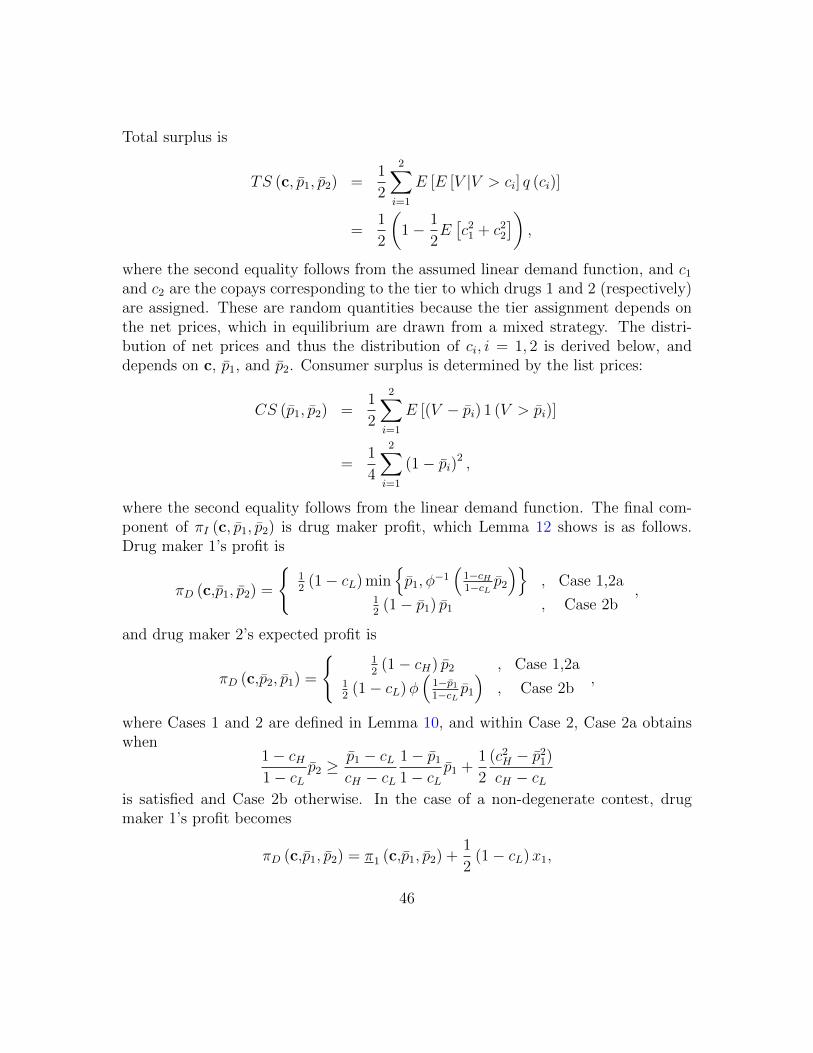
Total surplus is
TS (c, p̄1, p̄2) =1
2
2∑i=1
E [E [V |V > ci] q (ci)]
=1
2
(1− 1
2E[c2
1 + c22
]),
where the second equality follows from the assumed linear demand function, and c1
and c2 are the copays corresponding to the tier to which drugs 1 and 2 (respectively)are assigned. These are random quantities because the tier assignment depends onthe net prices, which in equilibrium are drawn from a mixed strategy. The distri-bution of net prices and thus the distribution of ci, i = 1, 2 is derived below, anddepends on c, p̄1, and p̄2. Consumer surplus is determined by the list prices:
CS (p̄1, p̄2) =1
2
2∑i=1
E [(V − p̄i) 1 (V > p̄i)]
=1
4
2∑i=1
(1− p̄i)2 ,
where the second equality follows from the linear demand function. The final com-ponent of πI (c, p̄1, p̄2) is drug maker profit, which Lemma 12 shows is as follows.Drug maker 1’s profit is
πD (c,p̄1, p̄2) =
{12
(1− cL) min{p̄1, φ
−1(
1−cH1−cL
p̄2
)}, Case 1,2a
12
(1− p̄1) p̄1 , Case 2b,
and drug maker 2’s expected profit is
πD (c,p̄2, p̄1) =
{12
(1− cH) p̄2 , Case 1,2a12
(1− cL)φ(
1−p̄1
1−cLp̄1
), Case 2b
,
where Cases 1 and 2 are defined in Lemma 10, and within Case 2, Case 2a obtainswhen
1− cH1− cL
p̄2 ≥p̄1 − cLcH − cL
1− p̄1
1− cLp̄1 +
1
2
(c2H − p̄2
1)
cH − cLis satisfied and Case 2b otherwise. In the case of a non-degenerate contest, drugmaker 1’s profit becomes
πD (c,p̄1, p̄2) = π1 (c,p̄1, p̄2) +1
2(1− cL)x1,
46
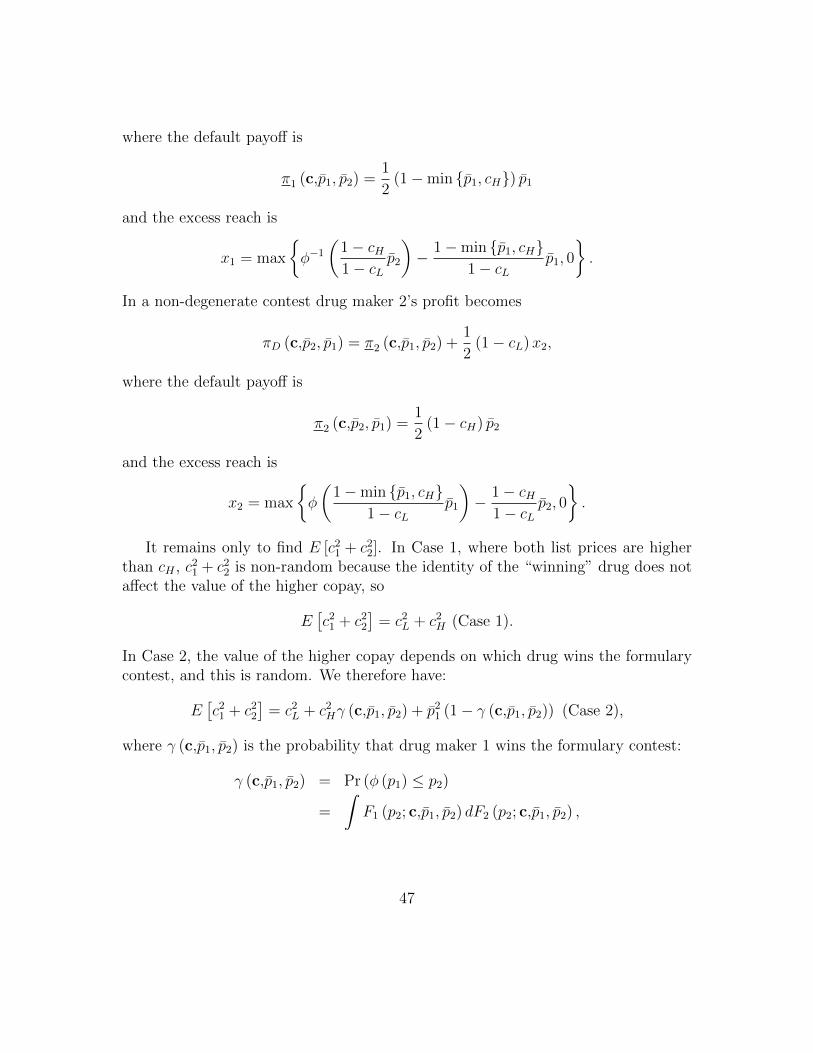
where the default payoff is
π1 (c,p̄1, p̄2) =1
2(1−min {p̄1, cH}) p̄1
and the excess reach is
x1 = max
{φ−1
(1− cH1− cL
p̄2
)− 1−min {p̄1, cH}
1− cLp̄1, 0
}.
In a non-degenerate contest drug maker 2’s profit becomes
πD (c,p̄2, p̄1) = π2 (c,p̄1, p̄2) +1
2(1− cL)x2,
where the default payoff is
π2 (c,p̄2, p̄1) =1
2(1− cH) p̄2
and the excess reach is
x2 = max
{φ
(1−min {p̄1, cH}
1− cLp̄1
)− 1− cH
1− cLp̄2, 0
}.
It remains only to find E [c21 + c2
2]. In Case 1, where both list prices are higherthan cH , c2
1 + c22 is non-random because the identity of the “winning” drug does not
affect the value of the higher copay, so
E[c2
1 + c22
]= c2
L + c2H (Case 1).
In Case 2, the value of the higher copay depends on which drug wins the formularycontest, and this is random. We therefore have:
E[c2
1 + c22
]= c2
L + c2Hγ (c,p̄1, p̄2) + p̄2
1 (1− γ (c,p̄1, p̄2)) (Case 2),
where γ (c,p̄1, p̄2) is the probability that drug maker 1 wins the formulary contest:
γ (c,p̄1, p̄2) = Pr (φ (p1) ≤ p2)
=
∫F1 (p2; c,p̄1, p̄2) dF2 (p2; c,p̄1, p̄2) ,
47
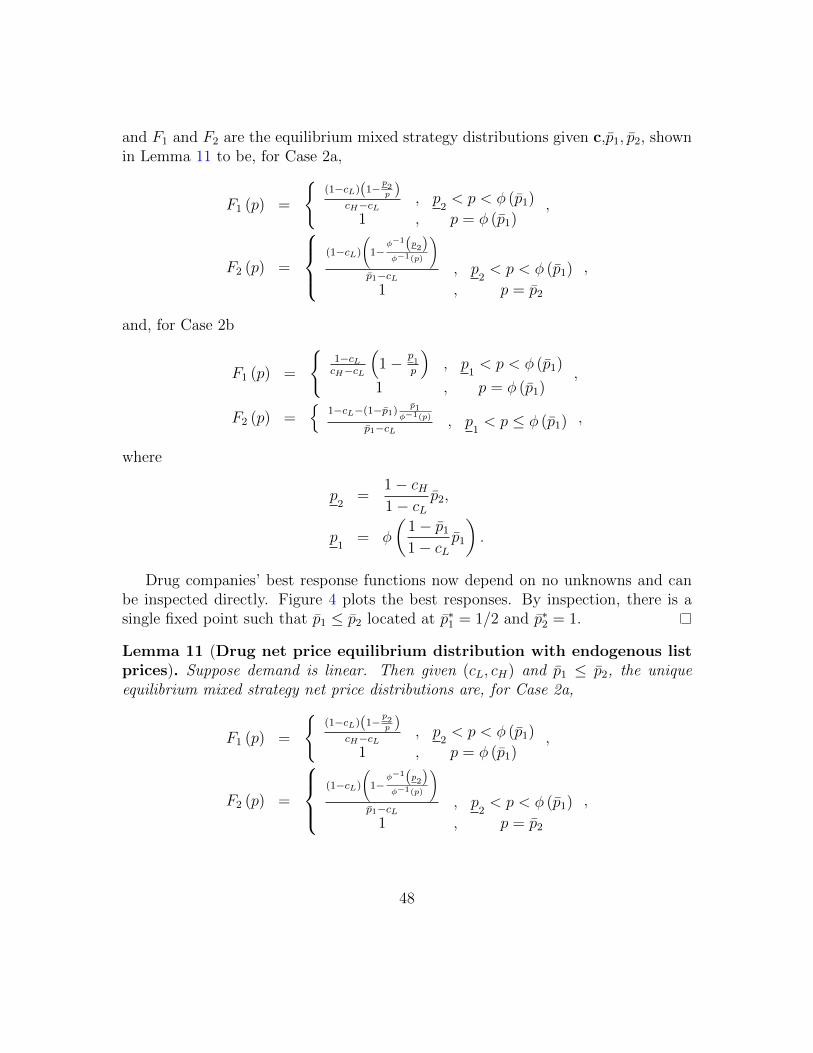
and F1 and F2 are the equilibrium mixed strategy distributions given c,p̄1, p̄2, shownin Lemma 11 to be, for Case 2a,
F1 (p) =
{(1−cL)(1−
p2p )
cH−cL, p
2< p < φ (p̄1)
1 , p = φ (p̄1),
F2 (p) =
(1−cL)
(1−
φ−1(p2)φ−1(p)
)p̄1−cL
, p2< p < φ (p̄1)
1 , p = p̄2
,
and, for Case 2b
F1 (p) =
{1−cLcH−cL
(1− p
1
p
), p
1< p < φ (p̄1)
1 , p = φ (p̄1),
F2 (p) ={
1−cL−(1−p̄1)p̄1
φ−1(p)
p̄1−cL, p
1< p ≤ φ (p̄1) ,
where
p2
=1− cH1− cL
p̄2,
p1
= φ
(1− p̄1
1− cLp̄1
).
Drug companies’ best response functions now depend on no unknowns and canbe inspected directly. Figure 4 plots the best responses. By inspection, there is asingle fixed point such that p̄1 ≤ p̄2 located at p̄∗1 = 1/2 and p̄∗2 = 1.
Lemma 11 (Drug net price equilibrium distribution with endogenous listprices). Suppose demand is linear. Then given (cL, cH) and p̄1 ≤ p̄2, the uniqueequilibrium mixed strategy net price distributions are, for Case 2a,
F1 (p) =
{(1−cL)(1−
p2p )
cH−cL, p
2< p < φ (p̄1)
1 , p = φ (p̄1),
F2 (p) =
(1−cL)
(1−
φ−1(p2)φ−1(p)
)p̄1−cL
, p2< p < φ (p̄1)
1 , p = p̄2
,
48

and, for Case 2b
F1 (p) =
{1−cLcH−cL
(1− p
1
p
), p
1< p < φ (p̄1)
1 , p = φ (p̄1),
F2 (p) ={
1−cL−(1−p̄1)p̄1
φ−1(p)
p̄1−cL, p
1< p ≤ φ (p̄1) .
where
p2
=1− cH1− cL
p̄2,
p1
= φ
(1− p̄1
1− cLp̄1
).
Proof. Note that the upper bound on the support of F1 is φ (p̄1) and the upper boundon the support of F2 is p̄2, because net prices cannot exceed list prices. Note alsothat a lower bound on the support of Fi is max {1− T, 1− ai}.
Take Case 2a first, where drug maker 2 is marginal. This means that drug maker2’s reach, where it is indifferent between winning and settling for a loss, determinesthe threshold price, which is a lower bound on the support of F2:
p2
=1− cH1− cL
p̄2.
Suppose first that p2> φ (p̄1) (that is, drug maker 2’s lower bound is greater than
drug maker 1’s maximum possible bid). Then F1 will be degenerate at φ (p̄1) and F2
will be degenerate at p̄2 and drug maker 1 wins with probability one. Now supposep
2≤ φ (p̄1). The supports of both F1 and F2 will then have a lower bound of p
2.
Note that φ (p̄1) is an upper bound on the support of F1. Any continuous portionof F2 will therefore have an upper bound of φ (p̄1). We first derive the continuousportion (if any) of F2 by considering drug company 1’s profit as a function of somebid p in the continuous portion of the support of F2:
π1 (p) =1
2(1− p̄1)φ−1 (p)F2 (p) +
1
2(1− cL)φ−1 (p) (1− F2 (p)) .
Equilibrium requires that π1 (p) be equal to the profit derived above using Siegel(2009), which allows us to solve for the the continuous portion of F2:
F cont2 (p) =
(1− cL)
(1− φ−1(p2)
φ−1(p)
)p̄1 − cL
.
49

We can similarly find the continuous portion of F1 by considering drug maker 2’sprofit at some net price p in the continuous portion of the support of F1:
π2 (p) =1
2(1− cH) pF1 (p) +
1
2(1− cL) p (1− F1 (p)) .
Again, using the profit derived above for drug maker 2, indifference determines thecontinuous portion of F1:
F cont1 (p) =
(1− cL)(
1− p2
p
)cH − cL
.
We now determine any mass points in the distributions. Note that F cont1 and F cont
2
are both zero at p2, meaning there is no mass point at the lower end of the support.
Note also that φ (p̄1) is an upper bound on the support of F1 and thus also onthe continuous portion of F2. Because F cont
1 (φ (p̄1)) < 1, F1 has a mass point ofλ1 = 1−F cont
1 (φ (p̄1)) at φ (p̄1). Because F cont2 (φ (p̄1)) < 1 (which is true because we
are in Case 2a), Drug maker 2 will put all remaining mass above φ (p̄1) at p̄2, for amass point of λ2 = 1− F cont
2 (φ (p̄1)) at p̄2. In summary, in Case 2a, the equilibriumdistributions are
F1 (p) =
{(1−cL)(1−
p2p )
cH−cL, p
2< p < φ (p̄1)
1 , p = φ (p̄1),
F2 (p) =
(1−cL)
(1−
φ−1(p2)φ−1(p)
)p̄1−cL
, p2< p < φ (p̄1)
1 , p = p̄2
,
if p2≤ φ (p̄1), and degenerate at φ (p̄1) and p̄2 otherwise.
Now take Case 2b, where drug maker 1 is marginal. Now the threshold priceis determined by drug maker 1’s reach, where it is indifferent between winning andsettling for losing. This establishes a lower bound on the support of F1:
p1
= φ
(1− p̄1
1− cLp̄1
).
Note that p1< p̄2, so p
1is also a lower bound on the support of F2. As before, we
can determine the continuous portion of F2 by looking at drug maker 1’s profit as afunction of some bid p in the continuous portion of the support of F2:
π1 (p) =1
2(1− p̄1)φ−1 (p)F2 (p) +
1
2(1− cL)φ−1 (p) (1− F2 (p)) .
50

Using the profit for drug maker 1 derived above for Case 2b, indifference determinesthe continuous portion of F1:
F cont2 (p) =
1− cL − (1− p̄1) p̄1
φ−1(p)
p̄1 − cL.
Similarly, we determine the continuous portion of F1 by looking at drug maker 2’sprofit at some bid b in the continuous portion of the support of F1:
π2 (p) =1
2(1− cH) pF1 (p) +
1
2(1− cL) p (1− F1 (p)) .
Using the profit for drug maker 1 derived above for Case 2b, indifference determinesthe continuous portion of F2:
F cont1 (p) =
1− cLcH − cL
(1−
p1
p
).
Now we determine mass points. Note F cont1 and F cont
2 are both zero at p1, meaning
neither distribution has a mass point at the lower end of the support. Note thatF cont
1 reaches one at 1−cL1−cH
p1> φ (p̄1), meaning F1 has a mass point at φ (p̄1) equal
to λ1 = 1 − F cont1 (φ (p̄1)). Because F cont
2 (φ (p̄1)) = 1, F2 has no mass point. Insummary, in Case 2b, the equilibrium distributions are
F1 (p) =
{1−cLcH−cL
(1− p
1
p
), p
1< p < φ (p̄1)
1 , p = φ (p̄1),
F2 (p) ={
1−cL−(1−p̄1)p̄1
φ−1(p)
p̄1−cL, p
1< p ≤ φ (p̄1) .
Lemma 12 (Drug maker profit with endogenous list prices). Suppose drugdemand is linear. Then given formulary copays c = (cL, cH)′ and list prices p̄1 ≤ p̄2,drug maker 1’s expected profit is
πD (c,p̄1, p̄2) =
{12
(1− cL) min{p̄1, φ
−1(
1−cH1−cL
p̄2
)}, Case 1,2a
12
(1− p̄1) p̄1 , Case 2b,
and drug maker 2’s expected profit is
πD (c,p̄2, p̄1) =
{12
(1− cH) p̄2 , Case 1,2a12
(1− cL)φ(
1−p̄1
1−cLp̄1
), Case 2b
,
51
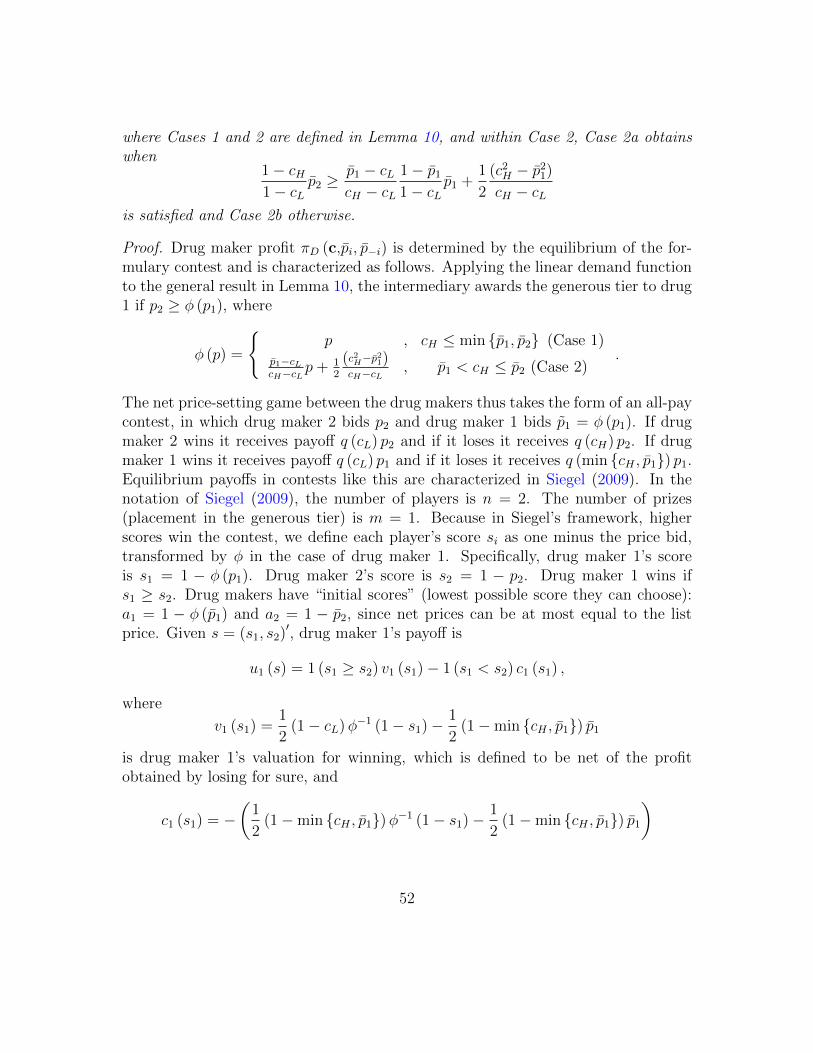
where Cases 1 and 2 are defined in Lemma 10, and within Case 2, Case 2a obtainswhen
1− cH1− cL
p̄2 ≥p̄1 − cLcH − cL
1− p̄1
1− cLp̄1 +
1
2
(c2H − p̄2
1)
cH − cLis satisfied and Case 2b otherwise.
Proof. Drug maker profit πD (c,p̄i, p̄−i) is determined by the equilibrium of the for-mulary contest and is characterized as follows. Applying the linear demand functionto the general result in Lemma 10, the intermediary awards the generous tier to drug1 if p2 ≥ φ (p1), where
φ (p) =
{p , cH ≤ min {p̄1, p̄2} (Case 1)
p̄1−cLcH−cL
p+ 12
(c2H−p̄21)
cH−cL, p̄1 < cH ≤ p̄2 (Case 2)
.
The net price-setting game between the drug makers thus takes the form of an all-paycontest, in which drug maker 2 bids p2 and drug maker 1 bids p̃1 = φ (p1). If drugmaker 2 wins it receives payoff q (cL) p2 and if it loses it receives q (cH) p2. If drugmaker 1 wins it receives payoff q (cL) p1 and if it loses it receives q (min {cH , p̄1}) p1.Equilibrium payoffs in contests like this are characterized in Siegel (2009). In thenotation of Siegel (2009), the number of players is n = 2. The number of prizes(placement in the generous tier) is m = 1. Because in Siegel’s framework, higherscores win the contest, we define each player’s score si as one minus the price bid,transformed by φ in the case of drug maker 1. Specifically, drug maker 1’s scoreis s1 = 1 − φ (p1). Drug maker 2’s score is s2 = 1 − p2. Drug maker 1 wins ifs1 ≥ s2. Drug makers have “initial scores” (lowest possible score they can choose):a1 = 1 − φ (p̄1) and a2 = 1 − p̄2, since net prices can be at most equal to the listprice. Given s = (s1, s2)′, drug maker 1’s payoff is
u1 (s) = 1 (s1 ≥ s2) v1 (s1)− 1 (s1 < s2) c1 (s1) ,
where
v1 (s1) =1
2(1− cL)φ−1 (1− s1)− 1
2(1−min {cH , p̄1}) p̄1
is drug maker 1’s valuation for winning, which is defined to be net of the profitobtained by losing for sure, and
c1 (s1) = −(
1
2(1−min {cH , p̄1})φ−1 (1− s1)− 1
2(1−min {cH , p̄1}) p̄1
)
52
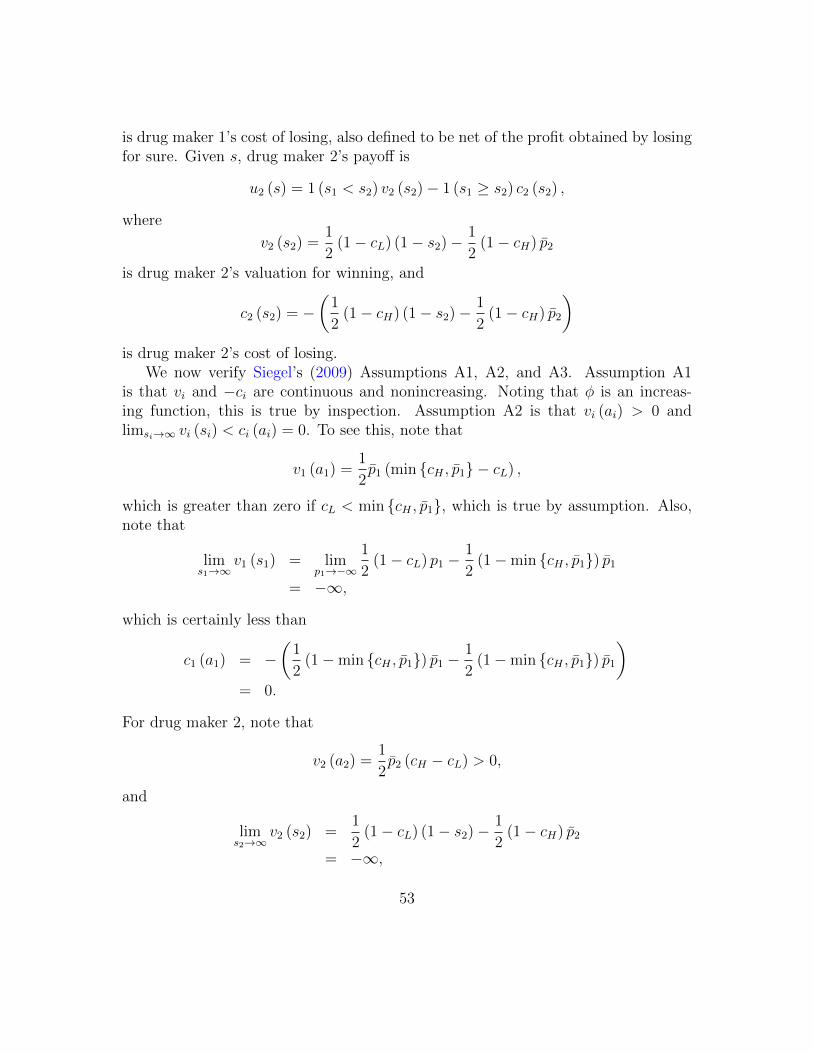
is drug maker 1’s cost of losing, also defined to be net of the profit obtained by losingfor sure. Given s, drug maker 2’s payoff is
u2 (s) = 1 (s1 < s2) v2 (s2)− 1 (s1 ≥ s2) c2 (s2) ,
where
v2 (s2) =1
2(1− cL) (1− s2)− 1
2(1− cH) p̄2
is drug maker 2’s valuation for winning, and
c2 (s2) = −(
1
2(1− cH) (1− s2)− 1
2(1− cH) p̄2
)is drug maker 2’s cost of losing.
We now verify Siegel’s (2009) Assumptions A1, A2, and A3. Assumption A1is that vi and −ci are continuous and nonincreasing. Noting that φ is an increas-ing function, this is true by inspection. Assumption A2 is that vi (ai) > 0 andlimsi→∞ vi (si) < ci (ai) = 0. To see this, note that
v1 (a1) =1
2p̄1 (min {cH , p̄1} − cL) ,
which is greater than zero if cL < min {cH , p̄1}, which is true by assumption. Also,note that
lims1→∞
v1 (s1) = limp1→−∞
1
2(1− cL) p1 −
1
2(1−min {cH , p̄1}) p̄1
= −∞,
which is certainly less than
c1 (a1) = −(
1
2(1−min {cH , p̄1}) p̄1 −
1
2(1−min {cH , p̄1}) p̄1
)= 0.
For drug maker 2, note that
v2 (a2) =1
2p̄2 (cH − cL) > 0,
and
lims2→∞
v2 (s2) =1
2(1− cL) (1− s2)− 1
2(1− cH) p̄2
= −∞,
53

which is less than
c2 (a2) = −(
1
2(1− cH) p̄2 −
1
2(1− cH) p̄2
)= 0.
Assumption A3 is that ci (si) > 0 if vi (si) = 0. For drug maker 1, v1 is zero at itsreach (the highest score at which vi is zero), which is:
r1 = 1− φ(
1−min {cH , p̄1}1− cL
p̄1
).
c1 evaluated at this value is
c1 (r1) =1
2(1−min {cH , p̄1}) p̄1
(min {cH , p̄1} − cL
1− cL
),
which is positive as required. For drug maker 2, v2 (s2) = 0 at
r2 = 1− 1− cH1− cL
p̄2.
c2 evaluated at this value is
c2 (r2) =1
2p̄2 (1− cH)
(cH − cL1− cL
),
which is positive as required. Siegel’s Assumptions A1-A3 are therefore satisfied inour setting.
The following concepts in Siegel’s framework help characterize equilibrium pay-offs. The marginal player is the drug maker with the lower reach. In Case 1(cH ≤ min {p̄1, p̄2}), r2 ≤ r1 so long as p̄2 ≥ p̄1, which is true by definition. There-fore, drug maker 2 is marginal in Case 1. In Case 2 (p̄1 < cH ≤ p̄2), drug maker 2 ismarginal if
1− cH1− cL
p̄2 ≥p̄1 − cLcH − cL
1− p̄1
1− cLp̄1 +
1
2
(c2H − p̄2
1)
cH − cL.
This condition may or may not hold, depending on the values of cL, cH , p̄1, p̄2. Wetherefore consider both cases. In Case 2a, the above condition holds, so drug maker2 is marginal. In Case 2b, the above condition does not hold, so drug maker 1 ismarginal. In Cases 1 and 2a, therefore, drug maker 2 is marginal (r2 ≤ r1), and inCase 2b, drug maker 2 is marginal (r2 > r1).
54
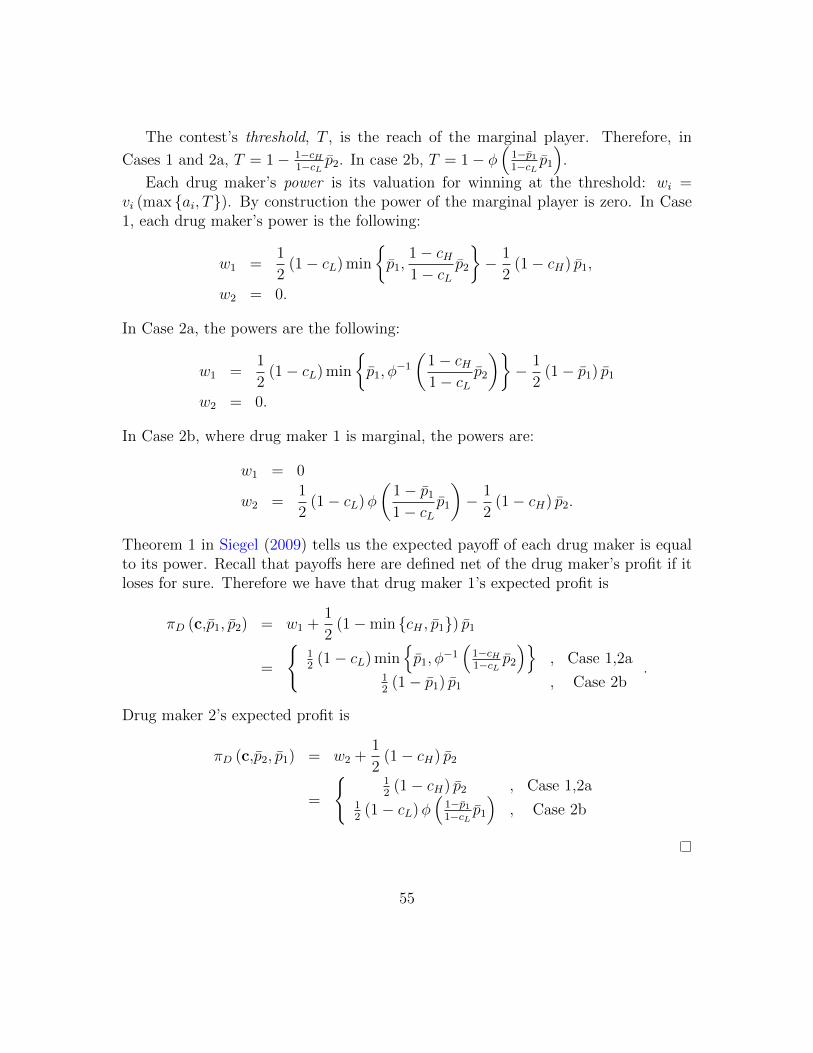
The contest’s threshold, T , is the reach of the marginal player. Therefore, in
Cases 1 and 2a, T = 1− 1−cH1−cL
p̄2. In case 2b, T = 1− φ(
1−p̄1
1−cLp̄1
).
Each drug maker’s power is its valuation for winning at the threshold: wi =vi (max {ai, T}). By construction the power of the marginal player is zero. In Case1, each drug maker’s power is the following:
w1 =1
2(1− cL) min
{p̄1,
1− cH1− cL
p̄2
}− 1
2(1− cH) p̄1,
w2 = 0.
In Case 2a, the powers are the following:
w1 =1
2(1− cL) min
{p̄1, φ
−1
(1− cH1− cL
p̄2
)}− 1
2(1− p̄1) p̄1
w2 = 0.
In Case 2b, where drug maker 1 is marginal, the powers are:
w1 = 0
w2 =1
2(1− cL)φ
(1− p̄1
1− cLp̄1
)− 1
2(1− cH) p̄2.
Theorem 1 in Siegel (2009) tells us the expected payoff of each drug maker is equalto its power. Recall that payoffs here are defined net of the drug maker’s profit if itloses for sure. Therefore we have that drug maker 1’s expected profit is
πD (c,p̄1, p̄2) = w1 +1
2(1−min {cH , p̄1}) p̄1
=
{12
(1− cL) min{p̄1, φ
−1(
1−cH1−cL
p̄2
)}, Case 1,2a
12
(1− p̄1) p̄1 , Case 2b.
Drug maker 2’s expected profit is
πD (c,p̄2, p̄1) = w2 +1
2(1− cH) p̄2
=
{12
(1− cH) p̄2 , Case 1,2a12
(1− cL)φ(
1−p̄1
1−cLp̄1
), Case 2b
55

Figure 1: PBM as Intermediary Between Drug Makers, Payers and Consumers
56
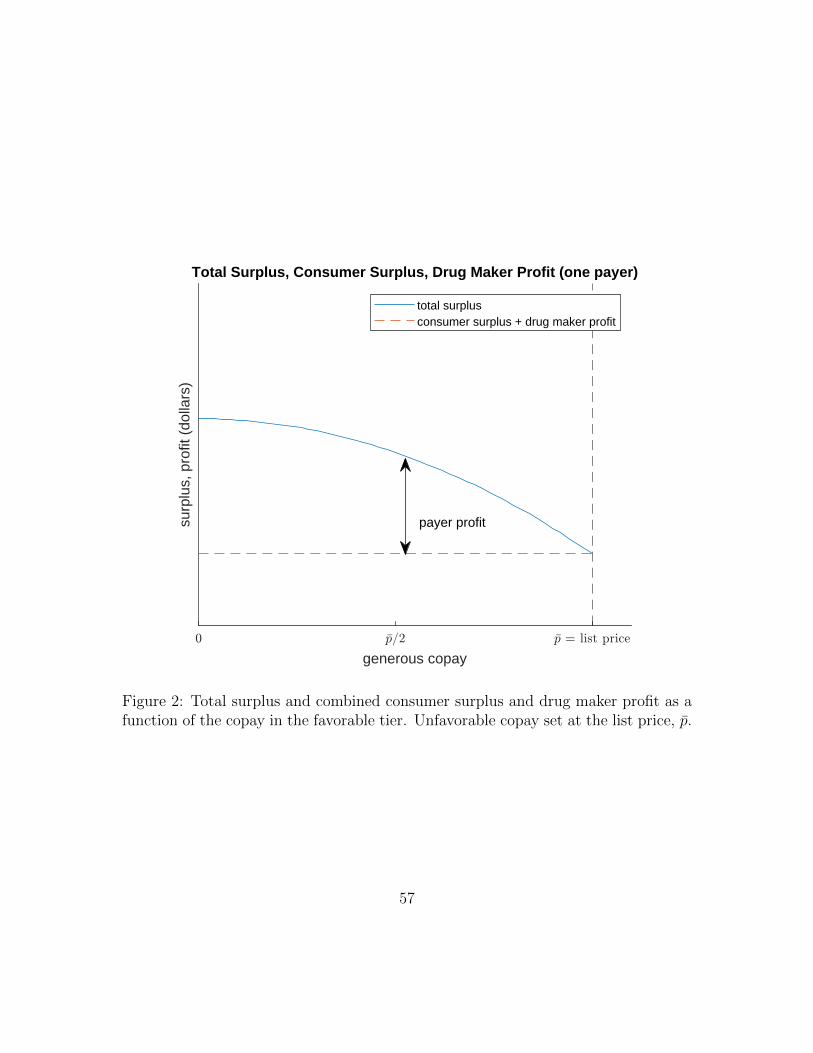
generous copay
surp
lus,
pro
fit (
dolla
rs)
Total Surplus, Consumer Surplus, Drug Maker Profit (one payer)
payer profit
total surplusconsumer surplus + drug maker profit
Figure 2: Total surplus and combined consumer surplus and drug maker profit as afunction of the copay in the favorable tier. Unfavorable copay set at the list price, p̄.
57

own generous copay
surp
lus,
pro
fit (
dolla
rs)
Total Surplus, Consumer Surplus, Profit (two payers)
own profit
other payer's profit
total surplusconsumer surplus + drug maker profitconsumer surplus + drug maker profit + other payer's profit
Figure 3: Total surplus and combined consumer surplus, drug maker profit, and otherpayer’s profit as a function of one payer’s own copay in the generous tier. Copayin the non-generous tier set at the list price, p̄, and other payer’s copay set at theequilibrium value.
58

Figure 4: Best response function for one drug maker’s list price as a function of theother drug maker’s list price.
59