communication and networking techniques for traffic safety
TRANSCRIPT
Linköping Studies in Science and Technology
Dissertation No. 1018
Communication and Networking Techniques for
Traffic Safety Systems
by
Ioan Chisalita
Department of Computer and Information Science
Linköpings universitet
SE-581 83 Linköping, Sweden
Linköping 2006


Abstract
Accident statistics indicate that every year a significant number of casualties and extensive
property losses are recorded due to traffic accidents. Consequently, efforts are directed towards
developing passive and active safety systems that help reduce the severity of crashes, or prevent
vehicles from colliding with one another. To develop these systems, technologies such as sensor
systems, computer vision and vehicular communication have been proposed. Safety vehicular
communication is defined as the exchange of data between vehicles with the goal of providing
in-vehicle safety systems with enough information to permit detection of traffic dangers. Inter-
vehicle communication is a key safety technology, especially as a complement to other
technologies such as radar, as the information it provides cannot be gathered in any other way.
However, due to the specifics of the traffic environment, the design of efficient safety
communication systems poses a series of major technical challenges.
In this thesis we focus on the design and development of a safety communication system that
provides support for active safety systems such as collision warning and collision avoidance.
We begin by providing a method for designing the support system for active safety systems.
Within our study, we investigate different safety aspects of traffic situations. For performing
traffic investigations, we have developed ECAM, a temporal reasoning system for modeling and
analyzing accident scenarios.
Next, we focus on the communication system design. We investigate approaches that can be
applied to implement safety vehicular communication, as well as design aspects of such systems,
including networking techniques and transmission procedures. We then propose a new solution
for vehicular communication in the form of a distributed communication protocol that allows the
vehicles to organize themselves in virtual clusters according to their common interest in traffic
safety. To disseminate the information used for organizing the network and for assessing
dangers in traffic, we develop an anonymous context-based broadcast protocol that requires the
receivers to determine whether they are the intended destination for sent messages based on
knowledge about their current situation in traffic. This communication system is then augmented
with a reactive operation mode, where warnings can be issued and forwarded by vehicles. A
vehicular communication platform that provides an implementation framework for the
communication system, and integrates it within a vehicle, is also proposed. Experiments have
been conducted, under various conditions, to test communication performance and the system’s
ability to reduce accidents. The results indicate that that the proposed communication system is
able to provide a reliable and timely exchange of safety information between vehicles.


i
Acknowledgments
My primary thanks are directed to my supervisor, Professor Nahid Shahmehri, for introducing
me to research work in the area of vehicular communication and giving me the opportunity of
performing the work presented in this thesis. Her support and guidance were always available
and were crucial for the outcome of the work.
Several other persons have contributed to the thesis. I would especially like to thank: Associate
Professor Patrick Lambrix for his valuable comments on the work and discussions on formal
modeling; Dr. Johan Åberg for providing in many occasions comments on the work; Associate
Professor Wlodek Drabent for comments on formal modeling; Brittany Shahmehri, for proof-
reading the thesis. Also, I would like to thank everybody else that helped me during this work.
I would like to thank all my colleagues at IISLAB (Laboratory for Intelligent Information
Systems) not only for their professional help, but also for their support and friendship. In this
respect, I want to mention the other Ph.D. students at IISLAB (during 2000-2006), with whom I
shared the every-day problems of the graduate student life.
Both on professional and non-professional level I would like to thank my family for helping me
get a solid education and for supporting me in many ways and in many occasions. A special
thanks to my wife, Simona, for always being there for me and for her understanding and
support. I would also like to mention my daughter Alexandra, who brightens up my life.
Thanks also to my friends for making life more enjoyable.
The work presented in this thesis has been carried out at IISLAB, Department of Information
and Computer Science (IDA), Linköpings universitet, and was partially financed by ECSEL
(Excellence Center in Computer Science and Systems Engineering in Linköping).
Ioan Chisăliţă (Nanu)
Linköping, Sweden, 2006


i
Contents
1. Introduction..............................................................................................................................1
1.1 Motivation............................................................................................................................................... 1 1.2 Problem description............................................................................................................................... 3 1.3 Contributions.......................................................................................................................................... 4 1.4 Thesis outline.......................................................................................................................................... 5
2. Designing the support system for active safety systems.................................................7
2.1 Active safety systems............................................................................................................................. 7 2.1.1 Background.................................................................................................................................. 7 2.1.2 Technologies for developing active safety systems................................................................ 7 2.1.3 Collaborative active safety systems........................................................................................ 10
2.2 Design method for realizing the support system ............................................................................ 11 2.3 Accident modeling and vehicular communication ......................................................................... 12
2.3.1 ECAM - Event Calculus for Accident Modeling................................................................... 13 2.3.2 ECAM – case study ................................................................................................................... 19 2.3.3 Vehicular communication and ECAM ................................................................................... 28
3. Safety communication system analysis ............................................................................35
3.1 Requirements analysis......................................................................................................................... 35 3.2 Approaches to vehicular communication......................................................................................... 39 3.3 Design components analysis .............................................................................................................. 44
3.3.1 Operation mode of the system ................................................................................................ 45 3.3.2 Networking technique.............................................................................................................. 46 3.3.3 Transmission procedure........................................................................................................... 47
3.4 Selected design features ...................................................................................................................... 48
4. Vehicular communication specifications .........................................................................51
4.1 Overview of networking and communication................................................................................. 51 4.2 Protocol operations .............................................................................................................................. 55 4.3 Network operations and organization .............................................................................................. 57 4.4 Safety information................................................................................................................................ 60
4.4.1 Basic safety messages ............................................................................................................... 61 4.4.2 Warning messages .................................................................................................................... 65 4.4.3 Other messages.......................................................................................................................... 67
4.5 Information forwarding ...................................................................................................................... 67 4.5.1 Forwarding of basic safety messages ..................................................................................... 68 4.5.2 Forwarding of warning messages........................................................................................... 71
4.6 Information filtering and network management............................................................................. 71 4.6.1 Parameters.................................................................................................................................. 72 4.6.2 Decision techniques .................................................................................................................. 74
4.7 An integrated vehicular communication platform.......................................................................... 77 4.7.1 Design principles....................................................................................................................... 77 4.7.2 Vehicular communication platform (VCP)............................................................................ 77

5. Communication evaluation................................................................................................. 85
5.1 Evaluation goals and method............................................................................................................. 85 5.2 Evaluation environment...................................................................................................................... 86 5.3 Metrics and free parameters ............................................................................................................... 87 5.4 Scenarios................................................................................................................................................ 90 5.5 Baseline settings.................................................................................................................................... 96 5.6 Test cases ............................................................................................................................................... 98 5.7 Results presentation and analysis .................................................................................................... 102 5.8 Final remarks ...................................................................................................................................... 142
6. Related work ........................................................................................................................ 145
6.1 Traffic information dissemination ................................................................................................... 145 6.2 Network organization........................................................................................................................ 149 6.3 MAC schemes for vehicular communication ................................................................................. 150 6.4 Direct Short Range Communication (DSRC).................................................................................. 151
7. Concluding remarks ........................................................................................................... 152
7.1 Final remarks ...................................................................................................................................... 152 7.2 Future work......................................................................................................................................... 155
Appendix A: Algorithms for derived parameters ............................................................. 159
List of Figures............................................................................................................................ 163
List of Tables............................................................................................................................. 167
References.................................................................................................................................. 169

1
1. Introduction
This introductory chapter presents the motivation behind our work, the formulation of the
research problems for which we propose solutions, and our contributions. The chapter also
includes an overview of the thesis.
1.1 Motivation1.1 Motivation1.1 Motivation1.1 Motivation
The automobile is arguably one of the most important inventions of the twentieth century
[Jon01]. The development of society has been profoundly influenced by the expansion of the road
system and the resulting increase in freedom of movement. However, it has always been the case
that wherever there are cars, there are traffic accidents. This is not a minor issue: with more than
one million people worldwide dying on the roads every year, and billions of US$ in accident-
related property losses, traffic safety continues to be a serious and difficult problem [Eva04,
CARE04].
The statistics underscore the seriousness of the situation. For instance, although traffic fatalities
in the European Union have consistently gone down over the past ten years (see Figure 1.1),
there were still more than 42.000 fatalities in the European Union alone in 2004. In addition to
loss of life and limb, the financial impact of traffic accidents is enormous: for example, in 2003 the
total of accident-related losses reported in the U.S. was more than $230 billion USD [NCSA03].
0
10000
20000
30000
40000
50000
60000
70000
1995 1997 1999 2001 2003 2005
Year
Fata
litie
s
Figure 1.1 EU fatalities 1995-2004 © European Commission [CARE06]
In an effort to improve traffic safety, extensive investigations into the causes of accidents and
crash countermeasures have been conducted over the course of the last decade [USDT99, Bis00,
Bre00]. Many of these studies identified driver error as the major cause of crashes (i.e. 90%).
Consequently, a great deal of effort has been directed towards helping drivers and reducing
operator error. Work has been done both on improvement of the road infrastructure (e.g. using
roundabouts at crossroads) and integration of support systems into vehicles. Such in-vehicle
systems have great potential for reducing the number of accidents. Thus, research in traffic safety

Chapter 1
2
has indicated that reduction rates up to 70% may be possible for particular types of accidents
[USDT99, AHR01, MH02]. However, accidents vary tremendously in the way they happen, and
developing a system that is efficient in every traffic situation is challenging. For instance, rear-
end accidents are defined as situations when a vehicle strikes the rear end of the vehicle situated
immediately in front of it. Intersection accidents are defined as angle collisions that occur at
crossroads. Lane change accidents are defined as lateral crashes due to the unsafe movement of a
vehicle into an adjacent lane. The algorithms used for detecting the possibility of accident are
usually dependent on the accident type, and so are the actions that are taken when hazards are
detected. Consequently, current prototype systems address only one type of collision, and focus
on the most common accidents (e.g. rear-end).
Two main lines of development have been undertaken for safety systems that can be installed
in vehicles. The first approach addresses the development of passive safety systems that react when
dangerous situations happen, and try to reduce the consequences of inevitable accidents.
Examples of systems that have already proved their efficiency are anti-lock brakes, pre-tensioned
seatbelts, and smart airbags [Bre00, Jon01]. The second approach addresses the development of
active safety systems, which are intended to prevent vehicles from colliding with each other. If this
is not possible due to the specifics of the traffic situation, these systems should at least reduce the
consequences of accidents [Jon01]. For instance, in the case of rear-end collisions, active systems
should at least assure a reduction of the velocity of the vehicle in back at the moment of impact.
Two representative examples of active systems are collision warning and collision avoidance
[ECT99]. These systems notify the driver of potential dangers in traffic, and may employ
automatic actions such as emergency braking or steering on behalf of the driver [Jon02]. The
major difference between passive and active systems lies in the level of support they can provide
to drivers. Thus, passive safety systems are oriented towards protecting the driver when a
dangerous situation is already underway. They are certainly essential for making traffic safer, but
due to their reactive mode of operation they cannot provide a high level of improvement in
traffic safety on their own [Jon01]. Active safety systems take an active role in preventing traffic
situations from developing into accidents. They have the ability to predict the possibility that a
hazard will happen, and thus are able to act well in advance to avoid its occurrence [Jon01].
Two approaches were considered for developing active safety systems. The first approach
addresses the development of autonomous systems that collect and analyze information from the
local environment of a vehicle [AVN00]. These systems usually employ technologies such as
radar (e.g. millimeter-wave or light-based), and machine vision (e.g. video cameras and image
processing) for acquiring information about obstacles situated in front of, next to, and behind a
vehicle [Pie98, Bis00]. One limitation of systems of this type is that this information may not be
accurate enough [KTT+02]. Also, complex traffic situations can require knowledge about vehicles
and obstacles that cannot be detected by sensors integrated into autonomous systems [AVN00].
The second approach is the development of collaborative systems that employ the wireless
exchange of information among vehicles and possibly between vehicles and servers located on
the roadside [AF96]. These systems require the development of vehicular communication networks.
Collaborative systems function similarly to autonomous systems, but they use both data

Introduction
3
collected by sensors and data received via communication from other vehicles when assessing
dangers in traffic. This fusion of information can provide a vehicle with an accurate view of its
current situation in traffic [AF96]. Using communication, collaborative systems allow vehicles to
acquire information that cannot be provided by sensors such as radar. Therefore, these systems
are able to overcome limitations associated with autonomous systems such as their unilateral
perception of the environment that surrounds a vehicle [WH98a, AVN00, KTT+02]. Previous
research has indicated the potential of collaborative active safety systems for improving traffic
safety, e.g. [AF96, WH98a, WH00, Bis00, AVN00, MSN00, AHR01, XHS+02, KTT+02, LO03].
Consequently, vehicular communication is considered one of the key technologies for developing
efficient safety systems.
Systems that provide exchange of safety data among vehicles require specific functionality and
features that are not provided by ordinary communication systems [AF96, WH98b, BV01]. Also,
the adaptation of current communication techniques for supporting traffic safety systems is
considered to be impractical [Win96, Per99, AVN00, MKA+00, MIK01, KBS+01].
Collaborative systems are a promising solution for improving traffic safety. For these systems
to become a reality, communication systems that can provide efficient exchange of safety data
among vehicles must be developed. Therefore, we focus in this thesis on the design of
communication and networking techniques for vehicular safety communication.
1.2 Problem description1.2 Problem description1.2 Problem description1.2 Problem description
Key requirements for safety communication among vehicles are low latency, reliability and high
throughput. In addition, the vehicular environment has properties that pose very specific
requirements on communication. For example, vehicles constantly change their position, travel in
areas with different levels of interference, and can join and exit the traffic in a relatively random
manner. Additionally, vehicles can travel at high speeds and follow well-defined patterns (i.e.
the roads), they usually move with respect to well-defined (traffic) rules, and they perform
maneuvers with regard to maneuvers executed by nearby traffic participants.
Simply providing vehicles with a means of communication and letting them communicate
without supplying a means of organization would not lead to improvements in traffic safety
[CC05]. Such uncoordinated communication cannot fulfill the requirements of safety
applications, and cannot guarantee that vehicles will eventually receive the necessary safety
information. Furthermore, the bandwidth will rapidly be saturated if vehicles frequently send
and relay data in an uncoordinated manner. Even if a number of vehicles receive some data, its
relevance could be low. Even worse, the received information could be misleading, which in turn
might induce unexpected maneuvers and produce accidents. Additionally, due to the properties
of the traffic environment, the communication needs to provide support for highly dynamic
management of the links. Forwarding of information must also be implemented, as vehicles that
are outside each other’s communication range may still need to exchange data. Information
filtering is also necessary, as the receivers may not be aware of which vehicles should provide
Chapter 1
4
them with safety data. Therefore, organizing the vehicular network and the communication is
crucial.
To conclude, network techniques and communication procedures that fulfill the requirements
imposed by the vehicular environment and by traffic safety applications must be developed.
1.3 Contributions1.3 Contributions1.3 Contributions1.3 Contributions
This thesis contributes to the area of vehicular communication and networking for traffic safety
systems. The main issues addressed are presented below:
• How to organize the vehicles into a network and how to manage this network?
• How to transfer safety data in a timely and reliable manner among vehicles?
We address these issues by proposing two techniques for controlling safety communication
among vehicles. First, we propose an organization of vehicles into virtual clusters, which allows
for the definition of manageable groups of vehicles. These clusters are defined and maintained
according to the vehicles’ current interest in traffic safety. Second, we design a context-based
protocol for delivering and forwarding data among vehicles. Within this protocol, the vehicles
broadcast safety data and the receivers are responsible for determining if they are the intended
destination for the data, and if the received data should be forwarded. These operations are
performed based on vehicles’ knowledge about their situation in traffic.
The detailed contributions of this thesis include:
� A method for designing the support system for active safety systems. This contribution
includes a set of analyses and a temporal reasoning system for investigating traffic scenarios. The
set of analyses includes a requirements analysis, an analysis of the applicability of
communication-based safety systems to accident avoidance, an analysis of approaches for
developing safety communication systems, and analyses of components of the communication
system. The reasoning system helps to investigate the time development of traffic scenarios, and
also helps identify requirements for technologies that can be used for avoiding accidents.
� A safety-oriented vehicular communication system. This contribution includes techniques for
organizing and managing the vehicular network, and a proposed communication protocol that
fulfills the requirements imposed by the vehicular environment and traffic safety applications.
Finally, a vehicular communication platform, intended to provide a framework for realizing and
integrating the communication system within a vehicle, is proposed.
� System evaluation under a range of conditions. This contribution includes a dedicated testing
environment consisting of traffic simulators and a network simulator. Comprehensive
investigations of the performance of the communication system, and the system support for
traffic safety systems under various conditions, are presented. The testing environment allows
realistic simulations, both from communication and traffic dynamics points of view.
Parts of the work reported in this thesis have been presented in a number of publications:
[CS02a], [CS02b], [CS02d], [CS04a], [CS04b], [CSL04], [SCA+04] and [Chi04].

Introduction
5
New communication methods have been proposed in [CS06a] and [CS06b]. Considerations
regarding the communication system design and analysis have been addressed in [CS06c] and
[CS06d].
Related research results have been published in [CS02c], [NAM+04] and [SCA06].
1.4 Thesis outline1.4 Thesis outline1.4 Thesis outline1.4 Thesis outline
The rest of the thesis is organized as follows:
Chapter 2 gives an overview of in-vehicle safety systems and presents a method for designing
the support system for safety systems. A reasoning system for modeling and analyzing traffic
scenarios is also introduced here.
Chapter 3 presents analyses of communication systems for exchange of safety data among
vehicles. A requirement analysis and an analysis of design components of safety communication
systems are presented. The design choices that we have made for developing a new system are
also introduced in this chapter.
Chapter 4 provides a description of the techniques proposed for organizing and managing the
vehicular network, and for exchanging safety data between vehicles. An overview of a vehicular
communication platform is also presented.
Chapter 5 presents an evaluation of the proposed communication system. The evaluation goals,
method and settings are first introduced. Further on, evaluation results are presented and
discussed.
Chapter 6 discusses related work in the area of vehicular communication.
Chapter 7 summarizes the work and presents final remarks. This chapter also includes future
research directions.

7
2. Designing the support system for active
safety systems
In this chapter we discuss active safety systems and propose a design method for development of
the support system for vehicular safety systems. We introduce the component elements of this
method and then propose a modeling system for temporal analysis of traffic scenarios.
2.1 Active safety systems 2.1 Active safety systems 2.1 Active safety systems 2.1 Active safety systems
2.1.1 Background2.1.1 Background2.1.1 Background2.1.1 Background
Active safety systems are intended to proactively prevent vehicles from colliding with each other
or with other objects. They collect and analyze information extracted from the environment
surrounding a vehicle to identify dangers in traffic [Bis00, AVN00]. These systems are designed
to provide assistance to the driver for better completion of driving tasks. They also contribute to
the increase of the driver’s situational awareness by providing information about traffic
situations. Active safety systems act towards avoiding accidents by alerting the driver to a
potential danger, and might eventually employ automatic actions such as emergency braking or
steering. An example of early active safety systems is the Adaptive Cruise Control (ACC) system
that uses radar sensors to help drivers maintain a safe distance between vehicles [Jon01]. Active
safety systems can also be connected with passive safety systems. Examples include systems that
offer support to passive systems by anticipating an imminent collision using radar technology.
Based on this data, the passive systems (e.g. seat belt, airbag) can be activated in advance, which
can lead to a reduction of the severity of injuries that the vehicle’s occupants may suffer. An
example of such passive-active system is the Toyota Pre-crash Safety System [Toy02].
The proposals for active safety systems can be categorized according to the type of support
provided to the driver as [Jon02]:
• Information delivery systems: control the content and the presentation of notifications. These
systems present the driver with information that can increase his/her situation awareness and
let the driver take the appropriate measures.
• Automatic control systems: delegate driving tasks to the driver and to the vehicle. These systems
aim at providing more support to the driver by employing automatic actions on the part of the
vehicle. However, attention needs to be given to the transfer of tasks from humans to vehicles,
since unknown problems may arise.
2.1.2 Technologies for developing active safety systems2.1.2 Technologies for developing active safety systems2.1.2 Technologies for developing active safety systems2.1.2 Technologies for developing active safety systems
Many research areas such as sensors, kinematics, positioning, information systems, and
communication networks can contribute to the development of efficient active safety systems.
We discuss in the following three technologies that were considered the most promising for
implementing safety systems: radar and laser sensor systems, computer vision, and
communication systems [Jon01].
Chapter 2
8
Sensor systems
Since the ultimate goal of active safety systems is to keep vehicles from colliding with each other
and with other objects, vehicles can be equipped with devices that can identify the presence of
nearby obstacles. Such devices are usually radar sensors or lidar sensors (i.e. sensors based on
laser) that can detect obstacles that exist around a vehicle and may interfere with its traveling
path [Bre00, Jon01]. Standard radar systems use sensors that send narrow microwave beams that
are reflected by objects and received back by the radar system [Wol95]. Based on this
information, the relative position and speed of other objects can be determined. Lidar systems
use light beams for the same purpose.
The major limitation associated with sensor systems is their local perception [AVN00]. This is
due to the fact that sensor systems usually require a line-of-sight (LOS) for object detection
[MH02]. They cannot detect distant or hidden objects (i.e. objects that are not in the LOS), and
therefore may not be able to provide information about more complex traffic situations.
Several other problems arise with the utilization of sensor systems, both with regard to their
operation modes and the state of the art of the technology. For example, lidar sensors are
considered less appropriate because rain and snow affect their functionality. The accumulation of
dust and mud may even make them unusable [Jon01]. Issues such as cost, sensor integration
within vehicles (i.e. this may require modification of the car body), and regulatory aspects
addressing frequency spectrum also need to be considered when developing sensors for vehicles.
For instance, radar systems on 76 -77 GHz, which were initially used in adaptive cruise control
systems, are currently considered less appropriate due to their high cost. Consequently,
proposals for new radar systems on 24 GHz have been made [IST02]. However, due to their
smaller operation range, radar systems on 24 GHz may not be so effective in cases that require
the detection of more distant obstacles.
Computer vision
Another technology that has been considered for improving traffic safety is computer vision. One
important safety application addresses collision avoidance where vehicles use vision to detect
obstacles such as pedestrians and other vehicles that may interfere with the traveling path of a
vehicle [FH02a]. Another important type of application using computer vision addresses the
monitoring of vehicle movement based on elements characteristic to roads, such as lane markers
[NSG+04, NDM+05]. In these applications, stereo cameras are used to monitor the environment
around a vehicle and image processing is employed to determine the occurrence of dangerous
situations, such as when a vehicle approaches the lateral side of a road unsafely [CAC02]. These
systems then alert the driver to such situations.
However, as with the utilization of sensor systems, limitations related to the local perception of
vehicles (e.g. LOS object detection and monitoring) can also apply to active safety systems based
on computer vision.
We note that computer vision can also be used to monitor driver condition. In such an
application, video cameras analyze the driver by monitoring behavior-related features such as
eye movement. This gives indications about the driver’s capacity for paying attention to road
Designing the support system for active safety systems
9
conditions and successfully fulfilling driving tasks. An application that has received much
attention is the determination of the state of drowsiness of a driver [USDT99, HMS+02].
Vehicular communication systems
Relying on data from local sensors is an inherent weakness of active safety systems based on
sensors and computer vision. Local sensors have limited utility in detecting objects that are not in
the line of sight, such as vehicles entering an intersection [MH02]. One solution to these
limitations is to equip vehicles with communication capabilities, allowing the exchange of traffic
safety information. Using communication, a vehicle can then obtain data about vehicles that are
not detected by sensors (e.g. radar) or by computer vision systems. Consequently, the
information gathering ability of a vehicle is extended. Considering this advantage, it was
predicted that vehicular communication would have a major impact on the development of
active safety systems that could effectively reduce the number and severity of crashes [AF96,
Jon01]. Additionally, it was envisioned that a variety of safety services, such as collision warning,
collision avoidance, or traffic jam notifications could be provided to the driver when vehicles
have communication capabilities [WH98a, AVN00, MSN00, KBS+01, AMF+02].
We note that communication networks for vehicles can be formed only by vehicles, or by
vehicles and servers located on the roadside. Thus, two types of vehicular communication were
defined [MKO00]:
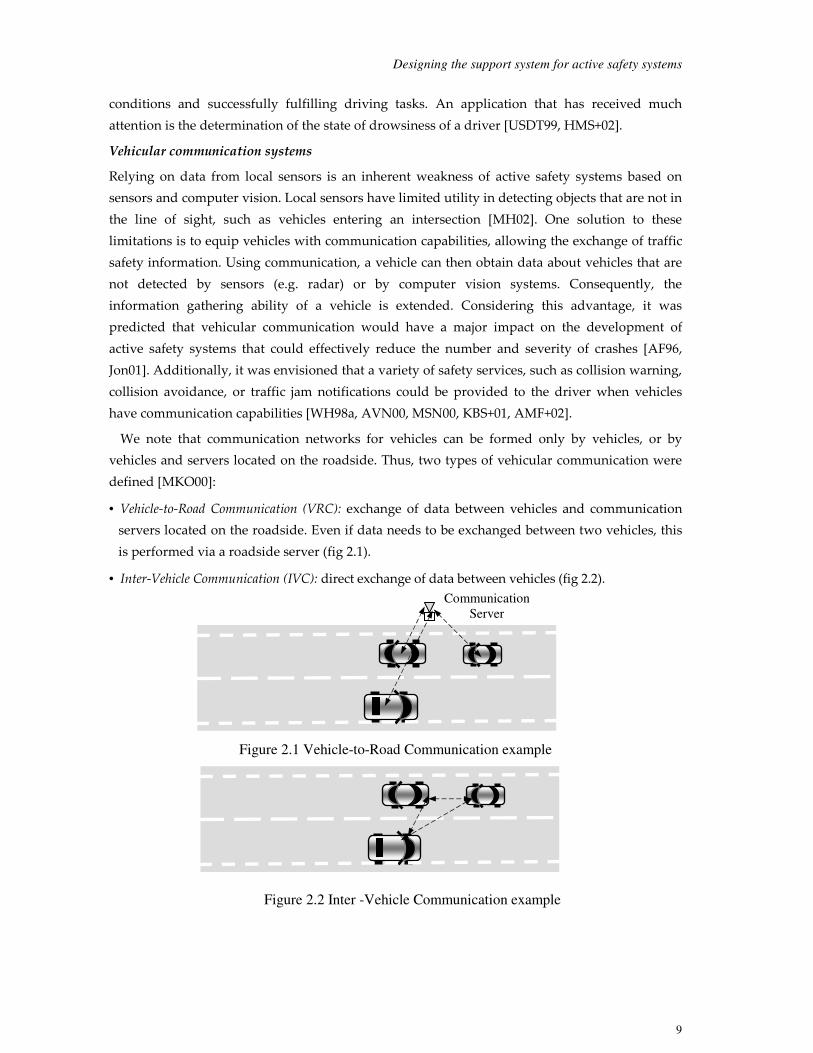
• Vehicle-to-Road Communication (VRC): exchange of data between vehicles and communication
servers located on the roadside. Even if data needs to be exchanged between two vehicles, this
is performed via a roadside server (fig 2.1).
• Inter-Vehicle Communication (IVC): direct exchange of data between vehicles (fig 2.2).
Figure 2.1 Vehicle-to-Road Communication example
Figure 2.2 Inter -Vehicle Communication example
Communication
Server

Chapter 2
10
2.1.3 Collaborative active safety systems 2.1.3 Collaborative active safety systems 2.1.3 Collaborative active safety systems 2.1.3 Collaborative active safety systems
The concept of collaborative safety communication is illustrated in figure 2.3. We use an
example with two vehicles, the concept being similar when more vehicles interact with one
another. The collaborative active safety systems contain a communication system for data
exchange between vehicles, a traffic database (i.e. the Traffic Data component), a knowledge base
for traffic scenarios patterns (i.e. the Traffic Scenario Knowledge component), and a processing
unit.
The communication system is used to exchange safety information such as front-end data
characterizing vehicles (e.g. velocity, position, heading), and data describing the road (e.g.
slipperiness coefficient). This information is registered in the traffic database.
The knowledge base for traffic scenarios contains patterns of potential accidents, which are
used to detect the occurrence of dangerous situations in traffic. This information is quasi-static
and may need to be updated. This can be done statically, e.g. during regular vehicle check-ups,
or dynamically, e.g. using a vehicular communication system.
The processing unit uses the collected data and the traffic knowledge to assess whether threats
might occur in traffic. If a threat is detected, the system can perform actions such as giving a
notification to the driver or initiating an automatic maneuver such as emergency braking [MH02,
KFC+03].
Figure 2.3 Collaborative communication concept
Processing Unit
• Threats Determination
• Actions
Communication system
Traffic
Data
Collaborative active safety system in vehicle A
Communication system Traffic
Data
Traffic
Scenarios
Knowledge
Collaborative active safety system in vehicle B
Data Exchange
Traffic
Scenarios
Knowledge
Processing Unit
• Threats Determination
• Actions

Designing the support system for active safety systems
11
2.2 Design method for realizing the support system 2.2 Design method for realizing the support system 2.2 Design method for realizing the support system 2.2 Design method for realizing the support system
This section introduces a generic design method that we propose to realize the support systems
for active safety systems. This method focuses on the important aspects of supporting a vehicular
safety system, which leads to an in-depth design of the support system. The designer is thus able
to specify the relevant set of requirements, identify appropriate solutions for the system
components, and analyze limitations of the system. In this thesis the method was applied when
designing the communication system that is part of a collaborative safety system.
Figure 2.4 provides a graphic representation of the components that we identified as essential
to analyze, and how the results of the analyses were used.
Figure 2.4 Design method
We analyzed traffic scenarios to determine accident dynamics and identify when dangerous
situations might occur. The accidents patterns that we addressed here are similar to those that
should be recorded in the component Traffic Scenarios Knowledge of collaborative active safety
systems (i.e. in figure 2.3). Requirements on exchange of traffic data (i.e. data registered within
the Traffic Data component) such as delivery latency, information content and size were derived
from these analyses. The spatial and temporal relevance of data were also investigated, e.g. the
set of vehicles that have data of interest for a subject vehicle, or when relevant information needs
to be provided to a vehicle to increase the odds of avoiding a collision. We further investigated
how accidents could be avoided by applying specific actions in traffic, and we also evaluated
whether an active safety system using communication can be used to induce these actions. To
perform these analyses we developed a temporal reasoning system that allows investigation of
the time development of traffic scenarios and the effect of inter-vehicular communication on
accident avoidance. This system is presented in the last section of this chapter.
Requirements analysis
Traffic environment
Traffic scenarios Active safety systems
Analysis of support system
impact on accident avoidance
Support system design
Analysis of approaches for
the support system Design components
analysis

Chapter 2
12
The vehicular environment imposes certain unique constraints on the reliable exchange of
safety information. We defined requirements specific to this environment for data exchange
between vehicles and for network management. Examples of these requirements include
information dissemination latency, service area size, and frequency of providing traffic data.
The next aspect that we focused on was the operation mode of active safety systems. We used
currently proposed systems for defining a general set of requirements and analyzed how they
applied to systems using communication. Generic requirements such as on system availability,
data exchange properties (e.g. reliability, latency) and communication cost were then defined.
We underline that the requirements on vehicular communication derived from our analyses
addressed not only communication performance (e.g. data rate, latency), but also functional
aspects (e.g. service area, system availability), and economic aspects (e.g. operation and
deployment costs). These requirements were used to assess the applicability of current
communication approaches to develop a safety communication system. Systems based on
satellite networks, cellular networks, infotainment infrastructures deployed on the roadside and
systems using direct data exchange were investigated. The requirements were also used to
analyze design components of communication systems such as operation modes, networking
techniques or data transmission procedures. Based on these analyses, we have selected several
features to be integrated within a proposal for a safety communication system.
We note that the proposed design method can help realize other support systems for active
safety systems, e.g. radar systems. In these cases, the analyses need to be changed or extended,
but some of the results presented here can be reused.
In the following, we introduce the reasoning system developed for traffic scenarios analyses.
Details on the other analyses defined within the design method are presented in the following
chapters.
2.3 Accident modeling and vehicular communication2.3 Accident modeling and vehicular communication2.3 Accident modeling and vehicular communication2.3 Accident modeling and vehicular communication
The analysis of accidents helps in identifying elements that affect traffic conditions, the relations
between these elements, and how they may contribute to the occurrence of dangerous situations
[NSS+03]. Based on the results of such analyses, more efficient crash countermeasures can be
developed. Descriptions of accidents are usually provided in the form of official reports
compiled by public safety agencies such as the police. Enhanced versions of such reports, where
the information is reorganized, are provided for research purposes by governmental
organizations such as the U.S. National Highway Transport Administration [USC05]. Such
official reports usually contain detailed descriptions of accidents and include narratives and
sketches of accidents. They also include information about the consequences of crashes in terms
of injuries and property damage. Usually, the reports also include characteristics of the involved
vehicles (e.g. size, airbag status, type of brake) and the description of pre-crash environmental
and driver-related data (e.g. roadway profile, driver distraction). Although these reports are
extensively used for statistically describing traffic aspects, they can be difficult to use for deriving
causal relations that provide indications about how an accident occurred, and what actions can

Designing the support system for active safety systems
13
be taken to avoid it [MST01, USC03]. This method of describing accidents is also static, and
allows only a limited investigation of the patterns related to the dynamics of crashes.
Consequently, there is a need for organizing and dynamically analyzing the information
contained by the above-mentioned reports. Thus, it is necessary to develop a means for
identifying preconditions that describe how a traffic situation develops into an accident
[USDT99, IST02, NSS+03]. It is also important to be able to investigate what data should be
provided to safety systems located in vehicles for these to efficiently act to avoid possible
collisions. Furthermore, it should be possible to investigate when and how this information
should be delivered [KLP+99, TCE+00, PAO01, MH02].
One way to dynamically analyze accidents is the simulation of scenarios using classical traffic
simulators. Examples of simulators that integrate advanced vehicle dynamics and driving
behaviors are presented in [SBH97, RO99, ER01]. However, high-performance simulators are
usually not accessible for public use. Common open-source simulators have several drawbacks
that make their utilization less appealing. First, many of them are difficult to modify and are
resource extensive. Other simulators include algorithms that cannot represent exactly the states
within time-developing situations, such as in specific accidents. For example, some of these
simulators work with fixed time steps for updates (e.g. typically 1-second intervals) [BBA98].
Several event-based simulators are also available for use [BBA98]. However, those that we tried
to employ (e.g. SIMNET and FLEXSIT-II) were dedicated to other types of analyses, and could
not be easily adapted for studying traffic scenarios involving crashes.
Considering the difficulties above, we decided to use formal logic to create an easy-to-use and
efficient reasoning system that can integrate elements given in official reports of accidents. This
system was designed to perform dynamical accident analyses for identifying relationships that
are of particular interest in developing safety systems. The modeling of accidents using a formal
logic also provides the possibility of formal verifications.
2.3.1 ECAM 2.3.1 ECAM 2.3.1 ECAM 2.3.1 ECAM ---- Event Event Event Event Calculus for Accident ModelingCalculus for Accident ModelingCalculus for Accident ModelingCalculus for Accident Modeling
Selected formalism
The sequence of traffic-related events, the relationships between them, and the relationships
between consecutive traffic situations determine if a collision takes place or not. Therefore, a
formal system for modeling traffic scenarios needs to offer the possibility of specifying relations
between traffic situations and actions that occur in traffic (e.g. driving maneuvers). The
formalism used by such a system should then allow temporal reasoning about situations and
changes. It should also allow the representation of preconditions for events to happen, the
specification of when they happen and how they affect a traffic situation. Since events can occur
simultaneously, concurrency should be considered. A formal system for modeling accidents
should also be able to model a wide variety of aspects and conditions related to traffic situations.
Given these requirements, we selected Event Calculus (EC) [KS86, Sha99] as the logic for our
reasoning system. Event Calculus is a logical framework for temporal reasoning about situations,
events, and changes that has the capacity to model event-based systems with time-specific
behavior [CM00, EFD+02]. The time development of traffic situations under certain conditions
Chapter 2
14
can be seen as such a system. Event Calculus allows the easy specification of time relations
between situations and events, which is essential for describing traffic accidents. Furthermore,
the development of accidents is driven by events, and Event Calculus integrates by default the
eventing mechanism. The specification of concurrent actions is also possible. Event Calculus is
also general enough to specify any type of event-based system [CM00].
Event Calculus has been successfully applied for developing systems in diverse applications
areas. An example is the use of Event Calculus for specifying a patient monitoring system
[CMD+94]. Systems for defining policies for adaptive mobile communication systems [EFD+02],
and systems for policy analyses were also proposed [BLR03]. Event Calculus was also used for
system description and control [CM00, CBC01]. However, the systems presented in these works
were strongly dependent on the specific application area. For instance, the system in [CM00]
describes the operation of a gas heater by modeling its components and possible states (e.g.
lighter, warm up state). Consequently, we could not adapt previous systems for modeling
accidents.
Other logical formalisms can be considered for developing systems similar to the one proposed
by us. An example is the Situation Calculus that allows reasoning about actions and their effects
on the world [RN95, PR99b]. However, this formalism specifies a sequential occurrence of actions
and does not allow the specification of the moment when an action takes place or the
specification of the development of a situation under concurrent actions [McC02]. In the
development of a collision, the time when a certain event occurred is important. Also, numerous
events may take place at the same time. Therefore, formalisms such as Situation Calculus did not
serve our purpose well enough. The logic framework of Features and Fluents, proposed in
[San94] could also be the basis for constructing a system for modeling and analyzing accident
scenarios. For instance, such a system may be constructed using the Fluent Calculus [Bra98] that
was developed using the above-mentioned framework. The formalism specified in the Features
and Fluents framework is similar in many aspects to Event Calculus [Bra98, Sha99]. However, it
provides a representation of continuous changes that is more complex than in Event Calculus
[Sha95]. Since we aimed at constructing an easy-to-use system for modeling and analyzing
accident scenarios, we decided to base the development of the system on Event Calculus. The use
of a formalism based on the Features and Fluents framework can be subject to future
investigations.
Event Calculus entities
We introduce below the entities defined within the specifications of Event Calculus (based on
[Sha99]):
• Events: actions that occur at a moment in time or during a time interval.
• Fluents: entities that modify their state as the result of the occurrence of actions. Examples are
the value of a quantity such as the velocity of a vehicle, or a proposition such as “vehicle x is
braking”. The modification of the state of a fluent is due to events. Thus, a fluent has time
duration and is initiated and terminated by events. A fluent holds when it is true (e.g. a

Designing the support system for active safety systems
15
proposition is correct). A fluent does not hold at the time the event that initiates it happens, but
holds at the time the event that terminates it happens.
• Predicates: entities that specify when events take place or indicate the state of fluents at different
time points. Event Calculus provides a basic set of predicates and allows the definition of new
predicates.
• Constraints (state constraints, effect constraints, and causal constraints): entities that define, using
predicates, diverse relations between fluents, and between fluents and events. For example, the
occurrence of two events at the same time that determines a modification of the state of a fluent
can be described using constraints.
ECAM – a modeling system based on Event Calculus
The reasoning system
The reasoning system that we propose for describing and analyzing traffic scenarios provides an
Event Calculus-based logical framework for time-developing situations. The set of predicates
and domain independent axioms provided by Event Calculus that we used in our work are
presented in figure 2.5. Throughout this chapter, we use ∧∧∧∧, ∨∨∨∨, ¬¬¬¬ for And, Or and Negation.
Notations such as =, <, >, +, -, * and / denote equality, inequality, and calculus relations.
Figure 2.5 ECAM - Predicates and Axioms
We should mention that the original specifications of Event Calculus (e.g. [KS86]) are able to
provide only a discrete representation of changes. Therefore, in our work we have used the
extension of Event Calculus proposed by Shanahan [Sha90, Sha99]. This provides the possibility
of representing not only discrete, but also continuous changes, such as the variation of the speed
of a vehicle. Thus, in our approach the varying entities (e.g. speed, acceleration, distances) take
values from a one-dimensional quantity space (e.g. speed can take values from 0 to 200 km/h),
and they are quantitatively represented when modeling traffic scenarios.
Predicates:
• InitiallyP(f) – fluent f holds from time 0 (i.e. the initial moment).
• Happens (e ,t) – event e occurs at time t.
• Initiates (e, f, t) – fluent f is initiated by event e at time t and starts to hold immediately after t.
• Terminates (e, f, t) – fluent f is terminated at time t by event e and ceases to hold immediately after t.
• t1<t2 – time point t1 is before time point t2 (temporal order).
• HoldsAt (f, t) – fluent f holds at time t.
• Clipped (t1,f,t2) – fluent f is terminated at some time t between times t1 and t2, where t1<t<t2.
• Trajectory (f1,t1,f2,dt) – if fluent f1 is initiated at time t1, then fluent f2 becomes true at time t1+dt.
Axioms:
• HoldsAt (f, t1) <- InitiallyP(f) ∧ ¬Clipped (0, f, t1).
• HoldsAt (f, t2) <- Happens (e, t1) ∧ Initiates(e, f, t1) ∧t1<t2 ∧ ¬Clipped (t1, f, t2).
• HoldsAt (f2, t2) <- Happens(e, t1) ∧ Initiates(e, f1, t1) ∧ t1 < t2 ∧ t2 = t1 + d ∧ Trajectory (f1, t1, f2,
d) ∧ ¬ Clipped (t1, f1, t2).
• Clipped (t1, f, t2) <- Happens(e, t) ∧ t1<t<t2 ∧ Terminates(e,f, t).

Chapter 2
16
The system that we developed is called ECAM, which stands for Event Calculus for Accident
Modeling. This reasoning system inherits the properties presented by Event Calculus and
provides a convenient way of analyzing a wide variety of elements from traffic scenarios. By
using Event Calculus, ECAM is able to represent the relations between different elements of a
traffic scenario, and is able to model the changes that take place when events happen in a traffic
situation. Also, ECAM is able to accommodate the description of various accident types. Event
Calculus allows the determination of the validity of fluents, the determination of the occurrence
of events, and the determination of the moments in time when events occurred [Sha99, EFD+02].
Consequently, ECAM can be used to determine if certain traffic conditions related to vehicles
involved in a traffic scenario are valid at some moments in time. ECAM can be also used to
determine whether and when certain events occurred within the development of a scenario. For
example, it can be determined if a collision between two vehicles took place and when the crash
occurred. ECAM can be used to investigate the impact of certain actions on the development of
scenario. For instance, it can be examined whether an action (e.g. braking) can lead to the
avoidance of an accident, and when such action needs to take place. We present below the
conceptual model of ECAM and an overview of a logic programming implementation of the
system. In the following sections, we illustrate the utilization of the system for modeling and
analyzing accident scenarios. ECAM is represented in figure 2.6 and contains three components:
• Knowledge Base for Event Calculus (KBEC): contains the elements that describe the Event
Calculus formalism and its logic. These are the concepts of events, fluents, predicates, and
constraints, the basic set of predicates and the domain independent axioms.
• World Representation (WR): contains the fluents and events used for describing the time
development of the scenario under consideration. It also contains the constraints that define
specific relations between fluents and events.
• Temporal Evolution of the Scenario (TES): contains the initial status (i.e. at the moment the
scenario begins) of various fluents encoded using InitiallyP predicates. It also contains the time-
ordered sequence of explicit events in the scenario (i.e. events with the exact moment of
occurrence specified beforehand), encoded using Happens predicates.
Figure 2.6 Conceptual architecture of the ECAM system
The initial description of traffic scenarios is usually given using natural language. We provide
below a step-based method for modeling the development of such scenarios using ECAM:
Step 1. Complete the initial description of the scenario with elements needed for dynamic
modeling. For instance, the kinematic equations used for describing the movement of
vehicles, or specific assumptions such as the driver reaction time, need to be specified.
Knowledge Base for Event Calculus (KBEC)
World Representation (WR)
Temporal Evolution of the Scenario (TES)

Designing the support system for active safety systems
17
Step 2. Translate the scenario description into ECAM elements. This implies the definition of
fluents and events of importance for describing the scenario and for performing analyses.
Step 3. Define the initiation and termination map of fluents, i.e. define which events start and
terminate which fluents.
Step 4. Define constraints describing specific relations between events and fluents.
Step 5. Define the narrative of the scenario in terms of initial conditions and the time-ordered
sequence of explicit events.
Step 6. Create an implementation of the model and perform analyses of interest.
An overview of a logic programming implementation of ECAM
We present below an overview of a Prolog [Bra01] implementation of the ECAM system. We
implemented ECAM using Prolog because this language constitutes a flexible programming
framework that allows the easy specification of relations between objects. Prolog also integrates a
powerful reasoning mechanism about such relations. We note that most of the other
programming languages (e.g. C) do not provide such a mechanism, which needs to be developed
if such languages are used for implementing ECAM. Moreover, Prolog provides a highly
expressive declarative style of programming, which is an advantage for representing the
relations between the component elements of traffic scenarios.
We note that for modeling accident scenarios we considered that all the required information is
present in the system and no intervention from the outside world is possible (i.e. closed world
assumption). Thus, if the validity of an entity in the model (e.g. a fluent) could not be proven, it
was considered not to hold. We should mention that we were interested in when conditions
related to traffic, such as if a vehicle is braking or the value of the speed of a vehicle, are valid at
different points in time.
The Event Calculus predicates were represented as Prolog predicates. Within this
implementation, we kept the original Event Calculus predicates with the exception of the Initiates
and Terminates predicates. These were encoded as Init and Initiate and respectively Term and
Terminate (i.e. as proposed in [CM00]), where the events, fluents and time moments were
separated. This separation simplifies the definition of the relations between fluents and the
events that initiate and terminate them. The fluents and events used for describing traffic
scenarios were represented as Prolog data objects. The set of Prolog predicates that we used in
our implementation is presented in Figure 2.7. The Prolog predicates holdsAt, initiate, terminate,
and clipped were defined in a common way as presented in Figure 2.8. Predicates such as happens
and initiallyP were used to implement the time development of the scenario under consideration.
We note that predicates such as trajectory or holdsAt may be subject to specific definitions for
certain fluents and events in different scenarios. These additional definitions are needed to
implement the constraints that define specific relations between fluents and events within the
modeling of the scenario. New predicates may be also needed to implement aspects related to a
scenario. Such additional predicates are usually support functions used for various calculations
(e.g. speed of vehicles, distance between vehicles, various timers).
Chapter 2
18
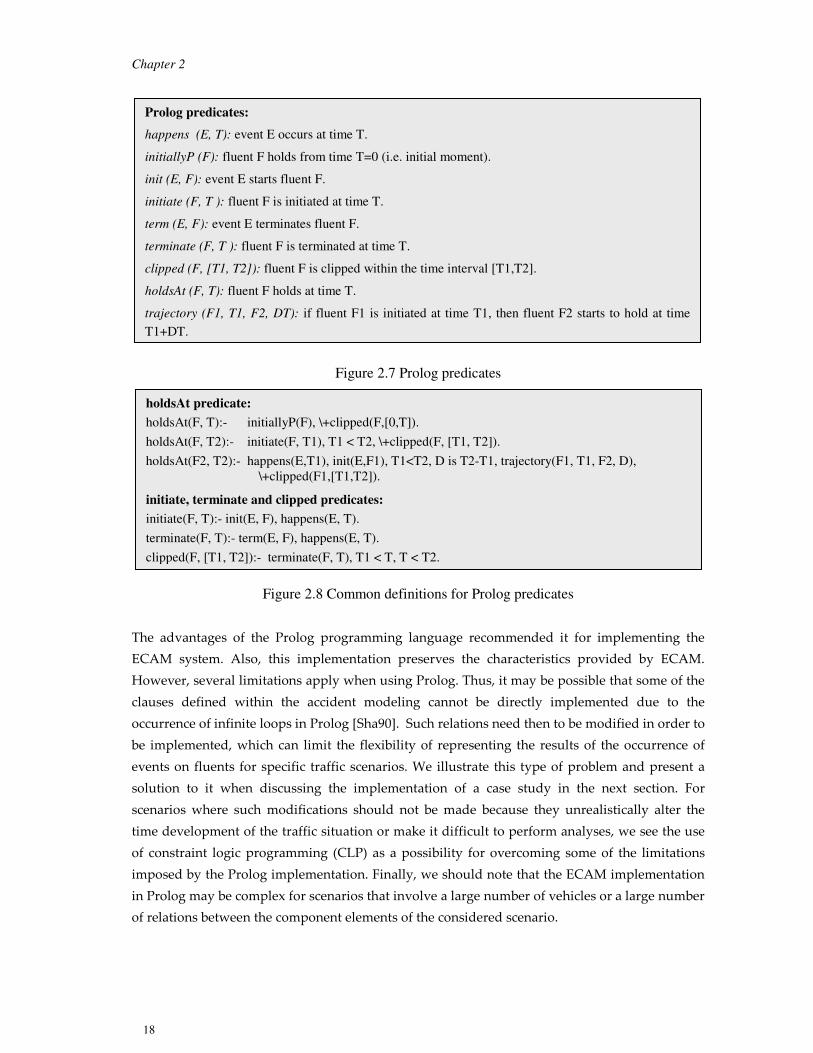
Figure 2.7 Prolog predicates
Figure 2.8 Common definitions for Prolog predicates
The advantages of the Prolog programming language recommended it for implementing the
ECAM system. Also, this implementation preserves the characteristics provided by ECAM.
However, several limitations apply when using Prolog. Thus, it may be possible that some of the
clauses defined within the accident modeling cannot be directly implemented due to the
occurrence of infinite loops in Prolog [Sha90]. Such relations need then to be modified in order to
be implemented, which can limit the flexibility of representing the results of the occurrence of
events on fluents for specific traffic scenarios. We illustrate this type of problem and present a
solution to it when discussing the implementation of a case study in the next section. For
scenarios where such modifications should not be made because they unrealistically alter the
time development of the traffic situation or make it difficult to perform analyses, we see the use
of constraint logic programming (CLP) as a possibility for overcoming some of the limitations
imposed by the Prolog implementation. Finally, we should note that the ECAM implementation
in Prolog may be complex for scenarios that involve a large number of vehicles or a large number
of relations between the component elements of the considered scenario.
Prolog predicates:
happens (E, T): event E occurs at time T.
initiallyP (F): fluent F holds from time T=0 (i.e. initial moment).
init (E, F): event E starts fluent F.
initiate (F, T ): fluent F is initiated at time T.
term (E, F): event E terminates fluent F.
terminate (F, T ): fluent F is terminated at time T.
clipped (F, [T1, T2]): fluent F is clipped within the time interval [T1,T2].
holdsAt (F, T): fluent F holds at time T.
trajectory (F1, T1, F2, DT): if fluent F1 is initiated at time T1, then fluent F2 starts to hold at time
T1+DT.
holdsAt predicate:
holdsAt(F, T):- initiallyP(F), \+clipped(F,[0,T]).
holdsAt(F, T2):- initiate(F, T1), T1 < T2, \+clipped(F, [T1, T2]).
holdsAt(F2, T2):- happens(E,T1), init(E,F1), T1<T2, D is T2-T1, trajectory(F1, T1, F2, D),
\+clipped(F1,[T1,T2]).
initiate, terminate and clipped predicates:
initiate(F, T):- init(E, F), happens(E, T).
terminate(F, T):- term(E, F), happens(E, T).
clipped(F, [T1, T2]):- terminate(F, T), T1 < T, T < T2.
Designing the support system for active safety systems
19
2.3.2 ECAM 2.3.2 ECAM 2.3.2 ECAM 2.3.2 ECAM –––– case study case study case study case study
We have modeled and analyzed various accident scenarios using the ECAM system. These
scenarios were selected from the most representative types of accidents, i.e. the accidents that
appear most frequently in traffic (e.g. [USDT99, SITC01]). These types of accidents were:
• Rear-end accidents, e.g. crashes implying a vehicle driven by an inattentive or distracted driver that strikes the rear end of another vehicle.
• Intersection accidents, e.g. angle crashes at cross-roads due to vehicles that run “stop” or “give way” signs.
• Lane change accidents, e.g. crashes due to a change lane maneuver executed by a vehicle that does not notice the presence of another vehicle in the lane it moves into.
When modeling accidents with ECAM we used the descriptions of collisions given in research
addressing crash analyses (e.g. [KLP+99, NSS01, MH02, SSN03, KCF+03]). We illustrate in the
following the development of the ECAM system by the use of an example. Thus, we model and
analyze a rear-end accident scenario.
View obstruction followed by tailgate scenario (VOTS)
VOTS - Scenario Description (Step 1)
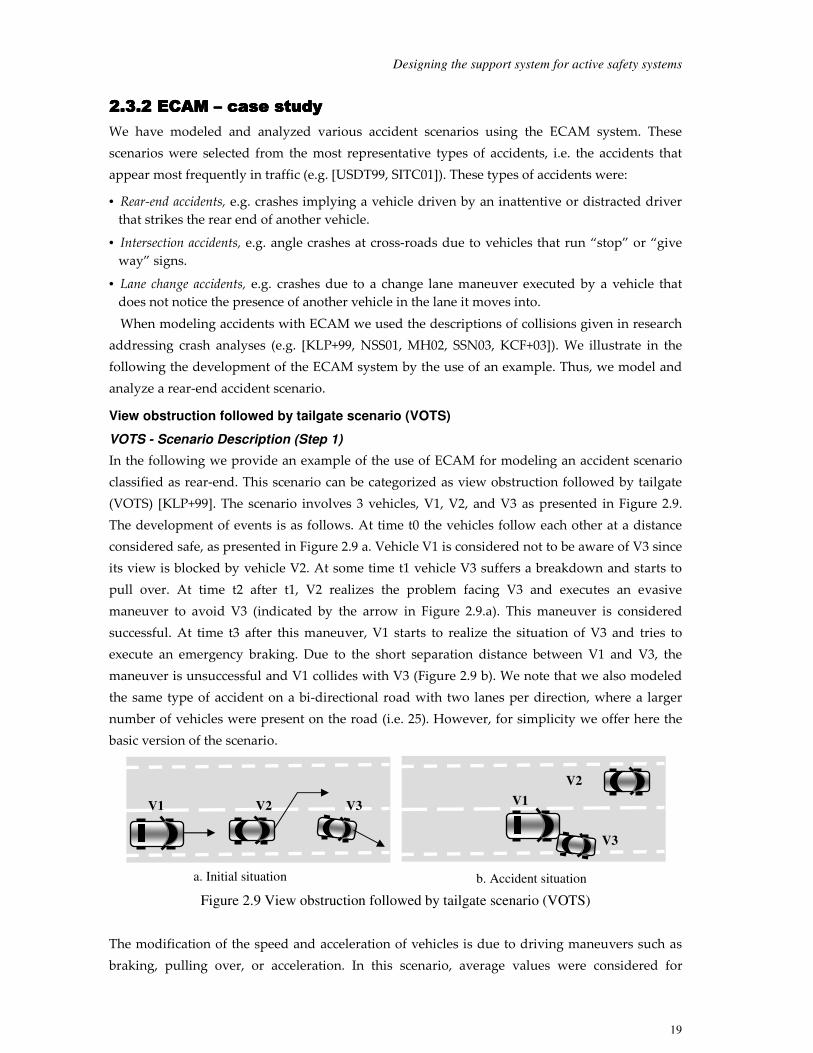
In the following we provide an example of the use of ECAM for modeling an accident scenario
classified as rear-end. This scenario can be categorized as view obstruction followed by tailgate
(VOTS) [KLP+99]. The scenario involves 3 vehicles, V1, V2, and V3 as presented in Figure 2.9.
The development of events is as follows. At time t0 the vehicles follow each other at a distance
considered safe, as presented in Figure 2.9 a. Vehicle V1 is considered not to be aware of V3 since
its view is blocked by vehicle V2. At some time t1 vehicle V3 suffers a breakdown and starts to
pull over. At time t2 after t1, V2 realizes the problem facing V3 and executes an evasive
maneuver to avoid V3 (indicated by the arrow in Figure 2.9.a). This maneuver is considered
successful. At time t3 after this maneuver, V1 starts to realize the situation of V3 and tries to
execute an emergency braking. Due to the short separation distance between V1 and V3, the
maneuver is unsuccessful and V1 collides with V3 (Figure 2.9 b). We note that we also modeled
the same type of accident on a bi-directional road with two lanes per direction, where a larger
number of vehicles were present on the road (i.e. 25). However, for simplicity we offer here the
basic version of the scenario.
Figure 2.9 View obstruction followed by tailgate scenario (VOTS)
The modification of the speed and acceleration of vehicles is due to driving maneuvers such as
braking, pulling over, or acceleration. In this scenario, average values were considered for
b. Accident situation a. Initial situation
V1
V2
V3
V1 V2 V3

Chapter 2
20
acceleration between events that determined significant modifications. The motion equations that
define the movement of the vehicles are presented below. In all formulas, the distance is
expressed in [m], the speed in [m/s] and the acceleration and deceleration in [m/s2]. Negative
values were used for deceleration.
We considered that the separation distance between two vehicles x and y, when x follows y, is
safe when it is higher than a threshold R calculated based on the characteristics of the two
vehicles [KCF+03]. Thus, R is calculated as the sum of the delay time range (DTR) and the
braking on set range (BOR) as presented below (adapted from [KCF+03]).
[ECS1.0] R= DTR + BOR. DTR and BOR are calculated as:
DTR = (Vx-Vy)*t_delay+0.5*(Ax-Ay)*t_delay2
BOR =2 (Vxp-Vyp)
-2*(Axr-Ayr)
In the equations above, Vx and Vy are the speed values, and Ax and Ay are the acceleration or
deceleration values of vehicles x and y. The time interval t_delay is the sum of the reaction time of
the driver and the braking systems lag. The reaction time of the driver is the interval between the
moment the driver notices an event in traffic and the moment the driver acts accordingly. The
braking system lag is the time between the application of the brake (pedal) and the application of
the brakes (shoes) on the wheel. Vxp and Vyp are the predicted velocity values for vehicles x and
y after the delay time t_delay has passed. Ayr is the deceleration of y and Axr is an approximation
of the expected deceleration of x. We note that within the modeling of the scenario we calculated
the predicted safe distance when the reaction delay time has passed (i.e. DTR is null), and we
used a value of -9 m/s2 for the emergency braking deceleration of a vehicle (i.e. Axr).
The calculations of speed values and separation distance between two vehicles are based on
classical kinematic equations (e.g. [Phy03]). Thus, for a vehicle traveling with a constant
acceleration A between time points t1 and t2, the speed at t2 is calculated as:
[ECS1.1] V2 = V1+ A*(t2-t1),
V1 and V2 are the speed values of the vehicle at times t1 and t2 respectively. If the distance
between two vehicles x and y at time t1 is D1 and x is traveling with acceleration Ax and y with
acceleration Ay between t1 and t2, then at time t2 the distance between x and y is:
[ECS1.2] D2 = D1 – AuxDx + AuxDy, where AuxDx = (Vx*DT)+0.5*(DT2*Ax) and AuxDy =
(Vy*DT)+0.5*(DT2*Ay) with DT =t2-t1.
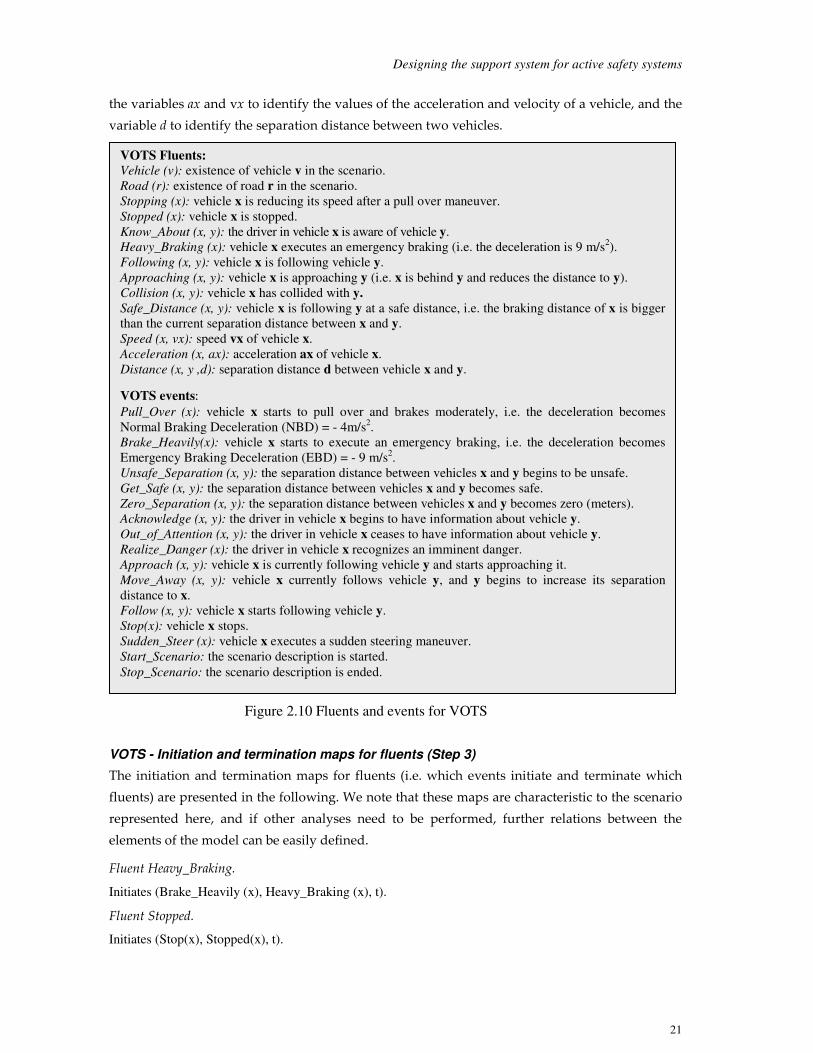
VOTS - ECAM fluents and events (Step 2)
The set of fluents and events used for modeling the VOTS scenario is presented in Figure 2.10.
We note that this set was also intended to provide the possibility of modeling other rear-end
accidents related to VOTS. In our definitions, we used the constants NBD for Normal Braking
Deceleration (i.e. - 4 m/s2) and EBD for Emergency Braking Deceleration (i.e. -9 m/s2). We used
Designing the support system for active safety systems
21
the variables ax and vx to identify the values of the acceleration and velocity of a vehicle, and the
variable d to identify the separation distance between two vehicles.
Figure 2.10 Fluents and events for VOTS
VOTS - Initiation and termination maps for fluents (Step 3)
The initiation and termination maps for fluents (i.e. which events initiate and terminate which
fluents) are presented in the following. We note that these maps are characteristic to the scenario
represented here, and if other analyses need to be performed, further relations between the
elements of the model can be easily defined.
Fluent Heavy_Braking.
Initiates (Brake_Heavily (x), Heavy_Braking (x), t).
Fluent Stopped.
Initiates (Stop(x), Stopped(x), t).
VOTS Fluents:
Vehicle (v): existence of vehicle v in the scenario.
Road (r): existence of road r in the scenario.
Stopping (x): vehicle x is reducing its speed after a pull over maneuver.
Stopped (x): vehicle x is stopped.
Know_About (x, y): the driver in vehicle x is aware of vehicle y.
Heavy_Braking (x): vehicle x executes an emergency braking (i.e. the deceleration is 9 m/s2).
Following (x, y): vehicle x is following vehicle y.
Approaching (x, y): vehicle x is approaching y (i.e. x is behind y and reduces the distance to y).
Collision (x, y): vehicle x has collided with y.
Safe_Distance (x, y): vehicle x is following y at a safe distance, i.e. the braking distance of x is bigger
than the current separation distance between x and y.
Speed (x, vx): speed vx of vehicle x.
Acceleration (x, ax): acceleration ax of vehicle x.
Distance (x, y ,d): separation distance d between vehicle x and y.
VOTS events: Pull_Over (x): vehicle x starts to pull over and brakes moderately, i.e. the deceleration becomes
Normal Braking Deceleration (NBD) = - 4m/s2.
Brake_Heavily(x): vehicle x starts to execute an emergency braking, i.e. the deceleration becomes
Emergency Braking Deceleration (EBD) = - 9 m/s2.
Unsafe_Separation (x, y): the separation distance between vehicles x and y begins to be unsafe.
Get_Safe (x, y): the separation distance between vehicles x and y becomes safe.
Zero_Separation (x, y): the separation distance between vehicles x and y becomes zero (meters).
Acknowledge (x, y): the driver in vehicle x begins to have information about vehicle y.
Out_of_Attention (x, y): the driver in vehicle x ceases to have information about vehicle y.
Realize_Danger (x): the driver in vehicle x recognizes an imminent danger.
Approach (x, y): vehicle x is currently following vehicle y and starts approaching it.
Move_Away (x, y): vehicle x currently follows vehicle y, and y begins to increase its separation
distance to x.
Follow (x, y): vehicle x starts following vehicle y.
Stop(x): vehicle x stops.
Sudden_Steer (x): vehicle x executes a sudden steering maneuver.
Start_Scenario: the scenario description is started.
Stop_Scenario: the scenario description is ended.

Chapter 2
22
Fluent Stopping.
Initiates (Pull_Over (x), Stopping (x), t).
Fluent Approaching.
Initiates (Approach (x, y), Approaching (x, y), t).
Terminates (Move_Away (x, y), Approaching(x,y), t).
Fluent Know_About.
Initiates (Acknowledge (x, y), Know_About (x, y), t).
Terminates (Out_of_Attention (x, y), Know_About (x, y), t).
Fluent Safe_Distance.
Initiates (Get_Safe (x, y), Safe_Distance (x, y), t).
Terminates (Unsafe_Separation (x, y), Safe_Distance (x, y), t).
Fluent Collision.
Initiates (Zero_Separation (x, y), Collision (x, y), t).
Fluent Following.
Initiates (Follow (x, y), Following (x, y), t).
Terminates (Sudden_Steer (x), Following (x, y), t).
Terminates (Sudden_Steer (y), Following (x, y), t).
Several conditional clauses for events to terminate fluents have been also defined:
Terminates (Sudden_Steer (x), Distance (x, y, d), t) <- HoldsAt(Distance(x,y,d), t) ∧ HoldsAt (Following
(x, y), t) ∧ Happens(Sudden_Steer(x), t).
Terminates (Sudden_Steer (y), Distance (x, y, d), t) <- HoldsAt(Distance(x,y,d), t) ∧ HoldsAt (Following
(x, y), t) ∧ Happens(Sudden_Steer(y), t).
Terminates (Brake_Heavily (x), Acceleration (x, ax), t) <- HoldsAt(Acceleration(x, ax), t) ∧ ax≠EBD ∧
Happens(Brake_Heavily(x), t).
VOTS - Constraints (Step 4)
Derived Happens and HoldsAt directives
For derived events, we needed to determine the moment when they occurred. We performed the
identification of such time moments using the fluents that are initiated by the corresponding
events. As a fluent does not hold at the time when the event that initiates it happened, but
immediately after, we used a time deviation ∆t to differentiate between these two moments (i.e. a
fluent does not hold at time t-∆t but starts to hold at time t).
• Event Approach and fluent Approaching.
Happens (Approach (x, y), t) <- HoldsAt (Following (x, y), t) ∧ HoldsAt (Speed (x, Vx), t) ∧ HoldsAt
(Speed (y, Vy), t) ∧ (Vx > Vy) ∧ ¬ HoldsAt (Approaching (x, y), t-∆t).
HoldsAt (Approaching (x, y), t) <- HoldsAt (Following (x, y), t) ∧ HoldsAt (Speed (x, Vx), t) ∧ HoldsAt
(Speed (y, Vy), t) ∧ (Vx > Vy).
• Event Unsafe_Separation and fluent Safe_Distance.
Designing the support system for active safety systems
23
Happens (Unsafe_Separation (x, y), t) <- HoldsAt (Distance (x, y, D), t) ∧ HoldsAt (Speed (x, Vx), t) ∧
HoldsAt (Speed (y, Vy), t) ∧ HoldsAt (Acceleration (y, Ay), t) ∧ D ≤ (Vx-Vy)2 / ( -2 * (EBD-Ay)) ∧
HoldsAt (Safe_Distance (x, y),t-∆t).
HoldsAt (Safe_Distance (x, y), t) <- HoldsAt (Distance (x, y, D), t) ∧ HoldsAt (Speed (x, Vx), t) ∧
HoldsAt (Speed (y, Vy), t) ∧ HoldsAt (Acceleration (y, Ay), t) ∧ D > (Vx-Vy)2 / (-2* (EBD-Ay)). We
note that the above comparisons for distance are based on ECS1.0.
• Event Zero_Separation and fluent Collision.
Happens (Zero_Separation (x, y), t) <- HoldsAt (Following (x, y), t) ∧ HoldsAt (Distance (x, y, 0), t ) ∧ ¬
HoldsAt (Collision (x, y), t-∆t).
HoldsAt (Collision (x, y), t) <- HoldsAt (Following (x, y), t) ∧ HoldsAt (Distance (x, y, 0), t).
• Event Stop(x) and fluent Stopped(x) for stationary vehicle.
Happens(Stop(x),t) <- Happens (Brake_Heavily(x),t1) ∧ t1<t ∧ HoldsAt(Speed(x,vx),t) ∧ vx=0 ∧
¬HoldsAt(Stopped(x),t-∆t).
HoldsAt (Stopped (x),t) <- HoldsAt (Speed (x, 0), t).
We also defined several additional constraints:
• Event Brake_Heavily and event Realize_Danger.
Happens(Brake_Heavily), t) <- Happens(Realize_Danger(x), t).
• Derived event Follow - initially vehicle x follows y and y follows z and y starts executing a
steering maneuver for changing lanes.
Happens (Follow (x, z), t) <- HoldsAt (Following (x, y), t) ∧ HoldsAt (Following (y, z), t) ∧ Happens
(Sudden_Steer (y), t).
• Derived fluent Distance - vehicle x follows vehicle y and y follows vehicle z.
HoldsAt (Distance (x, z, d), t) <- HoldsAt (Following (x, y), t) ∧ HoldsAt (Following (y, z), t) ∧ HoldsAt
(Distance (x, y, d1), t) ∧ HoldsAt (Distance (y, z, d2), t) ∧ d = d 1+ d 2.
• Additional Acceleration definitions - stationary vehicle, stopping vehicle and vehicle in heavy
braking. The acceleration of a vehicle is considered 0 m/s2 at all time moments exactly after the
moment when the vehicle came to a full stop. We recall that NBD stands for normal braking
deceleration and EBD for emergency braking deceleration.
HoldsAt (Acceleration (x, 0), t) <- HoldsAt (Speed (x, 0),t) ∧ HoldsAt (Stopped (x), t).
HoldsAt (Acceleration (x, NBD), t) <- HoldsAt(Stopping (x), t) ∧ ¬ HoldsAt (Stopped (x), t).
HoldsAt (Acceleration (x, EBD), t) <- HoldsAt (Heavy_Braking (x), t).
Trajectory definitions
We present below the Trajectory definitions that we introduced in our model and the HoldsAt
definitions determined by them. These were used for modeling the speed of vehicles and the
distance between vehicles.
• Fluent Distance assessed in relation with Following.
HoldsAt (Distance (x, y, d2), t2) <- Happens (Follow (x, y), t1) ∧ (t1<t2) ∧ (dt = t2 – t1) ∧ Trajectory
(Following (x, y), t1, Distance (x, y, d2), dt) ∧ ¬ Clipped (t1,Following (x, y), t2).
Trajectory (Following (x, y), t1, Distance (x, y, d2), dt) <- (t2 = t1 + dt) ∧ ¬ HoldsAt (Changing_Lane (x),
t2) ∧ ¬ HoldsAt (Changing_Lane (y), t2) ∧ Calculate_Distance(d2, ax, ay, vx, vy).
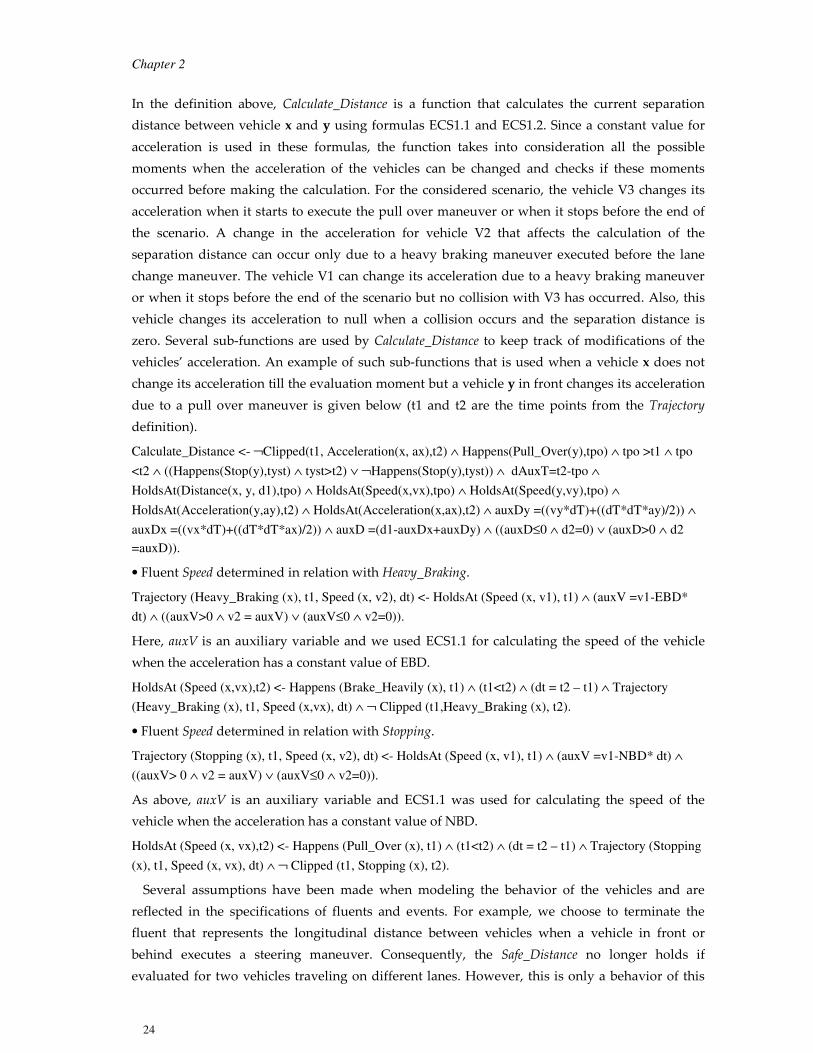
Chapter 2
24
In the definition above, Calculate_Distance is a function that calculates the current separation
distance between vehicle x and y using formulas ECS1.1 and ECS1.2. Since a constant value for
acceleration is used in these formulas, the function takes into consideration all the possible
moments when the acceleration of the vehicles can be changed and checks if these moments
occurred before making the calculation. For the considered scenario, the vehicle V3 changes its
acceleration when it starts to execute the pull over maneuver or when it stops before the end of
the scenario. A change in the acceleration for vehicle V2 that affects the calculation of the
separation distance can occur only due to a heavy braking maneuver executed before the lane
change maneuver. The vehicle V1 can change its acceleration due to a heavy braking maneuver
or when it stops before the end of the scenario but no collision with V3 has occurred. Also, this
vehicle changes its acceleration to null when a collision occurs and the separation distance is
zero. Several sub-functions are used by Calculate_Distance to keep track of modifications of the
vehicles’ acceleration. An example of such sub-functions that is used when a vehicle x does not
change its acceleration till the evaluation moment but a vehicle y in front changes its acceleration
due to a pull over maneuver is given below (t1 and t2 are the time points from the Trajectory
definition).
Calculate_Distance <- ¬Clipped(t1, Acceleration(x, ax),t2) ∧ Happens(Pull_Over(y),tpo) ∧ tpo >t1 ∧ tpo
<t2 ∧ ((Happens(Stop(y),tyst) ∧ tyst>t2) ∨ ¬Happens(Stop(y),tyst)) ∧ dAuxT=t2-tpo ∧
HoldsAt(Distance(x, y, d1),tpo) ∧ HoldsAt(Speed(x,vx),tpo) ∧ HoldsAt(Speed(y,vy),tpo) ∧
HoldsAt(Acceleration(y,ay),t2) ∧ HoldsAt(Acceleration(x,ax),t2) ∧ auxDy =((vy*dT)+((dT*dT*ay)/2)) ∧
auxDx =((vx*dT)+((dT*dT*ax)/2)) ∧ auxD =(d1-auxDx+auxDy) ∧ ((auxD≤0 ∧ d2=0) ∨ (auxD>0 ∧ d2
=auxD)).
• Fluent Speed determined in relation with Heavy_Braking.
Trajectory (Heavy_Braking (x), t1, Speed (x, v2), dt) <- HoldsAt (Speed (x, v1), t1) ∧ (auxV =v1-EBD*
dt) ∧ ((auxV>0 ∧ v2 = auxV) ∨ (auxV≤0 ∧ v2=0)).
Here, auxV is an auxiliary variable and we used ECS1.1 for calculating the speed of the vehicle
when the acceleration has a constant value of EBD.
HoldsAt (Speed (x,vx),t2) <- Happens (Brake_Heavily (x), t1) ∧ (t1<t2) ∧ (dt = t2 – t1) ∧ Trajectory
(Heavy_Braking (x), t1, Speed (x,vx), dt) ∧ ¬ Clipped (t1,Heavy_Braking (x), t2).
• Fluent Speed determined in relation with Stopping.
Trajectory (Stopping (x), t1, Speed (x, v2), dt) <- HoldsAt (Speed (x, v1), t1) ∧ (auxV =v1-NBD* dt) ∧
((auxV> 0 ∧ v2 = auxV) ∨ (auxV≤0 ∧ v2=0)).
As above, auxV is an auxiliary variable and ECS1.1 was used for calculating the speed of the
vehicle when the acceleration has a constant value of NBD.
HoldsAt (Speed (x, vx),t2) <- Happens (Pull_Over (x), t1) ∧ (t1<t2) ∧ (dt = t2 – t1) ∧ Trajectory (Stopping
(x), t1, Speed (x, vx), dt) ∧ ¬ Clipped (t1, Stopping (x), t2).
Several assumptions have been made when modeling the behavior of the vehicles and are
reflected in the specifications of fluents and events. For example, we choose to terminate the
fluent that represents the longitudinal distance between vehicles when a vehicle in front or
behind executes a steering maneuver. Consequently, the Safe_Distance no longer holds if
evaluated for two vehicles traveling on different lanes. However, this is only a behavior of this

Designing the support system for active safety systems
25
particular representation and does not mean that the vehicles are in immediate danger. Also,
when three vehicles follow each other, and the vehicle situated in between executes a steering
maneuver, the last vehicle starts following the first vehicle. We also set additional conditions for
fluents to hold or events to happen. For example, a vehicle x performs a heavy braking when a
Realize_Danger(x) event happens. However, such a heavy braking maneuver can take place in
contexts other than the one in the considered scenario. We explicitly set the value of acceleration
for several situations in which a vehicle can exist, such as for a vehicle that came to a full stop.
This facilitates the evaluation of other fluents such as the speed of a vehicle. For continuous
modeling of separation distance and speed, we used Trajectory predicates. If the calculations
resulted in negative values we set the result to null since no speed or distance can be negative in
our description. Events such as Approach, Brake_Heavily, Unsafe_Separation, or Zero_Separation take
place at unique moments in time that we identified with accuracy given by a ∆t time step. These
time points are needed in the Trajectory predicates for the starting points of the triggering fluents.
We defined the narrative of the scenario, which is presented in Figure 2.11.
Figure 2.11 Narrative for VOTS
VOTS - Implementation and Analyses (Step 6)
Implementation details and limitations
The model presented above was implemented in Prolog. The termination and initiation maps for
fluents represent the initial conditions of the scenario that are valid at all moments in time and
therefore were implemented using only the Prolog predicates term and init. Beside the common
definition for HoldsAt predicates, and the explicit definitions for Happens predicates, new
definitions implementing the constraints defined in Step 4 were needed. Also, auxiliary
predicates were needed for implementing the sub-functions used by the Calculate_Distance
function. New predicates used in diverse calculations (e.g. determination of the safe distance
Narrative for VOTS (Step 5):
Initially P (Road (r)).
Initially P (Vehicles (Vi), ∀ i ∈ {1,2,3}.
Initially P (Know_About (V1, V2).
Initially P (Know_About (V2, V3).
Initially P (Safe_Distance (Vi, Vj), ∀ i, j ∈ {1,2,3}, i≠j.
Initially P (Following (V1, V2)).
Initially P (Following (V2, V3)).
Initially P (Speed (Vi, Initial_Speed)), ∀ i ∈ {1,2,3}.
Initially P (Distance (V1, V2, Initial_Separation)).
Initially P (Distance (V2, V3, Initial_Separation)).
Initially P (Acceleration (Vi, Initial_Acceleration)),∀i∈{1,2,3}.
Happens (Start_Scenario, t0).
Happens (Follow (V1, V2),t0).
Happens (Follow (V2, V3),t0).
Happens (Pull_Over (V3), t1).
Chapter 2
26
between two vehicles), and for determination of specific time points when some events happen
(e.g. when a vehicle came to a full stop) were also added. In this scenario, as for all the other
scenarios that were modeled, we explicitly defined the events that marked the starting and
ending point of the scenario (i.e. Start_Scenario and Stop_Scenario.)
Several problems linked to the implementation of ECAM in Prolog apply to the example
presented in this section. The occurrence of infinite loops imposed difficulties in implementing
certain constraints that were logically correctly defined using Event Calculus. An example is the
specification of a heavy braking event defined in relation to a small separation distance between
two vehicles. This action leads to a modification of the speed and implicitly to the modification of
the distance between vehicles. Since this distance is calculated based on speed, and the derived
heavy braking is determined based on distance, the specification of such relations resulted in an
endless loop. Introducing additional events that are explicitly given can solve such problems. For
example, in our implementation we have used the event Realize_Danger, which leads to a heavy
braking maneuver. However, this may reduce the flexibility of the program in modeling derived
events, i.e. events that occur based on the states or values of other fluents and/or the occurrence
of other events. Furthermore, we encountered problems when implementing Trajectory
definitions. These definitions require the specification of the time moments when certain events
start certain fluents. When such events are not explicitly specified in the narrative of the scenario,
as in the case of derived events, the time of their occurrence needed to be specified via routines in
the program. We implemented the determination of such time moments via search functions that
analyze whether an event occurred based on the validity of the fluent initiated by it (i.e. using the
clauses defined in step 4). These functions verify whether a fluent is valid using the time given in
a query and searching the time space (i.e. the time interval between the time point specified in
the query and the moment when the scenario ends) using a time step defined in the
implementation. Since a fluent is valid immediately after the moment it was initiated, the event
that starts it is considered to happen at the moment that is one time step before the moment
when the fluent first holds. If the search reaches the moment when the scenario ends, the event
did not occur. In this implementation, the considered time step was 0.01 seconds. Even if this is a
fairly low value, some inaccuracy is still introduced within the accident modeling. This method
of determining the moments when derived events happened is valid only for the first occurrence
of the considered events. Thus, we employed this method for those events that can occur only
once within the scenario development (e.g. Zero_Separation(V1,V3)).
We defined derived events to indicate when certain actions occur in traffic as a result of the
combinations of specific conditions within a scenario. This helped us model the dynamic
behavior of accident scenarios, and model the effects of introducing new actions into the
scenario. To our knowledge, the use of derived events within systems based on Event Calculus
was not employed in previous works. Such previous systems require all the events to be
explicitly specified when the system is built (e.g. [CM00, EFD+02]). This means that all the events
that can occur when a situation is developing in time need to be defined beforehand and need to
be given in the narrative. However, this does not allow the investigation of how the variations of
diverse parameters or actions can dynamically influence the changes in the modeled situation.

Designing the support system for active safety systems
27
For cases where such dynamic dependencies are of importance, as when modeling accidents
where the traffic conditions dynamically affect each other (e.g. a braking maneuver is executed
due to a danger), it is necessary to build a system that can represent dynamic relationships. This
is possible by using derived events within modeling systems based on Event Calculus. We
believe that our work represents a step towards developing more advanced systems for
modeling and analyzing time-developing situations. However, as illustrated above, a number of
problems need to be addressed for such systems to become valuable tools.
Analyses
The analyses that can be performed using ECAM depend on the fluents and events defined
within the modeling of the scenario. We provide in the following examples of the traffic analyses
that can be performed based on the previously introduced implementation of VOTS. When
performing analyses, we used the following initial settings: Initial_Speed = 20m/s,
Initial_Separation = 40m and Initial_Acceleration = 0 m/s2. Also, the time moments when events
happened were t0 = 0 s, t1=10 s, t2=13 s, t3=14.5 s, t4=15.5 s and t5 =20 s.
We interrogated the system to determine whether fluents held at certain time points, and if and
when certain events took place. For example, we could determine if a collision between V1 and
V3 occurred. A collision between two vehicles was represented as a fluent that holds true from
the moment it occurs until the end of the scenario. Therefore, we interrogated the system about a
collision between V1 and V3 at the ending point of the scenario. However, such interrogation can
be performed at any time moment. The query about a collision between V1 and V3 evaluated
true, indicating that an accident happened. The query in Prolog syntax with the answer marked
in bold is presented below:
| ?- holdsAt(collision(v1,v3),20). yes
We note that the system could also be interrogated to determine when the collision actually
occurred using the Zero_Separation(V1,V3) event.
We then analyzed the influence of the modification of certain parameters on the development
of the scenario. These types of analyses are important for determining when and how to act to
avoid accidents. Thus, if the initial settings were modified so that the Realize_Danger(V1) event
occurred at time t4=14.5 seconds, no collision was noticed. We could also determine the moment
when V1 had stopped. The corresponding queries and answers are presented below:
| ?- holdsAt(collision(v1,v3),20). no
| ?- happens(stop(v1), Tstop_V1). Tstop_V1 = 16.8 ? yes
Various other investigations could also be performed using the ECAM model for VOTS. Thus,
it was possible to analyze issues of interest such as the velocity of vehicles, the separation
distance between two vehicles, and whether two vehicles followed each other:
| ?- holdsAt(speed(v1,Vel_V1),16). Vel_V1=15.5? yes
| ?- holdsAt(distance(v1,v3,D13),14). D13=48? yes
| ?- holdsAt(following(v2,v3),10). yes
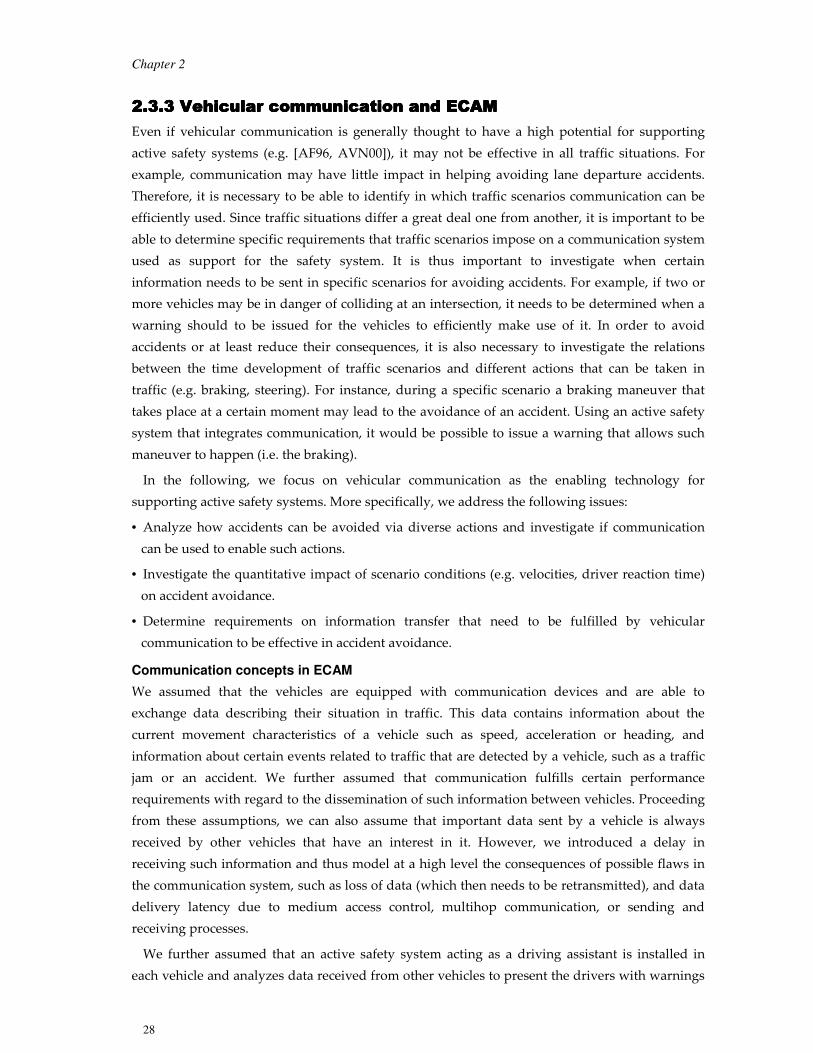
Chapter 2
28
2.3.3 Vehicular communication and ECAM 2.3.3 Vehicular communication and ECAM 2.3.3 Vehicular communication and ECAM 2.3.3 Vehicular communication and ECAM
Even if vehicular communication is generally thought to have a high potential for supporting
active safety systems (e.g. [AF96, AVN00]), it may not be effective in all traffic situations. For
example, communication may have little impact in helping avoiding lane departure accidents.
Therefore, it is necessary to be able to identify in which traffic scenarios communication can be
efficiently used. Since traffic situations differ a great deal one from another, it is important to be
able to determine specific requirements that traffic scenarios impose on a communication system
used as support for the safety system. It is thus important to investigate when certain
information needs to be sent in specific scenarios for avoiding accidents. For example, if two or
more vehicles may be in danger of colliding at an intersection, it needs to be determined when a
warning should to be issued for the vehicles to efficiently make use of it. In order to avoid
accidents or at least reduce their consequences, it is also necessary to investigate the relations
between the time development of traffic scenarios and different actions that can be taken in
traffic (e.g. braking, steering). For instance, during a specific scenario a braking maneuver that
takes place at a certain moment may lead to the avoidance of an accident. Using an active safety
system that integrates communication, it would be possible to issue a warning that allows such
maneuver to happen (i.e. the braking).
In the following, we focus on vehicular communication as the enabling technology for
supporting active safety systems. More specifically, we address the following issues:
• Analyze how accidents can be avoided via diverse actions and investigate if communication
can be used to enable such actions.
• Investigate the quantitative impact of scenario conditions (e.g. velocities, driver reaction time)
on accident avoidance.
• Determine requirements on information transfer that need to be fulfilled by vehicular
communication to be effective in accident avoidance.
Communication concepts in ECAM
We assumed that the vehicles are equipped with communication devices and are able to
exchange data describing their situation in traffic. This data contains information about the
current movement characteristics of a vehicle such as speed, acceleration or heading, and
information about certain events related to traffic that are detected by a vehicle, such as a traffic
jam or an accident. We further assumed that communication fulfills certain performance
requirements with regard to the dissemination of such information between vehicles. Proceeding
from these assumptions, we can also assume that important data sent by a vehicle is always
received by other vehicles that have an interest in it. However, we introduced a delay in
receiving such information and thus model at a high level the consequences of possible flaws in
the communication system, such as loss of data (which then needs to be retransmitted), and data
delivery latency due to medium access control, multihop communication, or sending and
receiving processes.
We further assumed that an active safety system acting as a driving assistant is installed in
each vehicle and analyzes data received from other vehicles to present the drivers with warnings
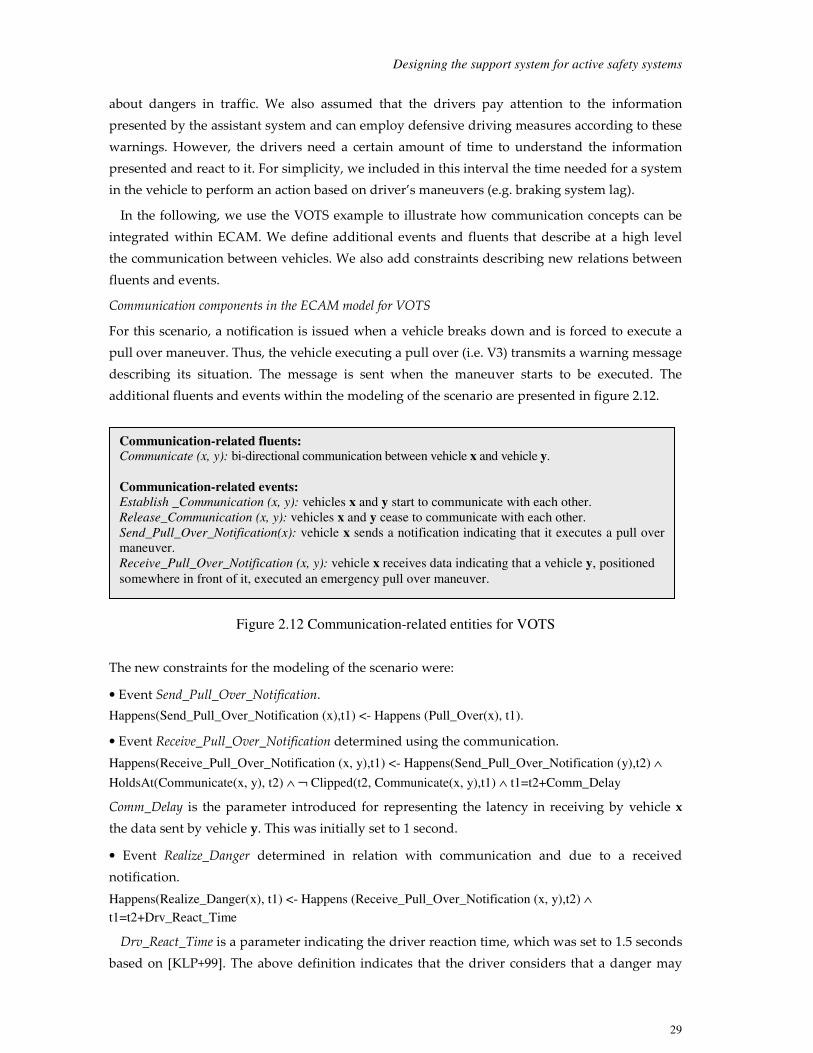
Designing the support system for active safety systems
29
about dangers in traffic. We also assumed that the drivers pay attention to the information
presented by the assistant system and can employ defensive driving measures according to these
warnings. However, the drivers need a certain amount of time to understand the information
presented and react to it. For simplicity, we included in this interval the time needed for a system
in the vehicle to perform an action based on driver’s maneuvers (e.g. braking system lag).
In the following, we use the VOTS example to illustrate how communication concepts can be
integrated within ECAM. We define additional events and fluents that describe at a high level
the communication between vehicles. We also add constraints describing new relations between
fluents and events.
Communication components in the ECAM model for VOTS
For this scenario, a notification is issued when a vehicle breaks down and is forced to execute a
pull over maneuver. Thus, the vehicle executing a pull over (i.e. V3) transmits a warning message
describing its situation. The message is sent when the maneuver starts to be executed. The
additional fluents and events within the modeling of the scenario are presented in figure 2.12.
Figure 2.12 Communication-related entities for VOTS
The new constraints for the modeling of the scenario were:
• Event Send_Pull_Over_Notification.
Happens(Send_Pull_Over_Notification (x),t1) <- Happens (Pull_Over(x), t1).
• Event Receive_Pull_Over_Notification determined using the communication.
Happens(Receive_Pull_Over_Notification (x, y),t1) <- Happens(Send_Pull_Over_Notification (y),t2) ∧
HoldsAt(Communicate(x, y), t2) ∧ ¬ Clipped(t2, Communicate(x, y),t1) ∧ t1=t2+Comm_Delay
Comm_Delay is the parameter introduced for representing the latency in receiving by vehicle x
the data sent by vehicle y. This was initially set to 1 second.
• Event Realize_Danger determined in relation with communication and due to a received
notification.
Happens(Realize_Danger(x), t1) <- Happens (Receive_Pull_Over_Notification (x, y),t2) ∧
t1=t2+Drv_React_Time
Drv_React_Time is a parameter indicating the driver reaction time, which was set to 1.5 seconds
based on [KLP+99]. The above definition indicates that the driver considers that a danger may
Communication-related fluents: Communicate (x, y): bi-directional communication between vehicle x and vehicle y.
Communication-related events:
Establish _Communication (x, y): vehicles x and y start to communicate with each other.
Release_Communication (x, y): vehicles x and y cease to communicate with each other.
Send_Pull_Over_Notification(x): vehicle x sends a notification indicating that it executes a pull over
maneuver.
Receive_Pull_Over_Notification (x, y): vehicle x receives data indicating that a vehicle y, positioned
somewhere in front of it, executed an emergency pull over maneuver.
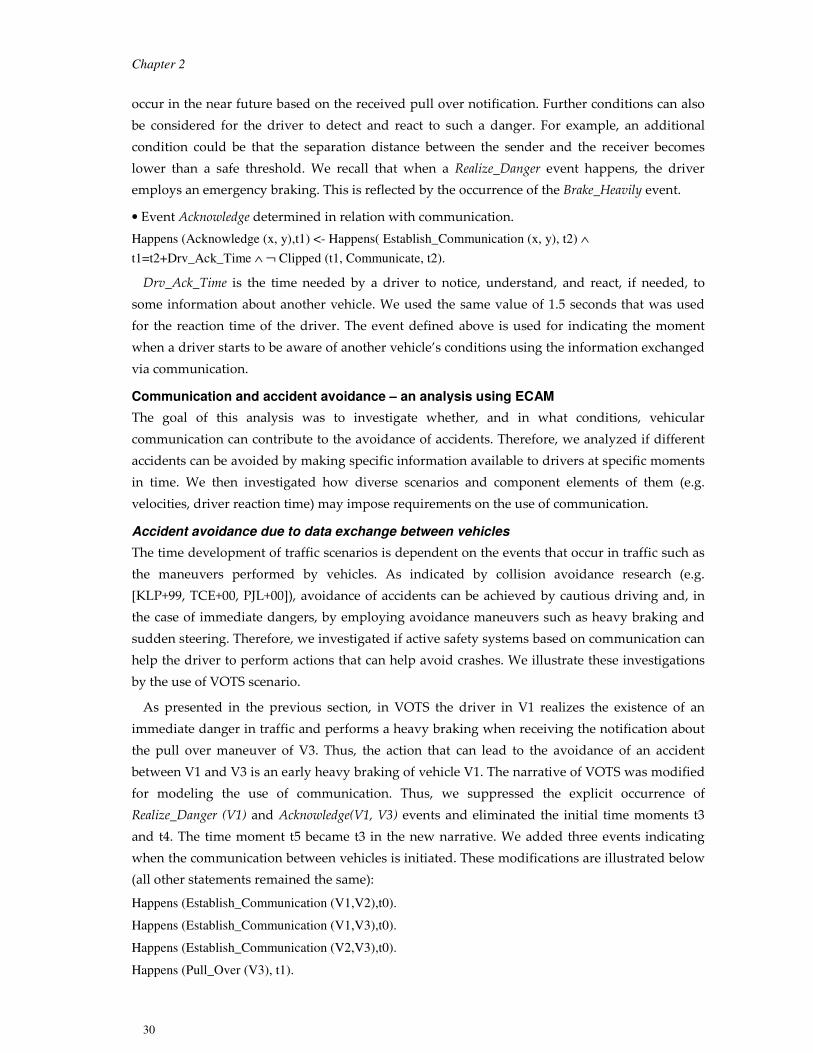
Chapter 2
30
occur in the near future based on the received pull over notification. Further conditions can also
be considered for the driver to detect and react to such a danger. For example, an additional
condition could be that the separation distance between the sender and the receiver becomes
lower than a safe threshold. We recall that when a Realize_Danger event happens, the driver
employs an emergency braking. This is reflected by the occurrence of the Brake_Heavily event.
• Event Acknowledge determined in relation with communication.
Happens (Acknowledge (x, y),t1) <- Happens( Establish_Communication (x, y), t2) ∧
t1=t2+Drv_Ack_Time ∧ ¬ Clipped (t1, Communicate, t2).
Drv_Ack_Time is the time needed by a driver to notice, understand, and react, if needed, to
some information about another vehicle. We used the same value of 1.5 seconds that was used
for the reaction time of the driver. The event defined above is used for indicating the moment
when a driver starts to be aware of another vehicle’s conditions using the information exchanged
via communication.
Communication and accident avoidance – an analysis using ECAM
The goal of this analysis was to investigate whether, and in what conditions, vehicular
communication can contribute to the avoidance of accidents. Therefore, we analyzed if different
accidents can be avoided by making specific information available to drivers at specific moments
in time. We then investigated how diverse scenarios and component elements of them (e.g.
velocities, driver reaction time) may impose requirements on the use of communication.
Accident avoidance due to data exchange between vehicles
The time development of traffic scenarios is dependent on the events that occur in traffic such as
the maneuvers performed by vehicles. As indicated by collision avoidance research (e.g.
[KLP+99, TCE+00, PJL+00]), avoidance of accidents can be achieved by cautious driving and, in
the case of immediate dangers, by employing avoidance maneuvers such as heavy braking and
sudden steering. Therefore, we investigated if active safety systems based on communication can
help the driver to perform actions that can help avoid crashes. We illustrate these investigations
by the use of VOTS scenario.
As presented in the previous section, in VOTS the driver in V1 realizes the existence of an
immediate danger in traffic and performs a heavy braking when receiving the notification about
the pull over maneuver of V3. Thus, the action that can lead to the avoidance of an accident
between V1 and V3 is an early heavy braking of vehicle V1. The narrative of VOTS was modified
for modeling the use of communication. Thus, we suppressed the explicit occurrence of
Realize_Danger (V1) and Acknowledge(V1, V3) events and eliminated the initial time moments t3
and t4. The time moment t5 became t3 in the new narrative. We added three events indicating
when the communication between vehicles is initiated. These modifications are illustrated below
(all other statements remained the same):
Happens (Establish_Communication (V1,V2),t0).
Happens (Establish_Communication (V1,V3),t0).
Happens (Establish_Communication (V2,V3),t0).
Happens (Pull_Over (V3), t1).

Designing the support system for active safety systems
31
Happens (Sudden_Steer (V2), t2).
Happens (Stop_Scenario, t3).
t3 > t2 > t1 > t0.
The implementation of the system was completed with the Prolog entities that model the fluents,
events, and constrains related to communication modeling. The initial settings remained the
same and the time moments were t0 = 0 s, t1=10 s, t2=13 s, and t3 =20 s. We then interrogated this
extended system about the occurrence of a collision between V1 and V3. In this case, due to the
modifications in driving behavior based on the information received via vehicular
communication, no collision happened:
?- holdsAt(collision(v1,v3),20). no
This result showed that V1 received the notification about V3’s condition early enough to be able
to stop safely. We also checked if and when the vehicles came to a full stop:
| ?- happens(stop(v1),T_stop_V1). T_stop_V1 = 14.79? yes
| ?- happens(stop(v3),T_stop_V3). T_stop_V3 = 15.09? yes
We note that similar investigations were performed for various scenarios (e.g. intersection
crashes with perpendicular path), where we obtained similar results.
Accident analyses and communication performance
An active safety system such as the above driving assistant system based on communication can
be effective only if the data used for analyses is provided in a reliable and timely manner.
Therefore, we were interested in assessing the relationship between the communication delay
and the possibility of avoiding an accident.
Many variables exist with the use of communication in traffic safety, and different scenarios
can impose very different demands on communication. Therefore, we analyzed various scenarios
and in each of them we considered that a notification is issued for indicating a dangerous
situation. This notification was designed to determine an action in traffic that could leads to
accident avoidance.
For the analyzed accident scenarios we performed two types of investigations. First, we kept
constant the initial parameters of the scenario (e.g. velocities, accelerations, distances) and
evaluated the maximum delay in delivering a warning message to the vehicles in need. Second,
we modified different parameters in the scenario (e.g. driver reaction time, initial speed of
vehicles, distances, maneuvers) and assessed the communication delay that is required for
achieving accident avoidance. We illustrate below these analyses using the VOTS scenario.
Within VOTS, we investigated the maximum delay that can be tolerated by the driving
assistant system for receiving and processing the pull over notification.
When keeping constant all the initial settings we determined that for a communication delay
higher than 3.59 seconds, the use of the assistant system could not provide accident avoidance.
Still, the consequences of the accident can be diminished even if avoidance is not achieved. Thus,
for a 3.6 second delay we noticed a reduction of around 60% of V1’s speed at the moment of

Chapter 2
32
impact compared with the initial case. This should be reflected in a reduction of the risk of
injuries.
We also investigated the communication delay when modifying parameters of the VOTS
scenario such as the initial speed of the vehicles, the initial separation distance between vehicles,
and the driver reaction time. For the sake of brevity, we illustrate in figure 2.13 the dependence
between the minimum delay required for accident avoidance and the initial separation distance
between vehicles and the initial velocity of the vehicles respectively. All other settings in the
scenario were kept constant.
10
20
30
40
0 0.5 1 1.5 2 2.5 3 3.5 4
Delay [s]
Initi
al S
epara
tion
Dis
tance [m
]
10
15
20
25
0 0.5 1 1.5 2 2.5 3 3.5 4Delay [s]
Initi
al V
elo
city
[m
/s]
Figure 2.13 Communication delay - initial separation distance and initial velocity
A smaller separation distance required a smaller delay in delivering the information. This was
expected since the vehicles were closer to each other and thus in more danger of colliding. A
smaller initial speed value also required a smaller delay. This was a result of the shorter distance
(and thus the shorter time) needed by V3 to come to a stop after it breaks down when initially
had a lower velocity. This required that the following vehicle (i.e. V1) be announced in a shorter
time to enable it to stop safely. We also investigated the modification of the initial speed values
only for V1 and V2 (i.e. V3‘s speed was kept constant at 20 m/s). In this case, a speed value of 21.5
m/s determined a minimum delay of 2.65 seconds, which was almost 1 second lower than the
value obtained under the initial settings. For speed values higher than 21.5 m/s, a collision
between V2 and V3 occurred, which altered the original scenario.
We note that the delay requirements on notifications varied a great deal between different
accidents scenarios. In many scenarios, a delay of 1÷2.5 s was sufficient for achieving accident
avoidance. However, in some cases, especially for intersection scenarios, we obtained smaller
values, such as 0.6 s. The delay could have also even lower values, as we noted when we
modified certain settings of the scenarios, e.g. the characteristics of the vehicles. However, in
those cases, the settings were not realistic, i.e. there was no real accident with such description
and the settings were extreme. One such extreme example would be a case in which ordinary
vehicles were situated at 50 meters from an urban crossroad and approached it at a speed of 90
km/h.
The investigations that we have performed also showed that simple operations of safety
systems may not result in the desired improvement of traffic safety. For example, in [SCA+04] we
investigated intersection accidents involving elderly drivers. An in-vehicle safety system that
reacts to notifications received from vehicles that pass through the intersection was considered.
Designing the support system for active safety systems
33
This system could also have an automatic mode, where a braking maneuver was performed
based on information included in a specific warning message. For instance, for the scenario
presented in figure 2.14, the system could employ an automatic braking when two vehicles may
collide at an intersection. The scenario implies that vehicle V2 is stopped and then tries to pass
through the intersection. The driver in V2 does not notice the approaching V1. When V2 starts to
cross, its acceleration is low, as the elderly driver in V2 tends to drive carefully. V1 is mislead by
V2’s maneuvers and realizes too late that V2 indeed wants to pass but it will not be able to pass
on time. V1 tries to brake to stop, but due to the short separation distance, crashes into V2. A
possible solution is to force V2, which comes from a non-priority road, to send a notification
when it starts to pass through the intersection. Based on the information included in this
message, the system in V1 identifies V2 as a possible danger and notifies the driver or applies a
braking maneuver. However, if the safety system reacted automatically by braking, it could
induce an accident (under specific settings of the scenario). This is because this simple safety
system forced V1 to brake too early, which then arrived into the intersection when V2 was still
there. If no braking had been employed, V1 would arrive in the intersection after V2 has passed.
Consequently, active safety systems need to be deliberative, and reason about potential
consequences of actions.
Figure 2.14 Intersection accident example
V1
a. Initial situation
V2
b. Accident situation
V1
V2


35
3. Safety communication system analysis
This chapter provides an analysis on the design of a communication system intended to provide
a timely and reliable dissemination of safety data between vehicles. We define requirements,
identify the main design issues of the system, and discuss the upsides and downsides of possible
alternatives. We thus discuss approaches to vehicular safety communication and design aspects
of the system such as operation modes, and networking and transmission techniques.
3.1 Requirements analysis3.1 Requirements analysis3.1 Requirements analysis3.1 Requirements analysis
The vehicular environment, the functionality of active safety systems, and accident dynamics
impose requirements on vehicular safety communication.
Requirements imposed by the vehicular environment
The vehicular or traffic environment is the environment where vehicles travel. We refer to the
vehicles and roadside servers equipped with communication means as hosts.
A set of properties exhibited by the vehicular environment that can impose requirements on
the design of the communication system used for exchanging safety data between vehicles is
presented below:
• The communicating hosts move on well-defined paths (i.e. the roads) (e.g. [KLP+99]). A host
can be mobile or fixed (e.g. [MKO00]). A mobile host is a vehicle and is located on a road. A fixed
host is a communication entity and is located on the side of the road (e.g. a gateway).
• The movements of mobile hosts are (currently) controlled by human entities, i.e. the drivers.
The drivers react to relevant changes in the environment and have the ability to estimate the
relative distance to other vehicles or obstacles on the road or roadside, and the relative velocities
of other vehicles (e.g. [WH98a, GMC+00]).
• The movement of vehicles is usually performed according to well-defined traffic rules (e.g.
vehicles stop when traffic lights are red). Vehicles perform maneuvers such as braking,
overtaking, and lane changing based on the individual perception of the traffic situation by the
driver. The movement of a vehicle is usually performed considering the current traffic situation
of other vehicles situated in its vicinity (e.g. [AF96, BV01, ZKV00]). However, the drivers may not
always respect traffic rules, nor can they always correctly predict the movements or intentions of
other vehicles. Consequently, the maneuvers made by vehicles are not always safe (e.g. [USDT99,
ZKV00, Eva04]).
• Each vehicle is characterized by dimension parameters such as width and length (e.g. [WH98a,
KLP+99]). The movement of vehicles can be described using motion parameters such as speed,
heading (i.e. driving orientation), and acceleration (e.g. [MKO00, BKP+02]).
• Vehicles can travel in geographical areas that may present significant topographical differences
(e.g. [KSA02]).
• Vehicles have the freedom of joining and leaving the traffic (e.g. [BV01]).

Chapter 3
36
• A road can be categorized according to its functional type (e.g. as highway, urban road, or
country road [FAT99, SBS+02]). Other parameters related to a road such as road conditions (e.g.
slipperiness), or construction characteristics (e.g. existence of a divider) can be used to describe a
road (e.g. [BSH00, KSA02]).
The influence of the above properties on the design and functionality of the safety
communication system is discussed in the following.
o The mobility of the hosts and the possible communication with fixed hosts need to be
reflected in the communication and networking techniques.
o The type of data that need to be exchanged is determined by the information that could be
of use for the driver. The traffic environment accommodates different types of roads and
this can influence the type of data and its processing.
o The characteristics of the vehicles (e.g. length) can influence the communication service
area and the design of the communication system.
o The fact that the vehicles travel on dedicated paths (i.e. roads) and exhibit specific
behaviors affects the design of the communication protocol and the transmission
technique. The random exiting and entering of roads by vehicles needs to be reflected in
the network organization and management. This also affects the design of the
communication protocol.
o The behavior of a driver in a vehicle depends on actions performed by surrounding
vehicles and on actions of other traffic participants (e.g. pedestrians). This influences the
development of the communication system in various ways (e.g. network management,
service area, or information dissemination technique).
With consideration given to the properties of the vehicular environment and the use of
communication as the enabling technology for safety systems, we present below a set of basic
requirements on communication:
• The communication needs to take place between hosts that can constantly modify their
position, speed, and driving orientation (e.g. [AF96, BH00]). The communication takes place in
environments where the transmission patterns change frequently. The communication
performance can be affected by elements specific to traffic situations such as terrain, buildings,
weather, or vehicle distribution [AF96, KSA02, MN97, SBS+02]. The communication needs to
accommodate frequent disconnections and failures, as well as high levels of interference (e.g.
[BV01]). This requires a communication system that can reliably deliver data in time and can
assure a high availability of the safety information (e.g. [AF96, MN97, FAT99, TAF00]). High
frequency of providing traffic information is needed, e.g. at least each 1-2 seconds (e.g. [AF96,
HBE+01]). Furthermore, small transmission latency needs to be achieved. Many factors influence
the latency, e.g. channel access delay, relaying delay. Different proposals have been made in the
literature for data delivering latency in vehicular networks (e.g. [AF96, Coc97, ONS+00, KTT+02,
CC05]). Values between 100 ms (e.g. [CC05]) and 1 second (e.g. [Bri01]) were thus proposed. For
applications such as collision warning and collision avoidance based on multihop data exchange,

Safety communication system analysis
37
delay values lower than 0.6 seconds were shown to induce important improvements to traffic
safety (e.g. [WH98a, BSH00]).
• The communication needs to take place between hosts that may join and leave the network at
very high rates. The mechanisms employed for network management and addressing need to
cope with this dynamic behavior (e.g. [BH00, BV01]).
• The vehicular communication needs to be operational at any time, in any place, and under a
wide variety of conditions (e.g. [KLP+99, TAF00]). The communication also needs to be
functional in zones with relatively high density of vehicles (e.g. 20 vehicles per kilometer) [BV01].
• The communication may need to take place beyond the local transmission range of the hosts.
This implies both line-of-sight (LOS) and multi-hop communication, which implies that the
development of forwarding techniques are needed (e.g. [MN97, TAF00]).
• The exchange of safety data can be done regularly, when certain events occur in traffic (e.g.
transmission of notifications due to events such as accidents), or in both cases (e.g. [AF96, BH00,
KTT+02]).
• The service area for communication needs to be selected with consideration given to aspects
related to traffic such as driving patterns and characteristics of vehicles (e.g. dimension,
maximum braking distance). Additionally, the relevance of safety data is space bounded. Other
aspects that need to be considered are the connection time between hosts and the amount of
information that needs to be transferred (e.g. [HBE+01, AMF+02]). Services areas of varying sizes
have been proposed for traffic applications. Even for the same application, proposals differed a
great deal. For instance, for traffic jam notifications, 200 meters to 5 kilometers were proposed
(e.g. [AF96, BSH00, BH00]). For collision warning applications, communication areas between the
average visibility of the driver (i.e. 100 meters), and several hundreds meters (e.g. 500 m) were
proposed (e.g. [Win96, AF96, WH98b, KBS+01, HBE+01]).
• The content of exchanged data needs to assure fast processing and should be relevant for traffic
safety (e.g. [AF96, HBE+01]).
Active safety systems requirements
The operation modes of collaborative active safety systems impose specific requirements on the
functionality of a safety communication system. Using crash avoidance research (e.g. [KLP+99,
TCE+00, PJL+00, ZKV00, KCF+03]), we have defined a set of high-level requirements for active
safety systems. We discuss here how these requirements relate to vehicular communication. The
generic requirements for active safety systems are presented in the following.
• Active safety systems must be reliable and must be efficient in determining dangers in traffic
and performing actions accordingly.
When communication is used for supporting the safety systems, the data exchange between
vehicles needs to be performed in a reliable and timely manner. Delay values as much as few
seconds need to be achieved for the data to be transferred from a system installed on a vehicle to
the system installed on another vehicle. The type and amount of information that is exchanged is
determined by the data needed by the safety systems for performing analyses of traffic

Chapter 3
38
situations. The safety information can extend over several hundred bytes at one instance and if it
is provided regularly, a channel bandwidth of at least several hundreds of kbps may be required.
• Active safety systems must be accurate and must provide effective support to the driver.
For vehicular communication, this requirement is primary reflected in the need for timely
exchange of accurate information between vehicles. To effectively help the driver, the safety
system needs to produce accurate and comprehensive notifications (e.g. [Alb99, ZKV00]).
Consequently, the type of data exchanged using vehicular communication depends on the
information that needs to be presented to the driver.
• Active safety systems should not lead to the mental overload of the driver.
Research in driving behavior indicated that drivers are able to successfully cope with secondary
tasks such as the use of safety systems that issue warnings [IIK+02, AHK+02]. However, the
presentation of warnings should not distract or overload the driver. The content of notifications
and the method of presenting them are certainly important. Thus, a wide variety of interfaces
such as audio (e.g. chimes, voice), video (head-up display, car computer display, rear/side mirror
display) or tactile (e.g. seat vibration, brake pulse) are currently under investigation (e.g. [ZKV00,
TCE+00, KCF+03]). Furthermore, the safety system needs to issue notifications early enough for
the driver to be able to employ maneuvers that help in avoiding or mitigating collisions. We note
that driver reaction time between 1 and 3 seconds should be taken in consideration [KLP+99].
The safety system also needs to assure a small number of false and nuisance alarms [GMC+00,
BKP+02]. If a large number of warnings are presented to the driver or if they are presented too
early, the driver’s confidence in the system degrades significantly [KLP+99, TCE+00]. These
factors require the safety system to have accurate data early enough to be able to perform traffic
analyses and employ actions. For safety systems that integrate communication, this translates
again into the need of having a reliable and timely data exchange.
• Active safety systems need to operate in a wide variety of traffic situations.
When communication is used as support for the safety system, the above requirement demands
the utilization of a communication system that is able to function on different roads, in different
areas, and under a wide variety of traffic conditions (e.g. network load, weather conditions,
terrain topology).
• Active safety systems need to be economically feasible.
The successful deployment of active safety systems requires the development of systems with
reasonable costs. For safety systems that integrate communication, this aspect addresses both the
cost of the equipment mounted on vehicles, and the infrastructures related to roads that may
need to be developed. We note that solutions designed to improve traffic safety can be
technically feasible, but not economically feasible. For instance, a system using sign-to-vehicle
communication that implements collision warning functions at intersections was considered less
appropriate for current deployment due to high costs [LMFS97].

Safety communication system analysis
39
Requirements derived from accident analyses
The study of accidents makes it possible to identify specific functional requirements on the use of
communication systems that support on-board safety systems. In our study we analyzed
accidents both theoretically, based on relevant literature (e.g. [USDT99, SITC01, NSD01, NSS+03,
NSS01, USC03, Eva04]), and also via simulations using the ECAM system introduced in the
previous chapter. The following requirements were identified:
• The data exchanged between vehicles needs to describe in detail the traffic situation in the
proximity of a subject vehicle. Information such as position, heading, speed and status of the
vehicle is essential. This information can extend over several hundreds bytes. As traffic data
needs to be provided frequently, and a large number of vehicles may exchange it, low transfer
rates (e.g. tens or few hundreds kbps) may not be appropriate. Furthermore, the use of specific
notifications for describing hazards in traffic (e.g. a vehicle stopped in the driveway) can have a
significant impact on avoiding collisions.
• All traffic data needs to fulfill strict requirements on latency. Values of several seconds may be
enough to avoid simple accidents such as rear-end scenarios involving a small number of
vehicles. However, in more complex situations and for the majority of traffic accidents values,
values that are minimally lower than 1 s are needed for multihop communication. Moreover,
values that can lead to high efficiency of safety systems would preferably be under 0.6 s.
• The required communication area can vary from tens to hundreds of meters, e.g. 80 meters to
700 meters. In most cases, several hundreds meters are needed for assuring the possibility of
avoiding accidents. Additionally, values over 800 meters are usually not needed, and values
less than 50-60 meters are usually too small to provide a real opportunity for avoiding a crash.
3.2 Approaches to vehicular communication3.2 Approaches to vehicular communication3.2 Approaches to vehicular communication3.2 Approaches to vehicular communication
We provide in the following an analysis of proposals for developing vehicular communication
systems, with consideration given to the safety functionality of the communication system that is
integrated in collaborative safety system.
Based on the specific operations performed for disseminating traffic information, the proposals
for vehicular communication can be categorized into four main approaches:
• Vehicular communication using satellite systems.
• Vehicular communication based on infotainment infrastructures (e.g. gateways mounted on
the roadside).
• Vehicular communication based on cellular systems.
• Direct vehicular communication.
We studied these approaches to identify the level of support they could provide for
implementing safety communication. Aspects of particular interest were the possible
performance of the communication system (e.g. data rate, latency, link availability), the
availability and the cost of the system, and the possibility for the system to integrate special
features (e.g. specific service area, use of geographical data). We do not include in the analysis

Chapter 3
40
below the use of satellite networks since it is generally considered that the large delays, high
costs, and possible low performance did not recommend them for implementing collaborative
safety applications [NTF96]. The considerations regarding the other three approaches are
presented in the following. The conclusions are then summarized using a qualitative comparison
table.
Vehicular communication based on infotainment infrastructures
This approach to vehicular communication employs the development of dedicated
communication infrastructures associated with roads (e.g. [NTF96]). These infrastructures are
usually developed for implementing services such as delivery of traveler information. An
example is presented in figure 3.1, where several communication servers provide communication
for vehicles on a road. These servers are connected with each other and with an Access Network
using a Vehicular Support Network that can be a wired or a wireless network. The Access
Network is also connected to a Traffic Service Center that provides information about traffic, or
to other networks that provide various services (e.g. Internet).
The vehicular communication based on such infrastructures has been subject to intensive
efforts in the last years, leading to remarkable results such as the development of the Vehicle
Information and Communication System (VICS) in Japan [Yam96, MKI+99]. This system is used
to collect and analyze traffic data received from different sources and then to deliver the results
of these analyses to vehicles using FM broadcast, radio beacons (i.e. on 2.49 GHz), and infrared
communication. The solutions for vehicular communication based on infotainment
infrastructures can include not only the installation of communication stations along the roads,
but also the integration of other elements with roads or roadsides. An example is a sensorial
system that integrates magnetic sensors and video cameras to detect the presence of pedestrians
and vehicles, and alerts upcoming vehicles to them. Another example would be systems formed
by devices installed on traffic signs and traffic lights that send various notifications to vehicles
(e.g. adaptive speed limits) (e.g. [AHR00, Bis00, AHR01]).
Figure 3.1 Vehicular communication based on an infotainment infrastructure (S1, S2 and S3 are dedicated communication servers)
Access Network
Vehicular Support Network
Internet
S2 S3 S1
PSTN
Other
networks
Traffic Service Center

Safety communication system analysis
41
Several limitations apply to the use of vehicular communication based on infotainment
infrastructures, like the ones mentioned above, when exchanging safety information. This
approach employs a client–server technique and even when data has to be exchanged only
between vehicles, a server located on the roadside needs to be involved. This induces latency and
therefore the exchange of data that requires a very small latency is not supported well.
Furthermore, many systems provide only unidirectional services (e.g. broadcast, toll collection)
and they will need to be modified for safety vehicular communication. The management of a
large number of vehicles can also pose problems, and require a large number of roadside devices
and/or a high bandwidth system, which are both expensive to achieve. In addition, the
development and deployment of communication systems using dedicated infrastructures is
usually a long-term objective that requires extensive funding. The applicability of these
communication systems is usually limited to specific geographic locations [Win96, MIK01]. This
hinders the ubiquitous utilization of such systems. For instance, current proposals for developing
systems based on infotainment infrastructures address mainly services for highways and
freeways (e.g. [MKI+99]). Since accidents happen on all types of roads it is desirable for a safety
system based on communication to be able to perform well under a wide variety of
topographical conditions and on all types of roads.
Vehicular communication based on cellular systems
This approach implies the development of communication systems that make use of cellular
networks such as GSM (e.g. [AVN00, MIK01, Bre01, KBS+01]). An example is presented in figure
3.2, where each vehicle is equipped with a mobile station (MS). Similar to a regular cellular
network, a number of base stations (BS) provide services to mobile stations. This type of cellular
network can offer traffic services that can be located within a base station or within other entities
in the network (e.g. the operation and maintenance center). This network can be also connected
to a traffic service center or with other networks that provides traffic services.
Figure 3.2 Vehicular communication based on a cellular network
Car manufacturers and telecomm operators have expressed a significant interest in the
development of vehicular networks based on a cellular approach. The possibility of using well-
Base Station (BS1) Base Station (BS2)
Communication zone
served by BS1
Internet
Other networks
Cellular network backbone

Chapter 3
42
established communication networks that give extensive coverage, are based on international
standards, and have a wide market penetration is enticing [AVN00]. Different types of
applications that make use of cellular systems have been proposed, the most common being
telematic applications that relate to roadside assistance and infotainment [Bre01]. These
applications follow a client-server approach where a mobile station (MS) mounted on a vehicle
connects to a base station (BS) when certain information is required by the driver or by some
system in the vehicle (i.e. POP-oriented service provision). The BS then contacts the service that
provides the requested information. This service can be located in the BS or at some distant
monitoring unit that processes data related to traffic. For example, mobile office applications (e.g.
e-mail or financial transactions) were developed and adapted for integration into vehicles
[Bre01]. PUSH-oriented services, where BS delivers information to vehicles without being
previously solicited, can also be provided. An example is the delivery of emergency notifications
indicating nearby accidents or traffic jams. Safety applications such as emergency calls in case of
vehicle failure or automatic accident notifications have also been proposed [LHC+00, FBD+01].
An example is the Volvo on Call system that makes use of a GSM phone and a Global Positioning
System (GPS) receiver [Vol04]. If a vehicle is involved in a crash, this system sends the vehicle
position and the status of the airbag to a service center.
Even if the success of several traffic applications using cellular networks indicates the potential
of this technology, several technical limitations can hinder the utilization of these networks for
implementing safety communication. Real-time applications such as collision avoidance for large
numbers of vehicles moving at relatively high speeds and in various environments are not well
supported by cellular networks [Win96, MN97]. These networks were not designed with the
intention of implementing vehicular communication or any similar application. They don’t
employ flexible connectivity and fast access to the radio channel, nor can they manage a large
number of users located in a small area. Also, cellular networks cannot usually assure very low
latency for data transmission, and high availability of the radio links [AVN00, HBE+01].
Additionally, the data rates provided by cellular networks can be too low to accommodate a
large number of communicating vehicles that send data frequently. The possible lack of
coverage, especially in rural areas, can also hinder the utilization of cellular networks for
supporting systems that implement safety applications (e.g. [Win96]). Other important issues
that currently hinder the utilization of cellular networks are the high cost of communication and
the lack of well-defined provision of services [Per99, Bre01, HBE+01, Haa02]. While the former is
a typical problem related to cellular networks, the later addresses the undecided distribution of
market roles between car manufacturers and telecom operators with regard to content and
service providers.
Direct vehicular communication
The last approach to vehicular communication that we have analyzed proposes the use of direct
communication among vehicles. This approach implies the direct exchange of information
without the involvement of a communication infrastructure. An example is presented in figure
3.3, where vehicles are equipped with full-duplex transceivers and can communicate directly one
with another. The dotted arrows in the figure indicate such communication links.
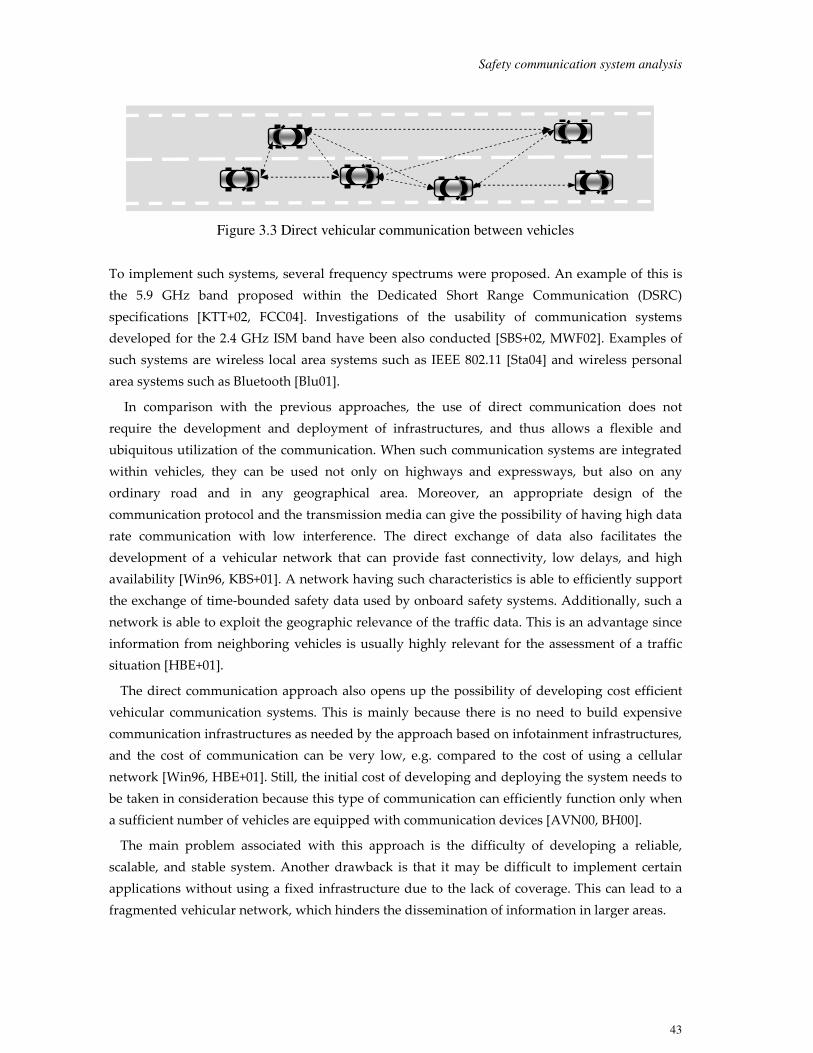
Safety communication system analysis
43
Figure 3.3 Direct vehicular communication between vehicles
To implement such systems, several frequency spectrums were proposed. An example of this is
the 5.9 GHz band proposed within the Dedicated Short Range Communication (DSRC)
specifications [KTT+02, FCC04]. Investigations of the usability of communication systems
developed for the 2.4 GHz ISM band have been also conducted [SBS+02, MWF02]. Examples of
such systems are wireless local area systems such as IEEE 802.11 [Sta04] and wireless personal
area systems such as Bluetooth [Blu01].
In comparison with the previous approaches, the use of direct communication does not
require the development and deployment of infrastructures, and thus allows a flexible and
ubiquitous utilization of the communication. When such communication systems are integrated
within vehicles, they can be used not only on highways and expressways, but also on any
ordinary road and in any geographical area. Moreover, an appropriate design of the
communication protocol and the transmission media can give the possibility of having high data
rate communication with low interference. The direct exchange of data also facilitates the
development of a vehicular network that can provide fast connectivity, low delays, and high
availability [Win96, KBS+01]. A network having such characteristics is able to efficiently support
the exchange of time-bounded safety data used by onboard safety systems. Additionally, such a
network is able to exploit the geographic relevance of the traffic data. This is an advantage since
information from neighboring vehicles is usually highly relevant for the assessment of a traffic
situation [HBE+01].
The direct communication approach also opens up the possibility of developing cost efficient
vehicular communication systems. This is mainly because there is no need to build expensive
communication infrastructures as needed by the approach based on infotainment infrastructures,
and the cost of communication can be very low, e.g. compared to the cost of using a cellular
network [Win96, HBE+01]. Still, the initial cost of developing and deploying the system needs to
be taken in consideration because this type of communication can efficiently function only when
a sufficient number of vehicles are equipped with communication devices [AVN00, BH00].
The main problem associated with this approach is the difficulty of developing a reliable,
scalable, and stable system. Another drawback is that it may be difficult to implement certain
applications without using a fixed infrastructure due to the lack of coverage. This can lead to a
fragmented vehicular network, which hinders the dissemination of information in larger areas.

Chapter 3
44
Approaches to vehicular communication – final remarks
Table 3.1 summarizes in a qualitative manner the analysis of approaches to vehicular
communication. The term System Availability has a Global component that identifies the
possibility of deploying and using the communication system on a wide variety of roads. The
term Link Availability indicates the probability that a host will acquire the communication channel
and establish a communication link in a timely manner.
Table 3.1 Comparison table for approaches to vehicular communication
We note that some of the parameters in Table 3.1 (e.g. latency, data rate) may depend on specific
features of the communication system (e.g. a specific medium access control scheme or a specific
routing protocol).
By looking at the properties of the approaches analyzed and at the requirements for safety
vehicular communication, we have concluded that the direct communication approach is the
most appropriate technique for exchanging safety data among vehicles.
3.3 Design components analysis 3.3 Design components analysis 3.3 Design components analysis 3.3 Design components analysis
We provide in the following an analysis of the components of a safety communication system
and the technologies that can be used for implementing them. We start by discussing the
operation mode of the system and then focus on functional aspects such as networking
techniques and transmission procedures. We then present the features we have selected to be
part of a communication system that we propose.
Approach to vehicular communication
Parameter Based on infotainment
infrastructures
Based on cellular
networks
Direct
Communication latency Medium High Low
Link availability Medium Low to Medium Medium to High
Data rate Medium to High Low to Medium High
System availability
• Local
• Global
High
Low
High
Medium
High
High
Flexibility (of connection) Low Low High
Cost competitiveness
• Initial cost
• Operational costs
High
Medium
High
Medium to High
Low to Medium
Null to Low
Communication service area Medium Large Small to Medium
Exploit geographic
relevance of data
No No Yes
Support for large area
notifications
Medium High Low to Medium
Support for safety
communication
Low to Medium Low High

Safety communication system analysis
45
3.3.1 Operation mode of the system3.3.1 Operation mode of the system3.3.1 Operation mode of the system3.3.1 Operation mode of the system
Reactive and proactive functionality
The vehicular communication system designed to support collaborative active safety systems can
operate using a reactive or/and a proactive approach.
The reactive approach implies the sending of notifications to warn approaching vehicles about
hazards in traffic. This happens when certain events take place in traffic, and the safety system in
the (sender) vehicle decides that other vehicles need to be informed about these events.
The proactive approach implies the regular sending of information, which is used by the safety
systems for detecting hazards in traffic and reacting to them.
In operational terms, the proactive approach can be more effective than the reactive approach
because it is directed toward trying to avoid the occurrence of dangerous situations and, in case
this is not possible, limiting their consequences. Using a proactive exchange of data, in-vehicle
safety systems can predict well in advance the possibility of accident occurrence and can
efficiently act towards eliminating it. In comparison, the reactive approach is directed only
towards limiting the consequences of dangerous situations that have already occurred. Still, the
reactive approach is valuable as there are cases when issuing notifications is useful for improving
traffic safety. For example, when a vehicle breaks down it would be difficult for nearby vehicles
to detect this event, whereas they can be timely and conveniently announced via a notification.
In terms of realization of the communication system, the proactive approach poses more
difficult problems than the reactive approach. Thus, the proactive approach requires special care
in designing the transmission procedures since it should assure the provision of vehicles with
accurate safety data in a regular manner and at short intervals. This may imply a constant high
occupation of the communication channel, which can induce problems such as difficulty of
accessing the transmission medium and information loss. In comparison, the reactive approach
needs only to accommodate bursty traffic and requires care in assuring the delivery of
notifications in an area of interest. In normal operations, such notifications should not be too
frequently issued.
Inter-vehicle communication and vehicle-to-road communication
The vehicular communication can basically take place only among vehicles (inter-vehicle
communication or IVC) or between vehicles and servers located on the roadside (vehicle-to-road
communication or VRC).
As previously mentioned, the development of a communication system between vehicles and
roadside has a series of disadvantages for implementing safety applications since vehicles need
to exchange data about each other. However, such systems can be used to provide vehicles with
additional safety services such as the road conditions in a certain area [OMT+99, MKA+00,
AHR01]. They can also provide delivery of information over wider areas, such as in the case of
distant notifications. For example, a traffic jam notification at long distance (e.g. 2- 5 km) can be
useful for drivers that may want to select another route to their destination. The use of an
infrastructure can also solve the problem of fragmented networks.

Chapter 3
46
The development of communication systems where vehicles directly exchange safety data
represents the best alternative for implementing safety services. However, the realization of these
systems is more difficult than using a road infrastructure, which can act towards managing the
communication.
Short-range and long range communication
The communication system operation can cover a large or a small area. We call short-range
communication the case when the system covers an area up to several hundreds meters (e.g. up
to 800 m); anything greater we refer to as long-range communication.
The development of a system using long-range communication for supporting collaborative
safety systems seems less appealing. This is because most of the proposed safety systems such as
collision warning and collision avoidance are based on information about nearby vehicles (e.g.
[KLP+99, ZKV00, TCE+00, PJL+00, MH02, BKP+02, KCF+03]). In addition, sending data in larger
area can have several disadvantages. More powerful transceivers are needed and this can
generate more interference. Even if a small transmission range is used, covering a larger area
requires extensive use of routing, which can lead to channel saturation. A number of related
works have shown in different contexts that long-range communication is less valuable for
exchanging data used by onboard safety systems (e.g. [AF96, KBS+01]).
The short-range technology specifies a small transmission range and is appropriate for the
transmission of safety data since neighboring vehicles usually have important information. With
an appropriate choice of the physical media, this technology can allow for high data rate and
lower interference levels [FAT99].
3.3.2 Networking technique3.3.2 Networking technique3.3.2 Networking technique3.3.2 Networking technique
The vehicular network can be mainly organized using a client-server [Tan04], or a peer-to-peer
[Gon01] approach.
The client-server approach implies that there is a central entity (i.e. a server) that regulates the
communication. When some service is needed, the clients contact the server, which provides the
requested service. This approach implies that a server is located on the roadside or one of the
vehicles assumes the role of the server. If a server is used, the vehicles need to communicate via
this server, which induces latency. As mentioned in the previous section, an extensive
infrastructure containing and linking the servers then needs to be built on all roads where the
service is provided. If the vehicles act as servers, they have to announce their existence to the
clients and then provide the services requested by them. The procedure of selecting and
replacing the server can be complex, and may involve extensive use of communication. This can
hinder or delay the exchange of traffic data. Furthermore, a server as the service provider
represents a bottleneck that can easily become saturated if many vehicles need the same service
at the same time. This is the case when all vehicles traveling on the same road sector solicit the
use of a safety service. In addition, the willingness of the car owner to let his/her vehicle act as a
server may be an issue.
Safety communication system analysis
47
The P2P networking approach does not require any centralized control to manage the network
behavior. Traditional P2P technology specifies that the communicating parties interact as equals
and there are no central units for managing the exchange of information [Gon01]. Mobile peer-to-
peer technology defines the application of the P2P networking approach in mobile environments
[KSP+01], such as in the vehicular environment. Several features recommend the use of this
technology for vehicular networking:
• Equal communicating hosts: assures that the communicating hosts have the same opportunity to send and receive safety-related data.
• Flexible interconnectivity: facilitates the direct establishment of the communication links between hosts, and thus the fast exchange of data within the network.
• Community-based communication: defines the virtual grouping of hosts that have similar interests.
A network formed by vehicles can be based on previous information or can be ad-hoc.
In a network based on previous information, the vehicles have communicated sometime
before, e.g. using a negotiation phase where vehicles select the communication partners. This
method usually implies that the communicating vehicles met each other in the past and kept data
about each other. However, keeping information about all the possible vehicles would not be
feasible. Also, vehicles may need data from vehicles they have not met before. Furthermore,
additional delays may occur when selecting the communication partners.
Ad-hoc connectivity implies a dynamic establishment of communication links between hosts
that do not need to have any previous information about each other. This type of connectivity
assures high flexibility of the link management, and allows the spontaneous establishment and
ending of the communication. Furthermore, it provides self-organization and supports the
development of a fault-tolerant network.
3.3.3 Transmission procedure3.3.3 Transmission procedure3.3.3 Transmission procedure3.3.3 Transmission procedure
Several transmission procedures may be applicable to vehicular communication. Unicast,
muticast, broadcast, and scoped broadcast [Sta04, WC02] are possible candidates.
Unicast specifies the transmission of data from a source to a specific receiver. Within the
vehicular network, this implies that the sender not only know the identity of the destination, but
also decide that this destination should receive its data. This can be difficult and time consuming,
as the sender needs to have previous data about the receiver in this case. Additionally, it is
uncertain if the receiver will actually need the data provided by the sender, as the traffic analysis
is performed from the point of view of the sender vehicle. A system of this type would also
require a data forwarding mechanism
Multicast specifies that a source sends data to a group of receivers defined using some common
properties. This implies that the sender knows the identity of the group and decides that this
group would make use of its data. Similarly to unicast, forwarding of information needs to be
implemented.

Chapter 3
48
Broadcast specifies the sending of data to all receivers in the transmission range, which can
further relay the received information. This type of communication eventually provides the
receivers with the data needed but potentially at the cost of a very high channel occupation. It
can thus provoke a broadcast storm, which leads to problems related to contention, collisions,
and bandwidth congestion [TNC+02]. Also, this method can induce information overload, as not
all the receivers will actually be interested in the received data.
A special form of broadcast is the scoped or directed broadcast, where senders broadcast their
data and the receivers use special techniques for filtering the information received and
eventually forwarding it. In this case, the senders need not know the identities of the receivers,
the information management can be improved, and the hosts can be provided only with the data
they can make use of. However, defining the methods for identifying the appropriate senders
makes this approach difficult to realize.
Finally, we comment on two concepts for exchanging data among vehicles: communication
based exclusively on physical data transfer and communication using contextual information.
The first concept is a method of communication that uses only techniques at the physical layer
to fulfill the requirements (e.g. encoding, modulation).
The second concept makes use of the above techniques, but tries to improve the information
management at higher layers by considering elements from the environment. Thus, techniques
such as information filtering and forwarding are designed to operate using contextual
information such as the position or velocity of vehicles.
3.4 Selected design features3.4 Selected design features3.4 Selected design features3.4 Selected design features
We selected the direct communication approach for developing a safety communication system.
We made this choice taking into consideration the scope of the system, the requirements on
safety communication, and the advantages of this approach in comparison with the other
approaches.
With regard to the operation mode of the communication system, both the reactive and the
proactive approach are important and can successfully support the reduction of the number and
the consequences of accidents. However, due to its advantages, the realization of a system using
the proactive approach is desirable. Therefore, we have primarily opted to build a
communication system that provides proactive operations. We further enhanced this system
with a reactive operation mode, as particular situations require that specific notifications be sent.
We also decided to encapsulate the safety data in short messages so as to optimize the use of the
communication channel. This type of messages is also appropriate since data required for traffic
analysis by active safety systems tends to be compact [MKO00, KTT+02, MH02]. The use of short
messages also facilitates the fast update of safety information, which is essential for an accurate
assessment of dangers in traffic [KBS+01]. To implement the proactive and the reactive operation
modes of the system, we allow the communication system to use both regular updates of data
concerning traffic safety and event-based communication. Thus, hosts issue messages containing
Safety communication system analysis
49
safety information on a regular basis. Additionally, they can issue dedicated messages when
significant events occur in traffic.
Due to the benefits of direct communication, this method was chosen as the primarily means
for data exchange. However, by acknowledging the advantages of using a road infrastructure
when one exists, we have considered a unified view of the vehicular communication by merging
inter-vehicle communication with vehicle-to-road communication. We still call this direct
communication, as in this case the vehicles communicate directly one to another, but can also
have a direct communication with some devices installed on the roadside. Thus, vehicles
traveling on roads and fixed communication entities that can be located on the roadsides are
considered part of the same vehicular network and can communicate using the same protocol.
We emphasize that the vehicles can communicate with an infrastructure but the communication
is not based on such infrastructure.
We have selected short-range radio communication due to its advantages for exchanging
safety data among vehicles. We have not opted for a specific wireless media because we aimed at
developing a system that is able to use different technologies if this is needed. Nevertheless,
certain requirements regarding transmission properties such as medium access, propagation, and
interference need to be fulfilled by the media employed. Current systems working in microwave
and millimeter-wave bands (e.g. around 2.4 GHz, 5.9 GHz, 60 GHz or 76 GHz) are the most
suitable for implementing vehicular communication. Examples of advantages provided by such
systems are narrow radio beams, reduced interference, and the possibility of having a wide band
data transmission [FAT99]. Differences exist between these systems in terms of their Quality of
Service (QoS). However, they are generally considered well adapted for supporting
communication in the vehicular environment [ONS+00].
As a networking technique, we have opted for the mobile P2P. However, since we also allow
VRC, we see the network more as a hybrid P2P network, where the hosts have the possibility of
soliciting specific services from dedicated hosts (i.e. servers that can be located on the roadside).
This network is formed in an ad-hoc manner.
The selected transmission procedure was scoped broadcast due to its advantages over the other
procedures, and the possibility of realizing a communication system that takes advantage of the
specific environment where the exchange of data takes place. Thus, we propose techniques for
network management and information dissemination that take into consideration the current
traffic situation of the communicating hosts.
As the concept for communication, we have opted for communication using contextual
information. This is because one of the most dominant characteristics of the vehicular
environment is that vehicles react and coordinate their driving maneuvers according to their
traffic situation, and according to actions performed by nearby vehicles. This creates a unique
need for situation awareness that we intended to provide support for in our vehicular
communication system.


51
4. Vehicular communication specifications
We present in this chapter the communication and networking techniques that we propose for
organizing the vehicular network and for exchanging safety data in the vehicular environment.
We also introduce a vehicular communication platform intended to provide an implementation
framework for these techniques, and to integrate the resulting communicating system within a
vehicle.
4.1 Overview of networking and communication 4.1 Overview of networking and communication 4.1 Overview of networking and communication 4.1 Overview of networking and communication
The communication needs to provide timely and reliable exchange of safety data among vehicles.
Random establishment of communication and frequent link failures need to be considered.
Frequent transmission of data by a significant number of vehicles located in a small area needs to
be accommodated. Forwarding of data may also be necessary. Additionally, the vehicles should
be able to select the important information from the received data. The vehicles should also be
able to send both regular data describing their current view of the traffic, and emergency
notifications about hazards in traffic.
Considering the above factors, we apply two methods for controlling the dissemination of
safety information in the vehicular environment. First, we define an organization of vehicles in
virtual clusters, which help in managing the vehicular network. These clusters are created and
maintained according to the current interest in traffic safety of the vehicles. Second, we design a
special communication protocol, an anonymous context-based broadcast protocol. This is a
scoped broadcast where vehicles send safety data and the receivers need to determine if they are
the intended destination of the received data. For this, the receivers use a context-based filtering
of information. The filtering is based on a set of rules defined using research results in crash
analyses and guidelines for developing active safety systems. In this thesis, we illustrate the
protocol operation with a basic set of rules as a proof-of-concept. We present below an overview
of the network organization and the communication protocol. The following sections give details
on the specific techniques that we have developed.
Vehicular network organization is essential for obtaining scalable and reliable communication.
However, due to the very large number of vehicles, a system for tracking them all would be
unfeasible. Additionally, only vehicles that are in close proximity one to another usually provide
useful information [ZKV00]. Furthermore, a vehicle would not benefit by having data about a
very large number of vehicles [AG96]. A solution that matches traffic dynamics is the
organization of vehicles in manageable clusters. Therefore, we propose that the hosts (e.g.
vehicles) organize themselves into Local Networks (LN) in which they exchange safety
information. We define a local network as a community of hosts that share a common interest in
the current traffic situation. A host belonging to a local network maintains information about
other hosts from the same local network. However, for determining changes in the local network,
a host also needs to analyze data sent by hosts not currently belonging to the same local network.
A formal definition of local networks is provided below. We define a set V of vehicles equipped

Chapter 4
52
with communication devices and a set F of fixed hosts such as servers that can communicate with
vehicles. A local network is defined as the set of hosts H that share a common interest in traffic
safety. This interest is defined as a set of conditions that model a traffic situation in which the
hosts exist at a given moment. Examples of such conditions are the separation distance between
vehicles, the driving orientation and the velocity of vehicles, and the characteristics of the road
on which the vehicles travel (e.g. slipperiness). The formal definition of a local network LNi is:
LNi⊆ F ∪ V, i ∈ N (N is the set of natural numbers)
∀ Hj, Hk ∈ LNi | Interest (Hj) ∩ Interest (Hk) ≠ ∅
An example of the vehicular network organization is given in figure 4.1, where two local
networks, one formed by three vehicles and a server (i.e. LN2), and another formed by two
vehicles (i.e. LN1), are illustrated.
Figure 4.1 Local networks example
The specific methods for organizing and managing local networks are presented later in the
chapter. Below, we give an overview of the criteria used for determining if vehicles are of interest
one for another. Thus, the criteria were:
• C1. Vehicle’s locations.
• C2. Service area extent.
• C3. Local network composition.
• C4. Parameters of the driving situation, e.g. relative distance between vehicles, relative
heading, road status, vehicle status, road type.
Criterion C1 is due to the fact that positioning data are needed by in-vehicle safety systems to
identify dangerous situations. For the vehicles to have location information, we considered them
equipped with accurate positioning devices. This assumption is feasible since the market
penetration of positioning devices is growing rapidly [Jon01], and their accuracy can be less than
one meter [MDF+00, MH02, KTT+02]. For example, Global Positioning System (GPS) [GWA01]
receivers can be used if they can give a precise indication of the position. However, the basic GPS
system may not be accurate enough and improvements to it were developed, thus differential
GPS systems and assisted GPS systems were proposed [MDF+00, DR01]. Also, since the GPS
system is based on satellite communication, the positioning system should be enhanced with
techniques such as Dead Reckoning [WM00], which supplements the possible temporary loss of
satellite visibility. We note that alternative position systems can also be used, and the research
Local Network (LN2) Local Network (LN1)

Vehicular communication specifications
53
area of positioning in vehicular networks is rapidly growing. For instance, the applicability of
positioning techniques using radio ranging technologies (e.g. [MDF+00]) or of localization
algorithms for wireless nodes (e.g. [CMH01, MLR+04]) in vehicular network are currently under
investigation.
Criterion C2 is defined because research in traffic safety has indicated that vehicles in
proximity usually have important data (e.g. [ZKV00]). In our work we have primarily considered
a 300 m service area, which we encoded as Service Area Threshold (SAT). For defining the
service area size we investigated proposals for safety systems such as in [KLP+99, ZKV00,
TCE+00, PJL+00, MH02, BKP02, KCF+03]. The systems proposed in these works use sensors for
detecting dangers around a vehicle. The development of these systems included extensive
studies of the drivers’ requirements and vehicles kinematics for defining the detection zone of
the safety system. For instance, the range of forward collision warning (FCW) systems was
defined as a function of the relative velocity of the vehicle on which the system is installed, and
an identified collision object. Such systems specify a detection range of at least 100 meters
[ZKV00]. However, most of the systems studied were autonomous, since as far as we know, very
few proposals for collaborative systems exist. Using wireless data exchange, the detection of
dangers in larger areas should be employed, since this is one of the main advantages of
collaborative systems. Therefore, the service area of the communication system needs to be larger
than the area defined for autonomous systems. Our selected value was thus three times larger
than the value proposed for FCW systems. We also investigated via simulations the
appropriateness of this value, and alternatives to it, from the communication performance point
of view.
Criterion C3 is defined based on traffic analyses that indicated that the number of vehicles
having important traffic data is usually limited (e.g. [AG96]). Thus, the local network
composition sets an upper bound for the number of hosts that can coexist in a local network at a
given moment. To be able to assess dangers in traffic, a vehicle needs to keep data about a
number of vehicles in front of, behind, and lateral to [ZKV00] itself. Considering the accident
dynamics, keeping data about several vehicles in front, both in the same lane and on adjacent
lanes is of major importance. Also, the information about vehicles situated immediately behind
or two vehicles behind a subject vehicle, which travel in the same lane and on adjacent lanes, is
important [MCG+02]. In addition, data about vehicles situated in front and behind a subject
vehicle that travel on lanes that are not adjacent may be of use. However, research in traffic
safety has indicated that having information about more than 3-4 vehicles traveling in front of a
subject vehicle does not contribute to the improvement of traffic safety [AG96]. Considering the
above points, the number of vehicles a subject vehicle has interest in can be limited. For example,
on a bi-directional road with one lane per direction a vehicle may need to keep data about 3
vehicles in front of or in parallel to it in both directions, 2 vehicles in behind it in the same lane,
and 2 vehicles behind it in the adjacent lane (i.e. since these vehicles may be involved in an
accident that propagates and can affect the subject vehicle). This sums up to 10 vehicles. In our
proposal we encoded the number of hosts that can coexist in a local network as the Maximum
Number of Hosts (MNH). With consideration given to a wide variety of traffic scenarios (e.g.

Chapter 4
54
[KLP+99, BKP+02, TCE+00]), the most common size of vehicles (e.g. 4-7 meters), the average
number of lanes of a road (e.g. less or equal with 6), and the size of the communication area, an
appropriate range for MNH would be from 10 to around 40 vehicles. Therefore, we empirically
set MNH to 20 and investigate the appropriateness of this value in different scenarios. We note
that MNH can also be adapted depending on the type of road on which the vehicles travel.
Criterion C4 addresses parameters indicated in accident reports as important for the
development of traffic situations into accidents (e.g. [USDT99, NSD01, SSN03, USC03, Eva04]).
These parameters are used by in-vehicle safety systems (e.g. collision warning and collision
avoidance) for identifying hazards in traffic (e.g. [TCE+00, PJL+00, KCF+03]).
The communication protocol that we propose employs anonymous broadcast for
disseminating short messages between vehicular hosts. Each host broadcasts short messages that
can be received by other hosts in its transmission range. We did not consider the addresses of the
communicating hosts to be a priori known. Therefore, our protocol requires the receivers to
analyze the content of the received messages to determine if they are the intended destination.
When the information embedded in a received message is considered important for traffic safety,
the receiving host accepts this data. Otherwise, it discharges the message. A receiver can also
decide to forward a message based on the embedded data. Consequently, the communication
protocol is context-based. We refer to the process of analyzing, considering, dropping, or
forwarding a message by a host as information filtering and forwarding. To implement the
filtering and forwarding of data, a host considers various elements related to its current traffic
situation. The communication is illustrated in figure 4.2, where the white boxes represent data
describing other hosts that was accepted by the respective vehicle. This data is further used for
organizing and maintaining local networks. As previously mentioned, the protocol functionality
is dual, i.e. proactive and reactive. For the constant update of data describing the traffic, we
defined Basic Safety Messages (BSM). We also allowed vehicles to communicate with servers
located on the road side if these exist. Consequently, the content of basic messages is different for
vehicles and for fixed hosts because the latter are not characterized by motion parameters. For
simplicity, throughout this chapter we use the terms basic safety message and basic message
interchangeably. For sending notifications about hazards in traffic we defined Warning Messages
(WAM). We note that other types of messages can be defined to extend the protocol
functionality.
Figure 4.2 Communication example
V2 records
V1 data: speed, position…
V1 records
V2 data: speed, position…
V3 data: speed, position…
V3 records
V1 data: speed, position…
V1
V2
V3
Vehicular communication specifications
55
4.2 Protocol operations4.2 Protocol operations4.2 Protocol operations4.2 Protocol operations
The protocol functionality relies on the following rules for information management:
Rule I. Acceptance of a message by a host. Received basic safety messages and warning messages
can be accepted if the information filtering indicates that they contain data of interest.
The information contained by accepted messages is written in a database associated with
the communication protocol. Messages that were already accepted or are older than the
currently accepted messages received from the same senders are dropped. All messages
that are not accepted are dropped.
Rule II. Local maintenance of data describing senders. A host H maintains data about a sender host S
as long as within a time interval T_record another BSM from S is received by H. If this
event does not happen and the time interval T_record has passed, the host H removes all
information about host S. When a new BSM is received by H and the information
contained by it is recorded, the time interval T_record related to this record is
reinitialized.
Rule III. Generation and transmission of Basic Safety Messages. A host H generates for transmission
basic safety messages at short regular intervals. A timer Tint_BSM is associated with the
generation of these messages and is initialized each time a BSM is transmitted. When this
timer triggers, a new BSM is generated for transmission. If, due to medium access, a BSM
cannot be transmitted until a new BSM is generated, the old BSM is erased and the new
BSM is considered for transmission.
Rule IV. Transmission of messages other than Basic Safety Messages. Messages other than BSMs are
transmitted as the result of events that occurred in traffic.
Rule V. Forwarding of messages. Basic safety messages can be forwarded based on specific
methods that depend on the organization of the vehicular network. Warning messages
are also subject to retransmission.
Rule VI. Priority of messages. Warning messages and basic safety messages sent by a subject host
have the highest priority. Routed BSMs and retransmitted WAMs have lower priority
and are sent after high priority messages.
Rule I is employed because the basic safety messages contain the information necessary for a
receiver to determine if a sending host is of interest. Additionally, a host is allowed by default to
accept any received warning message. However, the protocol can be configured to specify the
conditions that need to be fulfilled for a host to accept warning messages. These settings are
introduced when we present the safety information content and digest. Rule II is used to avoid
the maintenance of stale data about hosts that are not of interest anymore. Rule III assures that a
host regularly provides the other hosts with up-to-date data describing its view of traffic
conditions. Rule IV is used to generate notifications about dangerous events or other events of
interest that may occur in traffic. Rule V is employed because there are situations when
information forwarding is needed to provide the hosts with more complete traffic data. Rule VI is
employed because any subject host is primarily interested in successfully sending its own

Chapter 4
56
messages (i.e. BSMs and WAMs) so the other traffic participants can acquire timely knowledge of
its characteristics and situation in traffic. If a WAM and a BSM compete for transmission, we
choose to let the WAM be transmitted first. This is because the WAM describes a danger that
already exists.
The conceptual representation of the protocol functionality for reception of messages and for
transmission of BSMs and WAMs is presented in figure 4.3 and 4.4 respectively.
Figure 4.3 Communication protocol functionality - message reception
Figure 4.4 Communication protocol functionality – message transmission
The procedures used by a host for accepting, sending, and forwarding messages make use of the
information recorded in the database associated with the communication protocol. Therefore, the
database is updated at very short intervals (i.e. 5 ms) with data describing the subject host. In
addition, the database is updated when a message is accepted, and when a message is issued by
the subject host.
All messages that need to be sent, with the exception of basic safety messages generated by the
subject host, are recorded in a dedicated queue of the communication protocol. This is because
they may not be transmitted immediately due to transmission problems such as medium access,
or they need to wait until higher priority messages are transmitted. The queue is divided into
Transmitted BSM
BSM routing
mechanism
Create and send
BSM
Tint_BSM timer
Transmitted WAM Retransmitted WAM Routed BSM
Create and send
WAM Resend
WAM?
Expired
timer?
YES
Accepted BSM Accepted WAM
YES
Received message
NO
YES
Timeout
data? Communication system timer
YES
Drop message Information filtering Data of interest?
Write data in database Delete outdated records
Communication
system database

Vehicular communication specifications
57
four sections: one for WAMs sent by the subject host, one for retransmitted WAMs, one for
routed BMSs, and one for other messages if they are defined. Each section operates following the
FIFO (first-in-first-out) model, and the transmission of messages from the queue is controlled by
their priority. As previously mentioned, WAMs and BSMs issued by the subject host, which have
the highest priority, are sent before any other messages. Then, retransmitted WAMs and routed
BSMs are transmitted. Each section of the queue has an associated timer that controls its
operations. Thus, when a section is not empty, it tries to empty itself after a short interval (i.e.
0.01 s), which is measured by the associated timer. However, the messages are transmitted only if
their priority allows this, and certainly, if the transmission medium can be used. Each section of
the queue continues to try to empty itself until no messages are left. Old messages are usually
erased after a time interval, which is dependant on the protocol implementation. We note that
other control elements (e.g. specific timers) can be associated with the queue when specific
methods are used for sending messages. For instance, we defined specific time randomizers
associated with the sections where routed BSMs and retransmitted WAMs are recorded. These
timers are used by the information forwarding techniques. For practical reasons, the sections of
the queue are limited in size. If they overflow, the oldest message from the section is removed
and the current message is inserted.
BSMs generated by the subject host are intended to be sent immediately after they have been
issued. However, this may not be possible due to problems in accessing the transmission
medium. Therefore, a generated BSM is kept in a one-dimensional transmission buffer. If a new
BSM is generated and the buffer is not empty, i.e. an older BSM was not yet transmitted, the
content of the buffer is erased and the new message is written into it.
4.3 Network operations and organization4.3 Network operations and organization4.3 Network operations and organization4.3 Network operations and organization
Network operations overview
The management of local networks is done via specific network operations that consider data
provided by the filtering mechanism, data registered in the communication system database, and
timeout information provided by the system timer. These operations are:
• Initiate a local network
• Add a host to a local network
• Remove a host from a local network
An overview of the network management is given in figure 4.5.
Figure 4.5 Network management overview
Network management
Communication system timer Communication
system database Information filtering
Network operations

Chapter 4
58
Vehicular network organization
We define and discuss here two conceptual methods for organizing the vehicular network. These
methods are focused on the individual and the associative nature of the traffic; we call them host-
oriented organization and cluster-based organization.
Host-oriented organization is based on the individual nature of a host focused on avoiding
accidents. Within this method, each host defines, constructs, and maintains its own local
network. In case of a vehicle, this network is initiated as soon as it enters the traffic. For a fixed
host, the network is initiated when this host becomes operational. Within this approach, each
host takes the role of an organizer host by analyzing the information received from other hosts
and deciding which of them should belong to its own local network. This group of hosts is
continuously updated. The removal of hosts from a local network is time-based, i.e. if the
information describing a host is not updated in a time interval, this host is removed. When
employing the host-oriented approach, the local networks corresponding to different hosts can
overlap. In addition, the hosts are responsible for sustaining the global traffic awareness by
forwarding some of the information received. An example is presented in figure 4.6. In this case,
each vehicle creates its local network according to its current interest in traffic safety. For
example, V1 and V3 are part of V2’s local network, but only V3 is part of V4’s local network.
Figure.4.6 Host-oriented organization example
Cluster-based organization is based on the associative nature of the traffic for forming distinct
groups of hosts with a similar interest in traffic safety. Thus, the hosts deciding that their traffic
safety can benefit from such an association form local networks. An example of four vehicles
traveling on a road with a divider is presented in figure 4.7. Here, V1, V2 and V3 decide to form a
local network. V4, which travels on the other side of the road, is not part of this local network
since its traffic data is of no immediate interest for the other three vehicles.
Figure.4.7 Cluster-based organization example
Local network V4 Local network V1
V1 V2
V3 V4
Local network V2 Local network V3
Local network V1, V2, V3
V1 V2 V3
V4

Vehicular communication specifications
59
Within the cluster-based organization, each host belonging to a local network has to maintain
information about all the other hosts from the local network. Therefore, each host needs to be
provided with management functions for joining, leaving, or initiating a local network. A basic
method for joining and establishing local networks is using time constrains. Thus, if a host enters
the traffic and does not receive within a time interval information of interest about a currently
formed local network, it initiates a new one. Otherwise, the host joins an existing local network.
As mentioned before, host membership to a local network is interest-dependent. Thus, a host can
choose to join another local network if the data sent by hosts belonging to it is considered more
valuable than data sent by the members of the local network in which the vehicle is currently
registered. When a member leaves a local network, the other hosts need to remove the data
associated with the departing host. This can be done using a time-based method, or issuing a
leaving announcement. The sending of a leaving announcement has several drawbacks. Due to
the frequent fragmentation of the network, such notifications may need to be sent very often.
This may lead to an overload on communication and can hinder the reception of more important
data. Also, the leaving notification may not reach some hosts if the network is fragmented.
Therefore, we consider more appropriate the basic time-based method that requires a host to
remove the records associated with other hosts if the data describing them is not updated within
a time interval. An extension of the cluster-based organization is to allow the hosts to be
members of more than one cluster. This approach can allow better analyses of complex traffic
situations but impose difficulties in managing local networks, as a host needs to have data about
hosts from different local networks. Since a host aims to keep data about all members of a local
network but the composition of the network is limited (and implicitly the number of hosts a
subject host can keep data about is also limited), additional network management functions are
needed.
The host-oriented organization considers each host to be responsible for organizing its own
local network according to its singular interest. The cluster-based organization assumes a group
of hosts is collaborating to organize a local network. These hosts aim at maintaining consistent
group membership throughout the local network. The establishment and maintenance of local
networks is more flexible within the host-oriented organization, since every host decides whether
or not to register sender hosts. Thus, operations such as joining or exiting a local network are not
necessary. We note that these procedures can be quite complex in the cluster-based approach, as
the hosts need to collaborate to establish and maintain the local network. Additionally, a strict
cluster-based organization may not always accurately represent the safety needs of vehicles in
traffic. For example, hosts situated at the borders of local networks may not benefit from data
sent by hosts that are part of adjacent local networks. This is because the hosts maintain only data
sent by members of the same local network. This situation can be improved by using multiple
memberships and forwarding of information between local networks.
In both approaches, situations can exist in which a host is not able to directly receive
information of importance for its traffic safety due to communication problems (e.g. packet
collision, shadowing). Therefore, we provided the hosts with the capability to retransmit, when
necessary, received safety data. We note that in both cases this can pose difficulties, as the hosts
Chapter 4
60
may need to identify other hosts that do not have data about one another. Within the cluster-
based approach this may be simpler to implement as a member of a cluster should have
information about all the other members. Still, when the cluster is formed the vehicles that
should be part of it may be not included if their communication partners do not try to resend
their data. To keep the hosts informed about dangerous situations in traffic, we allowed them, by
default, to accept warning messages sent even by hosts that are not part of their local network.
Warning messages can, however, also be set to be delivered only within a local network.
Considering the issues mentioned above, we decided to focus on the development of a safety
communication system using the host-oriented approach. We note that work has also been done
on the cluster-based approach, but more investigations are needed to assure proper operations.
Consequently, we see this approach as subject for future work.
In the rest of this chapter, we present details on the techniques proposed for implementing data
communication and network management with consideration given to the host-oriented network
organization.
4.4 Safety information4.4 Safety information4.4 Safety information4.4 Safety information
As previously mentioned, our protocol uses basic safety messages (BSMs) for proactive
operations and warning messages (WAMs) for reactive operations. The size of each type of
messages and the format of the message fields are implementation-dependant. BSMs include
information used by safety systems (e.g. collision warning and avoidance) to determine if a
dangerous situation has occurred or could occur in traffic in the near future. Thus, the content of
these messages was defined considering the information needed by safety systems and data
relevant to assessing the possibility that accident could happen [MH02, KCF+03, KLP+99,
TCE+00, ZKV00, Eva04]. However, since it is possible for future systems to need or use
additional data, we provided a reserved field in the message structure where such information
can be encoded.
We note that the large majority of events in traffic should be determined using the data
included in BSMs. Therefore WAMs should mainly address those situations where an explicit
notification can significantly help increase traffic safety or traffic convenience. An example of
such a situation is a major vehicle failure that makes this particular vehicle dangerous to other
traffic participants. As presented below, we included in BSMs information about vehicle status.
We also provided the possibility of including additional data about the vehicles’ components
(e.g. brake and steering wheel status). Still, in case of sudden failure of a vehicle, it is appropriate
to rapidly warn the nearby vehicles, as this helps in obtaining a more efficient response to the
situation. Another example in which WAMs are useful is an indication about a traffic jam that
can be used to reduce the impact wave on the traffic, avoid sudden braking of a vehicle, and
allow a driver to choose an alternate route to a destination. We note that the generation and
transmission of emergency notifications is closely related to the functionality of the onboard
safety system. Such a system is responsible for determining when danger occurs and when
notifications need to be sent. The safety system should also specify how a warning message

Vehicular communication specifications
61
should be send, e.g. its frequency and time validity, in order for the data provided via this
notification to be valuable for other vehicles. Therefore, in our protocol we have mostly focused
on supporting the efficient distribution of warning messages rather than providing specific
techniques for disseminating WAMs in particular situations. This is because covering the whole
range of such situations would be infeasible. We also believe that the specific processing of
warnings should be part of the functionality of the safety systems rather than part of the
communication system. Thus, we provide a general mechanism for issuing warnings, which can
be further specified for different safety applications.
4.4.1 Basic safety messages 4.4.1 Basic safety messages 4.4.1 Basic safety messages 4.4.1 Basic safety messages
Each received BSM that has not been previously received is analyzed by the receiving host to
determine if the data contained by it is of importance. If this is the case, the receiver accepts the
message and records the data. Otherwise, the message is dropped. An accepted message is
forwarded if the mechanism used for information forwarding indicates this. The BSMs are
different for vehicles and for fixed hosts since the fixed hosts are not characterized by motion
data. The basic safety messages contain two identifiers indicating the identity and the type of the
sender host. Each host has a unique identity (e.g. the serial number of the installed
communication equipment). The host type is encoded via two values: fixed and vehicle. Each BSM
also contains a sequence number. Each time a message is sent, the sequence number is increased
and included in the message. When the counter for the sequence number reaches its highest
possible value, it returns to null and then starts counting again. The maximum value of the
counter is implementation-dependant but needs to be large enough to accommodate the
transmission of a large number of messages. A host that maintains data about a sender does not
accept a BSM from this sender if the message has a sequence number smaller than a previously
accepted message received from the sender. (We note that an exception is made for messages
with very small sequence numbers such as 0, 1, or 2 that are received after messages with
sequence numbers close to the maximum possible value of the sequence counter).
BSM messages for vehicle hosts
The structure of BSMs for vehicles is presented in table 4.1.
Table 4.1 Basic Safety Message – vehicle host
TID - Type identifier
SID = Sender identity
MSqn = Message sequence number
PS1 = First (latest) positioning
indication
PS2 = Second (earlier) positioning
indication
VSp = Vehicle speed
VSt = Vehicle status
VHd = Vehicle heading (if available)
HIDs = Identities of hosts in sender local network
RID = Road identity (if available)
RT = Road type (if available)
RSl = Road slipperiness indication (if available)
NH = Number of hosts in the sender local network
RSp = Road speed limit (if available)
OI = Other information e.g. brakes status, blinkers
status (Note: field currently reserved)
TID SID MSqn PS1 PS2 VSp VSt VHd HIDs RID RT RSl NH RSp OI
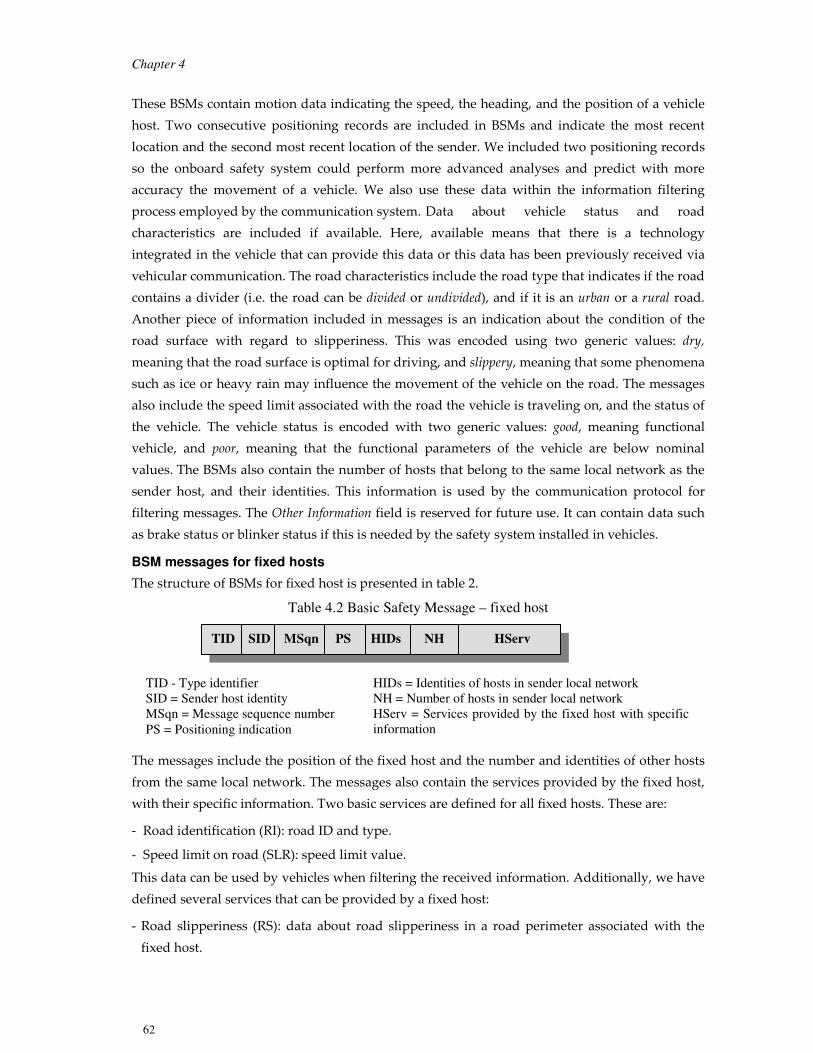
Chapter 4
62
These BSMs contain motion data indicating the speed, the heading, and the position of a vehicle
host. Two consecutive positioning records are included in BSMs and indicate the most recent
location and the second most recent location of the sender. We included two positioning records
so the onboard safety system could perform more advanced analyses and predict with more
accuracy the movement of a vehicle. We also use these data within the information filtering
process employed by the communication system. Data about vehicle status and road
characteristics are included if available. Here, available means that there is a technology
integrated in the vehicle that can provide this data or this data has been previously received via
vehicular communication. The road characteristics include the road type that indicates if the road
contains a divider (i.e. the road can be divided or undivided), and if it is an urban or a rural road.
Another piece of information included in messages is an indication about the condition of the
road surface with regard to slipperiness. This was encoded using two generic values: dry,
meaning that the road surface is optimal for driving, and slippery, meaning that some phenomena
such as ice or heavy rain may influence the movement of the vehicle on the road. The messages
also include the speed limit associated with the road the vehicle is traveling on, and the status of
the vehicle. The vehicle status is encoded with two generic values: good, meaning functional
vehicle, and poor, meaning that the functional parameters of the vehicle are below nominal
values. The BSMs also contain the number of hosts that belong to the same local network as the
sender host, and their identities. This information is used by the communication protocol for
filtering messages. The Other Information field is reserved for future use. It can contain data such
as brake status or blinker status if this is needed by the safety system installed in vehicles.
BSM messages for fixed hosts
The structure of BSMs for fixed host is presented in table 2.
Table 4.2 Basic Safety Message – fixed host
The messages include the position of the fixed host and the number and identities of other hosts
from the same local network. The messages also contain the services provided by the fixed host,
with their specific information. Two basic services are defined for all fixed hosts. These are:
- Road identification (RI): road ID and type.
- Speed limit on road (SLR): speed limit value.
This data can be used by vehicles when filtering the received information. Additionally, we have
defined several services that can be provided by a fixed host:
- Road slipperiness (RS): data about road slipperiness in a road perimeter associated with the
fixed host.
TID - Type identifier
SID = Sender host identity
MSqn = Message sequence number
PS = Positioning indication
HIDs = Identities of hosts in sender local network
NH = Number of hosts in sender local network
HServ = Services provided by the fixed host with specific
information
TID SID MSqn PS HIDs NH HServ

Vehicular communication specifications
63
- Road hazards (RH): indications about hazards associated with the road such as the existence of
current working places and dangerous spots.
- Warning messages store&relay (WSR): indication of the fact that the fixed host is configured to
store and retransmit certain warnings.
- Other services, e.g. infotainment: the identities of other services.
We note that to provide some of the services above, the fixed hosts need to be equipped with
devices that allow collection and analysis of traffic data, e.g. for determining the road
slipperiness or the road congestion. The RS service provides data used by vehicles for assessing
the possibility of dangers in traffic. This data is also used when filtering received messages. The
RH service provides information that can be used by collision warning systems for notifying the
driver. The WSR service specifies that a fixed host can keep for a certain interval an accepted
warning message, and then retransmit it. This depends on the type of emergency indicated in the
warning message. This service is provided to notify upcoming vehicles about a dangerous event
that exists on the road, because those vehicles may not have received data about the event due to
network fragmentation. Previous works (e.g. [BH00]) have indicated the advantages of using
such technique when disseminating data about dangerous events in traffic (e.g. data about traffic
jams).
Transmission rate for Basic Safety Messages
BSMs are designed to provide a vehicle with accurate and timely information describing the
current traffic situation. These messages need to be delivered in a timely manner, and need to be
sent frequently enough that vehicles are able to perform a correct assessment of hazards in
traffic. However, the channel bandwidth is limited, and delivering BSM with very high
frequency can lead to channel congestion, and consequently to higher delays and information
loss. When many vehicles travel on the road, the problem is more acute as the contention for the
medium is higher. Therefore, to define an appropriate value for the transmission rate of BSMs,
both the requirements of safety applications and the load on the communication channel need to
be considered.
Two approaches can be taken to disseminate BSMs: a fixed rate approach, where BSMs are
transmitted at fixed time intervals, and an adaptive approach, where BSMs are transmitted at
varying time intervals. In this work we have limited the fixed hosts to the use of the first
approach, as they only provide services for vehicles when they exist on the road. For BSMs
generated by vehicles, we have investigated the use of both approaches. For the fixed rate
approach, we investigated appropriate values for the transmission intervals from a
communication point of view, and compared the results against the demands of safety
applications. For the adaptive rate approach, we considered diverse aspects of the traffic
dynamics, and offer in the following an example based on the velocity of vehicles.
The goal of the adaptive approach is basically to control the transmission rate so as not to
overload communication, while keeping the hosts informed. One solution may be to apply
empirical algorithms that use an additive or multiplicative method for reducing the transmission
rate once some vehicles are aware of each other. In this case, the transmission rate is decreased

Chapter 4
64
with a fixed value every time when a number of messages (e.g. 100) is generated. The process is
repeated until a minimum value of the transmission rate is reached. However, this may leave
hosts uninformed as new vehicles may join the traffic. Therefore, we considered the use of
contextual information to adapt the transmission rate. We note that the applied algorithms need
to be general enough to accommodate a variety of traffic situations. For very specific situations
such as traffic jams or singular accidents on highways it is also possible to apply more specific
algorithms, such as the algorithms proposed in [BH00] and [YLZ+04].
An interesting aspect in the dynamics of traffic is the relationship between the velocities of the
vehicles and the traffic density. When a low number of vehicles are on the road, their velocities
can be high as traffic flows freely [RML02]. At high velocities the vehicle distribution is lower as
the separation spaces between vehicles are relatively high. For dense traffic the velocities of the
vehicles are reduced, and have fairly low values for very dense segments of traffic [Eva04].
Consequently, when vehicles travel with low velocity, the transmission rate of BSMs can be
lower since the movement characteristics of the vehicles do not change rapidly, and in-vehicle
safety systems can still correctly identify hazards in traffic. When the velocity is higher, the
frequency of sending BSMs also needs to be higher as major changes in position are frequent. We
note that the disseminating rate of BSMs needs to have both a minimum boundary that supports
an efficient operation of the safety system, and a maximum boundary that prevents channel
overload.
In the following, we introduce a proposal for an algorithm that considers the velocities of the
vehicle when adapting the transmission rate of BSMs. This algorithm specifies the calculation of
the transmission interval between two consecutive BSMs. We differentiate between velocities
that are characteristics to urban roads and velocities characteristics to highways and country
roads. We note that regular speed limits in many EU countries are 30 to 50 km/h in residential
areas, 70 to 90 or 100 km/h for country roads, and 100 to 150 km/h for highways. We define the
maximum time interval for delivering BSM as Tmax_BSM and the minimum interval as
Tmin_BSM. Based on previous studies (e.g. [WH98, KTT+02]) and analyses of traffic accidents,
we set Tmax_BSM to 0.5 seconds and Tmin_BSM to 0.1 seconds. We define Vmin as a minimum
of the regular velocity for a vehicle, and set it to 20 km/h. We then define a high velocity
threshold Vhst as a minimum of the velocity regularly used by vehicles on higher-speed roads:
We set this parameter to 90 km/h based on the speed limits on rural roads in many EU countries.
Considering the above parameters, the transmission interval Tint_BSM for BSMs is defined
below. Vveh is the current velocity of a vehicle.
>
≤<
≤
=
VhstVvehBSMT
VhstVvehVVveh
VBSMT
VVvehBSMT
BSMT
,min_
min,min
*max_
min,max_
int_
We note that the third member of the above formula can be modified to be similar to the second
member, in which case a smaller transmission interval can be obtained for relatively high speeds.
However, this can also lead to a more extensive use of communication. Therefore, we choose to
impose a fixed transmission interval for high speeds that is appropriate for diverse traffic safety
Vehicular communication specifications
65
applications and may not introduce channel congestion. We also note that the above method is
general, so as to cope with all traffic situations, and further specifications of rate adaptation
algorithms are possible, and are subject to future work.
4.4.2 Warning messages4.4.2 Warning messages4.4.2 Warning messages4.4.2 Warning messages
Warning messages (WAM) can be generated when emergency situations occur in traffic. The
sending and forwarding of warning messages are regulated by the functionality of the safety
systems located in a vehicle. These systems are also responsible for settings the parameters in the
warning messages and indicating if the warnings should be delivered locally, i.e. within the local
network of the sender, or should be delivered in an area beyond the local network. It is of great
importance to achieve a strong correlation between the detection of hazards and the generation
of warnings. Thus, there are situations when vehicles may not need to issue notifications on their
own, but only relay WAMs received from other vehicles. This helps to avoid communication
channel overload. For example, when a vehicle is stopped in a driveway, the vehicles
approaching it significantly reduce their velocities. As a consequence, they can generate
notifications to warn upcoming vehicles. These notifications are further relayed by the receiving
vehicles. Vehicles that are at some distance from the event can experience the same speed
reduction and can issue their own WAMs. Obvious, this increases the load on the channel as the
new and the older messages (i.e. the forwarded messages) coexist in the network. However, if the
vehicles corroborate the reduction of their speed with the reception of the notification about the
stopped vehicle, they can refrain from transmitting their (own) notifications. New transmission is
unnecessary because new notifications would refer to the same event and other vehicles should
be informed about it via the initial WAM and its retransmissions. However, special attention
needs to be given to such processing and the identification of situations when explicit
notifications should not be sent so as to avoid leaving vehicles uninformed.
To generate warnings, we have identified two main approaches: singular generation and
continuous generation. The first approach specifies that a WAM is issued when the safety system
identifies an existing dangerous situation in traffic. This message is then repeated a small number
of times, (e.g. 3-5) to increase the probability of being received by other hosts. The second
approach specifies that when the safety system in the vehicle identifies a dangerous situation, an
initial WAM is issued. Copies of this message are generated until the situation is not considered
dangerous anymore, or until it is assumed that the vehicles that needed to receive the notification
were informed. In this case, the overload of the channel can be higher than in the previous
approach. If a large number of vehicles detect the dangerous situation and start to issue WAMs
continuously, the overload of the channel will be significant. Therefore, in this case we have
considered the application of rate reduction algorithms that adapt the transmission rate of
WAMs using an empirical additive or multiplicative rate adaptation. This implies that the
transmission rate is modified with an implementation-dependant factor that is added or
multiplied to a fixed rate value. A similar approach has been taken in [YLZ+04] with positive
results. We note that we did not apply the same approach as for BSMs due to the differences in
generation and transmission of WAMs and BSMs. Thus, warning messages can be delivered in

Chapter 4
66
an area larger than the extent of a local network, and they are usually accepted and forwarded by
a host. The dynamic of propagating these messages and their rate of multiplication needs to
provide the hosts in an extended area with information in a very short time. Vehicles facing
emergency situations tend to travel with similar velocities, e.g. high and then low velocities in
the case of an accident on a highway. Even when the vehicle travels at a low speed, a warning
message still needs to be delivered as fast as possible as it indicates a situation that can constitute
an immediate danger. Therefore, a rate adaptation algorithm using the velocities of the vehicles
cannot be considered appropriate.
We note that the second approach can be considered a special case of the first approach in
certain situations. For instance, even if a vehicle needs to issue warnings about the same static
event as the above-mentioned vehicle stopped in the driveway, these WAMs can be considered
different as they have a different moment of transmission. In this work we have mainly focused
on the transmission of WAMs using the singular approach, especially when analyzing the
communication system efficiency in specific accident scenarios. For the continuous approach, we
have investigated the dissemination of WAMs at a constant rate when particular vehicles detect
hazards in traffic.
As previously mentioned, a host usually accepts a received warning message. However, the
protocol can be configured so that the receivers perform filtering of WAMs. To allow this, two
options are included within warning messages. The first option addresses the acceptance of
notifications issued by hosts from the same local network. It is possible to issue warnings that
should be received only if the sender is part of the receiver’s local network. To implement this,
we provided a field default acceptance in WAMs, which is by default set to true but can be
invalidated. True means that the WAM can be accepted by any host. False means that the WAM
can be accepted only by hosts from the same local network. The second option to allow filtering
rates the degree of urgency represented by the dangerous situation that required the WAM to be
sent. Thus, warning messages contain an indication of the criticality of the event. We used this
term to indicate how dangerous a certain traffic situation is at a moment in time. Two parameters
are used to describe criticality of a dangerous situation: the criticality type and the criticality level.
The criticality type provides a high-level description of the situation. We defined two types of
criticality: imminent, meaning that a dangerous situation will immediately occur, and existing,
meaning that a dangerous situation already happened. The criticality level is a parameter that
provides the possibility of setting a numeric value (e.g. 1–5) to indicate the level of emergency
associated with a dangerous situation. The criticality level and type can then be used when
deciding if a warning message should be accepted by a host.
The WAM structure is presented in table 4.3. These messages contain the sender identity and
the moment when the message was sent. These two fields uniquely identify the transmitted
message. The messages also contain the position of the dangerous situation or event, and a short
description of it. We note that the position of the dangerous situation or event is considered
similar to the position of the host that issued the warning if this host is a vehicle. If the sender is a
fixed host, the position of the dangerous event can differ from the position of the sender. For
instance, if a broken vehicle exists on the road and the fixed host sends notifications about this

Vehicular communication specifications
67
vehicle, the position of the vehicle is included in the message. We defined several descriptors for
dangerous situations: existing accident, obstacle on the road, traffic jam, high possibility of collision,
highly slippery road, vehicle breakdown, and undefined danger. Other information included in the
WAM messages is the criticality type and level, the retransmission counter, and the default
acceptance indication. As with BSM, a reserved field, i.e. OED, is allocated for future use.
Table 4.3 Warning Message
4.4.3 Other messages4.4.3 Other messages4.4.3 Other messages4.4.3 Other messages
Other types of messages can be defined and used within the vehicular network. To illustrate, we
offer a proposal for infotainment messages. These messages can contain data about services and
resources offered by hosts, and other information of general interest. We defined two categories
of infotainment messages, the resources/services-oriented messages and the general interest messages.
These messages have lower priority that BSMs and WAMs.
The resources/services-oriented messages also contain two types of messages, the resources/services
discovery messages and the resources/services advertising messages. The discovery messages are request
messages sent by hosts that would like to use certain services and resources offered by other
hosts. These messages contain the sender identity and the list of requested services and
resources. They also contain additional identification and authentication data about the requester
host. The advertising messages are inviting messages that indicate resources and services available
on different hosts. These messages contain the sender identity and a list of offered services and
resources with a short description.
The general interest messages contain data describing points of interest related to traffic (e.g.
nearest medical center). These messages contain the sender identity, the information identity,
and the information content.
We note that this is only an example of possible extensions of the protocol, and the work
presented in this thesis focuses exclusively on the safety operation of communication.
4.5 Information forwarding4.5 Information forwarding4.5 Information forwarding4.5 Information forwarding
We provide below details on the techniques defined for forwarding information within the
vehicular network. We alternately refer to these techniques as routing or retransmission.
TID - Type identifier
SID = Sender host identity
SitPS = Dangerous situation position
SndTime= Sending moment of the warning message
RtrCnt = Retransmission counter
DSD= Dangerous situation description
CrT = Criticality type
CrL = Criticality level
DA = Default acceptance
OED – other emergency data (field
reserved)
TID SID SitPS SndTime RtrCnt DSD CrT CrL DA OED
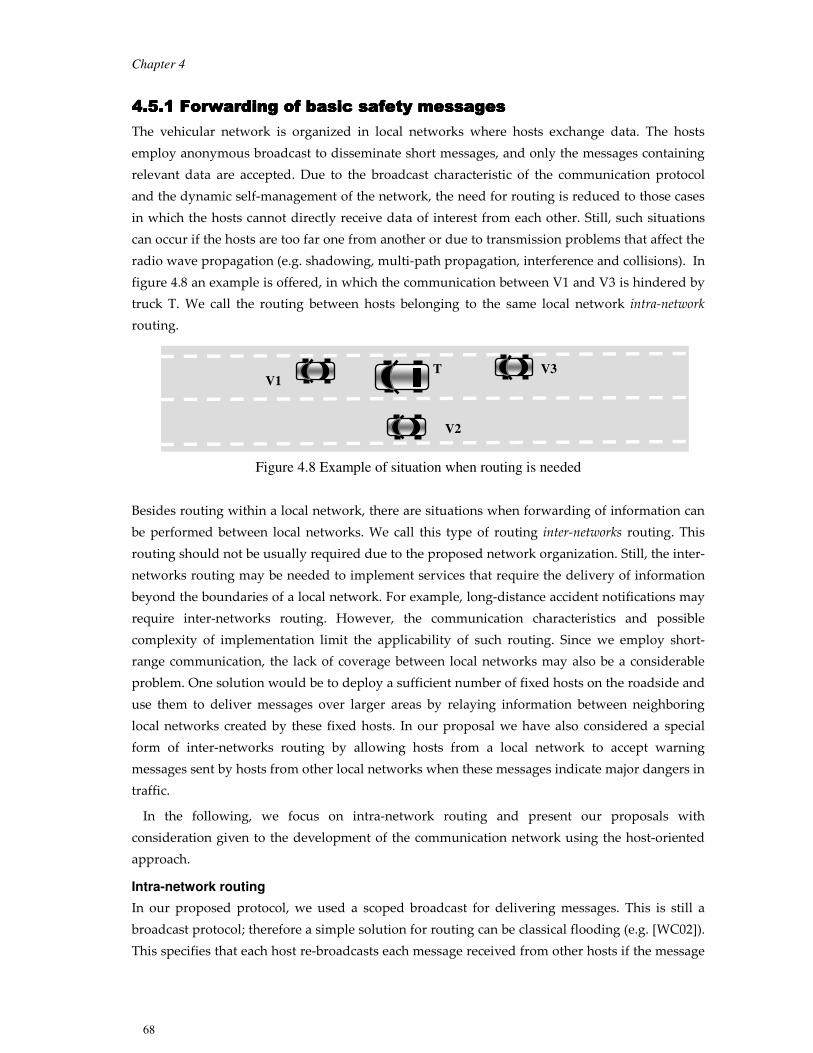
Chapter 4
68
4.5.1 Forwarding of basic safety messages4.5.1 Forwarding of basic safety messages4.5.1 Forwarding of basic safety messages4.5.1 Forwarding of basic safety messages
The vehicular network is organized in local networks where hosts exchange data. The hosts
employ anonymous broadcast to disseminate short messages, and only the messages containing
relevant data are accepted. Due to the broadcast characteristic of the communication protocol
and the dynamic self-management of the network, the need for routing is reduced to those cases
in which the hosts cannot directly receive data of interest from each other. Still, such situations
can occur if the hosts are too far one from another or due to transmission problems that affect the
radio wave propagation (e.g. shadowing, multi-path propagation, interference and collisions). In
figure 4.8 an example is offered, in which the communication between V1 and V3 is hindered by
truck T. We call the routing between hosts belonging to the same local network intra-network
routing.
Figure 4.8 Example of situation when routing is needed
Besides routing within a local network, there are situations when forwarding of information can
be performed between local networks. We call this type of routing inter-networks routing. This
routing should not be usually required due to the proposed network organization. Still, the inter-
networks routing may be needed to implement services that require the delivery of information
beyond the boundaries of a local network. For example, long-distance accident notifications may
require inter-networks routing. However, the communication characteristics and possible
complexity of implementation limit the applicability of such routing. Since we employ short-
range communication, the lack of coverage between local networks may also be a considerable
problem. One solution would be to deploy a sufficient number of fixed hosts on the roadside and
use them to deliver messages over larger areas by relaying information between neighboring
local networks created by these fixed hosts. In our proposal we have also considered a special
form of inter-networks routing by allowing hosts from a local network to accept warning
messages sent by hosts from other local networks when these messages indicate major dangers in
traffic.
In the following, we focus on intra-network routing and present our proposals with
consideration given to the development of the communication network using the host-oriented
approach.
Intra-network routing
In our proposed protocol, we used a scoped broadcast for delivering messages. This is still a
broadcast protocol; therefore a simple solution for routing can be classical flooding (e.g. [WC02]).
This specifies that each host re-broadcasts each message received from other hosts if the message
V1 V3 T
V2

Vehicular communication specifications
69
has not been previously received. However, this solution is highly inefficient due to problems
such as redundancy, contention, collisions, and bandwidth congestion (e.g. [TNC+02]).
Since we propose a context-oriented broadcast where the receivers must determine if they are
the intended destination of messages, no identities of destinations are present in messages.
Therefore, for forwarding information we employ the same strategy, namely to require the
receivers to determine if a message should be retransmitted. Thus, a host accepts only messages
that are of interest and these messages can also be routed, if necessary.
Given the specifics of the vehicular environment, we propose a routing technique using a
mediation mechanism based on the characteristics of the hosts that can directly communicate
with each other. Each host indicates within its BSMs the identities of the other hosts it knows
about, and which are part of the same local network. These indications are recorded in the
database associated with the communication system, and are used by the mediation mechanism
to decide whether a message should be retransmitted. When a BSM is accepted by a subject host,
the mediation mechanism will also detect if the message needs to be routed. This decision is
made by determining if the sender of the message could be of interest to some members of the
subject host’s local network that are not aware of the original sender at the moment the message
was accepted by the subject host. We call these members non-informed hosts. The subject host
identifies the non-informed hosts by analyzing its local network database. An example of intra-
network routing is presented in figure 4.9 where vehicles V1, V2, and V3 are equipped with
vehicular communication devices, whereas the truck T is not. The truck also hinders the direct
communication between V1 and V3. In this example, V2 detects that V1 and V3 can be interested
in each other’s data and retransmits this information.
Figure 4.9 Inter-network routing example for host-oriented organization
To determine if the sender may be of interest for the non-informed hosts, different strategies
can be applied. A basic approach would be to analyze the relative distance between the sender
and the hosts recorded in the subject host database. Analyses of traffic situations revealed that
there may be a high probability that two vehicles (i.e. the sender and a host in the database) that
are of interest for the subject host and are located close enough to each other will have interest in
each others’ data. When a BSM is accepted, the mediation mechanism then needs to check if there
are hosts that do not have data about the sender and are located within a certain distance from
the sender. We used as the basis for the distance threshold the size of local networks (i.e. the
Service Area Threshold) since a host will not consider data from hosts situated outside the
communication service area. The rule used for implementing the mediation mechanism in this
V1 V3 T
V2
Local network V2

Chapter 4
70
case is presented below. Let us consider that the subject host maintains data about senders from
the set S, and receive a basic safety message from A. If the subject host accepts this message, it
will resend it if the following rule holds:
Routing rule: ∃ B∈S, B≠A, and Dist(A,B) ≤ SAT, where Dist(A,B) is the Euclidean distance between A
and B.
However, there may be situations when the above technique leads to extensive forwarding of
information. Therefore, we also propose a more restrictive routing technique, then compare the
performance of both techniques within the evaluation. An extended routing scheme is to apply
an algorithm similar to the one used to determine if a sender is of interest for a subject host. Such
an algorithm uses the distance comparison as above, but extends the analysis by investigating
other parameters such as the relative heading or the possibility that two vehicles will meet in an
intersection. The complete algorithm for determining that a sender is of interest is presented in
the section Information filtering and network management. The algorithm for routing is a slightly
simplified version of the filtering technique as it checks whether two hosts may have an interest
in each other, but did not register or deregister hosts from the local network database. The
algorithm runs until a host that has interest in this sender is found, or until all the hosts in the
database are analyzed. Let us again assume that a subject host maintains data about a number of
senders from the set S and receives a basic safety message from a sender A. If the subject host
accepts this message, it will retransmit it if the following rule holds:
Routing rule: ∃ B∈S, B≠A, and B has interest in A data.
A problem related to routing of BSMs is that the same message can be forwarded at the same
moment by a number of hosts close to each other. This will lead to a peak-load on the channel
and can consequently reduce the communication quality. It can thus lead to information loss,
especially when the medium access scheme does not provide a method to efficiently reduce the
effects of transmission problems such as the hidden terminal. To alleviate the consequences of
such problems, we randomize the moment of forwarding BSMs. Thus, before forwarding a
message, a host waits a random amount of time. This interval is selected between 0 and the
current transmission rate of BSMs.
Forwarding of information increases the load on the communication channel. For reducing
such a load, previous work proposed algorithms for delivering messages between vehicles that
require a vehicle to wait an interval to determine if its transmission area has been mainly covered
by transmissions from other hosts [SFL+00]. If this is the case, the respective host refrains from
transmission. However, data provided by BSMs needs to be available at hosts as soon as possible,
and waiting only adds to the delay in providing this information. In addition, due to the highly
dynamic traffic environment, refraining from transmission based on analysis of received
messages cannot be applied in all traffic situations. As also indicated in [Brie00], there are
situations where the hosts that need certain data will not be able to receive it because the hosts
responsible for retransmitting it did not provided the respective data, assuming that other hosts
had already provided it. For example, when shadowing hinders the exchange of data, a host may
not be able to correctly estimate that the transmissions from other hosts were successful by
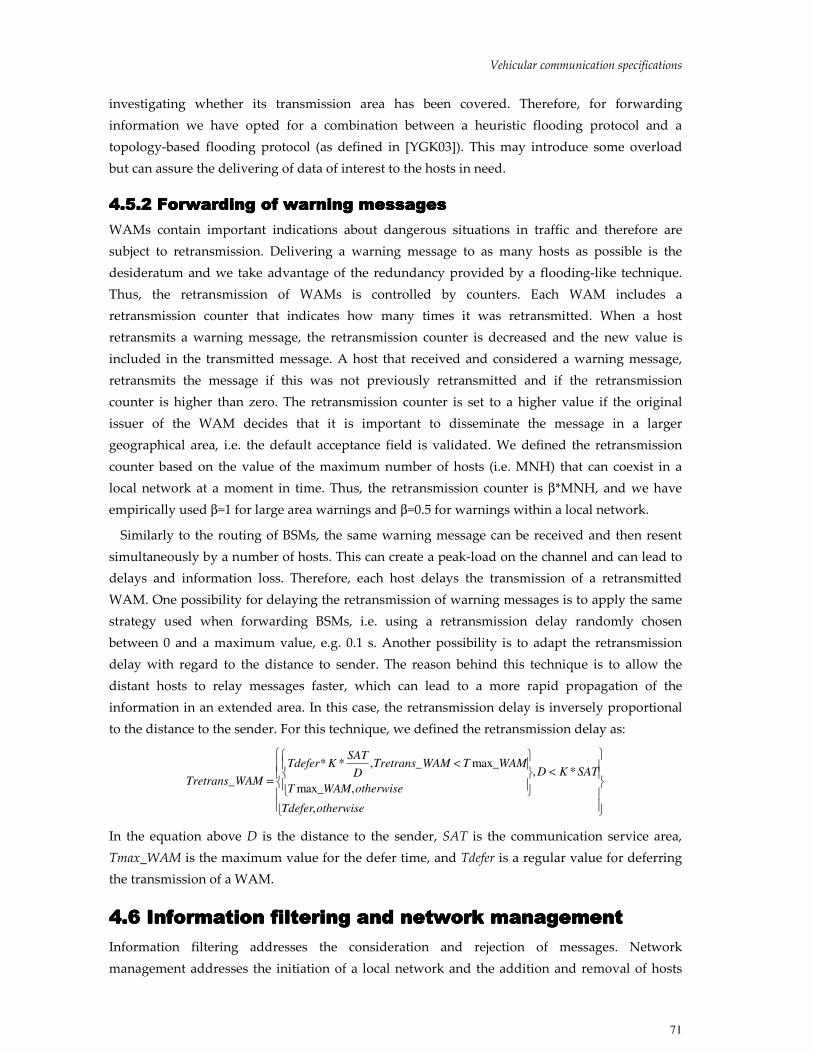
Vehicular communication specifications
71
investigating whether its transmission area has been covered. Therefore, for forwarding
information we have opted for a combination between a heuristic flooding protocol and a
topology-based flooding protocol (as defined in [YGK03]). This may introduce some overload
but can assure the delivering of data of interest to the hosts in need.
4.5.2 Forwarding of warning messages4.5.2 Forwarding of warning messages4.5.2 Forwarding of warning messages4.5.2 Forwarding of warning messages
WAMs contain important indications about dangerous situations in traffic and therefore are
subject to retransmission. Delivering a warning message to as many hosts as possible is the
desideratum and we take advantage of the redundancy provided by a flooding-like technique.
Thus, the retransmission of WAMs is controlled by counters. Each WAM includes a
retransmission counter that indicates how many times it was retransmitted. When a host
retransmits a warning message, the retransmission counter is decreased and the new value is
included in the transmitted message. A host that received and considered a warning message,
retransmits the message if this was not previously retransmitted and if the retransmission
counter is higher than zero. The retransmission counter is set to a higher value if the original
issuer of the WAM decides that it is important to disseminate the message in a larger
geographical area, i.e. the default acceptance field is validated. We defined the retransmission
counter based on the value of the maximum number of hosts (i.e. MNH) that can coexist in a
local network at a moment in time. Thus, the retransmission counter is β*MNH, and we have
empirically used β=1 for large area warnings and β=0.5 for warnings within a local network.
Similarly to the routing of BSMs, the same warning message can be received and then resent
simultaneously by a number of hosts. This can create a peak-load on the channel and can lead to
delays and information loss. Therefore, each host delays the transmission of a retransmitted
WAM. One possibility for delaying the retransmission of warning messages is to apply the same
strategy used when forwarding BSMs, i.e. using a retransmission delay randomly chosen
between 0 and a maximum value, e.g. 0.1 s. Another possibility is to adapt the retransmission
delay with regard to the distance to sender. The reason behind this technique is to allow the
distant hosts to relay messages faster, which can lead to a more rapid propagation of the
information in an extended area. In this case, the retransmission delay is inversely proportional
to the distance to the sender. For this technique, we defined the retransmission delay as:
<
<
=
otherwiseTdefer
SATKD
otherwiseWAMT
WAMTWAMTretransD
SATKTdefer
WAMTretrans
,
*,
,max_
max__,**
_
In the equation above D is the distance to the sender, SAT is the communication service area,
Tmax_WAM is the maximum value for the defer time, and Tdefer is a regular value for deferring
the transmission of a WAM.
4.6 Information filtering and network management 4.6 Information filtering and network management 4.6 Information filtering and network management 4.6 Information filtering and network management
Information filtering addresses the consideration and rejection of messages. Network
management addresses the initiation of a local network and the addition and removal of hosts

Chapter 4
72
from a local network. In this section we elaborate on the techniques used by a host for deciding
whether to accept a BSM. When such a message is accepted, certain network operations can be
performed. Additionally, accepted BSM can be forwarded.
4.6.1 Parameters 4.6.1 Parameters 4.6.1 Parameters 4.6.1 Parameters
The techniques used for filtering and network management are implemented using IF-THEN
rules and are based on a number of parameters. The rules were defined based on analyses of
traffic situations that may develop into accidents, and based on guidelines provided for the
development of safety systems such as collision warning and avoidance (e.g. as in [KLP+99,
TCE+00, PJL+00, ZKV00, MH02, KCF+03]).
We previously established that the service area of the vehicular communication is limited to
the Service Area Threshold (SAT) and the number of hosts from a local network is limited to the
Maximum Number of Hosts (MNH). We also assumed that the vehicles are able to communicate
with fixed hosts if these are installed on the roadside. However, roadside hosts are not necessary
for performing the exchange of data between vehicles but can be used for provision of services to
vehicles. If the fixed hosts are installed close enough to each other, they can communicate via the
vehicular communication. We also note the possibility of developing a dedicated communication
network for the fixed hosts, apart from the vehicular network. This can enhance the provision of
different data to vehicles but it was outside the scope of our work.
We define primary parameters that describe a subject host and the other hosts the subject host
had received messages from. The parameters describing these senders are extracted from the
information included in accepted basic safety messages. The parameters describing the subject
host are provided by onboard sensors. In addition, we define derived parameters that are obtained
using primary parameters and possibly using onboard information systems located in vehicles
(e.g. Geographical Information Systems (GIS) [ESRI95]). In [CS02c] we present considerations
about the design of safety-oriented GIS systems.
The primary parameters are:
• Identity and type of communicating hosts.
• Two consecutive positions of sending and receiving hosts.
• Heading of vehicle hosts.
• Velocity of vehicle hosts.
• The slipperiness coefficient of the road.
• Status of vehicle hosts.
• Road types (if available).
• The number of hosts in a local network.
• The speed limit on the road (RSL) (if available).
The derived parameters and the techniques used for determining them are:
• Relative distance between two hosts: the difference between the current locations of two hosts.

Vehicular communication specifications
73
• Similar heading: compare whether two vehicles are traveling in the same direction or not. If the
difference between the headings of two vehicles is smaller that a predefined threshold value,
the vehicles are considered to travel in approximately the same direction. Otherwise, the
vehicles travel in opposite directions. We evaluated the heading having the Y coordinate (i.e.
direction North) as reference, and set the threshold value to 90 degree.
• Membership of two hosts to the same road. We propose two methods for evaluating this
parameter:
a) The use of information systems (e.g. GIS) for indicating the identities of the roads on which
the hosts are located. The road identity is then included in BSMs and is compared at the
receiving host with the identity of the road the receiver is traveling on.
b) The use of an algorithm that estimates, using multiple positioning records, if two hosts are
situated on the same road. We employed an algorithm that analyzes the movement vectors
of two vehicles between two successive positioning records. The angle between these
vectors is evaluated, and if it is close to 0 or 180 degree (e.g. within 100), the vehicles are
considered to be on the same road. If this is not the case, they are regarded as being on
different roads. Details are presented in Appendix A, section A1.
• Relative positioning of two vehicle hosts. This parameter indicates if a vehicle is situated
behind, or ahead of, another vehicle. As with the parameter above, two methods can be used:
a) Information systems for indicating the locations of the hosts on a digital map. These
locations are then compared and the parameter is evaluated.
b) The use of an algorithm that evaluates, using multiple positioning records of the hosts,
whether a host is situated behind, or ahead of, another host. We employed an algorithm
that analyzes the angle between the vector given by two consecutive positions of a vehicle,
and the vector between the latest positions of the two vehicles. This angle is compared with
90 degree and indicates if a vehicle is behind or ahead of the other. Details are presented in
Appendix A, section A2.
• Possibility of route contention. This parameter indicates the possibility for two vehicles to meet
at an intersection. We proposed a method using estimations of the movement of two vehicles.
Using two consecutive positioning data points of the vehicles, we determine if an intersection
point exists, and then calculate its coordinates. We then evaluate, using the latest values of the
velocities of the vehicles, if the vehicles could arrive at this intersection point at the same
moment. We then relaxed the requirement on the strict equality of the time moments when
vehicles arrive at the intersection point, and introduced a contention interval. This is the
interval when the vehicles are supposed to be in danger of colliding at the intersection. We
considered in this way the physical dimensions of the vehicles and possible small variations of
their velocity when approaching the intersection. Details are presented in Appendix A, section
A3. We note that an information system can also be used to evaluate the route contention.
However, the calculations for determining if the vehicles might meet in the intersection still
need to be performed.

Chapter 4
74
When evaluating the derived parameters, we used a two-dimensional representation (i.e. X and
Y coordinates) of the location of a host. In the work presented in this thesis we did not consider
the existence of a GIS or another system that would help evaluate the derived parameters, we
used only the evaluation algorithms. The primary parameters marked with “if available” did not
affect the decisions if they could not be provided. In these cases, the statements that use them
were not evaluated.
4.6.2 Decision techniques 4.6.2 Decision techniques 4.6.2 Decision techniques 4.6.2 Decision techniques
We provide below a basic set of rules used for implementing information filtering and the
operations for network management. We note that these rules are a proof of concept, being an
example that we used in our work. This set can be further extended or modified based on
recommendations provided by domain experts (i.e. traffic safety experts). We also note that these
rules are specific to the host-oriented organization, which was considered in this work for the
development of the communication system. The rules use the parameters introduced in the
previous section and evaluate conditions related to the sending and receiving host. When these
conditions are determined to be true, the sender is considered of interest and the currently
received BSM is accepted. The main factors that we considered for defining the rules were:
A. The vehicles in close proximity usually have important data. Their number is limited.
B. Vehicles in front of, or behind, traveling on the same road and in the same direction have data
of interest.
C. Vehicles coming from an opposite direction can constitute a danger on undivided roads.
D. Vehicles can collide if they arrive at an intersection at the same time.
E. Fixed hosts located on the roadside provide services to vehicles.
Aspect A is derived from works in traffic safety, e.g. [KLP+99, ZKV00, MH02]. B is stipulated
within proposals for collision warning systems, e.g. [ZKV00, KCF+03]. C is derived from the
development of head-on collisions, e.g. [NSS+03, USC05] and D from the development of
intersection collisions, e.g. [PJL+00, MH02]. E is derived from our design of the vehicular
network.
Rules for information filtering
We present below the rules used by a receiver to determine if a sender is of interest and thus
accept a received basic safety message. The rules below are presented using natural language
and the logical connectives AND and OR. We use parentheses to delimit multiple clauses.
Case 1. The receiver and the sender are vehicle hosts
Inclusion rule:
(I1) The Euclidean distance between sender and receiver is less than SAT.
Regular rules:

Vehicular communication specifications
75
(R11) The sender and the receiver are traveling on the same road AND have similar heading
AND [the receiver maintains data about less than MNH hosts OR the sender is closer to the
receiver in comparison with the farthest host previously considered].
(R12) The sender and the receiver are on the same undivided road AND have different headings
AND the sender is ahead of the receiver AND [the road status or/and the sender status indicate
the possibility for a danger to occur] AND [the receiver maintains data about less than MNH
hosts OR the sender is closer to the receiver in comparison with the farthest host previously
considered].
(R13) The sender and the receiver are traveling on different roads AND a route contention is
detected AND [the receiver maintains data about less than MNH hosts OR the sender is closer to
the receiver in comparison with the farthest host previously considered].
Case 2. The receiver is a vehicle host and the sender is a fixed host
Inclusion rule:
(I2) The Euclidean distance between sender and receiver is less than SAT.
Regular rule:
(R21) The sender offers a service that is of interest for the receiver AND [the receiver maintains
data about less than MNH hosts OR the sender is closer to the receiver in comparison with the
farthest host previously considered].
Case 3. The receiver is a fixed host and the sender is a vehicle host
Inclusion rule:
(I3) The Euclidean distance between sender and receiver is less than SAT.
Regular rule:
(R31) The receiver maintains data about less than MNH hosts OR the sender is closer to the
receiver in comparison with the farthest host previously considered.
Case 4. The receiver is a fixed host and the sender is a fixed host
Inclusion rule:
(I4) The Euclidean distance between sender and receiver is less than SAT.
Regular rule:
(R41) The receiver maintains data about less than MNH vehicle hosts AND both the sender and
the receiver provide specific additional services.
Rules I1, I2, I3 and I4 are due to aspect A and the space limitation of the communication service
area. We note that vehicles situated at the border of this area may frequently enter and leave the
area. This can create an undesired instability and extensive processing of the information
received by repeated removal and addition of senders to receiver’s local network. Therefore,
when evaluating the relative distance between vehicles we have introduced a hystrerezis around
the area threshold. Rule R11 is due to aspects A and B, and the limitation of the composition of a
local network. Rule R12 is due to aspects A and C and the limitation of the composition of a local
network. Rule R13 is due to aspects A and D and the limitation of the composition of a local

Chapter 4
76
network. Rule R21 and R31 are due to aspects A and E and the fact that the local network is
limited in composition. Rule 41 is due to aspect E, the limitation in composition of the local
network, and the specific functionality of fixed hosts defined within the communication protocol.
The rules presented above have a high degree of generality and can be further specified. For
instance, rule R11 can be completed with clauses that check if the sender is no more than several
vehicles (e.g. 2) behind, or no more than several vehicles (e.g. 4) ahead of, the receiver. The set of
rules used for filtering information can be also extended by adding new rules. For example, rule
R13 can be completed by a condition that checks the value of a time-to-collision parameter for the
possible intersection collision. Only when this parameter is below a certain threshold, the rule
will evaluate true. In our work, we have also used such specializations of the rules. For instance,
rules R12 and R41 were replaced by:
(R12s) The sender and the receiver are on the same undivided road AND have different headings
AND the sender is ahead of the receiver AND [the road is slippery OR the sender status is poor
OR the sender speed is excessive] AND [the receiver maintains data about less than MNH hosts
OR the sender is closer to the receiver in comparison with the farthest host previously
considered].
(R41s) The receiver maintains data about less than MNH vehicle hosts AND the sender and the
receiver provide the WSR service.
Processing of rules
When both the inclusion rule and one of the regular rules hold at the same time, the sending host is
considered of interest and the receiving host accepts the newly received basic safety message. As
previously presented, the same rules can be applied for forwarding of basic safety messages.
Rules for network operations
The network management is provided by network operations that are performed in two cases as
follows:
• When a basic safety message was accepted by a subject host, which indicates that the sender is
of interest.
• When the timer associated with the communication protocol (i.e. T_record) indicates that old
records exist in the database, which indicates that the information about these hosts is obsolete.
We also define a least important host, which is used in the rules. Various definitions can be given
but in this work we consider this host to be the most distant host from the receiver. However, if a
less important host was identified as an existing danger via received WAMs, it would not be
considered less important anymore. The second less important host then becomes the least
important in this case, and so on. For the rules presented below, we use the same syntax as for
the information filtering rules. The generic rules implementing network operations are:
Initiation of a local network: IF a time interval T_Init has passed since a host is active (i.e. since a
vehicle host entered the traffic or since a fixed host was made operational) THEN the host
initiates its own local network.

Vehicular communication specifications
77
Addition of a host to a local network: IF a sender is considered of interest AND it is not registered
within the receiving host database THEN register the sender into the receiver’s local network.
Removal of a host from a local network: [IF a sender is considered of interest AND the receiver
database contains MNH hosts AND the sender is closer to the receiver than the farthest host
previously considered THEN remove the least important host from the receiver local network]
OR [IF the update time T_record of a record describing a sending host has passed THEN remove
the host from the receiver local network].
4.7 An integrated vehicular communication platform 4.7 An integrated vehicular communication platform 4.7 An integrated vehicular communication platform 4.7 An integrated vehicular communication platform
A platform for implementing the proposed networking and communication techniques and for
integrating the resulting communication system within a vehicle is proposed in this section.
4.7.1 Design principles4.7.1 Design principles4.7.1 Design principles4.7.1 Design principles
We have designed a vehicular communication platform (VCP) that complies with the
specifications of our proposed vehicular communication. The design principles that we
considered when realizing the platform are presented below:
• Modularity. The modular architecture is due to the diversity of information that needs to be
processed and the specific data organization. The modularity also facilitates future extensions.
• Different service levels. A basic service level needs to be provided, but it should be possible to
develop platforms that offer various services. Moreover, it should be possible to provide a
simplified version of the platform for less specialized vehicles (e.g. vehicles that lack some of
the onboard sensors).
• Extendable. It should be possible to add functionality to the platform by adding new modules
or extending the existing one.
• Medium-independent. The communication platform should not be restricted to a specific
media for transmitting information over the air interface. The platform should then be able to
operate with diverse media that fulfill certain requirements regarding the performance of the
data transfer and the local processing of data.
• Interoperable. The platform should be able to interoperate with other systems located in a
vehicle. Data provided by onboard systems (e.g. GIS) are useful for managing the
communication. Also, data that reside on the platform may be of use for other in-vehicle
systems (e.g. positioning information for traveler information services).
• Customizable. The VCP should be able to be adapted to the user preferences.
4.7.2 Vehicular c4.7.2 Vehicular c4.7.2 Vehicular c4.7.2 Vehicular communication platform (VCP) ommunication platform (VCP) ommunication platform (VCP) ommunication platform (VCP)
The architecture of the vehicular communication platform is presented in figure 4.10 and
contains eight modules:
• Physical Media Manager (PMM)
• Transmission Manager (TM)

Chapter 4
78
• Message Manager (MM)
• Organization Manager (OM)
• Service Space (SS)
• Host Processing Manager (HPM)
• Local Network Processing Manager (LNPM)
• Local Network Members Database (LNMD).
The other entities represented in the figure (i.e. as white boxes) are external to the platform but
should exist on a host for the vehicular platform to function properly. Details on the proposed
functionality of the platform components are given in the following sections. We note that the
platform is intended to be an implementation test-bed for the communication and networking
techniques that we proposed, and for future extensions. To evaluate the communication
performance (i.e. Chapter 5) we implemented some of the functionality of these components
within a prototype.
Figure 4.10 Vehicular Communication Platform (VCP) architecture
Physical Media Manager (PMM)
This component is intended to communicate with the physical equipment used for
communication and contains the specifications of the wireless media that can be employed for
inter-vehicle or vehicle-to-road communication. The Physical Media Manager (PMM) should
Host sensors and onboard systems
Local Network
Members Database
Host interfaces
Host positioning devices
Host Processing
Manager
Warning Service Module
Basic Services
Specific Services
Local Network Processing
Manager
…
Service Space
Basic Service Module
Message Manager
Transmission Manager
Organization Manager
Service 1 Service N Service 2
Transmission media Physical Media Manager

Vehicular communication specifications
79
have the possibility of controlling the functionality of the transceivers installed on a host (e.g.
power control). The PMM communicates with the Transmission Manager (TM), which is located
above it in the VCP architecture. The VCP may integrate different standards for communication
(e.g. IEEE 802.11 [IEE99], DSRC [AST03]). In our evaluation, we used as media a configurable
radio layer provided by the GloMoSim network simulator [BTA+99]. A study of an early
prototype of VCP connected with Bluetooth devices [ERB01] had been done in [Win03].
Transmission Manager (TM)
This component should manage the sending and the receiving of data from the Physical Media
Manager (PMM). The unit may perform fragmentation and reassembling of data if needed. The
TM should also have the possibility of determining the correctness of the information received.
The unit also needs to maintain information about the communication equipment installed on
the host and the standards used for communication. The operations performed by the TM are
dependent on the capabilities of the media used for physical exchange of data. The TM receives
data in the form of messages from the Message Manager (MM), converts it into a format
compatible with the physical communication medium, and sends it to the PMM. The reverse
processing is performed when the unit transfers data from PMM to the MM. The TM should also
be able to perform data flow control (e.g. queue management).
The TM can be used for managing security aspects of the communication such as data
encryption and decryption, and key management. When performing such operations, the TM
must consider the performance of the media used and the possible overload of communication.
For example, IEEE 802.11b provides a security mechanism that offers modest protection [Sta04].
If more than one transmission media is installed on a host, the TM should be able to select the
most appropriate one, and take care of the handover between different media. However, in the
work presented in this thesis we did not address handover operations, nor did we focus on
additional mechanisms for security; we considered only the security provided by the employed
medium.
Message Manager (MM)
The VCP platform was designed to support the message communication by processing and
managing messages that contain relevant safety data. The Message Manager is intended to
assure primary processing of incoming messages from the Transmission Manager (TM) by
analyzing the message type and determining whether the embedded data should be sent to the
Organization Manager (OM) or to a service installed on the host. The services are contained by
the Service Space (SS) and provide further data processing. The MM controls the data provided
by these services that is sent to other hosts. Thus, the unit creates messages from this data and
passes them to the TM.
The MM processes messages used by the proposed communication protocol, such as BSMs and
WAMs. Other types of messages can be defined and used by specific services if these are
installed on a host’s VCP. This depends on the service level provided by the specific VCP. As
long as a service is installed on the VCP and uses diverse messages for transferring data, the MM
is responsible for assuring the initial processing of the messages. Therefore, the MM maintains a

Chapter 4
80
catalogue of services that contains the types of messages used by each service. A service can
make use of several types of messages but two services cannot use the same type of message for
transferring information. When a message is received but its type is not known by the MM, this
indicates that the corresponding service is not installed on the host. Therefore, such a message is
discharged.
The BSMs received by the MM contain the information needed to determine the sending host’s
membership in a local network. This data is extracted by the MM and sent to the OM. The OM
decides if the sender belongs to the local network in which the receiving host currently resides. If
a sender does not belong to this local network, the MM is instructed to drop the received
message unless this is a regular warning message (i.e. the default acceptance is valid), or some
special message used by a service installed on VCP. For warning messages, further processing
based on criticality parameters can be performed. Such processing operations and the processing
of special messages need to be indicated within the catalogue of existing services. If such
specifications do not exist, the warning or special message is discharged.
The Message Manager can also employ authentication and authorization mechanisms that are
used when the sender hosts would like to access some specific services existing on the subject
host. This can be done based on host identity and other credentials. However, such operations
were not the focus of our work.
Organization Manager (OM)
This component processes the information describing the driving situation and the status of hosts
that are part of a local network. The unit manages the organization of hosts in local networks and
the routing within such networks according to the specification of the communication protocol.
The data needed for performing the network management is extracted from the Local Network
Members Database (LNMD) and from the received messages. The OM maintains a log of hosts
that are currently registered in the LNMD (i.e. the hosts belonging to the same local network as
the subject host). This log contains the identities of these hosts and indications about the last
update of the data describing the hosts. The OM uses this log to make decisions and to control
the time validity of the data recorded in the LNMD. If the information describing a host is not
updated within a time interval, the OM instructs the LNMD to remove the outdated record.
Another task that should be performed by the OM is the communication with positioning
systems installed on the subject host. Thus, this unit needs to register and update the positioning
data describing the subject host into the LNMD.
Service Space (SS)
We proposed a basic service level for VCP that provides the reception, transmission, and
processing of safety data. Two basic safety services that assure these operations were defined:
Basic Service Module (BSM) and Warning Service Module (WSM). However, the platform is
extendible and other services can be installed within the Service Space. Also, more functionality
can be added to the existing services. If a new service is installed on the VCP, the modules that
need to interact with it (e.g. Host Processing Manager) should be notified about its identity and
should be informed about the messages used by it. New services can be installed using the

Vehicular communication specifications
81
interfaces embedded in a host that communicate with the Host Processing Manager. However,
the possibility also exists to receive services via communication. The modules implementing the
services are responsible for processing and managing data received and sent by a host. If a
received message is accepted by a host, the message type is used to identify the corresponding
service. The data contained by the message is then sent to this service for further processing.
When the subject host wants to send some data, this is extracted from the Local Network
Members Database or is provided by the Local Network Processing Manager or by the Host
Processing Manager. This data is then processed by a service from SS and is sent to the MM for
further delivery. In this work we focused on the above-mentioned basic services, which we
briefly described in the following.
Basic Service Module (BSM)
This module manages data contained by basic safety messages. This information describes the
sender host and the driving situation associated with it, and is recorded by the service module
into the Local Network Members Database (LNMD). When a new message received from the
same host is accepted, the module updates the corresponding record in the database. We recall
that the Organization Manager uses timeout counters to control the validity of these records. The
basic service module constructs at regular time intervals, using data extracted from the LNMD
and data received from the Host Processing Manager (HPM), basic safety messages describing
the subject host. These are then sent to the Message Manager for further delivery.
Warning Service Module (WSM)
This module manages data contained by warning messages. The module maintains a log of
warnings and should provide methods for analyzing their degree of emergency. The log contains
the identity of the sender that issued a warning message and some additional data (e.g. its
position). This log can also be used by the Local Network Processing Manager when performing
analyses of traffic situations. The WSM should be able to filter the warning messages received
and notify the Host Processing Manager (HPM) only when the criticality level contained in these
messages exceeds a pre-defined threshold. A default criticality level is provided in the basic
version of the VCP and can be modified, e.g. based on the user preferences. The WSM is also
responsible for constructing warning messages when requested by the HPM or by the Local
Network Processing Manager (LNPM). These messages are send to the MM for further delivery.
Host Processing Manager (HPM)
This unit should assure the processing of information related to the subject host. The HPM is also
responsible for managing the interaction between the VCP and other systems installed on the
hosts. Thus, the unit should manage the reception of data from sensors embedded within a host.
This data can be analyzed and then registered into the LNMD. With regard to a vehicle host, a
wide variety of sensors can be use for monitoring its functionality. These can be basic sensors
indicating the engine temperature or the tire pressure, and more advanced devices such as
engine analyzers or road-friction sensors. The deployment of such in-vehicle devices has recently
witnessed a rapid evolution, and the complexity of in-vehicle networks requires specialized
processors and controllers for managing the large amount of data [ZKV00, Bre00]. Therefore, the

Chapter 4
82
HPM should usually not communicate with sensors, but with the specialized units that control
them and provide the filtering of data acquired by sensors. The HPM is intended to use the
information collected from the host’s sensors for performing analyses that help in detecting and
predicting dangerous traffic situations. Alarms received from sensors and traffic data analyses
can also trigger the transmission of warning messages. In these cases, the HPM should construct
a message describing the danger and send it to the WSM for further delivery. Also, the HPM may
alert the driver about such events. Therefore, the HPM should be able to manage the
communication with the interfaces located on the subject host and should represent diverse
notifications on these interfaces. Such notifications are created based on information extracted
from accepted messages and data describing the subject host. With regard to a vehicle host,
various types of driver-vehicle interfaces have been recently proposed (e.g. video, audio, tactile)
[ZKV00]. The HPM needs to be implemented so as to assure the proper representation of the
information using such devices. In certain cases, there is the possibility of producing successive
notifications for indicating the development of a dangerous traffic situation. Using different
levels of emergency constitutes a convenient method for avoiding the mental overload of the
driver [TCE+00]. The presentation method needs to be adapted considering driver preferences.
Since drivers react differently when facing the same type of traffic situation, the provision of a
customizable system is an advantage [MH02].
The HPM should also be able to collect data provided by a user via an in-host interface, and
send it to the corresponding unit from the VCP. Examples of data provided by drivers are the
request for certain information (e.g. vehicle status) and settings of the VCP such as the safety
threshold.
The HPM keeps a list of services installed on the subject host. As mentioned before, the services
are mainly installed using the interfaces that exist on a host. However, if a service is received for
installation using some vehicular communication, the HPM needs to determine whether it can be
installed on the VCP, and if this is the case, should perform its installation.
We note that only some of the functions that can be provided by the HPM were implemented
in a prototype that we used for evaluating the vehicular communication system. These functions
were also simulated since no in-vehicle sensors were used. Also, as interfaces, we used a
standard PC keyboard for inputting data and a PC screen for outputting data.
Local Network Processing Manager (LNPM)
This component is proposed for providing additional analyses and processing of data resident on
the vehicular communication platform. The LNPM should analyze data characterizing the
subject host and data received from other hosts that belong to the same local network to
determine the probability that a dangerous situation will happen. When such situation is
detected, the LNPM should create a warning that is sent to the Host Processing Manager (HPM),
which can perform the necessary processing to present it on an interface installed on the subject
host. The HPM can also send the warning to the WSM to be transmitted to other hosts. In our
evaluation, we investigated the success of sending warning messages. However, the LNMP
functionality was emulated by defining beforehand when warnings need to be issued.
Vehicular communication specifications
83
Local Network Members Database (LNMD)
This component of the VCP is the database that contains the information that characterizes the
subject host and the other hosts belonging to the same local network. The information describing
the subject host always exists in the database and is provided by the Host Processing Manager.
The information describing other hosts is recorded and updated by services installed in the
Service Space. As previously mentioned, the Organization Manager controls the removal of these
records from the database.


85
5. Communication evaluation
This chapter presents the details of the evaluation environment and the tests performed to assess
the performance of the proposed communication system. We first introduce the evaluation goals,
the testing environment, the metrics, the evaluation settings, and the test cases. We then present
and discuss the results for each test case.
5.1 Evaluation goals and method5.1 Evaluation goals and method5.1 Evaluation goals and method5.1 Evaluation goals and method
We have developed an experimental prototype of the proposed safety communication system as
a version of a vehicular communication platform. Both operation modes of the communication,
i.e. proactive and reactive, were implemented. The prototype was then evaluated with regard to
the following goals:
• Evaluate communication performance under various conditions using realistic simulations of
the vehicular traffic. Since the safety data is used by active safety systems, it is crucial to
determine whether its timely and reliable dissemination can be provided by the proposed
communication system. To be relevant to vehicular communication, it is necessary to perform
the evaluation using communicating hosts that exhibit behaviors close to those of real vehicles.
Since vehicular communication needs also to be available in a multitude of traffic scenarios, it is
important to evaluate the communication performance under various conditions (e.g. diverse
density and mobility of vehicles, various movement patterns).
• Investigate appropriate settings for the parameters of the proposed communication protocol.
The functionality of the protocol is influenced by several parameters such as the transmission
interval for BSMs and the communication service area. It is important to identify those settings
that can provide high-performance communication. It is also important to investigate if the
obtained values are realistic.
• Perform a comparative investigation of the techniques proposed for data dissemination, i.e. the
techniques for controlling the message dissemination rate, and the techniques for forwarding
information.
• Evaluate the efficiency of the proposed information filtering technique. The information
filtering is intended to help identify the relevant information and thus minimize the amount of
data considered by vehicles. Consequently, improvements of the information management that
can be obtained using this technique are of interest.
• Investigate the system usefulness for supporting safety applications, e.g. intersection collision
warning system, rear-end collision avoidance system.
• Investigate the functionality of the communication system under diverse settings for
transmission (e.g. coverage area).
As an evaluation method we have constructed a dedicated evaluation environment and used it
for performing a large number of simulations. A prototype of the system using real devices can
also be developed as a proof of concept, and is subject of future work.

Chapter 5
86
In developing the evaluation environment we have taken in consideration the following
requirements:
� Realistic and relevant simulations of traffic patterns.
The scenarios used need to be relevant to traffic safety. The traffic simulations need to include a
sufficient number of vehicles that travel on common types of roads. The vehicles movements,
density, distribution, velocities, and dimensions need to be close to real situations. In addition, a
basic scenario needs to be defined for evaluating the communication performance and for
comparing the different techniques proposed for data dissemination.
� Realistic settings of the radio communication.
This includes the definition of the propagation model, the radio type and parameters of the
transmission and reception (e.g. transmission power, reception sensitivity).
� Investigation of both modes of operation for the communication protocol.
Evaluations of both proactive and reactive mode of operation for the communication protocol
need to be performed. Experiments need to be performed for dissemination of basic safety
messages alone, and for dissemination of basic safety messages and warning messages.
5.2 Evaluation environment 5.2 Evaluation environment 5.2 Evaluation environment 5.2 Evaluation environment
The evaluation environment contains two components as presented in figure 5.1:
• Mobile Network Simulator: an advanced network simulator modified to include the
implementation of the vehicular communication system.
• Traffic Simulator: a set of traffic simulators that generates movement patterns of vehicles.
Figure 5.1 Evaluation environment
The network simulator and the proposed safety communication system
The network simulator that we have used was GloMoSim, a realistic simulation tool for mobile
networks based on a discrete event engine [BTA+99]. The communication hosts are called nodes
in GloMoSim and the simulator uses a layered approach with well-defined interfaces between
layers. GloMoSim provides support for nodes’ mobility by implementing several mobility
schemes such as random waypoint [JM96] and mobility trace file (i.e. the movement of the nodes
is specified in dedicated files). The simulator also provides configuration files that allow the user
to set various parameters of simulations.
Movement traces
Traffic Simulator
Mobile Network Simulator
Vehicular Communication Protocol
Evaluation
Environment

Communication evaluation
87
Our communication system was implemented in a language similar to C that is used in the
network simulator and runs at the application layer of GloMoSim. We implemented the
functionality of the communication protocol for disseminating basic safety messages and
warning messages. These messages were defined as C structures with lengths of 27 bytes for
WAM messages and 112 bytes for BSM messages. However, further encoding of the transmitted
traffic data can lead to smaller message size. Our prototype implemented the information
filtering, the data management for the local database of a host, and the routing of messages. The
local database contained the information about the subject host and the other hosts from the
same local network, and was defined as a C structure. The queues used for managing message
priority were implemented as linked lists with C structures as elements. The interaction with
diverse sensors from a vehicle (e.g. sensors that provide various data such as vehicle position)
was simulated via functions that communicate with the routines of the simulator (e.g. the
mobility routine gives the position of a node). We employed the trace file mobility option of
GloMoSim and inputted the movement patterns of nodes via trace files generated by a traffic
simulator that we have previously developed. Several configuration options had been added to
the original configuration files of GloMoSim for setting parameters of the communication
protocol (e.g. transmission interval for basic safety messages, time interval for deleting stale
data). Several other configuration files were also added for diverse settings (e.g. characteristics of
hosts, indication of message type).
Traffic simulator
The traffic simulator generates mobility trace files that contain the movements of the nodes.
These files contain the identity and the positions of the nodes at different time moments, and are
used as inputs for nodes mobility in GloMoSim.
Two types of traffic generators were developed:
- A general-case traffic simulator using a model given in the literature that implements a
common scenario, which was employed in the evaluation of communication performance and
the comparisons between different communication techniques.
- A specific-case traffic simulator that implements accident scenarios and is used for assessing
the system applicability to support the development of safety systems such as collision warning
and collision avoidance.
5.3 Metrics and free parameters5.3 Metrics and free parameters5.3 Metrics and free parameters5.3 Metrics and free parameters
As we evaluate wireless communication between moving nodes, the settings of the experiments
can influence the evaluation results. For instance, it is possible that some of the vehicles find
themselves during the simulation in situations that pose extreme conditions upon
communication. The hidden terminal situation is one such example, in which a node cannot
successfully access the transmission medium due to concurrent transmissions of nearby nodes.
Our proposed protocol is a best effort protocol and we aimed at investigating both absolute and
relative performance. Considering the above aspects, we investigated in many cases average
values for metrics.

Chapter 5
88
We were interested in investigating if safety information can be exchanged between vehicles in
a timely manner. Therefore, we defined the metric message delay for measuring the time interval
needed for a message to reach its destination. Due to the safety utilization of the exchanged
information, this metric needs to fulfill strict requirements. The metric is defined below.
• Message delay. This metric is defined as the time between the (initial) sending of a message and
the moment when it is accepted by a host. For messages that are routed, the moment when the
message was issued first is considered. For a simulation run, the maximum value of the delay
for all nodes is determined. As an indication of the median system capabilities, an average
value of the delay at each host and over the hosts in a simulation run is also measured.
Investigations regarding communication reliability need to be performed. The transmission
capabilities of the nodes are thus evaluated using two metrics, packet collisions and send errors.
Large values for collisions and send errors indicate low communication performance due to
information loss. This is because packet collisions lead to deterioration of received packets and
consequently to their loss. Send errors address situations when hosts drop messages because
these cannot be sent within a time interval. The metrics definitions are:
• Packet collisions. The evaluation of packet collisions is based on the collision statistics provided by
the radio layer of GloMoSim. These statistics calculate the number of collisions detected by each
node during a simulation run. The detection of a collision is dependent on the type of radio
employed. In our tests we used a standard radio with noise accumulation, where the signal
reception is controlled by the signal-to-noise ratio (i.e. SNR-bounded radio). A collision can
occur when a node currently receiving a message detects another signal that cannot be
captured, and which therefore contributes to the noise. If the power (or energy) of the message
currently received become, due to the arriving of the above-mentioned signal, lower than the
noise power multiplied with the SNR threshold, it is considered that the message cannot be
received correctly. Therefore, its processing is stopped and a collision is counted. For each
simulation, the values of the metric were averaged over the total number of nodes.
Furthermore, the packet collisions are normalized with the number of messages correctly
received and forwarded to the MAC layer plus the number of collisions. The normalized metric
represents the fraction of the messages that could have been correctly received, but were
discarded due to interference with other signals.
• Send errors. This metric represents the number of BSMs that cannot be transmitted due to
transmission problems, i.e. busy medium. BSMs are supposed to be sent by each host at regular
intervals. As previously mentioned, a BSM that cannot be transmitted immediately is kept in a
local buffer. If a new BSM is generated and the previous BSM is still in the buffer, the old BSM
is erased and the new BSM is inserted into the buffer. This means that the older message was
lost, and we call this a send error and count the number of such events at each node. The send
errors are averaged over the total number of nodes in the simulation. The obtained values are
then normalized with the average number of BSMs that are transmitted by a node. The resulted
normalized metric represents the fraction of BSMs that were lost due to send errors.

Communication evaluation
89
In the discussion of results we use packet collisions and normalized packet collisions to
identify the normalized packet collisions metric. Likewise, send errors and normalized send
errors refer to the metric normalized send errors.
The next aspect to be investigated is the efficiency of the filtering technique embedded within
the proposed communication protocol. Due to the broadcast feature of the protocol, the hosts
will usually receive a large number of messages. However, only a fraction of these messages may
contain data of interest. Therefore, the filtering technique is considered successful if the hosts
drop a significant number of messages in comparison to the number of received messages. This is
because the filtered (i.e. dropped) messages are clearly of no interest for the hosts and therefore
should not be considered. As mentioned in [SFL+00] such a metric can also be seen as a measure
of the bandwidth utilization. We note that the metric is most relevant when a larger number of
vehicles that exchange data exist in the simulation. In addition, the metric relevance is strongly
dependent on the simulated scenario. For example, there can be scenarios where the metric is less
relevant because all the vehicles in the simulation need to have data about each other. The metric
definition is given below.
• Information filtering rate. This metric represents the ratio between the number of BSMs accepted
by a host and the number of BSMs received by this host. For each simulation run, the results are
averaged over the total number of nodes in the simulation.
When disseminating warning messages, it is important to investigate whether they eventually
arrive at their destinations, i.e. the hosts that need to receive them. This can be seen as a measure
of communication reliability and it is quantified using the metric Information dissemination success.
We note that the metric is most relevant for specific scenarios, where one can precisely define
beforehand the nodes that should receive a certain notification. The metric is defined below.
• Information dissemination success. This metric evaluates the ratio between the number of hosts
that should receive and accept a warning message, and the number of hosts that accepted the
message.
Free parameters
The free parameters are the variables modified for evaluating the behavior of the communication
under various conditions. The determination of appropriate values for certain parameters of the
communication protocol was one of the evaluation goals. Such parameters were then used as free
parameters in the simulations. Additionally, free parameters that characterized the dynamics of
the traffic were used. Thus, the free parameters were:
• Transmission interval or rate of basic safety messages.
• Communication system bandwidth.
• Communication service area.
• Network load in terms of number of vehicles on the road.
• Mobility of the nodes, by modifying the maximum achievable speed for the vehicles (i.e. in the
traffic model).

Chapter 5
90
5.4 Scenarios 5.4 Scenarios 5.4 Scenarios 5.4 Scenarios
A general scenario for performance evaluation and specific scenarios for system usability have
been used in the evaluation. We describe below the general scenario and offer examples of the
specific scenarios with four relevant cases (i.e. two basic cases and two extensions of these).
These scenarios are also used for illustrating the obtained results.
Description
a. General scenario for performance evaluation
The basic traffic scenario used for evaluating communication performance and comparing the
proposed techniques for information dissemination is an undivided bi-directional road with one
lane in each direction (figure 5.2). This is a considered a common topology for rural and urban
roads [Eva04].
Figure 5.2 General scenario
b. Rear-end accident scenarios for system usability investigation
A classic rear-end accident scenarios was used. Thus, the VOTS scenario (vehicle obstruction
with tailgate scenario) introduced in Chapter 2 was initially considered. This scenario is shown in
figure 5.3 and was described in detail in section 2.4.2. The scenario involves three vehicles that
initially follow each other at a safe distance. Later on, V3 suffers a breakdown and starts to pull
over. V2 manage to avoid V3 by steering. When V1 notices V3, it tries to brake but it cannot
avoid the collision with V3.
Figure 5.3 Basic rear-end scenario
In addition, an extension of this scenario was used. In this case the accident development is
similar to the first scenario, but a larger number of vehicles are present on the road. For this, we
have positioned the scenario on one of the driving directions of a highway with two lanes per
direction as presented in figure 5.4.
b. Accident situation a. Initial situation
V1
V2
V3
V1 V2 V3

Communication evaluation
91
Figure 5.4 Extended rear-end scenario
c. Intersection accident scenarios for system usability investigation
Classic intersection accident scenarios with perpendicular crash were used. The initial scenario
that was considered involves two vehicles and is briefly presented in the following. Initially, V2
stops at the STOP sign and then tries to pass the intersection, without notifying the oncoming
vehicle V1 or misleading its position and velocity. V1 is confused by V2’s maneuver mainly
because V2 was initially stopped, and brakes too late and collides with V2.
Figure 5.5 Basic intersection scenario
A more complex intersection scenario that employed the same accident in the presence of more
vehicles on the intersecting roads was also considered. This is presented in figure 5.6.
V1 V2 V3
V1
a. Initial situation
V2
b. Accident situation
V1
V2
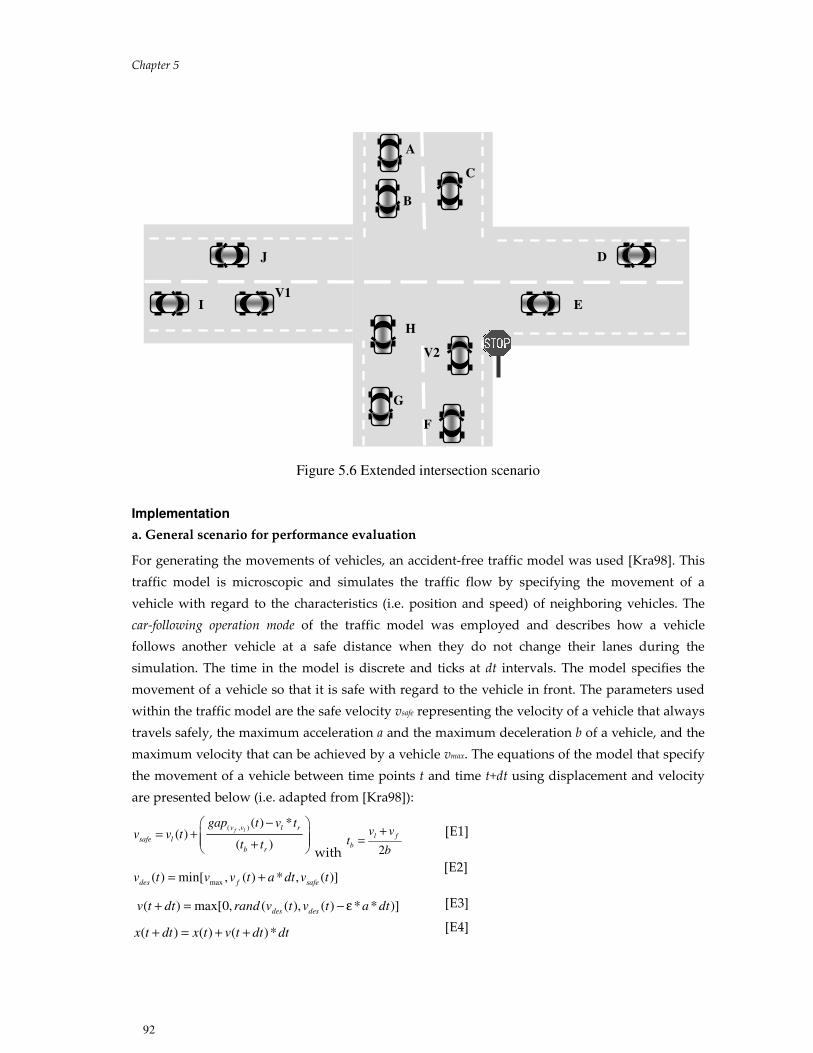
Chapter 5
92
Figure 5.6 Extended intersection scenario
Implementation
a. General scenario for performance evaluation
For generating the movements of vehicles, an accident-free traffic model was used [Kra98]. This
traffic model is microscopic and simulates the traffic flow by specifying the movement of a
vehicle with regard to the characteristics (i.e. position and speed) of neighboring vehicles. The
car-following operation mode of the traffic model was employed and describes how a vehicle
follows another vehicle at a safe distance when they do not change their lanes during the
simulation. The time in the model is discrete and ticks at dt intervals. The model specifies the
movement of a vehicle so that it is safe with regard to the vehicle in front. The parameters used
within the traffic model are the safe velocity vsafe representing the velocity of a vehicle that always
travels safely, the maximum acceleration a and the maximum deceleration b of a vehicle, and the
maximum velocity that can be achieved by a vehicle vmax. The equations of the model that specify
the movement of a vehicle between time points t and time t+dt using displacement and velocity
are presented below (i.e. adapted from [Kra98]):
( , ) ( ) *( )
( )
f lv v l r
safe l
b r
gap t v tv v t
t t
− = + + with 2
l f
b
v vt
b
+=
max( ) min[ , ( ) * , ( )]
des f safev t v v t a dt v t= +
( ) max[0, ( ( ), ( ) * * )]des des
v t dt rand v t v t a dt+ = − ε ( ) ( ) ( )*x t dt x t v t dt dt+ = + +
V1 I
J
C
E
A
D
H
G
B
F
V2
[E1]
[E2]
[E3]
[E4]

Communication evaluation
93
The parameters used in the equations are the speed of the leader vehicle vl, the speed of the
follower vehicle vf, the maximum acceleration a and maximum deceleration b of a vehicle, the
separation distance between the follower and the leader vehicle gap(vf,vl), the reaction time of the
driver and the braking system lag tr, and a noise parameter ε. The term rand(x, y) represents a
random number between x and y. The time interval dt used for updating the traffic model (i.e. for
generating new positions and velocities of the vehicles) needs to be equal to or smaller than the
reaction time of the driver and the braking system lag (i.e. tr) for the traffic to be safe [Kra98].
Therefore, dt ≤ tr was imposed. The random term used in equation [E3] is an uncertainty factor
that models deviations from optimal driving. Thus, in this traffic model the drivers are not
considered to have a completely accurate perception of the traffic situation in terms of speed of,
and distance from, neighboring vehicles. Therefore, they may execute unexpected maneuvers
such as a sudden deceleration without an existing reason. Introducing such a random variable
makes the model non-deterministic and more realistic with regard to traffic situations.
The simulations were performed by generating a number of vehicles on the road according to a
predefined traffic density ρ (measured in vehicles/km/lane). The average separation distance
between vehicles was calculated as avg_separation =1000/ρ [m]. The initial speed of the vehicles
was randomly set at the starting moment of the simulation to a value in the interval [vmax, vmax-
a*ε*dt]. The movements of the vehicles were determined by equations [E1] to [E4].
All the vehicles generated at the beginning of the simulation remained on the road for the
entire duration of a simulation run. We implemented this behavior for reasons of consistency and
because the employed network simulator requires the specification of the number and identities
of the nodes at the beginning of the simulation. The road length was adapted (e.g. 7.5 km, 12.5
km), with regard to the simulation duration and the velocity of the vehicles. The vehicles were
positioned at the beginning of the simulation on two sectors of the road starting at its left or right
end depending on the driving direction. They were uniformly positioned on these sectors with a
separation distance equal with avg_separation plus the length of a vehicle and a guard space.
The length of a vehicle plus the guard spaces (i.e. in front of and in behind) was set to 8 meters.
The width of a vehicle plus lateral guard spaces was set to 3 meters. The other settings of the
simulations are given in the table 5.1.
Table 5.1 Simulation settings
Parameter Value
Maximum speed 25 [m/s] (except when modified)
Acceleration and deceleration 1 [m/s2] and 4.5 [m/s
2]
Vehicle density 6 [vehicles/lane/km] (except when modified)
Reaction time 1.5 [s]
Noise factor 1.5
The general scenario was implemented as a C program that takes as input a configuration file
where the traffic model parameters and other settings (e.g. time granularity dt, vehicles

Chapter 5
94
dimensions) are specified. This program produces trace files containing the movement
characteristics of the vehicles (i.e. time and vehicle identity and position), which are then used as
inputs for GloMoSim.
b. Rear-end accident scenarios for system usability investigation
Classical kinematical equations (e.g. displacement calculus [Phy03]), and equations derived from
research in crash avoidance areas such as braking on-set range [KLP+99] were used for
simulating the movements of vehicles. The movement patterns followed well-defined scenarios
and the simulations were deterministic, as the movement characteristics of the vehicles were
specified beforehand at all time points in the simulation.
For the initial rear-end scenario we used the following settings. The vehicles have an initial
speed of 20 m/s, an initial acceleration of 0 m/s2, and an initial separation distance of 40 meters.
The simulation started at time 0 s. At time 10 s, the vehicle V3 breaks down and executes a pull
over maneuver with a deceleration of 4 m/s2. At time 13 seconds vehicle V2 executes a sudden
steer and vehicle V1 executes a heavy braking at time tb=(13 + DRT + RandT), where DRT is the
driver reaction time, which was set to 1.5 second, and RandT is a random variable in the interval
0 to 1 second. The maximum deceleration during the heavy braking was considered to be 9 m/s2,
a value that can be achieved by braking systems of current vehicles (e.g. 2005 SAAB 9.5). We note
that since this did not affect the development of the scenario, a simplified model was used to
represent the passing maneuver of V2 on the other lane. To simulate the scenario, a simulation
run of 20 seconds was enough. The length of the road segment on which the accident occurs was
500 meters.
For the extended rear-end scenario, we considered a two-lane bi-directional road on which a
rear-end accident similar to the one above takes place. A density of 10 veh/km/lane was used in
this case. On the direction opposite to the direction in which the accident happens, the vehicles
were uniformly distributed on a road sector starting with the right end of the road. These
vehicles travel with constant speed. The road length was selected so the vehicles could remain on
the road for the entire duration of the simulation, e.g. a 2.2 km road was needed for simulating a
40 seconds simulation run. The vehicles traveling in the same direction with the direction in
which the accident is produced were also uniformly distributed. They also travel with constant
speed and their characteristics, i.e. initial position and speed, were selected so that they do not
interfere with the development of the rear-end accident. Thus, the time development of the
accident remained the same, but it was delayed in time in order to obtain a longer simulation run
where vehicles could exchange more messages. The initial velocity of the vehicles not involved in
the accident was set to 20 m/s. Vehicle V1 was initially positioned at 500 meters from the
beginning of the road (i.e. its left end). The characteristics of the vehicles involved in the accident
were similar to the basic scenario.
The above simulations were realized via C programs that take as input a configuration file
where different parameters such as time granularity, deceleration, or initial speed of vehicles can
be specified. The programs produced trace files containing the description of the movements of
vehicles, which were then used in GloMoSim.

Communication evaluation
95
c. Intersection accident scenarios for system usability investigation
The simplified scenario contains two vehicles and employs the following settings. At the
beginning of the scenario, vehicle V1 has a speed of 10 m/s, an acceleration of 0 m/s, and it is
situated at 21 meters from the entry point into the intersection. Vehicle V2 is considered stopped
at the beginning of the scenario, i.e. speed is 0 m/s, and it is situated at 4 meters from the entry
point into the intersection. Each road lane has a width of 4 meters. The length of a car is also 4
meters. At time 1 s, vehicle V2 starts to pass the intersection with a constant acceleration of 1.5
m/s2. The simulation is realized via a C program that generates the movements of the vehicles. A
simulation run of 10 seconds was enough to simulate the scenario. In this case, each section of the
intersection was around 30 meters long.
For the extended scenario, we considered a more complex situation that involves the same
crossroad but in the presence of more vehicles. Thus, 10 more vehicles have been added. The
initial situation was introduced in figure 5.6. The vehicles move as follows. Vehicles A and B are
stopped during the simulation. These vehicles are waiting to pass through the intersection and
are positioned at 1 respectively 7 meters from the entry point into the intersection. Vehicle C has
passed through the intersection, it is situated at 4 meters after the entry point into the intersection
and continues with a constant speed of 8 m/s during the simulation. Vehicle D is situated at 54
meters from the entry point into the intersection, has an initial speed of 20 m/s, intends to stop
and therefore starts decelerating from the beginning of the scenario with 4 m/s2. Vehicle E is
situated at 4 meters after the entry point into the intersection and travels with a constant speed of
15 m/s. Vehicle F is situated at 10 meters from the entry point into the intersection, it is stopped
and remains stopped for the entire simulation. Vehicle H and G have passed through the
intersection and continue with a constant speed of 10 m/s and 15 m/s respectively. At the
beginning of the simulation they are positioned at 2, respectively 14 meters after the entry point
into the intersection. Vehicle I is situated at 30 meters from the entry point into the intersection
and is approaching the intersection with a velocity of 10 m/s. Vehicle J is traveling with a
constant speed of 8 m/s and is situated at the beginning of the scenario at 4 meters after the entry
point into the intersection. In this case, the right and the upper legs of the intersection were 30
meters long and the left and the lower legs were 60 meters long.
The above scenarios were also simulated using C programs where parameters are specified via
input files. These programs outputted trace files containing the movements of vehicles as
coordinates and time points.

Chapter 5
96
5.5 Baseline settings5.5 Baseline settings5.5 Baseline settings5.5 Baseline settings
Free parameters values
The ranges of values used for free parameters are presented in the table 5.2.
Table 5.2 Common settings for evaluations
Parameter Range of values
BSM transmission interval [0.001 – 2] [s]
Communication system bandwidth [10 – 2000] [kbps]
Communication service area [50 – 600] [m]
Network load density [6 – 20] [vehicles/km/lane]
Mobility of nodes (i.e. via modification of velocity) [10 – 40] [m/s]
The transmission interval for BSMs was varied from very low values to a value considered a
threshold for traffic safety applications (i.e. 2 seconds) [AF96]. The bandwidth variation was
within the capabilities of current communication systems (e.g. 9.6 kbps for cellular, 2 Mbps for
IEEE 802.11 WLAN [Sta04]). The communication service area was modified according to short-
range communication. The load density was varied from regular traffic to high volumes of traffic
(e.g. as indicated in [Eva04]). The mobility of the nodes used common speed values for vehicles
traveling on different kinds of roads.
Radio model parameters range
Table 5.3 presents the specific settings for the radio model used in the simulations. Classical
models for radio wave propagation and radio type (i.e. SNR) were used. We employed the two-
ray propagation model, which is extensively used for representation of signal propagation in
MANETs deployed in urban or rural areas [TMB01]. In previous work we have used the free
space propagation model for testing purposes (i.e. with transmission power of 9 dBm and 15
dBm) [Chi04, CS04a]. However, the free space model is an idealized model, and even if it can be
used for simulating an environment with stronger interference due to lower power loss of the
traveling signal, it is not as realistic as the two-ray model [TMB01]. Therefore, we have decided
to perform further testing using only the two-ray model. In most of the tests, an Additive White
Gaussian Noise (AWGN) channel was employed. However, different fading models, e.g. using
Rayleigh or Ricean distributions [God02], can be also employed for testing. The Rayleigh model
implies that no LOS exists between the communicating hosts. The Ricean model addresses
situations when LOS communication between hosts is possible. In this case the interference
between LOS and no LOS signals can be modeled via the Ricean K factor (e.g. a K factor of 5 is
common [TMB01]). With consideration given to the test scenarios used in the evaluation, the
vehicles can exhibit LOS communication, so the Ricean model seemed more appropriate. Thus,
we have also performed several experiments using the Ricean propagation model with a K factor
of 5. In this test, the general traffic scenario was used for generating the movement patterns of
vehicles.

Communication evaluation
97
Table 5.3 Radio model parameters
Parameter Value/Type
Propagation model Two-ray
Frequency 2.4 GHz, alternative 5.9 GHz
Transmission power 12 dBm ( ≅ 317 m range) and
23.5 dBm (≅ 614.5 m range)
Bandwidth 2 Mbps (except when modified)
Medium Access Control (MAC) non-persistent CSMA (Carrier Sense Multiple Access)
Radio type Based on IEEE 802.11
Signal-to-noise ratio (i.e. SNR) bounded
Standard radio with noise accumulation
SNR Threshold 10 dB
RX Sensitivity/RX Threshold -91 dBm / -81 dBm
The specific settings of the radio model used for testing are detailed in the following. The default
SNR threshold, reception sensitivity and reception threshold given in the GloMoSim source were
used since these values were similar to those employed for real devices such as WLAN cards
(e.g. [Gei02][Swi05]).
The values of the transmission power correspond to a transmission range slightly higher than
300 and 600 meters (i.e. when using the two-ray propagation model). A value of 300 meters was
selected as an appropriate service area for traffic safety, and is also proposed within the DSRC
specifications [YUA97, FCC04]. The value of 600 meters was employed mostly for testing
purposes and was considered an upper boundary for the short-range communication.
The frequency that we used in most of the tests is within the ISM band, which is freely
available and is employed by many current communication systems (e.g. WLANs, PANs). We
note that in real operation this may imply a higher interference if different systems (e.g. WLAN,
inter-vehicle safety communication, road toll collection communication) using this frequency
spectrum are active in the same area. Therefore, we also performed tests with 5.9 GHz as
frequency. This value was proposed within DSRC as a dedicated frequency for vehicular
applications and was adopted in several countries, e.g. the United States [FCC04]. However, the
results did not differ extensively and therefore we present in this thesis results obtained when
testing at 2.4 GHz.
The bandwidth value used in most of the tests is a realistic value that can be provided by
current communication systems (e.g. IEEE 802.11WLANs).
The MAC scheme that we employed was indicated as one of the potential schemes for traffic
applications [KTT+02, FH02b].
We mention that the GloMoSim’s radio model is implemented based on the IEEE 802.11
standard [IEE99]. The simulator specifies a synchronization time of 192 µsec and assumes a 5
µsec delay for the physical layer if specific delay values are not given in the MAC scheme.

Chapter 5
98
Other settings
Several other specific settings that were used in the tests are presented below.
Routed BSMs were delayed with a value randomly selected from the interval [0, Tint_BSM].
The random delay for avoiding synchronization of retransmitted WAMs was in the interval [0,
0.1] seconds. For delaying WAMs based on the distance to the sender we have primarily used
Tdefer = 0.05 s, Tmax_WAM=0.2 s, and K=3. For the continuous transmission of WAMs, the
messages were issued at an interval equal to 1 s.
The maximum time a record could exist in the database without being updated was 2 s. The
local network database update granularity (i.e. how often it is updated) was 0.005 s.
When BSMs are sent, their dissemination starts at the beginning of the simulation. To avoid the
initial synchronization of the transmission, the starting moment for disseminating the BSMs was
randomly chosen from the interval [0, 0.1] s.
The interval after which a section of the communication system queue that is not empty tries to
empty itself was set to 0.01 s. This happens until no messages are left in the queue section or the
simulation run ends. The size of each queue section was set to 100 messages.
When WAMs are sent, they are by default set for large area notifications (i.e. the default
acceptance field is validated). Only for particular tests did we invalidate this option.
The number of hosts in local networks was set to 20 and all vehicles were considered equipped
with communication devices (i.e. 100% penetration rate).
The road was considered slippery. Randomly selected vehicles had a poor status.
5.6 Test cases 5.6 Test cases 5.6 Test cases 5.6 Test cases
Test case 1: Communication performance for dissemination of basic safety messages with
constant rate
The communication performance is evaluated for dissemination of BSMs generated at a constant
rate. The forwarding of BSMs is performed using the basic approach that considers only the
relative distance between hosts that may have an interest one in another. The scenario considered
is the general scenario. The following aspects are investigated:
- Influence of transmission interval, bandwidth, network load, hosts’ mobility and
communication area size on BSMs dissemination delay, packet collisions, send errors and
efficiency of information filtering.
- Influence of the transmission power on communication performance.
- Appropriate values for the transmission interval for BSMs.
- The necessary communication system bandwidth for obtaining high performance.
- Appropriate values for the communication service area.
- Appropriate number of hosts in local networks.
The experiments were performed by modifying one of the free parameters when the others are
kept constant. When not modified, the values of the free parameters were: transmission interval

Communication evaluation
99
0.1 s, communication service area 300 m, network load 6 veh/km/lane, maximum speed in the
traffic model 25 km/h, and system bandwidth 2 Mbps. The tests were done using a 12 dBm and
alternatively 23.5 dBm as transmission power.
Test case 2: Communication performance for dissemination of basic safety messages with
adaptive rate
The communication performance is evaluated when employing the adaptive approach for
disseminating BSMs. The forwarding of BSMs is performed using the simplified algorithm as in
the previous test case. The scenario considered is the general scenario. The following aspects are
investigated:
- Influence of bandwidth, network load, hosts’ mobility and communication area size on
BSMs dissemination delay, packet collisions, send errors and efficiency of information
filtering.
- The necessary communication system bandwidth.
- Appropriate value for the communication service area.
- Appropriate number of hosts in local networks.
- The communication performance in comparison to the constant rate approach.
These investigations were performed using settings similar to those of the previous test case.
Test case 3: Influence of BSMs forwarding technique on the communication performance
This test investigates the differences in communication performance when using the two
proposed techniques for forwarding BSMs, i.e. the basic approach based only on distance, and
the extended approach where the same decision used for filtering is also used for routing. The
following aspects are investigated when using the extended technique for forwarding BSMs:
a. For settings similar to test case 1:
- Influence of transmission interval, bandwidth, network load, and communication area
size on BSMs dissemination delay, packet collisions, send errors and efficiency of
information filtering. The results are investigated in comparison to the results obtained
in test case 1.
- Investigation of the communication performance when using a different fading model,
i.e. the Rician model with k=5.
b. For settings similar to test case 2:
- Influence of bandwidth, network load, and communication area size on BSMs
dissemination delay, packet collisions, send errors, and efficiency of information
filtering. The results are compared to the results obtained at test case 2 and the results
obtained in test case 3.a.

Chapter 5
100
Test case 4: Communication performance when disseminating warning messages with
singular transmission
The communication performance is evaluated for transmission of WAMs in the presence of
(disseminating) BSMs. In these experiments, a warning message is issued when a host identifies
some hazard in traffic. To increase the chances of correctly alerting other vehicles about the
dangerous situation, each WAM is issued a number of times, which was empirically set to 3. The
retransmission of WAMs is performed using the random delay approach. The scenario
considered is the general traffic scenario, and the tests are performed using settings similar to test
case 1, and the extended routing scheme for BSMs. As mentioned in the baseline settings, the
WAMs had the default acceptance field validated.
The simulations are performed by randomly selecting several moments in time during a
simulation run when a randomly selected node issues a warning message. During each
simulation run, a number of 10 moments for the generation of warnings was used. The following
aspects are investigated:
- Influence of transmission interval, bandwidth, network load, and communication area
size on BSMs dissemination delay, packet collisions, send errors and information
filtering efficiency. The results are compared to the case when no WAMs are generated.
- Influence of transmission interval, bandwidth, communication service area, network
load and mobility of the hosts on WAMs dissemination delay.
- The above aspects when disseminating WAMs only within the local network, i.e. with
the default acceptance field invalidated.
Another aspect that is investigated is the information dissemination success for transmission of
WAMs. This is a measure of how many hosts that need to receive a warning message actually got
it. The problem here is the definition of a zone of interest, i.e. the specification of the vehicles that
should receive a specific warning. For a specific scenario where a high probability of collision is
detected, this zone contains the vehicles that need to be aware of the danger. However, in the
general traffic model used in this test, the definition of such a zone depends of the type and
importance of the detected emergency situation and the current topology of the traffic. For
instance, a WAM can be of interest only for the hosts from the local network of the sender if the
default acceptance field is invalidated. However, when the warning message is delivered in an area
larger than the size of a local network (i.e. default acceptance is validated), a specific definition of
the zone of interest needs to be made. In the results presented in this thesis we have considered
the issued WAMs to be of interest for vehicles in behind, but on the same lane as, and vehicles in
front of the issuer on the opposite lane, which are situated less than 500 meters from the vehicle
that issued the warning message.
Test case 5: Communication performance when disseminating Warning Messages with
multiple transmissions
Similarly to the previous test case, the communication performance is evaluated for transmission
of WAMs in the presence of BSMs. The multiple transmission case implies that a vehicle
Communication evaluation
101
detecting a danger issues warning messages until the danger does not exist any longer, or is no
longer detected by the issuing vehicle. The retransmission of WAMs is performed using the
random delay approach. The scenario considered is the general traffic scenario and the tests are
performed using the settings from test case 1. The routing scheme for BSMs is the extended
scheme. As with the previous test, the WAMs had the default acceptance field validated. Also here,
the tests are performed by randomly selecting several moments in time during a simulation run
when a randomly selected node starts to issue warning messages. The moment when the danger
occurs and the interval for which the danger exists are randomly selected. During a simulation
run, a number of 10 moments for the occurrence of dangers that determined the sending of
warnings was used. The following aspects are investigated:
- Influence of transmission interval, bandwidth, network load, and communication area
size on BSMs dissemination delay, packet collisions, send errors and information
filtering efficiency. The results are compared to the case when no WAMs are generated.
- Influence of transmission interval, bandwidth, communication service area, network
load and mobility of the hosts on WAMs dissemination delay. The results are compared
to the case when WAMs are generated with singular transmission.
The information dissemination success for transmission of WAMs is also investigated using
settings and assumptions similar to those from test case 4.
Test case 6: Influence of deferred retransmission techniques for WAMs on communication
performance
This test investigates the influence of modifying the modality of deferring the retransmission of
warning messages by using the proposed technique based on the distance to the sender.
Investigations similar to those from test case 4 are performed. The results are compared with
those obtained in test case 4.
Test case 7: Investigations of system usability for avoiding accidents
This test case investigates the communication performance in realistic accident scenarios for
assessing whether the proposed communication system can provide the necessary level of
support to on-board active safety system.
The first type of scenario is the rear-end accident scenario. First, the basic scenario involving
three vehicles is considered. All vehicles generate basic safety messages from the beginning of
the simulation, and vehicle V3 issues a warning message when it breaks down. The generation of
BSMs is performed like the settings presented in test case 1, and the forwarding of BSMs is
performed following the extended routing scheme. The WAM transmission is performed
according to the singular WAM transmission (i.e. as in test case 4). The WAM retransmission is
performed using the random delay approach. The following aspects are investigated:
- WAM delay.
- Information dissemination success for WAM.
The extended rear-end scenario is then considered, and the same aspects are investigated.
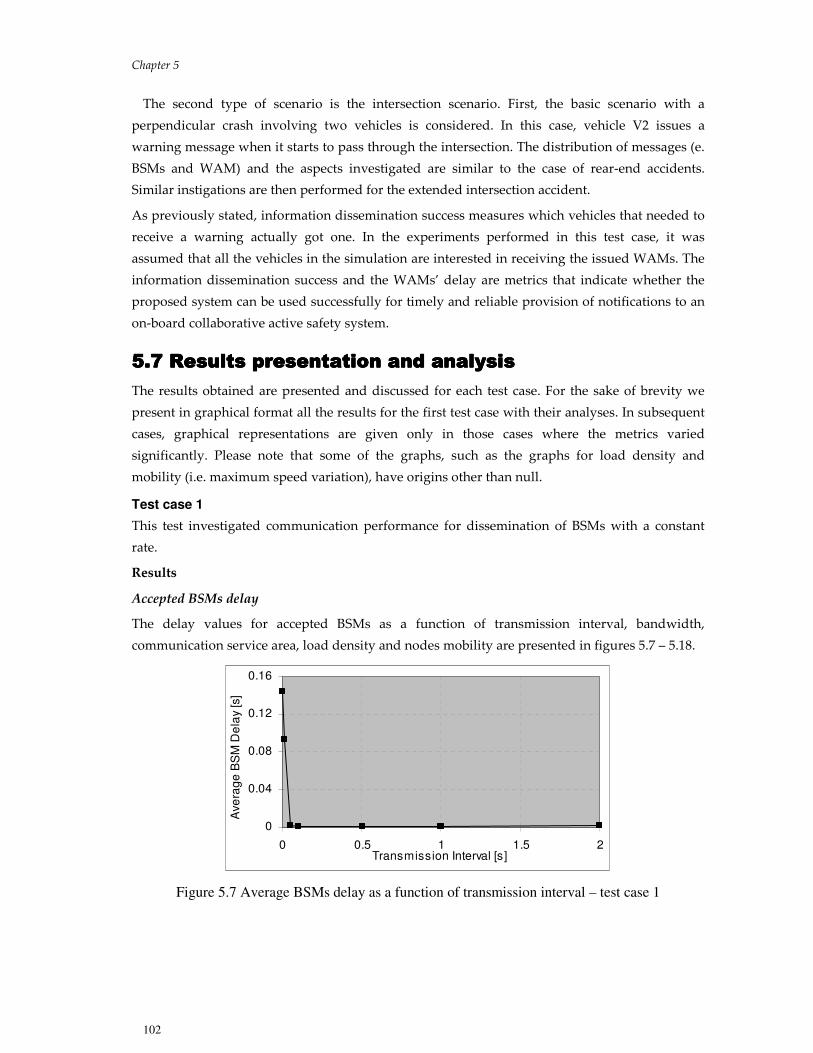
Chapter 5
102
The second type of scenario is the intersection scenario. First, the basic scenario with a
perpendicular crash involving two vehicles is considered. In this case, vehicle V2 issues a
warning message when it starts to pass through the intersection. The distribution of messages (e.
BSMs and WAM) and the aspects investigated are similar to the case of rear-end accidents.
Similar instigations are then performed for the extended intersection accident.
As previously stated, information dissemination success measures which vehicles that needed to
receive a warning actually got one. In the experiments performed in this test case, it was
assumed that all the vehicles in the simulation are interested in receiving the issued WAMs. The
information dissemination success and the WAMs’ delay are metrics that indicate whether the
proposed system can be used successfully for timely and reliable provision of notifications to an
on-board collaborative active safety system.
5.7 Results presentation and analysis5.7 Results presentation and analysis5.7 Results presentation and analysis5.7 Results presentation and analysis
The results obtained are presented and discussed for each test case. For the sake of brevity we
present in graphical format all the results for the first test case with their analyses. In subsequent
cases, graphical representations are given only in those cases where the metrics varied
significantly. Please note that some of the graphs, such as the graphs for load density and
mobility (i.e. maximum speed variation), have origins other than null.
Test case 1
This test investigated communication performance for dissemination of BSMs with a constant
rate.
Results
Accepted BSMs delay
The delay values for accepted BSMs as a function of transmission interval, bandwidth,
communication service area, load density and nodes mobility are presented in figures 5.7 – 5.18.
0
0.04
0.08
0.12
0.16
0 0.5 1 1.5 2Transmission Interval [s]
Ave
rag
e B
SM
De
lay [s]
Figure 5.7 Average BSMs delay as a function of transmission interval – test case 1
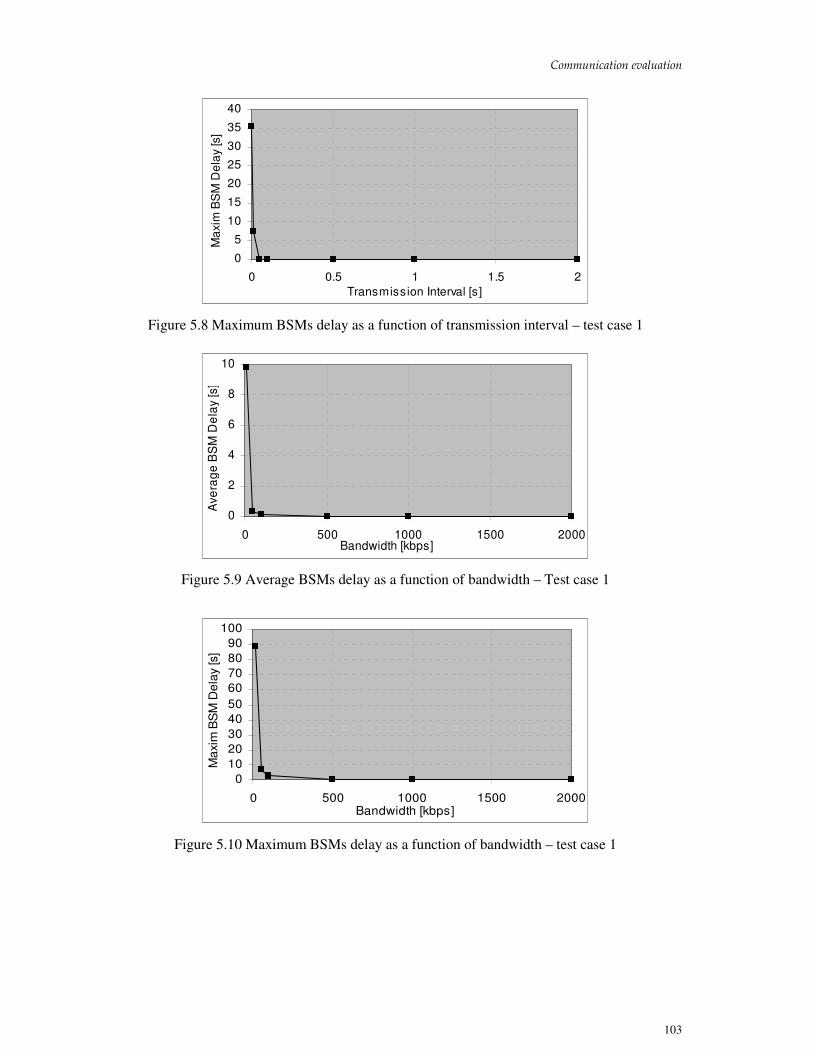
Communication evaluation
103
0
5
10
15
20
25
30
35
40
0 0.5 1 1.5 2
Transmission Interval [s]
Ma
xim
BS
M D
ela
y [s]
Figure 5.8 Maximum BSMs delay as a function of transmission interval – test case 1
0
2
4
6
8
10
0 500 1000 1500 2000Bandwidth [kbps]
Ave
rag
e B
SM
De
lay [s]
Figure 5.9 Average BSMs delay as a function of bandwidth – Test case 1
0
10
20
30
40
50
60
70
80
90
100
0 500 1000 1500 2000Bandwidth [kbps]
Ma
xim
BS
M D
ela
y [s]
Figure 5.10 Maximum BSMs delay as a function of bandwidth – test case 1
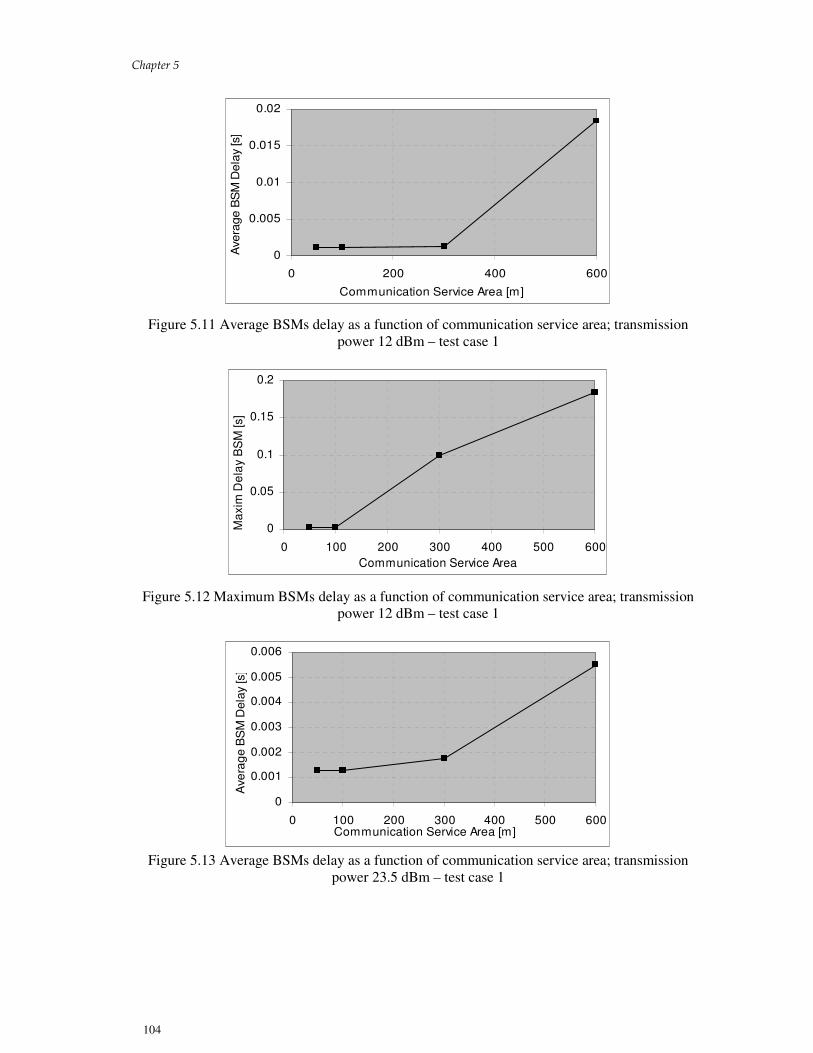
Chapter 5
104
0
0.005
0.01
0.015
0.02
0 200 400 600
Communication Service Area [m]
Avera
ge
BS
M D
ela
y [s]
Figure 5.11 Average BSMs delay as a function of communication service area; transmission
power 12 dBm – test case 1
0
0.05
0.1
0.15
0.2
0 100 200 300 400 500 600
Communication Service Area
Ma
xim
De
lay B
SM
[s]
Figure 5.12 Maximum BSMs delay as a function of communication service area; transmission
power 12 dBm – test case 1
0
0.001
0.002
0.003
0.004
0.005
0.006
0 100 200 300 400 500 600Communication Service Area [m]
Ave
rag
e B
SM
Dela
y [s]
Figure 5.13 Average BSMs delay as a function of communication service area; transmission
power 23.5 dBm – test case 1

Communication evaluation
105
0
0.05
0.1
0.15
0.2
0 100 200 300 400 500 600Communication Area
Ma
xim
De
lay B
SM
[s]
Figure 5.14 Maximum BSMs delay as a function of communication service area; transmission
power 23.5 dBm – test case 1
0
0.004
0.008
0.012
0.016
5 7 9 11 13 15 17 19 21
Load Density [veh/km/lane]
Ave
rag
e B
SM
De
lay [s]
Figure 5.15 Average BSMs delay as a function of network load – test case 1
0
0.2
0.4
0.6
0.8
1
5 7 9 11 13 15 17 19 21
Load Density [veh/km/lane]
Maxim
um
BS
M D
ela
y [s]
Figure 5.16 Maximum BSMs delay as a function of network load – test case 1

Chapter 5
106
0
0.0005
0.001
0.0015
0.002
10 15 20 25 30 35 40
Maximum Speed [m/s]
Ave
rag
e B
SM
De
lay [s]
Figure 5.17 Average BSMs delay as a function of velocity – test case 1
0
0.05
0.1
0.15
0.2
10 15 20 25 30 35 40Maximim Speed [m/s]
Ma
xim
BS
M D
ela
y [s]
Figure 5.18 Maximum BSMs delay as a function of velocity – test case 1
The delay followed a similar pattern for variation of the transmission interval and the
communication system bandwidth. Thus, larger values have been obtained for very small
transmission intervals and small bandwidths. For transmission intervals around 0.04 s, the
maximum delay was under 1 s. As soon as the transmission interval was higher than 0.05 s the
maximum delay values were lower than 0.1 s and had a very limited variation. The higher values
for low transmission intervals indicated that the hosts were unable to efficiently acquire and use
the transmission medium. Furthermore, the messages seemed to be frequently lost due to
collisions. Extensive routing has also been noticed, e.g. in one of the simulation runs a node
routed 10384 messages for a transmission interval of 0.001 s, compared to only 1220 messages for
a transmission interval of 0.1 s. All these led to an increase of the traffic on the channel and to
situations where older messages were received instead of current messages, which were lost.
This also induced increased delays in receiving the traffic data.
In the case of bandwidth, the maximum delay was higher than 1 s when the bandwidth was
lower than 250 kbps. The metric actually reached tens of seconds for bandwidths of tens of kbps
(e.g. 60 s for 10kbps). The maximum delay reached lower values for bandwidths over 210 kbps,
and was around 0.1 s for a bandwidth of 500 kbps, and 0.09 s for 2Mbps. This behavior showed
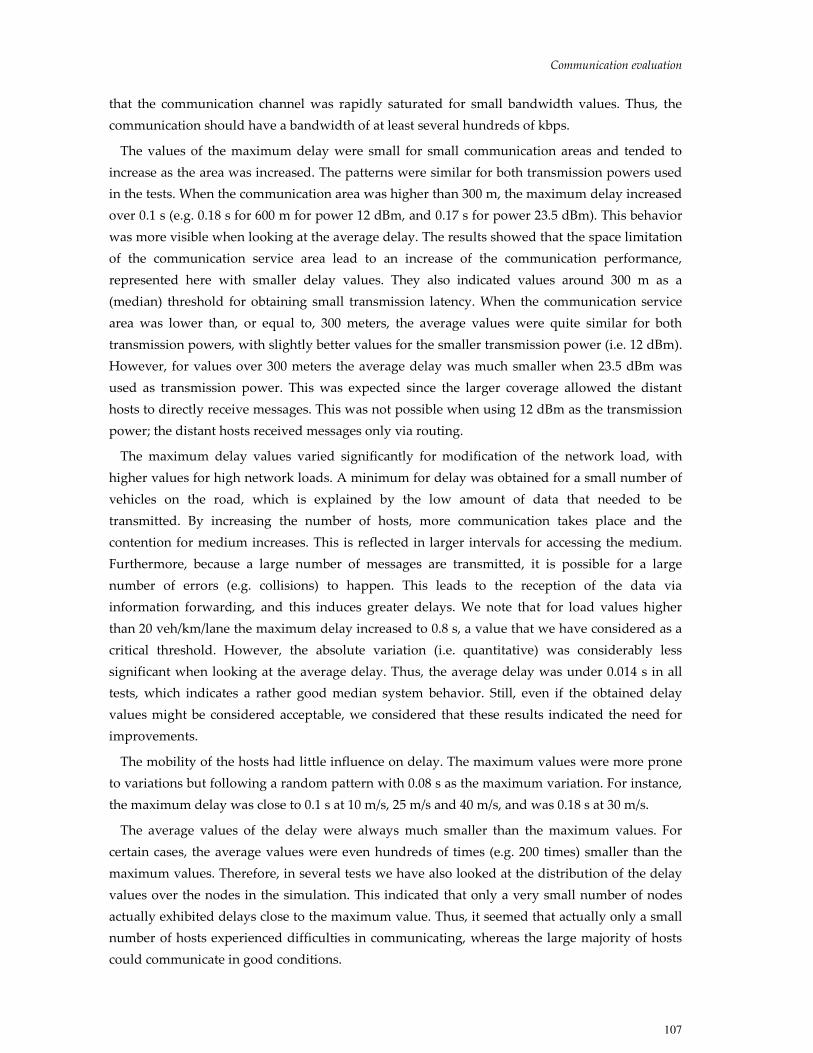
Communication evaluation
107
that the communication channel was rapidly saturated for small bandwidth values. Thus, the
communication should have a bandwidth of at least several hundreds of kbps.
The values of the maximum delay were small for small communication areas and tended to
increase as the area was increased. The patterns were similar for both transmission powers used
in the tests. When the communication area was higher than 300 m, the maximum delay increased
over 0.1 s (e.g. 0.18 s for 600 m for power 12 dBm, and 0.17 s for power 23.5 dBm). This behavior
was more visible when looking at the average delay. The results showed that the space limitation
of the communication service area lead to an increase of the communication performance,
represented here with smaller delay values. They also indicated values around 300 m as a
(median) threshold for obtaining small transmission latency. When the communication service
area was lower than, or equal to, 300 meters, the average values were quite similar for both
transmission powers, with slightly better values for the smaller transmission power (i.e. 12 dBm).
However, for values over 300 meters the average delay was much smaller when 23.5 dBm was
used as transmission power. This was expected since the larger coverage allowed the distant
hosts to directly receive messages. This was not possible when using 12 dBm as the transmission
power; the distant hosts received messages only via routing.
The maximum delay values varied significantly for modification of the network load, with
higher values for high network loads. A minimum for delay was obtained for a small number of
vehicles on the road, which is explained by the low amount of data that needed to be
transmitted. By increasing the number of hosts, more communication takes place and the
contention for medium increases. This is reflected in larger intervals for accessing the medium.
Furthermore, because a large number of messages are transmitted, it is possible for a large
number of errors (e.g. collisions) to happen. This leads to the reception of the data via
information forwarding, and this induces greater delays. We note that for load values higher
than 20 veh/km/lane the maximum delay increased to 0.8 s, a value that we have considered as a
critical threshold. However, the absolute variation (i.e. quantitative) was considerably less
significant when looking at the average delay. Thus, the average delay was under 0.014 s in all
tests, which indicates a rather good median system behavior. Still, even if the obtained delay
values might be considered acceptable, we considered that these results indicated the need for
improvements.
The mobility of the hosts had little influence on delay. The maximum values were more prone
to variations but following a random pattern with 0.08 s as the maximum variation. For instance,
the maximum delay was close to 0.1 s at 10 m/s, 25 m/s and 40 m/s, and was 0.18 s at 30 m/s.
The average values of the delay were always much smaller than the maximum values. For
certain cases, the average values were even hundreds of times (e.g. 200 times) smaller than the
maximum values. Therefore, in several tests we have also looked at the distribution of the delay
values over the nodes in the simulation. This indicated that only a very small number of nodes
actually exhibited delays close to the maximum value. Thus, it seemed that actually only a small
number of hosts experienced difficulties in communicating, whereas the large majority of hosts
could communicate in good conditions.

Chapter 5
108
Packet collisions
The packet collisions as a function of transmission interval, bandwidth, communication service
area, load density and nodes mobility are presented in figures 5.19 – 5.24.
0
0.1
0.2
0.3
0 0.5 1 1.5 2Transmission Interval [s]
No
rma
lize
d p
acke
t co
llis
ion
s
Figure 5.19 Packet collisions as a function of transmission interval – test case 1
0
0.05
0.1
0.15
0.2
0.25
0.3
0 500 1000 1500 2000
Bandwidth [kbps]
No
rma
lize
d p
acke
t co
llis
ion
s
Figure 5.20 Packet collisions as a function of bandwidth – test case 1
0
0.005
0.01
0.015
0.02
0.025
0.03
0.035
0 100 200 300 400 500 600
Communication Service Area [m]
No
rma
lize
d p
acke
t co
llis
ion
s
Figure 5.21 Packet collisions as a function of communication service area; transmission power
12 dBm – test case 1

Communication evaluation
109
0
0.02
0.04
0.06
0.08
0.1
0 100 200 300 400 500 600Communication Service Area [m]
No
rma
lize
d p
acke
t co
llis
ion
s
Figure 5.22 Packet collisions as a function of communication service area; transmission power
23.5 dBm – test case 1
0
0.05
0.1
0.15
0.2
5 7 9 11 13 15 17 19 21
Load Density [veh/km/lane]
No
rma
lize
d p
acke
t co
lisio
ns
Figure 5.23 Packet collisions as a function of network load – test case 1
0
0.005
0.01
0.015
0.02
10 15 20 25 30 35 40
Maximum Speed [veh/km/lane]
No
rma
lize
d p
acke
t co
llis
ion
s
Figure 5.24 Packet collisions as a function of nodes mobility – test case 1
The metric was large for small transmission intervals and then decreased significantly with the
increase of the transmission interval. For transmission intervals higher than 0.1 s, a fairly low
value of the normalized packet collisions was determined. This is mainly because for small
transmission intervals the vehicles tried to send their data often and the packets collided at the

Chapter 5
110
receivers. Furthermore, at low transmission intervals the hosts employed routing extensively,
which led to a higher channel occupation and a higher probability of packet collisions. These
results showed that high efficiency of communication can be obtained when the transmission
intervals for basic safety messages is equal to, or higher than, 0.1 s.
A similar behavior was obtained when modifying the bandwidth. As the bandwidth increased,
packet collisions decreased and the channel was not saturated anymore. The metric reached quite
a low value when the bandwidth was over 500 kbps. This indicated again that a system with a
bandwidth of several hundreds of kbps is needed.
The normalized packet collisions increased with the increase of the communication service
area, with smaller variations until the area was lower than 300 m, and larger variations for areas
between 300 and 600 m. We determined that the number of messages that are routed had risen
significantly with the increase of the service area, which led to a higher collision probability.
Noticeable differences were obtained when using different transmission powers. For the case of
23.5 dBm, the metric normalized packet collisions was up to 2.5 times higher than when using 12
dBm. This is due to the larger area in which the radio wave propagates, and consequently the
increased possibility of collisions as the packets can collide at close as well as distant receivers.
The load density also affects the packet collisions. The increase in the number of the hosts on
the road also caused an increase in the number of collisions. This was expected since more hosts
competed for the transmission medium when they tried to send traffic data. Consequently, more
messages could simultaneously arrive at the radio layer of each node during a simulation run.
As with the BSMs delay, the variation of the mobility of the hosts causes a small variation in
the number of collisions.
Send errors
The send errors as a function of transmission interval, bandwidth, communication service area,
load density and nodes mobility are presented in figures 5.25 – 5.30.
0
0.2
0.4
0.6
0.8
1
0 0.5 1 1.5 2Transmission Interval [s]
No
rma
lize
d s
en
d e
rro
rs
Figure 5.25 Send errors as a function of transmission interval – test case 1

Communication evaluation
111
0
0.1
0.2
0.3
0.4
0.5
0.6
0.7
0.8
0.9
1
0 500 1000 1500 2000Bandwidth [kbps]
No
rma
lize
d s
en
d e
rro
rs
Figure 5.26 Send errors as a function of bandwidth – test case 1
0
0.005
0.01
0.015
0.02
0.025
0 100 200 300 400 500 600
Communication Service Area [m]
No
rma
lize
d s
en
d e
rro
rs
Figure 5.27 Send errors as a function of communication service area; transmission power 12 dBm
– test case 1
0
0.02
0.04
0.06
0.08
0.1
0.12
0 100 200 300 400 500 600
Communication Service Area [m]
No
rma
lize
d s
en
d e
rro
rs
Figure 5.28 Send errors as a function of communication service area; transmission power 23.5
dBm – test case 1

Chapter 5
112
0
0.02
0.04
0.06
0.08
0.1
0.12
0.14
5 7 9 11 13 15 17 19 21Load Density [veh/km/lane]
No
rma
lize
d s
en
d e
rro
rs
Figure 5.29 Send errors as a function of network load – test case 1
0
0.001
0.002
0.003
0.004
10 15 20 25 30 35 40Maximum Speed [m/s]
No
rma
lize
d s
en
d e
rro
rs
Figure 5.30 Send errors as a function of nodes mobility – test case 1
The values for the normalized send errors were relatively high for transmission intervals lower
than 0.01 s. This was because the hosts tried to send their messages very often, and could not
access the transmission medium in time because it was busy. (By “in time” we mean that the
transmission of a BSM could not be performed until a newer BSM was generated and delivered
for transmission on the air interface). As the transmission interval increased, the send errors
decreased and reach very low values for intervals higher than 0.05 s (e.g. 0.00254 for 0.1 s).
For low bandwidth values, the send errors were high and did not reached a low value when
the bandwidth was lower than 350 kbps. For bandwidths between 500 kbps and 2 Mbps, the
values for send errors were very low. This behavior is explained by the channel saturation and
the impossibility for the hosts to access the medium in time when the communication channel
has low bandwidth. The results indicate that a system with a communication bandwidth of at
least 500 kbps would perform best.
The patterns for modifications of the communication areas were similar for the two
transmission powers considered: the send errors were higher for larger communication service
areas. The metric had quite low values until the service area was lower that 300 m, and increased
afterwards. However, the absolute variation was not major. The results for a transmission power
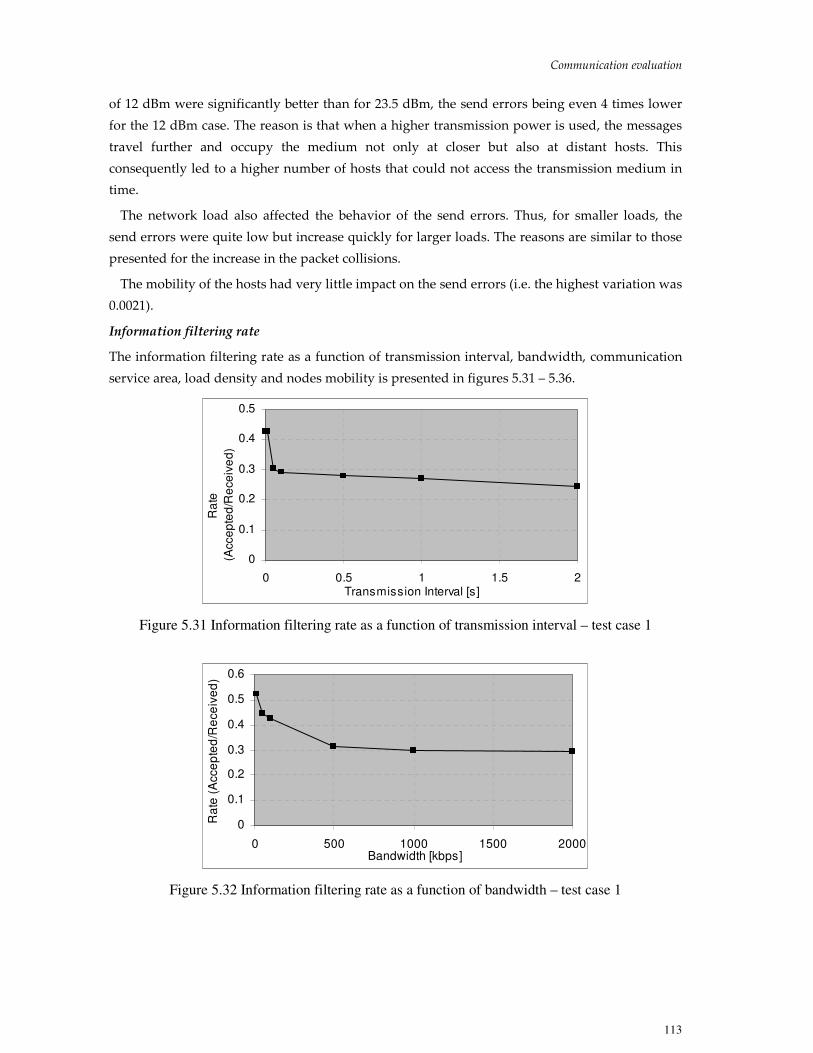
Communication evaluation
113
of 12 dBm were significantly better than for 23.5 dBm, the send errors being even 4 times lower
for the 12 dBm case. The reason is that when a higher transmission power is used, the messages
travel further and occupy the medium not only at closer but also at distant hosts. This
consequently led to a higher number of hosts that could not access the transmission medium in
time.
The network load also affected the behavior of the send errors. Thus, for smaller loads, the
send errors were quite low but increase quickly for larger loads. The reasons are similar to those
presented for the increase in the packet collisions.
The mobility of the hosts had very little impact on the send errors (i.e. the highest variation was
0.0021).
Information filtering rate
The information filtering rate as a function of transmission interval, bandwidth, communication
service area, load density and nodes mobility is presented in figures 5.31 – 5.36.
0
0.1
0.2
0.3
0.4
0.5
0 0.5 1 1.5 2Transmission Interval [s]
Ra
te
(Acce
pte
d/R
ece
ive
d)
Figure 5.31 Information filtering rate as a function of transmission interval – test case 1
0
0.1
0.2
0.3
0.4
0.5
0.6
0 500 1000 1500 2000Bandwidth [kbps]
Ra
te (
Acce
pte
d/R
ece
ive
d)
Figure 5.32 Information filtering rate as a function of bandwidth – test case 1

Chapter 5
114
0
0.05
0.1
0.15
0.2
0.25
0.3
0.35
0 100 200 300 400 500 600
Communication Service Area [m]
Ra
te (
Acce
pte
d/R
ece
ive
d)
Figure 5.33 Information filtering rate as a function of communication service area; transmission
power 12 dBm – test case 1
0
0.05
0.1
0.15
0.2
0 100 200 300 400 500 600
Communication Service Area [m]
Ra
te (
Acce
pte
d/R
ece
ive
d)
Figure 5.34 Information filtering rate as a function of communication service area; transmission
power 23.5 dBm – test case 1
0
0.05
0.1
0.15
0.2
0.25
0.3
0.35
5 7 9 11 13 15 17 19 21Load Density [veh/km/lane]
Ra
te (
Acce
pte
d/R
ece
ive
d)
Figure 5.35 Information filtering rate as a function of network load – test case 1

Communication evaluation
115
0
0.1
0.2
0.3
0.4
0.5
10 15 20 25 30 35 40
Maximum Speed [m/s]
Ra
te (
Acce
pte
d/R
ece
ive
d)
Figure 5.36 Information filtering rate as a function of nodes mobility – test case 1
The information filtering had similar patterns when varying the transmission interval and the
communication system bandwidth. The metric exhibited slightly higher values for smaller values
of transmission interval and bandwidth. The filtering rate then decreased relatively steeply and
had a limited variation for transmission intervals higher than 0.05 s (i.e. 0.25 – 0.3), and
bandwidth values higher than 500 kbps (i.e. 0.29 – 0.3). The results indicated that the
communication protocol performed a significant filtering of information. On average, only 30%
of all received messages were considered to contain useful information and therefore accepted.
The information filtering also varied with the extent of communication service area. The metric
had low values for small communication areas (e.g. 0.04 for 50 m), which increased until the
communication areas was higher than 300 m, and then varied fairly slowly. The low values
obtained for small communication areas are due to the large number of messages that arrived at
the hosts, which only accepted messages from nearby hosts. The metric exhibited lower values
when testing with 23.5 dBm as a transmission power than when testing with 12 dBm. This was
because the sent data in the first case was disseminated in a larger area and therefore a larger
number of non-useful messages arrived at the hosts, who discharged them.
The information filtering decreased with the increase of the network load. This is because
increasing the network load means more vehicles tend to send and rout messages. Consequently,
the hosts received more messages of no interest, i.e. messages with non-useful traffic data or
older messages. This caused the filtering mechanism to drop more messages.
The information filtering rate showed a small variation when modifying the mobility of the
hosts. Thus, the metric varied between 0.26 – 0.4 for maximum speeds between 10 m/s – 40 m/s.
Evaluation results for test case 1 – final analysis
The results indicated that efficient communication is possible even with the basic settings of the
communication protocol that were used in this test case.
The maximum delay values were usually low and very low, a higher value being obtained only
when the network was under high stress, i.e. a high network load was used. However, even in
this case, the average delay values were relatively low. We also investigated here how the
maximum values were distributed over the hosts in the simulations. This investigation revealed
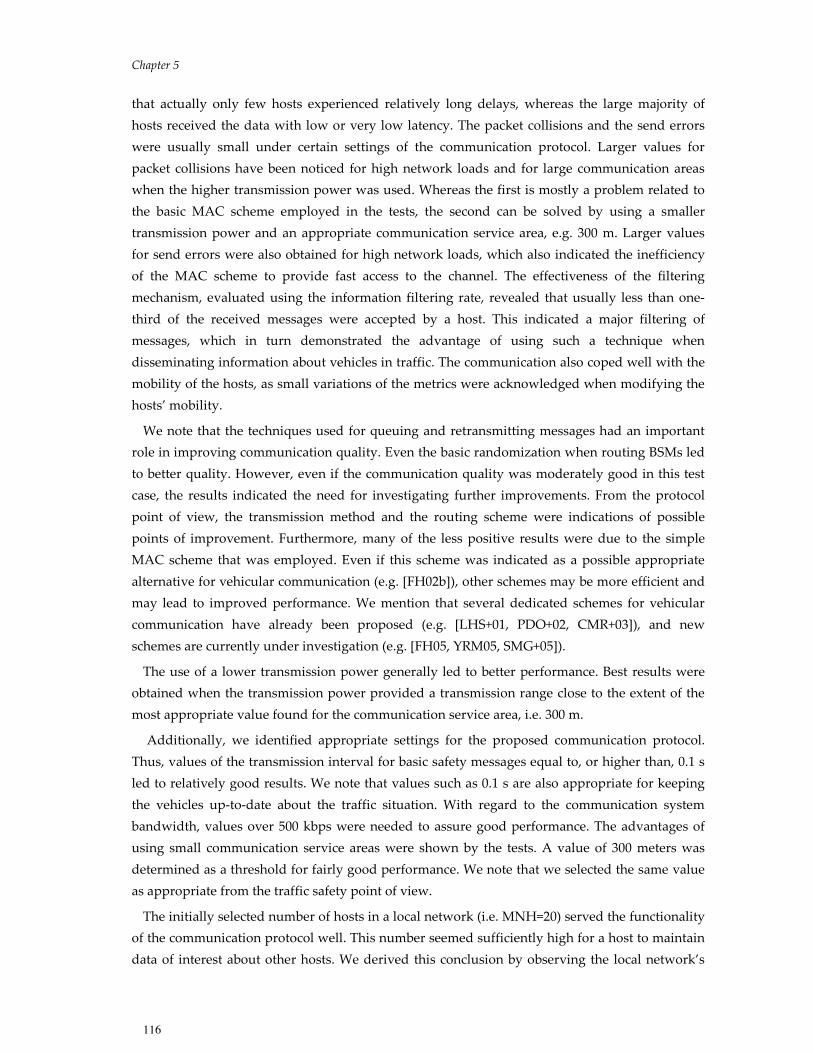
Chapter 5
116
that actually only few hosts experienced relatively long delays, whereas the large majority of
hosts received the data with low or very low latency. The packet collisions and the send errors
were usually small under certain settings of the communication protocol. Larger values for
packet collisions have been noticed for high network loads and for large communication areas
when the higher transmission power was used. Whereas the first is mostly a problem related to
the basic MAC scheme employed in the tests, the second can be solved by using a smaller
transmission power and an appropriate communication service area, e.g. 300 m. Larger values
for send errors were also obtained for high network loads, which also indicated the inefficiency
of the MAC scheme to provide fast access to the channel. The effectiveness of the filtering
mechanism, evaluated using the information filtering rate, revealed that usually less than one-
third of the received messages were accepted by a host. This indicated a major filtering of
messages, which in turn demonstrated the advantage of using such a technique when
disseminating information about vehicles in traffic. The communication also coped well with the
mobility of the hosts, as small variations of the metrics were acknowledged when modifying the
hosts’ mobility.
We note that the techniques used for queuing and retransmitting messages had an important
role in improving communication quality. Even the basic randomization when routing BSMs led
to better quality. However, even if the communication quality was moderately good in this test
case, the results indicated the need for investigating further improvements. From the protocol
point of view, the transmission method and the routing scheme were indications of possible
points of improvement. Furthermore, many of the less positive results were due to the simple
MAC scheme that was employed. Even if this scheme was indicated as a possible appropriate
alternative for vehicular communication (e.g. [FH02b]), other schemes may be more efficient and
may lead to improved performance. We mention that several dedicated schemes for vehicular
communication have already been proposed (e.g. [LHS+01, PDO+02, CMR+03]), and new
schemes are currently under investigation (e.g. [FH05, YRM05, SMG+05]).
The use of a lower transmission power generally led to better performance. Best results were
obtained when the transmission power provided a transmission range close to the extent of the
most appropriate value found for the communication service area, i.e. 300 m.
Additionally, we identified appropriate settings for the proposed communication protocol.
Thus, values of the transmission interval for basic safety messages equal to, or higher than, 0.1 s
led to relatively good results. We note that values such as 0.1 s are also appropriate for keeping
the vehicles up-to-date about the traffic situation. With regard to the communication system
bandwidth, values over 500 kbps were needed to assure good performance. The advantages of
using small communication service areas were shown by the tests. A value of 300 meters was
determined as a threshold for fairly good performance. We note that we selected the same value
as appropriate from the traffic safety point of view.
The initially selected number of hosts in a local network (i.e. MNH=20) served the functionality
of the communication protocol well. This number seemed sufficiently high for a host to maintain
data of interest about other hosts. We derived this conclusion by observing the local network’s

Communication evaluation
117
composition (i.e. the level of occupation in the communication system database at each host) at
the end of each simulation run. Thus, in almost all simulations, the number of hosts in the local
network was lower than MNH (i.e. the databases were not completely occupied).
As a final test, we analyzed in several experiments the composition of the local network of each
node at the end of the simulation to identify if these nodes have information about the vehicles
that should be of interest. To do so, we defined beforehand, using the characteristics of the
vehicles from the trace files and the filtering rules, which vehicles are of interest for each of the
nodes. Then, we analyzed the local network database to see if these vehicles are actually
registered into it. In all the cases in which this analysis was performed, the matching scored the
maximum value, which indicated that the nodes had data about the vehicles of interest.
Test case 2
This test investigated communication performance for dissemination of BSMs with adaptive rate.
Results
The results are presented with regard to the results obtained for the previous test case.
Accepted BSMs delay
The delay values for accepted BSMs as a function of bandwidth and load density are presented in
figures 5.37 – 5.40. The results for communication area and hosts mobility were similar both as
patterns and values to the constant rate test.
0
2
4
6
8
10
12
0 500 1000 1500 2000Bandwidth [kbps]
Ave
rag
e B
SM
De
lay [s]
Figure 5.37 Average BSMs delay as a function of bandwidth – test case 2

Chapter 5
118
0
10
20
30
40
50
60
0 500 1000 1500 2000
Bandwidth [kbps]
Ma
xim
BS
M D
ela
y [s]
Figure 5.38 Maximum BSMs delay as a function of bandwidth – test case 2
0
0.002
0.004
0.006
0.008
0.01
0.012
0.014
5 7 9 11 13 15 17 19 21
Load Density [veh/km/lane]
Ave
rag
e B
SM
De
lay [s]
Figure 5.39 Average BSMs delay as a function of load density – test case 2
0
0.1
0.2
0.3
0.4
0.5
0.6
5 7 9 11 13 15 17 19 21
Load Density [veh/km/lane]
Ma
xim
um
BS
M D
ela
y [s]
Figure 5.40 Maximum BSMs delay as a function of load density
The delay values followed patterns similar to the previous test case for variation of the
communication system bandwidth. The reasons for this behavior are also similar to the previous
test. For values less than 200 kbps, the maximum delay was higher than 1 s. For values over 500
kbps, the delay was between 0.1 and 0.12 s.

Communication evaluation
119
Patterns similar to the previous test were also obtained for modifications of the network load.
However, the delay values were quite different as the highest value for maximum delay was 0.55
s in this case. Also, the maximum value for the average delay was 0.011 s.
The results for modifying the communication area were also very similar to the constant rate
approach, with around 300 m as a threshold for better performance.
As with the previous test, the mobility of the hosts did not significantly influence the delay.
Packet collisions
The packet collisions as a function of bandwidth and network load are presented in figures 5.41
and 5.42.
0
0.05
0.1
0.15
0.2
0.25
0.3
0 500 1000 1500 2000Bandwidth [kbps]
No
rma
lize
d p
acke
t co
llis
ion
s
Figure 5.41 Packet collisions as a function of bandwidth – test case 2
0
0.02
0.04
0.06
0.08
0.1
0.12
0.14
0.16
5 7 9 11 13 15 17 19 21
Load Density [veh/km/lane]
No
rma
lize
d p
acke
t co
llis
ion
s
Figure 5.42 Packet collisions as a function of load density – test case 2
The packet collisions followed patterns relatively similar to the previous test when modifying the
bandwidth and the load density. The reasons for this behavior of the metric are obviously the
same as for the previous test. However, smaller values have been obtained for the adaptive
approach. Thus, the values of the normalized packet collisions were up to 1.4 times lower both
for the variation of bandwidth and for the variation of the network load. Also, the packet

Chapter 5
120
collisions decreased slightly faster with the bandwidth increase, and increased more slowly with
the load density increase.
The variation of communication service area and maximum speed also led to patterns similar
to the previous test. Again, the obtained values were significantly smaller than the values
obtained in the first test case. For communication service area, the packet collisions had values
up to 3 times lower. For mobility, the values were up to 3.8 times lower when the velocity was
lower than 25 m/s. For higher velocities, the values were similar.
Send errors
The send errors as a function of bandwidth and network load are presented in figures 5.43 and
5.44. Also here, the patterns were similar to those of the previous test but the metric had
significantly smaller values. For bandwidth, a reduction of up to 1.6 times was obtained. For
network load, a reduction of up to 8.7 times was obtained, with more significant values for lower
network loads. The same behavior has been obtained for variation of the communication area
and hosts mobility. For load density the reduction was up to 1.6 times, and for communication
area the reduction was up to 1.7 times.
0
0.2
0.4
0.6
0.8
1
0 500 1000 1500 2000 2500Bandwidth [kbps]
No
rma
lize
d s
en
d e
rro
rs
Figure 5.43 Send errors as a function of bandwidth – test case 2
0
0.02
0.04
0.06
0.08
0.1
0.12
5 7 9 11 13 15 17 19 21Load Density [veh/km/lane]
No
rma
lize
d s
en
d e
rro
rs
Figure 5.44 Send errors as a function of load density – test case 2

Communication evaluation
121
Information filtering rate
The obtained results were very similar to the results obtained within the test using a constant rate
dissemination of BSMs. The information filtering was again major, with only around one third of
the messages being accepted.
Evaluation results for test case 2 – final analysis
The obtained results indicated that timely and reliable communication is possible using the
proposed protocol.
Most of the considerations given for the previous test are also valid for this case, as are the
settings of the protocol that lead to good performance. However, the use of the adaptive
approach led to significantly better results. Thus, the highest value of the maximum delay,
obtained under high network stress, was 1.44 times lower than in the case of using a constant rate
for generating BSMs. This value (i.e. 0.55 s) was also reasonably good as related work showed
that values of up to 0.6 s can lead to significant improvements in traffic safety [WH98a]. The
adaptive approach outperformed the constant approach with regard to collisions and send
errors. These metrics were significantly lower in most of the cases when the adaptive approach
was employed. The information filtering revealed similar results in both cases. In conclusion, the
adaptive approach performs much better and therefore it is more appropriate for meeting the
requirements of safety vehicular communication.
Test case 3
This test investigated the influence of BSMs forwarding technique on communication
performance. We analyzed possible improvements of communication performance when using
the extended approach for forwarding information. For this routing technique, the same decision
is used both for filtering and for forwarding BSMs.
Results for the constant rate approach
Accepted BSMs delay
Similar patterns have been obtained in most of the simulations in comparison to the initial
approach when the basic technique was used for routing. When using the extended routing
technique, slightly lower values of the maximum delay were obtained for modification of the
transmission interval, bandwidth, and hosts mobility. Similar values for the maximum delay
have been obtained for modification of the communication service area. However, a major
difference in the maximum delay values was obtained for modification of the network load. The
delay variation for modifications of the load density is presented in figures 5.45 and 5.46. Thus,
for the highest load, a decrease of 1.8 times has been noticed when using the extended routing
scheme. The absolute maximum value was 0.44 s in this case. As mentioned above, this value can
allow for important improvements in traffic safety.
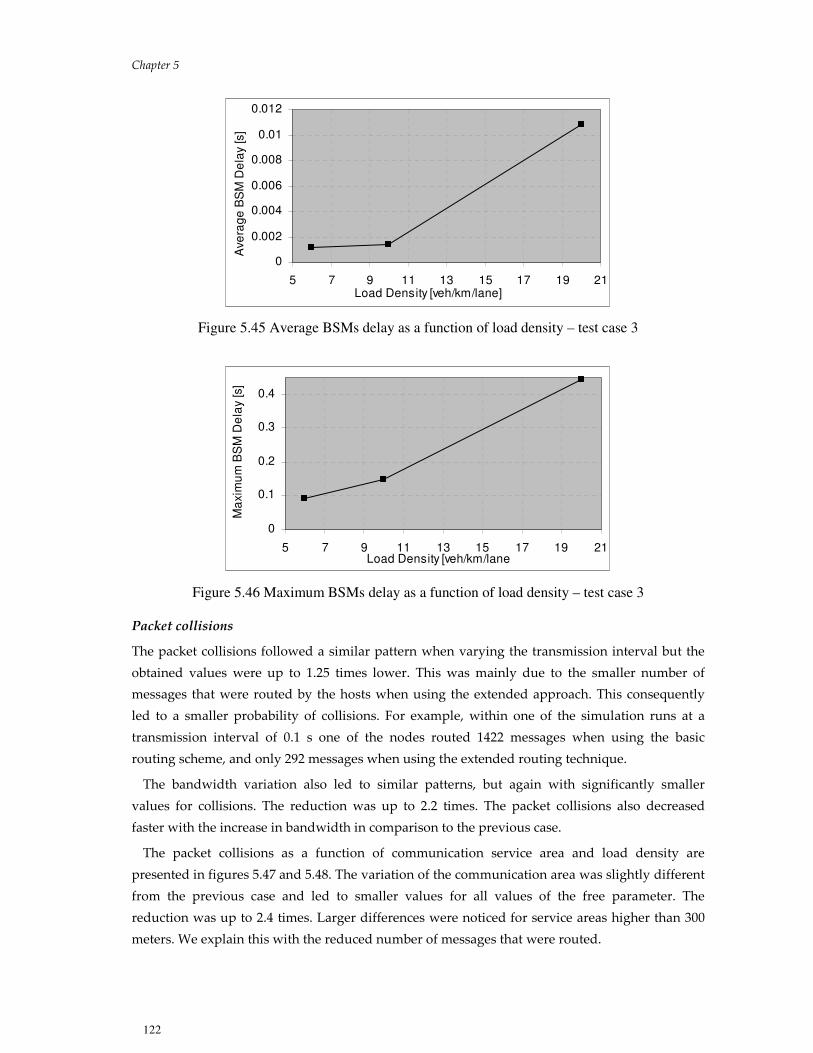
Chapter 5
122
0
0.002
0.004
0.006
0.008
0.01
0.012
5 7 9 11 13 15 17 19 21Load Density [veh/km/lane]
Ave
rag
e B
SM
De
lay [s]
Figure 5.45 Average BSMs delay as a function of load density – test case 3
0
0.1
0.2
0.3
0.4
5 7 9 11 13 15 17 19 21Load Density [veh/km/lane
Ma
xim
um
BS
M D
ela
y [s]
Figure 5.46 Maximum BSMs delay as a function of load density – test case 3
Packet collisions
The packet collisions followed a similar pattern when varying the transmission interval but the
obtained values were up to 1.25 times lower. This was mainly due to the smaller number of
messages that were routed by the hosts when using the extended approach. This consequently
led to a smaller probability of collisions. For example, within one of the simulation runs at a
transmission interval of 0.1 s one of the nodes routed 1422 messages when using the basic
routing scheme, and only 292 messages when using the extended routing technique.
The bandwidth variation also led to similar patterns, but again with significantly smaller
values for collisions. The reduction was up to 2.2 times. The packet collisions also decreased
faster with the increase in bandwidth in comparison to the previous case.
The packet collisions as a function of communication service area and load density are
presented in figures 5.47 and 5.48. The variation of the communication area was slightly different
from the previous case and led to smaller values for all values of the free parameter. The
reduction was up to 2.4 times. Larger differences were noticed for service areas higher than 300
meters. We explain this with the reduced number of messages that were routed.
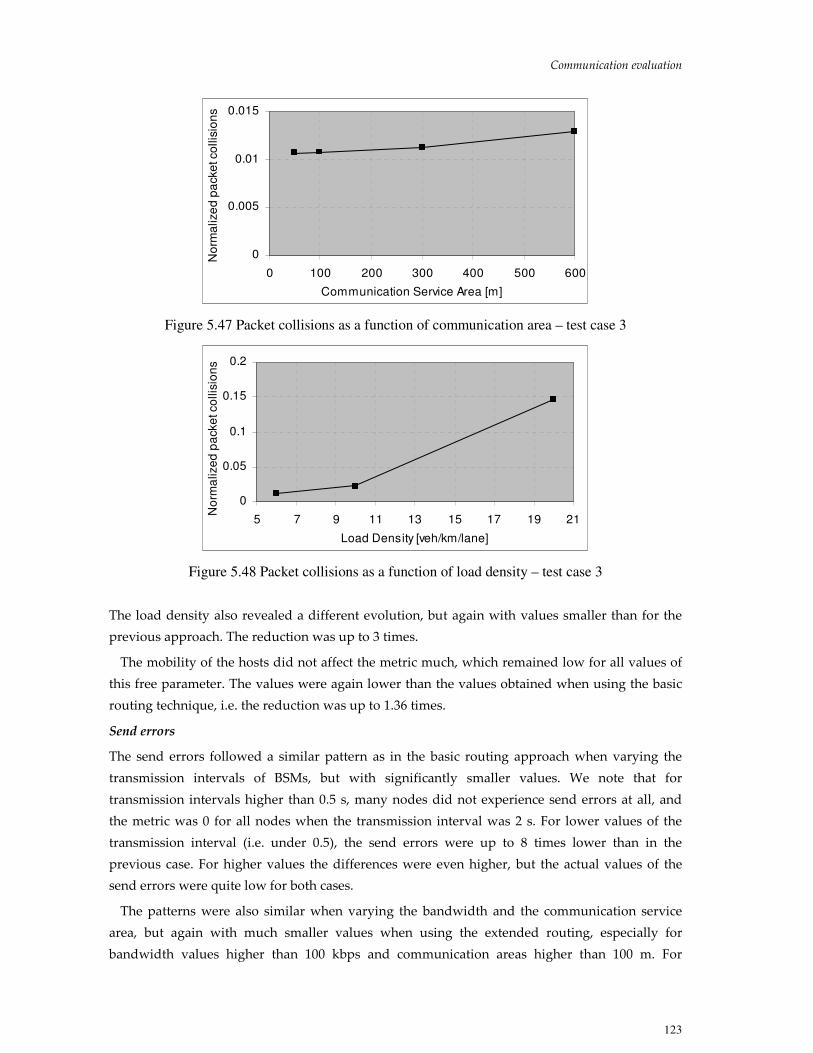
Communication evaluation
123
0
0.005
0.01
0.015
0 100 200 300 400 500 600
Communication Service Area [m]
No
rma
lize
d p
acke
t co
llis
ion
s
Figure 5.47 Packet collisions as a function of communication area – test case 3
0
0.05
0.1
0.15
0.2
5 7 9 11 13 15 17 19 21
Load Density [veh/km/lane]
No
rma
lize
d p
acke
t co
llis
ion
s
Figure 5.48 Packet collisions as a function of load density – test case 3
The load density also revealed a different evolution, but again with values smaller than for the
previous approach. The reduction was up to 3 times.
The mobility of the hosts did not affect the metric much, which remained low for all values of
this free parameter. The values were again lower than the values obtained when using the basic
routing technique, i.e. the reduction was up to 1.36 times.
Send errors
The send errors followed a similar pattern as in the basic routing approach when varying the
transmission intervals of BSMs, but with significantly smaller values. We note that for
transmission intervals higher than 0.5 s, many nodes did not experience send errors at all, and
the metric was 0 for all nodes when the transmission interval was 2 s. For lower values of the
transmission interval (i.e. under 0.5), the send errors were up to 8 times lower than in the
previous case. For higher values the differences were even higher, but the actual values of the
send errors were quite low for both cases.
The patterns were also similar when varying the bandwidth and the communication service
area, but again with much smaller values when using the extended routing, especially for
bandwidth values higher than 100 kbps and communication areas higher than 100 m. For
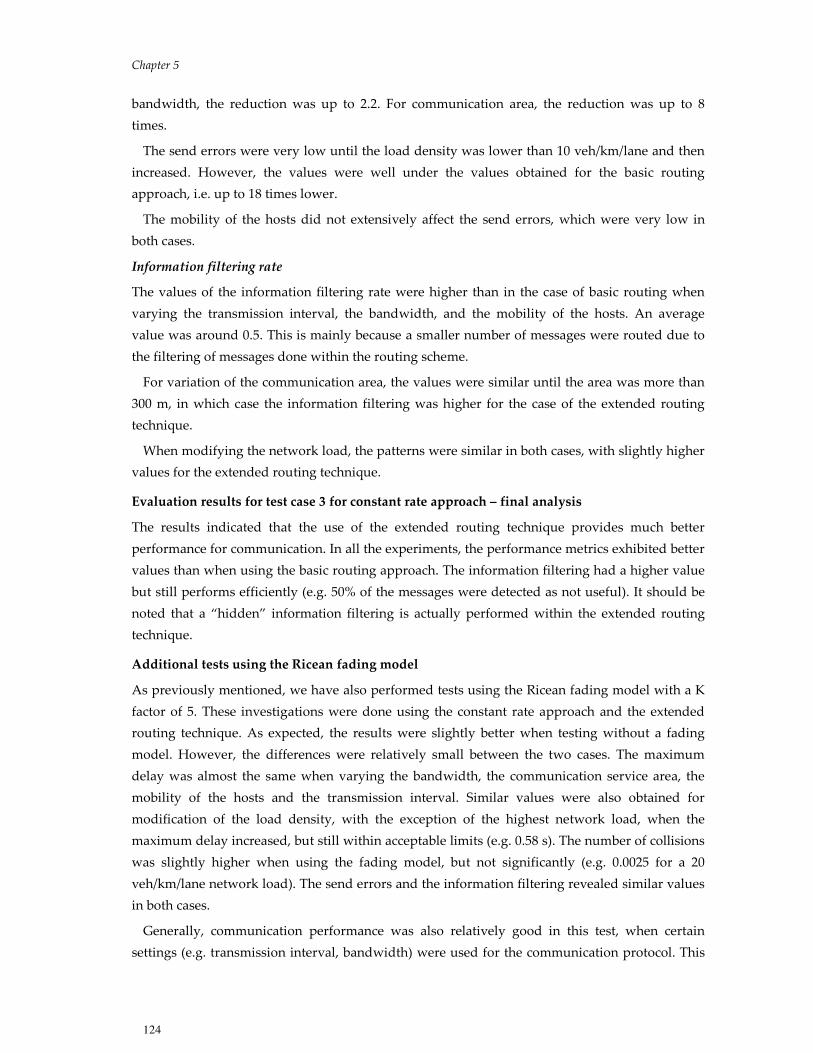
Chapter 5
124
bandwidth, the reduction was up to 2.2. For communication area, the reduction was up to 8
times.
The send errors were very low until the load density was lower than 10 veh/km/lane and then
increased. However, the values were well under the values obtained for the basic routing
approach, i.e. up to 18 times lower.
The mobility of the hosts did not extensively affect the send errors, which were very low in
both cases.
Information filtering rate
The values of the information filtering rate were higher than in the case of basic routing when
varying the transmission interval, the bandwidth, and the mobility of the hosts. An average
value was around 0.5. This is mainly because a smaller number of messages were routed due to
the filtering of messages done within the routing scheme.
For variation of the communication area, the values were similar until the area was more than
300 m, in which case the information filtering was higher for the case of the extended routing
technique.
When modifying the network load, the patterns were similar in both cases, with slightly higher
values for the extended routing technique.
Evaluation results for test case 3 for constant rate approach – final analysis
The results indicated that the use of the extended routing technique provides much better
performance for communication. In all the experiments, the performance metrics exhibited better
values than when using the basic routing approach. The information filtering had a higher value
but still performs efficiently (e.g. 50% of the messages were detected as not useful). It should be
noted that a “hidden” information filtering is actually performed within the extended routing
technique.
Additional tests using the Ricean fading model
As previously mentioned, we have also performed tests using the Ricean fading model with a K
factor of 5. These investigations were done using the constant rate approach and the extended
routing technique. As expected, the results were slightly better when testing without a fading
model. However, the differences were relatively small between the two cases. The maximum
delay was almost the same when varying the bandwidth, the communication service area, the
mobility of the hosts and the transmission interval. Similar values were also obtained for
modification of the load density, with the exception of the highest network load, when the
maximum delay increased, but still within acceptable limits (e.g. 0.58 s). The number of collisions
was slightly higher when using the fading model, but not significantly (e.g. 0.0025 for a 20
veh/km/lane network load). The send errors and the information filtering revealed similar values
in both cases.
Generally, communication performance was also relatively good in this test, when certain
settings (e.g. transmission interval, bandwidth) were used for the communication protocol. This

Communication evaluation
125
indicated that the communication protocol can accommodate transmission environments that
pose different requirements on communication.
Results for the adaptive rate approach
Here, we compare the results obtained when using the adaptive rate approach for disseminating
basic safety messages and the basic and the extended techniques for routing them.
Accepted BSMs delay
When varying the bandwidth, better delay values were obtained when using the extended
routing technique. The maximum delay was around 1 s when the bandwidth was 100 kbps,
which was half of the value obtained for the basic routing. As soon as the bandwidth was higher
than 500 kbps, the maximum delay was always under 0.1 s.
For variation of the communication service area, the results were similar for both routing
techniques.
When varying the load density, lower values were obtained for the maximum delay when
using the extended routing. The maximum was 0.47 s at the highest load tested.
For variation of the mobility of the hosts, the values were quite similar, with a very small
improvement for the extended routing case.
Packet collisions
The variation of the bandwidth led to better results for the advanced routing with differences
that reached 1.9 times (i.e. for bandwidth of 1 Mbps).
The modification of the communication area led to better results for the use of the extended
routing technique. For the largest area considered, i.e. 600 m, the difference was great, i.e. 3.2
times.
The packet collisions were also lower for extended routing scheme when the load of the
network was used as a free parameter. The differences were as high as 2.75 times.
An improvement was also noticed when varying the mobility of the nodes. However, in this
case the packet collisions were low in all cases.
Send errors
The send errors were lower for the extended routing scheme when using the bandwidth as a free
parameter. Better results were obtained for bandwidth values over 100 kbps, where
improvements of up to 10.7 times were noticed. Still, for bandwidth over 500 kbps, the send
errors were quite low in both cases.
The variation of the communication service area also revealed improvements due to the
extended routing technique, especially for areas over 300 m. However, a small number of send
errors were noticed in almost all tests.
The modification of the load density led to better results when using the extended routing. For
instance, the send errors were up to 14.3 times lower when using the extended routing.
The hosts’ mobility variation also revealed better performance for the extended routing.
However, in both cases, the number of send errors was again quite small.

Chapter 5
126
Information filtering rate
For both approaches, the metric varied slowly for modifications of the bandwidth,
communication area, and mobility, with slightly higher values when using the extended routing
scheme. In the case of modification of load density, the variation was steeper, with again higher
values for the extended routing technique.
Evaluation results for test case 3 for adaptive rate approach – final analysis
The results indicated that the extended routing technique also provides better performance for
communication when using the adaptive approach for disseminating basic safety messages. The
most important improvement was in the packet collisions. Also important are the improvements
for maximum delay and send errors.
Comparison between the adaptive and the constant rate approaches when using the extended
routing technique
In order to be able to provide a complete analysis and identify the best method for exchanging
safety data within the vehicular environment we have also compared the case of adaptive rate
and constant rate when using the extended routing scheme. We have previously shown that
using the basic routing the adaptive scheme outperforms the constant rate scheme. However, we
had to see if this would be also the case when using the extended routing technique.
Accepted BSMs delay
The variation of bandwidth and communication service area led to small improvements in
several cases for the delay in the case of adaptive dissemination of BSMs.
The variation of load density and mobility of the hosts led to very similar results.
Packet collisions
The variation of the bandwidth led to smaller values for the adaptive approach. The differences
for the normalized packet collisions values were higher at larger bandwidths, e.g. 1.48 times at 1
Mbps and 2 times at 2 Mbps. However, the packet collisions had relatively small values for high
bandwidths, e.g. 0.0142 for the constant rate and 0.00958 for the adaptive rate when the
bandwidth was 1 Mbps.
When varying the communication service area, the number of collisions was up to 2.7 times
lower for the adaptive approach. Again, the metric had low values in these experiments.
The modification of the load density revealed also an improvement for the adaptive approach.
This was more important for low network loads (e.g. 2 times for 6 veh/km/lane).
Smaller values of the packet collisions for the adaptive approach were obtained for
modification of the mobility of the hosts when the maximum speed had values lower than 25
m/s. This was obviously due to the smaller number of messages transmitted using the adaptive
approach. For small velocities the differences were high, e.g. 7 times lower value for 10 m/s.

Communication evaluation
127
Send errors
Smaller values of send errors were obtained when using the adaptive approach in comparison to
the constant rate approach when modifying the system bandwidth. However, we note that for
bandwidth values over 500 kbps, the absolute differences (i.e. in units) were less significant and
the send errors had very low values in both cases.
When modifying the communication service area, the metric had very low values in all tests.
Small improvements have been noticed for the adaptive approach.
As with the packet collisions case, the variation of the network load led to better results for the
adaptive approach. The reduction of the send errors was up to 2.4 times. However, the metric
had relatively low values within the performed tests, especially for lower network loads.
The modification of the hosts’ mobility generated a small number of send errors in all the tests,
with better results for the adaptive approach. Again, larger differences were obtained for smaller
values of velocities (e.g. 4.77 times less send errors for 20 m/s).
Information filtering rate
Similar results were obtained for both approaches when varying all the free parameters.
Comparative evaluation for the adaptive and constant rate approaches with extended routing -
final analysis
In all tests the adaptive approach outperformed the constant rate approach. The most significant
differences were for packet collisions and send errors.
Test case 4
In this test, the basic communication performance under the transmission of warning messages
was investigated. We use the term “basic communication performance” when presenting results
for test cases 4 and 5 to address the following metrics: accepted BSMs delay, packet collisions,
and send errors. In addition, we investigated the latency in delivering WAMs and the
information dissemination success. The last metric was evaluated by determining if the
transmitted WAMs were received by a pre-defined set of hosts.
As previously mentioned, warning messages were set by default to be transmitted in an area
larger than the size of a local network (i.e. default acceptance field was validated). Consequently,
the messages could be received by a large number of vehicles and their dissemination could be
performed in large areas. This meant that the warnings could be received by vehicles situated at
several kilometers from the vehicle that issued the warning message.
The basic communication performance was quite similar when testing with and without
WAMs. The metrics packet collisions and send errors were slightly higher when warning
messages were transmitted under a high network load. This was expected as more messages
were in the network and the contention for the medium increased. The results indicated that the
transmission of warnings did not significantly influence the basic communication performance,
when the number of generated WAMs was reasonably small. Under normal conditions this
should be the case as vehicles that are notified about a hazard will only forward the
announcement and should not produce and send their own announcement.

Chapter 5
128
The WAMs delay as a function of the transmission interval, bandwidth, communication service
area, network load and mobility of hosts is presented in figures 5.49 – 5.58.
0
0.5
1
1.5
2
2.5
0 0.5 1 1.5 2Transmission Interval [s]
Av
era
ge
WA
M D
ela
y [
s]
Figure 5.49 Average WAMs delay as a function of transmission interval – test case 4
0
5
10
15
20
0 0.5 1 1.5 2Transmission Interval [s]
Ma
xim
um
WA
M D
ela
y [s]
Figure 5.50 Maximum WAMs delay as a function of transmission interval – test case 4
0
5
10
15
20
25
0 500 1000 1500 2000Bandwidth [kbps]
Avera
ge W
AM
Dela
y [s]
Figure 5.51 Average WAMs delay as a function of bandwidth – test case 4

Communication evaluation
129
0
20
40
60
0 500 1000 1500 2000Bandwidth [kbps]
Ma
xim
um
WA
M D
ela
y [s]
Figure 5.52 Maximum WAMs delay as a function of bandwidth – test case 4
0.2
0.22
0.24
0.26
0 100 200 300 400 500 600
Communication Service Area [m]
Avera
ge W
AM
Dela
y [s]
Figure 5.53 Average WAMs delay as a function of communication service area – test case 4
0.7
0.75
0.8
0.85
0.9
0 100 200 300 400 500 600
Communication Service Area [m]
Maxim
WA
M D
ela
y [s]
Figure 5.54 Maximum WAMs delay as a function of communication service area – test case 4
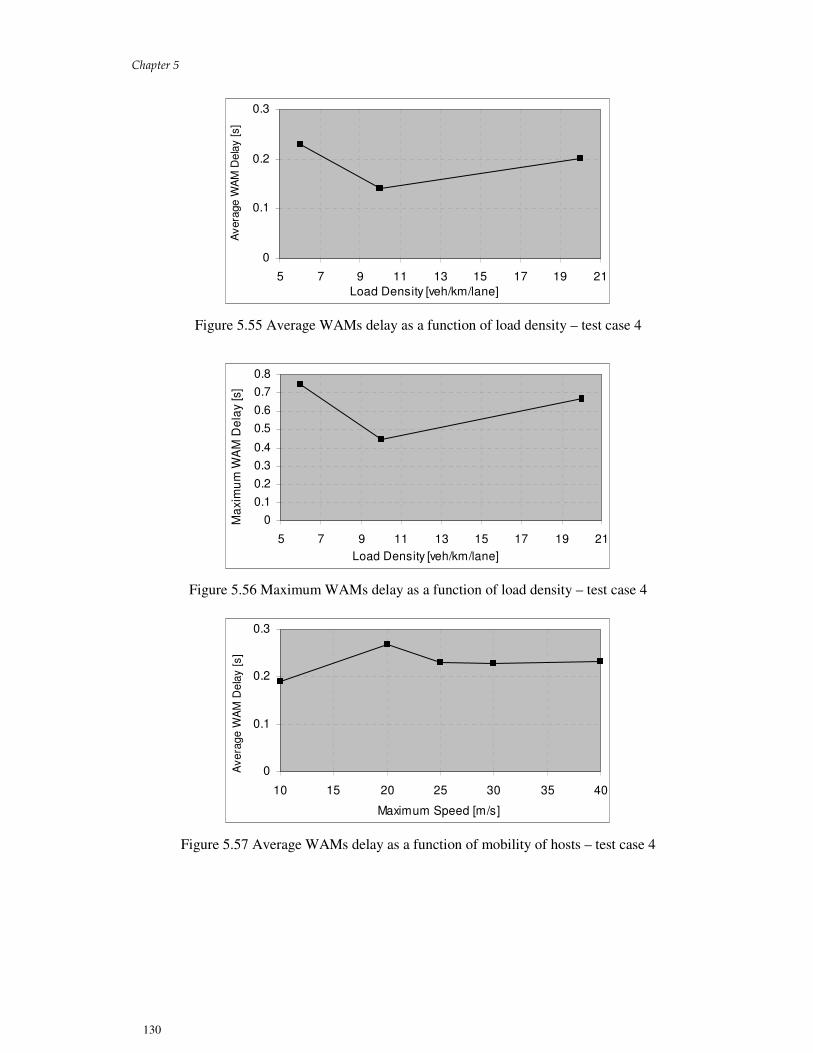
Chapter 5
130
0
0.1
0.2
0.3
5 7 9 11 13 15 17 19 21
Load Density [veh/km/lane]
Avera
ge W
AM
Dela
y [s]
Figure 5.55 Average WAMs delay as a function of load density – test case 4
0
0.1
0.2
0.3
0.4
0.5
0.6
0.7
0.8
5 7 9 11 13 15 17 19 21
Load Density [veh/km/lane]
Ma
xim
um
WA
M D
ela
y [s]
Figure 5.56 Maximum WAMs delay as a function of load density – test case 4
0
0.1
0.2
0.3
10 15 20 25 30 35 40
Maximum Speed [m/s]
Ave
rage
WA
M D
ela
y [
s]
Figure 5.57 Average WAMs delay as a function of mobility of hosts – test case 4
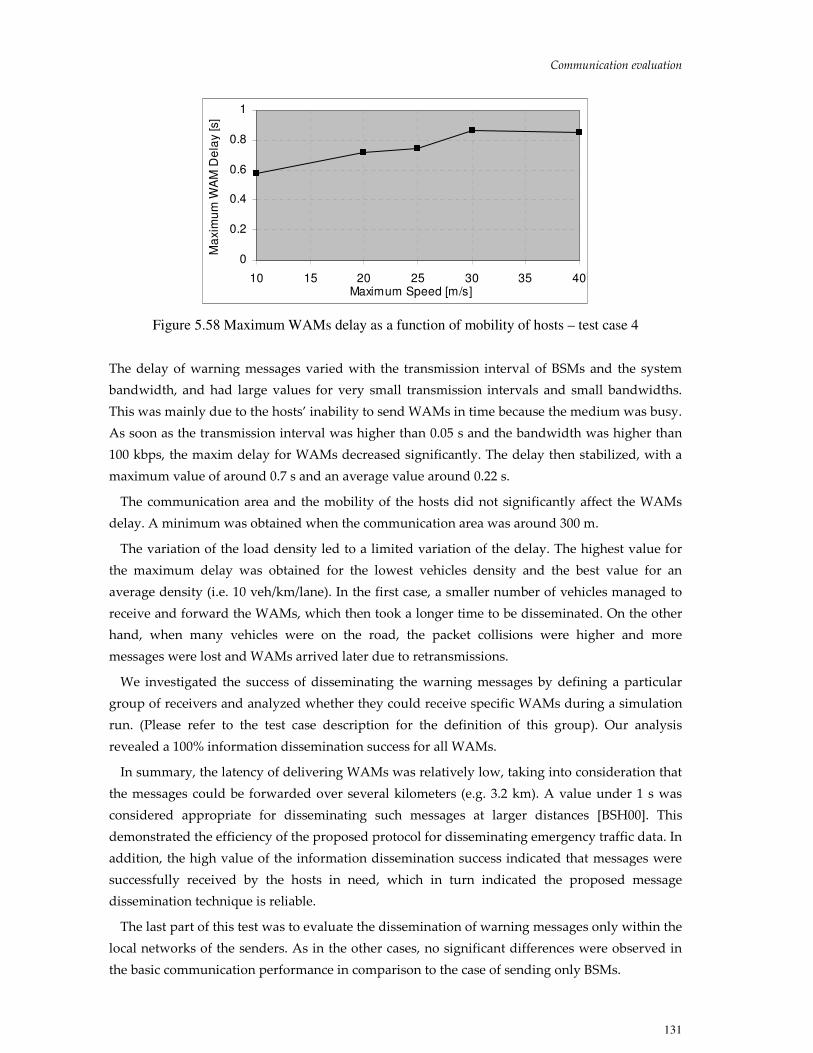
Communication evaluation
131
0
0.2
0.4
0.6
0.8
1
10 15 20 25 30 35 40Maximum Speed [m/s]
Ma
xim
um
WA
M D
ela
y [s]
Figure 5.58 Maximum WAMs delay as a function of mobility of hosts – test case 4
The delay of warning messages varied with the transmission interval of BSMs and the system
bandwidth, and had large values for very small transmission intervals and small bandwidths.
This was mainly due to the hosts’ inability to send WAMs in time because the medium was busy.
As soon as the transmission interval was higher than 0.05 s and the bandwidth was higher than
100 kbps, the maxim delay for WAMs decreased significantly. The delay then stabilized, with a
maximum value of around 0.7 s and an average value around 0.22 s.
The communication area and the mobility of the hosts did not significantly affect the WAMs
delay. A minimum was obtained when the communication area was around 300 m.
The variation of the load density led to a limited variation of the delay. The highest value for
the maximum delay was obtained for the lowest vehicles density and the best value for an
average density (i.e. 10 veh/km/lane). In the first case, a smaller number of vehicles managed to
receive and forward the WAMs, which then took a longer time to be disseminated. On the other
hand, when many vehicles were on the road, the packet collisions were higher and more
messages were lost and WAMs arrived later due to retransmissions.
We investigated the success of disseminating the warning messages by defining a particular
group of receivers and analyzed whether they could receive specific WAMs during a simulation
run. (Please refer to the test case description for the definition of this group). Our analysis
revealed a 100% information dissemination success for all WAMs.
In summary, the latency of delivering WAMs was relatively low, taking into consideration that
the messages could be forwarded over several kilometers (e.g. 3.2 km). A value under 1 s was
considered appropriate for disseminating such messages at larger distances [BSH00]. This
demonstrated the efficiency of the proposed protocol for disseminating emergency traffic data. In
addition, the high value of the information dissemination success indicated that messages were
successfully received by the hosts in need, which in turn indicated the proposed message
dissemination technique is reliable.
The last part of this test was to evaluate the dissemination of warning messages only within the
local networks of the senders. As in the other cases, no significant differences were observed in
the basic communication performance in comparison to the case of sending only BSMs.
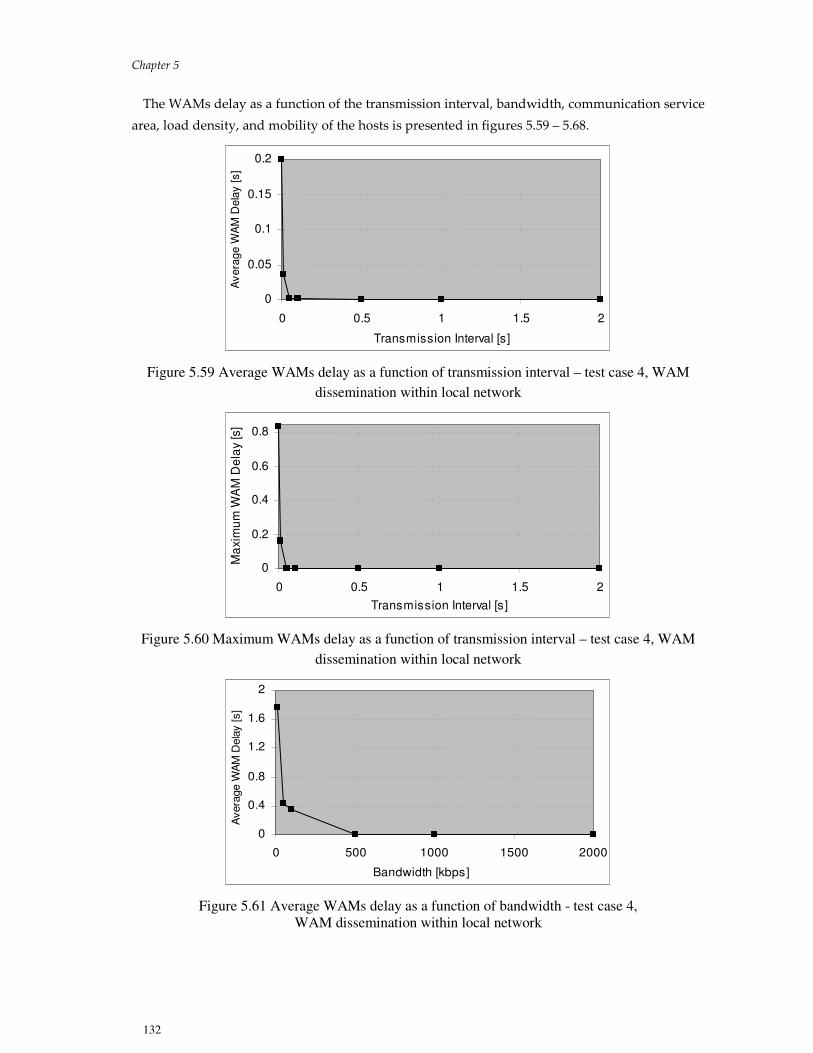
Chapter 5
132
The WAMs delay as a function of the transmission interval, bandwidth, communication service
area, load density, and mobility of the hosts is presented in figures 5.59 – 5.68.
0
0.05
0.1
0.15
0.2
0 0.5 1 1.5 2
Transmission Interval [s]
Av
era
ge W
AM
Dela
y [s]
Figure 5.59 Average WAMs delay as a function of transmission interval – test case 4, WAM
dissemination within local network
0
0.2
0.4
0.6
0.8
0 0.5 1 1.5 2
Transmission Interval [s]
Ma
xim
um
WA
M D
ela
y [s]
Figure 5.60 Maximum WAMs delay as a function of transmission interval – test case 4, WAM
dissemination within local network
0
0.4
0.8
1.2
1.6
2
0 500 1000 1500 2000
Bandwidth [kbps]
Avera
ge W
AM
Dela
y [s]
Figure 5.61 Average WAMs delay as a function of bandwidth - test case 4,
WAM dissemination within local network

Communication evaluation
133
0
2
4
6
0 500 1000 1500 2000
Bandwidth [kbps]
Maxim
um
WA
M D
ela
y [s]
Figure 5.62 Maximum WAMs delay as a function of bandwidth – test case 4, WAM
dissemination within local network
0
0.005
0.01
0.015
0.02
0.025
0.03
0 100 200 300 400 500 600
Communication Area [m]
Avera
ge W
AM
Dela
y [s]
Figure 5.63 Average WAMs delay as a function of communication service area – test case 4,
WAM dissemination within local network
0
0.02
0.04
0.06
0.08
0.1
0.12
0.14
0 100 200 300 400 500 600Communication Service Area [m]
Ma
xim
WA
M D
ela
y [s]
Figure 5.64 Maximum WAMs delay as a function of communication service area – test case 4,
WAM dissemination within local network
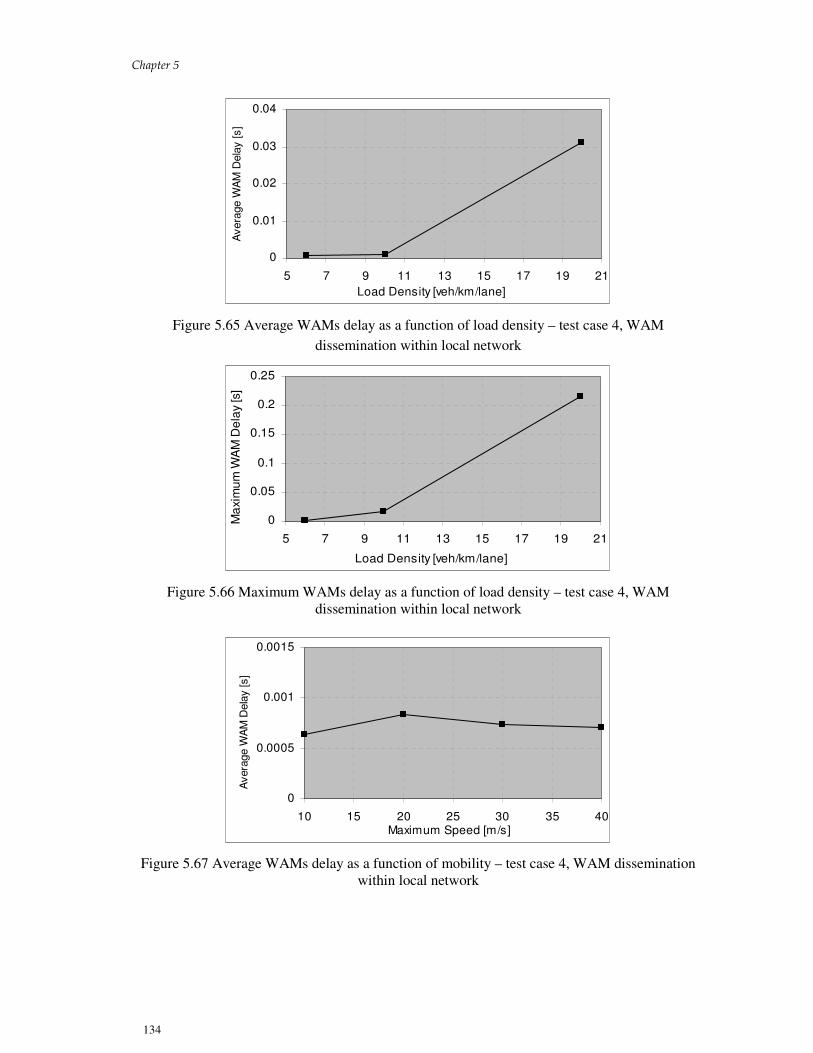
Chapter 5
134
0
0.01
0.02
0.03
0.04
5 7 9 11 13 15 17 19 21
Load Density [veh/km/lane]
Avera
ge W
AM
Dela
y [s]
Figure 5.65 Average WAMs delay as a function of load density – test case 4, WAM
dissemination within local network
0
0.05
0.1
0.15
0.2
0.25
5 7 9 11 13 15 17 19 21
Load Density [veh/km/lane]
Ma
xim
um
WA
M D
ela
y [s]
Figure 5.66 Maximum WAMs delay as a function of load density – test case 4, WAM
dissemination within local network
0
0.0005
0.001
0.0015
10 15 20 25 30 35 40Maximum Speed [m/s]
Avera
ge W
AM
Dela
y [s]
Figure 5.67 Average WAMs delay as a function of mobility – test case 4, WAM dissemination
within local network
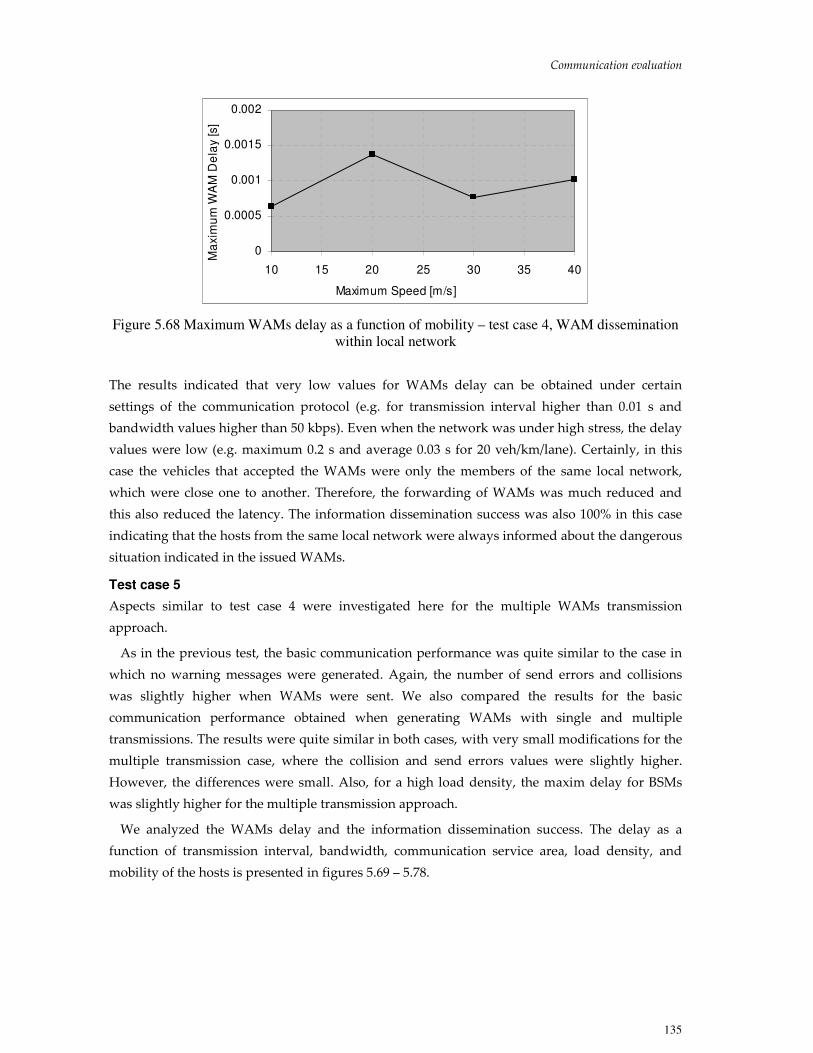
Communication evaluation
135
0
0.0005
0.001
0.0015
0.002
10 15 20 25 30 35 40
Maximum Speed [m/s]
Ma
xim
um
WA
M D
ela
y [s]
Figure 5.68 Maximum WAMs delay as a function of mobility – test case 4, WAM dissemination
within local network
The results indicated that very low values for WAMs delay can be obtained under certain
settings of the communication protocol (e.g. for transmission interval higher than 0.01 s and
bandwidth values higher than 50 kbps). Even when the network was under high stress, the delay
values were low (e.g. maximum 0.2 s and average 0.03 s for 20 veh/km/lane). Certainly, in this
case the vehicles that accepted the WAMs were only the members of the same local network,
which were close one to another. Therefore, the forwarding of WAMs was much reduced and
this also reduced the latency. The information dissemination success was also 100% in this case
indicating that the hosts from the same local network were always informed about the dangerous
situation indicated in the issued WAMs.
Test case 5
Aspects similar to test case 4 were investigated here for the multiple WAMs transmission
approach.
As in the previous test, the basic communication performance was quite similar to the case in
which no warning messages were generated. Again, the number of send errors and collisions
was slightly higher when WAMs were sent. We also compared the results for the basic
communication performance obtained when generating WAMs with single and multiple
transmissions. The results were quite similar in both cases, with very small modifications for the
multiple transmission case, where the collision and send errors values were slightly higher.
However, the differences were small. Also, for a high load density, the maxim delay for BSMs
was slightly higher for the multiple transmission approach.
We analyzed the WAMs delay and the information dissemination success. The delay as a
function of transmission interval, bandwidth, communication service area, load density, and
mobility of the hosts is presented in figures 5.69 – 5.78.
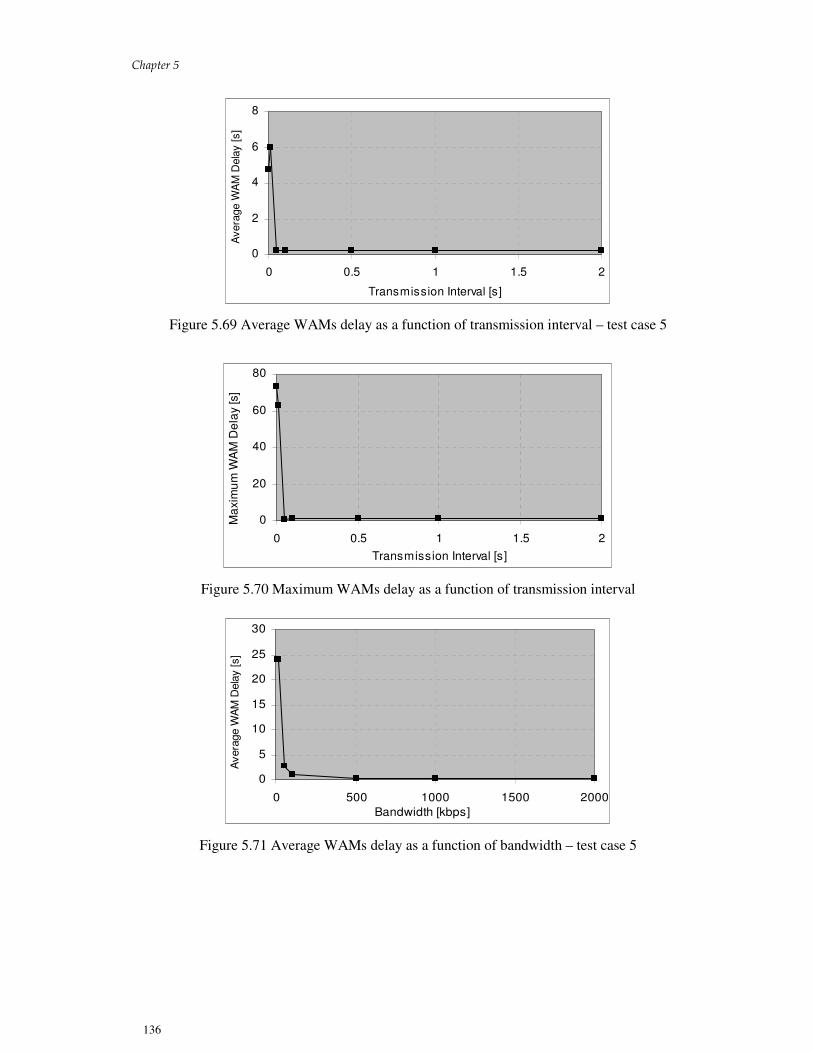
Chapter 5
136
0
2
4
6
8
0 0.5 1 1.5 2
Transmission Interval [s]
Avera
ge W
AM
Dela
y [s]
Figure 5.69 Average WAMs delay as a function of transmission interval – test case 5
0
20
40
60
80
0 0.5 1 1.5 2
Transmission Interval [s]
Ma
xim
um
WA
M D
ela
y [s]
Figure 5.70 Maximum WAMs delay as a function of transmission interval
0
5
10
15
20
25
30
0 500 1000 1500 2000
Bandwidth [kbps]
Avera
ge W
AM
Dela
y [s]
Figure 5.71 Average WAMs delay as a function of bandwidth – test case 5
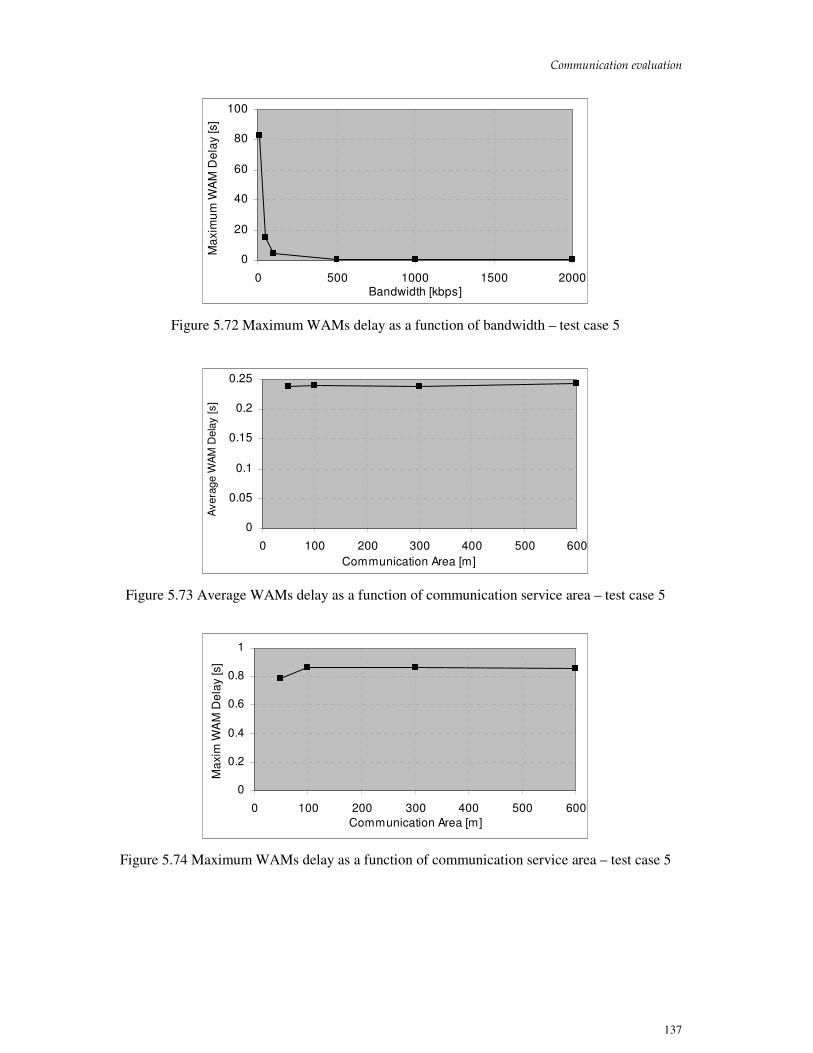
Communication evaluation
137
0
20
40
60
80
100
0 500 1000 1500 2000Bandwidth [kbps]
Ma
xim
um
WA
M D
ela
y [s]
Figure 5.72 Maximum WAMs delay as a function of bandwidth – test case 5
0
0.05
0.1
0.15
0.2
0.25
0 100 200 300 400 500 600
Communication Area [m]
Avera
ge W
AM
Dela
y [s]
Figure 5.73 Average WAMs delay as a function of communication service area – test case 5
0
0.2
0.4
0.6
0.8
1
0 100 200 300 400 500 600
Communication Area [m]
Ma
xim
WA
M D
ela
y [s]
Figure 5.74 Maximum WAMs delay as a function of communication service area – test case 5

Chapter 5
138
0
0.1
0.2
0.3
5 7 9 11 13 15 17 19 21
Load Density [veh/km/lane]
Avera
ge W
AM
Dela
y [s]
Figure 5.75 Average WAMs delay as a function of network load – test case 5
0
0.2
0.4
0.6
0.8
1
5 7 9 11 13 15 17 19 21
Load Density [veh/km/lane]
Ma
xim
um
WA
M D
ela
y [s]
Figure 5.76 Maximum WAMs delay as a function of network load – test case 5
0
0.1
0.2
0.3
10 15 20 25 30 35 40
Maximum Speed [m/s]
Avera
ge W
AM
Dela
y [s]
Figure 5.77 Average WAMs delay as a function of mobility of the hosts – test case 5

Communication evaluation
139
0
0.2
0.4
0.6
0.8
1
1.2
10 15 20 25 30 35 40Maximum Speed [m/s]
Ma
xim
um
WA
M D
ela
y [s]
Figure 5.78 Maximum WAMs delay as a function of mobility of the hosts – test case 5
As in the previous test case, as soon as the transmission interval was higher than 0.05 s and the
bandwidth higher than 100 kbps, the delay decreased significantly. The metric then stabilized,
with a maximum value of around 0.8 s, and a median value of around 0.25 s. The variation of
communication service area and hosts mobility did not significantly influence the delay values.
The delay exhibited a variation similar to the case of single WAM transmission when modifying
the load density due to similar reasons.
In summary, we obtained relatively low delay values under certain settings of the
communication protocol. Moreover, the information dissemination success was again 100%,
which indicated that this method of sending WAMs was efficient. When comparing the results
obtained for the single and multiple WAM transmission approach, the use of single messages
usually led to slightly better results, both for the basic communication performance, and for the
WAMs delay. Also, the communication performance degrades faster in the case of multiple
WAMs transmission since more (warning) messages are generated and routed.
Test case 6
In this test case, a comparison was made between the two proposed techniques for forwarding
warning messages, i.e. the random deferring approach, and the deferring approach based on the
distance to sender.
The basic communication performances were quite similar for the two approaches. However,
when investigating the WAMs delay, differences were noticed. For the initial settings of the
approach based on the distance to sender, the maximum delay was higher than when using the
random approach. We illustrate these results in figure 5.79 and 5.80 with the graphs for variation
of network load. In addition, the approach based on distance to sender led to a lower
dissemination success, i.e. 86%. This indicated that some hosts did not receive the needed
notifications. A more detailed analysis revealed than in several cases one of the WAMs was
received only by half of the vehicles that should receive it.

Chapter 5
140
0
0.2
0.4
0.6
5 7 9 11 13 15 17 19 21
Load Density [veh/km/lane]
Av
era
ge W
AM
De
lay [s]
Figure 5.79 Average WAMs delay as a function of network load – test case 6
0
0.5
1
1.5
5 7 9 11 13 15 17 19 21
Load Density [veh/km/lane]
Ma
xim
um
WA
M D
ela
y [s]
Figure 5.80 WAMs delay as a function of network load – test case 6
However, the performance of the approach using the distance to sender is highly dependant
on the parameters used for calculating the deferring time. For instance, using a setting with
Tdefer = 0.1 s and Tmax_WAM= 0.5 s led to delay values two times larger than the initial
approach. Similarly, using a setting with low deferring intervals, such as Tdefer = 0.01 s and
Tmax_WAM= 0.1 s, significantly lower values were obtained for the maximum delay. In this case
the delay values were below the values obtained using the random deferring approach. On one
hand this indicated the potential of the approach based on distance to sender. On the other hand,
no significant modifications to the information dissemination success have been obtained, which
indicated the approach to be less reliable. It seems that some of the hosts were unable to avoid
the synchronization, or the retransmission dynamic left particular hosts uninformed. Therefore,
for this approach to be successfully applied, further improvements are needed. We also note that
even the random approach may perform better when using diverse randomization parameters
(e.g.. the seed).

Communication evaluation
141
Test case 7
In this test we investigated the use of communication to avoid realistic traffic accidents. Thus, we
analyzed if the delay that can be obtained for providing specific information to vehicles can
satisfy requirements of safety applications. We also investigated if the delivering of this traffic
information can be performed in a reliable manner.
VOTS and extended VOTS scenarios
For the VOTS scenario, the WAM delay was very low and the information dissemination success
was high (i.e. 100%). Also, basic communication performance metrics such as collisions and send
errors were very low or even null. However, in this case only three vehicles traveled and
exchanged data. Therefore, the extended scenarios considered a significantly larger number of
vehicles. Even in this case the WAM delay had low values and the dissemination success was
again 100%. That means that all the vehicles in the simulation received the warning message,
including vehicles situated relatively far from the sender (e.g. at 1.6 km). Furthermore, the
performance metrics (e.g. send errors, maxim BSMs delay, collisions) indicate good
communication quality. In both cases, the latency of delivering the WAM was much lower than
the requirements (i.e. as derived using ECAM). The results related to WAM dissemination are
presented in table 5.4.
Table 5.4 Results for VOTS and extended VOTS scenarios
Metric VOTS Extended VOTS
Maximum WAM Delay [s] 0.000647252 0.178490713
Average WAM Delay [s] 0.000647192 0.083897233
Information dissemination success [%] 100 100
WAM Delay at V1 [s] 0.000647252 0.047498853
WAM Delay at V2 [s] 0.000647133 0.047498735
Basic and extended intersection scenarios
The results were also positive when testing with the basic and the extended intersection
scenarios. In the first case very low delay values were obtained and very good communication
performance was noticed. Due to the larger number of vehicles on the road, the extended case
was more relevant. Even in this case we obtained very low latency in providing the emergency
notification and good communication performance. The obtained delay values were again much
lower that the requirements. Furthermore, an information dissemination success of 100% for the
issued WAM was obtained in both cases. The results related to WAM dissemination are given in
table 5.5.
Table 5.5 Results for intersection and extended intersection scenarios
Metric Basic intersection
scenario
Extended intersection
scenario
Maximum WAM Delay [s] 0.000647059 0.000647128
Average WAM Delay [s] 0.000647059 0.000647069
Information dissemination success [%] 100 100
WAM Delay at V1 [s] 0.000647059 0.000647059

Chapter 5
142
5.8 Final remarks5.8 Final remarks5.8 Final remarks5.8 Final remarks
The results analysis indicated that when using specific settings of the communication protocol,
relatively good performance can be obtained. In addition, the communication protocol can
perform well under a wide range of conditions, such as different traffic patterns and vehicles
dynamics, varying network load, and modifications of the transmission specifics (e.g.
transmission power, fading model). Thus, with appropriate settings of the transmission interval
for basic safety messages (e.g. 0.1 seconds), of the system bandwidth (e.g. over 500 kbps), and of
the communication service area (e.g. 300 m), timely and reliable communication was possible.
The settings that we have derived also proved to be realistic considering the traffic safety
requirements (e.g. frequency of updating traffic data, service area), and the capabilities of current
communication systems (e.g. bandwidth).
The values obtained for the information filtering rate showed the benefits of using a context-
based approach when exchanging traffic information. An improvement of the bandwidth
utilization was also noticed when comparing our protocol with a flooding-oriented broadcast
protocol (i.e. as defined in [YGK03 ]) under the same conditions.
The fact that the protocol coped well with the mobility of the hosts indicated that the proposed
system can be efficiently used in areas with low and high speed regulations (e.g. on rural and
urban roads, and on highways).
Furthermore, the investigations of the system’s usability for avoiding accidents confirmed that
efficient support to safety systems can be provided by the proposed communication system.
When disseminating basic safety messages, the results indicated that the adaptive approach
was the best alternative for providing traffic information. This underlined again the value of an
approach where contextual information is used to control vehicular communication. The results
also indicated that further developments of the proposed technique, as well as the investigation
of other adaptive techniques, are of importance. With regard to the forwarding technique for
BSMs, the extended approach far outperformed the basic approach, which recommended its use
for routing. This result also indicated the advantages of using context data when performing
multi-hop communication between vehicles.
For warning messages, the results indicated that they can be successfully disseminated (in the
presence of BSMs) in large areas and with low latency. The singular WAM approach revealed
better results than the multiple WAMs approach. Still, the multiple WAMs approach obtained
relatively good results and can be successfully employed when needed. The random deferring
approach for forwarding WAMs performed better than the approach based on the distance to the
sender in terms of information dissemination success. In terms of delay, the results were highly
dependant on the settings used by both techniques and no firm conclusion could be derived.
Still, the approach based on distance has potential and further investigations are important. The
stress on the network due to warnings transmission was limited when a moderate number of
warning messages was generated. As previously mentioned, this should be the case when using
the proposed system, as many situations that may pose dangers should be determined using the
information included in BSMs and should not require the sending of WAMs.

Communication evaluation
143
In summary, the results indicated that the proposed communication system is able to provide a
high level of support to in-vehicle safety systems. Certainly, improvements to the current version
of the system are important, and are part of future work. Such improvements range from
improvements of the currently proposed communication and networking techniques to
structural modifications. An example of basic improvements is the better encoding of messages
to reduce their size and consequently to reduce the load on the communication channel. Another
example is the use of alternatives settings for adaptive BSMs dissemination and randomizers that
can improve the communication performance. Examples of structural modifications are the use
of a more efficient MAC scheme, which would definitely improve the performance, the definition
of specializations of the rules employed for information filtering and forwarding, and the
development of new adaptive techniques for message dissemination.


145
6. Related work
Research in vehicular communication can be broadly categorized into three areas: information
dissemination, network organization, and MAC techniques. In this chapter we provide an
overview of related work in these areas.
6.1 Traffic information dissemination6.1 Traffic information dissemination6.1 Traffic information dissemination6.1 Traffic information dissemination
The network that we propose for organizing the vehicles is fundamentally an ad-hoc network.
For disseminating messages in this type of network, extensive efforts have been focused on
routing protocols. First we discuss the applicability of such protocols to safety vehicular
communication. Further on, we focus on related vehicular communication protocols, which
propose specific techniques for data transmission and forwarding between moving vehicles.
Routing in ad-hoc networks and vehicular communication
For forwarding information in ad-hoc networks, both table-driven and on-demand driven
protocols have been proposed [RT99].
Examples of table-driven protocols are the Wireless Routing Protocol (WRP) [MG96], and the
Destination-Sequenced Distance-Vector protocol (DSDV) [PB94]. These protocols require a host
to maintain consistent or up-to-date routing information describing how packets sent by it can
reach other hosts in the network. To achieve this, each host maintains routing tables that reflect
the host’s view of the network. Each host is responsible for notifying the other hosts when a
modification of its view occurs, so as to maintain consistency throughout the network.
Examples of on-demand protocols are the Ad-hoc On-demand Distance Vector routing
protocol (AODV) [PR99a], the Dynamic Source Routing protocol (DSR) [JM96], and the
Temporally Ordered Routing Algorithm (TORA) [PC97]). These protocols create routes only
when the sending host needs to transmit data to another host. The establishment of a route is
done using route discovery mechanisms that are usually specific to the protocol. Such a route is
then maintained until the destination is no longer reachable, or until the route is not needed
anymore. A number of variations and extensions of these protocols, which implement various
methods for maintaining multiple routes or diverse procedures for route reconstruction and
route failure, have been also proposed (e.g. [PR99a, NCD01]).
An important feature of several routing protocols for ad-hoc networks is the use of geographic
information (e.g. the location of hosts) for increasing the efficiency of data dissemination
[MWH01]. An example is the Location-Aided Routing (LAR) protocol where the destination of a
data packet is determined using a combination of the identifier of the destination host and an
estimate of the position of this host. The estimate of the host position is based on information
about its previous location and previous movement characteristics (e.g. velocity) [KV00]. A host
receiving a packet forwards it based on a comparison between its own position and an estimation
of the destination host location.
One issue that hinders the applicability of the above-mentioned protocols to vehicular
communication is the anonymity of the hosts. In traffic safety applications a vehicle needs to

Chapter 6
146
receive information from a number of vehicles in its proximity rather than receiving data from a
specific vehicle. Since it is not feasible for a vehicle to maintain the identities of all other vehicles
that may receive its data, there is an advantage in not requiring a sender to know the addresses
of the receiving vehicles. Certainly, it is possible to provide a host with the identities of other
hosts (e.g. in its vicinity) by sending dedicated packets. However, this leads to an overload of
communication due to the transmission and forwarding of a large number of packets. It also
introduces latency in providing the needed safety data to vehicles. Therefore, routing protocols
that require the sender to know the identity of the receiver(s) do not work well for safety
vehicular communication.
The vehicular environment is very dynamic as vehicles frequently change their driving
orientation and randomly exit and join the roads. Consequently, the vehicular network can often
be fragmented. Therefore, the maintenance of a consistent view of the network as required by
proactive protocols would be extremely difficult. It would also lead to communication overload
and to high delays in data provision since it would be necessary to perform a large number of
route updates. The dynamics of vehicular traffic may also hinder the use of protocols that require
position estimation when forwarding data, since these estimations can be inaccurate.
We also note that many of the previously proposed routing protocols for ad-hoc networks do
not perform well even for non-safety traffic services, such as Internet browsing and low-rate
video chat [Wan04a, Wan04b]. Consequently, new routing protocols that are adapted to the
traffic environment demands and are focused on supporting infotainment applications have
recently been proposed (e.g. [SES+04], [WLH+05]).
Dedicated protocols for vehicular communication
Most of the dedicated protocols proposed for implementing vehicular communication rely on
broadcast or directed broadcast for generating messages, and then propose schemes for
forwarding these messages among vehicles. Many of these protocols take a reactive approach,
and focus on dissemination of notifications about hazards in traffic. In the following, we survey
several previous proposals for vehicular protocols.
The communication system presented in [BSH00] and [BH00] was designed to implement a
traffic jam notification service on highways. It is based on an ad-hoc distributed communication
protocol [BH00], which resides on top of a group membership service [BH02]. When a traffic jam
is detected, a virtual group is formed by the vehicles driving in the same direction that slow
down significantly. Thus, once a vehicle reduces its speed beyond a predefined threshold, it
starts communicating with nearby vehicles by sending messages indicating the existence of a
traffic jam. The vehicles receiving such a message wait for a certain time interval, which is
dependent on the distance to the sender, and then forward the received message. Each message
has a maximum number of hops over which it can be transmitted. The system also determines
the size of the traffic jam based on the positions of the vehicles situated at its borders.
The VIBROR system described in [MKO00] and [FMO01] implements a multi-hop transmission
scheme for broadcasting traffic information among vehicles. The proposed protocol reduces the
retransmission of packets in comparison to flooding-alike protocols, and is based on three main

Related work
147
concepts: packet structure, buffering management, and packet construction management. The
traffic data is embedded in fixed-size packets and each packet is divided into sub-packets. When
a packet is received by a vehicle, all the sub-packets contained in it are stored in a receiving
buffer. When a host sends a new packet, this is constructed from a sub-packet containing its own
data and other sub-packets containing data describing other hosts. The system assigns priorities
to the packets stored in the receiving buffer based on diverse methods, such as the combination
of the number of hops and the number of times a packet was retransmitted. When a host
constructs and sends a new packet, only the sub-packets with priority higher than a given
threshold are included in the sent packet.
The work described in [SFL+00] presents a protocol for highways that implements specific
broadcasting techniques. This system takes into consideration the position of the communicating
vehicles when forwarding messages. Two approaches are presented by the authors, the Tracking
Detection protocol (TRADE), which performs a classification of vehicles based on their relative
positions, and the Distance Defer Transfer protocol (DDT), which uses a deferring technique
where forwarding of messages is based on the relative distance between the sender and the
receiver. The TRADE protocol assumes the vehicles to have previous knowledge of the positions
of neighboring vehicles, and performs a selection of particular vehicles for retransmitting
messages. When a vehicle has some traffic data to send, it issues a message where it indicates
two vehicles that should retransmit this message. These special vehicles are the vehicles situated
farthest behind and farthest ahead of the sending vehicle, and previously classified by the sender
as traveling on the same road. The process then continues at the receiving vehicles. The
transmission of messages is controlled by time-to-live (TTL) counters. The second proposed
protocol, i.e. DDT, uses a time-based method for forwarding data and does not require the
positions of the neighboring vehicles to be previously available. When a vehicle issues a message,
this will also contain its position. Each vehicle that receives such a message computes a deferring
time inversely proportional to the distance to the sender. After this time has passed, the receivers
assess whether most of their transmission area has been covered by transmissions from
neighboring vehicles. If this is the case, they do not retransmit the message. Otherwise, the
message is rebroadcast. Similar to the previous protocol, TTL is used for controlling the
dissemination area.
A number of vehicular communication protocols using geographic forwarding have also been
proposed (e.g. [HBE+01, KSA02, CR03, LHT+03, FMH+03]). The techniques employed for multi-
hop communication in these proposals are based on a mapping between the position of the hosts
in the network and a database that maps the identities of these hosts to certain locations. To
perform such mapping, the main approach is to use digital maps installed in vehicles [LHT+03].
Current problems related to this approach are the difficulty of updating the maps and the
possible high cost. Another possibility is to deploy distributed databases within the network
[LJC+00]. In this case, when a vehicle needs to send some data, it first sends a query throughout
the network to determine the location of the destination. If the destination is found, the data
together with an indication of the destination location is sent out through the network. However,
for this approach problems related to the maintenance of location servers in the network must be

Chapter 6
148
solved [MJK+00]. For all protocols using geographic routing, the vehicles need to know the
identities of their one-hop neighbors. When a message containing traffic data is sent by a vehicle
to a destination, it is gradually routed through the network, starting with the sender’s immediate
neighbors and continuing with their neighbors, and so on. These neighboring vehicles forward
data using geographic constraints. For example, a simple decision scheme is to send data to the
vehicle that is closest to the destination (i.e. greedy position-based routing). If such a vehicle is
not found, other strategies for routing, such as the perimeter mode (i.e. delivery of data within an
area as in Greedy Perimeter Stateless Routing [KK00]), can be used. Systems implementing
vehicular communication using geographic routing are usually intended to provide safety and
non-safety traffic applications (e.g. The Fleetnet Project [HBE+01, LHT+03]). Therefore, they
usually focus on data dissemination in a large area, where they propose solutions for broadcast,
multicast and unicast communication.
The protocol that we present in this thesis uses scoped broadcast and proposes methods for
forwarding messages containing traffic safety data. The exchanged data can be used to
implement a plethora of safety applications on any type of road. Many of the previously
proposed protocols require the use of heartbeat messages. We extend the use of such messages
by integrating specific traffic information into regularly transmitted basic safety messages. This
data is used by vehicles for organizing the network into virtual clusters (i.e. local networks), and
by in-vehicle safety systems for detecting hazards in traffic. Our protocol is a hybrid, providing
both proactive and reactive operations. For disseminating information, we use geographic
constraints, and employ a context-based approach for deciding whether to accept and forward
data. Since safety is our main concern, short-area communication is employed. An appropriate
size for this area is determined based both on safety applications’ needs and communication
performance. Further on, we acknowledge the importance of disseminating specific notifications
about emergency situations in large areas, and provide for this possibility in our proposal.
Priority schemes such as the scheme proposed in VIBROR are less appealing for our case due to
vehicle grouping, and due to the small message size we need to impose on BSMs so as not to
overload the communication. Also, a forwarding scheme for BSMs based on distance to sender,
such as the one used in TRADE, did not fit our protocol well due to the organization of the
vehicles into local networks, where the members aim at having information about one another.
Further on, the method employed by DDT, i.e. refraining from retransmission based on analysis
of retransmissions from neighboring vehicles, can leave vehicles uninformed [Brie01]. Selective
retransmission of warnings with regard to the distance to the sender is appealing for faster
dissemination of emergency notifications in large areas. We investigate such technique in our
protocol when disseminating WAMs. However, though promising, the technique was not
reliable enough. The use of digital maps would certainly contribute to the development of
advanced traffic services, and would help us to apply high-precision algorithms for filtering
information. However, since such systems may not be available on such a large scale in the near
future due to cost issues, we also provided alternatives methods by specifying algorithms that
use only the position and movement data of vehicles as input parameters.

Related work
149
6.2 Network organization6.2 Network organization6.2 Network organization6.2 Network organization
Until recently, there has been little focus on developing procedures for organizing vehicular
networks. However, techniques for managing vehicles are essential in order to obtain scalable
and reliable communication, and we envision that the field will develop significantly in the
future. In this area work has mostly been done on group management for vehicles. Thus, in
[BH00] a group management service for sustaining communication in case of traffic jam
notifications is proposed. This service performs and maintains the aggregation of vehicles into
neighboring groups based on information included in small messages that are regularly sent by
vehicles (i.e. Hello messages). These messages contain the identity of a vehicle and its position,
and the vehicle grouping is used to control the dissemination of a notification about a traffic jam
through the network. Reference [MKC+01] introduces a general framework for proximity group
communication, where mobile communicating hosts in an area are grouped according to their
position and functional aspects. Possible traffic applications that are mentioned are grouping
vehicles that approach a traffic light, and grouping vehicles that should give right of way when
an ambulance is approaching. However, the work presents only the general idea and does not
provide details on how to implement these services. The work in [CC05] proposes an
organization of the vehicular networks into groups using two methods: stationary and dynamic.
The stationary approach considers the roads to be previously divided in fixed areas. When
vehicles enter these areas, they belong to the group associated with the area. The dynamic
approach proposes vehicle grouping based on radio coverage. Vehicles that are in each other’s
transmission range form a group. Improvements to this simple approach are grouping close
vehicles into cells and grouping vehicles in a vector on the basis of distance to sender.
Our work can be also categorized as belonging to the group membership area. The vehicles are
grouped into local networks according to their current interest in traffic safety. The information
needed for organizing the network is provided regularly, and we make use of position data and
other contextual information when defining the network organization and management. The
vehicles are then able to dynamically organize the network, which allows support for various
traffic safety applications. Using fixed clusters is an appealing alternative to dynamic
networking. However, this would require some authority to do extensive work on all roads, as
such clusters would need to be defined everywhere there is traffic, and their definition would
need to take into consideration a variety of aspects such as the road type, the driving conditions
and the communication properties (e.g. range). These clusters would need to be updated at
certain intervals, as the traffic conditions can change over time (e.g. weather – dense fog in
certain periods). Additionally, the vehicles would need to be aware of all existing clusters as they
might travel in large areas (e.g. different countries). Even if fixed clusters are defined, there is no
guarantee that the vehicles in the group associated with a cluster will be able to communicate
with each other. Therefore, even in this case some technique for information forwarding must be
developed. Considering these issues, we employed only a pseudo-static formation of clusters by
the fixed hosts. As also mentioned by the authors, our work can be considered complementary to
the work in [CC05] for the dynamic approach, as our local networks can be built on top of the

Chapter 6
150
dynamically formed groups in [CC05]. We note that the networking technique that we propose
did not need such previous grouping of vehicles, but it can make use of it if it exists.
6.3 MAC schemes for vehicular communication 6.3 MAC schemes for vehicular communication 6.3 MAC schemes for vehicular communication 6.3 MAC schemes for vehicular communication
Efficient MAC schemes are essential for developing high-performance communication for
vehicles. This area has recently received a great deal of attention.
Investigations of classic MAC schemes for vehicular use have been conducted, and extensions
to them have been proposed. For example, [WH98b] proposed a CDMA scheme where the
channel access is controlled using the relative location of vehicles, which is supplied by magnetic
sensors installed on roads. In a number of other works, e.g. [Ver97, TAF00, KTT+02, FH02b] or
[SON+02], assessments of the applicability of schemes such as p-persistent and non-persistent
CSMA, ALOHA and R-ALOHA to inter-vehicle communication have been made.
In [YRM05] two extensions to CSMA were proposed for controlling the dissemination of
warning messages. The first scheme uses backoff time spacing for differentiating messages with
different priorities (e.g. messages from closer vehicles have high priority, and messages from
distant vehicles have low priority). The second scheme implements a polling mechanism, where
the receiving vehicle polls only vehicles that are waiting to send messages indicated dangerous
situations. These vehicles are polled only if they are located within a certain distance from the
receiver. The polling operation is done by sending an out-of-band tone on a dedicated channel.
Dedicated MAC schemes for vehicular communication have also been developed. Schemes
using slot reservation mechanisms for UTRA-TDD were proposed in the Fleetnet project
[LHS+00] and the CarTalk2000 project [BCC+03]. Position-based schemes, where medium access
is coordinated using the location of the vehicles, were also investigated (e.g. [NH00+, BV01,
KMR+03]). These schemes require the division of the geographic area into cells that have
associated dedicated communication channels. The vehicles that enter a cell can then
communicate only on the associated channel(s). We note that the idea is similar to the network
organization using fixed clusters and therefore suffers from similar drawbacks.
The IEEE 802.11a MAC scheme is currently the de facto scheme for the Direct Short Range
Communication (DSRC) standard [BTD06], which provides support for road-to-vehicle
communication and for one-hop vehicle-to-vehicle communication. However, this scheme seems
to provide moderate quality for implementing certain safety applications such as collision
avoidance (e.g. [YEH+04]), and it is expected that improved schemes will be produced [CC05]. A
comprehensive analysis of the drawbacks of IEEE 802.11-based schemes and potential
improvements was given in [ZR03].
In our work we used one of the basic schemes (i.e. non-persistent CSMA) proposed for inter-
vehicle communication when performing the evaluation. However, the results clearly indicated
that this scheme could not assure high-quality communication, and the use of more efficient
schemes needs to be further investigated.

Related work
151
6.4 Direct Short Range Communica6.4 Direct Short Range Communica6.4 Direct Short Range Communica6.4 Direct Short Range Communication (DSRC) tion (DSRC) tion (DSRC) tion (DSRC)
Dedicated Short Range Communication (DSRC) is a suite of specifications initially proposed for
vehicle-to-road communication, and recently extended for vehicle-to-vehicle communication
[AST03]. DSRC specifies the MAC layer, the link layer and the radio layer for vehicular
communication systems. The basic standard specifies three types of channels: for vehicle-to-
vehicle communication, for road-to-vehicle services, and for (communication) control. The North
American DSRC program proposed a large variety of applications that can be supported by
DSRC [ZR03]. These are both safety applications and non-safety applications such as traveler
information and rich media content delivery.
However, DSRC does not address multihop communication or network management [CC05].
Our system is complementary to DSRC and can be implemented using the specified DSRC
components. The context-based protocol that we have proposed provides multihop
communication and may be used for augmenting DSRC functionality when implementing safety
applications. Furthermore, the organization of vehicles into local networks can help to improve
communication performance (e.g. by controlling dissemination area), and can ease operations
such as unicast and multicast as the local network’s members have data about each other. The
proposed communication system also integrates road-to-vehicle communication and may be
extended to accommodate services proposed to make use of DSRC.
152
7. Concluding remarks
This chapter presents final remarks on the work in this thesis. Future research directions are also
discussed.
7.1 Final remarks7.1 Final remarks7.1 Final remarks7.1 Final remarks
High casualty rates and extensive property damage make traffic safety a critical problem for
society. The importance of this problem has sparked research into developing systems that could
help reduce the severity of crashes, or even completely avoid collisions between vehicles.
However, although important improvements in traffic safety have recently been achieved, the
number of collisions with severe consequences is still unacceptably high. Therefore, safety
systems that can provide better service to the driver must be developed. Safety vehicular
communication is a promising technology for supporting active safety systems. This technology
allows the collection of data that cannot be acquired using other technologies proposed for safety
systems. It extends the perception of the vehicles, and allows them to correctly identify dangers
in complex traffic situations.
Designing the support system for active safety systems is challenging due to multiple factors
that must be considered. In this work we aimed at providing a generic method that helps the
designer focus on important design aspects, leading to a detailed system design. The risk of
overlooking certain key factors, such as accident development, is that the resulting solution may
not be applicable in various traffic situations. We refer to [YLZ+04] for a system that can provide
an efficient dissemination of emergency notifications in case of rear-end accidents. However, the
system cannot be successfully applied to intersection collisions. The design method that we
propose is certainly general and can be further specified. However, the current results of
analyses, as well as the analysis tools (e.g. ECAM) can be useful in developing other support
systems and extending the currently proposed system. They can also be useful in investigating
other aspects related to traffic. For instance, we employed ECAM for analyzing the possibility of
avoiding intersection accidents that involve drivers of a specific type, namely elderly drivers
[SCA+04, SCA06]. In this thesis we illustrate a specification of the general design method with
analyses of the communication as the enabling technology for active safety systems. We define
properties of the traffic environment in order to derive requirements for communication systems
that provide support to exchange of safety data among vehicles. We also study the operation
mode of active safety systems and analyze accident scenarios in order to identify specific
requirements that apply to safety communication. When analyzing accident scenarios, we also
investigate the limitations of safety systems based on communication. For instance, inter-vehicle
communication may be less effective in lane departure accidents. We note that the same
limitations apply for radar, but not for vision as the enabling technologies. Therefore, the ideal
safety system would augment communication-based mechanisms with other technologies.
Active safety systems that integrate several enabling technologies can be highly effective.
Chapter 7
153
Several communication approaches can be applied for disseminating data among vehicles in
traffic. We analyzed various approaches in order to estimate the level of support each could
provide to safety communication. We also conducted a deeper investigation of the design
components of the communication system, which resulted in specific features that we integrate
in our proposal.
Besides fulfilling strict requirements of safety applications such as collision warning, the
communication system needs to fulfill requirements imposed by the particular properties of the
vehicular environment. In this work, we advocate the use of these unique properties for building
systems that are adaptable to the traffic situation. Two techniques were used to achieve this
behavior in the communication system. First, we propose a method of organizing the vehicular
network by the use of contextual information. Using this method, the vehicles form and maintain
virtual clusters according to their current interest in traffic. This allows the vehicles to be able to
constantly organize a network that reflects their needs. Second, we develop a context-based
protocol for disseminating safety information to vehicles. An anonymous scoped broadcast
protocol is used for delivering specific messages, since the destinations of these messages may
not be known to the senders. The receivers then need to identify the messages that contain data
of interest. To achieve this, they apply a context-based information filter. We propose here a
filtering mechanism based on rules derived from accident situations and guidelines for active
safety systems. A set of rules was used as a proof of concept within a prototype implementation
of the communication system.
Our protocol mainly takes a proactive approach, where vehicles are regularly provided with
safety information. We argue for the effectiveness of this approach in improving traffic safety,
since in this case the safety system is able to identify possible dangers well in advance and
efficiently act towards avoiding them. Two basic methods can be taken for data delivery in
proactive protocols, the fixed rate approach and the adaptive rate approach. We investigate the
performance provided by each, and provide an example of the adaptive rate approach with an
adaptation mechanism based on the velocity of the vehicles. We also investigate different
methods for forwarding information. We subsequently propose a basic routing method based on
the distance to the sender, and then extend it to improve the communication performance.
Similarly to the information filtering, the routing techniques use context information.
Further on, we enhance the communication protocol with a reactive operation mode because
there are situations when traffic safety can benefit from the issuance of specific notifications to
warn vehicles in traffic. Also in this case, we investigate different methods for generating and
forwarding warnings.
For implementing the communication protocol and integrating it within a vehicle, we propose
a vehicular communication platform.
The traffic environment is complex and contains situations that can put very different
demands on communication. Therefore, we investigate the performance of the proposed
communication system under various conditions. We also investigate the system applicability in
helping to avoid specific accidents. A GloMoSim-based simulation system was used for

Concluding remarks
154
performing the simulations. Realistic traffic traces were generated by traffic simulators that we
have developed. We evaluate system performance using delay, packet collisions, send errors, and
dissemination success for warning messages. We also investigate the efficiency of the
information filtering and specific settings of the communication system. We then assess if the
settings that are appropriate for obtaining high-quality communication are realistic by
comparing them against safety applications’ demands and the capabilities of current
communication systems. The results indicate the adaptive approach employed for the proactive
operation mode as most suitable for delivering safety data. They also indicate that forwarding
and filtering of information are essential in obtaining good performance. For instance, the use of
a basic routing protocol resulted in a system with marginal performance for the maximum
latency, which may be difficult to use for informing particular vehicles in time. When the routing
mechanism was extended with a technique similar to message filtering, the system performance
was dramatically improved. For the retransmission of warning messages, the experiments
showed potential for an approach based on the distance to sender, but also revealed that such
techniques might not provide the needed level of reliability. Thus, when we applied a deferring
technique based on distance to sender, it was possible to obtain low delays for delivering
warning messages under specific settings, but some of the vehicles in need did not receive these
notifications. This indicated that improvements are needed for such techniques to function
satisfactorily. A simpler approach using a flooding-oriented technique for retransmitting
warning messages led to better results. These results also indicated that vehicular
communication based on contextual information needs to be carefully designed in order to
represent the traffic characteristics. The filtering of information was significant in all cases, which
indicated that important improvements in information management, i.e. elimination of useless
and misleading data, can be obtained when using contextual information for management of the
communication. The communication performance degrades with the network load, which
indicates the need for more efficient MAC schemes and the importance of further investigation of
transmission and forwarding techniques. We recall that the MAC scheme that we have employed
was previously proposed for vehicular communication. However, the evaluation results
indicated this MAC scheme to be able to provide only moderate quality.
To summarize, safety communication is an essential part of future active safety systems. In
this thesis we propose a method for designing communication and networking techniques for
use in safety vehicular communication. These techniques make use of contextual information for
controlling the communication between vehicles in traffic, which improves the management of
information and results in good communication performance. Thus, timely and reliable
provision of safety data to vehicles can be realized using the proposed communication system.

Chapter 7
155
7.2 Future7.2 Future7.2 Future7.2 Future work work work work
Many aspects of the work presented in this thesis can be extended. Several directions are
presented in the following.
Communication and networking
Medium Access Control
Investigation of more efficient MAC schemes for data exchange in the vehicular environment is
important. Research can also go deeper into this area with the goal of proposing new access
schemes. This is because even the scheme proposed for DSRC is considered only as a provisory
solution [CC05], as it cannot provide the needed level of quality. The performance study on
DSRC in reference [YEY+04] showed that this scheme may achieve low latency for one-hop
communication, but cannot currently fulfill reliability requirements, as a large number of
neighboring vehicles (i.e. more than 40%) may remained uninformed due to information loss.
Information Dissemination
Improved versions of the techniques for transmitting and forwarding data are also important
subjects for further investigation. We have shown that adaptive transmission of BSMs and
efficient routing can have a significant impact on the communication performance. The
adaptation method proposed here can be considered as generic, and further specializations can
be developed. Moreover, schemes that adapt the transmission rate with regard to the road the
vehicles travel on, or with regard to more specific traffic situations should also be investigated.
For instance, for vehicles traveling on divided highways, a combination of the driving
orientation, the number of vehicles in a local network, and the relative distance between vehicles
can be used. Thus, if a vehicle traveling in one direction has only distant neighbors, i.e. neighbors
situated at the border of the communication service area, the transmission rate can be reduced.
Forwarding of information in case of low penetration rate of the system also needs to be
investigated. This is to assess whether or not the protocol can work efficiently in this case and to
identify eventual extensions.
Information Filtering
Information filtering remains an open issue. In this work we have given examples of the
advantages of using contextual information for controlling the communication and we defined
and used a set of rules for filtering received data. However, this is a proof-of-concept and even if
these rules generally apply for most traffic situations, it is important that further investigations of
rules be performed. Aspects such as position inaccuracies, vehicles traveling on parallel roads,
and amount of vehicles that can be considered dangerous should be studied in more depth.
Network organization
Since network organization considerably influences the system performance, it is of interest to
explore alternatives. It would also be interesting to investigate how the network organization
could help to improve the communication performance by performing certain operations such as
controlling access priorities. Also of interest is to investigate how the network organization can

Concluding remarks
156
support the deployment of diverse traffic applications, such as applications that make use of
multicast and unicast communication.
Testing and implementation
The improvements in traffic safety for different deployment rates of the communication system
are of interest for investigation. Certainly, in this case the initial assumptions regarding the
operation of the safety system and the driver interaction with the system will influence the
results. Still, using relevant research results in traffic safety it should be possible to estimate the
level of improvement.
A prototype of the current version of the communication system or an improved future version
using on-market devices is planned for development. By employing field tests, more information
can be gathered about the performance of the system in real operations. However, this may
require the use of devices that do not really satisfy quality requirements imposed by the
vehicular environment. This is because such devices may not be available. For example, DSRC
devices are not currently on the market and WLAN cards, which are most likely to be employed
in field tests, usually provide low quality when used for inter-vehicle communication [CC05]. We
also note that a large number of vehicles would be needed for performing a realistic assessment
of the feasibility and reliability of the proposed communication system. This is because testing
with two or three vehicles, like in previous studies [e.g. [SBS+02, KKR+04, CC05]) can only
provide indications of data delivery latency, packet collisions or throughput. However, such tests
address a specific situation where interference will most probably be low. Also, indications about
the efficiency of the information filtering and the impact of the network organization on the
communication performance can be obtained only when testing with a larger number of vehicles.
The implementation of the proposed communication and networking techniques using DSRC
components would also be worthwhile to investigate in more detail.
Other directions
The protocol that we propose is directed toward safety applications. However, we envision the
possible use of the basic concepts for providing other types of vehicular communication such as
infotainment. To enhance the protocol with such functionality, new techniques for sending and
forwarding data need to be developed. Provision of different traffic services using inter-vehicle
communication is of interest to the community, and relevant research has already been
performed in this direction (e.g. [Wan04b, WLH+05]).
Another possible direction addresses the modeling of accidents and the derivation of
requirements on the support system for active safety systems using temporal logic. We see here a
need for extending the ECAM reasoning system with more advanced models of vehicle
dynamics, driver behavior and safety systems operation modes. The definition of a set of fluents
and events that generally apply to a large variety of traffic scenarios is also of interest. By using
such a set, a standard framework for analyzing accidents and deriving requirements for
supporting technologies for safety systems can be provided. We also see the possibility of
investigating the use of the ECAM system for predicting the occurrence of accidents.

Chapter 7
157
Security and privacy are issues of concern in vehicular networks and we have identified
various security requirements. However, we focus rather on the functionality of the
communication protocol in this thesis, and security remains an open issue.


159
Appendix A: Algorithms for derived
parameters
The decision mechanisms that implement the information filtering make use of primary and
derived parameters. The derived parameters are determined using primary parameters that were
previously extracted from received basic safety messages or were provided by systems located
on a subject host. In Chapter 4 we introduced the algorithms for determining the derived
parameters. This appendix gives details on these methods.
A1. Membership of two hosts to the same road
Let us consider two hosts, H1 and H2, which travel on a road as presented in figure A1.1. The
gray vehicles in the figure represent the current position of the hosts and the white vehicles with
dotted lines represent the previous positions of the hosts. The dotted arrows indicate the
movement of the vehicles between the two points in time.
We use a bidimensional representation (X and Y) of the movement vectors of the hosts. The angle
α between the movement vectors of the considered hosts can be calculated as:
1* 2arccos
| 2 || 1 |
V V
V V
α =
where 12 11
12 11
1x x
Vy y
− = −
and 22 21
22 21
2x x
Vy y
− = −
.
In the previous equation, |X| represents the module of vector X and we have used “*” to
indicate the dot product of two vectors. We used the classical equation for Euclidean distance
when calculating the module of a movement vector based on two successive position indications.
Thus:
2 2
12 11 12 11| 1| ( ) ( )V x x y y= − + − and 2 2
22 21 22 21| 2 | ( ) ( )V x x y y= − + −
Furthermore, the dot product of the movement vectors is calculated as:
12 11 22 21 12 11 22 211* 2 ( ) * ( ) ( ) * ( )V V x x x x y y y y= − − + − −
The angle α in the above equation is calculated in radians and needs to be translated in degrees.
Thus, α [degree] = α [rad] *180/π. If α is close to 0 or 180 degrees, then the hosts H1 and H2 are
considered to be on the same road. Otherwise, they are considered to travel on different roads.
We have considered 10 degrees as the maximum deviation (from 0 or 180 degrees).
Figure A1.1
H1 at P10(x11, y11)
Y
X
H1 at P11(x12, y12)
H2 at P20(x21, y21)
H2 at P21(x22, y22)
∝∝∝∝
V1 projected
V2
V1

160
A2. Relative positioning of two vehicle hosts
The relative positioning of two vehicle hosts indicates if one of the hosts is ahead of or behind the
other. This parameter is evaluated when the hosts are traveling with opposite headings. An
example is illustrated in figure A1.2, where two hosts H1 and H2 are represented at two
successive moments in time.
The gray vehicles represent the current position of the hosts and the white vehicles represent the
initial position. The dotted arrows indicate the movement of the vehicles. We also used a
bidimensional representation (i.e. X and Y) of the movement vectors. The angle β indicated in the
figure was evaluated as follows.
* 1cos
| || 1 |
AuxV V
AuxV Vβ = , where 12 11
12 11
1x x
Vy y
− = −
and 22 12
22 12
x xAuxV
y y
− = −
The angle β is then translated in degree and is compared with a threshold value of 90 degree. If β
is lower than this threshold, the host H2 is considered to be ahead of host H1. Otherwise it is
situated behind H1.
A3. Detection of route contention at an intersection
Route contention indicates the possibility that two vehicles will meet at an intersection. We
considered two vehicle hosts H1 and H2 that travel on different roads as presented in figure A
1.4. We estimated if these vehicles might meet using their positions (e.g. P21 and P11), their
orientations with regard to the horizontal axis (i.e. angles θ1 and θ2), and their velocities (i.e.
VH2 and VH1). We note int 22
int 22
tany y
x x2
−λ = θ2 =
− and int 12
int 12
tany y
x x1
−λ = θ1 =
−
If λ1= λ2 then H1 travels on a path parallel with H2 and they cannot meet at any time point. If
λ1≠ λ2 then:
int 12 1 int 1 12y y x xλ λ− = −
int 22 2 int 2 22y y x xλ λ− = −
Figure A1.2
H1 at P10(x11, y11)
Y
X
H1 at P11(x12, y12)
H2 at P20(x21, y21)
H2 at P21(x22, y22)
ββββ AuxV V1 projected

161
Thus, the estimated coordinates of the possible intersection point are:
[ ]int 1 12 2 22 22 12
1 2
1( )x x x y yλ λ
λ λ= − + −
−
and
[ ]int 1 2 12 22 1 22 2 12
1 2
1( ) )y x x y yλ λ λ λ
λ λ= − + −
−
The vehicles can meet at the intersection point PINT only when they approach this point. This is
the case if the following conditions hold at the same time:
[C1] int 12
12 11
0x x
x x
−>
− and [C2] int 22
22 21
0x x
x x
−>
−
The vehicles can meet at the intersection point only if they reach it at approximately the same
time. The distances to the predicted intersection point for H1 and H2 are calculated as follows: 1/ 2
2 2
11 int 12 int 12( ) ( )INTP P x x y y = − + −
1/ 22 2
21 int 22 int 22( ) ( )INTP P x x y y = − + −
The estimated times t1 and t2 when H1 and H2 are supposed to reach the intersection point are:
111
1
INTP Pt
VH= and 21
22
INTP Pt
VH=
However, the vehicles have a certain length and can collide when both of them arrive at the same
moment at the intersection point, or when one arrives at the intersection point and the other is
passing through it. Therefore, we introduced a time interval when the vehicles might meet at the
intersection. We call this interval Intersection_time_threshold and use this approximation when
comparing the time moments t1 and t2. Thus, the vehicles are considered in danger of meeting at
an intersection when |t1-t2|≤ Intersection_time_threshold
To specify a value for the Intersection_time_threshold we consider the usual length of a vehicle
to be between Lmin = 3 meters and Lmax = 7 meters. We also consider a minimum speed value of
Vmin = 8 km/h (e.g. urban intersection) and a maximum speed value of Vmax = 140 km/h (e.g.
highway junction) for a vehicle. Then, the longest period needed by a vehicle to completely pass
H1 at P10(x11, y11)
H1 at P11(x12, y12)
PINT (xint, yint)
θ2
θ1
H2 at P20(x21, y21)
H2 at P21(x22, y22)
X
Y
VH2
VH1
Figure A1.4

162
through the intersection point can be calculated as Lmax/Vmin and is around 3.2 sec.
Consequently, we selected 3 seconds as the value for Intersection_time_threshold.

163
List of Figures
Figure 1.1 EU fatalities 1995-2004 ..............................................................................................................1 Figure 2.1 Vehicle-to-Road Communication example ............................................................................9 Figure 2.2 Inter -Vehicle Communication example.................................................................................9 Figure 2.3 Collaborative communication concept .................................................................................10 Figure 2.4 Design method .........................................................................................................................11 Figure 2.5 ECAM - Predicates and Axioms ............................................................................................15 Figure 2.6 Conceptual architecture of the ECAM system.....................................................................16 Figure 2.7 Prolog predicates .....................................................................................................................18 Figure 2.8 Common definitions for Prolog predicates..........................................................................18 Figure 2.9 View obstruction followed by tailgate scenario (VOTS) ....................................................19 Figure 2.10 Fluents and events for VOTS ...............................................................................................21 Figure 2.11 Narrative for VOTS ...............................................................................................................25 Figure 2.12 Communication-related entities for VOTS.........................................................................29 Figure 2.13 Communication delay - initial separation distance and initial velocity........................32 Figure 2.14 Intersection accident example..............................................................................................33 Figure 3.1 Vehicular communication based on an infotainment infrastructure................................40 Figure 3.2 Vehicular communication based on a cellular network.....................................................41 Figure 3.3 Direct vehicular communication between vehicles ............................................................43 Figure 4.1 Local networks example .........................................................................................................52 Figure 4.2 Communication example........................................................................................................54 Figure 4.3 Communication protocol functionality - message reception.............................................56 Figure 4.4 Communication protocol functionality – message transmission......................................56 Figure 4.5 Network management overview...........................................................................................57 Figure.4.6 Host-oriented organization example ....................................................................................58 Figure.4.7 Cluster-based organization example ....................................................................................58 Figure 4.8 Example of situation when routing is needed .....................................................................68 Figure 4.9 Inter-network routing example for host-oriented organization........................................69 Figure 4.10 Vehicular Communication Platform (VCP) architecture .................................................78 Figure 5.1 Evaluation environment .........................................................................................................86 Figure 5.2 General scenario.......................................................................................................................90 Figure 5.3 Basic rear-end scenario ...........................................................................................................90 Figure 5.4 Extended rear-end scenario....................................................................................................91 Figure 5.5 Basic intersection scenario......................................................................................................91 Figure 5.6 Extended intersection scenario ..............................................................................................92 Figure 5.7 Average BSMs delay as a function of transmission interval – test case 1 ......................102 Figure 5.8 Maximum BSMs delay as a function of transmission interval – test case 1...................103 Figure 5.9 Average BSMs delay as a function of bandwidth – Test case 1.......................................103 Figure 5.10 Maximum BSMs delay as a function of bandwidth – test case 1 ..................................103 Figure 5.11 Average BSMs delay as a function of communication service area; transmission
power 12 dBm – test case 1 .................................................................................................104 Figure 5.12 Maximum BSMs delay as a function of communication service area; transmission
power 12 dBm – test case 1 .................................................................................................104 Figure 5.13 Average BSMs delay as a function of communication service area; transmission
power 23.5 dBm – test case 1...............................................................................................104 Figure 5.14 Maximum BSMs delay as a function of communication service area; transmission
power 23.5 dBm – test case 1...............................................................................................105 Figure 5.15 Average BSMs delay as a function of network load – test case 1..................................105

164
Figure 5.16 Maximum BSMs delay as a function of network load – test case 1 ............................. 105 Figure 5.17 Average BSMs delay as a function of velocity – test case 1........................................... 106 Figure 5.18 Maximum BSMs delay as a function of velocity – test case 1 ....................................... 106 Figure 5.19 Packet collisions as a function of transmission interval – test case 1 ........................... 108 Figure 5.20 Packet collisions as a function of bandwidth – test case 1............................................. 108 Figure 5.21 Packet collisions as a function of communication service area; transmission power 12
dBm – test case 1 .................................................................................................................. 108 Figure 5.22 Packet collisions as a function of communication service area; transmission power
23.5 dBm – test case 1 .......................................................................................................... 109 Figure 5.23 Packet collisions as a function of network load – test case 1......................................... 109 Figure 5.24 Packet collisions as a function of nodes mobility – test case 1...................................... 109 Figure 5.25 Send errors as a function of transmission interval – test case 1.................................... 110 Figure 5.26 Send errors as a function of bandwidth – test case 1 ..................................................... 111 Figure 5.27 Send errors as a function of communication service area; transmission power 12 dBm
– test case 1 ........................................................................................................................... 111 Figure 5.28 Send errors as a function of communication service area; transmission power 23.5
dBm – test case 1 .................................................................................................................. 111 Figure 5.29 Send errors as a function of network load – test case 1 ................................................. 112 Figure 5.30 Send errors as a function of nodes mobility – test case 1 .............................................. 112 Figure 5.31 Information filtering rate as a function of transmission interval – test case 1 ............ 113 Figure 5.32 Information filtering rate as a function of bandwidth – test case 1.............................. 113 Figure 5.33 Information filtering rate as a function of communication service area; transmission
power 12 dBm – test case 1................................................................................................. 114 Figure 5.34 Information filtering rate as a function of communication service area; transmission
power 23.5 dBm – test case 1.............................................................................................. 114 Figure 5.35 Information filtering rate as a function of network load – test case 1.......................... 114 Figure 5.36 Information filtering rate as a function of nodes mobility – test case 1....................... 115 Figure 5.37 Average BSMs delay as a function of bandwidth – test case 2 ..................................... 117 Figure 5.38 Maximum BSMs delay as a function of bandwidth – test case 2.................................. 118 Figure 5.39 Average BSMs delay as a function of load density – test case 2................................... 118 Figure 5.40 Maximum BSMs delay as a function of load density..................................................... 118 Figure 5.41 Packet collisions as a function of bandwidth – test case 2............................................. 119 Figure 5.42 Packet collisions as a function of load density – test case 2 .......................................... 119 Figure 5.43 Send errors as a function of bandwidth – test case 2 ..................................................... 120 Figure 5.44 Send errors as a function of load density – test case 2 ................................................... 120 Figure 5.45 Average BSMs delay as a function of load density – test case 3................................... 122 Figure 5.46 Maximum BSMs delay as a function of load density – test case 3 ............................... 122 Figure 5.47 Packet collisions as a function of communication area – test case 3 ............................ 123 Figure 5.48 Packet collisions as a function of load density – test case 3 .......................................... 123 Figure 5.49 Average WAMs delay as a function of transmission interval – test case 4................. 128 Figure 5.50 Maximum WAMs delay as a function of transmission interval – test case 4 ............. 128 Figure 5.51 Average WAMs delay as a function of bandwidth – test case 4 .................................. 128 Figure 5.52 Maximum WAMs delay as a function of bandwidth – test case 4 ............................... 129 Figure 5.53 Average WAMs delay as a function of communication service area – test case 4..... 129 Figure 5.54 Maximum WAMs delay as a function of communication service area – test case 4 . 129 Figure 5.55 Average WAMs delay as a function of load density – test case 4 ................................ 130 Figure 5.56 Maximum WAMs delay as a function of load density – test case 4............................. 130 Figure 5.57 Average WAMs delay as a function of mobility of hosts – test case 4 ........................ 130 Figure 5.58 Maximum WAMs delay as a function of mobility of hosts – test case 4 ..................... 131

165
Figure 5.59 Average WAMs delay as a function of transmission interval – test case 4, WAM dissemination within local network ..................................................................................132
Figure 5.60 Maximum WAMs delay as a function of transmission interval – test case 4, WAM dissemination within local network ..................................................................................132
Figure 5.61 Average WAMs delay as a function of bandwidth - test case 4, ...................................132 Figure 5.62 Maximum WAMs delay as a function of bandwidth – test case 4, WAM
dissemination within local network ..................................................................................133 Figure 5.63 Average WAMs delay as a function of communication service area – test case 4,
WAM dissemination within local network.......................................................................133 Figure 5.64 Maximum WAMs delay as a function of communication service area – test case 4,
WAM dissemination within local network.......................................................................133 Figure 5.65 Average WAMs delay as a function of load density – test case 4, WAM dissemination
within local network ............................................................................................................134 Figure 5.66 Maximum WAMs delay as a function of load density – test case 4, WAM
dissemination within local network ..................................................................................134 Figure 5.67 Average WAMs delay as a function of mobility – test case 4, WAM dissemination
within local network ............................................................................................................134 Figure 5.68 Maximum WAMs delay as a function of mobility – test case 4, WAM dissemination
within local network ............................................................................................................135 Figure 5.69 Average WAMs delay as a function of transmission interval – test case 5..................136 Figure 5.70 Maximum WAMs delay as a function of transmission interval....................................136 Figure 5.71 Average WAMs delay as a function of bandwidth – test case 5 ...................................136 Figure 5.72 Maximum WAMs delay as a function of bandwidth – test case 5................................137 Figure 5.73 Average WAMs delay as a function of communication service area – test case 5......137 Figure 5.74 Maximum WAMs delay as a function of communication service area – test case 5 ..137 Figure 5.75 Average WAMs delay as a function of network load – test case 5 ...............................138 Figure 5.76 Maximum WAMs delay as a function of network load – test case 5............................138 Figure 5.77 Average WAMs delay as a function of mobility of the hosts – test case 5...................138 Figure 5.78 Maximum WAMs delay as a function of mobility of the hosts – test case 5 ...............139 Figure 5.79 Average WAMs delay as a function of network load – test case 6 ...............................140 Figure 5.80 WAMs delay as a function of network load – test case 6 ...............................................140

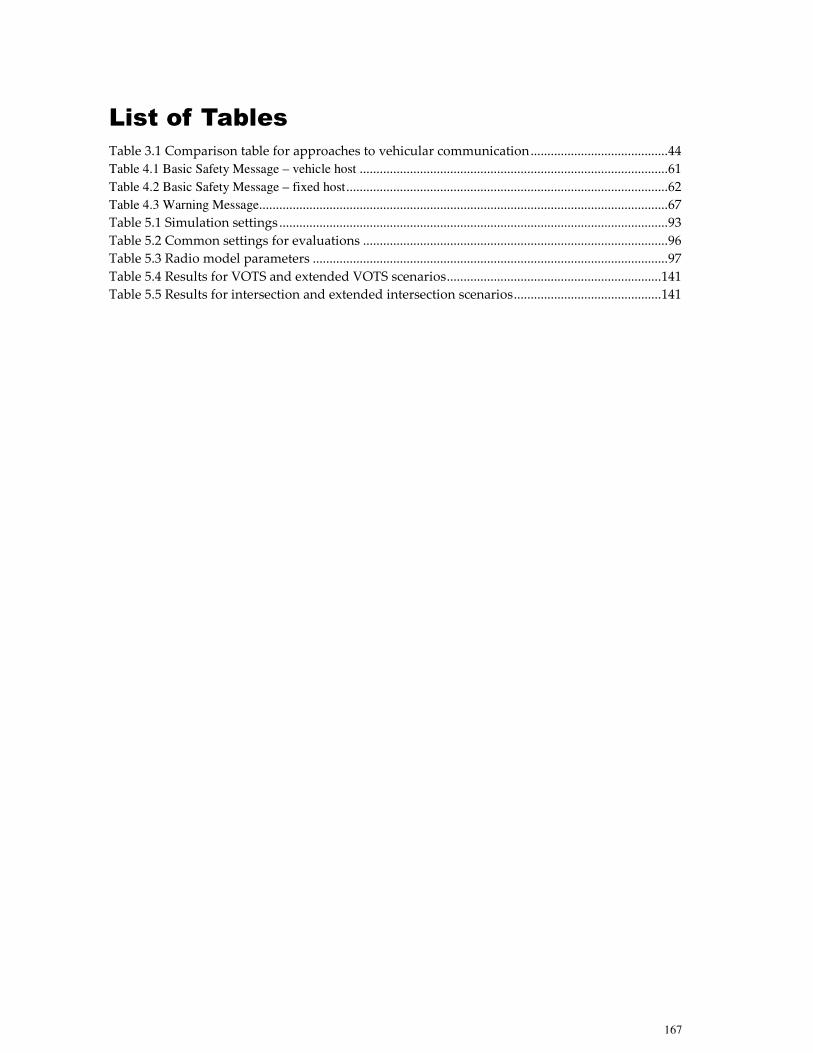
167
List of Tables
Table 3.1 Comparison table for approaches to vehicular communication.........................................44 Table 4.1 Basic Safety Message – vehicle host ............................................................................................61 Table 4.2 Basic Safety Message – fixed host................................................................................................62 Table 4.3 Warning Message..........................................................................................................................67 Table 5.1 Simulation settings....................................................................................................................93 Table 5.2 Common settings for evaluations ...........................................................................................96 Table 5.3 Radio model parameters ..........................................................................................................97 Table 5.4 Results for VOTS and extended VOTS scenarios................................................................141 Table 5.5 Results for intersection and extended intersection scenarios............................................141

169
References [AF96] Aoki M., Fujii H., “Inter-vehicle communication: technical issues on vehicle control application”, IEEE
Communication Magazine, vol. 34, pp. 90-93, Oct. 1996.
[AHK+02] Ayama M., Hasegawa H., Kawaguchi M., Ihata N., Ikegami M., Kasuga M., “A study to measure spare
capacity of driver's attention payable to cognitive subtask”, pp. 279-283, IEEE Intelligent Transportation Systems
Conference, Singapore, Sept. 2002.
[AHR00] Advanced Cruise-Assist Highway System Research Association (AHSRA) Japan, “Smart Cruise 21 – Proving
tests of Smart Cruise systems”, Dec. 2000.
[AHR01] Advanced Cruise-Assist Highway System Research Association (AHSRA) Japan, “Outline of the Primary
Requirements of Advanced Cruise-Assist Highway Systems”, Nov. 2001.
[Alb99] Albers M., ”Information design considerations for improving situation awareness in complex problem solving",
17th International Conference on Computer Documentation, pp. 154-158, New Orleans, USA, May 1999.
[AG96] Asher H.J., Galler B.A., “Collision warning using neighboring vehicle information”, Intelligent Transportation:
realizing the benefits, Houston, Texas, USA, 1996.
[AMF+02] Adachi M., Morita Y., Fujimura K., Takatori Y., Hasegawa T., “On an autonomous cruising traffic simulator
including inter-vehicle and road-to-vehicle communication networks”, IEEE Intelligent Transportation Systems
Conference, pp. 645-650, Singapore, Sept. 2002.
[AVN00] Andrisano O., Verdone R., Nakagawa M., “Intelligent transportation systems: the role of third generation
mobile radio networks”, IEEE Communication Magazine, pp. 144-151, Sept. 2000.
[AST03] ASTM, “Standard Specification for Telecommunications and Information Exchange between Roadside and
Vehicles Systems – 5 GHz Band Dedicated Short Range Communications (DSRC) Medium Access Control (MAC) and
Physical Layer (PHY) Specifications”, ATM 2213-03, 2003.
[BBA98] Bernauer E., Breheret L., Algers S., Boero M., Taranto C. D., Dougherty M., Fox K., Gabard J-F., “SMARTEST –
review of micro-simulation models”, SMARTEST Project Deliverable D3, Institute for Transport Studies, University of
Leeds, UK, 1998.
[BCC+03] Borgonovo F., Campelli L., Cesana M., Coletti L., “MAC for ad-hoc inter-vehicle network: services and
performance”, IEEE Vehicular Technology Conference 2003 Fall, pp. 2789-2793, Orlando, USA, Oct. 2003.
[BH00] Briesemeister L., Hommel G., “Role-based multicast in highly mobile but sparsely connected ad hoc networks”,
ACM Mobile and Ad Hoc Networking and Computing, Boston, USA, pp. 45-50, Aug. 2000.
[BH02] Briesemeister L., Hommel G., “Localized group membership service for ad hoc networks”, IEEE International
Conference on Parallel Processing Workshops, pp. 94-100, Menlo Park, USA, Aug. 2002.
[Bis00] Bishop R., “Intelligent vehicle applications world-wide”, IEEE Intelligent Systems, vol. 15, pp. 78-83, Jan./Feb.
2000.
[BKP+02] Brunson S.J., Kyle E.M., Phamdo N.C., Preziotti G.R., “Alert algorithm development program - NHTSA rear-
end collision alert algorithm”, US National Highway Traffic Safety Administration (NHTSA), U.S. Department of
Transportation, Sept. 2002.
[BLR03] Bandara A.K., Lupu E.C., Russo A., “Using Event Calculus to formalize policy specification and analysis”,
Fourth IEEE Workshop on Policies for Distributed Systems and Networks, pp. 26-39, Lake Como, Italy, Jun. 2003.
[Blu01] Bluetooth SIG 2001, “Specification of the Bluetooth system, Version 1.1”, (http://www.bluetooth.org/).
[Bra98] Brandano S., “A logic-based calculus of fluents”, Technical Report TR98-01, University of Pisa, Jan. 1998.
[Bra01] Bratko I., “PROLOG programming for artificial intelligence”, Third Edition, ISBN 0201-40375-7, Pearson
Education Limited, 2001.
[Brie01] Briesemeister L., “Group membership and communication in highly mobile ad hoc networks”, PhD thesis,
Technical University of Berlin 2001.
[Bre00] Bretz E.A., “Transportation 2000”, IEEE Spectrum, pp. 91-96, Jan. 2000.

170
[Bre01] Bretz E.A., “The car: just a web browser with tires”, IEEE Spectrum, pp. 92-94, Jan 2001.
[Bre99] Bretz E.A., “Transportation 2000”, IEEE Spectrum, pp. 98-103, Jan. 1999.
[BSH00] Briesemeister L., Schafers., Hommel G., “Disseminating messages among highly mobile hosts based on inter-
vehicle communication”, IEEE Intelligent Vehicle Symposium, pp. 522-527, Dearborn, USA, Oct. 2000.
[BTA+99] Bajaj L., Takai M., Ahuja R., Tang K., Bagrodia R., Gerla M., "GloMoSim: a scalable network simulation
environment", UCLA Computer Science Department Technical Report 990027, May 1999.
[BTD06] Biswas S., Tatchikou R., Dion F., “Vehicle-to-vehicle wireless communication protocol for enhancing traffic
safety”, IEEE Communications Magazine, pp. 74-82, Jan. 2006.
[BV01] Bana S.V., Varaiya P., “Space division multiple access (SDMA) for robust ad-hoc vehicle communication
networks”, IEEE Intelligent Transportation System Conference, pp. 962-967, USA, Aug. 2001.
[CAC02] Chapuis R., Aufrere R., Chausse F., “Accurate road following and reconstruction by computer vision”, IEEE
Transaction on Intelligent Transportation Systems, vol. 3, no. 4, pp. 261-270, Dec. 2002.
[CARE06] Community Road Accident Database, European Commission, Mar. 2006.
[CBC01] Chen L., Bechkoum K., Clapworthy G., “A logical approach to high-level agent control”, The Fifth International
Conference on Autonomous Agents, pp. 1-8, Montreal, Canada, May/June 2001.
[CC05] Chen W., Cai S., “Ad hoc peer-to-peer architecture for vehicle safety communications”, IEEE Communication
Magazine, pp.100-107, April 2005.
[CM00] Cervesato I., Montanari A., “A calculus of macro-events: progress report”, Seventh International Workshop on
Temporal Representation and Reasoning, pp. 47-58, Cape Breton, Canada, Jul. 2000.
[CMD+94] Chittaro L., Montanari A., Dojat M., Gasparini C., “The event calculus at work: a case study in the medical
domain”, IEEE International Conference on Intelligent Systems Engineering, pp. 195-200, Hamburg, Germany, Sept. 1994.
[CMH01] Capkun S., Hamdi M., Hubaux J., “GPS-free positioning in mobile ad-hoc networks”, Hawaii International
Conference on System Science, Jan. 2001.
[Coc97] Cochran A., “AHS communications overview”, IEEE Intelligent Transportation System Conference, pp. 47-51,
Boston, USA, Nov. 1997.
[CR03] Cheng A.M.K., Rajan, K., “A digital map/GPS based routing and addressing scheme for wireless ad-hoc
networks”, IEEE Intelligent Vehicles Symposium, pp. 17– 20, Columbus, USA, Jun. 2003.
[Chi04] Chisalita I., “Safety-oriented communication in mobile networks for vehicles”, Licentiate Thesis No. 1130,
Linköpings Studies in Science and Technology, Dec. 2004, ISBN 91-85295-85-X.
[CS02a] Chisalita I., Shahmehri N., “A novel architecture for supporting vehicular communication”, IEEE 56th Vehicular
Technology Conference, Vancouver, Canada, pp. 1002-1006, Sept. 2002.
[CS02b] Chisalita I., Shahmehri N., “A peer-to-peer approach to vehicular communication for the support of traffic safety
applications”, 5th IEEE Conference on Intelligent Transportation Systems, Singapore, pp. 336-341, Sept. 2002.
[CS02c] Chisalita I., Shahmehri N., “An in-vehicle approach for improving traffic safety through GIS utilization”, IEEE
International Conference on Systems, Man and Cybernetics, Tunisia, pp. 6-11, Vol.. 7, Oct 2002.
[CS02d] Chisalita I., Shahmehri N., “Active support for traffic safety applications through vehicular communication",
International Workshop on Trends in Information Systems, Cluj-Napoca, Romania, May 2002.
[CS04a] Chisalita I., Shahmehri N., “A context-based vehicular communication protocol”, IEEE Personal, Indoor and
Mobile Radio Communication Symposium, Barcelona, Spain, pp. 2820-2824, 5-8 Sept. 2004.
[CS04b] Chisalita I., Shahmehri N., “Traffic safety: the role of vehicular communication”, 2004 International Conference
on Systems, Man and Cybernetics, Hague, The Netherlands, pp. 3903-3908, 10-13 Oct. 2004.
[CS06a] Chisalita I., Shahmehri N., “Adaptive dissemination of safety data among vehicles”, conference paper, submitted.
[CS06b] Chisalita I., Shahmehri N., “Emergency information dissemination in mobile networks for vehicles”, conference
paper, submitted.
[CS06c] Chisalita I., Shahmehri N., “Safety-oriented vehicular communication using contextual information”, journal
paper, submitted.

171
[CS06d] Chisalita I., Shahmehri N., “On the design of safety communication systems for vehicles”, journal paper,
submitted.
[CSL04] Chisalita I., Shahmehri N., Lambrix P., “Traffic accident modeling and analysis using temporal reasoning”, 7th
IEEE Conference on Intelligent Transportation Systems, pp. 378-383, Washington, USA, Oct. 2004.
[DR01] Djuknic G., Richton R., “Geolocation and assisted GPS”, IEEE Computer, vol. 34, no. 2, pp. 317- 321, Feb. 2001.
[ECT01] European Transport Safety Council (ETSC), “European overview: priorities for EU road safety”, Oct 2001.
[ECT99] European Transport Safety Council (ETSC), “Intelligent transportation systems and road safety report”, 1999,
Brussels, Belgium.
[EFD+02] Efstratiou C., Friday A., Davies N., Cheverst K., “Utilising Event Calculus for policy driven adaptation on
mobile systems”, Third IEEE Workshop on Policies for Distributed Systems and Networks, pp. 13-24, Monterey, USA,
Jun. 2002.
[ER01] Ehlert P.A.M., Rothkrantz L.J.M., “Microscopic traffic simulation with reactive driving agents”, IEEE Intelligent
Transportation System Conference, pp. 962-967, Oakland, USA, Aug. 2001.
[ERB01] Ericsson ROK 101007 Bluetooth module – product specification, 2001.
[ESRI95] Environmental Systems Research Institute Inc. ”Understanding GIS - the ARC/INFO method”, 1995.
[Eva04] Evans L., “Traffic safety”, Bloomfields Hills, MI, Science Serving Society 2004.
[FAT99] Fujii H., Akiyama M., Tokuda K., ”Inter-vehicle communications protocol for group cooperative driving”, IEEE
Vehicular Technology Conference, pp. 2228–2232, Amsterdam, Netherlands, Sept. 1999.
[FAW01] Feeney L.M., Ahlgren B., Westerlund A., “Spontaneous networking: an application-oriented approach to ad-hoc
networking”, IEEE Communication Magazine, vol. 39, pp. 176-181, Jun. 2001.
[FBD+01] Funke D., Bellis E., Donnelly B., Blatt A., McClellan R., Wilson G., "Automotive Collision Notification (ACN)
Field Operational Test (FOT) / Final Report", National Highway Traffic Safety Administration, Washington, DC, Oct 2000.
[FCC04] Federal Communications Commission, FCC 03-024, Feb. 2004.
[FH02a] Franke U., Heinrich S., “Fast obstacle detection for urban traffic situations”, IEEE Transaction on Intelligent
Transportation Systems, vol. 3, no. 3, pp. 173-181, Sept. 2002.
[FH02b] Fujimira K., Hasegawa T., “Performance comparisons of contention schemes for inter-vehicle communications”,
IEEE Intelligent Transportation Systems Conference, pp. 342-346, Singapore, Sept. 2002.
[FH05] Fujimira K., Hasegawa T., “Performance evaluation of the Mac protocol for integrated inter-vehicle and vehicle-
to-road communications”, IEEE Intelligent Transportation Systems Conference, pp. 308-313, Wien, Austria, 13-15 Sept.
2005.
[FMH+03] Fussler H., Mauve M., Hartenstein H., Kasemann M, Vollmer D., “Location-based routing for vehicular ad-hoc
networks”, ACM SIGMOBILE Mobile Computing and Communications Review, Vol. 7, pp. 47-49, Jan 03.
[FMO01] Fukada A., Matsuda S., Ohada H., “Multi-hop control scheme on vehicular information broadcasting relay
(VIBROR) protocol for inter-vehicle-communication”, IEEE Vehicular Technology Conference, pp. 159-163, Atlantic City,
USA, Oct. 2001.
[Gei02] Geier JM., “Wireless LANs”, SAMS Publising, ISBN 0-672-32058-4, 2002.
[Glo06] GloMoSim, Global Mobile Information Systems Simulation Library, UCLA Parallel Computing Laboratory,
available at http://pcl.cs.ucla.edu/projects/glomosim, visited last Feb. 2006.
[GMC+00] General Motors Corporation, Delphi-Delco Electronic Systems, “Automotive collision avoidance system field
operational test”, Dec. 2000.
[Gon01] Gong L., “Project JXTA: a technology overview”, Sun Microsystems, Apr. 2001.
[God02] Godara L.C, editor, ”Handbook of antennas in wireless communication”, CRC Press, Boca Raton, USA, 2002.
[GWA01] Grewal M., Weill L., Andrews A., “Global positioning systems, inertial navigation, and integration”, John
Wiley and Sons, ISBN: 0-471-35032-X, 2001
[Haa02] Haagen J., “Seamless e-services for home, vehicles and personal devices”, COMDEX Nordic Symposium,
Gothenburg, Sweden, Jan. 2002.
172
[HBE+01] Hartenstein H., Bochow B., Ebner A., Lott M., Radimirsch M., Vollmer D., “Position-aware wireless networks
for inter-vehicle communication: the Fleetnet project”, ACM Mobile and Ad Hoc Networking and Computing
Conference, Long Beach, USA, pp. 259 - 262, Oct. 2001.
[HMS+02] Hayami T., Matsunaga K., Shidoji K., Matsuki Y., “Detecting drowsiness while driving by measuring eye
movement – a pilot study”, IEEE Intelligent Transportation Systems Conference, pp. 156-161, Singapore, Sept. 2002.
[IEE99] IEEE Standard 802.11, “Wireless LAN Media Access Control (MAC) and Physical Layer (PHY) Specification”,
IEEE 1999.
[IIK+02] Ihata N., Ikegami M., Kawaguchi M., Hasegawa H., Ayama M., Kasuga M., “Reaction time of the secondary task
while driving in various situations”, pp. 274-278, IEEE Intelligent Transportation Systems Conference, Singapore, Sept.
2002.
[IRT01] International Road Traffic and Accident Database (IRTAD), “Road traffic data” and “Accident traffic data”, Jan
2004.
[IST02] Information Society Technologies & European Commission, “eSafety- final report of the eSafety working group
on road safety”, Nov 2002.
[ITS01] Intelligent Transportation Systems (ITS) America, “IVI candidate user services”, 2001.
[JM96] Johnson D.B., Maltz D.A., “Dynamic source routing in ad-hoc wireless networks”, Mobile Computing, T.
Imielinski and H. Korth Eds., pp. 153-181, Kluwer Academic Publishers, 1996.
[Jon01] Jones W. D., “Keeping cars from crashing”, IEEE Spectrum, vol. 38, pp. 40-45, Sep. 2001.
[Jon02] Jones W. D., “Building safer cars”, IEEE Spectrum, vol. 38, pp. 82-85, Jan. 2002.
[KBS+01] Kellerer W., Bettstetter C., Schwingenschlögl C., Sties P., Steinberg K-E., Vögel H-J., “(Auto) Mobile
communication in a heterogeneous and converged world”, IEEE Personal Communication, vol. 8, pp. 41-47, Dec. 2001.
[KCF+03] Kiefer R.J., Cassar M.T., Flannagan C.A., LeBlanc D.J., Palmer M.D., Deering R.K., Shulman M.A., “Forward
Collision Warning requirements project: refining the CAMP crash alert timing approach by examining last-second
braking and lane change maneuvers under various kinematic conditions”, US National Highway Traffic Safety
Administration, Jan 2003.
[KKR+04] Kroon,J., van Klaveren R., Rothkrantz L., de Bruin D., Nelisse M., “Design and test of a communication based
advanced driver assistance system”, IEEE Conference on Systems, Man and Cybernetics, pp. 1326-1330, The Hague, The
Netherlands, Oct. 2004.
[KK00] Karp B., Kung H.T., “GPSR: greedy perimeter stateless routing for wireless networks”, ACM MOBICOM 2000, pp.
243 – 254, Boston, USA, Aug 2000.
[KLP+99] Kiefer R., LeBlanc D., Palmer M., Salinger J., Deering R., Shulman M., "Development and validation of
functional definitions and evaluation procedures for collision warning/avoidance system", US National Highway Traffic
Safety Administration Technical Report, USA, Washington, Aug 1999.
[Kra98] Krauss S., “Microscopic modeling of traffic flow: investigation of collision free vehicle dynamics”, PhD thesis,
University of Cologne, Apr. 1998.
[KS86] Kowalski R., Sergot M., “A logic-based calculus of events”, New Generation Computing No. 4, pp.67-95, Springer-
Verlag, 1986.
[KSA02] Kosh T., Schwingenschlögl C., Ai L., “Information dissemination in multihop inter-vehicle networks”, IEEE
Intelligent Transportation System Conference, pp. 685-690, Singapore, Sept. 2002.
[KSP+S01] Kortuem G., Schneider J., Preuitt, Thomson T.G., Fickas S., Segall Z., “When peer-to-peer comes face-to-face:
collaborative peer-to-peer computing in mobile ad-hoc networks”, International Conference on peer-to-peer computing,
Linköping, Sweden, pp. 75-91, Sep. 2001.
[KTT+02] Kato S., Tsugawa S., Tokuda K., Matsui T., Fujii H., “Vehicle control algorithms for cooperative driving with
automated vehicles and intervehicle communications”, IEEE Transactions on Intelligent Transportation Systems, vol. 3,
no. 3, pp. 155-161, Sept. 2002.
173
[KMR+03] Katragadda S., Murthy G., Rao R., Kumar M., Sachin R., “A decentralized location-based channel access
protocol for inter-vehicle communication”, The 57th IEEE Vehicular Communication Conference, pp. 1831-1835, Jeju,
Korea, 22-25 Apr. 2003.
[KV00] Ko Y.-B., Vaidya N.H., “Location-aided routing (LAR) in mobile ad hoc networks”, Wireless Networks, Kluwer
Academic Publishers, Vol. 6 , Issue 4, pp. 307 – 321, Jul 2000.
[LHC+00] Laoufi M., Heddebaut M., Cuvelier M., Rioult, J., Rouvaen J.M., “Positioning emergency calls along roads and
motorways using a GSM dedicated cellular radio network”, IEEE Vehicular Technology Conference, Boston, USA, pp.
2039 -2046, Sep. 2000.
[LHS+00] Lott M., Halfmann R., Schulz E., Radimirsch M., “Medium access and radio management for ad hoc networks
based on UTRA TDD”, ACM Mobile and Ad Hoc Networking and Computing Conference, Long Beach, USA, pp. 76 - 86,
Oct. 2001.
[LHT+03] Lochert C., Hartenstein H., Tian J.,, Fubler H., Hermann D., Mauve M., “A routing strategy for vehicular ad hoc
networks in city environments”, IEEE Intelligent Vehicles Symposium, pp. 156 – 161, Columbus, USA, Jun 2003.
[LJC+00] Jinyang L., Jannotti J., Couto D., Krager D., Morris R., “A scalable location service for geographic ad hoc
routing”, The Sixth ACM Annual Conference on Mobile Computing and Networking, pp. 120-130, Boston, USA, Aug.
2000.
[LMFS97] Lockheed Martin Federal Systems Odetics Intelligent Transportation Systems Division, “ITS communication
document”, Jan. 1997.
[LO03] Liu Y., Ozguner U., “Effect of inter-vehicle communication on rear-end collision avoidance”, IEEE Intelligent
Vehicles Symposium, pp. 168- 173, Columbus, USA, Jun. 2003.
[McC02] McCarthy J., “Actions and other events in situation calculus”, Knowledge Representation Conference, pp. 615-
622, Toulouse, France, Apr. 2002.
[MCG+02] Morsink P.L.J., Cseh C., Gietelink O.J., Miglietta M., “Preliminary design of an application for communication
based longitudinal control in the Cartalk2000 project”, IT Solutions for Safety and Security in Intelligent Transport, Lyon,
France, Sept. 2002.
[MDF+00] McCrady D., Doyle L., Forstrom H., Dempsey T., Martorana M., “Mobile ranging using low accuracy clocks”,
IEEE Transactions on Microwave Theory and Techniques, pp. 951-958, Jun. 2000.
[MLR+04] Moore D., Leonard J., Rus D., Teller S., “Robust distributed network localization with noisy range
measurements” Second ACM Conference on Embedded Networked Sensor Systems, Nov. 2004.
[MG96] Murthy S., Garcia-Luna-Aceves J.J., “An efficient routing protocol for wireless networks”, Mobile Networks and
Applications, Baltzer Science Publishers, Vol. 1, Issue 2, pp. 183 – 197, 1996.
[MH02] Miller R., Huang Q., ”An adaptive peer-to-peer collision warning system”, IEEE Vehicular Technology
Conference, Birmingham, USA, pp. 317-321, May 2002.
[MIK01] Munaka T., Ito Y., Kubota S., “A study of info-communication technologies required in ITS networks”, IEEE
Applications and the Internet workshops, pp. 171-176, San Diego, U.S.A., Jan. 2001.
[MJK+00] Morris R., Jannotti J., Kaashoek F., Li J., Decouto D., “CarNet: a scalable ad hoc wireless network system”, ACM
SIGOPS, pp. 61-65, Kolding, Denmark, Sept. 2002.
[MKA+00] Michael L.B., Kikuchi S., Adachi T., Nakagawa M., “Combined cellular/direct method of inter-vehicle
communication”, IEEE Intelligent Transportation Systems Conference 2000, pp. 534-539, Dearborn, USA, Oct. 2000.
[MKC+01] Meier R., Killijian M., Cunningham R., Cahill V., “Towards proximity group communication”, Advanced
Topic Workshop, Middleware for Mobile Computing, Heidelberg, Germany, Nov. 2001.
[MKI+99] Morimoto H., Koizumi M., Inoue H., Nitadori K., “AHS road-to-vehicle communication system”, IEEE
Intelligent Transportation Systems Conference, pp. 327 –334, Tokyo, Japan, Oct. 1999.
[MKO00] Matsuda S., Koike H., Okada H., “Vehicular information broadcasting relay (VIBROR) protocol for inter-vehicle
communication”, IEEE Vehicular Technology Conference, Boston, USA, pp. 2050-2010, Sep. 2000.
[MN97] Michael L.B., Nakagawa M., “Multi-hopping data considerations for inter-vehicle communication over multiple
lanes”, IEEE Vehicular Technology Conference, Phoenix, USA, pp. 121-125, May 1997.

174
[MSN00] Morioka Y., Sota T., Nakagawa M., “An anti-car collision system using GPS and 5.8 GHz inter-vehicle
communication at an off-sight intersection”, IEEE Vehicular Technology Conference, pp. 2019 – 2024, Boston, USA, Sep.
2000.
[MST01] Mondelo P.R., Sorin J., Terres de Ercilla F., “An analysis of traffic accidents using official reports”, International
Conference on Computer-Aided ergonomics and Safety, Hawaii, USA, Jul/Aug 2001.
[MWF02] Murphy P., Welsh E., Frantz J.P., “Using Bluetooth for short-term ad hoc connections between moving vehicles:
a feasibility study”, IEEE Vehicular Technology Conference, pp. 414- 418, May 2002.
[MWH01] Mauve M., Widmer A., Hartenstein H., “A survey on position-based routing in mobile ad hoc networks”, IEEE
Network, Vol. 15, Issue 6, pp. 30-39, Nov.-Dec. 2001.
[NAM+04] Shahmehri N., Aberg J., Maciuszek D., Chisalita I., "Linköping University's virtual companion project", IEEE
Pervasive Computing Journal, Work in Progress Section, Nr. 3(2), page 50, Apr.-Jun. 2004.
[NCD01] Nasipuri A., Castaneda R., Das S.R., “Performance of multippath routing for on-demand protocols in mobile ad
hoc networks”, Mobile Networks and Applications, Baltzer Science Publishers, Vol. 6, pp. 339-349, 2001.
[NCSA03] National Center for Statistics and Analysis, “Traffic safety facts 2003”, report DOT HS 809767, National
Highway Traffic Safety Administration, Washington, USA, 2004.
[NDM+05] Nedevschi S., Danescu R., Marita T., Oniga F., Pocol C., Sobol S., Graf T., Schmidt R., “Driving environment
perception using stereovision”, IEEE Intelligent Vehicle Symposium, pp. 331-336, Las Vegas, USA, Jun. 2004 .
[NH00+] Nagaosa T., Hasegawa, T., “A new scheme of nearby vehicles' positions recognition and inter-vehicle
communication without signal collision-V-PEACE scheme”, IEEE Vehicular Technology Conference, pp. 1616 – 1620,
Tokio, Japan, May 2000.
[NSD01] Najm W., Smith J., David S., “Analysis of crossing path crashes”, US Department of Transportation, July 200.
[NSG+04] Nedevschi S., Schmidt R., Graf T., Danescu R., Frentiu D., Marita T., Oniga F., Pocol C., “3D lane detection
system based on stereovision”, IEEE Intelligent Transportation Systems Conference, pp. 161-166, Washington, USA, Sept.
2004.
[NSS+03] Najm W., Sen B., Smith J., Campbell B., “Analysis of light vehicle crashes and pre-crash scenarios based on the
2000 general estimates system”, National Highway Traffic Safety Administration, U.S. Department of Transportation,
Feb. 2003.
[NSS01] Najm W., Smith J.D., Smith D.L., “Analysis of crossing path crashes”, National Highway Traffic Safety
Administration, U.S. Department of Transportation, Jul. 2001.
[NTF96] Nakamura N., Tsunomachi H., Fukui R., “Road vehicle communication system for vehicle control using leaky
coaxial cable”, IEEE Communications Magazine, Vol. 34, pp. 84 –89, Oct 1996.
[NWW+97] K. Nagel, D. E. Wolf, P. Wagner, and P. Simon, “Two-lane traffic rules for cellular automata: a systematic
approach,” Los Alamos Nat. Lab., Los Alamos, NM, Tech. Rep. LA-UR 97-4706, 1997.
[OMT+99] Okada M., Maeda M., Tsukamoto K., Komaki S., “A joint road-to-vehicle and vehicle-to-vehicle
communications system based on non-regenerative repeater”, IEEE Vehicular Technology Conference, Amsterdam,
Netherlands, pp. 2233-2237, Sept. 1999.
[ONS+00] Ohyama T., Nakabayashi S., Shiraki Y., Tokuda K., “A study of real-time and autonomous decentralized DSRC
system for inter-vehicle communications”, IEEE Intelligent Transportation Systems Conference, pp. 190-195, Dearborn,
USA, Oct. 2000.
[PAO01] Pan Y., Acarman T. Ozguner U., “Non-standard safety technology”, IEEE Intelligent Transportation Systems
Conference, pp. 1126-1131, Oakland, USA, Aug. 2001.
[PB94] Perkins C.E., Bhagwat P., “Highly dynamic-sequenced distance-vector routing (DSDV) for mobile computers”,
ACM SIGCOMM Computer Communication Review, Volume 24, Issue 4, pp. 234 – 244, Oct 1994.
[PC97] Park V.D., Corson M.S., “A highly adaptive distributed routing algorithm for mobile wireless networks”, Annual
Joint Conference of the IEEE Computer and Communications Societies, pp. 1405 –1413, Kobe, Japan, Apr. 1997.
[PDO+02] Pal A., Dolgan A., Ozguner F., Ozguner U., “A MAC layer protocol for real-time inter-vehicle communication”,
IEEE International Conference on Intelligent Transportation Systems, pp. 353-358, Singapore, September 2002.

175
[Per99] Pereira, J.M., “On the suitability of GPRS for integrating ITS with non-ITS traffic”, IEEE Vehicular Technology
Conference, pp. 758–763, Amsterdam, The Netherlands, Sept 1999.
[Phy03] Physics Tutorial, The Physics Classroom and Mathsoft Engineering & Education Inc., 2003.
[Pie98] Pierowicz, J.A., “Use of map data information in an on-board intersection violation detection system”, IEEE
Digital Avionics Systems Conference, pp. 251-256, Bellevue, USA, Nov. 1998.
[PJL+00] PierowiczJ., Jocoy E., Lloyd M., Bittner A., Pirson B., “Intersection collision avoidance using ITS
countermeasures“, U.S. Department of Transportation National Highway Traffic Safety Administration Office of
Advanced Safety Research, Sept. 2000.
[PR99a] Perkins, C.E., Royer E.M., “Ad-hoc on-demand distance vector routing”, IEEE Mobile Computing Systems and
Applications, pp. 90-100, New Orleans, USA, Feb. 1999.
[PR99b] Pirri F., Reiter R., “Some contribution to the metatheory of the Situation Calculus”, Journal of the ACM, Vol. 46,
May 1999.
[RML02] Rudack M., Meincke M., Lott M., “On the dynamics of ad hoc networks for inter vehicle communications
(IVC)“, International Conference on Wireless Networks, Las Vegas, USA, June 2002.
[RN95] Russell S., Norvig P., “Artificial Intelligence – a modern approach”, Prentice Hall, ISBN 0-13-103805-2, 1995.
[RO99] Redmill K.A., Ozguner U., “VATSIM: a Vehicle And Traffic SIMulator”, IEEE Intelligent Transportation Systems,
Columbus, USA, pp. 656-661, Oct. 1999.
[RT99] Royer E.M., Toh C.K., “A review of current routing protocols for ad hoc mobile wireless networks”, IEEE Personal
Communications, Vol. 6, Issue 2, pp. 46-55, Apr 1999.
[San94] Sandewall E., “Features and Fluents: the representation of knowledge about dynamical systems”, Volume I,
Oxford University Press, 1994.
[SBH97] Sukthankar R., Baluja S., Hancock J., “Evolving an intelligent vehicle for tactical reasoning in traffic”, IEEE
International Conference on Robotics and Automation, pp. 519-524, Albuquerque, USA, Apr. 1997.
[SBS+02] Singh P., Bambos N., Srinivasan B., Clawuin D., “Wireless LAN performance under varied stress conditions in
vehicular traffic scenarios”, IEEE Vehicular Technology Conference 2002. pp. 743-747, Vancouver, Canada, Sept. 2002.
[SCA+04] Shahmehri N., Chisalita I., Aberg J., Maciuszek D., Hellqvist M., “Using vehicular communication to support
older drivers at road intersection: a feasibility study”, International Conference on Smart Homes and Health Telematic,
pp. 33-41, Singapore, Sept. 2004.
[SCA06] Shahmehri N., Chisalita I., Aberg J., “Chapter 4.6: People with special needs and traffic safety”, in “Technology
for aging, disability and independence: computer and engineering for design and applications”, eds. Helal A., Mokhtari
M., Abdulrazak B., to be published by John Wiley & Sons, 2006.
[SES+04] Santos R.A., Edwards R.M., Seed L.N., Edwards A., “A location-based routing algorithm for vehicle to vehicle
communication”, IEEE International Conference on Computer Communication and Networks, pp.221-226, Chicago, USA,
Oct 2004.
[SFL+00] Sun M.-T., Feng W.-C., Lai T.-H., Yamada K., Okada H., Fujimura K., “GPS-based message broadcast for
adaptive inter-vehicle communications”, IEEE Vehicular Technology Conference, Vol. 6 , pp. 2685 –2692, Boston, USA,
Sep. 2000.
[Sha95] Shanahan M., “A circumscriptive calculus of events”, Artificial Intelligence, vol. 77, pages 249-284, 1995.
[Sha00] Shanahan M., “An abductive Event Calculus planner”, The Journal of Logic Programming, vol. 44, pp. 207-239,
2000.
[Sha99] Shanahan M., “ The Event Calculus explained”, Artificial Intelligence Today, Springer Lecture Notes in Artificial
Intelligence, no. 1600, pp. 409-430, Springer-Verlag, 1999.
[SITC01] Swedish Institute for Transport and Communications Analysis, “Road traffic accidents with personal injuries”,
2001.
[SSN03] Sen B., Smith J.D., Najm W.G., “Analysis of lane change crashes”, U.S. Department of Transportation, Mar 2003.

176
[SMG+05] Sadashivaiah M.., Makanaboyina, R.., George B., Raghavendra R., “Performance evaluation of directional
MAC protocol for inter-vehicle communication”, IEEE Vehicular Technology Conference, pp.2585-2589, 30 May – 1 June,
Stockholm, Sweden, 2005.
[SON+02] Shiraki Y., Ohyama T., Nakabayashi S., Tokuda K., Kato A., Fujise M., Horimatsu T., “Experimental system of
60 GHz millimeter wave band inter-vehicle communications based CSMA method”, IEEE Vehicle Symposium, pp. 576-
582, Versailles, France, Jun. 2002.
[Sta04] Stallings W., “Wireless communication and networks”, ISBN 0-13-191835-4, Prentice Hall 2004.
[Swi05] Swiss Wireless, “Radio theory and link planning for wireless LAN”, 2005.
[Tan 04] Tanenbaum A., “Computer networks”, Fourth Edition, Prentice-Hall, 2004.
[TAF00] Tokuda K., Akiyama M., Fujii H., “DOLPHIN for inter-vehicle communications system”, IEEE Intelligent
Vehicles Symposium, Dearborn, USA, pp. 504 - 509, 3-5 Oct. 2000.
[TCE+00] Talmadge S., Chu R., Eberhard C., Jordan K., Moffa P., "Development of performance specifications for
collisions avoidance systems for lane change crashes", TRW Space and Defense, USA, Washington, Aug. 2000.
[Tet00] Tetsuji I., “Summary of the research achievements of AHSRA”, 4th AHS Research Seminar, Tokyo, Japan, Jun.
2000.
[TNC+02] Tseng Y.-C., Ni S.-Y., Chen Y.-S., Sheu J.-P., ”The broadcast storm problem in a mobile ad hoc network”, ACM
Wireless Networks, Vol. 8, Issue 2/3, pp. 153 – 167, Mar. 2002.
[Toy02] Toyota Motor Corporation News, “Toyota develops pre-crash safety system”, Tokyo, Japan, Jun. 2002.
[TMB01] Takai M., Martin J., Bagrodia R., “Effects of wireless physical layer modeling in mobile ad hoc networks”,
MOBICOM 2001.
[USC05] U.S. Department of Transportation National Highway Traffic Safety Administration National Center for
Statistics & Analysis, Crashworthiness Data System (CDS), 2005.
[USD03] U.S. Department of Transportation (DOT), Intelligent Transportation Systems, 2003, http://www.its.dot.gov/.
[USDT99] U.S. Department of Transportation, ITS Joint Program Office, “Motor vehicles crashes – data analysis and IVI
program emphasis”, Nov. 1999.
[Ver97] Verdone R., “Multihop R-Aloha for inter-vehicle communication at milimeter waves”, IEEE Transaction on
Vehiculat Technology, pp. 992-1005, Nov 1997.
[Wan04a] Wang S.Y., “On the intermittence of routing paths in vehicle-formed mobile ad hoc networks on highways”,
IEEE International Conference on Intelligent Transportation Systems, pp. 803-809, Washington, USA, Oct. 2004.
[Wan04b] Wang S.Y., “Predicting the lifetime of repairable unicast routing paths in vehicle-formed mobile ad hoc
networks on highways”, IEEE International Symposium on Personal, Indoor, and Mobile Radio Communications,
pp.2815-2819, Sept. 2004, Barcelona, Spain.
[WLH+05] Wang S.Y., Lin C.C., Hwang Y.W., Tao K.C., Chou C.L, “A practical routing protocol for vehicle-formed
mobile ad hoc networks on the roads”, IEEE Intelligent Transportation Conference, pp. 161-166, Vienna, Austria, Sept.
2005.
[WC02] Williams C., Camp T., “Comparison of broadcasting techniques for mobile ad hoc networks”, 3rd ACM
International Symposium on Mobile Ad Hoc Networking & Computing, pp. 194 – 205, Lausanne, Switzerland, Jun. 2002.
[WH00] Widodo A., Hasegawa T., “Impacts of environment adaptive running with and without IVCN”, Vehicular
Technology Conference Proceedings, VTC 2000-Spring, Tokyo, Japan, pp. 327-330, May 2000.
[WH98a] Widodo A., Hasegawa T., “Evaluations of traffic safety improvement using an autonomous traffic flow
simulator including inter-vehicle communication”, Global Telecommunications Conference, Sydney, Australia, pp. 2629-
2633, Nov. 1998.
[WH98b] Widodo A., Hasegawa T., “A new inter-vehicle communication system for ITS and an autonomous traffic flow
simulator”, IEEE International Symposium on Spread Spectrum Techniques and Applications, pp. 82-86, USA, Sept. 1998.
[Win03] Winberg B. “Realizing a vehicular communication platform”, Master Thesis, Linköping University, 2003.

177
[Win96] Wingfield P.A., “Telecommunications media for transport telematics”, IEEE Communications Magazine , Vol. 34,
pp. 62 –67, Oct . 1996.
[WM00] Wood C., Mace O., “Vehicle positioning in urban environments”, GPS World Magazine, April 2000.
[Vol04] Volvo Car Corporation, 2004.
[Wol95] Woll, J.D., “Monopulse Doppler radar for vehicle applications”, IEEE Intelligent Vehicles Symposium, pp. 42-47,
Sept 1995.
[XHS+02] Xu Q., Hedrick K., Sengupta R., van der Werf J., “Effects of vehicle-vehicle/roadside-vehicle communication on
adaptive cruise controlled highway systems”, IEEE Vehicular Technology Conference, pp. 1249-1253, Vancouver,
Canada, Sept. 2002.
[Yam96] Yamada S., “The strategy and deployment plan for VICS”, IEEE Communication Magazine, Oct. 1996.
[YGK03] Yi Y., Gerla M., Kwon T.J., “Efficient flooding in ad hoc networks: a comparative performance study”, IEEE
International Conference on Communications, pp. 1059-1063, Anchorage, USA, May 2003.
[YEY+04] Yin J., ElBatt T., Yeung G., Ryu B., Habermas S., Krishnan H., Talhy T., “Performance evaluation of safety
applications over DSRC vehicular ad hoc networks”, ACM Conference on Vehicular Ad Hic Networks, Philadelphia,
USA, Oct. 2004.
[YLZ+04] Yang X., Liu J., Zhao F., Vaidya N.H., “A vehicle-to-vehicle communication protocol for cooperative collision
warning”, International Conference on Mobile and Ubiquitous Systems: Networking and Services, pp. 114-123, Boston,
USA, 22-24 Aug., 2004.
[Yua97] Yuan R., “North American Dedicated Short Range Communications (DSRC) standards”, 1997 IEEE Intelligent
Transportation System Conference, pp. 537–542, Boston, USA, Nov 1997.
[YRM05] Yang S., Refai H., Ma X., “CSMA based inter-vehicle communication using distributed and polling
coordination”, IEEE Intelligent Transportation Systems Conference, pp. 167-171, Vienna, Austria, 13-15 Sept. 2005.
[ZKV00] Zador P., Krawchuk S., Voas R., "Final Report -- Automotive Collision Avoidance System (ACAS) Program",
Delphi-Delco Electronic Systems, USA, Aug. 2000.
[ZR05] Zhu J., Roy S., “MAC for Dedicated Short Range Communications in Intelligent Transportation System”, IEEE
Communications Magazine, pp. 60-67, December 2003.