community and regional noise mapping in the united … · 14 sound and vibration/september 2007...
TRANSCRIPT
www.SandV.com14 SOUND AND VIBRATION/SEPTEMBER 2007
Community and Regional Noise Mapping in the United StatesKenneth Kaliski, Eddie Duncan, and James Cowan, Resource Systems Group Inc., White River Junction, Vermont
The mapping of background noise levels around communities in Europe is increasing rapidly, spurred on by the European Union Directive 2002/49/EC, which requires ‘agglomerations’ of more than 250,000 inhabitants to produce noise maps. This directive has been a catalyst for developing noise models that can handle the daunting task of computing propagation from thousands of miles of highways, railroads, and other sources. While the United States has been slow to catch on to regional noise mapping, the tools that were developed in Europe can be implemented almost seamlessly into U.S. projects. This is because the most advanced noise mapping models can interact with GIS-based transportation models, GIS (Geographic Information Systems), CAD (Computer Aided Design) files, and image file formats that are commonly used in the U.S. This article describes a demonstration project in Chittenden County, VT, that uses existing transportation, GIS, and CAD data in Datakustik’s CadnaA sound propagation model to create a map of traffic and rail noise over the county’s 539-square-mile area.
In 1999, the World Health Organization (WHO) issued suggested community noise guidelines.1 It considered various environments, noise levels, and noise impacts. In outdoor living areas (backyards, for example), a noise level of 50-55 dBA averaged over the daytime is considered moderately to seriously annoying; levels above 45 dBA averaged over nighttime hours can disturb sleep; and indoor noise levels above 35 dBA impact communication in a school classroom.2
The European Union (EU) has been very concerned with noise impact across member states. WHO estimates that more than 50% of Europeans live in noisy surroundings and that 30% experience nighttime noise levels that disturb sleep.3 Concern about those magnitudes and the probability of noise levels increasing with development and transportation system expansion prompted the European Parliament and Council of the European Union to initi-ate Directive 2002/49/EC. It requires ‘agglomerations’ of more than 250,000 inhabitants to produce noise maps.4
Noise mapping is the geographic presentation of data related to outdoor sound levels and sound exposure with associated infor-mation on impact to the affected population. A geographic view of noise shows community planners, developers, elected officials, government agencies and the general populace where current noise levels present a problem, where mitigation is needed, and where new and future development will have the greatest nega-tive impact.
European noise maps are required to:• Provide estimates of daytime and nighttime sound levels over
a wide area.• Estimate the number of exceedences of a limit value (55 Lden)
for residences, schools, and hospitals.• Estimate the number of people exposed to various noise lev-
els.One of the most sophisticated and well publicized of the EU
noise maps was created for Paris (http://www.v1.paris.fr/fr/envi ronment/bruit/carto_jour_nuit/cartobruit.html). The map can be viewed in two or three dimensions, and noise levels are color coded (Figure 1). The three-dimensional map color-codes build-ings to show noise levels on each façade. Paris can be viewed as a whole or viewers can select ‘arrondisements’ and then zoom in on particular neighborhoods or streets. Daytime and nighttime comparisons are available along with graphic displays of noise levels in the selected area.
As the Paris noise map shows, noise levels are generally highest
and of greatest concern around roadways and near transportation terminals like airports and train stations.
The EU is using noise maps to set a baseline against which im-provements can be made. The greatest attention is paid to areas of high annoyance or possible sleep disturbance and areas that could reach those levels with certain types of development.
Noise Mapping in the United StatesWhile noise mapping is not mandated in the U.S. by federal or
state governments, communities that are experiencing or planning growth can learn where noise problems already exist, define prob-lematic noise sources, take corrective action and plan development so that noise levels are not exacerbated.
Despite these potential benefits, community-wide noise maps in the U.S. are rare and noise prediction models tend to be limited in scope either to Environmental Impact Statements (EISs) for highways or railways or Part 150 studies for airports. These models rarely incorporate noise from sources other than infrastructure under study. For example, Part 150 airport studies are unlikely to include modeling that shows the noise contribution of nearby road-way traffic. In addition, the output from these models is relatively poor compared with European models used today.
Figure 1. Paris noise map (web view).
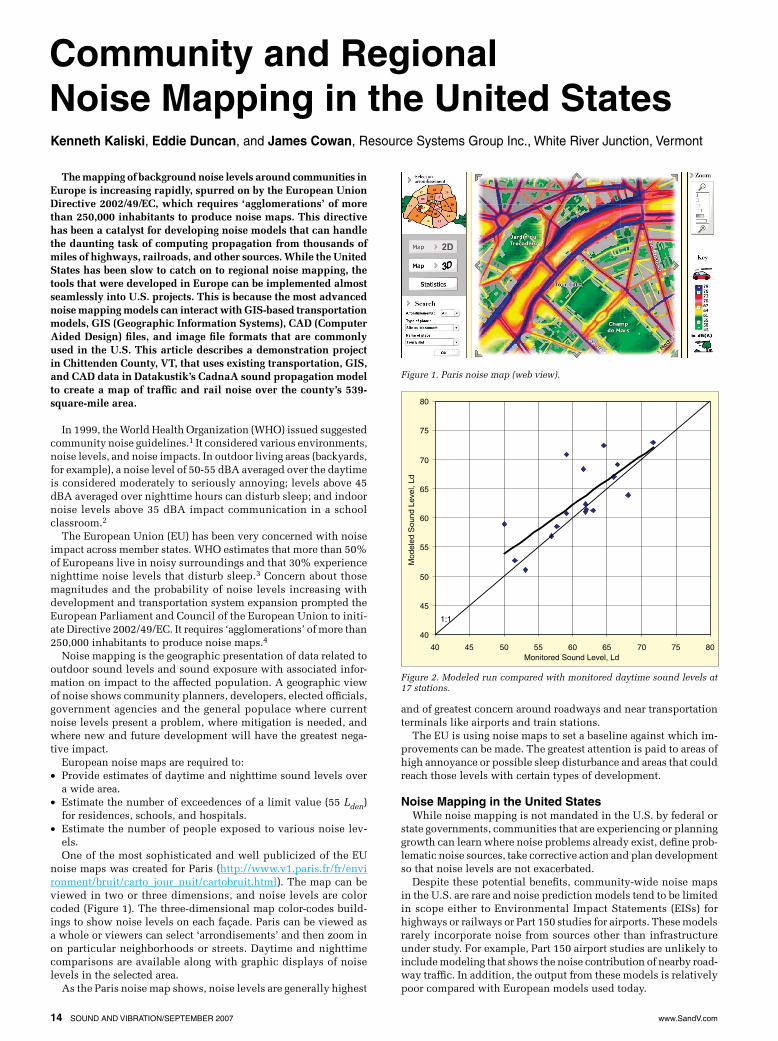
Figure 2. Modeled run compared with monitored daytime sound levels at 17 stations.
40
45
50
55
60
65
70
75
80
40 45 50 55 60 65 70 75 80Monitored Sound Level, Ld
Mod
eled
Sou
nd L
evel
, Ld
1:1

www.SandV.com SOUND AND VIBRATION/SEPTEMER 2007 15
With regard to highway noise mapping, the U.S. significantly lags behind Europe. The Federal Highway Administration (FHWA) does provide its own Traffic Noise Model (TNM), but it presents several drawbacks to easy, realistic noise mapping. • TNM cannot handle situations where contour lines (or any other
data layer lines) cross roadways (or any other data layer). Thus, direct import of contour lines is very difficult.
• There is no easy way to import large amounts of roadway geom-etry data into TNM.
• The graphical output of TNM is primitive and cannot be easily imported into GIS systems.
• While TNM may be able to handle complex geometries and a large number of roadway segments, in practice, the model bogs down quickly with increasing complexities in the runs.
• TNM cannot incorporate data from rail lines, airports, or other nonhighway industrial sources.In contrast, noise mapping software, such as CadnaA and Sound-
Plan, offers the real advantage of being GIS- and CAD-based so maps reflect streets, parks, forests, building locations, etc., as people would recognize them. Contour lines present no challenge. Neither does importing data. For example, with Datakustik’s CadnaA, RSG imported 1,230 roadway segments from Chittenden County’s travel demand model, including geographic information, average daily traffic volumes, class and speeds in one step. Importing land cover and terrain required an additional two steps.
At least two European noise modeling packages, CadnaA and SoundPlan, are now working to offer the option to implement the TNM algorithm. While these implementations have not officially been ‘approved’ by the FHWA, they offer significant advantages in their fast processing speed over a virtually unlimited number of receivers, multiprocessor support, built-in CAD functionality, 3-D
viewing, building façade noise predictions, professional graphics and GIS/CAD-compatible input and output.
While these models have been successfully used in the U.S. for modeling industrial sources, there has been limited use in regional noise mapping. Aside from the Chittenden County noise map, Columbia College has recently started limited noise mapping of Lincoln, Nebraska, with SoundPlan. Under the direction of Dominique Chéene, director of the acoustics program at Colum-bia College, students helped the city survey residents and collect daytime and nighttime background sound levels in areas where noise complaints had been issued.
Using these background levels for calibration, Chéene and his students created a noise map of the Highway 2 corridor.5 The map reflects daytime and nighttime noise levels with and without certain road improvements. With this information, the city was given the ability to consider the potential effectiveness of noise barriers, limits to truck traffic, and pavement resurfacing as options to reduce highway noise.
Chittenden County Noise MapThe Chittenden County noise map was created by noise and
Figure 3. Chittenden County noise map showing traffic and rail daytime sound levels; cut-away shows sound levels at homes and apartments in city of Bur-lington, VT.
. . . communities, towns and cities need to bet-ter understand noise within their boundaries.
Complaints often confound development efforts or force unplanned and unbudgeted mitigation efforts. Noise mapping offers local administra-tors and politicians a way to proactively moni-
tor and manage noise in their communities.

www.SandV.com16 SOUND AND VIBRATION/SEPTEMBER 2007
transportation engineers at Resource Systems Group Inc. (RSG), a consulting firm headquartered in White River Junction, VT.
The RSG noise mapping effort closely parallels efforts in Europe in that it was interested in presenting a geographic view of noise levels across the county and areas of annoying or harmful noise, in particular. RSG began its noise mapping process by collecting all the necessary transportation and spatial information.
Transportation demand model data. Vehicle and roadway data were obtained via the regional travel demand model. The Chittenden County Metropolitan Planning Organization (MPO) maintains this transportation demand model to help it understand the impact of land use changes and its transportation plan. Other MPOs maintain these models in response to transportation con-formity provisions of the Clean Air Act and Titles 23 and 40 of the U.S. Code. These provisions require all U.S. MPOs not meeting air quality standards to estimate the air pollution impact of proposed major transportation projects. MPOs must estimate the average daily traffic on the regional roadway system and the total vehicle miles traveled. Most state agencies and MPOs charged with this responsibility use transportation demand models. These models typically include all of the major collectors, arterials and freeways in the area. Each of these roadways has data including, but not lim-ited to, speed limits, actual travel speeds, traffic volumes (hourly or daily) and capacity.
Transportation demand models represent roadways with links and nodes. Links represent roadway segments and nodes represent intersections or changes of direction in a roadway. Each link of a transportation demand model carries a database that includes the basic components for determining noise emissions along the segment: geometric information, average travel speed, design hour or average daily traffic volume and type of roadway (collector,
Figure 4. Noise map (a) of Burlington, VT, with composite image (b) from Google Earth.
Figure 5. (a) 3-D street view from CadnaA and (b) composite image of same scene showing color-coded noise levels – Bank Street, city of Burlington, VT.
arterial, ramp, freeway, etc.). The only remaining piece of critical information for a noise
emission estimate is the vehicle mix (percent cars and trucks). In this case, a fixed vehicle mix is assumed. However, vehicle mix can be determined through classification counts or using defaults such as those in the German RLS-90 standard.
Spatial Information. Once vehicle and roadway data were obtained from the transportation demand model, RSG quantified spatial parameters affecting noise propagation and identified re-ceiver locations. These included:
Household Location. For Chittenden County, VT, a dataset of 45,221 residences was obtained from the State of Vermont E-911 program. Every building in Vermont is coded with its UTM (Universal Transverse Mercator) coordinates and characterized as

www.SandV.com SOUND AND VIBRATION/SEPTEMER 2007 17
residential, commercial, industrial, etc. These data were pro-vided by the Vermont Center for Geographic Information in an ESRI (Environmental Systems Research Institute) shapefile format.
Terrain. Terrain can significantly affect propagation of sound from roadways. For the purposes of this project, contour lines were created from U.S. Geologic Survey 30-meter digital elevation models. The Golden Software Surfer program was used to convert the 30-meter elevation points to contour lines within the extent of 16, 7.5-minute quadrangles.
Orthophotography. Aerial photography was obtained from sev-eral sources. For the more rural areas, relatively low-resolution maps from the Microsoft/USGS Terraserver were obtained. For the densely populated areas around Burlington, higher resolution orthophotos were obtained from the Vermont Mapping Program.
Land Cover. Land cover, such as dense forest and buildings, can also affect sound propagation. For this project, forest cover was ignored, since the greatest impacts tended to occur close to the road-way. For most homes, there would be little dense foliage between it and the nearest roadway. Dense building cover was determined using aerial photography and digitized using ArcGIS.
Building Outlines. For portions of downtown Burlington, out-lines of buildings were obtained from a CAD file maintained by the city.
Data from the sources just described were imported into the CadnaA sound propagation model. A 50-meter grid of receivers was developed to cover the 1,409 square kilometers of the county for a total of about 560,000 receivers. The model was set up to use the German RLS-90 standard for calculating Ld and Ln from roadways. That is, it used defaults for German vehicle mixes, vehicle sound emissions, and propagation algorithm.
Model CalibrationTo calibrate the model, RSG chose 17 locations throughout the
county. Both short- and long-term monitors were used. In the case of short-term monitoring, results were adjusted to a full day using the time-of-day variations found in the long-term stations. Ideally, more long-term stations would have been used, but for the purpose of this study, the number appeared adequate.
The calibration revealed a mean error of +2.1 dB with a stan-dard deviation of 4.3 dB (Figure 2). The 50th percentile error was +1.1 dB. While the overall error rate was good, there were three outliers where the model over-predicted the actual sound levels by 7 dB or more.
Model ResultsOnce calibration was complete, the model was run for daytime
and nighttime sound levels. Next, the results were loaded into ArcGIS along with the location of each residence from the E-911 database. The homes were then color coded based on their traffic noise level and overlaid onto aerial photos of each town and city (Figure 3).
Overall, 20% of the residences were found to exceed a daytime LAeq(16) of 55 dB, which the WHO characterizes as representing a “significant annoyance,” and 30% of the residences were found to exceed 45 dB LAeq(8) at night, which the WHO says could po-tentially create sleep disturbance.
Note that Burlington is a city of 38,532 people (2005 estimate) and much less densely populated than most urban/suburban ar-eas. Chittenden County, even with the inclusion of Burlington, is considered a rural county.
Presentation of Noise Map DataOne nice feature of noise mapping software like CadnaA is that it
not only accepts many different data formats for import, but it can also export graphics and model features in many different formats. The exported results and components of a noise map can then be used by other software packages to present the data in useful and
interesting ways. Google Earth, from the ubiquitous web portal and search site,
is a recently released software package with very vivid graphic capabilities that allows users to view and present geographic information. To demonstrate possible integration of noise maps with other software, RSG imported the Chittenden County Map into Google Earth Pro (Figure 4). The CadnaA map results were exported in ESRI shapefile polyline format, and then the polylines were imported into Google Earth Pro.
Noise mapping in CadnaA can also be viewed in three dimen-sions. With standard digital photographs and the 3-D noise map-ping views from CadnaA, noise data can be presented in great detail for localized areas. Figure 5 was created with two images: a photograph that was taken in downtown Burlington and a “3-D special” view from CadnaA. In the 3-D special view, CadnaA shows the terrain, the noise map on the ground, the geometry of the build-ings, and the noise map on the building facades. The photograph and the 3-D special image were then aligned and merged into one image in photo-editing software.
CadnaA can also model sound levels in the X-Z plane. This is demonstrated by a cross-section of the same street in Burlington shown in Figure 6. Note the outline of the buildings and the “hot spots” along the road centerlines.
ConclusionsThe RSG experience in Chittenden County demonstrates how
easy it is for the majority of MPOs to access the data required for noise mapping. With transportation models required by the Federal Highway Administration in hand, noise maps can be generated using programs like CadnaA. Other nontraffic data, like building density parameters or actual buildings, can be added to ensure that the map reflects actual, experienced noise levels.
Given their access to necessary transportation data and the availability of GIS-based tools like CadnaA and ArcGIS, it is fairly easy for MPOs or local governments to understand how noise is currently impacting residents and how noise levels will increase with development or decrease with mitigation efforts.
With noise complaints increasing in communities, towns and cities need to better understand noise within their boundaries. Complaints often confound development efforts or force unplanned and unbudgeted mitigation efforts. Noise mapping offers local administrators and politicians a way to proactively monitor and manage noise in their communities.
AcknowledgementsOur thanks go to Resource Systems Group, Inc. and Scantek
Inc. for providing funds for this project. Scantek Inc. supplied the sound level monitoring equipment and CadnaA model used in the study. This project would not have been possible without the data provided by the Chittenden County Metropolitan Plan-ning Organization, Vermont Center for Geographic Information, Microsoft/USGS Terraserver and Vermont Mapping Program. Also, thanks go to Kevin Hathaway for help with calibration monitor-ing and graphics, Karen Kaliski and Audrey Spitz with editorial assistance and John Hinckley with GIS.
References1. Guidelines for Community Noise, World Health Organization, 1999.2. Guidelines for Community Noise, Table 4-1, World Health Organization,
1994.3. Occupational and Community Noise, World Health Organization, Fact
Sheet No. 258, February 2001.4. “Directive 2002/49/EC of the European Parliament and of the Council of 25
June 2002 Relating to the Assessment and Management of Environmental Noise,” Official Journal of the European Communities, July 18, 2002.
5. “An Investigation of the Nebraska Highway 2 Noise Levels,” Department of Audio Arts and Acoustics, Columbia College, Chicago, 2006.
The authors can be reached at: [email protected].
Figure 6. Cross-sectional view of Bank Street, City of Burlington, VT, with color-coded sound contours.