community garden report
TRANSCRIPT

In the summer of 2016, I received the John Donahue
Social Justice Grant through the Department of Sociology and
Anthropology at Trinity University. This grant is a self-directed,
independent summer-long research opportunity. It is with great
appreciation and gratitude that I have conducted this research, and I
would like to thank John Donahue, an anthropology professor at
Trinity University who himself worked in the social justice field
until his death in 2014. I hope that I am able to honor his memory
with my work.
Additional special acknowledgement and thanks to Dr.
Jennifer Mathews, Michelle Gorham at Green Spaces Alliance, the
stewards and members of the case-study community gardens, and
anyone else who aided my research. Your guidance, support, and
contributions are immensely appreciated.

2


The City of San Antonio defines a food desert as “[a]n area of the
community where low-income residents are more than 1 mile from a full-service grocery
store, supermarket, farmer’s market, or other healthy food outlet”. Although I originally
used this definition to guide this research, the one set by the United States Department of
Agriculture (USDA), appears to be more specific in what it considered a food desert, thus
increasing the number of areas in San Antonio that are could be food deserts. Their
definition of food desert is “a low-income census tract where a substantial number or share
of residents has low access to a supermarket or large grocery store”. The USDA continues
the definition by defining what low-income census tracts are: “any census tract where (1)
the poverty rate for that tract is at least 20 percent, or (2) for tracts not located within a
metropolitan area, the median family income for the tract does not exceed 80 percent of
statewide median family income; or for tracts located within a Metropolitan area, the
median family income for the tract does not exceed 80 percent of the greater of statewide
median family income or the metropolitan area median family income”6 and then defines
what low-access is: “more than 1 mile from a supermarket or large grocery store in urban
areas and as more than 10 miles from a supermarket or large grocery store in rural areas”7.
The primary distinction between the City of San Antonio’s definition and the
USDA’s definition of a food desert is that it states that a resident needs to be within one mile
of a supermarket or large grocery store, whereas San Antonio states that a resident needs to
be within one mile of “a full-service grocery store, supermarket, farmer’s market, or other
healthy food outlet”8. On one hand, this definition illustrates San Antonio’s effort to include
less traditional outlets like farmers markets and forms of urban agriculture. However, on the
4

other hand, a farmer’s market like the Pearl Farmers Market in the 78215 zip code does not
have the offerings of a full-service grocery store (it does not carry staples like toilet papers or
dish soap) and the prices of goods sold may be beyond the financial means of people living in
a community. For example, one San Antonio resident interviewed this summer whose income
range was much higher than that of the median income of San Antonio said that they could
not afford to use the Pearl Farmers Market as their primary source of food (C. Lewis, personal
communication, June 10, 2016). This would imply that it is highly unlikely that an individual
or household earning far below the median income for San Antonio could afford to use the
farmers market as a primary food source.
4

For this research project, I selected five community
gardens for study, based on the following criteria: each garden has to
be at least three years old, located in or near a residential area, have
some degree of vegetable production present, and located in a food
desert. In other words, I wanted to be sure that the community
gardens was established part of its respective neighborhood, and it
was situated in a residential context so that the community members
had the potential to harvest food crops from their community garden.
The methods I used involved both quantitative and qualitative data,
and included surveys and interviews, as well as included GIS and
graphic charts for visually representing my findings. The five chosen
case-study community gardens are: Beacon Hill Community Garden,
The Eastside Sprout, Gardens of St. Therese, Roots of Change, and
Southtown Community Garden.

Figure 1: Above are the origin years for the case-study
community gardens, their census tracts, the populations of those
census tracts, and the quantity of Significant Food Points (SFP)
within those census tracts.
6

Figure 2: Above are the demographic breakdowns for
each community garden using census tracts. The demographics
included are ethnicity, median income, and employment status.
7

During the course of this research, I created four types of surveys for the
different stakeholders in each of the selected communities: stewards, members,
neighborhood, and general. (The only difference between the neighborhood and general
survey is the location of a participant's residence. If the residence was in one of the case-
study garden neighborhoods, their survey would be classified as ‘neighborhood’.) Each
survey is intended to examine the relationship between people and their food, whether that
relationship changes when people interact with community gardens, and the satisfaction
with that current relationship, plus preferences with future relationships with food
obtainment. It also aimed to collect information about demographics - ethnicity/race,
median household income range, age range, employment status, and educational attainment
- and transportation used. In addition, the stewards' survey also collected information about
garden set-up and management.
Each garden has one or two garden stewards. For each of those gardens, I
attempted to interview and survey all stewards, and at least five garden members.
Unfortunately, I was unable to contact any Southtown garden members, even after attending
three Southtown garden workdays and I, despite several attempts, unable to obtain a survey
from the Gardens of St. Therese steward. Additionally, I attempted to obtain at least ten
‘neighborhood’ surveys from the case-study gardens neighborhoods by distributing flyers
with links to the web-based survey in cafes, restaurants, cultural and civic centers, and
churches. The flyers were both in English and Spanish, as were the ‘neighborhood’ and
‘general’ surveys. I distributed links to the web-based ‘general’ surveys through the
professional networks I had access to, with the aim to collect as many submissions as I
8

could. The deadline for all data collection was August 3rd, 2016.
8

I started by geocoding significant food points: including community gardens, grocery stores, farmers markets, corner stores, and food pantries. This meant cross referencing Google Maps, Yelp, individual websites, corporate websites, and Facebook in order to get accurate listings and creating spreadsheets with the name of the entity, the address, and the type of SPF. I would like to note that I only listed community gardens associated with Green Spaces Alliance as they have the most comprehensive list of gardens due to their partnerships with them, and this also may mean some gardens may have been missed. Additionally, I may have missed some places, especially corners stores, with little to no online presence. After that I imported the addresses (geocoding) into a GIS map and superimposed the points over a shapefile of the Bexar County line and Bexar County streets (note: I only used SPFs within San Antonio city limits). The purpose of creating maps with SFPs is to visually illustrate the concertation and distributions of these points of interest, as well as to draw attention to areas of San Antonio that lack them.
9

Figure 3: Above is a food desert map provided by the
City of San Antonio and used SA Tomorrow, the city’s
sustainability plan, that illustrates the percentage of populations
who are low income and live at least a half mile from a
supermarket by census tract.
Each of the case-study community gardens are located
in census tracts where 50-75% of the population is at least half a
mile from a supermarket.
10

Figure 4a and 4b: These are the maps showing the
distributions and concentration of grocery stores and corner store in
San Antonio. Notable, areas on the east-side and west-side lack both.
11

Figure 5a and 5b: These are the maps showing the
distributions and concentration of farmers markets and community
gardens in San Antonio. Most of the west-side lack either.
12

Figure 6: These are the maps showing the distributions
and concentrations of food pantries in San Antonio.
13

Figure 7: The above map shows the geographic
distribution of survey respondents. There are concentrated clusters of
respondents in the areas of the case-study community gardens, and
the vast majority of respondents reside within the 410 Loop.
14

Figure 8: Ethnicity and race by all respondents, steward and member respondents, neighborhood and general respondents, and San Antonio 2013 census data.
Figure 8 shows the demographic information that I’ve collected from the surveys I administered. They are divided into three main groups: all respondents, stewards and members (people who interact with community gardens), and neighborhood and general (people who may or may not live near one of the case-study gardens). General San Antonio demographic data is included when relevant and available.
Latinos make up ~63% of the San Antonio’s population, but only ~37% of all respondents were Latino, and while ~26% of San Antonio's population is White, ~49% of all respondents were White. This illustrates an underrepresentation of Latino populations and an over-representation of White populations in my survey date. Black and Asian groups are also underrepresented. Of those two groups, the underrepresentation of Black populations is especially problematic when considering that two of the case-study gardens are located on the east-side, a part of San Antonio that has historically had large concentration of Black residents. The underrepresentation of minority groups could result in certain culturally-specific views and perspectives being overlooked, such as the importance of culturally significant crops or planting methods.
15
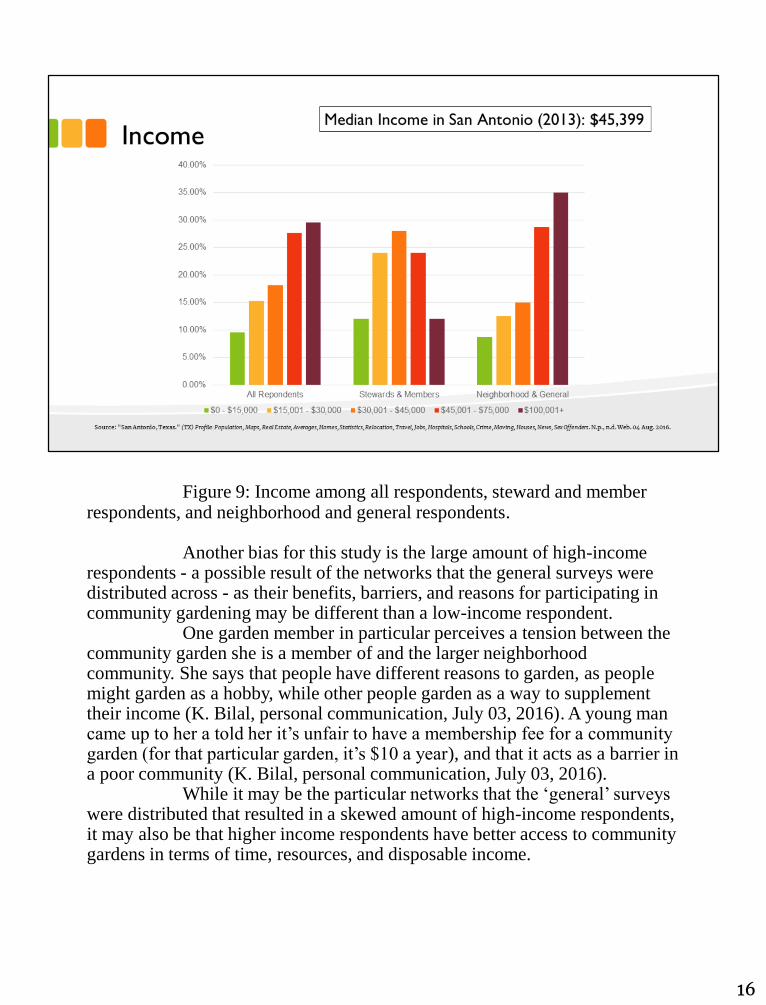
Figure 9: Income among all respondents, steward and member respondents, and neighborhood and general respondents.
Another bias for this study is the large amount of high-income respondents - a possible result of the networks that the general surveys were distributed across - as their benefits, barriers, and reasons for participating in community gardening may be different than a low-income respondent.
One garden member in particular perceives a tension between the community garden she is a member of and the larger neighborhood community. She says that people have different reasons to garden, as people might garden as a hobby, while other people garden as a way to supplement their income (K. Bilal, personal communication, July 03, 2016). A young man came up to her a told her it’s unfair to have a membership fee for a community garden (for that particular garden, it’s $10 a year), and that it acts as a barrier in a poor community (K. Bilal, personal communication, July 03, 2016).
While it may be the particular networks that the ‘general’ surveys were distributed that resulted in a skewed amount of high-income respondents, it may also be that higher income respondents have better access to community gardens in terms of time, resources, and disposable income.
16

Figure 10: Employment status among all respondents, stewards and members, and neighborhood and general.
There is a notable difference between the percentage of retirees among the two groups. This may be that retirees are more likely to have the time needed to invest in being community garden stewards and thus more likely to take on the role. This lines up with two of the main reasons people provided for not being involved with community gardens: time commitments for jobs and families. Several garden member families I interviewed mentioned that having children put a strain on their ability to participate in their community gardens. In those cases, either the families brought their children with them to the garden and were unable to get as much work done or waited for their children to become older, only occasionally visiting the garden (C. Zeluff, personal communication, June 23, 2016 and S. Castro, personal communication, June 24, 2016.)
17

Figure 11: Current primary food outlets and ideal primary food outlets.
In the surveys, the respondents were asked where they currently get their food products and where they ideally would get their food products. Both groups primarily obtain food products from grocery stores. ‘Steward’ and ‘member’ respondents have slightly more diversity in where they obtain their food products, as they are more likely to obtain their food from community gardens and farmers markets than ‘neighborhood’ and ‘general’ respondents. However, when asking the respondents where they ideally would meet their food needs, the responses were much more diverse, with farmers markets being the most desired food outlet from both groups.
Someone said, "The need [for fresh food] is there, but the demand isn't." I disagree, the demand appears to be present, however people are unable to shop at their preferred outlet due to expense, convenience, and availability.
18
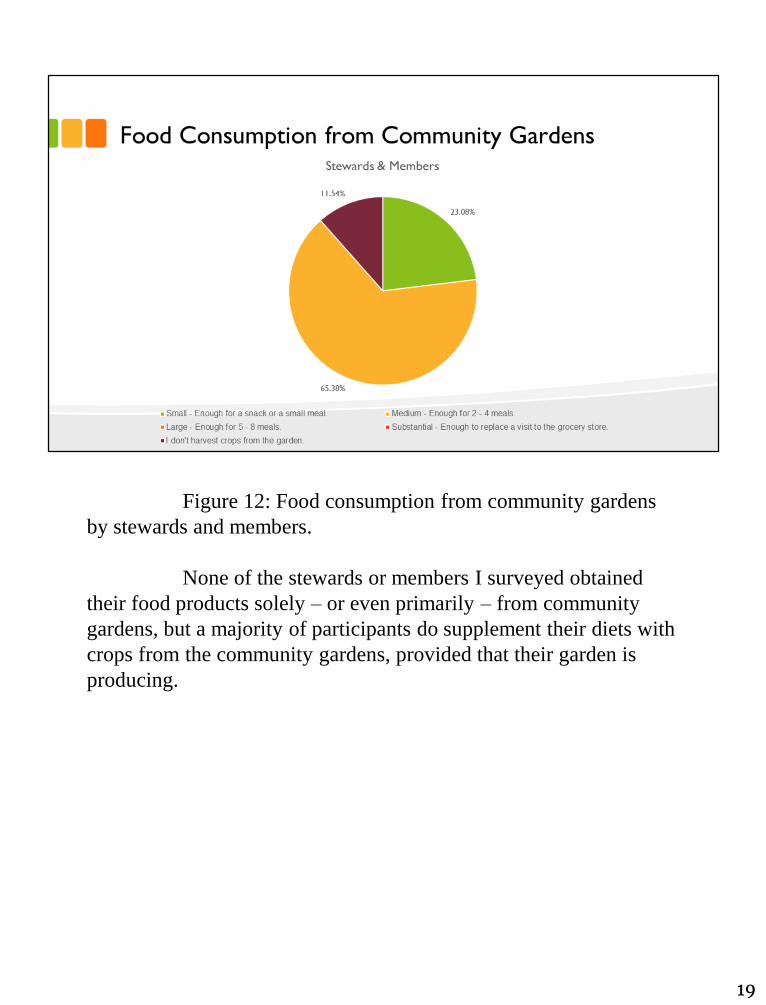
Figure 12: Food consumption from community gardens
by stewards and members.
None of the stewards or members I surveyed obtained
their food products solely – or even primarily – from community
gardens, but a majority of participants do supplement their diets with
crops from the community gardens, provided that their garden is
producing.
19

Figure 13: Percentage of different transportation means to
grocery store by general and neighborhood respondents and by
steward and member respondents. Transportation to farmers markets
by general and neighborhood respondents and by steward and
member respondents.
While, the use of automobiles overwhelmingly takes up
shares as transportation to grocery stores, there appears to be a more
diverse use of transportation when traveling to farmers markets,
especially in the ‘steward and member’ category. Stewards and
members may be, on average, closer to the farmers market they
frequent, however, since the majority of stewards and members bike
or walk to their respective community garden, it may also influence
how they travel to farmers markets.
20

Figure 14: Transportation taken to community gardens by
stewards and members.
The majority of stewards and members (60%) either walk
or bike to their community gardens. Hauling tools and equipment
was often cited as a reason for driving a car. See prior slide for
comparison data.
21

Figure 15: Current community garden use and wanted community garden use by neighborhood and general respondents.
When asked how people use community gardens in their area, almost 30% of respondents said that they don’t use a community garden in their area (see also: Top Benefits and Barriers). The percentage decreases to about 3% when people are asked how they would want to use a community garden in their area, illustrating a disparity between people’s current relationships with community gardens and their desired relationships with community gardens. Additionally, the use of food source in community gardens increases from about 12% to 30%, while the use of community gardens as a social/community space increases from 18.75% to almost 28%, showing an interest in using community gardens more, especially in terms of as a food source.
22

Figure 16: Percentage of willingness to walk to a grocery
store by general and neighborhood respondents and by member
respondents.
About 30% of ‘general and neighborhood’ respondents
would walk 1 mile to grocery stores, while over 50% of members
would walk the same distance. The one mile category shows the
biggest difference between the two groups, as the distance decreases,
the willingness of both groups to walk to the grocery store increases,
and at ¼ a mile, about 90% of both groups would walk.
The reasons for not walking, can be categorized into the
following reasons: heat, inconvenience (such as having children
present or the weight of having to carry groceries), age or disability,
and safety (such as traffic or fear of stray dogs).
23

Figure 17: The satisfaction of distance, transport, travel
time, and level of fresh, affordable produce of primary food outlet by
steward and member respondents and by neighborhood and general
respondents.
Garden stewards and members consistently rate less
satisfaction than ‘neighborhood and general’ respondents with
regards to distance, transport, travel time, and the level of fresh,
affordable produce available. This may be skewed due to the higher
income range (see: Income) in the ‘neighborhood and general’
category, as a higher income would increase resources available and
the means to obtain them.
24

Figure 18: Benefits of community gardens.
One study10 accumulated benefits of community gardens
from a number of sources and created a chart listing them. While this
is not an exhaustive list, it does hit many of the benefits commonly
discussed about community gardens. Most of the benefits disused in
this research fall into the social and health category.
25

Figure 19: More commonly chosen benefits of community gardens by stewards and member respondents and most commonly chosen barriers of community gardens by general and neighborhood respondents.
In both the ‘steward’ and ‘member’ interviews, there was a question that asked about the specific list of benefits of community gardening. The respondents were asked to choose any benefits that applied to them. The list of benefits was not exhaustive. The question was pulled from a Green Spaces Alliance annual survey and altered for the purposes of this research.
In the ‘neighborhood’ and ‘general’ surveys, respondents were asked about potential barriers that prevented them from engaging in community gardens. They choose from a list of the barriers that might apply, as well as being able to utilize a free-response answer that allowed each respondent to further explain or input a barrier that may be absent on the list. While many of the “general’ survey respondents were already involved with community gardens in some capacity (leading to another possible bias in the data collection), a large portion of respondents weren’t involved. Their responses were collected and generated into the list above.
Each list has the top five most frequently cited benefits and barriers, in descending order.
26

Figure 20: Visualization of core benefits and core
barriers associated with community gardens.
Through the surveys and interviews, I was able to
discern three ‘core’ benefits as to why people participate in
community gardening and three ‘core’ barriers as to why there is
a lack of participation in community gardening. In other
scholarly sources11,12,13, such as the ‘benefits chart’ two slides
before, researchers have found the same – or similar – benefits
and barriers.
27

Figure 21: Quotes pertaining to a core barrier, inclusion, by stewards and member respondents and by neighborhood and general respondents.
In a study conducted in Baltimore, Maryland, “one gardener discussed how most of the community garden participants are White, even though the neighborhood is predominantly Black. She said, “Personally, I would rather the demographics [of the garden] reflect the demographics in the neighborhood””14. The same sentiment is found through the data collected for this study. More often than not, the demographics of the community gardens did not reflect the demographics of the neighborhoods. For example, 48.28% of ‘steward’ and ‘member’ respondents were Latino, although every case-study neighborhood has a Latino population of at least 75% (see: Ethnicity and Race). A similar trend occurred with income, where a majority of ‘steward’ and ‘member’ respondents made above the median household income for their neighborhoods (see: Income).
28

Figure 22: Quotes pertaining to a core barrier, physicalenvironment, by stewards and member respondents and by neighborhood and general respondents.
In addition to these comments of being unable to be self-sufficient, of a lack of local farms and famers, of sprawl and location dictating if someone has access to fresh food, people also mentioned their lack of safety while walking and biking. One garden member at the Gardens of St. Therese said even though she lives close to the garden, she is too afraid to walk because of the packs of semi-feral dogs that roam the area, adding that if she were younger, she might, but because of her age, she worries that she wouldn’t be able to get away from them, should they chase her (A. Unknown, personal communication, July 09, 2016.).
I experienced this worry first-hand while distributing survey flyers to houses in the Woodlawn and Dignowity Hill neighborhoods. Often, I saw dogs running around in the streets, in addition to being chained outside in the front lawn and usually barking and growling aggressively while I walked by. People often put their dogs in their front lawn in an effort to increase the security of their homes, but it also makes walking in those particular neighborhoods – and neighborhoods similar to them – unpleasant and potentially dangerous.
29

Figure 23: Quotes pertaining to a core barrier, access, by
stewards and member respondents and by neighborhood and general
respondents.
According to the respondents, access to community
gardens was just as often about cultural perspectives and education
as it was about proximity.
30

Figure 24: Proposals and their relationships to core benefits and barriers.
The City of San Antonio is taking action to make the city more sustainable and open to different food systems. For example, the city recently “approved amendments to the City’s Unified Development Code” in December of 2015 that allowed “gardeners [to] grow food in most lots and sell produce right at their garden or farm”15. Additionally, the San Antonio Food Policy Council recently “endorse[d] the proposed Food System Strategies for the Sustainability Plan as part of the comprehensive planning process for SA Tomorrow”16. FS2 – Assistance programs at farmers markets and FS7 – Expand number and frequency of farmers markets particularly align with the data collected surrounding people’s “ideal” food outlets and the reasons they are unable to obtain them (see: Community Garden Uses) .
These additional proposals address the concerns that people stated in their interviews and surveys. Each proposal focuses on one barrier to participating in community gardens while utilizing two benefits.
31

Figure 25: Key elements of proposals.
Based on the data from the survey respondents, I have formulated potential
proposals for lessening the barriers – and therefore improving participation – in community
gardens. The proposals are aimed at the citizen interaction with community gardens and not
necessarily the food production of suppliers. These proposals are not in and of themselves
‘cures’ to food deserts, but potential ways at lessening the stresses they cause. These
proposals are meant to be utilized in conjunction with other proposals that effect other parts
of the food system chain, such as the Health Corner Store Initiative17.
Open-Access Database: One steward said that it is would be a lot easier to
host educational events if there were pre-made curriculums (C. Lewis, personal
communication, June 10, 2016.). Several members stated that it can be overwhelming to
jump into gardening, especially if you have no prior knowledge of how to garden in South
Texas (L. Heger, personal communication, June 28, 2016). The open-access database would
be accessible online and free for anyone to use. It would be curated – by the entity that
housed the database – and updated for best practices, anything from water conservation to
garden bed preparation to organizational techniques to educational curriculums.
Additionally, members of the public would be able to submit to the database such as
gardening knowledge, recipes, remedies, anything that would pertain to the creation,
upkeep, benefit, and maintenance of a community garden.
City Policy: Respondents said that it is difficult to walk in San Antonio,
especially on the west-side and on the east-side, due to lack of sidewalks, lack of bike lanes
- especially protected bike lanes -, and fear of safety. The policy changes address those
32

concerns. San Antonio “largely used [a] "if you want it, pay for it" infrastructure model up to
the 1970s”, meaning that “construct[ing] sidewalks was a decision left to individual property
owners” and often people opted out because of the expenses18. Due to that model, the city has
been playing catch up ever since. Putting in sidewalks is costly, but so is the increased
automobile use, decreased air quality that comes from heavy automobile use, decreased
pedestrian safety, decreased mobility, and decreased standard of living that come from a lack
of sidewalks and bike lanes. The city is trying to help this situation, like allocating $15
million in the 2016 fiscal budget to build 31 miles of new sidewalks, but considering the city
lacks “almost 2,500 miles” of sidewalks19, and considering the consistently high demand
from citizens, it’s not enough. Additionally, while walking in some of the west-side and east-
side neighborhoods, it was noticeably hotter because of the a lack of shade trees that other
neighborhoods – often wealthier neighborhoods – had. Helping to reduce the heat island
effect in these areas by planting shade trees, and making it more tolerable to be outside,
would also most likely increase people’s willingness to walk and bike.
Youth Summer Program: While there are existing youth garden programs in
San Antonio, this program would be free, operate during the majority of the summer, be
neighborhood-based, and have an environmental and social justice focus. Students would
have hands-on experience learning about the different aspects of gardening (such as
seasonality, composting, soil care, mulching, planting, weeding, landscape design, etc), urban
farming/agriculture/food systems, ecology, environmentalism/conservation, social
justice/food sovereignty movements, food cultures and cooking, GMOs, sustainability,
resource use and management, water conservation, permaculture, garden wildlife,, nutrition,
art, etc. They would also gain skills such as gardening and garden design, flora and fauna
identification, potential job training, cooking, and construction. This could be a way to
introduce the next generation to urban agriculture, introducing them to farming as a possible
– and viable – career. Additionally, by having the program neighborhood-based, located at a
community garden within that neighborhood, it would possibly help build up community
bonds within that neighborhood and increase participation at that community garden, as well
as encouraging inter-generational knowledge exchange between children and their parents.
32

Figure 26: Photos of community gardens and stewards and members. Photos
taken by Briauna Barrera.
Based on the data collected and analyzed during this research, I conclude
that community gardens do affect the relationship people have with their food systems in
that people involved in gardens appeared to have a more diverse array of food outlets.
However, a study with a larger sample size of respondents, especially from the
‘neighborhood’ category, is needed to better understand that change in relationship.
Additionally, in order to increase the participation in community gardens, action is required
to address the core barriers preventing people from doing so, whether through proposals
such as the ones I’ve suggested or initiatives similar to the San Antonio Food Policy
Council food strategy endorsements.
Challenges faced during this study included: not being able to speak Spanish
and missing access to a key demographic population because of it, feeling the potential
danger in distributing survey flyers in neighborhoods alone, not having any formal training
in survey creation, not obtaining demographic information that would have aided this
research (such as gender and educational attainment), and not having a more structured
form for interviews in order to obtain more consistent data.
However, having had the opportunity to talk to lots of diverse people about
their experiences with community gardens and how they interact with their food systems
has given way to new and more profound insights into this complex subject. There is not a
single reason people are drawn to community gardening, however, I did observe a few key
33

similarities between garden members and stewards as a whole. Oftentimes there was a
palpable frustration among them at their lack of resources or time or ability to dedicate to
their community gardens. The thing about community gardens is that they take a community
in order to flourish and oftentimes a community was found to be lacking. However, they are
also passionate people who care about their communities and the city they are apart of. They
participate not only for the individuals benefits that a garden provides, but also because they
seek to change San Antonio for the better. As one member said, “All my neighbors are doing
meaningful things.” From what I’ve seen and heard, I believe this to be very much true.
33

34