community potential for shared solar development in india
TRANSCRIPT
The Pennsylvania State University
The Graduate School
Department of Energy & Mineral Engineering
COMMUNITY POTENTIAL FOR SHARED SOLAR DEVELOPMENT IN INDIA
A Thesis in
Energy & Mineral Engineering
by
Balaji Raman
Submitted in Partial Fulfillment
of the Requirements
for the Degree of
Master of Science
May 2016

ii
The thesis of Balaji Raman was reviewed and approved* by the following:
Jeffrey R. S. Brownson
Associate Professor of Energy & Mineral Engineering
Solar Option Lead: iMPS Renewable Energy & Sustainability Systems
Thesis Advisor
Andrew N. Kleit
Professor of Energy & Environmental Economics
Chiara Lo Prete
Assistant Professor of Energy Economics
Luis F. Ayala H.
Professor of Petroleum & Natural Gas Engineering
Associate Department Head for Graduate Education
*Signatures are on file in the Graduate School

iii
ABSTRACT
Community shared solar can offer feasible solutions for both rural electrification problems and
integrated development in emerging economies like India. In order to study the suitability of
communities to successfully host and manage a shared solar farm, the socioeconomic
characteristics of locations have been assessed in terms of the community’s (i) organizational
capabilities, (ii) financial capabilities and (iii) solar resource. India Human Development Survey
dataset was used to extract information the characteristics of different communities related to
organizational abilities. Data on financial access in rural areas was used to assess the suitability of
communities to host and manage a community based solar farm. The average annual solar resource
in India shows the technical feasibility of hosting a solar farm across different locations in India.
This study outlines the importance of the three aforementioned capabilities in successfully
managing a community shared solar resource and presents the abilities of different locations across
India in this regard.

iv
TABLE OF CONTENTS
List of Figures ................................................................................................................................. v
List of Tables ........................................................................................................................ …….vi
Acknowledgements .................................................................................................................. …..vii
Chapter 1 Introduction ........................................................................................................ 1
Chapter 2 Rural Electrification & Community Driven Development ................................ 3
Rural Electrification & Importance of Energy Access in India .......................... 3
The Role of the Community: Importance of Collective Action, Social Capital in
Rural Development ......................................................................................................... 4
Chapter 3 The Idea of Community Solar ............................................................................ 8
Incentives of Community Ownership ................................................................. 8
Concept of Community Solar .............................................................................. 8
Models of Community Solar ............................................................................... 9
Successful Community Sourced Solar Projects ................................................ 12
Chapter 4 Overview of Research Approach ..................................................................... 16
Chapter 5 Organizational Abilities in a Community ........................................................ 19
Importance of Community Based Organizations .............................................. 19
Data on Community Based Organizations ........................................................ 20
What Do The Organizations Represent? ........................................................... 22
Factor Analysis to Obtain Information on Community Organizational
Capabilities .................................................................................................................... 24
Chapter 6 Financial Abilities of a Community ................................................................. 26
Microfinance as an Instrument for Enhancing Rural Financial Services .......... 27
How Can Microfinance Impact Rural Development? ....................................... 33
Examples of Successful Projects Which Have Used Microfinance to Support
Solar Power Deployment .............................................................................................. 35
Cataloguing Financial Capabilities ................................................................... 38
Chapter 7 Solar Resource in India .................................................................................... 41

v
Solar Resource Terminologies .......................................................................... 41
Solar Resource across India .............................................................................. 41
Assessing the Solar Resource in the Indian Peninsula ...................................... 43
Chapter 8 Results ……………………………………………………………………...45
The Underlying Ability of the Community to Organize ................................... 45
Penetration of Microfinance in India ................................................................ 49
Solar Resource Aspect in Community Solar Assessment ................................. 54
Chapter 9 Discussion ........................................................................................................ 56
Chapter 10 Conclusions .................................................................................................... 60
References ......................................................................................................................... 62
Appendix ........................................................................................................................... 66
Exploratory Factor Analysis ............................................................................. 66
Mathematical Model ......................................................................................... 69
Factor Loading Estimation ................................................................................ 73
Factor Scores ..................................................................................................... 78
Political Map of India with the States ............................................................... 82

vi
LIST OF FIGURES
Figure 7-1 Annual average global horizontal irradiance data for India, represented for
solar conditions from 2002-2011[76] ............................................................................... 43
Figure 8-1 (a): Map of locations of the communities under Levels 1; (b): is a heat map
showing the distribution of all the locations weighted using their corresponding
factor scores ..................................................................................................................... 49
Figure 8-2 Penetration of Microfinance in India [78] .............................................................. 50
Figure 8-3 Number of credit linked SHGs in Andhra Pradesh, Maharashtra, Kerala and
Haryana (2012) ................................................................................................................ 53
Figure 8-4 Histogram showing the number of Level 1, 2 and 3 locations in the range of
GHI values ....................................................................................................................... 54
Figure 9-1 Annual average global horizontal irradiance data for India, represented for
solar conditions from 2002-2011 [76] .............................................................................. 59
vii
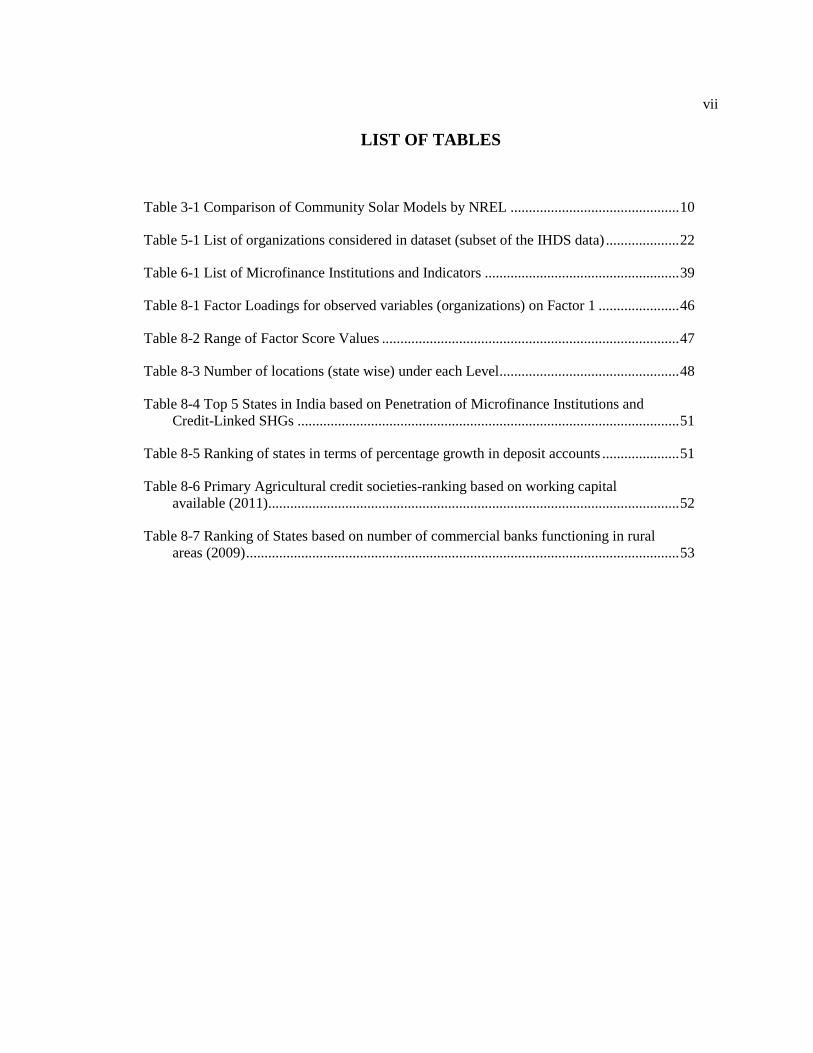
LIST OF TABLES
Table 3-1 Comparison of Community Solar Models by NREL .............................................. 10
Table 5-1 List of organizations considered in dataset (subset of the IHDS data) .................... 22
Table 6-1 List of Microfinance Institutions and Indicators ..................................................... 39
Table 8-1 Factor Loadings for observed variables (organizations) on Factor 1 ...................... 46
Table 8-2 Range of Factor Score Values ................................................................................. 47
Table 8-3 Number of locations (state wise) under each Level................................................. 48
Table 8-4 Top 5 States in India based on Penetration of Microfinance Institutions and
Credit-Linked SHGs ........................................................................................................ 51
Table 8-5 Ranking of states in terms of percentage growth in deposit accounts ..................... 51
Table 8-6 Primary Agricultural credit societies-ranking based on working capital
available (2011) ................................................................................................................ 52
Table 8-7 Ranking of States based on number of commercial banks functioning in rural
areas (2009) ...................................................................................................................... 53

viii
ACKNOWLEDGEMENTS
I would like to express my sincere gratitude to Dr. Jeffrey Brownson and Dr. Andrew Kleit for
their support during my time as a Masters’ student. Their guidance was invaluable in putting
together this study and also in writing this thesis. I would like to thank Dr. Chiara Lo Prete for
agreeing to be a part of my defense committee and for her inputs during the defense. Last but not
the least, I would like to thank my family and friends for their love and support throughout my
life.

1
Chapter 1 Introduction
Access to energy is regarded as one of the key factors in social and economic development. In the
context of developing economies like India, access to modern energy services like electricity is an
integral aspect of development. Integrated rural development takes a bottom up approach begins
at the base of the pyramid, which in this case are the villages. Community driven development
has been promoted by World Bank and United Nations as an important aspect of rural
development. The development process becomes a part of the community and their livelihood
ensuring their active involvement in the projects.
A majority of the rural households in India use bio-mass based fuels for cooking and
lighting. Apart from being inefficient, these pose various health and environmental hazards.
Providing access to energy has been included in the United Nation's Millennium Development
Goals. Electricity can substitute the fuels used for lighting while providing cleaner and reliable
lighting. Although, the Government of India has targeted rural electrification through multiple
schemes, the central grid does not cover the entire country. There is also the issue of providing
round the clock reliable power to villages. Distributed generation using renewable technology is a
viable option for providing reliable access to electricity. Micro and mini grids also offer
flexibility in terms of regulating and managing the power according to intermittency issues in the
renewable technology.
Community based solar projects can serve as rural electrification projects while actively
involving the community in development and management of the resource. Solar photovoltaic
technology has been shown to be a viable option for rural electrification in India. India also has a
history of collective action in forest and watershed management. However, community managed
solar projects are few and far between. A successful community solar project requires more than

2
good solar resource. It demands for a conducive environment where the community can cooperate
to work towards maximizing everyone’s benefit rather than the individual. The community must
have the capacity to regulate the use of the resource, ensure that the rules are followed and also
manage the finances of the resource system. Lack of knowledge about technology and education
in the rural areas discourages many developers to invest in such projects. However, it has been
shown that communities are more than capable of managing their own resources.
Often times, the suitability of the location to successfully host a community based project
is ignored. The assessment studies fail focus on the ability of the local population to engage in
collective action for management of the resource. While the capacity building process is targeted
towards bridging the technology gap, the importance of community characteristics and
capabilities are ignored. This study selected three underlying characteristics for community based
solar projects in villages across India, namely i) a community’s organizational capabilities, ii) a
community’s financial capabilities and iii) the local solar resource. By justifying the importance
of the abovementioned characteristics in developing community solar, the potential of
communities in India have been explored. The goal is to use the underlying characteristics as
yardsticks to assess the potential of different communities across India. This assessment will be
made based on data obtained for the three different underlying characteristics. The potential will
be a clear indicator of the suitability of the location to successfully host a community based
energy project. In this study, community is defined as a group of people living in geographic
proximity, as in the case of a village. Although this study looks at the potential for community
solar projects, no assumptions are made on the type of the solar technology that can be
implemented. Solar power in this case is purely treated as a resource which can be used as the
community sees fit.

3
Chapter 2 Rural Electrification & Community Driven Development
Rural Electrification & Importance of Energy Access in India
As of the year 2005, 412 million people in India did not have access to electricity. 92% of this
population was in rural India. [1] Rural electrification has been one of the top priorities for the
Indian and it has constantly rolled out numerous schemes and policies in this regard. Though
electricity is not the primary source of energy used in rural household activities in India, it is a
viable substitute for traditional lighting fuels. According to the Government of India, a village is
considered electrified, if 10% of the households in the village have electricity access and
electricity is provided to all the public spaces such as schools, health centers, community centers,
etc. [2] The Central Electricity Authority reports that only 9 out of the 29 states in India have
achieved 100% village electrification and 12 out the remaining 20 states have achieved between
90-99% village electrification. [3] Major reasons for a number of villages being unelectrified is
their remote location and the high cost of extending the grid to such locations. Hence, the
Government of India has started promoting distributed generation projects to provide access to
electricity in remote areas.
A number of the ‘electrified’ villages in India do not have 24 hour access to electricity or
have reliable power supply. Not one state in India can boast of 100% household electrification in
India. [3] Although, global level studies have not been able to unearth a causal relationship
between energy consumption and economic growth[4], there are community level studies that
have shown the positive impact of access to energy on rural development. [5] The Global Energy
Network Institute has shown that electricity consumption per capita has strong positive
correlations with social development indices like human development index, maternal mortality

4
rates, infant mortality rates, etc. [6] Studies have also shown that village level microgrids have
contributed to rural development in developing countries like Kenya. [7] These studies establish
the importance of access to electricity in improving the quality of life.
Due to the inability of the central grid to reach every part of the country, many avenues
open up for using renewable power as for rural electrification. Renewable power can be set up
independent of the grid and can be used as a distributed source targeting the needs of the local
community. Renewable power can not only be used to supply electricity to un-electrified villages,
but can also be considered as an option for providing supplemental power to villages that cannot
rely on the grid for reliable power supply round the clock. Studies have shown solar power to be a
viable option for decentralized power generation in India. Most of India has an annual global
solar radiation greater than 1900 kWh/m2/year. In comparison, Germany, which is one of the top
countries employing solar power successfully, the annual solar radiation ranges from 800
kWh/m2/year to 1200 kWh/m2/year. [8-16] The National Electricity Policy of India emphasizes
deployment of renewable power in locations where it is suitable and economical. [17] Renewable
energy is a viable option for distributed generation. Solar photovoltaics have been adapted
globally as well as in India for rural electrification. Electricity from solar photovoltaics can be
from a micro-grid, individual solar home systems, solar lanterns, etc. Photovoltaics have minimal
operational costs and can be set up in different ways according to the needs of the society. Solar
power is a feasible solution for distributed power generation in rural areas in India.
The Role of the Community: Importance of Collective Action, Social Capital in Rural
Development
Marshall[18] defined collective action as the action taken by a group in pursuit of
members’ perceived shared interests. This action can be taken by a group of people or an

5
organization acting on their behalf. Social capital is the structure of relationship between
individuals in a community that encourages productive activities. [19] In this context, social capital
indicates the strength of trust in the society. Social capital covers several aspects of community
strength like networks, group memberships, civic and public participation. Social capital can also
be interpreted as a common resource that enables access to social, economic and natural resources
for the entire community. [20] Social capital reduces the transaction costs of interacting with
members of the community and hence facilitates cooperative action. [21] Social capital is also
related to aspects of organizations like networks, rules and trust that facilitate collective action and
cooperation. [22] It is hypothesized that a community with high social capital will have a better
ability to manage a resource collectively. [23] The capacity of a community to cooperate is an
underlying ability of the community to create formal or informal frameworks to achieve collective
action. [24] The underlying ability can also be interpreted as a form of social capital, but of the
community and not an individual. The presence of community based organizations in the
community indicate high social capital among the community members and hence, higher
inclination to engage in collective action.
Examples in literature prove effectiveness of community driven development and focus on
community involvement in developmental projects across the world. Review of literature on
successful community sourced projects across the world point call attention to the following as
factors leading to success. Participatory governance, which entails the involvement of locals in the
decision making process has been shown to be a primary reason for success of many community
level projects. A study to assess the importance of institutions in a rural community, survey of
agricultural households in Kenya showed that using Producer Marketing Groups that are farmer
run organizations, the farmers in rural Kenya were able to overcome market imperfections and
facilitate access to new technology. In this case, the key factor in success was found to be
mobilizing the farmers and collective decision making. [25] Apart from involving the locals in
6
decision making, friendly policies from the government also boost the chances of success of
community development projects. In India, forest management has been carried out for decades
collectively by the community with assistance from the forest department. A study by the Center
for International Forestry Research showed that, for successful management of forest resources the
involvement of people, especially women and NGO organizations is necessary along with friendly
government policies backing the locals. A study in West Bengal showed that, involving women in
forest resources management led to more prudent use of resources and better prevention of
misappropriation of resources. This was attributed to the fact that more women were directly
involved in using the forest resources and contributing to household income compared to men .[26]
Involving the local community members in the day to day activities of the project also increase the
chances of success. This type of involvement is different from participatory governance in the
manner that the locals are actively involved in the daily operations. Being a direct beneficiary of
the project success, the community members have an incentive to work towards achieving the
project goals. The success of rural development projects have been shown to depend on the
involvement of locals and community based organizations in both the planning and the operational
aspect of the project.[27] Nepal is a prime example of where successful community based
management of natural resources led to a bylaw being passed for promotion of community based
organizations for rural electrification.[28] The examples from both India and Nepal show the
importance of local governance, involving the community in the project activities and the need for
backing from the government in success of community sourced projects. Re-iterating on the
importance of local involvement throughout the project, Wijayaratna points out that a bottom up
approach is required for integrated rural development. [29] A bottom up approach starts with
involving the members of the targeted community in every stage of the process. This aligns with
Ostrom’s principles of collective action, which calls for the involvement of the locals in
management of the resource. [30] Studies of watershed management projects have shown that

7
participation of the people is a significant indicator of success of the overall project [31] and social
capital has been shown as a significant determinant of participation and project effectiveness.[32]

8
Chapter 3 The Idea of Community Solar
Community renewable energy projects are renewable energy project which involve select
members of the community or the entire community in various stages of the project. The
members of the community are stakeholders in the project. The scope of community renewable
energy projects is very broad in terms of the level of involvement of the community members and
the various stages of the project at which they are involved. Community shared solar answers
rural electrification issues and also promotes community driven development.
Incentives of Community Ownership
The benefits of a community owned/managed energy project vary according to the stakes
of the community and its members in the project itself [33]. Some of the incentives are listed
below.
● Reliable power supply and steady electricity prices
● Local income and employment creation
● Local control in managing the project to suit the specific need of the community
● A channel of financial investment
Concept of Community Solar
‘Community Shared Solar’ is a solar electric power system that provides electricity or
financial benefits to multiple community members. Community scale renewable energy projects
hedge against increasing fuel costs, reduce carbon emissions and create jobs in the community.

9
[34] A community solar plant, also called a community solar garden, is defined as a solar array
with subscribers who share the benefits of the solar plant. It is a solar project with multiple
individual owners living in geographic proximity of the project and sharing the costs and benefits
of the project. [35] Community based solar, being a decentralized energy source; offers a solution
for rural electrification problems. The involvement of the community in the project ties in with
the bottom up approach targeting integrated development. It has been suggested that community
shared solar improves quality of life by bringing together residents on issues of sustainability of
development. Community solar projects also make the local community economically
competitive. [36] Community solar ties in both collective action and renewable energy. By
involving the local community, a community solar project takes the bottom up approach in rural
development. Based on how the project is structured, a community solar project can provide
electricity to the community and/or serve as an income generating entity in the community.
Models of Community Solar
The National Renewable Energy Lab [34] classifies community solar models into three
main categories. Table 3-1below distinguishes the salient features of each model.

10
Table 3-1 Comparison of Community Solar Models by NREL
Utility
Special Purpose Entity
(SPE) Non Profit
Owner Third Party or Utility Members of the special
purpose entity
Non-Profit
Organization
Financed By Utilities through
grants of subscriptions
Member investments
and incentives.
Sometimes it could be
state promoted grants
Member donations
and contributions
Host Utility or Third Party Third Party not for profit
organization as host
Subscriber
Subscribers/Customers
of the utility (Rate
Payers
Community investors Donors/members
Intent of the
subscriber
Offset (Save) personal
electricity use
Return on investment (
in some cases it can be
to offset personal
electricity use)
Philanthropy or tax
benefits from
charitable donations
Long Term
Strategy
The utility aims to
offer its customers a
solar power option,
thereby meeting
renewable portfolio
standards
The SPE either sells
system to the host after
a certain period or
retains the system to
make money off the
generated electricity
Retain the system for
electricity production
Utility Sponsored Model
In this model, the project is owned and/or by a utility but the project is open to ratepayer
subscription. The utility funds the project either by itself or using grants or by having a
subscription fee. The customers of the utility then buy into the solar plants buy paying the
subscription fee and the benefits and the incentives are added to their electric bills. The biggest
advantage to the community, the members of which are the customers of the utility in this model
is the pre-existing legal, financial and managerial infrastructure of the utility which can be used in
implementing the project. In a utility sponsored model, the ratepayers are the subscribers and

11
hence indirect users. The electricity generated from the solar plant, does not reach them directly,
but is a part of the utility’s portfolio. The solar plant in this case is a dedicated solar power plant
in a suitable location and not individual rooftop systems.
Special Purpose Entity Model
This model is useful if the members of the community want to take advantage of the tax
incentives and other benefits themselves. In this case the members of the community structure the
project as a business. The community forms a for-profit organization to take advantage of the
benefits of generating solar power. The members of the community are ‘tax-motivated investors’
who wish to avail the tax benefits of generating solar power. The community organization my
hence deal with the legal and financial procedures in setting up and running a business. In this
model, the solar plant is a revenue generating entity. The benefit to the investors is the return on
investment.
Non-Profit Model
In this model, a non-profit organization engages a community in developing a community
shared solar project. The benefits of the solar project can be shared between the non-profit and
the community or the community just acts a donor and finances the project as a gesture of
goodwill. Recently, many non-profits have teamed up with third party for-profit entities that own
and install the system for tax benefits and the non-profit organization uses the power generated
from the project. Non-profit organizations are not eligible for tax benefits themselves, but they
can take advantage of many grants and other sources of funding available for non-profits. The

12
advantage for community members in this model is that they can deduct their contribution to the
project as a donation if the non-profit manages to obtain a status as a charitable organization.
Successful Community Sourced Solar Projects
University Park Community Solar LLC, University Park, Maryland
The University Park (UP) Community Solar LLC[37] is a 36 member limited liability
company of residents of University Park, Maryland formed to establish and maintain a solar
power generation system for the community. A centralized generation unit is set up on the rooftop
of the Church of the Brethren, which acts as the host site for the solar system. The solar panels
were installed on the roof of the church with the help of outside experts, Standard Solar Inc., who
are also responsible for the maintenance of the panels. The cost of the panels was covered by the
proceeds of the membership purchase in the LLC. This is the initial investment for the members
of the community. By becoming an LLC, they found it easier to raise capital, incentivizing
contributors with a possible return on their investment. Their "for-profit" status also allowed
them to collect a 30% cash grant (rebate) on their total cost, $133,550. They targeted smaller
investments, looking for approximately thirty-five people to contribute at $2000, with the average
investment being $4000. They plan to offer investors a return on their investment in the following
ways,
Selling electricity to the church (13% below retail rate of utility company)
Federal and state support (30% cash grant from federal government as well as $10,400
demonstration grant from Maryland Energy Administration) and
By selling solar renewable energy credits (SRECs).

13
Through these avenues, they plans to be able to pay off investors in 6-7 years, with a 7-
8% return on investment over the twenty year life of the project. The Church of the Brethren also
has the option to purchase the system before the 20 year lease is up1. This model is an example of
a ‘Special Purpose Entity’ formed by the community members to take advantage of the legislation
the state of Maryland.
Sunderbans- Sagar Island- West Bengal, India [8, 13, 38]
Sagar Island is located in the Sunderban delta on the banks of river Ganga on the eastern
coast of India. It is one of the hundreds of islands which make up the Sunderbans. The terrain in
the Sunderban delta is primarily mangrove swamps. Due to the challenging terrain and the fact
that there a number of these small islands, it is economically not feasible to extend the grid to
these islands. The state electricity board currently serves around 650 customers on the islands by
means of diesel powered generators which provide power for 4 hours a day. In 1996 the West
Bengal Renewable Energy Development Agency (WBREDA) set up solar power plants on the
islands to serve as a distributed power generation source. Seeing the success of solar power in the
locations, the program was promoted and not there are 10 solar power plants in the islands
powering 1600 households for up to 6 hours a day.
The Sagar Rural Energy Development Cooperative was established to oversee the
operations of the rural electrification project. The cooperative consists of local officials who work
with the WBREDA, which has maintained an advisory role. The cooperative is responsible for
collecting the tariffs and passing them on to the WBREDA and is also responsible for dealing
with non-payment and deciding on sanctions. We see that the projects based on community
1 "Solar Gardens | Community Power!." 2010. 29 May. 2014 <http://www.solargardens.org/>

14
centric, village specific schemes. Once a plant is commissioned in a village, a village level Local
Management Committee is formed and this body oversees the daily operations of the plant. The
implementation of renewable energy in the Sunderban delta has been hailed as success story and
the project also received the Ashden Award in 2003 for promoting local clean energy solutions.
Research on the impacts of installing distributed power generation to electrify villages has shown
a significant improvement in the socio economic conditions of the people.
Community Solar Power Plant-Jhansi, Uttar Pradesh, India [39]
Another example of a successful community managed power plant is a community
managed solar power plant set up in the Jhansi district of Uttar Pradesh in India. Scatec Solar, a
Norwegian company partnered with Development Alternatives, an NGO in India to setup two
community solar power plants in Rampura and Gopalpura villages in the district. The projects
were entirely funded by Scatec Solar and Development Alternatives played a role in facilitating
the project by training the villages in management practices and the technology. A Village
Energy Committee (VEC) was formed and the VEC was trained in the operation and maintenance
of the plant. The VEC oversees the daily plant operations. A local bank was used to manage the
finances of the VEC and the bank also acted as an institution to develop trust and increase social
capital in the village community.
The plant was designed to suit the needs of the local population and the land for the solar
power plant was obtained with the help of the village Panchayat. The NGO took the responsibility
of training the villagers by offering them various workshops and creating an awareness about
renewable technology. The villages were urged to attend all meetings between the project
developers, local government and district agencies. A Build-Operate-Transfer model was

15
implemented where the community members ultimately own the project. There has been a
marked improvement in the quality of life in the village since the power plants went into effect.
The above examples help illustrate the fact community based renewable energy is a
viable option to serve the energy needs at a community level. Considering the case of rural India,
where there is no reliable power supply from the grid, solar power is a viable option to provide
electricity access to villages. Community participation in such projects will ensure the long term
success and sustainability of such projects.
The Colorado Community Solar Act is one of the first instances where the state
government has taken initiative in promoting community owned solar power. Following
Colorado’s footsteps, Minnesota is also putting together legislation for promoting community
solar. Community based projects involve empowering the community to manage their resources
and contribute to their development [40]. Community shared solar takes a bottom up approach
towards rural electrification by making the community members active beneficiaries. The bottom
up approach aligns with community driven development, which is integral to development in
emerging economies.

16
Chapter 4 Overview of Research Approach
There are many complexities in setting up a community energy. In the context of developing
economies like India, developing a rural community managed energy project also calls for
educating the people about the technology [33]. This study selected three underlying characteristics
for community based solar projects in villages across India, namely i) a community’s organizational
capabilities, ii) a community’s financial capabilities and iii) the local solar resource. We
hypothesize that a community with an existing social framework has a better chance of engaging
in collective action. Hence, this community will be better suited to host a community shared solar
farm. Community-based organizations offer a good framework to implement collective action.
Strong community network and high social capital have a positive impact on developmental
projects and quality of life in rural areas. [31, 32, 41] Community participation not only helps in
the initial stages of the project, but also ensures the long term sustainability of the project. NGOs
involved in rural electrification projects spend a lot of resources on capacity building in the
communities. Apart from educating the community on the renewable energy technology, the
community must also be trained to engage in collective action and managing the resource as a
community. As Ostrom mentions, no two communities are similar and there is no standard template
that can be followed in common property resource management. [30] The underlying
organizational ability of a community can be used as a yardstick to assess the community’s
suitability for collective action. It is the characteristics of the community that enable the locals to
become active stakeholders in the project, the essence of community shared solar. This study
intends to include a piece of information characteristic to the community as a part of initial studies

17
for developing such projects. This study aims to extract the information about the underlying
characteristic from the existing societal frameworks. The assessment will be purely based on the
existing strengths and weaknesses of the community.
The financial abilities of the community here refer to both resource management as well as
access to financial services. Financial capabilities are important to the success of a shared solar
project. [42] Microfinance has been shown to improve access to financial services in rural areas.
[43-48] Penetration of microfinance can serve as a proxy for the financial capabilities of rural
communities. Solar projects are capital intensive and familiarity with financial services and
schemes will assist the locals in managing the project.
The third aspect, the solar resource is an important criterion for the technical success of
the system. Usually considered the limiting criterion, in India where the average solar irradiation
is around 1200 kWh/m2 to 2300 kWh/m2 [14], the solar resource is more than sufficient for a
successful distributed solar power plant. The solar resource is consistent across a large part of India
thereby marginalizing solar resource aspect of the distributed solar project.
The following chapters will outline the methods used to extract information about the
underlying characteristics that contribute to a successful community shared solar plant. Information
regarding (i) community based organizations, (ii) a community’s access to financial services and
(iii) the local solar resource will be pieced together to present a well-rounded picture representing
the potential or suitability of multiple locations across India to host community shared solar farms.
The assessment of community characteristics and financial capabilities will be important in
designing a project structure suitable to the local needs. The different characteristics justify the role
of socioeconomic characteristics in a successful community solar project and support a
multidimensional approach to developing community shared solar projects. Identifying the
strengths and weaknesses of a given location will not only help determine the suitability to host a

18
community based energy project but also help the developers prepare to overcome the deficiencies
whenever possible.

19
Chapter 5 Organizational Abilities in a Community
The importance of community involvement in rural electrification process has been emphasized
in literature but has never been a criterion in the feasibility studies of projects. Community
participation not only helps in the initial stages of the project, but also ensures the long term
sustainability of the project. It is the characteristic of the community that enables the locals to
evolve from being just a beneficiary to being active stakeholders in the project. One of the
essential requirements of successful collective action is that the rules and penalties must be
decided locally by the appropriators of the resource. [30] The ideal community should be capable
of putting aside differences and taking decisions with the common goal in mind or in other words,
to cooperate with each other. The capacity of the community to cooperate is the inherent
capability to form social networks, both formal and informal, to achieve the goals of collective
action. [24]
Importance of Community Based Organizations
A multiple stakeholder approach is very useful in initiating collective action for
protection and provision of public goods [22] and local organizations offer a platform for this
type of approach. Hussain et. al. showed the positive impact of community based organization on
socio economic development in rural Pakistan. [41] Viable community groups have been shown
to be important drivers in development. Community based organizations also help streamline
common interest provide effective outreach of the project benefits. Narayan also illustrates the
benefits of nurturing existing organizations to improve capacity and engage in collective action
20
rather than forming new organizations. [49] Isham, Narayan et. al.[31] suggest approaches to
examine ways cooperative action can overcome individualistic inefficiencies like free riding.
We propose to use a characteristic of the community that enables the members to
organize themselves as a yardstick to assess the community’s suitability for collective action.
Although not the only metric, institutions and organizations indicate the presence of good social
network and capacity to cooperate. The examples in literature support the hypothesis that a
community with an existing social framework i.e. organizations and networks has a better chance
of engaging in collective action. The organizations are the result of the underlying characteristic.
This study uses statistical techniques to extract information about the underlying characteristics
which will then be used as an indicator of the potential to host and manage a community shared
project.
Data on Community Based Organizations
The India Human Development Survey (IHDS) is used as the source of information about
community based organizations in various locations. The survey was organized by the University
of Maryland in coordination with National Council of Applied & Economic Research, New
Delhi, India. [50] The IHDS is a nationally representative survey covering 41,554 households in
1503 villages and 971 urban neighborhoods across India. The section on village-level data was
used, with the questions oriented towards socioeconomic conditions, infrastructure and presence
of organizations/institutions in the village. As a part of the bigger survey, IHDS enquired into the
presence of 12 different community-based organizations in each village. The responses to these
12 questions were down-selected as the dataset for analysis. The responses were recorded as a 1
for a ‘yes’, 0 for a ‘no’ and -1 for a ‘don’t know’. All the locations with at least one ‘-1’ value in

21
the list of responses were removed from the data set. This reduced the number of villages in the
list to 1460 from the initial 1503 sampled.
Table 5-1 displays the organizations considered in this study. This list covers a range of
formal and informal organizations in a typical village. Institutions are varied in their functions as
well as the background of the members. Depending on the type of organization, membership is
either voluntary or by virtue of profession or religion. Informal institutions thrive based on the
characteristics of individuals and their willingness to participate. The formal institutions available
vary greatly depending on location and hence an individual’s affiliation to such institutions also
depends on their location. [51]

22
Table 5-1 List of organizations considered in dataset (subset of the IHDS data)
Name of the Organization Function/Purpose
Agriculture & Milk
cooperatives
Formal and larger trade groups that sell
their products under one banner
Caste associations Represent caste members in issues of
importance
Community Centers Convention centers for local events
Credit or Savings groups Credit facilities and household
improvement services
Mahila Mandals
Federations that help women participate in
rural activities and work towards women
empowerment
Non-Governmental
Organizations (NGOs)
Voluntary organizations working on
developmental projects in rural areas.
Usually based out of cities
Panchayat
Local self-governance institutions at the
village level recognized by the Govt. of
India
Pani Panchayats Formal bodies which deal with water
(pani) related issues
Religious and social
groups Organize religious festivals and events
self-help groups (SHG)
Groups of 10-20 women who pool their
savings, which will be used to provide
credit to members when needed
Trade Unions Professional groups formed by local
businessmen
Youth clubs Associations that involve the youth of the
community in various activities
What Do The Organizations Represent?
‘Mahila Mandals’ are federations that help women participate in rural activities and work
towards women empowerment in the village. These can be formal as well as informal. A typical
self-help group (SHG) consists of 10-20 women from socio economic background who pool their
savings, which will be used to provide credit to members when needed. Youth clubs and
associations are formed to involve the youth of the community in development and community
activities. Credit or Savings groups provide credit facilities and household improvement services.

23
Trade unions and cooperatives are business related organizations that help in promoting local
businesses and income generating activities. In cooperatives, the members pool their resources in
order to earn greater economic benefits. Religious and caste associations are involved in
celebrating religious festival and representing the caste members in issues of importance. Non-
Governmental Organizations (NGOs) are typically based in urban locations and consists of
people who wish to contribute to rural development[52]. A Panchayat is a local self-governance
institution at the village level in India.
This list of institutions and organizations considered covers a range of formal and
informal organizations in a typical village. The institutions are varied in their functions as well as
the background of the members. People gain membership in religious and caste institutions
because they were born in a particular religion or caste whereas membership in professional
groups like trade associations and credit groups is by virtue of their profession. Women join self-
help groups voluntarily to help their livelihood. Agricultural and milk cooperatives indicate the
presence of business oriented people in the community. Credit and savings groups show that the
members of the community place their trust in the group with regards to their savings and have
access to credit in time of need. Panchayats indicate the presence of a formal institution to resolve
local issues and take care of local administration. The formal institutions available vary greatly
depending on location and hence an individual’s affiliation to such institutions also depends on
their location[51]. Informal networks thrive based on the characteristics of the individuals and
their willingness to participate. This set of institutions and organizations can present a
comprehensive picture of the formal and informal networks in the community and hence translate
to their ability to cooperate. This will provide us with a good basis to understand some
characteristic abilities favoring the success of community based project.

24
Shortcomings of the IHDS Dataset
Though the India Human Development Survey is as comprehensive as one can hope, it
must be noted that the purpose of the survey was not to determine locations for community based
resource management. The questions are not tailored towards the capacity or the inclination of the
people to form organizations for resource management. However, it is the best available data set
in this regard. For this study, we are using a particular section of the village level survey. Also,
the IHDS dataset does not have any information on how active an organization is in the village.
An inactive institution does not serve any good. On the contrary it might be detrimental to
development. With the limited resources and information available we decided to proceed with
the study using the IHDS data set.
The ideal way to select the location will be conduct a field survey of potential locations
where the respondents are asked questions very specific to the project to gauge their capabilities
in managing a resource and resolving conflicts. The ability to form organizations can be used as
an initial screening criterion for selecting locations. Hence, even though the available survey is
not directly focusing on community based actions, it is related to successful implementation of
collective action projects (by providing information on organizations and institutions) and the use
of the data in the study is justified.
Factor Analysis to Obtain Information on Community Organizational Capabilities
The correlations between survey responses in the survey were used to identify the
underlying characteristic in the community that favored the formation of organizations and
institutions. Underlying characteristics like ability to cooperate and factors influencing
willingness to participate are unobservable. The results of such characteristics, however, are

25
observable outcomes like community-based organizations. Studies have used statistical
techniques like exploratory factor analysis to extract common factors which are used as indicators
of unobservable underlying characteristics of community. [24, 53, 54] Exploratory factor analysis
was used to extract common factors based on a linear model involving the correlations in the
variables. The theory and mathematics behind factor analysis is presented, with an example in the
Appendix section. The common factor represents the unobservable characteristic that influences
the formation and functioning of such institutions. The coefficients of the common factors are the
factor loadings that represent the strength of the influence of the common factors on the observed
outcomes. The factor score is a numerical estimate of the unobservable common factor. In this
context, factor scores were used to compare the ability of the community to form organizations
across different villages. The factor scores aided in processing 12 pieces of information (the 12
types of institutions considered) using one numerical value. Factor analysis of the data and
calculation of factor scores was carried out using STATA. To geographically visualize the
distribution of the better performing locations, the Google Fusion Tables plotting tool was used to
plot the locations based on their factor scores.
26
Chapter 6 Financial Abilities of a Community
In many studies on common property resource management and community based projects best
practices suggest that community must be more than just the targeted beneficiary. The community
must be involved as a stakeholder in the project. Not only will this give the members a sense of
ownership of the project but also ensures that they will work towards the success of the project.
One of the many ways to make someone a stakeholder is to make them invest capital in the project.
Like most renewable technology, solar photovoltaic are capital intensive. There is high initial cost
and financial success depends on regular payments for the electricity generated.
There are quite a few ways to finance a community solar project. The capital to set up the
project can come from various avenues
● Grants from non-profit organizations
● Grants from a corporate entity as a part of their Corporate Social Responsibility project
● Investment by a company
● Investment by entrepreneurs
● Loans from banks and financial institutions
Considering most of the intended beneficiaries i.e. the targeted community, depend on
agriculture for their livelihood or earn irregular wages, access to credit is not easy. [55] Not many
financial institutions will be willing to loan money to this section of the society due to lack of
information about their creditworthiness. The Rural Finance Access Survey, 2003 conducted
jointly by the World Bank and the National Council of Applied Economic Research, India showed
that rural banks serve primarily the needs of the rural rich. The rural poor on the other hand, face
difficulties in accessing financial services. Even with economies of scale playing a role in
community based projects, many rural households might not be able to make an initial investment
27
in a solar project without any assistance. Apart from the initial investment, renewable energy
projects also require the resource appropriators to make pay their tariffs (depending on the tariff
structure) regularly. An issue, which regularly comes up is the inability of the community members
to pay regularly for the energy. [42] This causes the projected financial model of the project to
break down and disrupts the entire structure. Hence it is very important to look at the financial
capabilities of the community before deciding to proceed with the project.
Microfinance as an Instrument for Enhancing Rural Financial Services
Microfinance aims to provide financial services to the rural population in a regulated
manner like commercial banks but without the requirement for a collateral or credit history. It
involves group-based models, where several entrepreneurs come together to apply for loans and
other services as a group. [56] Microfinance works on relationship-based banking for individual
entrepreneurs and small businesses. Microfinance clients address usually self-employed low
income, no access to formal financial institution.
Evolution of Microfinance in India
The primary purpose of microfinance in India is to provide a means through which
impoverished families who are generally excluded from financial systems may access credit. [57]
The origin of microfinance lies in the various traditional and informal forms on money lending
present in communities over centuries. Community based financial transactions were based on trust
and social status. These informal money lenders-usually the richer people in the society- loaned
money without collateral based on verbal agreements and trust in the borrower. [45] All the
transactions were within the community and rules were set by the money lenders based on their

28
culture and religion. The local money lenders were able to stay in business without any outside
competition because of their knowledge of the creditworthiness of the borrowers. Since the local
money lenders were not regulated, they had the ability to design interest rate structures based on
the borrower. The nature of the transaction in itself puts the moneylender higher up in the village
hierarchy. [58] In 1904, exploitation of the farmers by moneylenders led to riots in the Deccan
region (modern day Andhra Pradesh) and this led to the then British Government passing the
Cooperative Societies Act. The intent was to regulate moneylending and promote the formation of
cooperative societies as an institution of rural finance. The members of the cooperatives pooled
their resources and helped other members out, thereby eliminating the money lender. In post-
independence India (after 1947), delivering credit and financial services to the rural farm sector
was a priority. At the time, the commercial banks, which were a part of the private sector, did not
have much of a presence in the rural areas and there were not sufficient incentives to help them
venture into farm sector. This along with the lack of information about the creditworthiness of the
rural poor and the preconceived notion about their inability to pay back or provide collateral
discouraged the commercial banks from setting up branches in rural locations. The cooperatives
were the government’s only choice to provide credit service to rural areas. [59]
The nationalization of banks in 1969 resulted in the establishment of Regional Rural Banks
and adoption of priority sector lending in order to eradicate poverty. This was one of the first steps
in involving formal commercial institutions in rural banking. Also, state led small scale programs
experimented different models to cater to the financial needs of the rural poor and this led to the
development of self-help groups and NGOs which were beginning to get involved in microfinance.
These developments over the years came with their own share of problems. The cooperatives were
dysfunctional due to poor governance and repayment issues. The regional rural bank’s financial
position deteriorated due to the restricted interest regime and poorly directed rural credit. The
Indian government had focused on expanding services and not much importance was given to how

29
and to whom the loan was sanctioned. This led to losses of more than Rs. 3000 crores by the year
1999. In 1992, the government of India proposed linking of cooperatives (SHGs) with commercial
banks. The National Bank of Agriculture and Rural Development led this initiative and published
guidelines to banks for financing SHG through the conventional banking system. In 1996, financing
SHGs was made a mainstream activity under priority sector financing for all the banks. [59]
Post 2000, the microfinance process was commercialized and saw the entry of many for-
profit agencies. This led to the formation of Non-Banking Finance Companies which were eligible
to take deposits and then would use the deposits as funds for loans. Microfinance was seen as a
social entrepreneurship instrument to gain social and financial returns. [59]
The informal traditional sources of finance (money lenders) have dominated the rural
financial sector for ages in India. Prior to the introduction of microfinance institutions (MFIs) in
India in the 1980s, the poor predominantly relied on informal commercial lenders, as formal banks
were unwilling to provide credit to those who were insolvent or could provide no collateral. These
moneylenders were easily accessible and unregulated, and were thus able to charge exorbitant
interest rates. [60] In the year 1961, 83.7% of the total dues in rural households were owed to
informal source of finance.[61] This number has dropped down to 36% in 1991. This can be
correlated to the development of formal microfinance services over this period. However, as
recently as 2002, several location specific studies showed that informal, traditional sources of
finance still dominate the financial transactions of the rural poor. Microfinance aims to provide
financial services to the rural population in a regulated manner like commercial banks but without
the requirement for a collateral or credit history. There are a few different microfinance delivery
models which have been successful over the years. Three of these models are described below.

30
Self Help Group Model
This model is unique and distinct to India. The self-help groups (SHGs) mobilize member
savings and provide need based loans to members. [47] Members make the rules and elect their
own leaders. Almost 90% of the SHGs in India consist primarily of women members as the poorest
households also rely on the income generated by the women of the house. The Federated SHG
model brings together a number of SHGs under a single governing body. The governing body has
around 15-20 elected members who interact with the NGOs and other organizations supporting the
SHGs. Federations can be linked with formal banking institutions and help serve a larger section
of the society. [62]
Grameen Model
The Grameen bank is the brainchild of Prof. Muhammad Yunus from Bangladesh. During
his travels through the villages of Bangladesh, he discovered that the rural poor suffer not from the
lack of skills, but from the lack of credit. In one of his interviews, he recollects his conversations
with the women in the village of Jogra. The women made a livelihood by selling chairs made of
bamboo. Due to the lack of finances, the women were forced to buy the raw materials and sell their
products through the same middleman. The women were also charged interest on the loan they
borrowed to buy the raw materials. At the end of the day, the women made roughly 2 cents a day.
He realized that, by eliminating the middleman, the moneylender, the women would be much better
off. This was the motivation for Prof. Yunus to work on providing the rural poor with access to
credit. After experimenting with multiple models, in 1983, with special charter from the
Bangladesh Government, he established Grameen Bank as a formal, independent financial

31
institution. [63] Grameen Bank model assumes that, rural individuals, when provided with credit,
will engage in income generating activities2.
A bank unit is set up with a field manager and bank workers. A bank typically covers 15
to 20 villages. The bank manager visits the villages to educate the local populations about the
operation and benefits of the back and identify prospective clients. Groups of five prospective
borrowers are formed. For the first 2 to 3 weeks, the members are required to make small deposits
to the bank. Only two of these five are eligible for and receive a loan. Only if the two borrowers
pay the principal and interest over a period of 50 weeks do the others become eligible. Hence, there
is group pressure on individuals to conform to bank rules. [47] Loans are provided for all purposes
at nominal interest rates. The purpose of the loan request is discussed in the group meetings and
the members monitor the use of money to ensure that the loan is repaid. Only if the initial loans are
clears, credit will be extended to other group members. A five member group is considered to be
ideal for peer monitoring. In larger groups, there is a chance of members leaving the monitoring
responsibility to others. Apart from providing credit, the system also encourages the members to
make weekly savings in the form of deposits. This will be held in a savings account for that member.
Grameen Bank also offers the opportunity to purchase an equity share through a group fund. This
offers the members a stake in the bank's operations. [63] Repayment of loans in small chunks is
one of the reasons for the high success rate of this model. [62] Grameen Bank has demonstrated
that the poor are creditworthy and has made micro-credit a global movement. Grameen Bank plays
dominant role in microcredit financial market in Bangladesh. Service charge on credit varies from
10% to 20% at flat method of collection. [64]
2 "Grameen Bank | Bank for the poor - Breaking the vicious ..." 2008. 1 Jun. 2014
<http://www.grameen-info.org/index.php?option=com_content&task=view&id=25&Itemid=169>

32
Cooperative Model
This model is based on the premise that every community has the human and financial
resources to manage their own financial institutions. The members of the cooperative institutions
are those who wish to avail its services. If there is good social capital in the community, a
sustainable cooperative can be set up to provide a variety of services. The ownership and control
of the cooperative will remain with the locals. An example of a successful cooperative organization
in India is the Sahavikasa (meaning development for everyone) or the Cooperative Development
Fund which is based on a savings first strategy. The success of the CDF in Andhra Pradesh led to
the government passing a legislation supporting the flexible functioning of cooperatives in the state.
[62]
Microfinance as Collective Action
The involvement of the locals in microfinance reduces the transaction cost and makes use
of local level knowledge, thereby eliminating risk. We have seen separately how social capital and
collective action can lead to better organization and management of resources, which in turn leads
to development. Microfinance and microfinance institutions offer similar avenue for development.
By organizing regular meetings and collective services microfinance institutions can increase the
social capital in the society. [65] Ostrom et al. [66] have shown that given the right framework to
communicate the members were successful in coordinating actions to improve yield, come to verbal
agreements for implementing the actions and structuring methods to deal with nonconforming
members. Microfinance institutions can provide this framework in a society. By encouraging
regular meetings, microfinance not only improves the social capital for economic transactions but
also offer a platform for the members to communicate. With such regularity creates a culture of

33
conforming to the rules and it reduces the incentive to default from the rules. [67] The Grameen
Bank model requires the group to monitor each other to ensure the appropriate use of the loan
money. The presence of such models will reduce the cost of monitoring and enforcing rules in
common property management analogous to how the presence of organizations will reduce the cost
of capacity building in the community.[58]
How Can Microfinance Impact Rural Development?
Microfinance aims to reduce the information gap in providing financial services to the rural
population. This is done by involving the community in the process so that the members can provide
the information. We saw how community participation has a positive impact on rural development
projects. Microfinance, being community based, has the potential to reach all levels of the society
and provide services to those in need. Failures in multiple rural energy projects have been linked
to lack of community participation and inequality in the society. By inequality, we mean not
involving all sections of the society, especially women of the household. Women are managers of
household energy and are the worst affected by energy shortage. When they are not involved in the
process, it makes it difficult to judge the effectiveness of the program. [68] An analysis by the
Microfinance Exchange in India showed that 90% of the borrowers from microfinance institutions
are women. Newly established microfinance institutions (established after 1995), almost all clients
are women. Even in the microfinance institutions established before 1995 about 85% of the clients
are women. Microfinance has a great reach in the society and can provide financial services to
everyone in a rural community. Microfinance institutions can finance the access to renewable
energy for small and micro enterprises and low income households through location specific
innovative financial schemes. They can raise awareness about the opportunities in investing in
renewable energy and how it can improve the livelihood for everyone in the community.

34
Imai et al. show that the presence of microfinance institutions increases the welfare in the
society and contribute to poverty reduction. [44] The intention of the borrower plays an important
role in poverty reduction outcomes. In models like the Grameen Bank model, where group lending
model is used, the intention and proper use of the loan is monitored by the group members. In
Bangladesh, the presence of microfinance institutions and access to microfinance has resulted in
an increase in household income, generate employment, reduce income disparity and increase
social welfare. [46] Experiences with Central American NGOs have shown improvement in the
economic status and quality of life of microfinance clients due to their continued participation in
personal savings program initiated by the NGOs. [43]
Microfinance & Solar Power
Solar power is a very viable option for off grid rural electrification project. However, like
any renewable energy technology, solar power is also capital intensive and has high upfront costs.
Rural population in developing countries cannot afford such high investments. Hence, there is a
need to mobilize financial resources in order to provide the access to energy. [69] In deploying
solar power systems there are multiple technical, economic, political and social challenges which
have to be overcome. [16] Among other issues like capacity building, maintenance of technology
and community impact, financial issues related to solar power have been regularly discussed in
literature. [9, 11] Traditionally solar power for the poor has always been made available through
donations from the industry or the work of development organizations. However, there has been an
increased interest in developing strategies that enable the rural poor to finance their own needs.
[70] The solar market is limited by the buying capacity of the end user. This scenario can be
changed if the end user is able to finance the purchase of the products. Microfinance due to its
outreach and penetration can play a major role in enabling the poor to finance their energy needs.

35
The local presence enables the microfinance institutions to design appropriate loans where the loan
payments match the existing energy expenditures or income flows. [71] Partnering energy
companies with microfinance institutions offers three important benefits
1. Enables access to energy services for the rural poor
2. Expands the market for energy service companies
3. Improves the operations of the microfinance institutions and expands their client base
Morris et al. suggest that as links improve between microfinance institutions and energy
companies, formal/commercial financial institutions will be more willing to provide loans for
energy services. [72]
Examples of Successful Projects Which Have Used Microfinance to Support Solar Power
Deployment
Innovative Microfinance Schemes Leads to Success in Rural Electrification Projects in
Bangladesh [64]
Bangladesh has developed an economically viable solution for providing electricity to rural
areas where the national grid is difficult or expensive to extend. The Renewable Energy
Development Agency of Bangladesh proposed the use of solar home systems in rural electrification
projects. Solar home system units are well received by small entrepreneurs for lighting and
extending their business hours. The electrification program uses innovative financial schemes to
ensure that energy access is provided to the rural poor. Microcredit programs (MCP) are
implemented by various formal financial institutions (nationalized commercial banks and
specialized banks), specialized government organizations and Non-Government Organizations
(NGOs).

36
The Rural Electrification Board offers a fee for service model where the customers pay a
flat fee for their use of the solar home systems. The systems are owned by the Rural Electrification
Board. The second model is a permanent ownership model which is more popular in remote areas
surrounded by rivers. This model is handled by the Infrastructure Development Company Limited
(IDCOL), established by the Government of Bangladesh. IDCOL offers soft loans of 10-year
maturity, with a 2-year grace period, at 6–8% per annum interest to its partner organizations, who
then loan the money out to the microcredit customers. The microcredit customer pays 20% of the
project cost as down payment and the rest is loaned out by the partner organizations. The loan
period is usually 2-3 years. The repayment is through monthly payments in most cases. The solar
home systems were able to compete with kerosene and the program was accepted by the people.
The solar home system (SHS) program in Bangladesh is considered to be one of the most successful
programs in the world.
The success of SHS program was driven by
● The strong motivation of the rural population to improve the lifestyle
● The existence of infrastructure of microfinance institutions
● Making available facile credit for SHS by Government
● The support of domestic and international institutions.
We see that participation of the people and presence of microfinance institutions which
have helped the rural poor gain access to credit has been instrumental in the success of this program.
Solar Electricity for Rural Development in Dominican Republic [73]
In 1984, Enersol Associates, a non-profit organization from United States were successful
in linking solar power and microfinance to provide electricity in village of Bella Vista in the

37
Dominican Republic. Called SO-BASEC, the Solar Based Rural Electrification Concept model
links PV power with the local institutional resource to provide electricity access to the communities.
Firstly the local were trained in operating and maintaining small scale solar energy equipment. The
locals formed an enterprise which designs and installs PV power system according to the local
need. Enersol Associates worked with NGOs to establish revolving credit programs to enable
financing for solar power system purchases. Local microcredit services do not require collateral or
credit history and it was seen that access to credit increased the percentage of households which
could afford photovoltaic systems. Three year loans were provided at reasonable interest rates to
enable the purchase of PV modules. The installation of solar power had a direct positive impact on
the quality of life in the villages. Forming the enterprise generated jobs in the community. Solar
power was used to provide electricity to schools and health centers. The power supply boosted
small scale cottage industries and other farm related activities. This is an example of a replicable
model which uses microfinance and solar power for development in rural areas.
Some Other Examples
In Solomon Islands, an innovative concept of integrating local business and solar
power has enabled the locals to gain access to solar powered lamps. Realizing that the
locals do no always have access to cash, the energy service company accepts payments in
the form of crops which then it sells to get cash for services. This is again offering access
to financial and energy services, albeit indirectly. [74] The Solar Energy Foundation is a
charitable microfinance institution which has set up more than 2000 solar home systems in
Ethiopia. [70] The credit linked SHG program in India has involved commercial banks in
the energy lending process. The Aryavart Gramin Bank provides solar purchase and

38
installation loans to customers and also bulk orders PV systems for enterprises. [61]
SELCO-India is an energy service company which has partnered with rural banks and
microfinance institutions to distribute solar lanterns to the rural communities in Karnataka,
India. The SELCO model uses the banks and microfinance institutions to provide financial
services while the company provides technical and after sales service. [10]
The examples portray the positive impact of microfinance in the success of solar
projects all over the world. The success of microfinance institutions also involves collective
action at the ground level; this will tie in well with the community aspect of the rural
electrification project. The examples of successful projects justify the use of “presence of
microfinance” as an indicator for the financial capabilities of the community. In a rural
community, the presence of SHGs and credit groups indicate the availability of credit to
the members and the credit linked SHGs [59] indicate the availability of formal credit from
commercial institutions. This will provide flexibility in designing the financial model of
the project and opens up multiple avenues for financing. The above sections prove the
value of microfinance in both community based project and solar rural electrification
projects, thereby justifying the use of microfinance as an indicator to assess financial
capabilities.
Cataloguing Financial Capabilities
In order to assess the financial capabilities, access to financial services were reviewed for
rural areas of India. Data covering financial services in rural India were obtained from the website
of Ministry of Rural Development for India. [75] The data for financial inclusion provided

39
information of financial services available in rural areas and also information on percentage of
households availing such services. Apart from this data, literature on delivery of financial services
at affordable costs in rural India was also used to obtain a better understanding of penetration of
microfinance in India. The data was scrutinized to identify the locations with access to financial
services. The presence of microfinance institutions and other commercial financial institutions was
used as an indicator of availability of financial services.
Table 6-1 List of Microfinance Institutions and Indicators
Type of Financial
Institution/Indicator
Function
Credit Linked Self Help
Groups
Local self-help groups linked with formal
financial institutions to create savings pool
and promote a savings first mentality
Growth in rural bank accounts Indicator of increase in awareness about and
access to financial services
Primary Agricultural Credit
Societies (PACS)
Microfinance institutions supported by local
governments to support farmers and
agriculture activities
Commercial Bank branches in
rural areas
Indicates the penetration of formal and
commercial financial services in rural areas.
Also an indicator of financial
awareness/capabilities of a community.
Table 6-1 gives the list of microfinance institutions and indicators that were used in
assessing the financial capabilities. The performance of states with high functioning community

40
capabilities was studied in order to identify any possible links between the organizational ability
and penetration of microfinance.

41
Chapter 7 Solar Resource in India
Solar Resource Terminologies
Before comparing the solar resource available across India, it is important to define the
terminologies used for measuring solar resource. Irradiance (W/m2) is the light
that impinges upon a surface, interpreted as the instantaneous rate of change in energy (power in
Watts) per unit area. Another common term is Irradiation (Wh/m2) which is the light incident
upon a surface, interpreted as the energy per unit area.
The success of any solar project ultimately depends on the solar resource available. All
feasibility studies begin with resource assessment and this applies for solar based projects as well.
India, being located in the equatorial sun belt of the earth, receives abundant radiant energy from
the sun. The Indian Meteorological Department records show that most parts of India, on an
average, experience 250 to 300 sunny days in a year. [76] The Ministry of New and Renewable
Energy, India reports that the annual global irradiation received in India ranges from 1200 kWh/m2
to 2300 kWh/m2. [14] Solar resource in India is so rich that even if 10% of the theoretically
available land area (apart from agricultural lands, forests, housing area, etc.) is used to generate
solar power, it would amount to 8 MW a year. [3] This presents a picture of the available solar
resource in India.
Solar Resource across India
Error! Reference source not found. shows the incident annual global solar radiation a
cross the country. It is clearly visible that the north western region of the country gets the maximum
amount of radiation. Even though the peninsular region consisting of Andhra Pradesh, Madhya

42
Pradesh, Maharashtra, Karnataka, Kerala and Tamil Nadu come second in the country, they receive
fairly large amounts of solar radiation. The average solar radiation received in this region is much
higher compared to countries like United States, Japan and Germany which are considered to be
the world leaders in solar power. [76] Ramachandra et al.[15] studied the NASA Global Insolation
data for India to identify potential ‘hotspots’ for solar power in India. It was shown that a good
portion of the country receives comparable solar insolation with the northwestern region of Gujarat
and Rajasthan. The maps show very high solar irradiance in similar regions across the country.
Figure 7-1 Annual average global horizontal irradiance data for India, represented for
solar conditions from 2002-2011[76]

43
Assessing the Solar Resource in the Indian Peninsula
The potential for solar power development at the village level is analyzed here, using
Global horizontal irradiance (GHI) as a resource metric. India’s landmass was divided in to regions
based on ranges of annual average GHI values. The National Renewable Energy Laboratory’s map
[77] on annual average GHI across India provided the GHI data and the ranges for division of
regions based on the GHI data. The ranges were then used as bin sizes to create a histogram of the
locations based on the range of GHI values in which they fall. Only the locations that exhibited
good community organizational ability and good financial capabilities were chosen for the
histogram. The histogram was used to make an assessment of the solar resource available based on
the range in which the local GHI values lie. In addition to this, previous studies on solar potential
in India [10, 11, 14, 15] were also used in local solar resource assessment to support the theory that
majority of India has sufficient resource to develop solar power.

44
Chapter 8 Results
The Underlying Ability of the Community to Organize
Due to the varied nature of the assessed India institutions, factor analysis was used to identify an
underlying common factor or characteristic indicative of forming organizations and their intent to
cooperate. Factor analysis is a method which aims to determine the underlying structure or behavior
in a dataset. A dataset here is defined as multiple observations for a variable set. The goal of factor
analysis is to determine the number of individual constructs (factors) required to account for the
pattern of correlations in the data. The characteristics of these so called factors are explained by
estimating the strength and direction of influence (correlation) of each of the factors on each of the
variables. These estimates are referred to as ‘factor loadings’. Factor analysis will allow us to
interpret variables not as fundamental quantities but as derivable from some basic unobserved latent
components.
This community characteristic to form social organizations provided a basis to explore the
characteristic abilities favoring the success of community-based project. Kaiser-Guttman criterion
suggests the use of only those common factors, which have an eigenvalue greater than unity. [78]
Application of the Kaiser-Guttman rule yielded only one common factor, which significantly
influenced the outcomes. Only this common factor was used in further analysis and this was labeled
as ‘Factor No. 1’. The following section will provide information on attaching a meaning to this
Factor No. 1.
Table 8-1 gives the values of the factor loadings of the 12 variables on to the common
factor. Credit groups, community centers, youth associations and caste associations had the highest
loadings on ‘Factor No. 1’. These organizations are informal in nature as they were formed by the
initiative of the local community and need not be registered with any higher authorities. The set of

45
variables with factor loading values lying in between 0.49 to 0.43 are a mix of formal unions and
government recognized local institutions tasked with the responsibility of improving the socio
economic status of the community. It was observed that NGOs and self-help groups displayed the
lowest loading values on ‘Factor No.1’. The common factor influenced the informal organizations
the highest, followed by local unions and business organizations. This observation supported the
argument that the common factor represents an underlying ability or the willingness of the
community to cooperate and form organizations. This factor, Factor 1 was termed as the
community’s ‘underlying ability to organize’.
Table 8-1 Factor Loadings for observed variables (organizations) on Factor 1
Variable Factor 1 Loading
Credit or Savings Group 0.52
Community Center in the village 0.52
Youth Club-Sports Group 0.51
Caste Association 0.51
Mahila Mandal 0.49
Agricultural or Milk Cooperative 0.49
Panchayat Bhavan 0.49
Trade Union-Professional Group 0.47
Religious or Social/festival Group 0.47
Pani Panchayat 0.43
Self-help groups 0.34
Development Group or NGO 0.33
Table 8-2 gives the range of values of the factor scores. These factor scores were used as
scales to compare the ‘underlying ability to organize’ across different locations. A high factor
indicates a strong presence of the common factor for that set of observations, or in this case high
‘underlying ability to organize’ in that particular community. The locations with most community-
based organizations had the highest factor scores. A low factor score indicates that the common
factor prompting the formation of community based organizations has a very weak influence in the
community. Such locations, had the lower number of organizations.
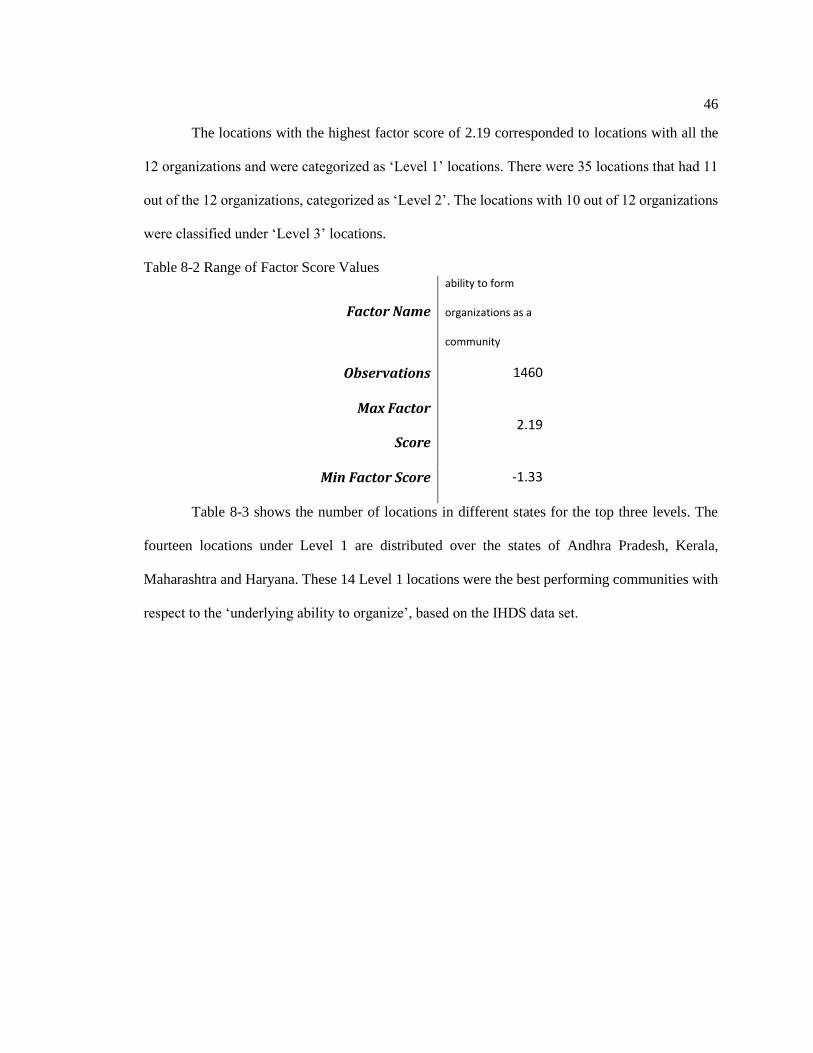
46
The locations with the highest factor score of 2.19 corresponded to locations with all the
12 organizations and were categorized as ‘Level 1’ locations. There were 35 locations that had 11
out of the 12 organizations, categorized as ‘Level 2’. The locations with 10 out of 12 organizations
were classified under ‘Level 3’ locations.
Table 8-2 Range of Factor Score Values
Factor Name
ability to form
organizations as a
community
Observations 1460
Max Factor
Score 2.19
Min Factor Score -1.33
Table 8-3 shows the number of locations in different states for the top three levels. The
fourteen locations under Level 1 are distributed over the states of Andhra Pradesh, Kerala,
Maharashtra and Haryana. These 14 Level 1 locations were the best performing communities with
respect to the ‘underlying ability to organize’, based on the IHDS data set.

47
Table 8-3 Number of locations (state wise) under each Level
Number of Locations
State Level 1 Level 2 Level 3 Total
Kerala 4 8 17 29
Andhra Pradesh 8 6 8 22
Maharashtra 1 5 16 22
Karnataka 3 12 15
Gujarat 2 4 6
Tamil Nadu 2 3 5
Orissa 1 2 3
Haryana 1 2 3
Rajasthan 3 3
Tripura 1 1 2
West Bengal 1 1 2
Chattisgarh 1 1
Goa 1 1
Madhya Pradesh 1 1
Bihar 1 1
Figure 8-1 shows the distribution of the top performing locations on a map of India. It is
clear that the villages with best community characteristics are distributed in the peninsular region
of India. Figure 3(a) is the map of locations of the communities under Levels 1. Figure 3(b) is a
heat map showing the distribution of all the locations weighted using their corresponding factor
scores. Level 1 locations have the highest factor scores and are weighted heavily. The red zones
(denoting high intensity) on the map indicate a community with the highest weightage. This
translates directly in to communities with a high factor score, suggesting favorable abilities to
organize themselves. The heat map also gives an idea of the distribution of locations in all the three
levels. The dense regions on the map indicate cluster of high performing villages. The states of
Kerala and Andhra Pradesh have the highest number of locations in the three levels, and display
dense coloring in the heat map.
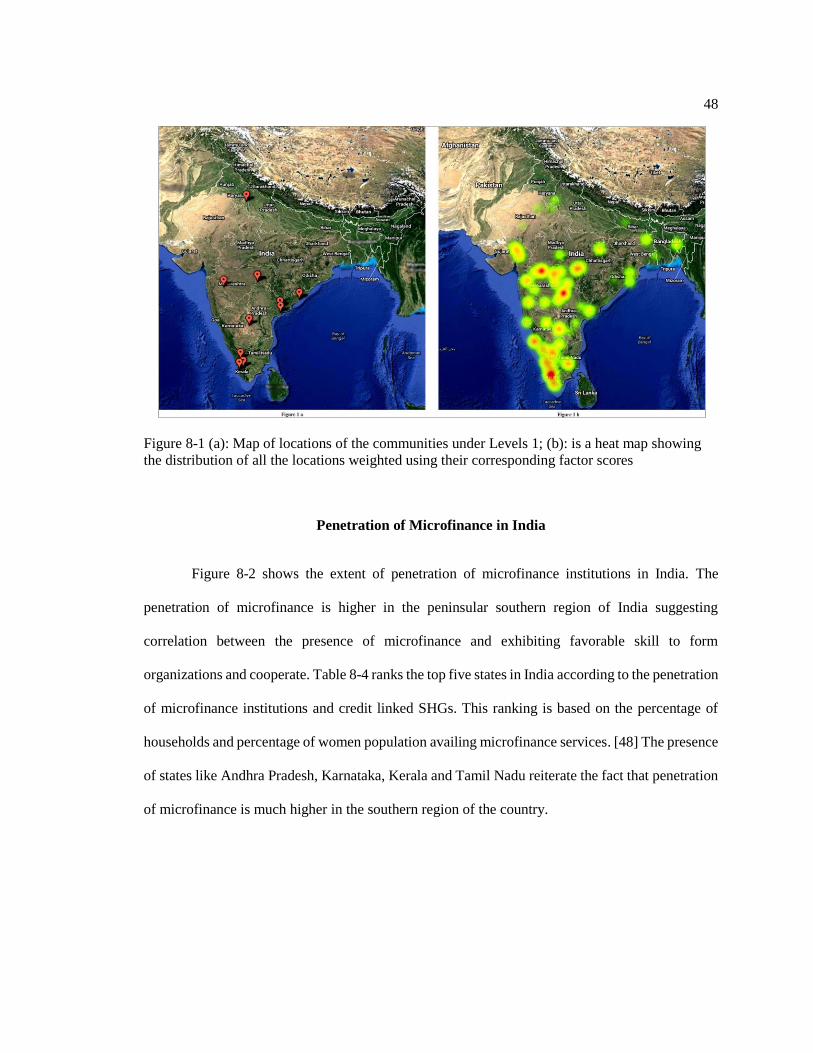
48
Figure 8-1 (a): Map of locations of the communities under Levels 1; (b): is a heat map showing
the distribution of all the locations weighted using their corresponding factor scores
Penetration of Microfinance in India
Figure 8-2 shows the extent of penetration of microfinance institutions in India. The
penetration of microfinance is higher in the peninsular southern region of India suggesting
correlation between the presence of microfinance and exhibiting favorable skill to form
organizations and cooperate. Table 8-4 ranks the top five states in India according to the penetration
of microfinance institutions and credit linked SHGs. This ranking is based on the percentage of
households and percentage of women population availing microfinance services. [48] The presence
of states like Andhra Pradesh, Karnataka, Kerala and Tamil Nadu reiterate the fact that penetration
of microfinance is much higher in the southern region of the country.

49
Figure 8-2 Penetration of Microfinance in India [78]

50
Table 8-4 Top 5 States in India based on Penetration of Microfinance Institutions and Credit-
Linked SHGs
Rank Penetration of Microfinance Institutions
Penetration of credit-linked
SHGs
1 Andhra Pradesh Andhra Pradesh
2 Karnataka Orissa
3 Tamil Nadu Tamil Nadu
4 Orissa Kerala
5 West Bengal West Bengal
Table 8-5 provides the performance of the states with respect to percentage growth in bank
accounts. [79] Bank accounts imply access to formal financial credit and can be used as a legitimate
indicator of the financial status of the people. The growth indicates awareness about commercial
financial services in the community. The high rank of Andhra Pradesh and Kerala show a link
between communities with ‘abilities to organize’ and awareness about financial services.
Table 8-5 Ranking of states in terms of percentage growth in deposit accounts
State Ranking
Andhra Pradesh 1
Kerala 2
Gujrat 3
Rajasthan 4
Madhya Pradesh 5
Haryana 7
Maharashtra 13
Table 8-6 presents the nationwide rank of the ‘Level 1’ states with respect to the working
capital available to the local Primary Agricultural Credit Societies. Primary Agricultural Credit
Societies (PACS) are government promoted cooperatives. PACS are groups with around 1000

51
members, predominantly male and the loans are usually for agricultural purposes. PACS are linked
to the district level and state level cooperative banks and more formal in nature compared to SHGs.
PACS have been shown to be viable rural financial institutions. [80]
Table 8-6 Primary Agricultural credit societies-ranking based on working capital available (2011)
States Nationwide
Rank Working capital
(Rs million)
Andhra Pradesh 1 348,396
Kerala 2 263,802
Maharashtra 3 139,060
Haryana 7 78,214
Given the importance of cooperatives and organizations in community based projects and
also the role they play in improving the reach of microfinance, established credit societies can serve
as an indicator of access to financial credit in the rural areas. All the states with Level 1 locations
rank within the top 10 in this category further establishing a relation between high performing
communities and penetration of microfinance.
Table 8-7 ranks the states based on the number of commercial banks actively function in
rural areas of the different states. A number of commercial banks have rural branches providing
banking services in the rural areas. Availability of formal financial services indicates the ability to
obtain financial services to fund capital-intensive renewable energy projects. Andhra Pradesh and
Karnataka once again demonstrate the high penetration of financial services in rural areas of south
India. Maharashtra, which ranks third in number of communities in Levels 1, 2 and 3 also ranks
high in number of commercial bank branches in rural areas.

52
Table 8-7 Ranking of States based on number of commercial banks functioning in rural areas (2009)
States No. of Rural
Branches
Nationwide
Rank
Andhra Pradesh 2,393 2
Karnataka 2,166 4
Maharashtra 2,148 6
Haryana 690 16
Kerala 331 20
Figure 8-3 shows the number of operational SHGs linked with three different types of
banks in Level 1 states, Andhra Pradesh, Maharashtra, Kerala and Haryana. The SHG bank linkage
program was established create interaction between local SHGs and formal banking institutions.
The formal institutions can be a rural regional bank, a commercial bank or a cooperative bank. This
linkage promotes the savings first concept and encourages the SHGs to plan their expenditures and
increase their savings. The higher the savings, the better will be the credit availability for the SHG.
Figure 8-3 Number of credit linked SHGs in Andhra Pradesh, Maharashtra, Kerala and Haryana
(2012)

53
The Energy Resource Institute, New Delhi, India, has reported that participation,
ownership and local control are three important factors in the success of a community-based project
[27]. Access to credit and financial services increases the capability of the community to invest in
the project and be an active stakeholder in the project
Solar Resource Aspect in Community Solar Assessment
The Indian Ministry of New and Renewable Energy reports that the annual global radiation
received in India ranges from 1200 kWh/m2 to 2300 kWh/m2. [14] The average solar resource
across India is high enough, that even if 10% of the theoretically available land area (apart from
agricultural lands, forests, housing area, etc.) is used to generate solar power, it would amount to 8
million MW a year. [3] As of March 2012, the government of India reported a net grid connected
solar capacity of 500 MW. [81]
Figure 8-4 Histogram showing the number of Level 1, 2 and 3 locations in the range of GHI
values
Figure 8-4 clear that majority of the top performing locations receive an average GHI of
between 5-6 kWh/m2/Day. This is comparable to the solar resource of states like Gujrat and
Rajasthan, which have the maximum solar resource in India. From this, an inference can be made
that these locations have the sufficient solar resource to develop solar power, without the resource
0
20
40
60
80
4 4.5 5 5.5 6 More
Nu
mb
er o
f lo
cati
on
Range of GHI (kWh/m2/Day)

54
being a limiting criterion. The average solar radiation received in the region is much higher than
the United States, Japan and Germany, which are considered to be the world leaders in solar power.
[76]

55
Chapter 9 Discussion
The three aspects of community solar considered in this study are underlying factors which drive
the success of the community solar project. The importance of collective action in such projects
has been shown in different case studies across the world. Collective action or community being
the most important part of community solar, it is important to ensure that there is a strong presence
of societal networks and ability to work together in any potential community. To identify the
potential locations in India and their strengths & weaknesses, this study used common factor
analysis. Although the study identified, one common factor tying together the different
organizations present in the village, it is important to gain more information to assist in developing
community based projects. The influence of the underlying ability (common factor) on different
organizations varies according to the factor loading estimates. These indicate the strength of the
common factors influence on the individual observations. The previously mentioned ‘Level’
classification is purely based on the number of organizations present and it attaches no value to the
significance of the organization in the societal network. The definition of the various organizations
tells us that each organization plays a different role in the community. The question now becomes,
how do we distinguish between the different organizations or in other words, is one organization
more valuable than the other. Factor scores can be used to classify among locations that fall under
one Level based on the importance of the different organizations present. Based on the factor
loadings, all other things being equal, a Level 2 location which does not have an NGO is better
suited than a Level 2 location without a credit or savings group. This is because the common factor
has very little influence on the NGO compared to a local savings group. The presence of a local
savings group is more important to having a strong inherent ability to cooperate. . Credit or savings
groups contribute highly to local abilities compared to an NGO, which is usually an outside
organization. Though actively involved in developmental activities, NGOs displayed a very low

56
factor loading value on to the common factor. This could be attributed to the fact that NGOs are
not initiated by the locals and are typically based in urban locations. However, a similar explanation
cannot be offered for the low factor loading value of self-help groups (SHGs). SHGs have been
shown to be very important in promoting developmental activities and also are directly related to
increased penetration of microfinance. [82]
Along the lines of the example above, the factor scores calculated using the factor loadings
have been used as indicators of underlying ability of the community to organize amongst
themselves. A high factor score indicates a favorable skill to form organizations. This can be
verified by observing that the villages with higher number of institutions out of the twelve
considered have higher factor scores. Factor scores enable one to differentiate between locations
based on the institutions present, or absent. They also furnish information regarding unobservable
characteristics, which is made use of in this study in assessing the potential to host and manage a
community-based project. Factor score is an estimate to interpret the unobservable common factor
and compare the factor across the different villages. The results of the factor analysis on the IHDS
dataset indicate that the southern peninsular region has multiple locations with high performing
communities (in terms of factor score-indicating strong common factor). Due to the existing
societal framework, these locations would be ideally suited for community based projects. The
strength of the organizational framework will make it easier for any capacity building involving
the community and ensure that the community has sufficient experience in managing its affairs.
The presence of an established network of microfinance institutions makes it easier for
project developers and NGOs involved in capacity building to develop a financial model for the
project. A community with access to credit can be considered a viable location for a community
solar plant as the members will have the ability to pay for the services or make an investment as a
stakeholder. States like Andhra Pradesh, Kerala and Karnataka have multiple locations with good
community characteristics, and also perform well in the various indicators used to judge financial

57
capabilities. The penetration of microfinance indicates availability of credit and hence will act a
means for generating capital for the community solar project. Apart from the financial benefits,
microfinance institutions are an additional contributor to the community’s societal framework and
social capital.
Given that Gujarat and Rajasthan have the highest annual solar resource metrics for India,
they have each served as hubs for solar development in India. However, from viewing the histogram
of high performing potential locations and the respective average annual GHI, it can be concluded
that a majority other states also host a high annual solar resource comparable to that of Gujrat and
Rajasthan. Even though the histogram includes only the top performing locations from the analyses,
the distribution of the locations as seen in Figure 9-1 indicates the spread of the region with high
solar resource. This is in conjunction with the Figure 9-1, which suggests that a vast region of India
receives sufficient annual solar irradiance to develop solar power. This highlights the fact that the
solar resource will not be a limiting factor in developing community shared solar farms. Rather, it
will be the socioeconomic characteristics of the community that will determine the success or
failure of the model.
The different aspects of the study indicate that the peninsular region is a more favorable
environment to begin a community shared solar project. Although there would be other constraints
and influential factors, the three factors considered in this study are irrefutably important for the
success of a shared solar project and it would be justified to say the regions indicated in this study
have a much greater potential to succeed in community based endeavors compared to other regions.

58
Figure 9-1 Annual average global horizontal irradiance data for India, represented for solar
conditions from 2002-2011 [76]

59
Chapter 10 Conclusions
There is a lot of scope of rural electrification projects all over India, especially for distributed
generation using renewable power. The National Electricity Policy of India emphasizes deployment
of renewable power in locations where it is suitable and economical. [17] The Global Energy
Network Institute has shown that electricity consumption per capita has strong positive correlations
with social development. [6] Community driven development is touted as an integral part of rural
development. India’s community social structure provides a good framework for community based
projects.
While considering a developmental project, it is important to study the socioeconomic
aspects as well. With the solar resource shown not to be a limiting factor, community solar projects
in such locations can ride on the back of the local ability to collectively manage both the resource
and the money. The assessment does not confirm that any community in regions with higher ‘ability
to organize’ will be successful in developing a solar project. Rather, the results indicate that high
performing communities are more likely to succeed in managing a community-shared project. The
results present an interesting case for the interdependency of the community and the financial
aspects. The community characteristics analysis can be considered a broader study incorporating a
range of community based organizations, while the financial aspect study will be a subset focusing
only on the access to credit and financial services.
This study clearly indicates that if community solar gardens have to be promoted in India,
the best places to start will be the communities in the southern part of the country. These regions
have multiple locations which come out on top in underlying abilities to organize and also have
good penetration of microfinance. It has been shown that solar resource if abundant throughout
the country. Hence, multiple communities in southern India have favorable characteristics for
development of community solar projects. This is not to say that such projects will fail in other

60
regions. It could take a lot more capacity building to successfully host and manage such projects
in regions which do not perform well in the considered here.
Such studies debunk assumptions about developing capital-intensive renewable energy
projects in emerging economies. The analysis of the different aspects of community solar projects
shows that many rural communities are capable of owning and managing community based solar
projects. The results presented here are not means to zero in on an ideal location but only aim to
judge the capabilities of the region in a broad manner. A recent New York Times3 article,
describes SELCO India’s efforts to use microfinance to innovatively fund solar home systems
projects in rural Karnataka, a southern Indian state. In a developing economy like India,
community solar can play an important role in integrated development and enhance the quality of
life in rural locations. Considering solar resource is not a limiting factor, the local socioeconomic
characteristics take prominence. Emphasis must be placed on such analyses of socioeconomic
factors to promote the development of community based solar projects.
3 http://www.nytimes.com/2016/01/03/business/energy-environment/electrifying-india-with-the-
sun-and-small-loans.html

61
References
1. Urban, F., R.M. Benders, and H.C. Moll, Energy for rural India. Applied Energy, 2009.
86: p. S47-S57.
2. Govt. of India Definition of Village Electrification. 2004 [cited 2014 May 28]; Available
from: http://powermin.nic.in/rural_electrification/definition_village_electrification.htm.
3. Govt. of India. Open Government Data (OGD) Platform India. 2012 [cited 2014 May 28];
Available from: data.gov.in.
4. Ozturk, I., A. Aslan, and H. Kalyoncu, Energy consumption and economic growth
relationship: Evidence from panel data for low and middle income countries. Energy
Policy, 2010. 38(8): p. 4422-4428.
5. Ozturk, I., A literature survey on energy–growth nexus. Energy policy, 2010. 38(1): p. 340-
349.
6. Leung, C.S. and P. Meisen, How electricity consumption affects social and economic
development by comparing low, medium and high human development countries. Retrieved
November, 2005. 10: p. 2013.
7. Kirubi, C., et al., Community-based electric micro-grids can contribute to rural
development: evidence from Kenya. World development, 2009. 37(7): p. 1208-1221.
8. Chakrabarti, S. and S. Chakrabarti, Rural electrification programme with solar energy in
remote region–a case study in an island. Energy Policy, 2002. 30(1): p. 33-42.
9. Chaurey, A. and T. Kandpal, Solar lanterns for domestic lighting in India: viability of
central charging station model. Energy Policy, 2009. 37(11): p. 4910-4918.
10. Chaurey, A. and T.C. Kandpal, Assessment and evaluation of PV based decentralized rural
electrification: An overview. Renewable and Sustainable Energy Reviews, 2010. 14(8): p.
2266-2278.
11. Chaurey, A. and T.C. Kandpal, A techno-economic comparison of rural electrification
based on solar home systems and PV microgrids. Energy Policy, 2010. 38(6): p. 3118-
3129.
12. Deorah, S.M. and L. Chandran-Wadia, Solar-mini Grids for Rural Electrification. 2013,
Observer Research Foundation Mumbai. p. 80.
13. Moharil, R.M. and P.S. Kulkarni, A case study of solar photovoltaic power system at
Sagardeep Island, India. Renewable and Sustainable Energy Reviews, 2009. 13(3): p. 673-
681.
14. Pillai, I.R. and R. Banerjee, Renewable energy in India: Status and potential. Energy, 2009.
34(8): p. 970-980.
15. Ramachandra, T., R. Jain, and G. Krishnadas, Hotspots of solar potential in India.
Renewable and Sustainable Energy Reviews, 2011. 15(6): p. 3178-3186.
16. Ulsrud, K., et al., The solar transitions research on solar mini-grids in India: learning from
local cases of innovative socio-technical systems. Energy for Sustainable Development,
2011. 15(3): p. 293-303.
17. Nouni, M., S. Mullick, and T. Kandpal, Providing electricity access to remote areas in
India: An approach towards identifying potential areas for decentralized electricity supply.
Renewable and Sustainable Energy Reviews, 2008. 12(5): p. 1187-1220.
18. Scott, J. and G. Marshall, A dictionary of sociology. 2009: Oxford University Press.
19. Pretty, J. and H. Ward, Social capital and the environment. World Development, 2001.
29(2): p. 209-227.

62
20. Pantoja, E., Exploring The Concept of Social Capital and its Rellevance for Community
Based Development: The Case of Coal Mining Areas in Orissa, India. World Bank, 2000.
Social Capital Initiative-Working Paper.
21. Pretty, J., Social capital and the collective management of resources. Science, 2003.
302(5652): p. 1912-1914.
22. Vanni, F., Agriculture and Public Goods, in Agriculture and Public Goods. 2014, Springer.
p. 1-19.
23. Meinzen-Dick, R., M. DiGregorio, and N. McCarthy, Methods for studying collective
action in rural development. Agricultural systems, 2004. 82(3): p. 197-214.
24. McCarthy, N., C. Dutilly-Diané, and B. Drabo, Cooperation, collective action and natural
resources management in Burkina Faso. Agricultural Systems, 2004. 82(3): p. 233-255.
25. Shiferaw, B., et al., Leveraging institutions for collective action to improve markets for
smallholder producers in less-favored areas. African Journal of Agricultural and Resource
Economics, 2009. 3(1): p. 1-18.
26. Saxena, N.C., The saga of participatory forest management in India. 1997: CIFOR.
27. Malhotra, P., Management of community-based energy interventions in rural areas of
India: issues and perspectives. Sustainable Development, 2006. 14(1): p. 33-45.
28. Yadoo, A. and H. Cruickshank, The value of cooperatives in rural electrification. Energy
Policy, 2010. 38(6): p. 2941-2947.
29. Wijayaratna, C., ROLE OF LOCAL COMMUNITIES AND INSTITUTIONS IN
INTEGRATED RURAL DEVELOPMENT, in Role of Local Communitis and Institutions in
Intgrated Rural Development. 2004, Asian Productivity Organization.
30. Ostrom, E., Governing the commons: The evolution of institutions for collective action.
1990: Cambridge university press.
31. Isham, J., D. Narayan, and L. Pritchett, Does participation improve performance?
Establishing causality with subjective data. The World Bank Economic Review, 1995.
9(2): p. 175-200.
32. Isham, J. and S. Kähkönen, What Determines the Effectiveness of Community-Based Water
Projects. Social Capital Initiative Working Paper, 1999. 14.
33. Walker, G., What are the barriers and incentives for community-owned means of energy
production and use? Energy Policy, 2008. 36(12): p. 4401-4405.
34. Coughlin, J., et al., A Guide to Community Shared Solar: Utility, Private, and Nonprofit
Project Development. Disponível: http://www. nrel. gov/docs/fy12osti/54570. pdf, 2012.
35. Farrel, J., Community Solar Power-Obstacles and Opportunities, in The New Rules
Project. 2010, Institute of Local Self Reliance.
36. Hubner, J. Community-owned solar: Like drinking milk without caring for the cow. 2012
[cited 2014 10 Aug]; Available from: http://www.pv-
magazine.com/news/details/beitrag/community-owned-solar--like-drinking-milk-without-
caring-for-the-cow_100009253/#ixzz3A12EleLN.
37. UPCS LLC. University Park Solar. 2010 [cited 2014 May 29]; Available from:
http://www.universityparksolar.com/.
38. Shrank, S., Another Look at Renewables on India's Sagar Island. Standford University,
2008.
39. Community Solar Power Plant Project-Jhansi. 2011, OneWorld Foundation India.
40. Khan, M.I., A.B. Chhetri, and M.R. Islam, Community-based energy model: A novel
approach to developing sustainable energy. Energy Sources Part B-Economics Planning
and Policy, 2007. 2(4): p. 353-370.

63
41. Hussain, A.H., N.U.R.K. Khattak, and A.Q.K. Khan, Role of Community Based
Organizations in Rural Development: A Case Study of Selected CBOs in District Swat.
2008.
42. Aggarwal, V., et al., Rural Energy Alternatives in India: Opportunities in Financing and
Community Engagement for Renewable Energy Microgrid Projects, in Woodrow Wilson
School of Public and International Affairs. 2014, Princeton University.
43. Hiatt, S.R. and W.P. Woodworth, Alleviating poverty through microfinance: Village
banking outcomes in Central America. Social Science Journal, 2006. 43(3): p. 471-477.
44. Imai, K.S., T. Arun, and S.K. Annim, Microfinance and Household Poverty Reduction New
Evidence from India. World Development, 2010. 38(12): p. 1760-1774.
45. Kabir Hassan, M., The microfinance revolution and the Grameen Bank experience in
Bangladesh. Financial Markets, Institutions & Instruments, 2002. 11(3): p. 205-265.
46. Mahjabeen, R., Microfinancing in Bangladesh: Impact on households, consumption and
welfare. Journal of Policy Modeling, 2008. 30(6): p. 1083-1092.
47. Rao, P.S.C., et al., Energy-microfinance intervention for below poverty line households in
India. Energy Policy, 2009. 37(5): p. 1694-1712.
48. Champatiray, A.K., P. Agarwal, and S. Sadhu, Map of Microfinance Distribution in India.
2010, Institute for Financial Management and Research.
49. Lutz, E., Agriculture and the environment: perspectives on sustainable rural development.
1998, World Bank Publications. p. 103-117.
50. Desai, S., et al., India human development survey (IHDS). University of Maryland and the
National Council of Applied Economic Research (NCAER), New Delhi, 2005.
51. Vanneman, R., S. Desai, and J. Noon. Social capital in India: networks, organizations, and
confidence. in Annual Meeting of the American Sociological Association. Montreal. 2006.
52. Katoch, M. and N.D. Gupta, Community Based Organizations and Informal Social
Network Ties in Rural India. 2011.
53. Fujiie, M., Y. Hayami, and M. Kikuchi, The conditions of collective action for local
commons management: the case of irrigation in the Philippines. Agricultural Economics,
2005. 33(2): p. 179-189.
54. Vyas, S. and L. Kumaranayake, Constructing socio-economic status indices: how to use
principal components analysis. Health Policy Plan, 2006. 21(6): p. 459-68.
55. Shruti Mahajan Deorah and L. Chandran-Wadia, Solar-mini Grids for Rural
Electrification. 2013, Observer Research Foundation Mumbai. p. 80.
56. Contributors, W. Microfinance. 14 May 2014 00:19 UTC [cited 2014 27 May]; Available
from: http://en.wikipedia.org/w/index.php?title=Microfinance&oldid=608472344.
57. Shylendra, H., Microfinance institutions in Andhra Pradesh: crisis and diagnosis.
Economic and Political Weekly, 2006: p. 1959-1963.
58. Van Bastelaer, T., Imperfect information, social capital and the poor's access to credit.
Center for institutional reform and the informal sector. Working paper, 2000. 234.
59. Background Note: 03 Microfinance in India: An Overview 2011,
microfinancegateway.org.
60. Yerramilli, P., The Politics of the Microfinance Crisis in Andhra Pradesh, India. The
Journal of Politics and Society, 2013. 24(1): p. 190-225.
61. Mahajan, V. and B.G. Ramola, Microfinance in India: Banyan Tree and Bonsai. A review
paper for the Banco MundialWashington, DC, 2003.
62. Nasir, S., Microfinance in India: Contemporary Issues and Challenges. Middle East
Journal of Scientific Research, 2013. 15(2).
63. Sengupta, R. and C.P. Aubuchon, The microfinance revolution: An overview. Federal
Reserve Bank of St. Louis Review, 2008. 90(January/February 2008): p. 9-30.

64
64. Pode, R., Financing LED solar home systems in developing countries. Renewable and
Sustainable Energy Reviews, 2013. 25(0): p. 596-629.
65. Anderson, C.L., L. Locker, and R. Nugent, Microcredit, social capital, and common pool
resources. World Development, 2002. 30(1): p. 95-105.
66. Ostrom, E., Constituting Social Capital and Collective Action. Journal of theoretical
politics, 1994. 6(4): p. 527-562.
67. Jain, P.S., Managing credit for the rural poor: lessons from the Grameen Bank. World
Development, 1996. 24(1): p. 79-89.
68. Cynthia Neudoerffer, R., P. Malhotra, and P. Venkata Ramana, Participatory rural energy
planning in India—a policy context. Energy Policy, 2001. 29(5): p. 371-381.
69. Sovacool, B.K., Expanding renewable energy access with pro-poor public private
partnerships in the developing world. Energy Strategy Reviews, 2013. 1(3): p. 181-192.
70. Grimshaw, D.J. and S. Lewis, Solar power for the poor: facts and figures. Science and
Development Network, 2010. 24.
71. Winiecki, J. Linking Solar Energy & Microfinance. Accelerating Access to Energy 2010
[cited 2014 June 6]; Available from:
http://www.gvepinternational.org/en/business/news/linking-solar-energy-and-
microfinance.
72. Morris, E., et al., Using Microfinance to Expand Access to Energy Services: Summary of
Findings. 2007, United States Agency for International Development.
73. Kaufman, S.L., Solar electricity for rural development: Experience in the Dominican
Republic. Energy for Sustainable Development, 1994. 1(1): p. 43-45.
74. Parthan, B. Solomon Islands Solar: A New Microfinance Concept Takes Root. 2009 [cited
2014 June 10].
75. Govt. of India. Department of Rural Development, Ministry of Rural Development. 2012
[cited 2014; Available from: http://rural.nic.in/.
76. Garud, S. and I. Purohit, Making solar thermal power generation in India a reality–
Overview of technologies, opportunities and challenges. The Energy and Resources
Institute (TERI), Darbari Seth Block, IHC Complex, Lodhi Road, New Delhi, 2009.
110003.
77. Lopez, A. and B. Roberts, India Solar Resource, G.H.I.-A. Average, Editor. 2013, National
Renewable Energy Laboratory.
78. Yeomans, K.A. and P.A. Golder, The Guttman-Kaiser Criterion as a Predictor of the
Number of Common Factors. Journal of the Royal Statistical Society Series D-the
Statistician, 1982. 31(3): p. 221-229.
79. Bhandari, A.K., Access to banking services and poverty reduction: a state-wise assessment
in India. 2009, IZA discussion papers.
80. Misra, R., Primary Agricultural Credit Society Linkage, India: The Best Remote Rural Self-
Help Groups Can Do? 2008, Coady International Institute: Antigonish.
81. Ministry of New & Renewable Energy. Generation of Solar Power. 2012 [cited 2014 19
August]; Available from: http://pib.nic.in/newsite/erelease.aspx?relid=81229.
82. Deininger, K. and Y. Liu, Economic and social impacts of self-help groups in India. 2009.

65
Appendix
Exploratory Factor Analysis
Factor analysis is a method which aims to determine the underlying structure or behavior
in a dataset. A dataset here is defined as multiple observations for a variable set. The goal of factor
analysis is to determine the number of individual constructs (factors) required to account for the
pattern of correlations in the data. The characteristics of these so called factors are explained by
estimating the strength and direction of influence (correlation) of each of the factors on each of the
variables. These estimates are referred to as ‘factor loadings’. Factor analysis will allow us to
interpret variables not as fundamental quantities but as derivable from some basic unobserved latent
components.
Common Factor Model
We observe nonzero correlation between the variables in the data set because the variables
are influenced (linear influence) by unobserved underlying behavior. This also means that sets of
variables collectively explain hidden patterns or behavior. This underlying construct is defined as
a common factor. The common factor is an unobserved construct which exerts linear influence on
more than one variable in the data set. It is called common factor because it is common to more
than one variable. The Common Factor Model assumes that whenever the observed variables are
correlated, there will exist common factors within the dataset. The idea is to exploit these common
factors to explain the correlations among the variables. The method is advantageous only if the
number of factors is less than the number of variables.

66
Figure A1 Common Factor Model
Figure A1 represents a common factor model where each measured variable MV is
influenced by a unique factor UF and a Common Factor. The unique factor influences only the
corresponding variable but the common factors can exert their influence on more than one
measured variable. The influence of a common factor is stronger for a group of variables compared
to the rest. Factors Analysis aims to extract these common factors as unobserved
estimates/constructs/indices. The knowledge of the measured variables influenced by a common
factor helps in the interpretation of the factor. Common factors are usually unobservable latent
constructs like ability, capacity, status etc. The solid lines represent the strong influence of the
common factor on the measured variable. The dotted lines represent weak influence of the factor
on the variables. In factor analysis, only the strong influence of the factor is taken into account and
hence some amount of variation in the dataset goes unexplained.

67
Unique Factors
Unique factors are unobserved source of linear influence on a single variable in the data
set. The Common Factor Model assumes that each variable is affected by a unique factor. The
unique factor represents the portion of the score on the variable that is not explained by the common
factor. These are characteristics of each variable that are individualistic and do not explain the
correlation in the dataset. The correlation is explained by common factors. The unique factors are
assumed to be independent of each other. In the case of our dataset, the unique factors are the
unobserved factors which cause each of the measured variables. For example, the necessity or the
inclination to form a particular trade union or a cooperative will be a unique factor which results in
one particular measured variable being a response.
Common Factors
Common factors, also unobserved, are sources of influence on more than one measured
variables. Their influence on some of the measured variables can be very strong and not so strong
on the others. For example, the inclination to promote trade might lead to the formation of trade
unions, self-help groups, cooperatives but will not have a great influence on the formation of
caste associations or festival groups. In this case, ‘inclination to promote trade’ can be considered
a common factor.
Representing the Variance in the Data
Using the above definitions of common and unique factors we can divide the observed
variance in the data into two parts as shown below.
𝑇𝑜𝑡𝑎𝑙 𝑣𝑎𝑟𝑖𝑎𝑛𝑐𝑒 = 𝑐𝑜𝑚𝑚𝑜𝑛 𝑣𝑎𝑟𝑖𝑎𝑛𝑐𝑒 + 𝑢𝑛𝑖𝑞𝑢𝑒 𝑣𝑎𝑟𝑖𝑎𝑛𝑐𝑒

68
This is directly from the assumptions that the factors are directly involved in explaining
the variance in the dataset.
The common factor model uses the above definitions to ‘estimate’ the common factors and
the strength of their influence on measured variables. To begin with, no assumptions are made
about the numerical values of the strength (influence/correlation) of the common factors on the
measured variables. These are estimated by fitting the data according to the Common Factor Model.
The numerical values of the strength of the factors’ influence on the variable are called factor
loadings.
Mathematical Model
The common factor model aims to explain the variables as a linear combination of common
factors and a unique factor. Each variable is associated with a unique factor while the number of
common factors is less than the total number of variables. The random variables are expressed as a
linear combination of common factors and "factor pattern loadings". The factor pattern loadings
are the weights assigned to the common factors and unique factor components. So the variable is
represented as a combination of common factors and unique factors.
Hence the mathematical representation is as shown below,
𝑌1 = 𝑙11𝐹1 + 𝑙12𝐹2 … + 𝑙1𝑟𝐹𝑟 + 𝜓1𝜖1
𝑌2 = 𝑙21𝐹1 + 𝑙22𝐹2 … + 𝑙2𝑟𝐹𝑟 + 𝜓2𝜖2
𝑌𝑛 = 𝑙𝑛1𝐹1 + 𝑙𝑛2𝐹2 … + 𝑙𝑛𝑟𝐹𝑟 + 𝜓𝑛𝜖𝑛
The above equations represent a case where we have n variables in the data set. F1…Fr
represent the r common factors extracted (r<n). ‘lir’ represents the factor pattern loading for the ith

69
variable on the rth factor. ϵi is the unique factors and the ψs are the unique factor loadings for the
variables.
The above expression can also be expressed in the matrix form
𝑌 = 𝐿𝐹 + 𝜓𝜖
This expression in the matrix form can incorporate multiple observations (data producing
entities).
Factor analysis is all about explaining the common variance between variables in terms of
hypothetical common factors. Since the variables are not perfectly correlated, there must be a
component of variance other than the common variance. This is the unique variance term. Hence
the variance in the observed variables can be divided into the common variance and unique
variance.
Taking the variance of the matrix form we arrive at the following expression.
𝐸(𝑌𝑌′) = 𝐸[(𝐿𝐹 + 𝜓𝜖)(𝐿𝐹 + 𝜓𝜖)′]
𝑃 = 𝐸[𝐿𝐹𝐹′𝐿′ + 𝐿𝐹𝜖′𝜓′ + 𝜓𝜖𝐹′𝐿′ + 𝜓𝜖𝜖′𝜓′]
𝑃 = 𝐿𝐸[𝐹𝐹′]𝐿′ + 𝐿𝐸[𝐹𝜖′]𝜓′ + 𝜓𝐸[𝜖𝐹′]𝐿′ + 𝜓𝐸[𝜖𝜖′]𝜓′
We have stated that the unique factors are independent of each other and they are
independent with the common factors as well. The value of E(ϵ ϵ’) is equal to 1 and the cross
correlation terms between ϵ and F i.e. E(F ϵ’) and E(ϵF’) are 0. Hence the middle two terms in the
above equation disappear and the resultant equation is shown below.
𝑃 = 𝐿 Ф𝐿’ + 𝜓2
P- the variance covariance matrix
L – This matrix is defined as the strength and direction of the influence of the common
factors on the variables. From previous definition, the elements of this matrix are the factor
loadings. This matrix is also called the factor loading matrix. This matrix has as many columns as

70
there are common actors and as many rows as there are variables. Hence each element is the
strength and direction (given by the sign) of the influence of each factor on each variable (hence
no. of factors times no. of variables).
Ф is the correlation matrix among the common factors i.e. E(FF’)
The cross correlation terms between the common and unique factors are all zero as the
common factors are not correlated with the unique factors.
𝝍𝟐- This matrix represents the covariance matrix among the unique factors. The diagonal
elements represent the variance of the unique factors and the off diagonal elements are zero as the
unique factors are also assumed to be independent.
The above expression in matrix form is the fundamental expression for the common factor
model in the matrix form. The expression can be re-written as
𝑃 − 𝜓2 = 𝐿 Ф𝐿’
The difference matrix in the LHS (𝑃 − 𝜓2) called the ‘reduced correlation matrix’. 𝜓2 is
a diagonal matrix. Subtracting it from the population correlation matrix P does not affect the off
diagonal elements. 𝜓2 is the unique variance. Subtracting the unique variance from the total
variance gives us the common factor variance. Hence the diagonal elements are variances observed
due to common factors only. The diagonal elements represent the proportion of variance each
variable has in common with the other variables. These are also referred to as communalities. This
is explained in the section following the example.
The Ф matrix is a unit matrix or not depending on the assumptions about the independence
of the factors. The general assumption is that the factors are independent and hence have no
correlation with each other. In this case the Ф matrix becomes a unit matrix and the right hand side
is nothing but the squares of the factor loadings (L times L’). The matrix equation above equates
the common factor variance in the dataset to a matrix of factor loadings. This estimate of factor
loadings will be good coefficients for the common factors.

71
Numerical Example
Consider the following data set in a class. The data set contains the grades of the 5 students
in three subjects which are finance, marketing and policy. The goal here is to determine the
underlying ability of the students to perform in these subjects.
In exploratory factor analysis, we ask the program to compute all the factors based on the
common factor model and then choose the factors that are relevant to us. In the dataset given below,
the subjects i.e. Finance, Marketing and Policy are the measured variables and the different students
are the observations. Each of the measured variables is a linear combination of the underlying
common factors weighted by the factor loadings.
Student No. Finance Marketing Policy
Student 1 3 6 5
Student 2 7 3 3
Student 3 10 9 8
Student 4 3 9 7
Student 5 10 6 5
The common factor model for the above data set will look like
𝐹𝑖𝑛𝑎𝑛𝑐𝑒 = 𝑙10 + 𝑙 𝐹11
1 + 𝑙12𝐹2 + ⋯ + 𝑒1
𝑀𝑎𝑟𝑘𝑒𝑡𝑖𝑛𝑔 = 𝑙20 + 𝒍𝟐𝟏𝐹1 + 𝑙22𝐹2 + ⋯ . + 𝑒2
𝑃𝑜𝑙𝑖𝑐𝑦 = 𝑙30 + 𝒍31𝐹1 + 𝑙32𝐹2 + ⋯ + 𝑒3
In the above model, the l terms are the factor coefficients /factor loadings and the F terms
are the factor scores
Of the multiple common factors, we will retain the factors which will explain best the
underlying ability to score in the subjects. This means that we retain as many factors as it requires
to explain the variance in the dataset while reducing the dimension of the dataset that we need to
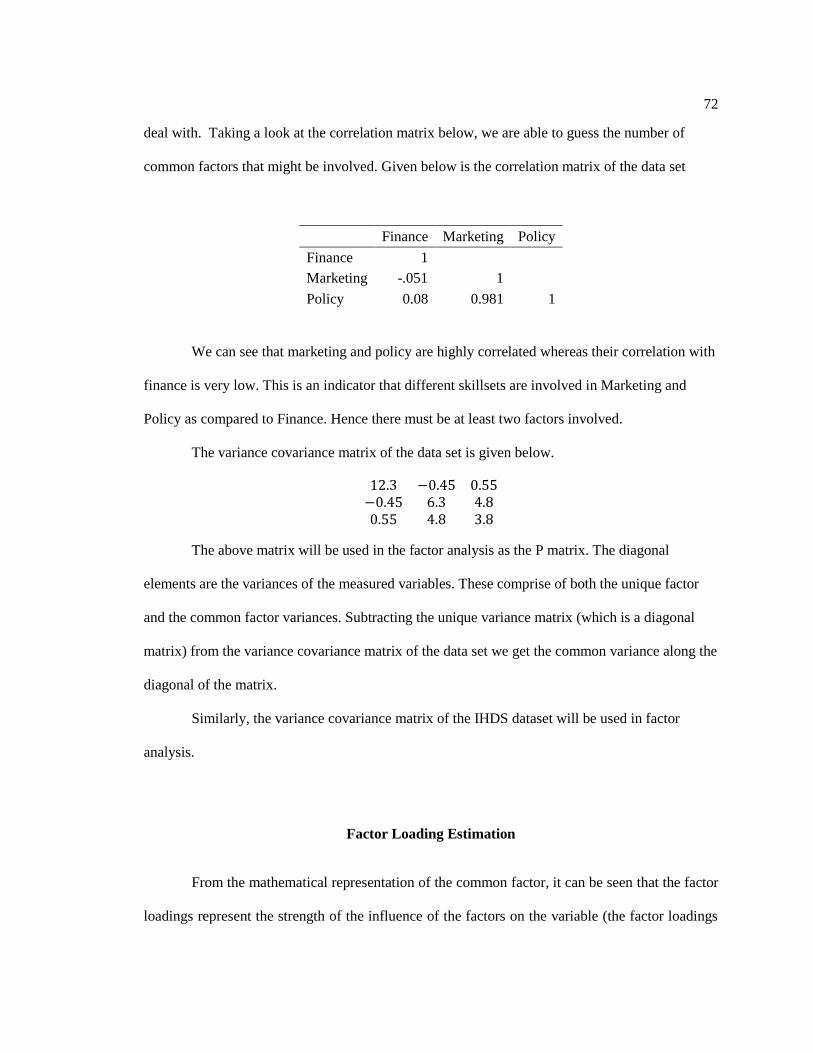
72
deal with. Taking a look at the correlation matrix below, we are able to guess the number of
common factors that might be involved. Given below is the correlation matrix of the data set
Finance Marketing Policy
Finance 1
Marketing -.051 1
Policy 0.08 0.981 1
We can see that marketing and policy are highly correlated whereas their correlation with
finance is very low. This is an indicator that different skillsets are involved in Marketing and
Policy as compared to Finance. Hence there must be at least two factors involved.
The variance covariance matrix of the data set is given below.
12.3 −0.45 0.55−0.45 6.3 4.80.55 4.8 3.8
The above matrix will be used in the factor analysis as the P matrix. The diagonal
elements are the variances of the measured variables. These comprise of both the unique factor
and the common factor variances. Subtracting the unique variance matrix (which is a diagonal
matrix) from the variance covariance matrix of the data set we get the common variance along the
diagonal of the matrix.
Similarly, the variance covariance matrix of the IHDS dataset will be used in factor
analysis.
Factor Loading Estimation
From the mathematical representation of the common factor, it can be seen that the factor
loadings represent the strength of the influence of the factors on the variable (the factor loadings

73
are the coefficients of the factor in the linear expression). The off diagonal elements of the reduced
correlation matrix are the correlations among the measured variables and the diagonal elements are
the communalities. The off diagonal elements can be estimated from the variable data set. The
question now becomes, how to estimate the communalities?
In 1956, Louis Guttmann found that, when the common factor model holds perfectly for
the entire population, the communality for a measured variable must be equal to or greater than the
Squared Multiple Correlations.
Since in most cases the variable set is a sample set of the population and we aim to estimate
the factor loadings which fit the mathematical model, the squared multiple correlations can be used
as good estimates of the communalities.
Squared Multiple Correlations to Estimate Communalities
The coefficient of multiple correlation is a measure of how well a variable can be predicted
using a linear function of other variables. It is defined as the correlation coefficient between the
predicted and actual values of the dependent variable in a regression model. For a given variable
the squared multiple correlation refers to the proportion (or fraction) of variance of that variable
that is accounted for (explained) by the remaining variables in the data set. It defines how well one
variable is represented by the other variables. Squared Multiple Correlation is the R2 value when
one measured variable is regressed over all the remaining measured variables.
Computationally the squared multiple correlations can be used as a reasonable estimate of
the communalities which are the diagonal elements of the reduced correlation matrix (P-ψ). Now
since all the estimates of the factor loading matrices are known, the goal is to estimate the values
of the factor scores.

74
Choosing the Number of Factors
The number of common factors, ideally is the number of factors which
Account for a good amount of variance in the data
Has fewer number of factors than there are variables
All the common factors are readily interpretable and can be related to theoretical principles
The following methods are generally used to determine the number of factors to be retained
Eigenvalues Greater than One
This is the most commonly used rule to determine the number of factors. This is based on
the principle that greater the eigenvalue of a factor the greater the variance explained in the dataset.
An n by n data set has n eigenvalues. The eigen values of an n by n data set can be
represented as an n dimensional ellipsoid. By the theoretical definition, the eigenvectors are the
axes of the ellipsoid representation of the data. The axes are perpendicular to each other and
similarly the eigenvectors are orthogonal. The eigenvalues are the lengths of the eigenvectors.
Eigenvalues are the half lengths of the axes of the ellipsoid. From this definition, the largest axis
of the ellipsoid has the largest eigenvalue.
For a number of two dimensional coordinates, we will find a distribution of points which
can be enclosed by an ellipse. The axes of the ellipse become the eigenvectors and the half lengths
of the axes become the eigenvalues. Obviously, the largest variation in the data is along the largest
axis of the ellipse. These data points have the highest range (spread) in terms of coordinates. The
axis (an eigenvector) explains the highest proportion of variance in the data. The longest portion of
the ellipse or ellipsoid will encompass the most data points hence covering a good range of the
dataset’s variation. Since this is the longest axis, it will be the longest eigenvector in terms of length

75
and hence it will have the largest eigenvalue. This gives us a relation between the eigenvalue of a
dataset and the variation in the data. The largest eigenvalue explains the maximum proportion of
variance in the data.
For an n-dimensional dataset enclosed by an ellipsoid, the longest axis accounts for the
greatest range of the points and hence will account for the greatest variation. The n eigenvectors
put together account for the total variation in the dataset.
The idea can be mathematically explained as follows.
The eigenvalue of the correlation matrix of the data set corresponds to the proportion of
the variance explained by a factor. Hence the initial factor solution will have as many factors as
there are eigenvalues i.e. as many variables. Each factor will have a corresponding eigenvalue. The
Kaiser-Guttman Rule states that, we can retain the factors which have an eigenvalue greater than
1. The eigenvalue of a factor is also equal to the sum of the squared factor loadings of all the
variables on that factor. The greater the eigenvalue, the greater is the proportion of the variance
explained by the factors. Hence only those factors are chosen which explain a good proportion of
the variance.
Scree Plot
A scree plot is a plot of the eigenvalues of the correlation matrix (same as the eigenvalues
of the facors) in descending order. The y-axis is the value of the eigenvalue and x-axis is the number
of the eigenvalue (in descending order). The idea here is to include the number of eigenvalues
which precede the last major drop in eigenvalue. This method also results in choosing the factors
with high eigenvalues implying that, we retain only those factors which explain a large proportion
of the variance. Given below is an example of a scree plot.
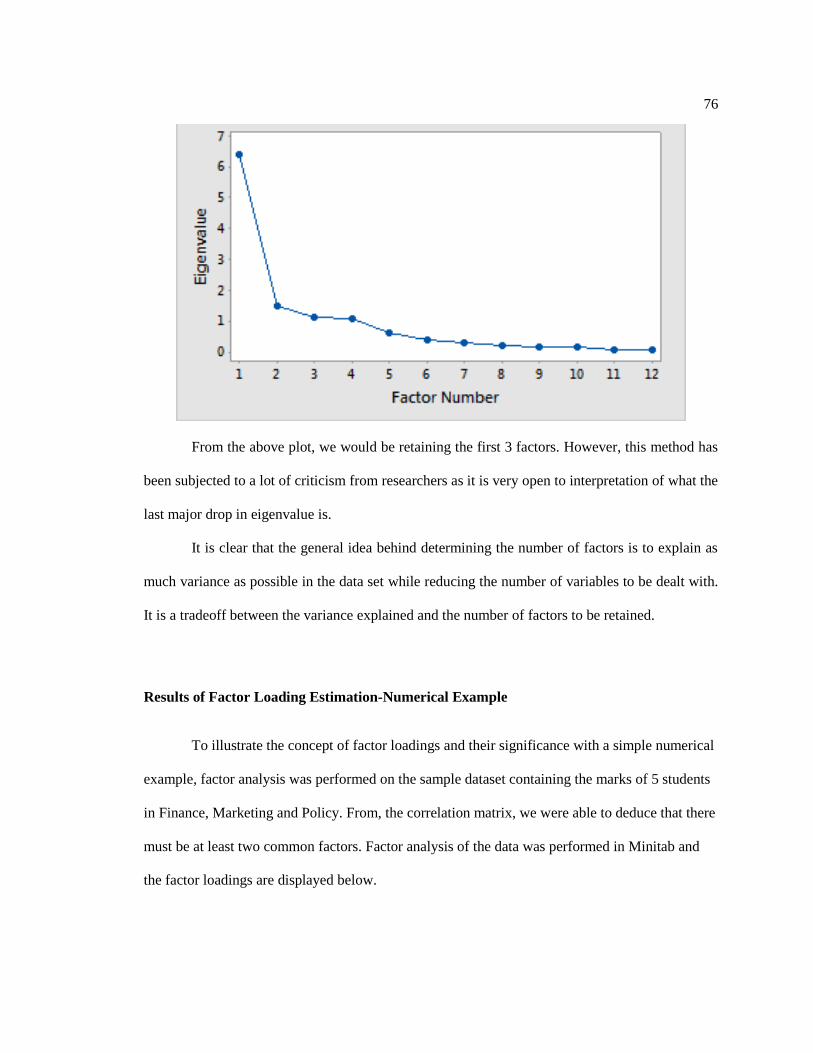
76
From the above plot, we would be retaining the first 3 factors. However, this method has
been subjected to a lot of criticism from researchers as it is very open to interpretation of what the
last major drop in eigenvalue is.
It is clear that the general idea behind determining the number of factors is to explain as
much variance as possible in the data set while reducing the number of variables to be dealt with.
It is a tradeoff between the variance explained and the number of factors to be retained.
Results of Factor Loading Estimation-Numerical Example
To illustrate the concept of factor loadings and their significance with a simple numerical
example, factor analysis was performed on the sample dataset containing the marks of 5 students
in Finance, Marketing and Policy. From, the correlation matrix, we were able to deduce that there
must be at least two common factors. Factor analysis of the data was performed in Minitab and
the factor loadings are displayed below.

77
Variable Factor1 Factor2
Finance 0.03 1.00
Marketing 0.994 -0.08
Policy 0.996 0.05
The factor loading matrix clearly shows that Marketing and Policy lead heavily on
Factor1 and Finance loads heavily on Factor2. Clearly, Factor1 includes the skillset and
characteristics needed to perform well in Marketing and Policy and Factor2 includes the
characteristics required to excel in Finance. These loadings are an estimate of the strength of the
influence of the common factors on the different measured variables. These are estimated by
fitting the LL’ matrix to the reduced correlation matrix (P − ψ2)
Factor Scores
The factor loading matrix is useful because it enables us to relate the observed variables to
the underlying unobserved factors. Since the common factors have more importance than the
observed variables, we wish to relate the observations (the villages) to the factors. This allows us
to work with factors for each observation (location in our specific case) and since the number of
factors is always less than the number of variables, we have a smaller data set to work with and one
which explains any underlying influential behavior. Hence the factor score is a way to relate each
observation to each of the factors.
The most common method used to estimate factor scores is a multiple regression method.
The known data scores are used as predictor variables and a weighted linear combination of the
variables is used to predict the factor score. The linear expression for calculating the factor score is
given by a combination of predictor variables and their regression coefficients. However, while
calculating the factor scores, the coefficients of the predictor variables must be estimated first.

78
The predictors in the regression equation are the variables in the dataset. The regression
coefficients are estimated using the OLS methods. The independent variable is the matrix of
correlations among the data variables. The dependent variable is the factor loadings from the
variables on a particular factor. Solving this will give us the coefficients which can then be used in
the multiple regression equation to predict the factor score for each observation. The mathematical
model for estimating β I shown below
𝛽1 + 𝛽2 𝑟12 + 𝛽3𝑟13 + ⋯ 𝛽𝑛𝑟1𝑛 = 𝑙1𝑓1
𝛽1𝑟21 + 𝛽2 + 𝛽3𝑟23 + ⋯ 𝛽𝑛𝑟2𝑛 = 𝑙2𝑓1
𝛽1𝑟𝑛1 + 𝛽2 𝑟𝑛2 + 𝛽3𝑟𝑛3 + ⋯ 𝛽𝑛 = 𝑙𝑛𝑓1
This is an Ordinary Least Squares Model which can be used to estimate the values of β.
This can be represented in matrix form as
𝑃𝛽 = 𝑙𝑓1
P is the matrix of correlations among the variables-the population correlation matrix
𝑙𝑓1 is the column matrix of the factor loadings of all the variables on the first factor F1
Once the β values are estimated using least squares, they are then used in predicting the
factor scores.
The linear equation is shown below, the subscript ‘i’ refers to the ‘ith’ observation.
𝑓1𝑖 = 𝛽1𝑦1𝑖 + 𝛽2𝑦2𝑖 + 𝛽3𝑦3𝑖 … . + 𝛽𝑛𝑦𝑛𝑖
𝑓1𝑖- This is the factor score for factor 1 (F1) for observation i
𝑦1𝑖 – this is the value (score) of variable 1 for observation i
𝑦2𝑖 – this is the value (score) of variable 2 for observation i
𝛽 – this is the standard regression coefficient for any variable.

79
The above steps correspond to the factor score of one observation i alone. This step has to
be repeated as many number of times as there are observations. Also these are the factor scores for
just one factor.
The steps are repeated for every factor. The factor scores represent the influence of the
underlying construct on each of the observations and can be used in further analysis.
As we can see that regression model uses the measured variables and the influence of each
factor on different measured variables to obtain information to estimate the factor score for each
observation.
Results of Factor Score Estimation-Numerical Example
To complete the factor analysis of the sample data set, the factor score coefficients and the
factor scores were estimated. The matrix of βs is given below. These are also called the factor score
coefficients, since these are the coefficients in the multiple regression equation used to estimate the
factor scores. The coefficients are estimated using the OLS Model described above.
Variable Factor1 Coefficient Factor2 Coefficient
Finance 0.015 0.991
Marketing 0.502 -0.081
Policy 0.503 0.051
Using the factor score coefficients and the measured variables, the factor scores can be
estimated for each factor for each observation. The linear relationship used to calculate the factor
scores is described earlier in the section.

80
Student No. Factor1 Score Factor2 Score
Student 1 5.6 2.7
Student 2 3.1 6.9
Student 3 8.7 9.6
Student 4 8.1 2.6
Student 5 5.7 9.7
The factor scores indicate how each student measures up in that particular characteristic a
factor signifies. It was seen that Factor2 indicated ability to perform well in finance. We see that
student 3 and student 5 have high factor2 scores indicating that they have a good ability to excel
in Finance. If we refer back to the dataset, we notice that student 3 and student 5 have scored high
in Finance. Hence, the Factor2 Score is a good estimate to judge the quantitative/mathematical
abilities (skills required to excel in Finance) of students.

81
Political Map of India with the States