community risk perception 5 - odpem.org.jm 5-6... · community risk perception 5.0 5.1 ... is a...
TRANSCRIPT

5

Community Risk Perception 5.0
5.1 Community Profile
WhitehallOf the communities within the study boundary, Whitehall is located closest to the Negril Town centre and has the transportation centre as part of its boundary. As depicted by the multi-temporal analysis, up to 1968, this area consisted of sparse residential development and landcover was mainly natural vegetation. Post- 1968, there was drastic changes and significant increases in the density of infrastructure and housing. That trend continued into the 1990’s and even currently, the community continues to expand.
Population And SettlementRiVAMP (2012) indicates that the population of this community was approximately 500 in the 1970’s and grew to approximately 500 in 2009. The Census of 2011, indicates an estimated population of 2255, 70% of whom are in the 16-64 age cohort and 28% in the 0-14 age group.
Table 5.1: Population Distribution for White Hall
This development was intended to be a formal one, with some locations subdivided as recently as early and late 2000’s. The community now has widespread squatter settlements which have contributed to the on-going deterioration of environmental conditions (RiVAMP 2012). “The dramatic increase in unplanned housing has resulted in the deforestation of the hillsides, poor drainage and inadequate garbage disposal systems as well as sanitation facilities. While the majority of residents now have access to flush toilets, a number of houses still remain unconnected to the main sewage lines and rely on pit latrines. Almost all residents have access to piped potable water sourced from Hanover” (RiVAMP, 2012).
The community Hazard Mapping confirms that the community is not exposed to storm surge, however, flooding is their primary hazard.
Whitehall Female Male Total Percentage
0-14 323 316 639 28
15-64 714 855 1569 70
>65 24 23 47 2
TOTAL 1061 1194 2255 100
Percentage 47 53
107
PhysiographyThe topography of Whitehall rises from an elevation of 10m to 250m above sea level. The community is located on whitelimestone, more specifically, Gibraltar Bonnygate formation. This limestone formation consists of extensive and thick outcrops of light-colored limestones. Principal rock types are soft chalks, shelly limestones. There may be underground drainage systems; however these are usually fault controlled. Possible construction problems include flood risk in depressions or gully courses.
LivelihoodWhitehall was developed in response to the expansion of Negril as a resort area and the resultant housing demand that ensued lead to the development of areas such as Whitehall. Most persons are involved in the housing sector.
Red Ground
Population and SettlementRed Ground adjoins the Whitehall community and is located in close proximity to the town centre of Negril. The community is an informal one and like Whitehall evidence from the multi-temporal analysis suggests that the community started around 1968 as a very sparse development and by 1999, the density significantly increased.
The population is about half of that of the more formal Whitehall community and based on the 2011 census was 1010 persons 53% of whom were males and 67% were in the 15-64 age cohort.
PhysiographyThere are two predominant geological formations that comprise Westland Mountain. Similar to Whitehall, the dominant formation is Gibraltar Bonnygate formation consisting of extensive and thick outcrops of light-colored limestones. Possible construction problems include Depth to bedrock being extremely variably; Landslip risks along fault scarps and flood risk in depressions or gully courses. The less dominant formation is coastal limestone found mainly along the coast. This formation consists of hard reef limestones with subordinate often interbedded rubbly and chalky or marly limestones dominate this formation. Soil development is shallow and generally insignificant. Possible construction problems associated with this geological formation may include high erodability.
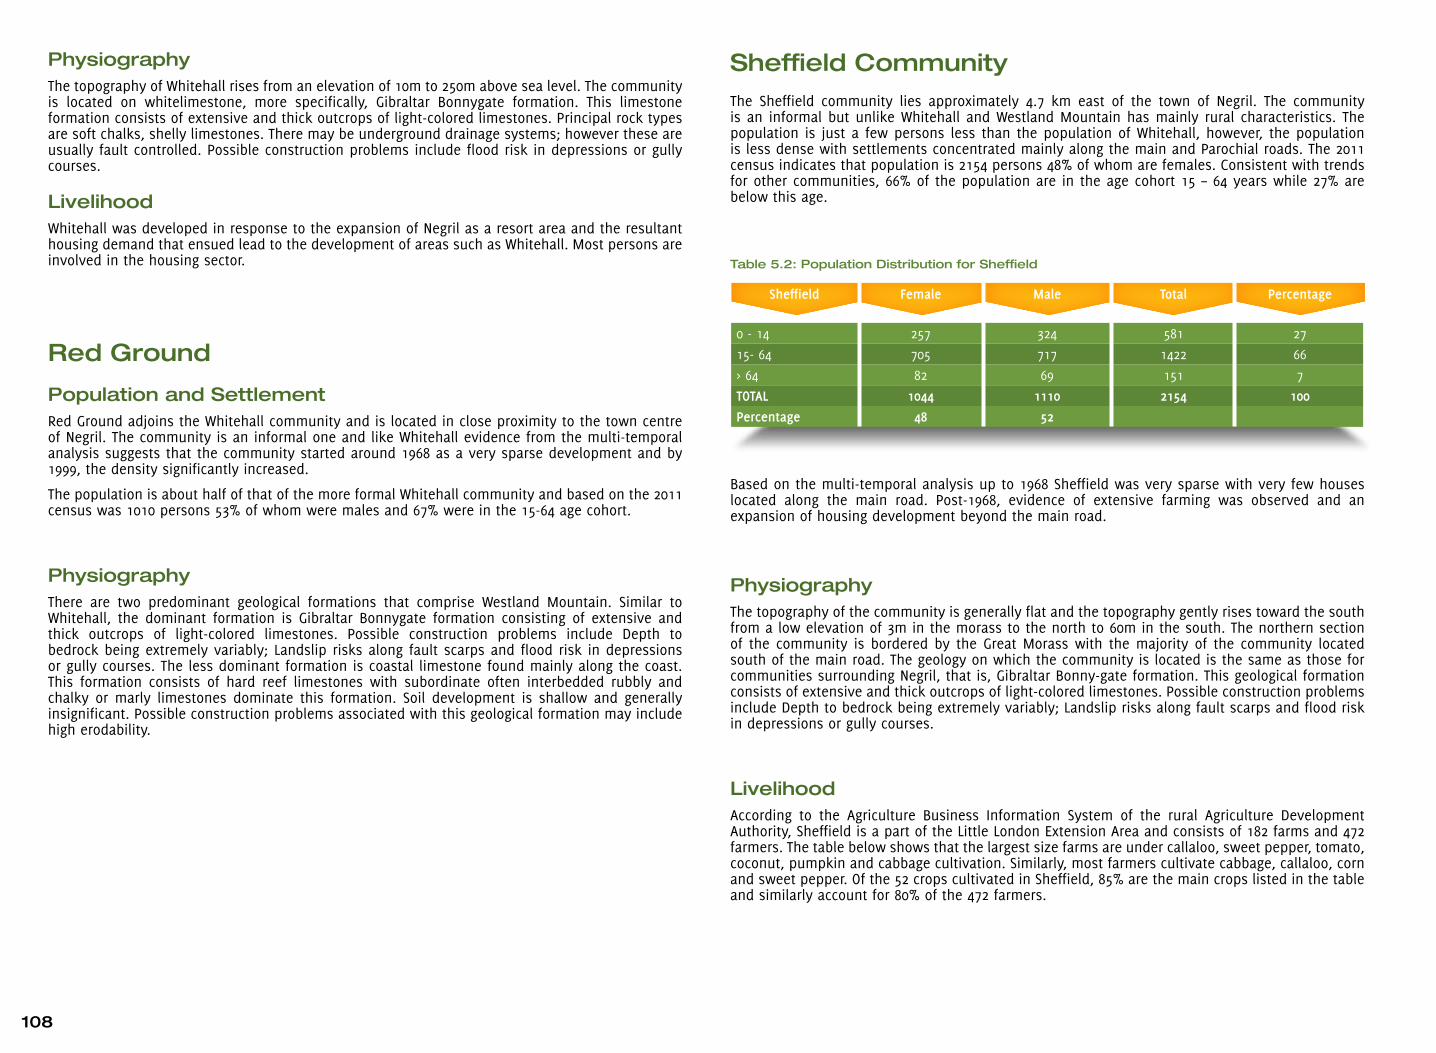
Sheffield CommunityThe Sheffield community lies approximately 4.7 km east of the town of Negril. The community is an informal but unlike Whitehall and Westland Mountain has mainly rural characteristics. The population is just a few persons less than the population of Whitehall, however, the population is less dense with settlements concentrated mainly along the main and Parochial roads. The 2011 census indicates that population is 2154 persons 48% of whom are females. Consistent with trends for other communities, 66% of the population are in the age cohort 15 – 64 years while 27% are below this age.
Table 5.2: Population Distribution for Sheffield
Based on the multi-temporal analysis up to 1968 Sheffield was very sparse with very few houses located along the main road. Post-1968, evidence of extensive farming was observed and an expansion of housing development beyond the main road.
PhysiographyThe topography of the community is generally flat and the topography gently rises toward the south from a low elevation of 3m in the morass to the north to 60m in the south. The northern section of the community is bordered by the Great Morass with the majority of the community located south of the main road. The geology on which the community is located is the same as those for communities surrounding Negril, that is, Gibraltar Bonny-gate formation. This geological formation consists of extensive and thick outcrops of light-colored limestones. Possible construction problems include Depth to bedrock being extremely variably; Landslip risks along fault scarps and flood risk in depressions or gully courses.
LivelihoodAccording to the Agriculture Business Information System of the rural Agriculture Development Authority, Sheffield is a part of the Little London Extension Area and consists of 182 farms and 472 farmers. The table below shows that the largest size farms are under callaloo, sweet pepper, tomato, coconut, pumpkin and cabbage cultivation. Similarly, most farmers cultivate cabbage, callaloo, corn and sweet pepper. Of the 52 crops cultivated in Sheffield, 85% are the main crops listed in the table and similarly account for 80% of the 472 farmers.
Sheffield Female Male Total Percentage
0 - 14 257 324 581 27
15- 64 705 717 1422 66
> 64 82 69 151 7
TOTAL 1044 1110 2154 100
Percentage 48 52
108
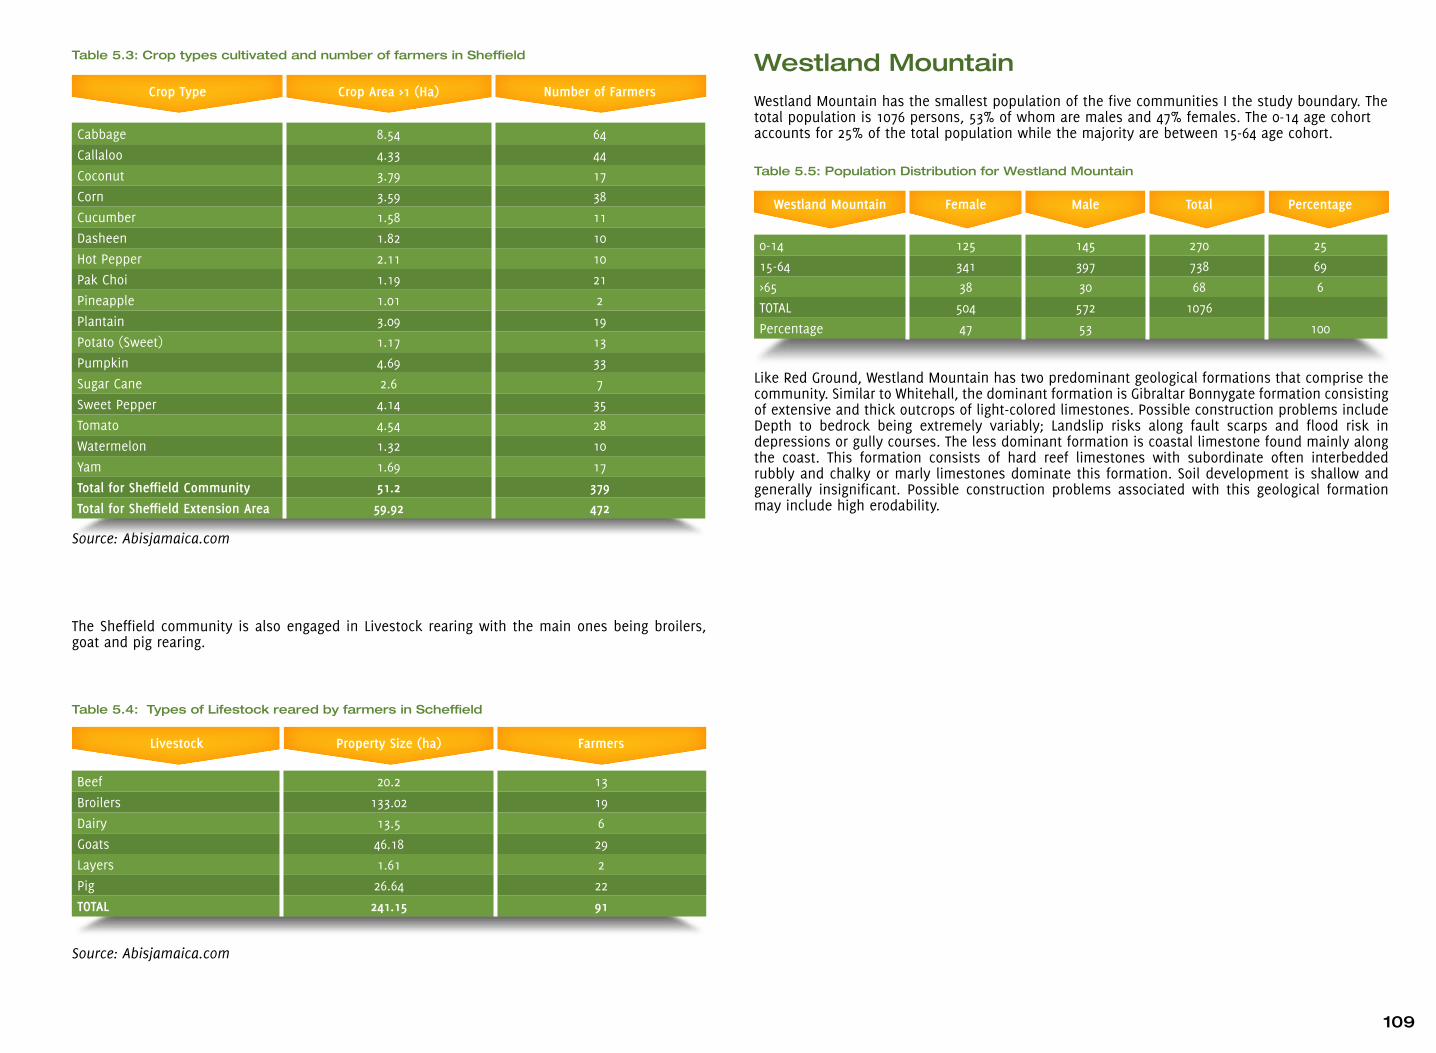
Table 5.3: Crop types cultivated and number of farmers in Sheffield
Source: Abisjamaica.com
The Sheffield community is also engaged in Livestock rearing with the main ones being broilers, goat and pig rearing.
Table 5.4: Types of Lifestock reared by farmers in Scheffield
Source: Abisjamaica.com
Westland MountainWestland Mountain has the smallest population of the five communities I the study boundary. The total population is 1076 persons, 53% of whom are males and 47% females. The 0-14 age cohort accounts for 25% of the total population while the majority are between 15-64 age cohort.
Table 5.5: Population Distribution for Westland Mountain
Like Red Ground, Westland Mountain has two predominant geological formations that comprise the community. Similar to Whitehall, the dominant formation is Gibraltar Bonnygate formation consisting of extensive and thick outcrops of light-colored limestones. Possible construction problems include Depth to bedrock being extremely variably; Landslip risks along fault scarps and flood risk in depressions or gully courses. The less dominant formation is coastal limestone found mainly along the coast. This formation consists of hard reef limestones with subordinate often interbedded rubbly and chalky or marly limestones dominate this formation. Soil development is shallow and generally insignificant. Possible construction problems associated with this geological formation may include high erodability.
Livestock Property Size (ha) Farmers
Beef 20.2 13
Broilers 133.02 19
Dairy 13.5 6
Goats 46.18 29
Layers 1.61 2
Pig 26.64 22
TOTAL 241.15 91
Crop Type Crop Area >1 (Ha) Number of Farmers
Cabbage 8.54 64
Callaloo 4.33 44
Coconut 3.79 17
Corn 3.59 38
Cucumber 1.58 11
Dasheen 1.82 10
Hot Pepper 2.11 10
Pak Choi 1.19 21
Pineapple 1.01 2
Plantain 3.09 19
Potato (Sweet) 1.17 13
Pumpkin 4.69 33
Sugar Cane 2.6 7
Sweet Pepper 4.14 35
Tomato 4.54 28
Watermelon 1.32 10
Yam 1.69 17
Total for Sheffield Community 51.2 379
Total for Sheffield Extension Area 59.92 472
Westland Mountain Female Male Total Percentage
0-14 125 145 270 25
15-64 341 397 738 69
>65 38 30 68 6
TOTAL 504 572 1076
Percentage 47 53 100
109

5.2 Hanover Communities
Logwood/Orange BayThe population of Logwood and Orange Bay combined is 3183 and this is the largest population of all communities in the Negril study boundary, exceeding the second largest community, Whitehall, by 40%.
Table 5.6: Population Distribution in Logwood/ Orange Bay
PhysiographyLogwood consists of a mixture of geological formations comprising coastal limestone, and Swanswick formation. Hard reef limestones with subordinate often interbedded rubbly and chalky or marly limestones dominate the coastal formation and possible construction problems associated with this geological formation may include high erodability. Swanswick formation is a member of the white limestone group. It consists of extensive and thick outcrops of light colored shallow to deep-water limestones. Rocks are variable but generally hard and competent. The formation usually consists of localized crops of softer, well or thinly bedded sandy limestones. Karstic drainage patterns are usually well developed with sinkholes and depressions feeding underground systems. Soil development is usually minor or thin on steep hillsides, or hilltops. Slope stability is generally good and possible construction problems include flood risks in gully courses and landslip Risk along fault scarps.
The community is dissected by the Orange River which flows from the hilly areas to the east of the community and empties in the Orange Bay area to the west of the community. The North Negril River also flows in the lower elevation of the community and empties at Rutland Point. The community is bordered by The Great Morass to the west several ponds exist in the community.
LivelihoodUnlike Sheffield, Logwood/Orange Bay is not a predominantly farming community and has 120 farmers when compared with 519 farmers. Data from ABISJamaica.com also shows that far less crops are cultivated in this area. Crops exceeding 1 hectare are listed in the table below.
Table 5.7: Crop types cultivated in Logwood
Chicken, goat and pig rearing and the main livestock in the area with a total of 111 farmers engaged in these areas. The same number of farmers are engage in the main crop types (classified as >1 hectare) for the community.
Table 5.8:
Source: Abisjamaica.com
The dominant crop types are listed in the table above. Most farmers are engaged in banana and yam cultivation.
Crop Area (> 1Ha) Sub-total Farmers Sub-total
Crops Orange Bay Logwood (Ha) Orange Bay Logwood (Ha)
Banana 1.8 1.46 3.26 20 12 32
Corn 0.55 0.55 7 7
Yam 1.95 1.95 24 24
Plantain 1.44 1.44 13 13
Coconut 1.07 1.07 5 5
Dasheen 3.77 3.77 20 20
Sugar Cane 4.14 4.14 10 10
TOTAL 5.74 10.44 16.18 64 47 111
Crop Area (Ha) Sub-total Farmers Sub-total
Livestock Orange Bay Logwood (Ha) Orange Bay Logwood (Ha)
Broilers 4.03 11.78 15.81 9 25 34
Goats 5.6 74.39 79.99 9 41 50
Pig 1 24.46 25.46 5 22 27
TOTAL 10.63 110.63 121.26 23 88 111
Logwood/Orange River Female Male TOTAL Percentage
0-14 462 471 933 29
15-64 944 1068 2012 63
>65 127 111 238 7
TOTAL 1533 1650 3183
Percentage 48 52
110

a Historical profile
b Historical visualization
c Seasonal calendar
d Institutional and Social Network Analysis
e Livelihoods and coping strategies analysis
f Mapping
g Transect walk
5.3 Vulnerability and Capacity Assessment
Vulnerability and Capacity Assessment (VCA) is a participatory investigative process designed to assess the risks that people face in their locality, their vulnerability to those risks, and the capacities they possess to cope with a hazard and recover from it when it strikes. VCA helps people to prepare for hazards, to prevent them from turning into disasters and to mitigate their effects (IFRC, 2007).This activity was led by the Jamaica Red Cross as part of training sub -component of the overall Component 3 of the Adaptation Fund Program. VCA was undertaken in two (2) communities- Logwood and Orange Bay and summary of the findings are presented below.
To facilitate the VAC process, the following participatory approaches were used to collect data from the communities:
Logwood
The historical visualization shows that the community transitioned from a highly vegetated area to a more developed and populated area with more infrastructure.
Identifying hazards and their potential impact on the communityTable 5.9: Hazards identified by residents of Logwood
Hazard Potential Risk Vulnerability Capacity
Improper housing construction
• Property damage• Death• Accidents
1. Livelihood a. Propertyb. Cropsc. Animals
2. Well-being/statusa. Children b. Elderly c. Physically challenged.d. All members of the
community.
• Organize group to advocate to NWA and the parish Council for the fixing of the roadway.
• Educate residents• Host public forum
Defective fire hydrants
• Loss of life and property
• Livelihood a. Propertyb. Cropsc. animal
• Well-being/statusa. Children b. Elderly c. Physically challenged.d. All members of the
community.• Social protection
a. Closure of schoolsb. Inability to go to work/
school.
• Organize group to advocate to (NWC) National Water Commission for the fixing and implementation of Hydrants.
Inadequate Street light
• Injuries• Death• Robbery• Physical abuse
1. Well-being/statusa. Children b. Elderly c. Physically challenged.d. All members of the
community.
• Organize group to advocate to JPS for the fixing and implementation of proper lighting
Blocked Drains • Flooding• Damage to property• Death• Damage to crops• Accidents• Loss of livestock
1. Livelihood a. Propertyb. Cropsc. animal
2. Well-being/statusa. Children b. Elderly c. Physically challenged.d. All members of the
community.3. Social protection
a. Closure of schoolsb. Inability to go to work/
school.
• Organize group and have the drains cleaned.
• Organize group and advocate to relevant authorities to have the drains cleaned.
• Educate the residents
Uncleaned river channels
• Flooding• Damage to property• Death• Damage to crops• Accidents• Loss of livestock
1. Livelihood a. Propertyb. Cropsc. animal
2. Well-being/statusa. Children b. Elderly c. Physically challenged.d. All members of the
community.3. Social protection
a. Closure of schoolsb. Inability to go to work/
school.
• Organize group and have the drains cleaned.
• Organize group and advocate to relevant authorities to have the drains cleaned.
• Educate the residents
111

Local capacity to respond to hazards
Table 5.10: Local capacity in Logwood to respond to Hazards
Orange BayThe historical visualization shows that the community transitioned from a highly vegetated area to a more developed and populated area with more infrastructure.
Hazard Vulnerabilities Identified Actions to transform Vulnerabilities into Capacities
Improper housing construction
1. Livelihood a. Propertyb. Cropsc. Animals
2. Well-being/statusa. Children b. Elderly c. Physically challenged.d. All members of the community.
• Organize group to advocate to NWA and the parish Council for the fixing of the roadway.
• Educate residents• Host public forum
Defective fire hydrants
1. Livelihood a. Propertyb. Cropsc. animal
2. Well-being/statusa. Children b. Elderly c. Physically challenged.d. All members of the community.
3. Social protectiona. Closure of schoolsb. Inability to go to work/school.
• Organize group to advocate to (NWC) National Water Commission for the fixing and implementation of Hydrants.
Blocked Drains 1. Livelihood a. Propertyb. Cropsc. animal
2. Well-being/statusa. Children b. Elderly c. Physically challenged.d. All members of the community.
3. Social protectiona. Closure of schoolsb. Inability to go to work/school.
• Organize group and have the drains cleaned.
• Organize group and advocate to relevant authorities to have the drains cleaned.
• Educate the residents
Uncleaned river channels
1. Livelihood a. Propertyb. Cropsc. animal
2. Well-being/statusa. Children b. Elderly c. Physically challenged.d. All members of the community.
3. Social protectiona. Closure of schoolsb. Inability to go to work/school.
• Organize group and have the drains cleaned.
• Organize group and advocate to relevant authorities to have the drains cleaned.
• Educate the residents
112
Hazard Potential Risk Vulnerability Capacity
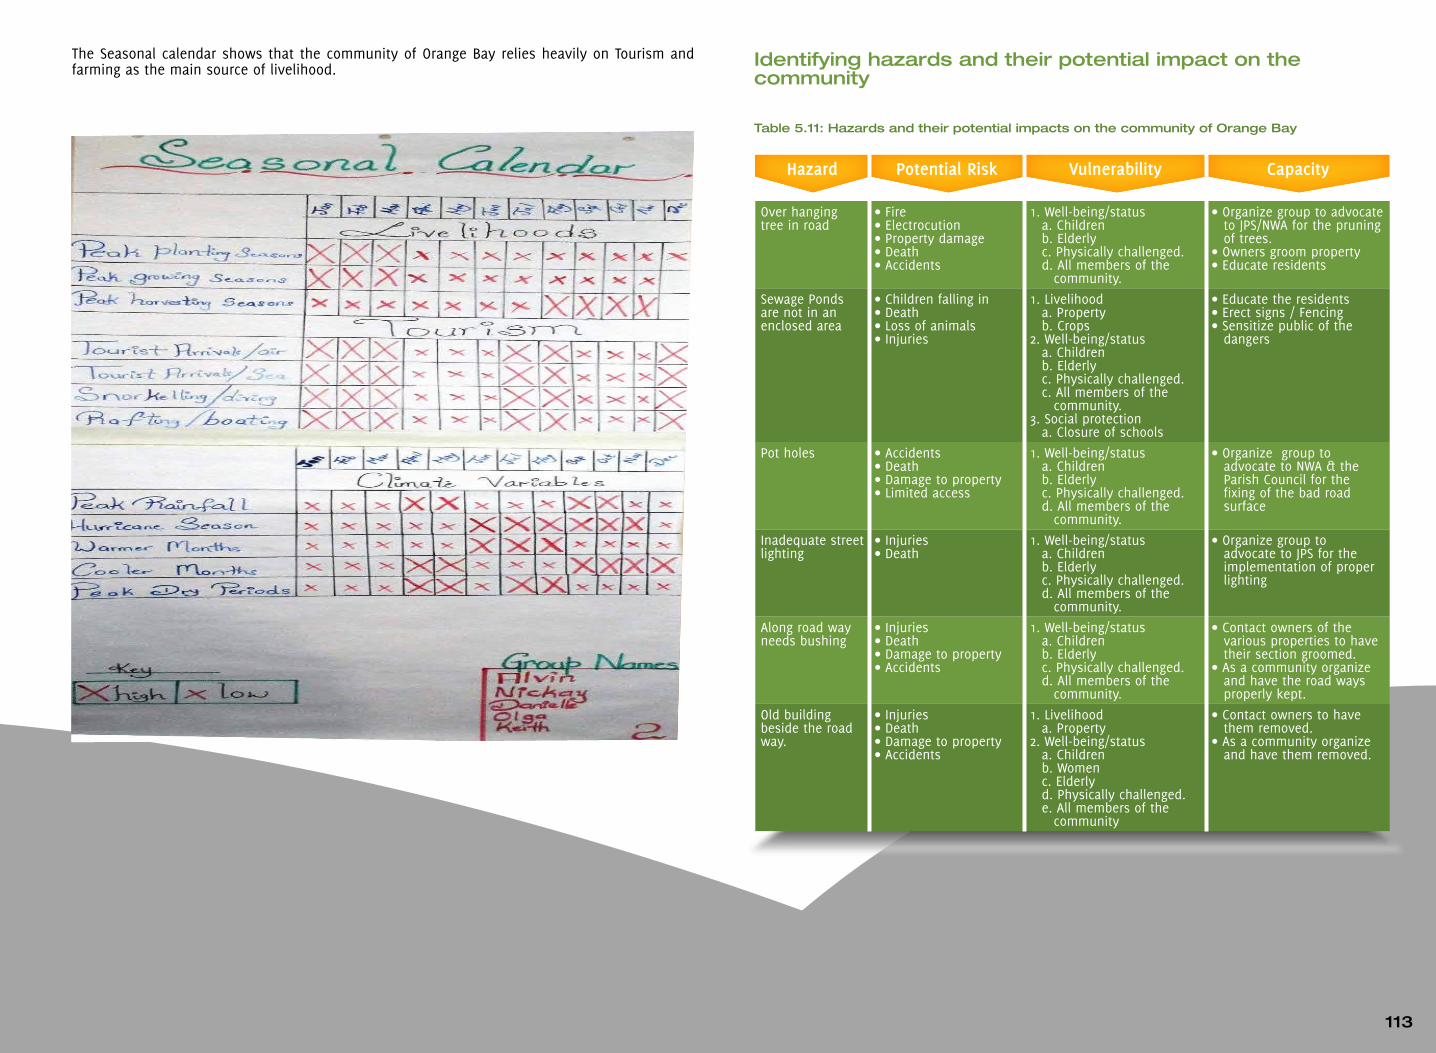
Over hanging tree in road
• Fire• Electrocution• Property damage• Death• Accidents
1. Well-being/statusa. Children b. Elderly c. Physically challenged.d. All members of the
community.
• Organize group to advocate to JPS/NWA for the pruning of trees.
• Owners groom property• Educate residents
Sewage Ponds are not in an enclosed area
• Children falling in• Death• Loss of animals• Injuries
1. Livelihood a. Propertyb. Crops
2. Well-being/statusa. Children b. Elderly c. Physically challenged.c. All members of the
community.3. Social protection
a. Closure of schools
• Educate the residents• Erect signs / Fencing• Sensitize public of the
dangers
Pot holes • Accidents• Death• Damage to property• Limited access
1. Well-being/statusa. Children b. Elderly c. Physically challenged.d. All members of the
community.
• Organize group to advocate to NWA & the Parish Council for the fixing of the bad road surface
Inadequate street lighting
• Injuries• Death
1. Well-being/statusa. Children b. Elderly c. Physically challenged.d. All members of the
community.
• Organize group to advocate to JPS for the implementation of proper lighting
Along road way needs bushing
• Injuries• Death• Damage to property• Accidents
1. Well-being/statusa. Children b. Elderly c. Physically challenged.d. All members of the
community.
• Contact owners of the various properties to have their section groomed.
• As a community organize and have the road ways properly kept.
Old building beside the road way.
• Injuries• Death• Damage to property• Accidents
1. Livelihood a. Property
2. Well-being/statusa. Children b. Womenc. Elderly d. Physically challenged.e. All members of the
community
• Contact owners to have them removed.
• As a community organize and have them removed.
Identifying hazards and their potential impact on the community
Table 5.11: Hazards and their potential impacts on the community of Orange Bay
The Seasonal calendar shows that the community of Orange Bay relies heavily on Tourism and farming as the main source of livelihood.
113

Type of measures to mitigate disasters
Table 5.13: Measures to mitigate disasters
Actions to transform Vulnerabilities into Capacity
Prevention Preparation Mitigation
Organize group to advocate to JPS/NWA for the pruning of trees.
x x x
Owners groom property x x x
Educate residents x x x
Educate the residents x x x
Erect signs / Fencing x x x
Sensitize public of the dangers x x x
Organize group to advocate to NWA & the Parish Council for the fixing of the bad road surface
x x x
Organize group to advocate to JPS for the implementation of proper lighting
x x x
Contact owners of the various properties to have their section groomed.
x x x
As a community organize and have the road ways properly kept.
x x x
Contact owners to have them removed. x x x
As a community organize and have them removed.
x x x
Hazard Vulnerability Capacity
Over hanging tree in road
1. Well-being/statusa. Children b. Elderly c. Physically challenged.d. All members of the community.
• Organize group to advocate to JPS/NWA for the pruning of trees.
• Owners groom property• Educate residents
Sewage Ponds are not in an enclosed area
1. Livelihood a. Propertyb. Crops
2. Well-being/statusa. Children b. Elderly c. Physically challenged.d. All members of the community.
3. Social protection a. Closure of schools
• Educate the residents• Erect signs / Fencing• Sensitize public of the dangers
Pot holes 1. Well-being/statusa. Children b. Elderly c. Physically challenged.d. All members of the community.
• Organize group to advocate to NWA & the Parish Council for the fixing of the bad road surface
Inadequate street lighting
1. Well-being/statusa. Children b. Elderly c. Physically challenged.d. All members of the community.
• Organize group to advocate to JPS for the implementation of proper lighting
Along road way needs bushing
1. Well-being/statusa. Children b. Elderly c. Physically challenged.d. All members of the community.
• Contact owners of the various properties to have their section groomed.
• As a community organize and have the road ways properly kept.
Old building beside the road way.
1. Livelihood a. Property
2. Well-being/statusa. Children b. Womenc. Elderly d. Physically challenged.e. All members of the community
• Contact owners to have them removed.• As a community organize and have them
removed.
Local capacity to respond to hazards
Table 5.12: Local capacity in Orange Bay to respond to Hazards
114

5.4 Community Hazard Mapping To get a comprehensive perspective of risk in the Negril Community, it was necessary to include the community’s perspective on their own vulnerability. This was done through a process of Community Hazard Mapping.
Community hazard mapping is the process of identifying spatially the high risk areas in the community as well as critical facilities and infrastructure that might be affected in the event of a disaster.
Community hazard mapping is therefore one of the most effective tools for raising community risk awareness and improving overall disaster preparedness. Hazard mapping through the lens of the community represents or facilitates visual understanding of exposure to hazard impacts, vulnerable conditions and allows strategies for risk reduction to be developed and implemented at the community level. Hence, community input and participation is important.
The five communities that fell within the project boundary were taken through a five step process of preparing community hazard maps (See Figure 5.1)
To gain a reasonably good perspective on the community’s risk, the participant profile of the community hazard mapping workshops was diverse to include older persons who have knowledge of the history of the community, younger persons who would be familiar with development changes in the community and working class who would also recall the impacts.
STEP 3: Transfer natural and physical resources onto base map (roads, rivers, houses, clinic, community centre, farm lands etc).
FEATURES such as rivers, roads, schools, clinic etc should be LABELED.
STEP 4: Consider the risks
Overlay on the base map the hazard history of the community to show flood prone areas, landslide zones and potential hazardous areas in the community.Emergency shelters should be clearly shown on map.
STEP 5:Community ground- truthing
Validate or “ground-truth” the information gathered in previous steps to ensure map accurately represent the community.
STEP 1: Discuss the basics of hazard mapping
STEP 2: Define your community boundary and visualize all natural and physical resources in community.
Plate 5.1: Hazard mapping validation in Scheffield | Source: ODPEM
Figure 5.1: Steps in Community Hazard Mapping
115

Map 5.1a: Whitehall, Westmoreland
116
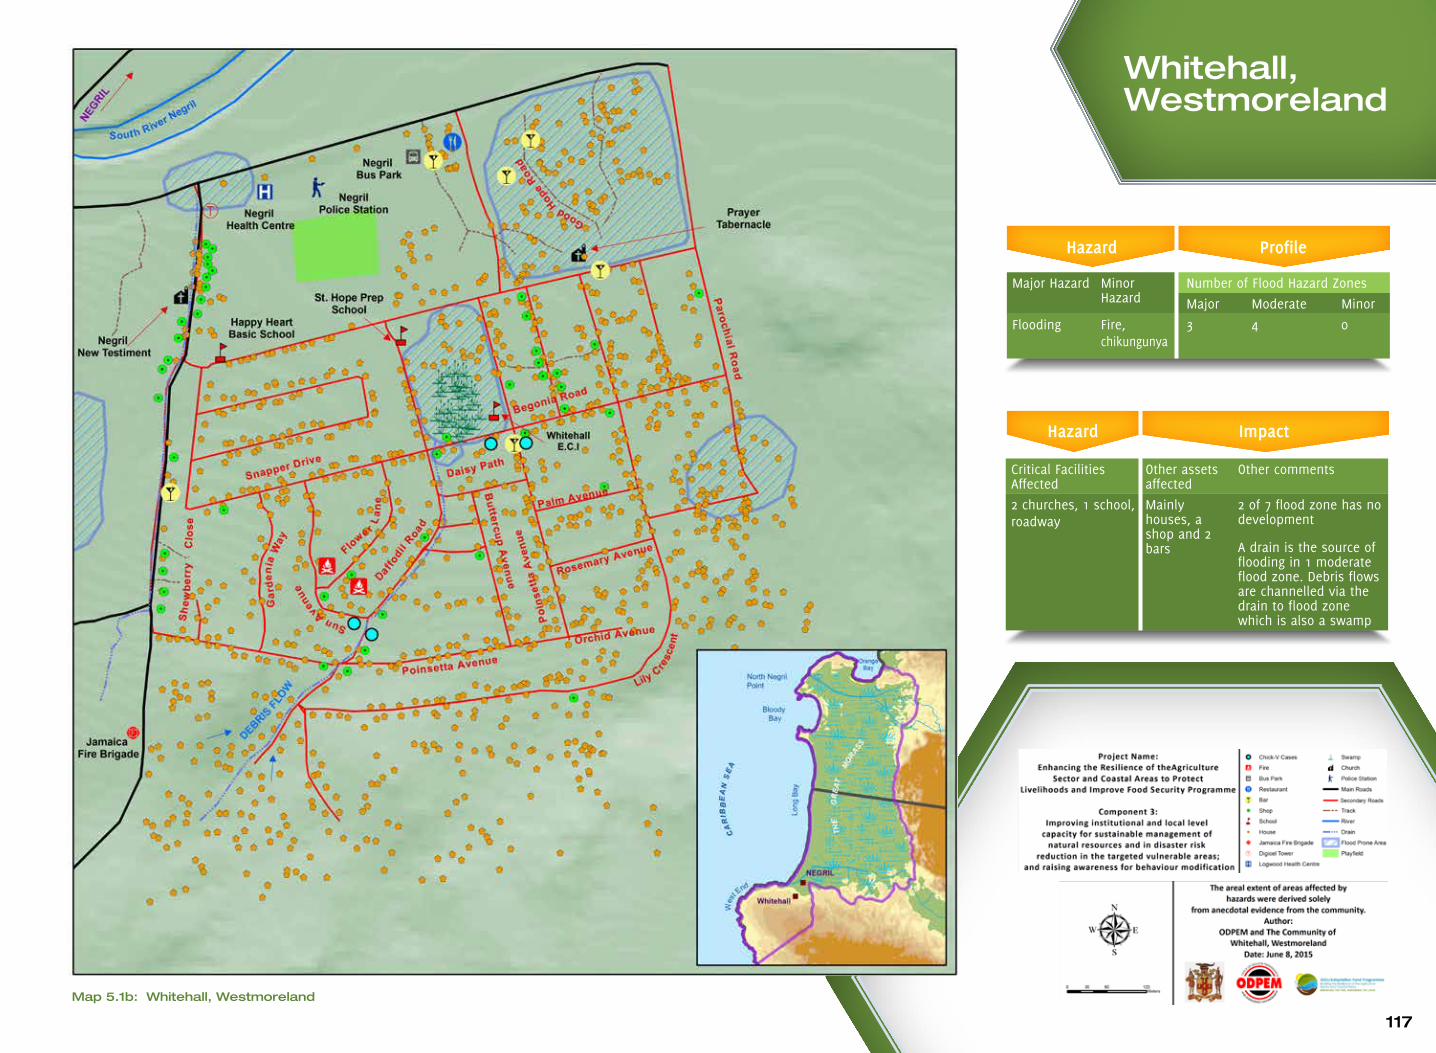
Whitehall,Westmoreland
Hazard Profile
Major Hazard Minor Hazard
Number of Flood Hazard Zones
Major Moderate Minor
Flooding Fire, chikungunya
3 4 0
Hazard
Impact
Critical Facilities Affected
Other assets affected
Other comments
2 churches, 1 school, roadway
Mainly houses, a shop and 2 bars
2 of 7 flood zone has no development
A drain is the source of flooding in 1 moderate flood zone. Debris flows are channelled via the drain to flood zone which is also a swamp
Map 5.1b: Whitehall, Westmoreland
117

Map 5.2a: Redground Community Hazard Map, Westmoreland
118

Redground Community Hazard Map,Westmoreland
Hazard Profile
Major Hazard Minor Hazard
Number of Flood Hazard Zones
Major Moderate Minor
Flooding nil 1 3 1
Hazard
Impact
Critical Facilities Affected
Other assets affected
Other comments
1 church, 1 gas station
Houses Flood zones are also mosquito breeding sites
Map 5.2b: Redground Community Hazard Map, Westmoreland
119

Map 5.3a: Scheffield Community Hazard Map, Westmoreland
120

ShefieldCommunityHazard Map,Westmoreland
Hazard Profile
Major Hazard Minor Hazard
Number of Flood Hazard Zones
Major Moderate Minor
Flooding 4 depressions
2 4 3
Hazard
Impact
Critical Facilities Affected
Other assets affected
Other comments
Sheffield cemetery, 1 bridge, roadway
Mainly houses, Negril Hills Golf Club and few shops
Only 1 depression has sparse houses, other have no development in them
Map 5.3b: Scheffield Community Hazard Map, Westmoreland
121
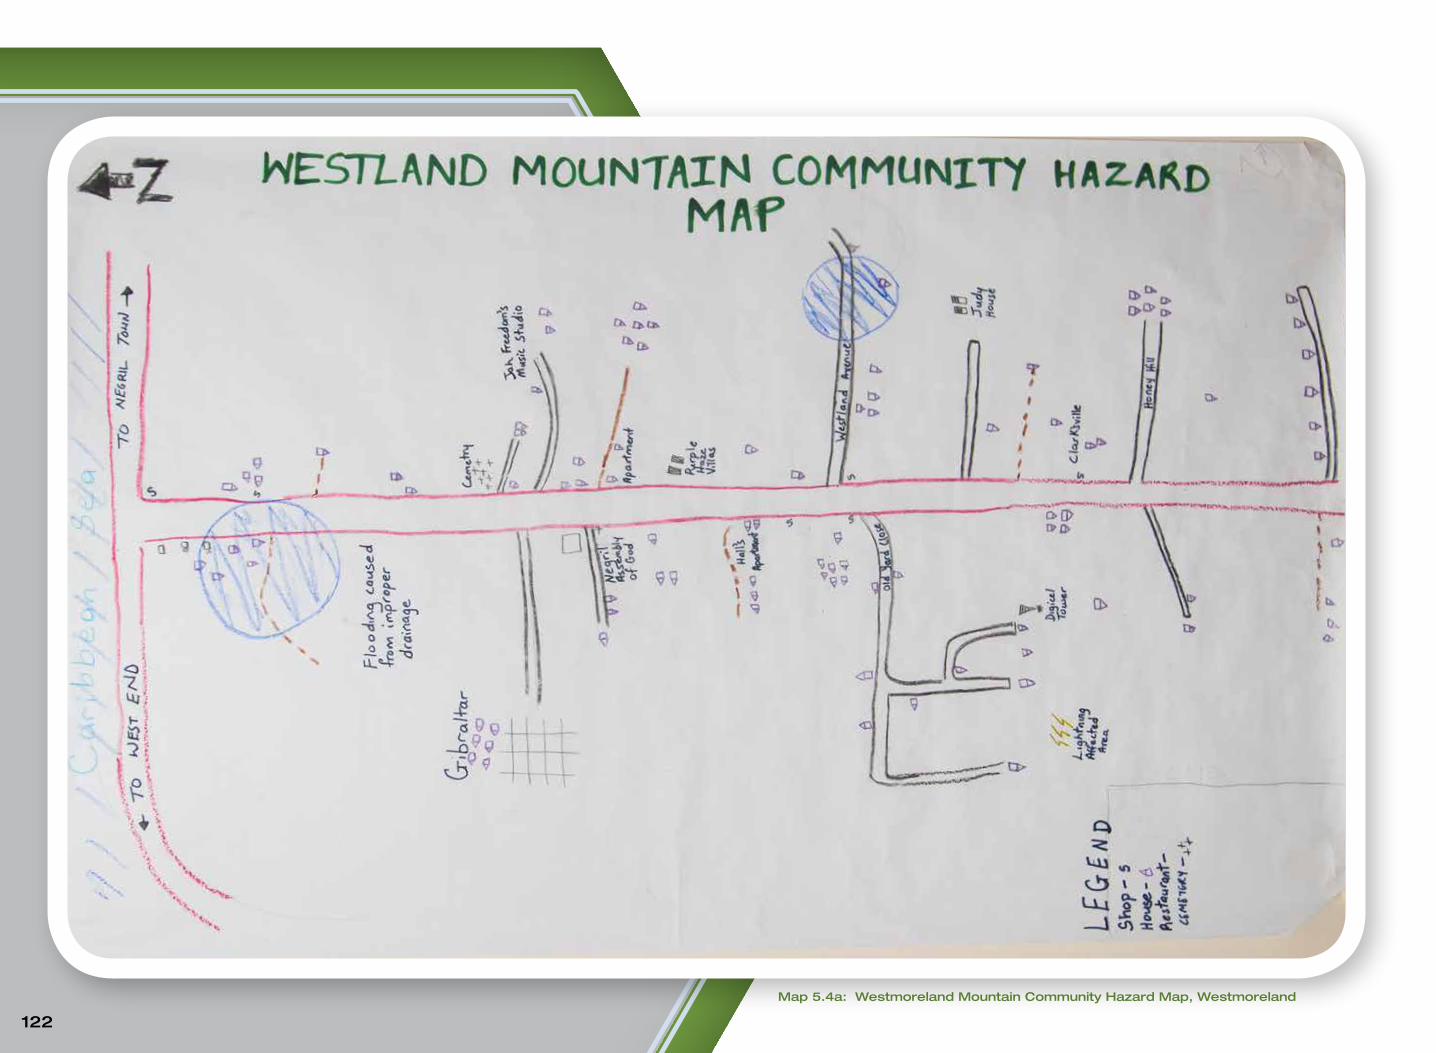
Map 5.4a: Westmoreland Mountain Community Hazard Map, Westmoreland
122

Map 5.4b: Westmoreland Mountain Community Hazard Map, Westmoreland
WestlandMountain Community Hazard Map, Westmoreland
Hazard Profile
Major Hazard Minor Hazard
Number of Flood Hazard Zones
Major Moderate Minor
Flooding Lightening 2 0 0
Hazard
Impact
Critical Facilities Affected
Other assets affected
Other comments
Roadway Houses and shops
Only 1 flood zone has houses located in that zone
123

Map 5.5a: Logwood Community Hazard Map, Hanover
Actions to transform vulnerabilities to Capacities
Prevention Preparation Mitigation
Organize group to advocate to JPS for the pruning of trees.
X X
Contact owners of the various properties to have their section groomed.
X X
Educate residents X X X
Organize group to advocate to NWA and the parish Council for the fixing of the roadway.
X X X
Organize as a group and repair roadways.
X X X
Host public forum X X X
Organize group to advocate to (NWC) National Water Commission for the fixing and implementation of Hydrants.
X X X
Organize group to advocate to JPS for the fixing and implementation of proper lighting
X X X
Contact owners of the various properties to have their section groomed.
X X
As a community organize and have the road ways properly kept.
X X X
Organize group to advocate to the relevant authority to have the road way groomed
X X X
Contact owners to have them removed.
X X
As a community organize and have them removed.
X X
Organize group and have the drains cleaned.
X X X
Organize group and advocate to relevant authorities to have the drains cleaned.
X X
Type of measures to mitigate disasters
The third step consisted in differentiating the types of measures, along three categories:
• Prevention actions: action which tries to reduce to probability of a disaster in the community;
• Mitigation actions: action that attempts to protect,
strengthen, rehabilitate or reconstruct;• Preparation actions: action that aims to strengthen the
capacity of the community of Bamboo to respond in an effective and efficient manner
124

Map 5.5b: Logwood Community Hazard Map, Hanover
LogwoodCommunity Hazard Map,Hanover
Hazard Profile
Major Hazard Minor Hazard
Number of Flood Hazard Zones
Major Moderate Minor
Flooding nil 2 3 2
Hazard
Impact
Critical Facilities Affected
Other assets affected
Other comments
Health Centre, 4 bridges, community roadway
HShops, houses, 2 carwashes
-
125

6126
6.0Risk Assessment
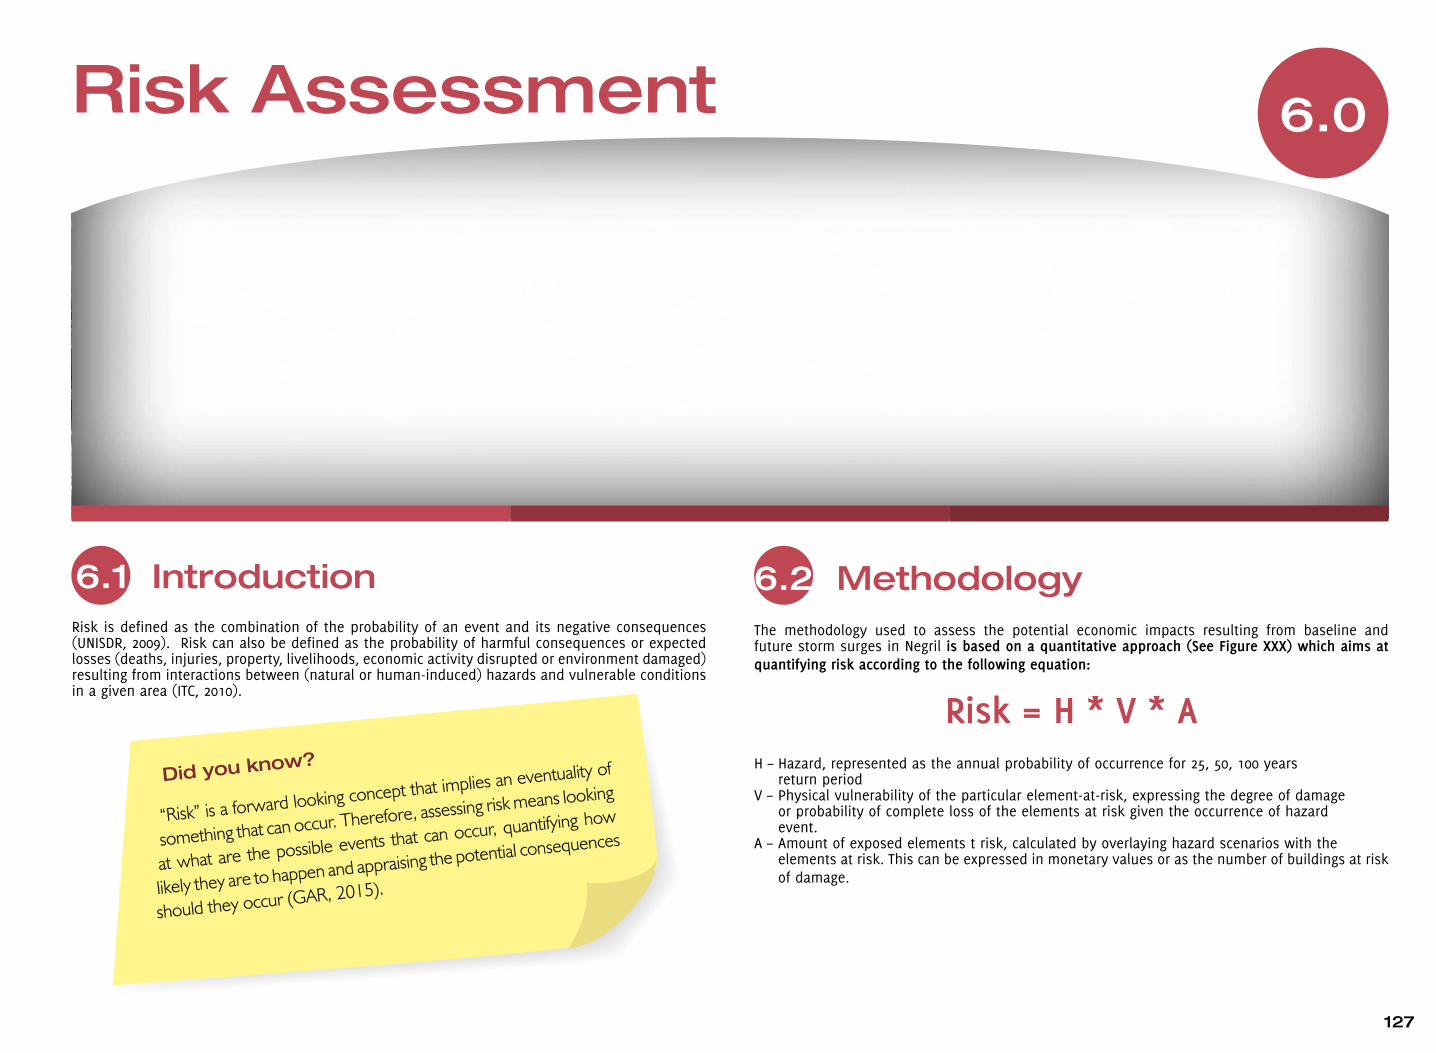
6.1 IntroductionRisk is defined as the combination of the probability of an event and its negative consequences (UNISDR, 2009). Risk can also be defined as the probability of harmful consequences or expected losses (deaths, injuries, property, livelihoods, economic activity disrupted or environment damaged) resulting from interactions between (natural or human-induced) hazards and vulnerable conditions in a given area (ITC, 2010).
6.2 MethodologyThe methodology used to assess the potential economic impacts resulting from baseline and future storm surges in Negril is based on a quantitative approach (See Figure XXX) which aims at quantifying risk according to the following equation:
Risk = H * V * AH – Hazard, represented as the annual probability of occurrence for 25, 50, 100 years return periodV – Physical vulnerability of the particular element-at-risk, expressing the degree of damage or probability of complete loss of the elements at risk given the occurrence of hazard event.A – Amount of exposed elements t risk, calculated by overlaying hazard scenarios with the elements at risk. This can be expressed in monetary values or as the number of buildings at risk
of damage.
Did you know?
“Risk” is a forward looking concept that implies an eventuality of
something that can occur. Therefore, assessing risk means looking
at what are the possible events that can occur, quantifying how
likely they are to happen and appraising the potential consequences
should they occur (GAR, 2015).
127

6.2.1 Generation of Vulnerability/Stage Damage CurveOnce the exposed elements at risk (Refer to Section 4) are identified it is possible to assess how they would be impacted, that is to assess the physical vulnerability. Physical vulnerability is defined as the degree of loss, to a given element-at-risk or set of elements-at-risk (e.g. buildings) resulting from the occurrence of a natural phenomenon of a given magnitude. Once the physical characteristics for each building class are defined, it is possible to establish and assign the likely damage, and subsequently losses to that specific building class subjected to various levels of specific hazard intensity. This is done by defining relationships between a measured parameter of the hazard intensity (e.g. water depth in case of flooding) to the likely damage level of the particular building class (UNISDR, 2015).Vulnerability is expressed on a scale from 0 (no damage) to 1 (total damage).
For this project, vulnerability curves were derived through expert judgement. This method involved the consultation of five (5) experts (Coastal and Hydrologic Engineers) to estimate the percentage damage expected for three (3) structural types found in Negril (Reinforced Concrete, Wood and Zinc) having different hazard intensities (flood depth). The estimates provided by the experts for each structure type was resampled using the Bootstrapping Statistical Method. This was done to account for uncertainties by assigning measures of accuracy to sample estimates.
A comparative assessment was undertaken to validate the results of the vulnerability curves developed for Negril using historical impact of storm surges of similar building typology in three (3) coastal communities in Jamaica namely, Caribbean Terrace, Old Harbour Bay and Portland Cottage.
The impacts from passage of Hurricanes Ivan and Dean in 2004 and 2007 in these coastal areas were used, respectively. Results of the validation process shows confidence limit of over 85% for all three (3) coastal communities. The vulnerability curves for Negril also compares well to expected percentage damage to buildings within V Zone used in Federal Emergency Management Agency (FEMA) HAZUS-MH. The V flood zone is “the first two or three blocks…closest to the flooding source” (FEMA, 2001).
The analysis of risk in Negril focuses on physical vulnerability of buildings with the hazard intensity being water depth. Damage due to storm surges depend on several factors such as direct exposure to hydraulic wave action, water depth, strong winds, erosion or scour and so on. Taking these factors into consideration, three (3) vulnerability curves were created to determine percent damage for each return period and climate scenario.
For each flood depth, the percent damage to each individual structure identified in Section 4 as exposed was estimated by applying the vulnerability or depth-damage curve in Figure 6.2 below.
Risk = Probability of losses occurring
Risk = Hazard * Vulnerability * Elements at Risk
= Temporal * Consequences or
Probability losses
= Temporal Degree of loss to Quantification of Probability * Elements at Risk to Elements at Risk
}}Vulnerability
Vulnerability Function
Exposure:Spatial overlay ofHazard and Elements at Risk
Hazard Intensity
% D
amag
eHazard
Temporal probability
DurationTime of onsetType of Hazard
Hazard Intensity
Spacial extent• Initiation• Spreading/ runout
Vulnerability
Types of Elements at Risk
Temporal variationQuantification• Number• Economic value
Location
Type 1
Type 2
Figure 6.1: Probabilistic Risk Assessment Methodology Source: ITC 2010
Figure 6.2: Vulnerability Curve
1.00
0.90
0.80
0.70
0.60
0.50
0.40
0.30
0.20
0.10
0.000 0.5 1 1.5 2 2.5 3 3.5 4 4.5
Wood
Water Depth
Concrete/Block
Zinc
Vuln
erab
ility
128

6.2.2 Cost Estimation for Elements at Risk
Potential damage or losses were estimated for hotels, commercial/industrial, and residential buildings. The assessment of costs focused on tangible/direct losses which accounts for damage to property and contents for hotels and in the case of the residential and commercial/ industrial damage to property only. The analysis did not take into account indirect losses such as functional downtime (interruption of business due to damage to buildings) or job loss due to time and resource constraints.
The replacement value for hotel buildings and contents was estimated using two construction costs to account for differences in hotel size, amenities and services provided. Replacement cost reflects the cost of labour and materials to construct a building of a particular size, type and quality (FEMA, 2001). For the hotels exposed to baseline storm surge hazard, the replacement cost was derived by multiplying estimated construction cost/room by the number of rooms for each of those hotels.
The Hotel Development Cost Survey 2014/2015 was used to determine future replacement cost of hotel for storm surges with sea level rise to the end of the century. In the HVS Hotel Development Cost Survey, the elements of a hotel development budget are broken down into five general categories: Land; Construction Costs and Site Improvements; Soft Costs; Furniture, Fixtures, and Equipment (FF&E); and Pre opening and Working Capital. These categories provide general ranges for analyzing hotel development budgets on a per room basis and represent the true costs of building hotels across the United States at the particular time (Sahlins, 2015). The replacement cost used in the calculation for future storm surges in shown below in Table 6.1.
Table 6.1: Hotel Replacement Cost
For commercial and residential buildings, the replacement cost was determined using construction cost per square foot. Using the elements at risk database discussed in Chapter 4, the building footprint (sq. ft) of each exposed commercial and residential structure was multiplied by construction cost (USD$)/sq ft to derive replacement cost (See Table 6.2). The lower end of the range of was used to calculate replacement cost under baseline scenario whilst the upper end of the range for future scenarios for both commercial and residential buildings there are exposed.
Table 6.2: Commercial and Residential Replacement Cost
* USD conversion based on Bank of Jamaica Exchange rate for same period
Risk CalculationTo calculate losses, the percent damage as determined by vulnerability curve was transformed to economic loss by multiplying it by the replacement value at risk. This procedure was followed for all of exposed assets in Negril. Losses were then aggregated for each asset yielding a net loss for each return period or scenario. The total for all return periods was then converted to average annualized loss which is the expected loss per year when averaged over a long period of time (e.g. 100 years). The estimated annualized loss addresses the key issue of risk which is represented as the amount of money that has to be paid in the long term to offset the losses associated with storm surge.
LimitationsIt is accepted that there are inherent uncertainties with modeling such as with Probabilistic Risk Assessment methodology used in the development of this Climate Risk Atlas for Negril. It should be noted that the most appropriate datasets available at the time of conducting this assessment along with robust scientific tools/methodologies were used. Assumptions and simplifications where necessary was applied to model coastal hazards however, there is high confidence in the findings presented in this Climate Risk Atlas.
Hazard/Scenario Land Use JMD$ Cost/Sq USD ($) Conversion Data Source
Baseline storm surge Residential 6,000* 64.50 Jamaica Gleaner, 2012
Commercial 8,500 83.30 Jamaica Gleaner, 2013
Future Scenarios Residential 7,200 77.40
Commercial 11,000 107.80
Hazard/Scenario Hotel size Construction cost/room ($US) Data Source
Baseline storm surge small – medium
(<150 rooms)
100,000 JHTA, 2006
Large (>150 rooms) 159,000 Jamaica Observer,2013
(based on Riu Palace development costs).
Future storm surge Small – medium 110,900 Hotel Development Cost Survey 2014/2015Large 220,000
129

ResultsBuildings at Risk of DamageThe vulnerability curve was used to quantify and assign damage state to each asset based on hazard intensity in this case water depth. The damage state of buildings in Negril is represented according to the following four (4) classifications:
• Slight damage: 0 - 0.25
• Moderate damage: 0.26 - 0.5
• Severe damage: 0.6 -0.75
• Complete loss/Destroyed: 0.76 -1
For each storm surge scenario the buildings were reclassified according to this classification and performing GIS spatial overlay analysis, the number of buildings and damage state per Enumeration District were calculated. The number of buildings that are at risk to be potentially damaged by the different return period is given in the Table 6.3 below.
Results show that the number of buildings at risk of being damaged increases with each return period with the 100 year storm surge event expected to have worst impact with 43 buildings at risk of being destroyed. Of this total, 46% comprise commercial structures such as craft shops, small businesses (bars and restaurants) are at risk of being destroyed. Hotel buildings represent 19% whilst 30% account for the residential structures that are found along the coast in the community. Most of these residential buildings are found in Orange Bay, a fishing village that is situated to the north of the highway.
Table 6.3: Buildings at risk of damage from Storm Surge Hazard
Damage State
Annual Probability
Storm Surge Return Period Slight Moderate Severe Destroyed
0.1 10 392 188 105 0
0.04 25 473 144 147 12
0.02 50 538 217 187 19
0.01 100 573 196 220 43
46% commercial buildings
30% residential buildings
19% hotels
5% other
43buildingsat risk
Plate 6.1: A section of Harbour View, Kingston showing bridge washed away by the Hope River after Tropical Storm Gustav, 2008
Photo Credit: Jamaica Defence Force
130

BuILDInGS AT RISk OF DAMAGE TO 100 yEAR STORM SuRGE (BASE LInE) AnD FuTuRE STORM SuRGE FOR THE yEAR (2100), nEGRIL
Map 6.1: Buildings at risk of damage to 100 year storm surge (base line) and future storm surge for the year (2100), negril
131

Expected Economic Losses – Baseline Storm Surge ScenarioFigure shows the expected losses by land use for different baseline storm surge scenarios. The results show that for a given return period resort land use account for as much as 95% of total expected losses in Negril. Commercial and residential land use account for significantly less with 2%, and 3% of total expected losses, respectively. The result is not surprising given the concentration of hotels and other infrastructure along the coast in Negril.
The losses for each return period were converted to average annual loss (AAL). AAL is the expected average loss per year considering all the events that could occur over a long time frame. It represents the amount of savings that need to be set aside each year to cover the cost of long term losses from storm surge hazard in Negril (Global Assessment Report on Disaster Risk Reduction, 2015).
The expected annualized loss for baseline storm surge scenario is summarized in Figure 6.4. The figure displays the estimated relationship between total losses and annual probability with the area under the curve representing expected AAL of US $4,946,521 million. Of this total, the tourism sector alone accounts for 94% (US$ 4,777,495) of the total annual risk in Negril.
Future Storm Surge (with Sea Level Rise)The AAL increases under sea level rise conditions by contributing an additional US$1.8 million to the expected average annual losses by the end of the century (See Figure 6.5). The yellow shaded area between the baseline and future curves represents the increased AAL associated with climate change-related sea-level rise.
$40
$60
$80
$100
$120
$140
$160
$180
$20
00 0.01 0.02 0.03 0.04 0.05 0.06 0.07 0.08 0.09 0.1
Annual Probability
Average Annualized Loss for Storm Surge (Baseline)
Loss
es in
Mill
ions
(USD
)
Figure 6.4: AAL for Baseline Storn Surge Scenario
Expected Annual LossUS$4,946,521
Figure 6.3: Combined Losses by Land use for Baseline Storm Surge Scenarios
$40
$60
$80
$100
$120
$140
$160
$20
0
1 in 10 1 in 25 1 in 50 1 in 100
Storm Surge Return Period
Expe
cted
Los
ses
in M
illio
ns (
USD
)
ResidentialCommercialResort
Combined Losses by Land Use for Baseline Storm Surge Scenarios
132

By the year 2100, if climate change induced sea level rise occur as forecasted, the exposed value of assets is estimated to increase from US $ 460.1 to 621.2 million. Similarly, the AAL is expected to increase by 37% from US $4.94 million from baseline scenario to US $6.76 million by the end of the century.
The AAL for Negril is considered to be conservative because it does not include all hazards -coastal erosion and wave overtopping. The AAL in this atlas represents direct physical risk to hotels (incl. guesthouse and villas), residential and commercial buildings. It does not include risk to infrastructure such as roads and other facilities in Negril. Finally, the AAL does not consider indirect losses and impacts.
Implications for GDPThe economic risk for baseline and future storm surge scenarios does not affect the tourist resort of Negril alone; it will also impact the national economy. Tourism is one of the main sectors in Jamaica which contributed 7% to the national Gross Domestic Product [GDP] (US$13.4 billion) in 2014 for all the resort areas combined (STATIN & JTB, 2014). Of this total, the Negril resort area alone is estimated to contribute a significant percentage of 3.25% which is equivalent to US $437.3 million.
At a macroeconomic level, AAL is equivalent to 0.04% and 0.05% of National GDP for baseline and future storm surges, respectively. Taking Negril’s direct contribution to national GDP, the AAL for baseline storm surge risk is equivalent to 1.1% of Negril’s GDP which is expected to increase under sea level rise conditions to 1.5%. The relationship between AAL and GDP needs to be considered because of potential cascading impacts spilling over into other sectors thereby the increasing complexity of risks not only at micro but also at a macro level for the country.
Results
Storm Surge Return Period Slight
Baseline Storm surge
Future storm surge with SLR
Change from Baseline Condition
Exposed Value Million US $ 460.1 621.2
1.82Average Annual Loss
Million US $ 4.94 6.76
% 37
Table 6.4: Comparison of Exposed Value and AAL for Baseline and Future Storm Surges
$100
$150
$200
$250
$300
$50
0
0 0.01
Future surge storm risk
Baseline storm surge risk
0.02 0.03 0.04 0.05 0.06 0.07 0.08 0.09 0.1
Annual Probability
Increased AAL for Future Storm Surge RiskLo
sses
in M
illio
ns (
USD
)
Figure 6.5: AAL for Future Storm Surge Risk due to sea level rise
133

7.1 Conclusion
The data clearly shows that the current risk levels posed by storm surge will increase significantly when sea level rise and coastal erosion are factored. When factored to the already significant levels of coastal erosion being experienced, a number of hotels and resorts will be significantly affected from the two main hazards of focus; storm surge and sea level.
The location of the resort area primarily along the narrow strip of sand barrier is a key contributor to this high level of exposure. This is further compounded by the quality of the level of degradation of natural protective mechanisms such as sea grass beds and coral reefs that offer a first line of protection for the coastline. Both factors threaten the viability of the Negril Resort area and by extension the tourism sector nationally.
The problem of coastal erosion has progressively worsened since the late 1960’s when the government pursued a development path that relied heavily on tourism, Negril featuring heavily in this development discussion. Not only has the number of resorts intensified but the types of
hotels and resorts around which Negril was developed has also changed demonstrating a strong correlation between levels of coastal erosion and intensification and scope of hotel developments.
The projections show that the situation will continue to worsen if no mitigation measures are implemented, however, should the two breakwaters proposed under this project be implemented, the models show that there will improvements in the rates of erosion and even more improvements when all 5 proposed are implemented. If unmitigated, the situation is not likely to improve and in such situation, not only will the hotels and resorts be impacted but other infrastructure such as roadways will also be impacted.
Notwithstanding the level of erosion and se-level rise that exists, the information presented in this atlas, when used to guide development decisions, should also result in a reduction in the level of vulnerability, especially through instruments such as development plans, adaptation and disaster risk reduction plans and shoreline protection and beach restoration plans.
Conclusion and Recommendations7.0
134

7.2 Recommendations • Training and further assessment is needed to quantify environmental risk and an Ecosystems
based approach to this assessment is recommended. Such an assessment should include the Great Negril Morass
• An assessment of the impact on livelihood groups is required. This is best facilitated by an assessment of the current and future climate impacts on ocean temperatures in Negril and a further analysis of this impact on marine organisms and vegetation. This can then be used to gauge impact on fishing. Such assessments can be undertaken collaboratively with universities
• The findings from this atlas should be used as a guide to developing other outputs under this programme, more specifically, the Beach Restoration Guideline, installation of the breakwaters and Adaption Plan for Negril
• The findings from the atlas should be incorporated and form the basis for any development plan and order created for Negril
• A number of stakeholders need to be sensitized on the findings from this atlas and this include media practitioners, Negril hoteliers, local authorities, NGO’s and businesses
• Stakeholders, when sensitized to the findings, should implement risk reduction and climate change adaption measures to reduce the risk. Such strategies and actions can include Business Continuity planning, alternate livelihood, structural mitigation, training and soft engineering.
• The three local authorities with jurisdiction over Negril should improve data collection to include impact reports on all events affecting Negril and surrounding communities. Special attention should be paid to impact to ecosystems
• Monitoring of the coastline changes should be done by NEPA and incorporate hoteliers located along the sand barrier in the process
• Select vulnerability and risk maps from the atlas should be placed on signboards in strategic sections of the town of Negril as part of public awareness of the risk
• The risk atlas should be placed on the website of the ODPEM, MOTE and PIOJ and National Spatial Data Management Division (NSDMD)
• Training in Risk assessment methodology and Ecosystems based analysis needs to be provided to climate change and disaster risk reduction professionals
• Dissemination of the atlas should be pursued as this was not an inclusion in the project. Dissemination should include various formats suited to different users of the data
Plate 6.1
135

Adaptation Fund, (n.d). Programme proposal.
The Caribbean Catastrophe Risk Insurance Facility. (2010). Enhancing the climate risk and adaptation fact base for the Caribbean: Preliminary results of the ECA Study. CCRIF’s Economics of Climate Adaptation (ECA) Initiative. Grand Cayman, Cayman Islands.
Civil Environmental and Coastal Engineers, (2012). Final Report for Identification and Soft Engineering Structures for Negril, Jamaica. Produced for Planning Institute of Jamaica.
Climate Studies Group, Mona (CSGM), (2012). State of the Jamaican Climate 2012: Information for Resilience Building (Full Report). Produced for the Planning Institute of Jamaica (PIOJ), Kingston Jamaica.
Climate Studies Group, Mona (CSGM), (2014). Near-Term Climate Scenarios for Jamaica (Technical Report). Produced for the Improving Climate Data and Information Management Project. Produced for the Planning Institute of Jamaica (PIOJ), Kingston, Jamaica.
Disaster Preparedness and Emergency Management Act 1993 (Jam.).
Disaster Act 2014. (Jam.)
Intergovernmental Panel on Climate Change. (2012). Managing the Risks of Extreme Events and Disasters to Advance Climate Change Adaptation. Special Report of Working Groups I and II of the Intergovernmental Panel on Climate Change (Field, C.B., V. Barros, T.F. Stocker, D. Qin, D.J. Dken, K.L. Ebi, M.D. Mastrandrea, K.J. Mach, G.-K. Plattner, S.K. Allen, M. Tignor, and P.M. Midgley (eds.). Cambridge University Press. Cambridge, UK, and New York, NY, USA.
Jamaica Tourist Board, (2014). Annual Travel Statistics 2006. Retrieved from http://www.jtbonline.org/statistics/Annual%20Travel/Annual%20Travel%20Statistics%202006.pdf
Jamaica Tourist Board, (2014). Annual Travel Statistics 2014. Retrieved from http://www.jtbonline.org/statistics/Annual%20Travel/Annual%20Travel%20Statistics%202014.pdf
Lalor, R.M. (1980). Tourism and Development: a case study of Negril, Jamaica. MPhil thesis. Department of Geography, Faculty of Natural Sciences, The University of the West Indies, Mona
Mona Informatics Limited, (2013). Negril–Orange River Land Cover Mapping and Change Detection Analysis: Technical Report Final . RFP: 2013 – CCA – Q2 – 01. Produced for Planning Institute of Jamaica.
Office of Disaster Preparedness and Emergency Management, (2000). Revised Catalogue of Disasters: 1500 – 2000. Office of Disaster Preparedness and Emergency Management.
Perch-Nielsen, S. L. (2009). The Vulnerability Of Beach Tourism To Climate Change. An Index Approach. Climatic Change 100: 579–606
Planning Institute of Jamaica, (2009). Vision 2030 Jamaica: National Development Plan. PIOJ: Author.
Rao, A.D. ,P. Chittibabu, T.S. Murty, S.K. Dube and U.C. Mohanty. (2007). Vulnerability from storm surges and Cyclone Wind Fields on the Coast of Andhra Pradesh, India. Natural Hazards Journal (2007) 41:515-529.
Smith Warner International Limited, (2007). Preliminary Engineering Report for Beach Restoration Works at Negril. Produced for Negril Coral Reef Preservation Society.
Statistical Institute of Jamaica, (2014). Population Census 2001 Jamaica, Country Report: Volume 2 Age and Sex: Male and Female by Five Year Age Groups: Jamaica.
8.0References
136

Toba, N. (2009). Potential Economic Impacts of Climate Change in the Caribbean Community. Latin America and Caribbean Region Sustainable Development Working paper 32, “Assessing the Potential Consequences of Climate Destabilization in Latin America”. World Bank. Washington DC. USA.
United Nations, (n.d). Sendai Framework for Disaster Risk Reduction: 2015 – 2030. UNISDR/GE/2015 - ICLUX EN5000 1st edition. Retrieved from http://www.preventionweb.net/files/43291_sendaiframeworkfordrren.pdf
United Nations Environment Programme (UNEP), (2010). Risk and Vulnerability Assessment Methodology Development Project (RiVAMP): Linking Ecosystems to Risk and Vulnerability Reduction. The Case of Jamaica – Results of Pilot Assessment. Produced for Planning Institute of Jamaica.
United Nations International Strategy for Disaster Risk Reduction. (2008). Climate Change and Disaster Risk Reduction: Briefing Note 01. United Nations, Geneva.
United Nations International Strategy for Disaster Risk Reduction. (2013). Global Assessment Report on Disaster Risk Reduction: From shared Risk to Share Value: The Business Case for Disaster Risk Reduction. United Nations International Strategy for Disaster Reduction. Geneva, Switzerland: UNISDR. Retrieved from http://www.preventionweb.net/english/hyogo/gar/2013/en/home/GAR_2013/GAR_2013_2.html
United Nations International Strategy for Disaster Risk Reduction.( n.d). Hyogo Framework for Action 2005 – 2015: Building the Resilience of Nations and Communities to Disasters: Extract from the final report on the World Conference on Disaster Reduction (A/CONF.206/6). UN/ISDR-07-2007-Geneva
University of the West Indies, Mona, Jamaica, (2002). Final Report on Phase 1: Beach Sands Resource Assessment Negril, Jamaica. Department of Geography and Geology, UWI: Author.
Westen, C.J., D. Alkema, M. Damen, N. Kerle and N. Kingma. (2013). Multi-hazard risk assessment: Distance education course Guide book. United Nations University – ITC School on Disaster Geoinformation Management (UNU-ITC DGIM), Version 2013.
Williams, S.A., Badr, A.W., Jayakaran, A. (2012). Towards Restoration of the Negril Great Morass Ecosystem: A Rapid Assessment of Hydrologic and Biodiversity Issues Critical to Ecosystem Restoration. Produced for Negril area Environmental Protection Trust (NEPT) Technical Report, Negril, Jamaica.
World Travel and Tourism Council, (2015). Travel and Tourism: Economic Impact 2015 World. Retrieved from http://www.wttc.org/-/media/files/reports/economic%20impact%20research/regional%202015/world2015.pdf
World Tourism Organization and UNEP (United Nations Environment Programme. (2008). Climate Change and Tourism – Responding to Global Challenges. Madrid, Spain
137

8.1 Glossary of TermsAnnual Average Loss (AAL): The long-term expected loss per year, averaged over many years. While there may actually be little or no losses, over a short period of time, the AAL accounts much larger losses that may occur more infrequently. In other words, it is the weighted average of expected loss from every event conditioned on the annual probability of each loss’s occurrence.
Climate Change: a change of climate which is attributed directly or indirectly to human activity that alters the composition of the global atmosphere and which is in addition to natural climate variability observed over comparable time periods.
Critical facilities: The primary physical structures, technical facilities and systems which are socially, economically or operationally essential to the functioning of a society or community, both in routine circumstances and in the extreme circumstances of an emergency.
Disaster: A serious disruption of the functioning of a community or a society involving widespread human, material, economic or environmental losses and impacts, which exceeds the ability of the affected community or society to cope using its own resources.
Disaster risk management: The systematic process of using administrative directives, organizations, and operational skills and capacities to implement strategies, policies and improved coping capacities in order to lessen the adverse impacts of hazards and the possibility of disaster.
Disaster risk reduction: The concept and practice of reducing disaster risks through systematic efforts to analyse and manage the causal factors of disasters, including through reduced exposure to 11 hazards, lessened vulnerability of people and property, wise management of land and the environment, and improved preparedness for adverse events.
Exposure: people, property, systems, or other elements present in hazard zones that are thereby subject to potential losses.
Hazard: a dangerous phenomenon, substance, human activity or condition that may cause loss of life, injury or other health impacts, property damage, loss of livelihoods and services, social and economic disruption, or environmental damage.
138

Mitigation: the lessening or limitation of the adverse impacts of hazards and related disasters.
Preparedness: the knowledge and capacities developed by governments, professional response and recovery organizations, communities and individuals to effectively anticipate, respond to, and recover from, the impacts of likely, imminent or current hazard events or conditions.
Probabilistic Risk Assessment: Uses a combination of probabilistic hazard scenarios, exposure and vulnerability, which is produced through modeling. Unlike historical estimates, probabilistic risk assessment takes into account all the disasters that could occur in the future, including very 5 intensive losses over long return periods, and thus overcomes the limitations associated with estimates derived from historical disaster loss data.
Probability: likelihood of an event occurring compared to all the possible events that might occur. The exceedance probability is the likelihood of one event of a given magnitude occurring or being exceeded within a defined time span.
Resilience: the ability of a system, community or society exposed to hazards to resist, absorb, accommodate to and recover from the effects of a hazard in a timely and efficient manner, including through the preservation and restoration of its essential basic structures and functions.
Return period: average frequency with which a particular event is expected to occur. It is usually expressed in years, such as 1 in X number of years. This does not mean that an event will occur once every X numbers of years, but is another way of expressing the exceedance probability: a 1 in 200 years event has 0.5% of chances to occur or be exceeded every year.
Risk: the combination of the probability of an event and its negative consequences.
Risk assessment: a methodology to determine the nature and extent of risk by analyzing potential hazards and evaluating existing conditions of vulnerability that together could potentially harm exposed people, property, services, livelihoods and the environment on which they depend.
Vulnerability: the characteristics and circumstances of a community, system or asset that make it susceptible to the damaging effects of a hazard.
139

140

141
