community satisfaction survey · market facts, was commissioned by the redland city council in...
TRANSCRIPT

Community Satisfaction Survey
REDLAND CITY COUNCIL
March 2019

Redland City Council Customer Satisfaction Survey 2019 MARKET FACTS (QLD) PTY LTD 1
TABLE OF CONTENTS
INTRODUCTION 2 Objectives of Survey 2 Themes of Council Responsibility 3 Structured Sample Survey 8 Briefing Material Supplied to Participants 9 Data Processing and Analysis 9 Reliability of the Findings 10
RESPONDENT PROFILE 11 OVERALL PERFORMANCE RATINGS 14
COMPARISON OF PERFORMANCE INDICES 15 ANALYSIS OF KEY POINTS 16
Areas of Lowest Performance Relative to Importance 17 Areas of Highest Performance Relative to Importance 19 Areas of Average Performance 21 Areas of Least Importance 21
EVALUATIONS OF TOTAL PERFORMANCE 22 Weighted Performance Indicators 22 Basic Services & Infrastructure 23 Community Lifestyle Services 24 Managing the City 25 Customer Service and Communications 26 Qualities of Council 27 COMMUNITY RATINGS OF COUNCIL RESPONSIBILITY AREAS (THEMES) 28
IMPORTANCE 29 Theme 1: Basic Services & Infrastructure IMPORTANCE 29 Theme 2: Community Lifestyle Services IMPORTANCE 36 Theme 3: Managing the Shire IMPORTANCE 44 Theme 4: Customer Service and Communication IMPORTANCE 48
PERFORMANCE 53 Theme 1: Basic Services & Infrastructure PERFORMANCE 54 Theme 2: Community Lifestyle Services PERFORMANCE 61 Theme 3: Managing the Shire PERFORMANCE 69 Theme 4: Customer Service and Communication PERFORMANCE 73 Theme 5: Quality of Council PERFORMANCE 77
PUBLIC OPINION QUESTIONS – KEY FINDINGS 78 Perceptions of various aspects of Redland City Council 79 Contact with Council 92 Branding 96 Community Understanding of Aboriginal Heritage 98 Council Information Provision 101 Nature of Contact with Council and Satisfaction Level 104 Disaster Management 107 Type of Information Required from Council 107 Making Payments 109 Council Events and Cultural Services 110
SUMMARY 112

Redland City Council Customer Satisfaction Survey 2019 MARKET FACTS (QLD) PTY LTD 2
INTRODUCTION
Market Facts, was commissioned by the Redland City Council in January 2019 to conduct a survey of community attitudes measuring levels of satisfaction with the services provided by Council.
This survey also included ‘supplementary questions’ (based on a survey undertaken by Council in 2016).
Objectives of Survey
The objectives are to:
1. Survey relevant categories of the members of the Redland City Council community, in order to:
(i) provide measurements of residents’ attitudes and opinions, and (ii) provide diagnostic information and analyses,
regarding the extent to which the Council’s provision of works, facilities and relevant administrative services meets the community’s perceived priorities.
2. Compare the results (as appropriate) against the most recent (July 2017) Metro Fringe LGA‘norms’ established by the LGAQ’s biennial surveys.1
3. Provide number-based detail which can be used to calculate relative priorities between the 37primary policy areas for which Council is responsible according to the “weighted averages” ofcommunity perceptions, after taking into account both existing Council Performance as well asbasic community priorities (i.e. ratings for Importance).
4. Compare ‘supplementary questions’ (where appropriate), which were based on a previoussurvey undertaken by Council in 2016.
1 There are 42 Responsibility Areas for the LGAQ standard customer satisfaction survey. A comparison with LGAQ Qld wide and Metro Fringe is provided in this report. However, it is not directly comparable as the Redland City Council customer satisfaction survey only included 37 Responsibility Areas. Hence comparison with LGAQ results are limited, to providing a general indication of comparative performance for key responsibility areas that are similar to LGAQ survey.

Redland City Council Customer Satisfaction Survey 2019 MARKET FACTS (QLD) PTY LTD 3
Themes of Council Responsibility
At the core of the benchmarking process is the evaluation by residents in the community of the broad array of council responsibilities (services and activities), divided into five Themes.
These Themes are:
Areas of Council Responsibility
THEME (1) Basic Services and Infrastructure
Function/Responsibility Examples/Clarification
Road Construction Constructing new or upgrading existing roads
Road Maintenance Repairing potholes and damaged road shoulders; street sweeping and verge mowing
Footpaths, Kerbing & Guttering Construction and maintenance of safe footpaths, kerbs and gutters
Street Lighting Funding the provision and upkeep of lights on Council streets/roads
Traffic Management Traffic planning, traffic lights, roundabouts, traffic `calming' and directional signage
Parking Facilities Establishing parking policies, parking control, provision of or assessment of requirement for on and off-street parking
Water Supply Supply of water to meet reasonable standards of Quantity (volume, pressure, continuity) and Quality (colour, odour, taste, softness)
Sewerage Provision of sewerage system with adequate standards of effluent discharge, odour control and operating efficiency
Public Transport Either providing or ensuring the provision of an adequate system of public transport
Drainage & Flood Mitigation Construction and maintenance of open and underground stormwater drains, levee banks, division channels etc
Waste Management Garbage collection and disposal, waste minimisation (recycling and composting), street bins
Community Health Inspection of restaurants/cafés/shops, mosquito/midge spraying, cemeteries

MARKET FACTS (QLD) PTY LTD 4
THEME (2) Community Lifestyle Services
Function/Responsibility Examples/Clarification
Parks, Playgrounds & Public Amenities
Development and maintenance of open space areas, parks, children's play-grounds and public toilets
Environmental Controls Enforcement of regulations on air, water and noise pollution
Environmental Protection & Conservation
Tree planting, bushland acquisition, noxious weeds eradication, foreshore protection, preservation of natural areas.
Heritage Protection Preservation of historic buildings, monuments, facilities, artefacts, and Indigenous & other records
Sporting & Recreational Facilities Public swimming pools, sports-fields, land and/or support for clubs & their facilities
Cultural & Entertainment Facilities Civic centre, public halls, art gallery/museum, community arts programs, community festivals
Libraries & Other Information Access
Public library, Internet access, CD ROM's
Community Safety Safety action plans, safety audits, signage, security patrols & cameras, beach & pool lifeguards, community education & awareness programs
Community Services Programs and facilities that meet the needs of a range of stakeholder groups (such as senior citizens, young people, families, Indigenous, disabled, non-English speaking background)
Pet / Animal Control Registration, impounding of strays, control of feral animals
Shopping Centres Ensuring the provision of adequate shopping facilities to meet the needs and convenience of local residents
Community Development Working with (& supporting) community organisations and special-interest groups to develop strong, sustainable & self-reliant communities
Cycleways Adequate and safe provision of cycleways throughout the city
Redland City Council Customer Satisfaction Survey 2019

Redland City Council Customer Satisfaction Survey 2019 MARKET FACTS (QLD) PTY LTD 5
THEME (3) Managing the City
Function/Responsibility Examples/Clarification
Town Planning Planning and zoning for the purposes of residential, rural, commercial, industrial, recreational, open space & public infrastructure development including urban renewal & CBD redevelopment, rules regarding land usage
Economic Development & Local Employment
Promoting/supporting increased economic activity and increased local employment opportunities, attracting investment
Development of Tourism Area promotion, tourist information facilities, visitor care programs, caravan parks, promoting/supporting additional tourism activities
Financial Management Responsible, open and accountable management of the Council's finances
Revenue Raising Establishing fair and equitable rating for residential, rural, commercial and other sectors; applying a fair and reasonable balance between income from rates and from user-pays fees and charges
Redland City Council Customer Satisfaction Survey 2019 MARKET FACTS (QLD) PTY LTD 6
THEME (4) Customer Services and Communication
Function/Responsibility Examples/Clarification
Customer Service Accessible & adequate facilities for dealing with and responding to contacts from stakeholders and the general public, handling enquiries / requests / complaints
Information Services Maintaining and updating databases on Council facilities & services including rates & property information, water/sewerage/drainage networks, community services, etc
Informing the Community Keeping the community informed of Council policies, plans, programs & activities through newsletters & other means, advising of community issues to be debated
Consulting the Community Ensuring community input into Council policies, plans & programs by regularly canvassing residents’ opinions & priorities and by maintaining effective relationships with the broad range of community groups
Responding to the Community Providing feedback on community input, taking action where appropriate to implement community priorities, being accessible to all members of the community including minority groups
Providing Leadership & Advocacy
Representing local community needs & interests to other spheres of government (including government authorities) and to other outside organisations whenever relevant, supporting civic pride & local identity, promoting accountability & best practice

Redland City Council Customer Satisfaction Survey 2019 MARKET FACTS (QLD) PTY LTD 7
THEME (5) Qualities of Council
Function/Responsibility Examples/Clarification
Quality and Performance of Staff
Competent, effective, efficient, get things done, accessible, courteous, helpful, believe in achieving solutions, knowledgeable

Redland City Council Customer Satisfaction Survey 2019 MARKET FACTS (QLD) PTY LTD 8
Structured Sample Survey
Random telephone calls were made to resident households throughout the City, using the Electronic White Pages. These calls identified 600 residents aged 18 years and over who indicated that they were ‘interested in discussing local government issues and expressing an opinion about them’ and who were prepared to participate in the survey.
In order to enrol the sample of 600 respondents a total of 6082 attempted and 3478 connected telephone calls were made. Quotas for the telephone survey were taken as follows:
Suburb Quotas Region and Postcode
Coastal Region
Thorneside 14 4158
Birkdale 54 4159
Erobin, Ormiston 24 4160
Wellington Point 42 4160
Cleveland, Raby Bay 62 4163
Point Halloran, Victoria Point, Victoria Point West 70 4165
Redland Bay 54 4165
TOTAL 320
Inland Region
Capalaba 60 4157
Sheldon 10 4157
Alexandra Hills, Burwood Heights 56 4161
Thornlands 50 4164
Mount Cotton 24 4165
TOTAL 200
Stradbroke Island
Amity Point, Dunwich, Point Lookout, NSI 30 4183
TOTAL 30
Southern Moreton Bay Islands
Coochiemudlo Island 10 4184
Karragarra Island, Lamb Island, Macleay Island, Russell Island
40 4184
TOTAL 50
SAMPLE TOTAL 600
The total sample size was n=600

Redland City Council Customer Satisfaction Survey 2019 MARKET FACTS (QLD) PTY LTD 9
Briefing Material Supplied to Participants
After despatching preliminary prompt material to those people who had agreed to participate, follow-up telephone interviews were conducted by appointment. The material sent included the explanation of the ‘Themes of Council Responsibility’ set out on the previous pages, the method of rating for Importance and Performance, and also described the methods of rating.
Data Processing and Analysis
The data has not been weighted. As a matter of course the data, after input, was cleaned and logic-checked to ensure error-free detailed tables. All percentages in the tabular output have been rounded to one decimal point. Significance tests have been applied to identify those differences in response among the various subgroups which were highly unlikely to have occurred due to chance.
All responses were coded and computer-analysed by the standard breaks of:
Gender
Age Group
Location – Coastal, Inland, Stradbroke Island, Southern Moreton Bay Islands
Participation quotas were set for all Redlands Coast suburbs to ensure the overall sample was representative of the city. There was however intentional slight over-sampling from NSI and SMBI to ensure results from these areas were statistically significant.
Overall sample size allows statistically robust comparison of 4 city regions ie Coastal, Inland, SMBI and NSI. The following postcode level report will provide a guide only to community sentiment at a postcode level, as sample sizes by postcode may not always be sufficient for results to be statistically reliable.

Redland City Council Customer Satisfaction Survey 2019 MARKET FACTS (QLD) PTY LTD 10
These breaks were established to enable the identification of significant differences in response patterns among the various community sectors represented by the sub-samples. For all analysis of these standard demographic breaks, and for the local issues tables, we have applied significance tests to the differences between the sub-samples and the total sample. These appear in the tables as:
+++ significantly greater than the sample result at the 99% level of confidence ++ significantly greater than the sample result at the 95% level of confidence + significantly greater than the sample result at the 90% level of confidence - - - significantly lower than the sample result at the 99% level of confidence - - significantly lower than the sample result at the 95% level of confidence - significantly lower than the sample result at the 90% level of confidence
Tables included in this Report only show results for the Total Sample. However, a comprehensive printout of all analyses has been closely examined in compiling the commentary.
Average ratings for Importance and Performance were calculated - from which Weighted Performance Indicators were derived for each parameter being rated. These were then combined to provide a Weighted Performance Index for each of the five Themes of Council Responsibility and for Overall Performance on all 37 Areas as a whole.
Reliability of the Findings
The findings of the survey are obviously subject to Sampling Error. The maximum Probable Error of our total sample is ±3.99% at the 95% level of confidence. Comparisons between categories and subgroups are subject to varying error depending on respondent frequencies and the relative percentages of respondents falling in different response codes.
In order to better understand the principle of maximum probable error, the following example is provided. For a maximum Probable Error of plus or minus 3.99% at the 95% level of confidence, if a result of 50% was returned, we could be confident that 95% of responses fell between 46.01 % and 53.99%, which is 50% plus or minus 3.99%.
This survey is not designed to deliver definitive findings for individual Council divisions.
By continuing to use the basic survey instrument and reporting methodology over an extended period of time, data accumulated in the form of ‘norms’ permit ever more accurate and reliable benchmarks to be established.

Redland City Council Customer Satisfaction Survey 2019 MARKET FACTS (QLD) PTY LTD 11
RESPONDENT PROFILE
The following section of the report provides a graphical summary of the demographic profile of the respondents who participated in the survey. The sample averages for the following demographic characteristics are reported, as follows by:
Gender
Age Group
Neighbourhood
Home Ownership
Present Work Status
The following profile of the survey respondents in Redland City Council is important as it provides an overview of the community members who have provided their opinion and perceptions about Council in the following sections of this report.
In terms of gender, the screened sample of ‘interested’ respondents comprised (50%) males and (50%) females.
Due to the low incidence of the youngest age group (18-24 age group), it has been added to the 25-34 years age group for the analysis in this report. This low response is typical and indicates a much lower interest in local government matters. Additionally, as respondents were screened for interest in local government matters, this may also go some way to explain low numbers for this age group.
65 yrs and over28%
45-54 yrs25%
55-64 yrs22%
35-44 yrs18%
18-34 yrs7%
Age Group

Redland City Council Customer Satisfaction Survey 2019 MARKET FACTS (QLD) PTY LTD 12
The majority (46%) of respondents were ‘living as a couple’ households.
The majority (86%) of the respondents live in built up areas, close to neighbours.
Living as a couple46%
Living as a family (2 parent)
33%
Living alone16%
Living as a family (1 parent)
4%
Single /sharing accommodation
1%
Household situation
Built up area, living close to
neighbours86%
Acreage or semi rural (1/2 1
hectare)10%
Rural residential (more than 1-2
hect.)2%
Truly rural area, like
living on a farm1%
Refused1%
Neighbourhood

Redland City Council Customer Satisfaction Survey 2019 MARKET FACTS (QLD) PTY LTD 13
Renters account for 13% of respondents.
87% of respondents were home-owners.
Almost half (41%) of the respondents were Managers/Professional (24%) or Para-professional/Trades persons (17%)
Own home87%
Renting13%
Home Ownership
Main income-earner not working/no
breadwinner36%
Manager/Administrator/Profession
al24%
Para-professional/ Trades person
17%
Plant or machine operator/Driver/L
abourer/Farm worker
12%
Clerical worker/Sales or Personal service
worker11%
Occupation of main breadwinner

Redland City Council Customer Satisfaction Survey 2019 MARKET FACTS (QLD) PTY LTD 14
OVERALL PERFORMANCE RATINGS
This survey method uses a weighted aggregated total performance rating to measure overall satisfaction which is calculated by summarising all Performance ratings of each of the 37 Responsibility Areas into one (1) number, weighted by the relative Importance of each Area. It is computed by using all Importance scores, all Performance scores and all weighted Performance Indicators for all 37 Responsibility Areas and calculation of the weighted Total Performance Index from the resultant totals, using the standard formula. It is close to, but not the same as, the average of all Performance means expressed as a share of the Optimum performance score.
This ‘summary number’ is called the ‘Average Total Performance Index’ (TPI) or the Aggregated Overall Performance (Weighted).
Average Total Performance Index (TPI) for the survey was calculated at 67.65%
By comparison, with LGAQ State-wide survey Metro Fringe averages in 2017, TPIs of 69.39% and 69.18% were achieved, so Redlands TPI of 67.65% for 2019 is tracking just below both Queensland wide and Metro Fringe TPIs.
Total Performance Indexes can be examined from two general perspectives - the composition (i.e. the average scores for the individual Importance and Performance scores for each of the Responsibility Areas in each of the Themes) and a comparison of the overall index scores over time (for future ongoing tracking surveys).

Redland City Council Customer Satisfaction Survey 2019 MARKET FACTS (QLD) PTY LTD 15
COMPARISON OF PERFORMANCE INDICES
The following charts show comparison of the Total Performance Index (TPI) for Redland City Council 2019 with LGAQ 2017.
The chart above, shows the Redland City Council TPI (67.65%) for 2019 compared to TPI for the 5 key themes for both Metro Fringe and Queensland State-wide in the 2017 survey.
As can be seen from the chart above (compared to Metro Fringe and Queensland State-wide surveys), Redland City Council is above the overall average TPI in 2 out of the 5 areas namely:
Qualities of Council (72.04%)
Community Lifestyle Services (76.01%)
For Redland City Council Managing the City TPI (58.31%), it is well below the Metro Fringe TPI (65.92%) and LGAQ State-wide (65.65%).
For the remaining two themes – Basic Services and Infrastructure and Customer Services and Communications, Redland City Council is generally on par with Metro Fringe counterparts and LGAQ State-wide.
68.81%
76.01%
58.31%
66.14%
72.04%
67.65%
69.24%
71.96%
65.92%
66.86%
70.13%
69.18%
70.57%
72.02%
65.65%
66.38%
69.45%
69.39%
0.00% 10.00%20.00%30.00%40.00%50.00%60.00%70.00%80.00%
Basic Services / Infrastructure
Community Lifestyle Services
Managing the Shire/City
Customer Services and Communications
Qualities of Council
OVERALL WEIGHTED PERFORMANCE INDEX
Summary of Performance Indices
LGAQ STATEWIDE - 2017 LGAQ (METRO FRINGE) SURVEY - 2017 REDLAND 2019

Redland City Council Customer Satisfaction Survey 2019 MARKET FACTS (QLD) PTY LTD 16
ANALYSIS OF KEY POINTS
Explanation of Importance & Performance Ratings
In conjunction with TPI, mean score ratings are also used to understand average IMPORTANCE or PERFORMANCE ratings given by all respondents, and a 5-point scales is used with clarifying semantic differentials as follows:
IMPORTANCE PERFORMANCE
Crucial (5) Very Good (5) Important (4) Good (4) Nice to Have (3) Fair Only (3) Unimportant (2) Poor (2) Quite Unimportant (1) Very Poor (1)
In both measurements, provision was also made for unprompted ‘Don't Know’ or ‘Not Applicable’ responses. These were factored out of the calculations by giving them a value = 0.
While the words used in the Performance Scales each have an obvious meaning, those used in the Importance Scales were explained in detail to all respondents by the interviewers:
‘Crucial’ means that it is a service or activity that the community must have and that it is vitalfor the council either to do or to get involved in to make sure that it is done by someone.
‘Important’ is for something that you certainly expect your council to do, provide or make surethat somebody else provides it.
‘Nice To Have’ means just that, as does ‘Not Very Important’.
‘Quite Unimportant’ means unnecessary - something that in any council cutbacks would be thefirst to go.
Achieved MEAN scores should thus be considered in relation to the scale being applied. For example:
a MEAN of 4.5 on Importance indicates that the particular responsibility/quality is adjudgedmid-way between Important and Crucial.
a MEAN of 3.5 for Performance means that the Council is seen as mid-way between Fair Onlyand Good in being effective/delivering service on that particular criterion.

Redland City Council Customer Satisfaction Survey 2019 MARKET FACTS (QLD) PTY LTD 17
Areas of Lowest Performance Relative to Importance
The Table shows the 18 Responsibility Areas and graph (overleaf) highlight where there are the greatest gaps between Performance and Importance mean scores.
Responsibility Area Importance Performance Share of Optimum Mean Rank Mean Rank
Town Planning 4.66 5= 2.68 32 53.6%
Parking Facilities 4.38 17= 2.70 31 53.9%
Responding to the Community
4.67 4 2.81 30 56.1%
Traffic Management 4.56 9 2.83 29= 56.6%
Economic Development/Local
Employment
4.40 16 2.83 29= 56.6%
Financial Management 4.71 3 2.92 28= 58.4%
Consulting the Community 4.65 6 2.92 28= 58.4%
Environment Protection & Conservation
4.32 18 2.97 27 59.3%
Public Transport 4.38 17= 2.99 26 59.7%
Development of Tourism 4.02 27= 3.06 25 61.2%
Providing Leadership & Advocacy
4.53 11 3.08 24 61.6%
Revenue-raising 4.43 15 3.11 23 62.2%
Road Construction 4.46 13 3.15 22 63.1%
Environmental Controls 4.21 23 3.20 21 64.0%
Road Maintenance 4.57 8= 3.21 20= 64.1%
Footpaths, Kerbing, Guttering
4.14 24 3.21 20= 64.2%
Community Development 4.13 25 3.25 19 65.1%
Heritage Protection 4.02 27= 3.28 18 65.7%
*Responsibility Areas shown in shading were rated in ‘top ten’ in overall importance

Redland City Council Customer Satisfaction Survey 2019 MARKET FACTS (QLD) PTY LTD 18
These 18 Responsibility Areas have been selected on the basis that
their Importance rating is at least 3.96 (on the border-line of ‘4’= ‘Important’), and
their Performance is more than 1.5% below Average (where Average Total Performance Indexis 67.65%).
The size of the job to be done can be defined in two ways:
Move the Performance Mean from the current rating up to the Optimum level (‘a score of ‘5’).Current Performance as a share of Optimum is shown in the Share of Optimum column. Thedifference between ‘Share of Optimum’ and 100.0% shows how actual performance has toimprove to achieve a score of ‘5’.
Achieve Equilibrium between Performance and Importance by closing the ‘gap’ between theirrespective Mean scores. If the gap between the average ratings for Importance andPerformance were to close, there would be a significant improvement in communityperceptions of Overall Performance.
4.02
4.13
4.14
4.57
4.21
4.46
4.43
4.53
4.02
4.38
4.32
4.65
4.71
4.40
4.56
4.67
4.38
4.66
3.28
3.25
3.21
3.21
3.20
3.15
3.11
3.08
3.06
2.99
2.97
2.92
2.92
2.83
2.83
2.81
2.70
2.68
0.00 0.50 1.00 1.50 2.00 2.50 3.00 3.50 4.00 4.50 5.00
Heritage Protection
Community Development
Footpaths, Kerbing, Guttering
Road Maintenance
Environmental Controls
Road Construction
Revenue-raising
Providing Leadership & Advocacy
Development of Tourism
Public Transport
Evironment Protection & Conservation
Consulting the Community
Financial Management
Economic Development/Local Employment
Traffic Management
Responding to the Community
Parking Facilities
Town Planning
Lowest Performers - Importance & Performance Comparison
Performance Mean Importance Mean

Redland City Council Customer Satisfaction Survey 2019 MARKET FACTS (QLD) PTY LTD 19
Areas of Highest Performance Relative to Importance
There are 15 Responsibility Areas (out of the total of 37) on which Council performed best in relation to their judged importance. These are summarised in the table below and graphically overleaf. In this case, ‘best’ is defined as having:
an Importance rating of at least 3.96 (on the border-line of ‘4’= ‘Important’), and
Performance more than 1.5% above Average (where Average Performance is 67.65%- the(calculated) Average Total Performance Index).
*Responsibility Areas shown in shading were rated in ‘top ten’ in overall importance
Responsibility Area Importance Performance Share of Optimum Mean Rank Mean Rank
Libraries & other Information Access
4.27 19
4.26 1 85.3%
Waste Management 4.66 5= 4.11 2 82.1%
Sewerage 4.73 2 4.05 3 81.0%
Water Supply 4.78 1 4.02 4 80.4%
Customer Service 4.48 12 3.87 5 77.5%
Parks, Playgrounds & Public Amenities 4.01 28 3.81 7 76.2%
Information Services 4.45 14= 3.78 8 75.6%
Drainage & Flood Mitigation 4.55 10 3.77 9 75.4%
Shopping Facilities 4.25 20 3.62 10 72.4%
Community Safety 4.45 14= 3.61 11 72.3%
Quality & Performance of Staff
4.57 8=
3.60 12 72.0%
Street Lighting 4.24 21 3.57 13= 71.3%
Community Health 4.38 17= 3.57 13= 71.3%
Community Services 4.22 22 3.52 14 70.3%
Pet/Animal Control 4.11 26 3.49 15 69.9%

Redland City Council Customer Satisfaction Survey 2019 MARKET FACTS (QLD) PTY LTD 20
4.27
4.66
4.73
4.78
4.48
4.01
4.45
4.55
4.25
4.45
4.57
4.24
4.38
4.22
4.11
4.26
4.11
4.05
4.02
3.87
3.81
3.78
3.77
3.62
3.61
3.60
3.57
3.57
3.52
3.49
0.00 1.00 2.00 3.00 4.00 5.00 6.00
Libraries & other Information Access
Waste Management
Sewerage
Water Supply
Customer Service
Parks, Playgrounds & Public Amenities
Information Services
Drainage & Flood Mitigation
Shopping Facilities
Community Safety
Quality & Performance of Staff
Street Lighting
Community Health
Community Services
Pet/Animal Control
Highest Performers - Importance & Performance Comparison
Performance Mean Importance Mean

Redland City Council Customer Satisfaction Survey 2019 MARKET FACTS (QLD) PTY LTD 21
Areas of Average Performance
There is only one Responsibility Area (out of the total of 37) on which Council has received an average score which is defined as having:
an Importance rating of at least 3.96 (on the border-line of ‘4’= ‘Important’), and
Performance not more than 1.5% below or above Average (where Average Performance 67.65%- the (calculated) Average Total Performance Index).
Responsibility Area Importance Performance Share of Optimum Mean Rank Mean Rank
Informing the Community 4.64 7 3.42 16 68.3%
*Responsibility Areas shown in shading were rated in ‘top ten’ in overall importance
Areas of Least Importance
Only 3 of the 37 Responsibility Areas have not been considered in formulating the previous three lists (Highest Performers, Lowest Performers and Average Performers) because they did not have an Importance rating greater than 3.96, or 4 when rounded (i.e.= ‘Important’).
Nevertheless, they do exist, and are listed below - ranked by their Performance score, as used in the previous three tables.
Despite their Importance rating being regarded as fairly low, by the Community at large, Councils cannot avoid expending resources upon them, as they are very Important to some members of the community (e.g. Sporting & Recreational Facilities is rated as ‘important’ by 48.7% of respondents). Hence, the detailed data on these particular areas has to be examined, to formulate priorities - as these show the proportions of the community who have varying priorities.
Responsibility Area Importance Performance Share of Optimum Mean Rank Mean Rank
Cultural & Entertainment Facilities
3.86 30 3.85 6= 77.1%
Sporting & Recreational Facilities
3.89 29 3.85 6= 76.9%
Cycleways 3.68 31 3.29 17 65.9%

Redland City Council Customer Satisfaction Survey 2019 MARKET FACTS (QLD) PTY LTD 22
EVALUATIONS OF TOTAL PERFORMANCE
The following pages present tables showing performance indices (used to benchmark successive measures of performance). These can be used to guide plans and policies in order to improve the levels of satisfaction of the residents of Redland City Council – Local Government Area.
Weighted Performance Indicators
The tabular calculations give the results for each Responsibility Area within each Theme as a Weighted Performance Indicator (WPI). The table then combines these individual Weighted Performance Indicators to produce an overall Total Performance Index (TPI) for each Theme.
Individual Weighted Performance Indicators are produced by multiplying the average Performance Rating awarded to a council for each Responsibility Area within a particular Theme by the average Importance Rating given to it. This ‘weights’ each individual Performance score by the level of community priority for that specific Area.
To obtain the Total Performance Index (TPI) for each Theme, the individual Weighted Performance Indicators are summed, as an Achieved Score, and percentaged against a Possible Score - which could be achieved only if all respondents gave their council a ‘5’ rating (‘Very Good’) for Performance on all the Responsibility Areas in that Theme.
These TPI’s become a benchmark against which Council can track, over individual and successive surveys, the effectiveness with which they have addressed community expectations. They also provide objective numerical data which can be used to crystallise - from the viewpoint of residents - Objectives set out in Council Strategic or Corporate Plans. They describe ‘what is’ - actual performance, adjusted for relative importance priorities.

Redland City Council Customer Satisfaction Survey 2019 MARKET FACTS (QLD) PTY LTD 23
Basic Services & Infrastructure
Weighted Performance Index (in order of Importance)
Theme 1 Basic Services/Infrastructure
2019 Survey
Importance Means
Performance Means
Performance Indexes
Water Supply 4.78 4.02 80.4%
Sewerage 4.73 4.05 81.0%
Waste Management 4.66 4.11 82.1%
Road Maintenance 4.57 3.21 64.1%
Traffic Management 4.56 2.83 56.6%
Drainage & Flood Mitigation 4.55 3.77 75.4%
Road Construction 4.46 3.15 63.1%
Community Health 4.38 3.57 71.3%
Public Transport 4.38 2.99 59.7%
Parking Facilities 4.38 2.70 53.9%
Street Lighting 4.24 3.57 71.3%
Footpaths, Kerbing, Guttering 4.14 3.21 64.2%
MEANS 4.48 3.43
Total Performance Index 68.81%
The weighted Total Performance Index (TPI) for Basic Services & Infrastructure is one number, which sums up the whole interaction between Performance and Priorities for this particular Theme.
In 2019, the actuality of the interaction between these two forces gives a result of 68.81% of what might have been achieved if Redland City Council were to achieve perfect performance for every Responsibility Area.
The table shows a comparison of how the community actually judges Council performance, as it makes allowance for the relative Importance of each of the Activity Areas judged. This ‘reality’ is shown in the Weighted Performance Indicator numbers. However, the rank order of these WPIs is clearly at variance with the priorities with which the community wants matters to be handled (the table is formatted in the rank order of Importance scores).

Redland City Council Customer Satisfaction Survey 2019 MARKET FACTS (QLD) PTY LTD 24
Community Lifestyle Services
Weighted Performance Index (in order of Importance)
Theme 2 Community Lifestyle Services
2019 Survey
Importance Means
Performance Means
Performance Indexes
Libraries & other Information Access
4.27 4.26 85.3%
Cultural & Entertainment Facilities
3.86 3.85 77.1%
Sporting & Recreational Facilities
3.89 3.85 76.9%
Parks, Playgrounds & Public Amenities
4.01 3.81 76.2%
Shopping Facilities 4.25 3.62 72.4%
Community Safety 4.45 3.61 72.3%
Community Services 4.22 3.52 70.3%
Pet/Animal Control 4.11 3.49 69.9%
Cycleways 3.68 3.29 65.9%
Heritage Protection 4.02 3.28 65.7%
Community Development 4.13 3.25 65.1%
Environmental Controls 4.21 3.20 64.0%
Environment Protection & Conservation
4.32 2.97 59.3%
Means 4.11 3.54
Total Performance Index 76.01%
The weighted Total Performance Index (TPI) for Community Lifestyle Services in 2019 is 76.01% of the Optimum.
Weighted Performance Indicator scores vary from survey to survey, as they are affected by changes to Importance scores as well as Performance scores. Therefore, they can be used as a way of ensuring that planning targets for both Importance and Performance are kept within realistic achievable ranges.
They also clearly show where the community’s resources should be allocated to achieve planning objectives

Redland City Council Customer Satisfaction Survey 2019 MARKET FACTS (QLD) PTY LTD 25
Managing the City
Weighted Performance Index (in order of Importance)
Theme 3 Managing the City
2019 Survey
Importance Means
Performance Means
Performance Indexes
Financial Management 4.71 2.92 58.4%
Town Planning 4.66 2.68 53.6%
Revenue-raising 4.43 3.11 62.2%
Economic Development/Local Employment
4.40 2.83 56.6%
Development of Tourism 4.02 3.06 61.2%
Means 4.44 2.92
Total Performance Index 58.3%
The weighted Total Performance Index (TPI) for Managing the City in 2019 is 58.3% of the Optimum.
The table shows a comparison of how the community actually judges the performance of Council as it makes allowance for the relative Importance of each of the Activity Areas judged. This ‘reality’ is shown in the Weighted Performance Indicator numbers.

Redland City Council Customer Satisfaction Survey 2019 MARKET FACTS (QLD) PTY LTD 26
Customer Service and Communications
Weighted Performance Index (in order of Importance)
Theme 4 Customer Service and Communication
2019 Survey
Importance Means
Performance Means
Performance Indexes
Responding to the Community
4.67 2.81 56.1%
Consulting the Community
4.65 2.92 58.4%
Informing the Community 4.64 3.42 68.3%
Providing Leadership & Advocacy
4.53 3.08 61.6%
Customer Service 4.48 3.87 77.5%
Information Services 4.45 3.78 75.6%
Means 4.57 3.31
Total Performance Index 66.14%
The weighted Total Performance Index (TPI) for Customer Service & Communications for 2019 is 66.14%.
The table shows a comparison of how the community actually judges Council performance for this theme, as it makes allowance for the relative Importance of each of the Activity Areas judged. This ‘reality’ is shown in the Weighted Performance Indicator numbers. However, the rank order of these WPIs is clearly at variance with the priorities with which the community wants matters to be handled (shown by the rank order of Importance scores).

Redland City Council Customer Satisfaction Survey 2019 MARKET FACTS (QLD) PTY LTD 27
Qualities of Council
Weighted Performance Index (in order of Importance)
Theme 5 Qualities of Council
2017 Survey
Importance Means
Performance Means
Performance Indexes
Quality & Performance of Staff 4.57 3.60 72.0%
Means 4.57 3.60
Total Performance Index 72.04%
The 2019 weighted Total Performance Index (TPI) for Qualities of Council is 72.04%.
The table shows how the community actually judges Council performance, as it makes allowance for the relative Importance of each of the Activity Areas judged. This ‘reality’ is shown in the Weighted Performance Indicator numbers. However, the rank order of these WPIs is again at variance with Importance priorities (shown by the rank order of Importance scores).

Redland City Council Customer Satisfaction Survey 2019 MARKET FACTS (QLD) PTY LTD 28
COMMUNITY RATINGS OF COUNCIL RESPONSIBILITY AREAS (THEMES)
This section comprises two sets of tables and commentary:
the first set of tables deals with the community’s priorities - the IMPORTANCE of each Area ofResponsibility/Service;
the second set of tables deals with the community’s perceptions of what is actually the case -the ratings for COUNCIL PERFORMANCE in each Area of Responsibility / Service.
N.B. In the following tables, the Responsibility Areas being rated are presented in the order of consideration by respondents, not in rank order of Importance or Performance.
In terms of importance mean scores as compared with results for the LGAQ 2017 survey for both Queensland State-wide and Metro Fringe Councils, these results are summarised below. What is clear is that Redland City Council respondents have placed far greater emphasis on importance of responsibilities areas across all five themes compared to their counterpart Councils across the State.
The following section sets out in details ratings for each responsibility area within the theme and includes some analysis of significant variances from samples averages for these ratings. This will help Council to build a picture of where different sub-samples have viewed importance differently.
4.28
3.95
4.21
4.26
4.30
4.18
3.92
4.18
4.26
4.35
4.48
4.11
4.44
4.57
4.57
3.40 3.60 3.80 4.00 4.20 4.40 4.60 4.80
Basic Services /Infrastructure
Community Lifestyle Services
Managing the Shire/City
Customer Service & Communication
Quality of Council
Importance Mean Comparison - LGAQ versus Redland City Council
RCC LGAQ Metro Fringe LGAQ QLD

Redland City Council Customer Satisfaction Survey 2019 MARKET FACTS (QLD) PTY LTD 29
IMPORTANCE
Theme 1: Basic Services & Infrastructure IMPORTANCE
Sample Size
RANK Crucial Import -ant
Nice to
have
Not very
Import.
Quite Unimp-ortant
Don't Know
Not Applic -able
RCC Mean 2019
LGAQ Mean 2017
Road Construction 600 7 52.3% 42.3% 4.0% 1.0% 0.2% 0.0% 0.2% 4.46 4.21
Road Maintenance 600 4 61.2% 35.5% 2.5% 0.5% 0.2% 0.0% 0.2% 4.57 4.39
Footpaths, Kerbing & Guttering
600 10
30.2% 54.7% 9.8% 2.2% 0.7% 0.8% 1.7% 4.14 3.96
Street Lighting 600 9 36.5% 53.0% 6.8% 2.2% 0.7% 0.7% 0.2% 4.24 3.95
Traffic Management 600 5 63.8% 29.7% 4.5% 0.8% 0.7% 0.0% 0.5% 4.56 4.15
Parking Facilities 600 8= 43.7% 49.3% 5.0% 0.3% 0.3% 0.3% 1.0% 4.38 3.87
Public Transport 600 8= 43.7% 49.3% 5.0% 0.3% 0.3% 0.3% 1.0% 4.38 3.85
Water Supply 600 1 78.7% 20.5% 0.5% 0.0% 0.2% 0.2% 0.0% 4.78 4.47
Sewerage 600 2 71.0% 20.2% 2.2% 0.2% 0.0% 2.3% 4.2% 4.73 4.39
Drainage & Flood Mitigation
600 6
58.0% 37.3% 2.8% 0.5% 0.0% 0.0% 1.3% 4.55 4.32
Waste Management 600 3 67.5% 30.5% 1.5% 0.2% 0.0% 0.0% 0.3% 4.66 4.45
Community Health 600 8= 43.3% 50.3% 5.3% 0.2% 0.0% 0.8% 0.0% 4.38 4.15
AVERAGE FOR THEME AS A WHOLE 4.48 4.18
The average level of Importance for the responsibilities in this Theme is 4.48. All responsibility areas were judged as ‘important’ (a mean rating of 4.00 or better).
The top 2 priorities are:
Water Supply (4.78)
Sewerage (4.73)
Those regarded as least important, were Street Lighting (4.24) and Footpaths, Kerbing & Guttering (4.14).
Significant variances (by age, gender and location) from the sample averages are also shown, below each graph, for each responsibility area.

Redland City Council Customer Satisfaction Survey 2019 MARKET FACTS (QLD) PTY LTD 30
Significant variances by:
Gender none
Age none
Location 16.7% from North Stradbroke Island – Nice to have 6.7% from North Stradbroke Island – Unimportant 2.0% from Southern Moreton Bay Islands – Not applicable
Significant variances by:
Gender none
Age 1.8% 65 years and over - unimportant
Location 13.3% from North Stradbroke Island – Nice to have 3.3% from North Stradbroke Island – Quite Unimportant 2.0% from Southern Moreton Bay Islands – Not Applicable
Crucial 52%
Important 43%
Nice to have 4%
Not very Import. 1%
Quite Unimportant
0%Don't Know
0%
Not Applicable0%
Road Construction
Crucial 61%
Important 35%
Nice to have 3%
Not very Import. 1%
Quite Unimportant
0%
Don't Know0%
Not Applicable0%
Road Maintenance

Redland City Council Customer Satisfaction Survey 2019 MARKET FACTS (QLD) PTY LTD 31
No significant variances.
Significant variances by:
Gender none
Age none
Location 16% from Southern Moreton Bay Islands – Nice to have 4% from Southern Moreton Bay Islands – Quite Unimportant 6.7% from North Stradbroke Island – Don’t Know 2% from Southern Moreton Bay Islands – Not applicable
Crucial 30%
Important 54%
Nice to have 10%
Not very Import. 2%
Quite Unimportant
1%
Don't Know1%
Not Applicable2%
Footpaths, Kerbing & Guttering
Crucial 37%
Important 53%
Nice to have 7%
Not very Import. 2%
Quite Unimportant
1% Don't Know1%
Not Applicable0%
Street Lighting

Redland City Council Customer Satisfaction Survey 2019 MARKET FACTS (QLD) PTY LTD 32
Significant variances by:
Gender none
Age 74.5% aged 35-44 years – Crucial 37.6% aged 65 years and over - Important
Location 16.7% from North Stradbroke Island – Nice to have 10% from North Stradbroke Island – Unimportant 6.7% from North Stradbroke Island – Quite Unimportant 14% from Southern Moreton Bay Islands – Nice to have 4% from Southern Moreton Bay Islands – Not Applicable
Significant variances by:
Gender none
Age 1.6% aged 55-64 – Unimportant 62.4% aged 65 years and over - Important
Location 73.3% from North Stradbroke Island – Crucial 72% from Southern Moreton Bay Islands - Crucial
Crucial 64%
Important 30%
Nice to have 4%
Not very Import. 1%
Quite Unimportant
1% Don't Know0%
Not Applicable
1%
Traffic Management
Crucial 44%Important
50%
Nice to have 5%
Not very Import. 0%
Quite Unimportant
0%
Don't Know0%
Not Applicable
1%
Parking Facilities

Redland City Council Customer Satisfaction Survey 2019 MARKET FACTS (QLD) PTY LTD 33
Significant variances by:
Gender none
Age none
Location 48.5% from Inland Region – Important 66.7% from North Stradbroke Island – Crucial 74% from Southern Moreton Bay Islands - Crucial
No significant variances.
Crucial 44%
Important 50%
Nice to have 5%
Not very Import.
0%
Quite Unimportant
0%
Don't Know
0%Not Applicable
1%
Public Transport
Crucial 79%
Important20%
Nice to have 1%
Not very Import.
0%
Quite Unimp-ortant
0% Don't Know0%Not Applicable
0%
Water Supply

Redland City Council Customer Satisfaction Survey 2019 MARKET FACTS (QLD) PTY LTD 34
Significant variances by:
Gender 4% of Females – Nice to have
Age none
Location 79.7% from Coastal Region – Crucial 3.3% from North Stradbroke Island – Unimportant 10% from North Stradbroke Island – Don’t Know 16% from Southern Moreton Bay Islands – Nice to have 8% from Southern Moreton Bay Islands – Don’t Know 36% from Southern Moreton Bay Islands – Not Applicable
Significant variances by:
Gender none
Age 6.2% aged 55-64 years – Nice to have
Location 16.7% from North Stradbroke Island – Not Applicable 16% from Southern Moreton Bay Islands – Nice to have
Crucial 71%
Important 20%
Nice to have 2%
Not very Import.
0% Quite Unimportant
0%
Don't Know3% Not Applicable
4%
Sewerage
Crucial 58%
Important 37%
Nice to have 3%
Not very Import. 1%
Quite Unimportant
0% Don't Know0%
Not Applicable1%
Drainage & Flood Mitigation

Redland City Council Customer Satisfaction Survey 2019 MARKET FACTS (QLD) PTY LTD 35
Significant variances by:
Gender none
Age none
Location 10% from North Stradbroke Island – Nice to have 3.3% from North Stradbroke Island – Not Applicable 2.0% from Southern Moreton Bay Islands - Unimportant
Significant variances by:
Gender none
Age 58.8% aged 65 years and over - Important
Location 66.7% from North Stradbroke Island - Crucial 3.3% from North Stradbroke Island – Unimportant 70% from Southern Moreton Bay Islands - Crucial
Crucial 67%
Important 31%
Nice to have 2%
Not very Import. 0%
Quite Unimportant
0%
Don't Know0%
Not Applicable0%
Waste Management
Crucial 44%
Important 50%
Nice to have 5%
Not very Import. 0%
Quite Unimportant
0%
Don't Know
1% Not Applicable0%
Community Health

Redland City Council Customer Satisfaction Survey 2019 MARKET FACTS (QLD) PTY LTD 36
Theme 2: Community Lifestyle Services IMPORTANCE
TOTAL RANK Crucial Import -ant
Nice to
have
Not very
Import.
Quite Unimp-ortant
Don't Know
Not Applic -able
RCC Mean 2019
LGAQ Mean 2017
Parks, Playgrounds & Public Amenities
600 10 26.8% 48.7% 22.3% 1.7% 0.0% 0.3% 0.2% 4.01 3.91
Environmental Controls
600 6 36.2% 48.8% 13.0% 1.3% 0.0% 0.5% 0.2% 4.21 3.87
Environmental Protection & Conservation
600 2 46.3% 41.2% 10.0% 1.7% 0.3% 0.3% 0.2% 4.32 3.99
Heritage Protection 600 9 30.8% 43.3% 21.2% 2.7% 0.7% 1.0% 0.3% 4.02 3.87
Sporting & Recreational Facilities
600 11 22.7% 48.7% 23.2% 3.8% 0.8% 0.7% 0.2% 3.89 3.79
Cultural & Entertainment Facilities
600 12 21.0% 48.3% 26.0% 2.7% 1.3% 0.5% 0.2% 3.86 3.64
Libraries & other Information Access
600 3 41.5% 44.0% 12.8% 0.7% 0.3% 0.5% 0.2% 4.27 4.05
Community Safety 600 1 53.5% 37.2% 8.0% 0.5% 0.0% 0.7% 0.2% 4.45 4.28
Community Service 600 5 39.0% 41.8% 16.7% 0.3% 0.0% 1.8% 0.3% 4.22 4.10
Pet/Animal Control 600 8 32.2% 49.0% 15.0% 2.3% 0.5% 0.8% 0.2% 4.11 3.79
Shopping Facilities 600 4 39.7% 46.7% 12.2% 1.2% 0.0% 0.3% 0.0% 4.25 3.89
Community Development
600 7 27.5% 53.8% 12.3% 1.0% 0.3% 5.0% 0.0% 4.13 3.84
Cycleways 600 13 23.7% 35.5% 25.3% 11.3% 2.3% 1.0% 0.8% 3.68 na
AVERAGE FOR THEME AS A WHOLE 4.11 3.92
The average level of Importance for the responsibilities in this Theme is 4.11.
The following three responsibility areas were rated most important:
Community Safety (4.45) Environmental Protection & Conservation (4.32) Libraries & other Information Access (4.27)
Cycleways (3.68) was awarded the lowest priority.
Significant variances (by age, gender and location) from the sample averages are also shown, below each graph, for each responsibility area.

Redland City Council Customer Satisfaction Survey 2019 MARKET FACTS (QLD) PTY LTD 37
Significant variances by:
Gender none
Age 4.1% aged 65 years and over - Unimportant
Location 28.8% from Coastal Region – Nice to have 73.3% from North Stradbroke Island – Crucial 3.3% from North Stradbroke Island – Don’t know 44% from Southern Moreton Bay Islands - Crucial
Significant variances by:
Gender none
Age none
Location 3.5% from Inland Region – Unimportant 76.7% from North Stradbroke Island – Crucial
Crucial 27%
Important 49%
Nice to have 22%
Not very Import. 2%
Quite Unimportant
0%Don't Know0%
Not Applicable0%
Parks, Playgrounds & Public Amenities
Crucial 36%
Important 49%
Nice to have 13%
Not very Import. 1%
Quite Unimportant
0% Don't Know1%
Not Applicable0%
Environmental Controls

Redland City Council Customer Satisfaction Survey 2019 MARKET FACTS (QLD) PTY LTD 38
Significant variances by:
Gender none
Age none
Location 4.5% from Inland Region – Unimportant 80% from North Stradbroke Island – Crucial 3.3% from North Stradbroke Island – Quite Unimportant
Significant variances by:
Gender none
Age 40.3% aged 55-64 years - Crucial
Location 56.0% from Southern Moreton Bay Islands - Crucial
Crucial 46%
Important 41%
Nice to have 10%
Not very Import. 2%
Quite Unimportant
1%
Don't Know0%
Not Applicable0%
Environmental Protection & Conservation
Crucial 31%
Important 43%
Nice to have 21%
Not very Import.
3%
Quite Unimportant
1%
Don't Know1%
Not Applicable0%
Heritage Protection

Redland City Council Customer Satisfaction Survey 2019 MARKET FACTS (QLD) PTY LTD 39
Significant variances by:
Gender none
Age none
Location 28.1% from Coastal Region – Nice to have 53.3% from North Stradbroke – Crucial
Significant variances by:
Gender none
Age none
Location 6.7% from North Stradbroke Island – Quite Unimportant 42% from Southern Moreton Bay Islands – Crucial 2.0% from Southern Moreton Bay Islands – Not Applicable
Crucial 22%
Important 49%
Nice to have 23%
Not very Import. 4%
Quite Unimportant
1%
Don't Know1%
Not Applicable0%
Sporting & Recreational Facilities
Crucial 21%
Important 48%
Nice to have 26%
Not very Import. 3%
Quite Unimportant
1%Don't Know1% Not Applicable
0%
Cultural & Entertainment Facilities

Redland City Council Customer Satisfaction Survey 2019 MARKET FACTS (QLD) PTY LTD 40
Significant variances by:
Gender none
Age none
Location 73.3% from North Stradbroke Island – Crucial 2.0% from Southern Moreton Bay Islands – Not Applicable
Significant variances by:
Gender none
Age none
Location 86.7% from North Stradbroke Island – Crucial 2.0% from Southern Moreton Bay Islands – Not Applicable
Crucial 41%
Important 44%
Nice to have 13%
Not very Import. 1%
Quite Unimportant
0%
Don't Know1%
Not Applicable0%
Libraries & other Information Access
Crucial 53%
Important 37%
Nice to have 8%
Not very Import. 1%
Quite Unimportant
0%
Don't Know1%
Not Applicable0%
Community Health & Safety

Redland City Council Customer Satisfaction Survey 2019 MARKET FACTS (QLD) PTY LTD 41
Significant variances by:
Gender none
Age none
Location 76.7% from North Stradbroke Island – Crucial 62% from Southern Moreton Bay Islands - Crucial
Significant variances by:
Gender none
Age none
Location 63.3% from North Stradbroke Island – Crucial 2.0% from Southern Moreton Bay Islands – Not Applicable
Crucial 39%
Important 42%
Nice to have 17%
Not very Import. 0%
Quite Unimportant
0%Don't Know
2%
Not Applicable0%
Community Service
Crucial 32%
Important 49%
Nice to have 15%
Not very Import. 2%
Quite Unimportant
1%
Don't Know1% Not Applicable
0%
Pet/Animal Control

Redland City Council Customer Satisfaction Survey 2019 MARKET FACTS (QLD) PTY LTD 42
Significant variances by:
Gender 45.8% of Females – Crucial
Age 20% aged 35-44 years – Nice to have 1.8% aged 35-44 years – Don’t know
Location 61% from Inland Region - Important
Significant variances by:
Gender none
Age 62.4% aged 65 years and over – Important
Location 56.7% from North Stradbroke Island – Crucial 44% from Southern Moreton Bay Islands – Crucial
Crucial 40%
Important 47%
Nice to have 12%
Not very Import. 1%
Quite Unimportant
0%
Don't Know0%
Not Applicable0%
Shopping Facilities
Crucial 28%
Important 54%
Nice to have 12%
Not very Import. 1%
Quite Unimportant
0%
Don't Know5%
Community Development

Redland City Council Customer Satisfaction Survey 2019 MARKET FACTS (QLD) PTY LTD 43
Significant variances by:
Gender none
Age 32.6% aged 55-64 years - Crucial
Location 63.3% from North Stradbroke Island – Crucial 6.7% from North Stradbroke Island – Not Applicable
Crucial 24%
Important 36%
Nice to have 25%
Not very Import. 11%
Quite Unimportant
2% Don't Know1%
Not Applicable
1%
Cycleways

Redland City Council Customer Satisfaction Survey 2019 MARKET FACTS (QLD) PTY LTD 44
Theme 3: Managing the City IMPORTANCE TOTAL RANK Crucial Import
-ant Nice
to have
Not very
Import.
Quite Unimp-ortant
Don't Know
Not Applic -able
RCC Mean 2019
LGAQ Mean 2017
Town Planning 600 2 68.8% 28.2% 2.3% 0.0% 0.2% 0.2% 0.3% 4.66 4.31
Economic Development & Local Employment
600
4
48.0% 41.2% 6.2% 1.7% 0.0% 2.7% 0.3% 4.40 4.24
Development of Tourism
600 5
29.2% 48.8% 16.0% 3.7% 1.2% 0.8% 0.3% 4.02 3.80
Financial Management 600 1 71.8% 22.2% 2.7% 0.0% 0.2% 2.8% 0.3% 4.71 4.50
Revenue-raising 600 3 47.7% 40.0% 5.2% 0.7% 0.3% 5.7% 0.5% 4.43 4.12
AVERAGE FOR THEME AS A WHOLE 4.44 4.18
The average level of Importance for the responsibilities in this Theme is 4.44.
Financial Management (4.71) was accorded the highest priority and Town Planning the second highest (4.66).
Development of Tourism was the lowest priority (4.02).
Significant variances (by age, gender and location) from the sample averages are also shown, below each graph, for each responsibility area.

Redland City Council Customer Satisfaction Survey 2019 MARKET FACTS (QLD) PTY LTD 45
Significant variances by:
Gender 74.2% of Males – Crucial 33.2% of Females - Important
Age none
Location none
Significant variances by:
Gender none
Age 4.1% aged 65 years and over - Unimportant
Location 49.5% from Inland Region – Important 80% from North Stradbroke Island - Crucial
Crucial 69%
Important 28%
Nice to have 3%
Not very Import.
0%
Quite Unimportant
0%
Don't Know
0%
Not Applicable0%
Town Planning
Crucial 48%
Important 41%
Nice to have 6%
Not very Import. 2%
Quite Unimportant
0%
Don't Know3%
Not Applic -able0%
Economic Development & Local Employment

Redland City Council Customer Satisfaction Survey 2019 MARKET FACTS (QLD) PTY LTD 46
Significant variances by:
Gender 20.1% of Males – Nice to have
Age none
Location 56.7% from North Stradbroke Island – Crucial 6.7% from North Stradbroke Island – Quite Unimportant 6.7% from North Stradbroke Island – Don’t Know
Significant variances by:
Gender none
Age 33.5% aged 65 years and over - Important
Location 31.5% from Inland Region – Important 88% from Southern Moreton Bay Islands - Crucial
Crucial 29%
Important 49%
Nice to have 16%
Not very Import. 4%
Quite Unimportant
1% Don't Know1%
Not Applicable0%
Development of Tourism
Crucial 72%
Important 22%
Nice to have 3%
Not very Import. 0%
Quite Unimportant
0%
Don't Know3%
Not Applicable0%
Financial Management

Redland City Council Customer Satisfaction Survey 2019 MARKET FACTS (QLD) PTY LTD 47
Significant variances by:
Gender none
Age 10.1% aged 45-54 years – Don’t know
Location 48% from Inland Region – Important 78% from Southern Moreton Bay Islands - Crucial
Crucial 48%
Important 40%
Nice to have 5%
Not very Import. 1%
Quite Unimportant
0%
Don't Know6%
Not Applicable1%
Revenue-raising

Redland City Council Customer Satisfaction Survey 2019 MARKET FACTS (QLD) PTY LTD 48
Theme 4: Customer Service and Communication IMPORTANCE
TOTAL RANK Crucial Import -ant
Nice to
have
Not very
Import.
Quite Unimp-ortant
Don't Know
Not Applic -able
RCC Mean 2019
LGAQ Mean 2017
Customer Service 600 5 50.8% 44.5% 2.7% 0.3% 0.0% 1.2% 0.5% 4.48 4.22
Information Services 600 6 50.0% 44.8% 4.5% 0.0% 0.2% 0.2% 0.3% 4.45 4.04
Informing the Community 600 3 66.8% 30.5% 1.7% 0.3% 0.2% 0.3% 0.2% 4.64 4.28
Consulting the Community
600
2
67.8% 28.3% 3.0% 0.0% 0.0% 0.7% 0.2% 4.65 4.34
Responding to the Community
600
1
68.3% 28.0% 2.3% 0.0% 0.0% 1.0% 0.3% 4.67 4.41
Providing Leadership & Advocacy
600
4
57.3% 34.0% 5.5% 0.3% 0.0% 2.7% 0.2% 4.53 4.25
AVERAGE FOR THEME AS A WHOLE 4.57 4.26
The average level of Importance for the responsibilities in this Theme is 4.57.
The equal top scores were: Responding to the Community (4.67)
Consulting the Community (4.65)
Information Services (4.45) was given lowest priority. However, all responsibility areas were judged as high, with a mean of 4 or more.
Significant variances (by age, gender and location) from the sample averages are also shown, below each graph, for each responsibility area.

Redland City Council Customer Satisfaction Survey 2019 MARKET FACTS (QLD) PTY LTD 49
Significant variances by:
Gender none
Age none
Location 55% from Inland Region – Important 3.3% from North Stradbroke Island – Unimportant 80% from Southern Moreton Bay Islands - Crucial
Significant variances by:
Gender none
Age none
Location 53.5% from Inland Region – Important 73.3% From North Stradbroke Island – Crucial 3.3% from North Stradbroke Island – Not Applicable 78% from Southern Moreton Bay Islands – Crucial
Crucial 51%
Import-ant 44%
Nice to have 3%
Not very Import. 0%
Quite Unimportant
0%
Don't Know1%
Not Applicable1%
Customer Service
Crucial 50%
Important 45%
Nice to have 5%
Not very Import. 0%
Quite Unimportant
0%
Don't Know
0%
Not Applicable0%
Information Services

Redland City Council Customer Satisfaction Survey 2019 MARKET FACTS (QLD) PTY LTD 50
Significant variances by:
Gender none
Age 1.8% aged 35-44 years – Don’t know 39.4% aged 65 years and over - Important
Location none
Significant variances by:
Gender none
Age 2.7% aged 35-44 years – Don’t know 37.6% aged 65 years and over - Important
Location 93.3% from North Stradbroke Island - Crucial
Crucial 67%
Important 31%
Nice to have 2%
Not very Import. 0%
Quite Unimportant
0%
Don't Know0%
Not Applicable0%
Informing the Community
Crucial 68%
Important 28%
Nice to have 3%
Not very Import. 0%
Quite Unimportant
0%
Don't Know1%
Not Applicable0%
Consulting the Community

Redland City Council Customer Satisfaction Survey 2019 MARKET FACTS (QLD) PTY LTD 51
Significant variances by:
Gender none
Age 38.2% aged 65 years and over - Important
Location 3.3% from North Stradbroke Island – Not Applicable
Significant variances by:
Gender none
Age 10.9% aged 35-44 years – Nice to have
Location 8.4% from Coastal Region – Nice to have 6.7% from North Stradbroke Island – Unimportant 90% from Southern Moreton Bay Islands – Crucial
Crucial 68%
Important 28%
Nice to have 3%
Not very Import.
0%Quite
Unimportant 0%
Don't Know1%
Not Applicable0%
Responding to the Community
Crucial 57%
Important 34%
Nice to have 6%
Not very Import. 0%
Quite Unimportant
0%
Don't Know3%
Not Applicable0%
Providing Leadership & Advocacy

Redland City Council Customer Satisfaction Survey 2019 MARKET FACTS (QLD) PTY LTD 52
Theme 5: Quality of Council IMPORTANCE
TOTAL Crucial Import -ant
Nice to
have
Not very
Import.
Quite Unimp-ortant
Don't Know
Not Applic -able
RCC Mean 2019
LGAQ Mean 2017
Quality and Performance of Council Staff
600 59.7% 36.8% 2.2% 0.7% 0.0% 0.5% 0.2% 4.57 na
The Quality and Performance of Council Staff rated 4.57, between important and crucial.
The LGAQ Mean is not shown as for this survey, five responsibility areas comprise this theme, so for Redlands survey there can be no direct comparison of importance.
Significant variances by:
Gender none
Age 46.5% aged 65 years and over - Important
Location 86% from Southern Moreton Bay Islands - Crucial
Crucial 60%
Important 37%
Nice to have 2%
Not very Import.
1%
Quite Unimportant
0%
Don't Know1%
Not Applicable0%
Quality and Performance of Staff

Redland City Council Customer Satisfaction Survey 2019 MARKET FACTS (QLD) PTY LTD 53
PERFORMANCE
In terms of performance mean scores as compared with results for the LGAQ 2017 survey for both Queensland State-wide and Metro Fringe Councils, these results are summarised below. Redland City Council respondents are tracking on par in three out of five themes, namely Basic Services/Infrastructure, Community Lifestyle Services and Customer Services and Communication, just ahead in performance for Quality of Council and well below in Managing the Shire.
The following section sets out in details ratings for each responsibility area within the theme and includes some analysis of significant variances from samples averages for these ratings. This will help Council to build a picture of where different sub-samples have viewed their performance differently.
3.52
3.60
3.28
3.32
3.47
3.45
3.60
3.30
3.35
3.51
3.43
3.54
2.92
3.31
3.60
0.00 0.50 1.00 1.50 2.00 2.50 3.00 3.50 4.00
Basic Services /Infrastructure
Community Lifestyle Services
Managing the Shire/City
Customer Service & Communication
Quality of Council
Performance Mean Comparison - LGAQ versus Redland City Council
RCC LGAQ Metro Fringe LGAQ QLD

Redland City Council Customer Satisfaction Survey 2019 MARKET FACTS (QLD) PTY LTD 54
Theme 1: Basic Services & Infrastructure PERFORMANCE
Sample Size
RANK Very Good
Good Fair Only
Poor Very Poor
Don't Know
Not Applic -able
RCC Mean 2019
LGAQ Mean 2017
Road Construction 600 7 7.0% 33.3% 34.3% 14.8% 8.7% 1.7% 0.2% 3.15 3.38
Road Maintenance 600 6= 6.7% 34.7% 36.8% 14.5% 6.5% 0.5% 0.3% 3.21 3.29
Footpaths, Kerbing & Guttering
599 6=
5.8% 37.0% 32.2% 12.2% 8.2% 1.7% 2.8% 3.21 3.28
Street Lighting 600 5= 10.8% 48.5% 28.3% 5.7% 4.5% 1.2% 1.0% 3.57 3.56
Traffic Management 600 9 4.7% 25.3% 30.2% 23.7% 13.8% 1.3% 1.0% 2.83 3.33
Parking Facilities 600 10 4.8% 20.8% 27.7% 26.3% 16.7% 1.7% 2.0% 2.70 3.11
Public Transport 599 8 8.0% 23.7% 20.0% 22.2% 9.3% 13.3% 3.3% 2.99 3.08
Water Supply 600 3 26.5% 57.0% 9.3% 2.7% 3.3% 0.3% 0.8% 4.02 3.72
Sewerage 600 2 23.3% 56.2% 7.3% 1.3% 3.0% 2.0% 6.8% 4.05 3.86
Drainage & Flood Mitigation
600 4
15.7% 52.3% 19.2% 5.0% 2.8% 2.2% 2.8% 3.77 3.36
Waste Management 600 1 25.0% 63.2% 6.8% 2.2% 1.2% 1.0% 0.7% 4.11 3.93
Community Health 600 5= 8.7% 47.2% 23.3% 4.7% 4.8% 11.2% 0.2% 3.57 3.54
AVERAGE FOR THEME AS A WHOLE
3.43 3.45
The average performance rating for this Theme is 3.43.
The top performers were:
Sewerage (4.05)
Waste Management (4.11)
The poorest performing area was Parking Facilities (2.70).
Significant variances (by age, gender and location) from the sample averages are also shown, below each graph, for each responsibility area.

Redland City Council Customer Satisfaction Survey 2019 MARKET FACTS (QLD) PTY LTD 55
Significant variances by:
Gender none
Age none
Location 16% from Southern Moreton Bay Islands – Very good
Significant variances by:
Gender none
Age 21.7% aged 55-64 years - Poor
Location 6.7% from North Stradbroke Island – Not Applicable 18% from Southern Moreton Bay Islands – Very Poor
Very Good 7%
Good 33%
Fair Only 34%
Poor 15%
Very Poor 9%
Don't Know2%
Not Applicable0%
Road Construction
Very Good 7%
Good 35%
Fair Only 37%
Poor 15%
Very Poor 6%
Don't Know1%
Not Applicable0%
Road Maintenance

Redland City Council Customer Satisfaction Survey 2019 MARKET FACTS (QLD) PTY LTD 56
Significant variances by:
Gender none
Age 7% aged 55-64 years – Not Applicable 4.1% aged 65 years and over – Don’t know
Location 42.5% from Coastal Region – Good 30% from Southern Moreton Bay Islands – Poor 24% from Southern Moreton Bay Islands – Very Poor 10% from Southern Moreton Bay Islands – Not Applicable
Significant variances by:
Gender 2.3% of Females – Don’t know
Age 17.6% aged 45-54 years – Very good
Location 16% from Southern Moreton Bay Islands – Poor 22% from Southern Moreton Bay Islands – Very Poor
Very Good
6%
Good 37%
Fair Only 32%
Poor 12%
Very Poor 8%
Don't Know2%
Not Applicable3%
Footpaths, Kerbing & Guttering
Very Good 11%
Good 48%
Fair Only 28%
Poor 6%
Very Poor 5%
Don't Know1%
Not Applicable1%
Street Lighting

Redland City Council Customer Satisfaction Survey 2019 MARKET FACTS (QLD) PTY LTD 57
Significant variances by:
Gender none
Age 4.7% aged 55-64 years – Not applicable
Location none
Significant variances by:
Gender none
Age none
Location 43.3% from North Stradbroke Island – Very Poor 50% from Southern Moreton Bay Islands – Very Poor
Very Good 5%
Good 25%
Fair Only 30%
Poor 24%
Very Poor 14%
Don't Know1%
Not Applicable1% Traffic Management
Very Good
5%
Good 21%
Fair Only 28%
Poor 26%
Very Poor 16%
Don't Know2%
Not Applicable2%
Parking Facilities

Redland City Council Customer Satisfaction Survey 2019 MARKET FACTS (QLD) PTY LTD 58
Significant variances by:
Gender 5.6% of Females – Not applicable
Age none
Location 18% from Southern Moreton Bay Islands – Very Good 44% from Southern Moreton Bay Islands - Good
Significant variances by:
Gender none
Age none
Location 10% from North Stradbroke Islands – Not Applicable
Very Good 8%
Good 24%
Fair Only 20%
Poor 22%
Very Poor 9%
Don't Know14%
Not Applicable3%
Public Transport
Very Good 27%
Good 57%
Fair Only 9%
Poor 3%
Very Poor 3%
Don't Know
0% Not Applicable1%
Water Supply

Redland City Council Customer Satisfaction Survey 2019 MARKET FACTS (QLD) PTY LTD 59
Significant variances by:
Gender none
Age 67.3% aged 35-44 years - Good
Location 65.6% from Coastal Region – Good 13.3% from North Stradbroke Island – Very Poor 16% from Southern Moreton Bay Islands – Very Poor 42% from Southern Moreton Bay Islands – Not Applicable
Significant variances by:
Gender none
Age none
Location 58.1% from Coastal Region – Good 13.3% from North Stradbroke Island – Very Poor 13.3% from North Stradbroke Island – Not Applicable 14% from Southern Moreton Bay Islands – Very Poor
Very Good 23%
Good 56%
Fair Only 7%
Poor 2%
Very Poor 3%
Don't Know2%
Not Applicable7%
Sewerage
Very Good 16%
Good 52%
Fair Only 19%
Poor 5%
Very Poor 3%
Don't Know2% Not Applicable
3%
Drainage & Flood Mitigation

Redland City Council Customer Satisfaction Survey 2019 MARKET FACTS (QLD) PTY LTD 60
Significant variances by:
Gender none
Age 78.2% aged 35-44 years - Good
Location 26.7% from North Stradbroke Island – Fair Only 16.7% from North Stradbroke Island – Poor 8% from Southern Moreton Bay Islands - Poor
Significant variances by:
Gender none
Age 8.8% aged 45-54 years – Very poor
Location 30% from Southern Moreton Bay Islands – Very Poor
Very Good 25%
Good 63%
Fair Only 7%
Poor 2%
Very Poor 1%
Don't Know
1%
Not Applicable1%
Waste Management
Very Good 9%
Good 47%
Fair Only 23%
Poor 5%
Very Poor 5%
Don't Know11%
Not Applicable0%
Community Health

Redland City Council Customer Satisfaction Survey 2019 MARKET FACTS (QLD) PTY LTD 61
Theme 2: Community Lifestyle Services PERFORMANCE
TOTAL RANK Very Good
Good Fair Only
Poor Very Poor
Don't Know
Not Applic -able
RCC Mean 2019
LGAQ Mean 2017
Parks, Playgrounds & Public Amenities
600 3 15.2% 56.7% 16.3% 3.5% 3.3% 4.8% 0.2% 3.81 3.80
Environmental Controls 600 11 5.7% 34.5% 34.3% 11.7% 7.7% 5.8% 0.3% 3.20 3.37
Environmental Protection & Conservation
600 12 4.8% 25.2% 40.2% 12.3% 12.8% 4.5% 0.2% 2.97 3.31
Heritage Protection 600 9 5.2% 32.2% 34.0% 7.3% 5.7% 14.8% 0.8% 3.28 3.44
Sporting & Recreational Facilities
599 2= 15.5% 55.0% 17.2% 2.5% 2.5% 7.0% 0.2% 3.85 3.77
Cultural & Entertainment Facilities
599 2= 18.8% 51.2% 17.7% 4.2% 2.2% 5.5% 0.3% 3.85 3.63
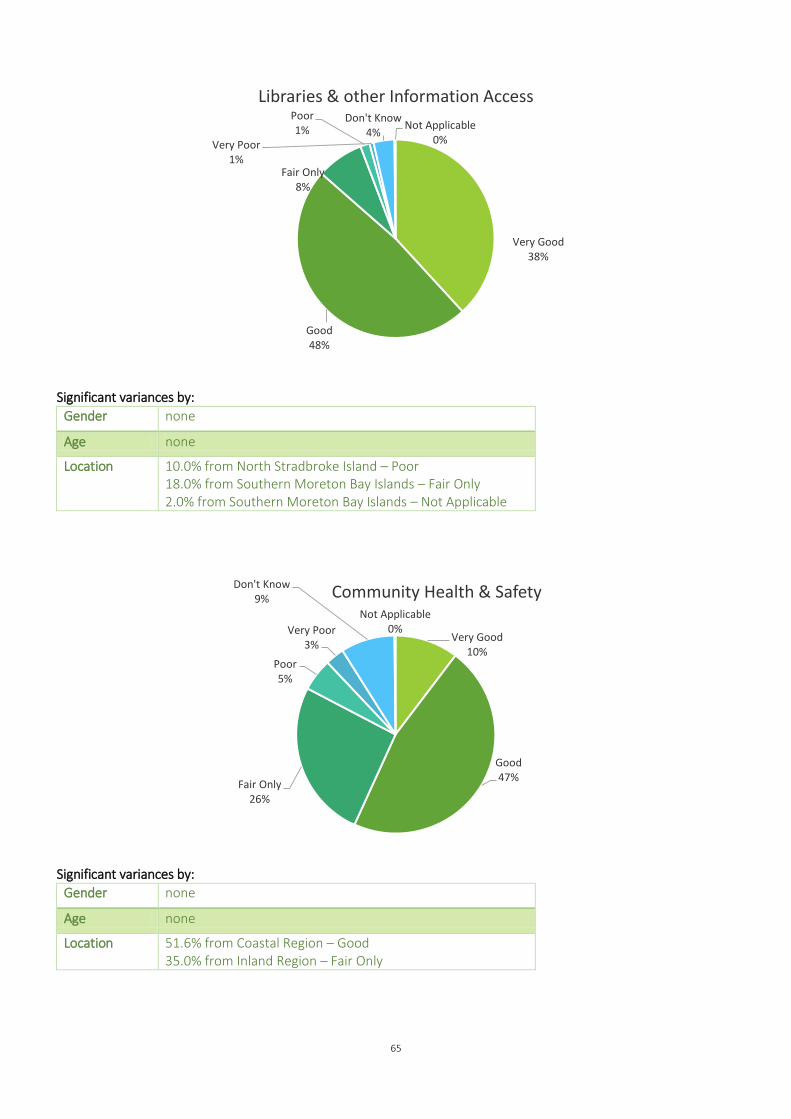
Libraries & other Information Access
600 1 38.2% 48.3% 7.7% 1.5% 0.7% 3.5% 0.2% 4.26 4.04
Community Safety 600 5 10.3% 46.5% 25.8% 5.3% 3.0% 8.8% 0.2% 3.61 3.59
Community Service 600 6 5.0% 43.3% 27.3% 4.5% 3.0% 16.2% 0.7% 3.52 3.51
Pet/Animal Control 600 7 9.3% 43.2% 27.8% 7.7% 4.3% 7.2% 0.5% 3.49 3.41
Shopping Facilities 600 4 18.7% 45.5% 17.7% 11.7% 5.0% 1.3% 0.2% 3.62 3.79
Community Development
600 10 3.7% 31.0% 32.2% 10.2% 3.8% 18.2% 1.0% 3.25 3.51
Cycleways 600 8 4.8% 39.7% 23.5% 9.3% 7.5% 14.3% 0.8% 3.29 na
AVERAGE FOR THEME AS A WHOLE
3.54 3.60
The average performance rating for this Theme is 3.54.
The top performer was Libraries & Other Information Access (4.26)
Equal second (3.85) highest performing areas were:
Sporting & Recreational Facilities
Cultural & Entertainment Facilities
The poorest performing area was Environment Protection & Conservation (2.97).
Significant variances (by age, gender and location) from the sample averages are also shown, below each graph, for each responsibility area.

62
Significant variances by:
Gender none
Age none
Location 19.4% from Coastal Region – Very Good 13.3% from North Stradbroke Island – Poor 23.3% from North Stradbroke Island – Very Poor
Significant variances by:
Gender none
Age none
Location 20% from North Stradbroke Island – Very Good 23.3% from North Stradbroke Island – Very Poor 4.0% from Southern Moreton Bay Islands – Not Applicable
Very Good 15%
Good 57%
Fair Only 16%
Poor 4%
Very Poor 3%
Don't Know5%
Not Applicable0%
Parks, Playgrounds & Public Amenities
Very Good
6%
Good 34%
Fair Only 34%
Poor 12%
Very Poor 8%
Don't Know6%
Not Applicable0%
Environmental Controls

63
Significant variances by:
Gender none
Age none
Location 16.7% from North Stradbroke Island – Very Good 3.3% from North Stradbroke Island – Not Applicable
Significant variances by:
Gender none
Age none
Location 23.5% from Inland Region – Don’t Know
Very Good 5%
Good 25%
Fair Only 40%
Poor 12%
Very Poor 13%
Don't Know5%
Not Applicable0%
Environmental Protection & Conservation
Very Good 5%
Good 32%
Fair Only 34%
Poor 7%
Very Poor 6%
Don't Know15%
Not Applicable1% Heritage Protection

64
Significant variances by:
Gender none
Age 12.9% aged 65 years and over – Don’t know
Location 11.0% from Inland Region – Don’t Know 23.3% from North Stradbroke Island – Very Poor 32.0% from Southern Moreton Bay Islands – Fair Only 8.0% from Southern Moreton Bay Islands – Poor 10% from Southern Moreton Bay Islands – Very Poor 2.0% from Southern Moreton Bay Islands – Not Applicable
Significant variances by:
Gender none
Age none
Location 24.7% from Coastal Region – Very Good 23.3% from North Stradbroke Island – Very Poor 3.3% from North Stradbroke Island – Not Applicable 14.0% from Southern Moreton Bay Islands - Poor
Very Good 16%
Good 55%
Fair Only 17%
Poor 2%
Very Poor 3%
Don't Know
7% Not Applicable0%
Sporting & Recreational Facilities
Very Good 19%
Good 51%
Fair Only 18%
Poor 4%
Very Poor 2%
Don't Know6%
Not Applicable0%
Cultural & Entertainment Facilities
65
Significant variances by:
Gender none
Age none
Location 10.0% from North Stradbroke Island – Poor 18.0% from Southern Moreton Bay Islands – Fair Only 2.0% from Southern Moreton Bay Islands – Not Applicable
Significant variances by:
Gender none
Age none
Location 51.6% from Coastal Region – Good 35.0% from Inland Region – Fair Only
Very Good 38%
Good 48%
Fair Only 8%
Poor 1%
Very Poor 1%
Don't Know4%
Not Applicable0%
Libraries & other Information Access
Very Good 10%
Good 47%
Fair Only 26%
Poor 5%
Very Poor 3%
Don't Know9%
Not Applicable0%
Community Health & Safety

66
Significant variances by:
Gender none
Age none
Location 13.3% from North Stradbroke Island – Very Poor 10.0% from Southern Moreton Bay Islands – Very Poor
Significant variances by:
Gender none
Age 40% aged 35-44 years – Fair only 11.8% aged 65+ - Don’t Know
Location 12.5% from Inland Region – Don’t Know 16.7% from North Stradbroke Island – Very Poor 4.0% from Southern Moreton Bay Islands – Not Applicable
Very Good 5%
Good 43%
Fair Only 27%
Poor 5%
Very Poor 3%
Don't Know16%
Not Applicable1%
Community Service
Very Good 9%
Good 43%Fair Only
28%
Poor 8%
Very Poor 4%
Don't Know7%
Not Applicable1%
Pet/Animal Control

67
Gender none
Age none
Location 55% from Inland Region – Good 16.7% from North Stradbroke Island- Very Poor 3.3% from North Stradbroke Island – Not applicable 14% from Southern Moreton Bay Islands – Very Poor
Significant variances by:
Gender none
Age none
Location 16.7% from North Stradbroke Island – Very Poor 6.7% from North Stradbroke Island – Not Applicable 12.0% from Southern Moreton Bay Islands – Very Poor
Very Good 19%
Good 45%
Fair Only 18%
Poor 12%
Very Poor 5%
Don't Know1%
Not Applicable0%
Shopping Facilities
Very Good 4%
Good 31%
Fair Only 32%
Poor 10%
Very Poor 4%
Don't Know18%
Not Applicable1%
Community Development

68
Gender none
Age 20.6% aged 65 years and over – Don’t Know
Location 45.6% from Coastal Region – Good 17.8% from Coastal Region – Don’t Know 40% from North Stradbroke Island- Very Poor 6.7% from North Stradbroke Island – Not Applicable 24% from Southern Moreton Bay Islands – Very Poor
Very Good 5%
Good 40%
Fair Only 24%
Poor 9%
Very Poor 7%
Don't Know14%
Not Applicable1%
Cycleways

69
Theme 3: Managing the Shire PERFORMANCE
TOTAL RANK Very Good
Good Fair Only
Poor Very Poor
Don't Know
Not Applic -able
RCC Mean 2019
LGAQ Mean 2017
Town Planning 600 5 1.3% 17.3% 39.3% 23.5% 13.5% 4.5% 0.5% 2.68 3.38
Economic Development & Local Employment
600 4
1.5% 19.2% 32.8% 19.2% 8.3% 17.5% 1.5% 2.83 3.18
Development of Tourism 600 2 3.3% 26.0% 37.0% 13.8% 6.8% 12.7% 0.3% 3.06 3.29
Financial Management 600 3 2.3% 20.7% 31.7% 15.2% 8.2% 19.8% 2.2% 2.92 3.23
Revenue-raising 600 1 3.8% 27.3% 28.0% 10.3% 8.0% 20.7% 1.8% 3.11 3.20
AVERAGE FOR THEME AS A WHOLE
2.92 3.30
The average performance mean rating for this Theme is 2.92.
The top performer was Revenue Raising (3.11) and the poorest performing area was Town Planning (2.68).
Significant variances (by age, gender and location) from the sample averages are also shown, below each graph, for each responsibility area.

70
No significant variances.
Significant variances by:
Gender none
Age 24.1% aged 65 years and over – Don’t know
Location 38.1% from Coastal Region – Fair Only 23.5% from Inland Region – Don’t Know 32.0% from Southern Moreton Bay Islands – Very Poor
Very Good 1%
Good 17%
Fair Only 39%
Poor 23%
Very Poor 14%
Don't Know5%
Not Applicable1%
Town Planning
Very Good 1%
Good 19%
Fair Only 33%Poor
19%
Very Poor 8%
Don't Know18%
Not Applicable2%
Economic Development & Local Employment

71
Significant variances by:
Gender none
Age none
Location 42.8% from Coastal Region – Fair Only 18.0% from Inland Region – Don’t Know 33.3% from North Stradbroke Island – Very Poor 28.0% from Southern Moreton Bay Islands – Poor 22.0% from Southern Moreton Bay Islands – Very Poor
Significant variances by:
Gender none
Age none
Location 20.0% from Southern Moreton Bay Islands – Not Applicable
Very Good 3%
Good 26%
Fair Only 37%
Poor 14%
Very Poor 7%
Don't Know13%
Not Applicable0%
Development of Tourism
Very Good
2%
Good 21%
Fair Only 32%
Poor 15%
Very Poor 8%
Don't Know20%
Not Applicable2%
Financial Management

72
Significant variances by:
Gender none
Age 28.2% aged 65 years and over – Don’t know
Location 31.5% from Inland Region – Don’t Know 13.3% from North Stradbroke Island – Very Good 14% from Southern Moreton Bay Islands – Not Applicable
Very Good 4%
Good 27%
Fair Only 28%
Poor 10%
Very Poor 8%
Don't Know21%
Not Applicable2%
Revenue-raising

73
Theme 4: Customer Service and Communication PERFORMANCE
TOTAL RANK Very Good
Good Fair Only
Poor Very Poor
Don't Know
Not Applic -able
RCC Mean 2019
LGAQ Mean 2017
Customer Service 600 1 20.5% 50.5% 17.7% 4.2% 2.2% 4.5% 0.5% 3.87 3.65
Information Services 600 2 13.0% 56.3% 19.0% 4.3% 2.0% 5.2% 0.2% 3.78 3.53
Informing the Community 600 3 7.0% 45.7% 30.7% 8.8% 5.2% 2.3% 0.3% 3.42 3.36
Consulting the Community 600 5 3.2% 26.8% 34.0% 19.5% 10.5% 5.7% 0.3% 2.92 3.22
Responding to the Community
600 6 2.7% 23.5% 31.2% 21.2% 12.7% 8.3% 0.5% 2.81 3.10
Providing Leadership & Advocacy
600 4 3.3% 27.3% 35.8% 10.5% 8.3% 13.8% 0.8% 3.08 3.22
AVERAGE FOR THEME AS A WHOLE 3.31 3.35
The average performance rating for this Theme is 3.31
The top performers were:
Customer Service (3.87)
Information Services (3.78)
The poorest performing area was Responding to the Community (2.81).
Significant variances (by age, gender and location) from the sample averages are also shown, below each graph, for each responsibility area.

74
Significant variances by:
Gender none
Age 26.4% aged 55-64 years – Fair only
Location 13.3% from North Stradbroke Island – Very Poor 6.7% from North Stradbroke Island – Not Applicable 8.0% from Southern Moreton Bay Islands – Very Poor
Significant variances by:
Gender none
Age 19.4% aged 65 years and over – Very good
Location 10.0% from North Stradbroke Island – Very Poor 3.3% from North Stradbroke Island – Not Applicable
Very Good 20%
Good 50%
Fair Only 18%
Poor 4%
Very Poor 2%
Don't Know5% Not Applicable
1%
Customer Service
Very Good 13%
Good 57%
Fair Only 19%
Poor 4%
Very Poor 2%
Don't Know5%
Not Applicable
0%
Information Services

75
Significant variances by:
Gender none
Age 1.8% aged 35-44 years – Not applicable 14.2% aged 45-54 years – Poor
Location 48.0% from Southern Moreton Bay Islands – Fair Only
Significant variances by:
Gender 8.3% of Females – Don’t know
Age 1.8% aged 35-44 years – Not applicable 10% aged 65 years and over – Don’t know
Location 26.7% from North Stradbroke Island – Very Poor 10.0% from Southern Moreton Bay Islands – Very Good
Very Good 7%
Good 46%
Fair Only 31%
Poor 9%
Very Poor 5%
Don't Know2%
Not Applicable0%
Informing the Community
Very Good 3%
Good 27%
Fair Only 34%
Poor 20%
Very Poor 10%
Don't Know6%
Not Applicable0%
Consulting the Community

76
No significant variances.
Significant variances by:
Gender none
Age none
Location 17.5% from Coastal Region – Don’t Know 10.0% from Southern Moreton Bay Islands – Very Good
Very Good 3%
Good 23%
Fair Only 31%
Poor 21%
Very Poor 13%
Don't Know8%
Not Applicable
1%
Responding to the Community
Very Good 3%
Good 27%
Fair Only 36%
Poor 11%
Very Poor 8%
Don't Know14%
Not Applicable1%
Providing Leadership & Advocacy

77
Theme 5: Quality of Council PERFORMANCE
TOTAL Very Good
Good Fair Only
Poor Very Poor
Don't Know
Not Applic -able
RCC Mean 2019
LGAQ Mean 2017
Quality and Performance of Staff
600 12.3% 43.8% 28.7% 6.0% 3.0% 6.0% 0.2% 3.60 na
The Quality and Performance of Council Staff rated 3.60, between good and fair.
The LGAQ Mean is not shown as for this survey, five responsibility areas comprise this theme, so for Redlands survey there can be no direct comparison of performance.
Significant variances by:
Gender none
Age none
Location 32.0% from Southern Moreton Bay Islands – Very Good
Very Good 12%
Good 44%
Fair Only 29%
Poor 6%
Very Poor 3%
Don't Know6%
Not Applicable0%
Quality and Performance of Staff

78
PUBLIC OPINION QUESTIONS – KEY FINDINGS This section of the report presents the key findings of the two public opinion questions. They were asked as ‘open ended questions’ in the survey. However, in order to give a snapshot summary, they are also graphically presented. In this survey, all questions were included in the briefing mail-out sent to each respondent prior to the main telephone interview. Consequently, respondents had time to think about the question, and give a ‘considered’ opinion. They were requested to do just this – even discuss the question with friends and relations – in the briefing letter. Where appropriate, comparisons with similar questions asked in Council’s 2016 survey were made in the following analysis. However, it should be noted the 2016 survey was not undertaken using the same methodology as this survey, so results are not directly comparable. Although, comparisons have been provided and they do give Council a very good indication of community sentiment on key similar topics.

79
Perceptions of various aspects of Redland City Council
1. Just thinking about various aspects of Redland City Council, and the city….. The following table summarises respondent’s feedback on key aspects of Redland City Council: The highest level (over 90%) of agreement was in relation to the following aspects:
‘Redlands is a good place to live’ (97%)
‘Would recommend Redlands Coast as a place to live’ (92.3%)
‘Feel a good sense of belonging here’ (90.3%) The highest level of disagreement was in relation to:
81.3% said, apartment, terrace houses, small lots etc did not appeal as housing choices for themselves and their family
Respondents were divided equally on their views about how effectively Council works with state and federal government to support the interest of the city, with 38.7% stating they ‘don’t know’, 32.2% ‘agreeing’ and 30.2% ‘disagreeing’.
Yes
% No %
Don't know
%
Is Redlands Coast a good place to live? 97 1.8 1.2
Are you generally happy with the direction of the current Council? 51.3 39 9.7
Would you recommend Redlands Coast as a place to visit? 92.3 6.8 0.8
Is Redlands a better place to live than 5 years ago? 34 52.5 13.5
Do you feel a good sense of belonging here? 90.3 7.3 2.3
Have you received a Councillor newsletter in the last 12 months? 85.2 8.7 6.2
Are you aware of the Redlands Community Plan? 49.5 48 2.5
Do you know what you get for your rates? 75.5 13.3 11.2
Do you consider that the rates and charges levied by Council are value for money relative to the range of services and facilities provided?
34.8 49.3 15.8
Do you have a household disaster management plan? 43.5 55.3 1.2
Are you aware Council sends out warning via social media? 51.3 47.5 1.2
Do apartments, terraces houses, small lots etc appeal to you as housing choices for you and your family?
18 81.3 0.7
Do large houses on large blocks appeal to you as housing choices for you and your family?
65 33.3 1.7
Does Council work effectively with state and federal government to support the interest of the city?
31.2 30.2 38.7

80
The following charts provide a graphical summary of responses to the various aspects of Redland City Council. These are then followed by a summary of significant variances for the responses to each aspect for sub-samples, compared to the total sample. Is Redlands Coast a good place to live? There was high level of agreement, with 97% of respondents stating ‘yes’ to ‘Redlands City Council is a good place to live’.
Significant variances by:
Gender 3.3% of females - No
Age 4.7% aged 65 years and over - No
Location none
Yes97%
No2%
Don't know1%
Is Redlands Coast a good place to live?

81
Are you generally happy with the direction of the current Council?
Just over half (51%) of respondents said yes, they ‘are generally happy with direction of Council’.
Significant variances by:
Gender none
Age none
Location 74% from Southern Moreton Bay Islands - Yes
Would you recommend Redlands Coast as a place to visit? There was general agreement with most (92%) of the respondents stating ‘yes’ to recommending Redlands Coast as a place to visit.
No Significant variances.
Yes51%
No39%
Don't know10%
Are you generally happy with the direction of the current Council?
Yes92%
No7%
Don't know1%
Would you recommend Redlands Coast as a place to visit?

82
Is Redlands a better place to live than 5 years ago? Just over half (52%) of respondents did not think that Redlands is a better place to live than 5 years ago.
Significant variances by:
Gender none
Age none
Location 59.1% from Coastal Region – No 76% from Southern Moreton Bay Islands - Yes
Do you feel a good sense of belonging here? Almost all (91%) respondents felt a good sense of belonging (in Redland City Council).
No Significant variances.
Yes34%
No52%
Don't know14%
Is Redlands a better place to live than 5 years ago?
Yes91%
No7%
Don't know2%
Do you feel a good sense of belonging here?

83
Have you received a Councillor newsletter in the last 12 months? The majority (85%) of respondent stated ‘yes’ they had received a Councillor newsletter in last 12 months.
Significant variances by:
Gender none
Age 14.9% aged 45-54 years - No
Location 23.3% from North Stradbroke Island - No
Are you aware of the Redland Community Plan? Respondents were split, with 49% stating they were aware of the Redland Community Plan and 48% not aware of the Redland Community Plan.
No Significant variances.
Yes85%
No9%
Don't know6%
Have you received a Councillor newsletter in the last 12 months?
Yes49%
No48%
Don't know3%
Are you aware of the Redland Community Plan?

84
Do you know what you get for your rates? Just over three quarters (76%) of respondents said ‘yes’ they knew what they get for their rates.
Significant variances by:
Gender none
Age 20.9% aged 35-44 years – don’t know
Location none
Do you consider that the rates and charges levied by Council are value for money relative to the range of services and facilities provided? Just over a third (35%) of respondent considered rates and charges levied by Council as ‘value for money’
No Significant variances.
Yes76%
No13%
Don't know11%
Do you know what you get for your rates?
Yes35%
No49%
Don't know16%
Do you consider that the rates and charges levied by Council are value for money relative to
the range of services and facilities provided?

85
Do you have a household disaster management plan? Just under half (44%) of respondent stated that they do have a household disaster management plan. In comparison to in 2016, 53% of respondents who stated that they had a household disaster management plan.
Significant variances by:
Gender none
Age none
Location 60.9% from Coastal Region - No
Are you aware Council sends out warnings via social media? Just over half (51%) of respondents were aware that Council sends out warnings via social media. In comparison to in 2016, when only 39% were aware of these social media warnings.
Significant variances by:
Gender none
Age 64.5% aged 35-44 years – Yes 60.6% 65 years and over - No
Location 76% from Southern Moreton Bay Islands - Yes
Yes44%
No55%
Don't know1%
Do you have a household disaster management plan?
Yes51%
No48%
Don't know1%
Are you aware Council sends out warnings via social media?

86
Do apartments, terraces houses, small lots etc appeal to you as housing choices for you and your family? Most (81%) of respondents said that apartments, terrace houses, small lots etc did not appeal as a housing choice.
Significant variances by:
Gender none
Age 91.8% aged 35-44 years – No 25.3% aged 65+ - Yes
Location none
Do large houses on large blocks appeal to you as housing choices for you and your family? Almost two thirds (65%) agreed that large blocks appeal as a housing choice.
Significant variances by:
Gender none
Age 76.4% aged 35-44 years - Yes
Location 60% from Southern Moreton Bay Islands - No
2. Does Council work effectively with state and federal government to support the interest of the city?
Yes18%
No81%
Don't know1%
Do apartments, terraces, houses, small lots etc appeal to you as housing choices for you and
your family?
Yes65%
No33%
Don't know2%
Do large houses on large blocks appeal to you as housing choices for you and your family?

87
Respondents were divided equally on their views about how effectively Council works with state and federal government to support the interest of the city, with 39% stating they ‘don’t know’, 31% ‘agreeing’ and 30% ‘disagreeing’.
Significant variances by:
Gender none
Age none
Location 44.1% from Coastal region – Don’t know 38% from Inland region – No
Yes31%
No30%
Don't know39%
Does Council work effectively with state and federal government to support the interest of
the city?

88
3. Is Council doing a good job of managing growth, development and providing housing choice?
Almost two thirds (63%) did not think that Council was doing a good job at managing growth and providing housing choice.
No Significant variances.
No63%
Yes19%
Don't know18%
Is Council doing a good job of managing growth, development and providing housing choice?

89
3.a Why do you say that? Key reasons provided by respondents in relation to whether they thought Council was doing a good job managing growth, development and providing housing choice are summarised graphically below. By far, most respondent’s felt “Too much high density development/small lot housing/Too many units” and “Overdevelopment” were key reasons for negative responses about Council in relation to these matters.
31.8
22.2
18.7
17.5
15.2
14.7
9
8.8
7.7
5.7
5.5
0 5 10 15 20 25 30 35
Too much high density development/Small lot housing/Too many units
Overdevelopment
Not enough infrastructure for proposed housing development
Rural character/lifestyle lost
Better traffic managment and parking
Don't know
Good variety of housing choice available
Council is not spending money wisely
Council is doing a good job/Happy with this Council
Development planning is not long term
Environmental impacts of development/ destryoing wildlife habitat
Why do you say that...

90
4. How strongly would you support your Council cutting out some services or reducing service levels in others if this allowed some reduction in the level of rates or charges?
Two thirds (66%) of respondents either ‘oppose’ (42%) or ‘strongly oppose’ (24%) Council cutting out some services or reducing services levels if it allowed some reduction in rates.
No Significant variances.
For the 8% of respondents who support/strongly support cutting services they were asked to suggest what could be cut. Their verbatim suggestions are as follows:
Advertising about koalas is a waste of money. They’ve long gone now.
All services outside basic one i.e. cultural and social activities which were never meant to be council responsibility
Animal control
Any nonessential services
Any service that is not of great importance. Get fine defaulters to do local clean up rather than rate payers footing the bill?
Anything non-essential
Apart from water/sewerage/waste management services - whatever services being charged but not cost effect, then cut them down
Bicycle lanes are useless
Bit of everything/ council staff on a job need to be less - 5 working, 3 sitting
Can't think of any, obviously not really important services.
Community events / entertainment that only certain groups attend. Should be something for everyone in the community
Cut out highly paid contractors who do park maintenance and get people on the dole to do it.
Cut out some building developments
Do not waste money on Toondah Harbour
Engineering requirements can be reduced - commercial buildings have too many building regulations
Entertainment/nonessential activities (i.e. yoga)
Environmental services redirected.
Get rid of unproductive councillors and staff and use their huge wages to reduce the rates
Oppose42%
Neither / Don't know26%
Strongly oppose24%
Strongly support6%
Very strongly support
2%
How strongly would you support you Council cutting out some services or reducing service
levels in others if this allowed some reduction in the level or rates or charges?

91
I don't use 99% of the facilities so most of them can be scaled back i.e. pool, library, showground
If they were to cut the dead wood of too many councillors and use their wages to improve and construct what is needed
Mobile library, yoga lesson, free sports, bike paths. Only because I don't use them myself
Money spent on the wrong things. They must know
Need to be looked at and negotiated - not sure what
Non critical or important services
Not critical, vital services. Would need to know which services and community input needed
Not the important or necessary services
Over communicate with printed material and printed material must be reduced.
Parking fines and things like that stops people going anywhere for fear of it costing money
Parking wardens at schools. We are only there for 10-15 minutes and it can cost you a fortune if you cross a line or park for an extra minute. So dangerous for the kids but a money maker for the council.
Places like ‘Indigescape’ are an example. Waste of money
Possible park maintenance. Have council staff do it rather than send the work out to private service. May reduce cost and employ locals
Provision of cycleways / pet and animal control
Recreational services
Rubbish removal
Some deadwood. They don't maintain the footpath around here
Stop the change of name to Redlands Coast. That’ll save money. Stop approving high-rise apartments. That's not why we live here.
They've allowed too much development of housing - overcrowding
Too many staff, especially on road works, gardening etc - too many people
Tourism
Unnecessary services - Unfortunately most of those are money makers for the council. Actions that deter visitors and tourists. Nanny state things.
Unsure which services but obviously not water or waste services

92
5. Thinking about your views on the performance of your local Council as an organisation, would you say your views are more positive, about the same or less positive than they were two years ago?
Just over half (54%) of respondents, when considering performance of Council felt ‘about the same’ in terms of level of positivity about Council.
No Significant variances.
5.a What's the main reason for that? For the 7% of respondents who were generally ‘more positive’ their reasons primarily related to:
New community services and facilities being provided by Council including local road and park upgrades
Viewed Redlands as a ‘nice place to live - no issues’
Can see progress and development
Council is more proactive and communication has improved For the 37% of respondents who were less positive about Council, their reason primarily related to:
Council not providing services in their area
Overdevelopment - allowing too many houses/apartments
Lack of infrastructure – too much traffic and parking congestion
Lack of leadership – poor decision making and not listening to the community
Loss of rural environment, including impact on natural environment and loss of habitat
Contact with Council
6. Have you made contact by phone or in person with your Mayor or a Councillor in the past 12 months in relation to a Council matter?
About the same54%
Less positive37%
More positive7%
Don't know2%
Thinking about your views on the performance of you local Council as an organisation, would you
say your views are more positive, about the same or less positive than they were two years ago?

93
Just over three quarters (78%) of respondents had not made contact by phone or in person with Mayor or Councillor in last 12 months in relation to a Council matter.
No Significant variances.
(If Yes) What was the main purpose of that contact?
7. Have you made contact by phone or in person with your Mayor or a Councillor in the past 12 months in relation to a Council matter? (If Yes) What was the main purpose of that contact?
22% of respondents had made contact with the Mayor or Councillor in last 12 months, and the main reasons provided by respondents are grouped below into common themes with commentary provided below each theme.
Animal Control Main purpose of contact:
Animal control
Animal Management (x2)
Cat nuisance. Cats are not being managed
Dog noise issue
Dogs
Dogs are a nuisance
Flying foxes
Neighbours cat straying into our yard and messing
Our dog was attacked in the dog park. Suddenly it was a civil matter and we had to take necessary action
Rodent control
Neighbours light. Rubbish on the footpaths. Stray cats, Illegal parking Community Main purpose of contact:
Charity events
Community activities
Local Art Group
Men's shed, finalisation, power tool usage for grown men. Just the red tape
Met the mayor at a social event - re the koalas
No78%
Yes22%
Have you made contact by phone or in person with your Mayor or a Councillor in the past 12
months in relation to a Council matter?

94
Neighbourhood issues
Personal safety should be more important than trees
Questions about local organisation
RSL wants to take over football club, hinges on lease from council
Secretary of community Group - re various issues
Social event Development/Buildings/Approvals Main purpose of contact:
Building approval complaint
Building approval taking too long
Complaint about neighbours building
Complaint regarding development
Development at Raby Bay
Development of Toondah Harbour should be done environmentally not for profit. They are destroying a bird RAMSAR sanctuary for migrating birds.
Dilapidated houses on the island
Discuss town planning, services etc
Effects on wildlife of development (Toondah Harbour)
General plan for Stradbroke Island
Land at Birkdale given away for development Karen Williams is fighting for the land to be for tertiary facility - not housing
Over-development
Planning and development on Russell Island
Policy regarding redevelopment of Cleveland Pool
Property Development in my area
Reducing units
Regarding the trouble getting approvals
Spoke to lance Hewlett re development of Albert St
Terminal has been poorly designed
To become educated about why councillors make the decisions that they make regarding planning and development
To notify them I was moving & to find out info about vacant lot behind my house re development or other intended use
To object to the developments that are going on
To try and find out future development plans for our area
Unnecessary bridge of Perish Creek
Written letter opposing the over-development at Toondah Harbour and housing high-rise. NO response
About where the proposed over 50's development was going ahead
Environmental Main purpose of contact:
Bad drainage
Clearing of protected land
Concerning drainage in the park. Tree felling and erosion on Thorneside waterfront. Loose dogs on the beach at Thorneside
Environment issues
Environmental concerns (x2)
Expressed concerns about trees being ripped out for sewer lines
Fires on Stradbroke
Fireweed on council land (x2)

95
General conversations regarding loss of organic, productive land and green spaces
Gum trees a danger to homes
Keeping the reserve clean and tidy for koalas
Midges, but we’re told they can't spray them anymore. If they block the waterways and stop the fish breeding and the birds, naturally that interrupts the order of things - what happens? Midges because there is nothing to feed on them.
More wheel bins in parks
Mozzies and midges
Noise pollution
Park maintenance and marine environment issues
Red dust everywhere and nothing done about it
Regarding cleaning out the local creek. Puts us off any sort of fishing. Do they run sewerage into Tingalpa Creek? Always frothy along the shore
Sewerage problems due to the building across the road (high-rise)
To protect against Thornlands koala corridor destruction (Bonnie Street)
Tree lopping
Trees were cut down on foreshore dunes Flinders Beach
Wildlife concerns Maintenance Main purpose of contact:
Have footpath checked out
I have trees on the council's footpath but are destroying my fences, front and back
Ongoing removal of vegetation
Resurfacing of street and covered the area in dirt in the process. Where are the water trucks?
State of the roads
State of the roads near home
Surface of the road
Tree on the footpath causing damage and I can't touch it or I'll be fined, big time. Danger to pedestrian Rates/Permits/Fines Main purpose of contact:
About rates and dog permit
Fine dispute
Stupid fines/ NFI
Traffic/Parking Main purpose of contact:
Adjacent parking to my house
Asking for better parking in my street
Asking for parking, they listen politely but we get a negative response.
Bloomfield street parking is just terrible
Condition of road and traffic speed of hoons at Wellington Point
Driveway blockage by council workers. I ask them to move and they just said, soon
Learner driver trucks turning in my street - beeping
Parking
Parking in Middle Street
Parking on the mainland. No success
Rickett Road bottleneck. Both ends coming at the middle - the bridge. Crazy plan
Road out the front of the house
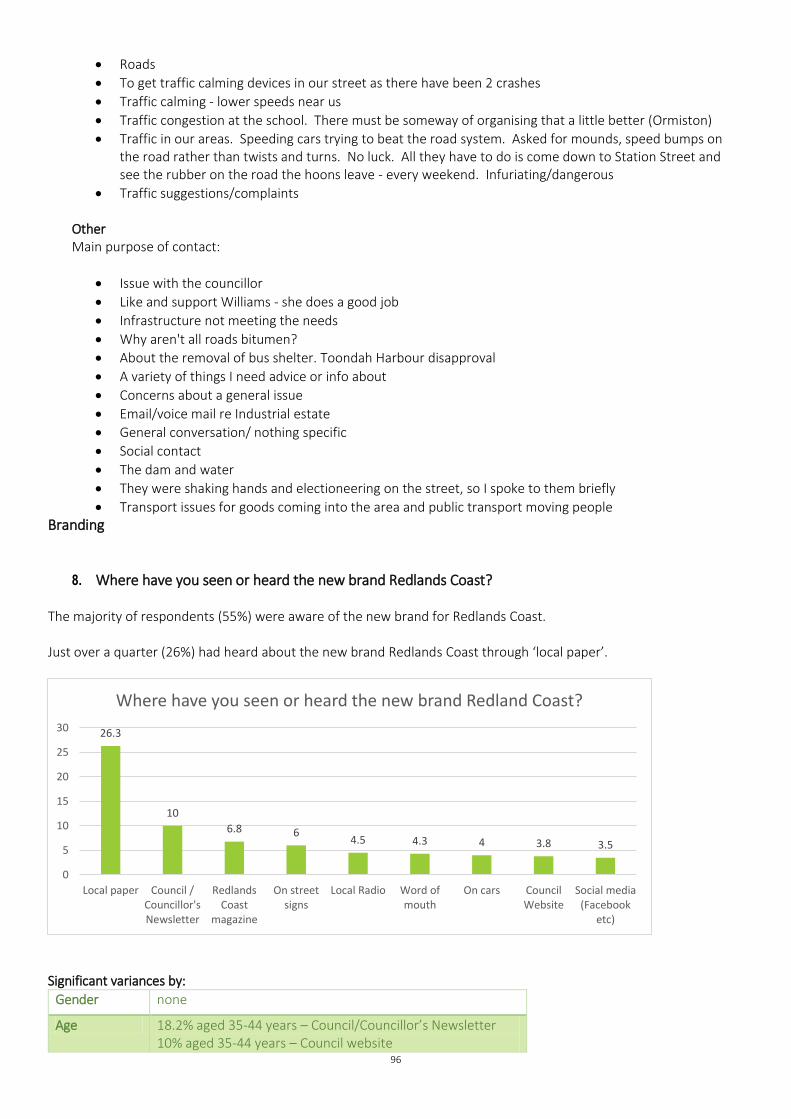
96
Roads
To get traffic calming devices in our street as there have been 2 crashes
Traffic calming - lower speeds near us
Traffic congestion at the school. There must be someway of organising that a little better (Ormiston)
Traffic in our areas. Speeding cars trying to beat the road system. Asked for mounds, speed bumps on the road rather than twists and turns. No luck. All they have to do is come down to Station Street and see the rubber on the road the hoons leave - every weekend. Infuriating/dangerous
Traffic suggestions/complaints Other Main purpose of contact:
Issue with the councillor
Like and support Williams - she does a good job
Infrastructure not meeting the needs
Why aren't all roads bitumen?
About the removal of bus shelter. Toondah Harbour disapproval
A variety of things I need advice or info about
Concerns about a general issue
Email/voice mail re Industrial estate
General conversation/ nothing specific
Social contact
The dam and water
They were shaking hands and electioneering on the street, so I spoke to them briefly
Transport issues for goods coming into the area and public transport moving people Branding
8. Where have you seen or heard the new brand Redlands Coast?
The majority of respondents (55%) were aware of the new brand for Redlands Coast. Just over a quarter (26%) had heard about the new brand Redlands Coast through ‘local paper’.
Significant variances by:
Gender none
Age 18.2% aged 35-44 years – Council/Councillor’s Newsletter 10% aged 35-44 years – Council website
26.3
10
6.8 64.5 4.3 4 3.8 3.5
0
5
10
15
20
25
30
Local paper Council /Councillor'sNewsletter
RedlandsCoast
magazine
On streetsigns
Local Radio Word ofmouth
On cars CouncilWebsite
Social media(Facebook
etc)
Where have you seen or heard the new brand Redland Coast?

97
4.5% aged 35-44 years – On rates 3.1% aged 55-64 years - TV
Location 5.9% from Coastal region – Council website 12% from Inland Region – On cars 20% from North Stradbroke Island – On street signs

98
Community Understanding of Aboriginal Heritage
9. How much do you know about the Aboriginal community of the Redlands and their history? 83% of respondents had strong knowledge (16%) or were ‘aware’ (67%) of local Aboriginal community. This is in comparison to 2016, where 76% of respondents had a strong level of knowledge or aware of the Aboriginal community of Redlands.
Significant variances by:
Gender none
Age None
Location 56.7% from North Stradbroke Island – Strong knowledge of Aboriginal communities and traditions
Aware that there is a local
Aboriginal community
67%
Unaware of any local Aboriginal community or
traditions17%
Strong knowledge of Aboriginal
communities and traditions
16%
How much do you know about the Aboriginal community of the Redlands and their history?

99
10. Can you tell me what Quandamooka means?
Just over half of the respondents did not know the meaning of Quandamooka, and only 2.7% were able to provide the correct meaning (i.e. ‘coming for sand and sea’). This is compared to 2016, where 41% of respondents gave the correct answer for the meaning of Quandamooka.
Significant variances by:
Gender none
Age none
Location 22.4% from Coastal Region – Descendants of the first Aboriginal people of the Redlands 16.7% from North Stradbroke Island – Stradbroke Island Tribes 16.7% from North Stradbroke Island – Coming from sand and sea
56.9
18.515.2
5.3 4.1 2.7
0
10
20
30
40
50
60
No, don'tknow what it
means
Descendantsof the firstAboriginal
people of theRedlands
Name of thelocality
StradbrokeIsland tribes
The tribes ofMoreton andStradbroke
Islands
Coming fromsand and sea
Can you tell me what Quandamooka means?

100
11. Do you identify as …
Only 3% of respondents identified as being ‘Traditional Owners’ (1%) or “Aboriginal or Torres Strait Islander’ (2%)
No Significant variances.
none of the above96%
an Aboriginal or Torres Strait
Islander2%
a Traditional Owner
1%
other non-English speaking
background1%
Do you identify as...

101
Council Information Provision
12. How do you get your information from Council?
As in 2016, the main source of information was from mail/letter box drops – 58.4% in 2019 versus 49% in 2016. The Quarterly residents newsletter from Councillors was also popular, with 56.4% nominating this as this as a source of information. The popularity of receiving information from Council website decreased from 32% in 2016 to 16.9% in 2019. In 2016, 65% of respondents stated they received a Quarterly newsletter from their Councillor versus the 56.4% of respondents in this survey, who nominated this newsletter as source of information from Council.
Significant variances by:
Gender none
Age 18.2% aged 35-44 years – Council social media (Facebook, Twitter, Instagram) 3.4% aged 45-54 years – I have not received any information from Council
Location 51.9% from Coastal Region – The media i.e. newspaper, radio, TV 2.5% from Inland Region – I have not received any information from Council 13.3% from North Stradbroke island – Community meetings 38% from Southern Moreton Bay Islands – Bay Islander 2% from Southern Moreton Bay Islands – Phone calls to me
58.4 56.4
46.9
18.5 16.911.2 10 8.5
49
65
17
32
1
8
0
10
20
30
40
50
60
70
In the mail /letterbox
drops
Quarterlyresidents'newsletter
fromCouncillor
The media ienewspaper,
radio, TV
Word ofmouth
CouncilWebsite
Our RedlandsCoast
magazine
Council socialmedia
(Facebook,Twitter,
Instagram)
Council emailor
eNewsletter
How do you get information from Council?
2019 2016
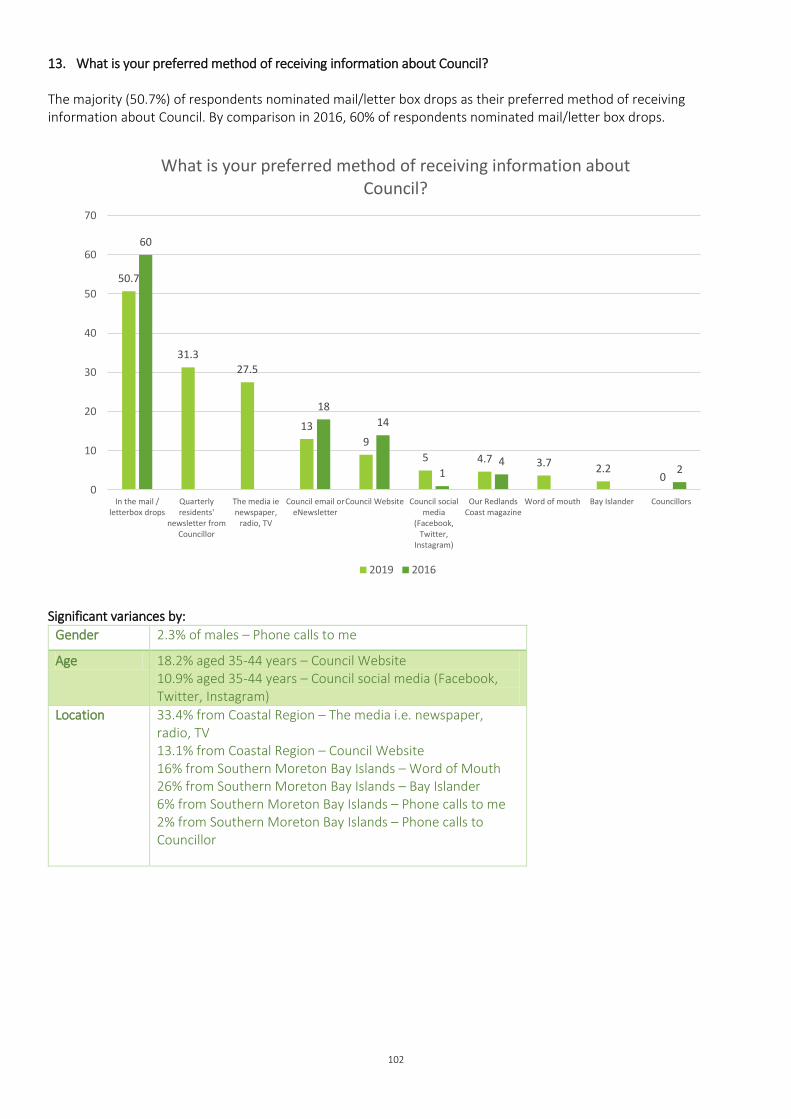
102
13. What is your preferred method of receiving information about Council?
The majority (50.7%) of respondents nominated mail/letter box drops as their preferred method of receiving information about Council. By comparison in 2016, 60% of respondents nominated mail/letter box drops.
Significant variances by:
Gender 2.3% of males – Phone calls to me
Age 18.2% aged 35-44 years – Council Website 10.9% aged 35-44 years – Council social media (Facebook, Twitter, Instagram)
Location 33.4% from Coastal Region – The media i.e. newspaper, radio, TV 13.1% from Coastal Region – Council Website 16% from Southern Moreton Bay Islands – Word of Mouth 26% from Southern Moreton Bay Islands – Bay Islander 6% from Southern Moreton Bay Islands – Phone calls to me 2% from Southern Moreton Bay Islands – Phone calls to Councillor
50.7
31.327.5
13
9
5 4.7 3.7 2.20
60
18
14
14
2
0
10
20
30
40
50
60
70
In the mail /letterbox drops
Quarterlyresidents'
newsletter fromCouncillor
The media ienewspaper,
radio, TV
Council email oreNewsletter
Council Website Council socialmedia
(Facebook,Twitter,
Instagram)
Our RedlandsCoast magazine
Word of mouth Bay Islander Councillors
What is your preferred method of receiving information about Council?
2019 2016

103
14. Would you prefer to receive the Councillor Newsletter by email or in the post?
Almost two thirds (60%) of respondents would prefer to receive Council newsletters in the post.
Gender None
Age None
Location 45.5% from Coastal Region - Email
15. In the last 12 months, have you had any contact with Redland City Council?
56% of respondents had contact with Council in last 12months versus 42% in 2016, of respondents who had contact with Redland City Council in last 12 months.
No Significant variances.
In the post60%
Email40%
Would you prefer to receive the Council Newsletter by email or in the post?
Yes56%
No44%
In the last 12 months, have you had any contact with Redland City Council?

104
Nature of Contact with Council and Satisfaction Level 16. How did you make your last contact with Council?
Most respondents had made contact with Council via:
Customer Service Centre in person - 25.8% versus 11% in 2016
General enquiry line - 34.3% versus 45% in 2016
Online (email or website) – 11.9% versus 13% in 2016
Significant variances by:
Gender none
Age 25.4% aged 35-44 years – Online (email or Council’s website) 9.8% aged 65 years and over – at the library
Location 67.6% from Southern Moreton Bay Islands – Through general enquiry numbers 2.9% from Southern Moreton Bay Islands – They called me
35.8 34.3
11.99.3
6.64.5 4.2 3.6
0
5
10
15
20
25
30
35
40
In person atCustomer Service
Centre
Through generalenquiry numbers
Online (email orCouncil's website)
Direct call to aCouncil officer
Through localCouncillor
Be letter or othercorrespondence
At the library In person(elsewhere)
How did you make your last contact with Council?

105
17. (If Yes) What was that contact about?
Main reasons respondents had contacted Council were to:
Pay rates – 22%
Animal registration - 14.3%
Building enquiry or approvals - 12.5%
Significant variances by:
Gender none
Age 6.6% aged 35-44 years – Drainage problems 8.9% aged 45-54 years – Parking / Parking on the mainland 13.7% aged 55-64 years – Rates enquiries 11.6% aged 65 years and over - Other
Location 14.7% from Southern Moreton Bay Islands – Parking / Parking on the mainland 8.8% from Southern Moreton Bay Islands – Road work/dust problem/workers parking across driveway 2.9% from Southern Moreton Bay Islands – Boating / Kayak / Water activities facilities
22
14.312.5
8.66.5 6.5 6.3 6 6 5.4
0
5
10
15
20
25
Pay rates Animalregistration
Buildingenquiry orapprovals
Trimmingtrees
Recreationalactivitiesenquiries
Animalcontrol
Dog/Cat/Foxissue
Rubbish /refuse
Make otherpayments
Ratesenquiries
Planningenquiry orapproval
What was the contact about?

106
18. How satisfied were you with how it was handled?
68% of respondent were ‘satisfied’ (37%) or ‘very satisfied (31%) with how their contact was handled. This was in comparison to in 2016, where 61% of respondents were satisfied with how contact was handled.
Significant variances by:
Gender none
Age none
Location 47.7% from Inland Region – Satisfied
Satisfied37%
Very satisfied31%
Very dissatisfied19%
Dissatisfied7%
Neither6%
How satisfied were you with how it was handled?

107
Disaster Management
19. Where do you get your disaster management warnings?
Key sources of information for disaster management warnings were:
TV news – 52% versus 39% in 2016
Text message – 28%
BOM Brisbane – 23%
ABC Radio – 19.8% versus 12% in 2016
Significant variances by:
Gender 13.3% of Females – Don’t know
Age 38.2% aged 35-44 years – BOM Brisbane 4.5% aged 35-44 years – State government social media channel 37% aged 45-54 years – Text messages 23.7% aged 65 years and over – Don’t know
Location 57.9% from Coastal Region – TV news – 7, 9, 10, ABC, SBS 27.4% from Coastal Region – BOM Brisbane 11.9% from Coastal Region – Morning programs (Sunrise, Today) 6% from Coastal Region – Local radio 28.1% from Inland Region – ABC radio 612 33.3% from North Stradbroke Island – Word of mouth 6.7% from North Stradbroke Island – Cars driving past with loud speakers 53.1% from Southern Moreton Bay Islands – Text messages 24.5% from Southern Moreton Bay Islands – Word of mouth 14.3% from Southern Moreton Bay Islands – Fire Brigade / Authorities 2% from Southern Moreton Bay Islands – Messenger/Facebook
Type of Information Required from Council
20. What topics do you want more information about from Council?
52
2823
19.8
9.9 7.9 5.4 5.2
0
10
20
30
40
50
60
TV News -7, 9,
10,ABC,SBS
Textmessages
BOMBrisbane
ABC Radio612
Don'tknow
Morningprograms(Sunrise,Today)
ABC News24
Word ofmouth
Where do you get your disaster management warnings?

108
The key areas respondents want more information from Council are in relation to:
General Council updates - 48.2% versus 12% in 2016
Roads and transport – 38.9% versus 15% in 2016
General development and building – 34.3% versus 21% in 2016
Significant variances by:
Gender none
Age 35.9% aged 55-64 years – Rates 31.3% aged 55-64 years - Water
Location 60% from North Stradbroke Island – Planning 53.3% from North Stradbroke Island – Major Developments 56.7% from North Stradbroke Island – Rates 46.7% from North Stradbroke Island – Community services 40% from North Stradbroke Island – Economic Development 53.1% from Southern Moreton Bay Islands – Planning 61.2% from Southern Moreton Bay Islands – Major Developments 51% from Southern Moreton Bay Islands – Rates 42.9% from Southern Moreton Bay Islands – Water 40.8% from Southern Moreton Bay Islands – Community Services 44.9% from Southern Moreton Bay Islands – Economic Development
48.2
38.934.3
31.327.5
1215
21
7 9
0
10
20
30
40
50
60
General Council updates Roads and transport General developmentand building
Planning Major developments
What topics do you want more information about from Council?
2019 2016

109
Making Payments 22. What is your preferred method of making payments to Council for rates or other fees?
Almost half (47.2%) of respondents preferred to make payments to Council for rates or other fees via online (through bank account), compared to 65% who preferred this method in 2016.
Significant variances by:
Gender none
Age 17.3% aged 35-44 years – Never had to make a payment 57.4% aged 55-64 years – Online, through bank account 34.3% aged 65 years and over – Face to face
Location 26.7% from North Stradbroke Island – Post Office 10% from Southern Moreton Bay Islands – Post Office
47.2
21.4
10.2
65
15 14
0
10
20
30
40
50
60
70
Online, through bankaccount
Face to face Over the phone
What is your preferred method of making payments to Council for rates or other fees?
2019 2016

110
23. (If not mentioned) Have you used Council's website to make an online payment in the last year?
16% of respondents had used Council’s website to make an online payment in the last year.
No Significant variances.
22.a) (If Yes) How satisfied were you with Council's online payment system?
84% of respondents were ‘satisfied’ (53%) or ‘very satisfied’ (31%) with Council’s online payment system. By comparison in 2016, 90% of respondents were satisfied with Council’s online payment system.
Significant variances by:
Gender none
Age none
Location 64.4% from Coastal Region - Satisfied
Council Events and Cultural Services 24. What events or cultural services at Council venues have you attended or used in the last year?
No84%
Yes16%
(If not mentioned) Have you used Council's website to make an online payment in the last year?
No Yes
Satisfied53%
Very satisfied31%
Neither7%
Very dissatisfied5%
Dissatisfied4%
(If Yes) How satisfied were you with Council's online payment system?

111
Significant variances by:
Gender 70.9% of males - None
Age 4.5% aged 35-44 years – Children’s events
Location 3.3% from North Stradbroke Island – Whale centre/Ceremony
Other events mentioned by respondents were:
Children's events 1.3%
Concerts at Cleveland 1.3%
Markets/ night markets 1.3%
Quandamooka Festival 1.3%
Anzac Day 1%
Australia Day / Citizenship 1%
Indigescape 0.8%
Blues Festival 0.7%
Curlew count 0.7%
Strawberry festival 0.7%
Classes / Events at the library
0.7%
Stradbroke chamber of music festival
0.3%
Other 0.3%
Blue light disco 0.2%
Whale Centre/Ceremony 0.2%
25. If none - why is that?
Lack of time and being too busy were the key reasons, respondents did not attend Council events or cultural services. Lack of awareness and having no interest were secondary reasons for not attending these events.
65.2
8.5 4.7 3.7 2.8 2.7 2.3 1.5
0
10
20
30
40
50
60
70
None Concert atRPAC
ChristmasCarols
Art Gallery /Art Show
Fireworks NYE Redfest DonaldSimpson
Centre events
Informationareas,
including hallfunctions and
publicmeetings
Council Events or Cultural Services Attended

112
SUMMARY This 2019 Redland City Council Community Satisfaction Survey clearly shows the extent to which Council is currently performing and is perceived to be meeting expectations of the community it serves. While this study can be used as a stand-alone report on the situation in Redland City Council, as the community sees it, it can also be compared against an external standard - the 2017 LGAQ State-wide Report of results for Queensland, and Metro-Fringe Councils. Obviously, for reviewing performance, up-dating the Corporate Plan, and determining priorities, the most important information is the actual detail in Redland City Council’s own study. However, taking account of an external measurement criterion is important, as it provides Council with a relative comparison measure of its performance. Overall Performance To gain an understanding of overall performance, this survey method uses a weighted aggregated total performance rating to measure overall satisfaction which is calculated by summarising all Performance ratings of each of the 37 Responsibility Areas into one (1) number, weighted by the relative Importance of each Area. It is computed by using all Importance scores, all Performance scores and all weighted Performance Indicators for all 37 Responsibility Areas and calculation of the weighted Total Performance Index from the resultant totals, using the standard formula. It is close to, but not the same as, the average of all Performance means expressed as a share of the Optimum performance score. This ‘summary number’ is called the ‘Average Total Performance Index’ (TPI) or the Aggregated Overall Performance (Weighted). Average Total Performance Index (TPI) for the survey was calculated at 67.65% By comparison, with LGAQ State-wide survey Metro Fringe averages in 2017, TPIs of 69.39% and 69.18% were achieved, so Redlands TPI of 67.65% for 2019 is tracking just below both Queensland wide and Metro Fringe TPIs. Total Performance Indexes can be examined from two general perspectives - the composition (i.e. the average scores for the individual Importance and Performance scores for each of the Responsibility Areas in each of the Themes) and a comparison of the overall index scores over time (for future ongoing tracking surveys).

113
COMPARISON OF PERFORMANCE INDICES The following charts show comparison of the Total Performance Index (TPI) for Redland City Council 2019 with LGAQ 2017.
The chart above, shows the Redland City Council TPI (67.65%) for 2019 compared to TPI for the 5 key themes for both Metro Fringe and Queensland State-wide in the 2017 survey. As can be seen from the chart above (compared to Metro Fringe and Queensland State-wide surveys), Redland City Council is above the overall average TPI in 2 out of the 5 areas namely:
Qualities of Council (72.04%)
Community Lifestyle Services (76.01%) For Redland City Council Managing the City TPI (58.31%), it is well below the Metro Fringe TPI (65.92%) and LGAQ State-wide (65.65%). For the remaining two themes – Basic Services and Infrastructure and Customer Services and Communications, Redland City Council is generally on par with Metro Fringe counterparts and LGAQ State-wide. In terms of importance mean scores as compared with results for the LGAQ 2017 survey for both Queensland State-wide and Metro Fringe Councils, these results are also summarised below as they are significant. What is clear is that Redland City Council respondents have placed far greater emphasis on importance of responsibilities areas across all
68.81%
76.01%
58.31%
66.14%
72.04%
67.65%
69.24%
71.96%
65.92%
66.86%
70.13%
69.18%
70.57%
72.02%
65.65%
66.38%
69.45%
69.39%
0.00% 10.00%20.00%30.00%40.00%50.00%60.00%70.00%80.00%
Basic Services / Infrastructure
Community Lifestyle Services
Managing the Shire/City
Customer Services and Communications
Qualities of Council
OVERALL WEIGHTED PERFORMANCE INDEX
Summary of Performance Indices
LGAQ STATEWIDE - 2017 LGAQ (METRO FRINGE) SURVEY - 2017 REDLAND 2019

114
five themes compared to their counterpart Councils across the State. This needs to be considered when reviewing performance scores for Council and community expectations of performance for Redland City Council service delivery.
4.28
3.95
4.21
4.26
4.30
4.18
3.92
4.18
4.26
4.35
4.48
4.11
4.44
4.57
4.57
3.40 3.60 3.80 4.00 4.20 4.40 4.60 4.80
Basic Services /Infrastructure
Community Lifestyle Services
Managing the Shire/City
Customer Service & Communication
Quality of Council
Importance Mean Comparison - LGAQ versus Redland City Council
RCC LGAQ Metro Fringe LGAQ QLD

115
Areas Rated as Being ‘Poor’ on Performance There are 18 Responsibility Areas where there are the greatest gaps between Performance and Importance - ranked inversely by the level of rated Performance.
These 18 Responsibility Areas have been selected on the basis that
their Importance rating is at least 3.96 (on the border-line of ‘4’= ‘Important’), and
their Performance is more than 1.5% below Average (where Average Total Performance Index is 67.65%). The size of the job to be done can be defined in two ways:
Move the Performance Mean from the current rating up to the Optimum level (‘a score of ‘5’). Current Performance as a share of Optimum is shown in the Share of Optimum column. The difference between ‘Share of Optimum’ and 100.0% shows how actual performance has to improve to achieve a score of ‘5’.
Achieve Equilibrium between Performance and Importance by closing the ‘gap’ between their respective Mean scores. If the gap between the average ratings for Importance and Performance were to close, there would be a significant improvement in community perceptions of Overall Performance.
65.7%
65.1%
64.2%
64.1%
64.0%
63.1%
62.2%
61.6%
61.2%
59.7%
59.3%
58.4%
58.4%
56.6%
56.6%
56.1%
53.9%
53.6%
52.0% 55.0% 58.0% 61.0% 64.0% 67.0%
Heritage Protection
Community Development
Footpaths, Kerbing, Guttering
Road Maintenance
Environmental Controls
Road Construction
Revenue-raising
Providing Leadership & Advocacy
Development of Tourism
Public Transport
Evironment Protection & Conservation
Consulting the community
Financial Management
Economic Development/Local Employment
Traffic Management
Responding to the Community
Parking Facilities
Town Planning
Lowest Performers

116
Areas Rated of Highest Performance There are 15 Responsibility Areas (out of the total of 37) on which Council performed best in relation to their judged importance. In this case, ‘best’ is defined as having:
an Importance rating of at least 3.96 (on the border-line of ‘4’= ‘Important’), and
Performance more than 1.5% above Average (where Average Performance is 67.65%- the (calculated) Average Total Performance Index).
85.3%
82.1%
81.0%
80.4%
77.5%
76.2%
75.6%
75.4%
72.4%
72.3%
72.0%
71.3%
71.3%
70.3%
69.9%
60.0% 65.0% 70.0% 75.0% 80.0% 85.0% 90.0%
Libraries & other Information Access
Waste Management
Sewerage
Water Supply
Customer Service
Parks, Playgrounds & Public Amenities
Information Services
Drainage & Flood Mitigation
Shopping Facilities
Community Safety
Quality & Performance of Staff
Street Lighting
Community Health
Community Services
Pet/Animal Control
Highest Performers

117
Areas of Average Performance
There is only one Responsibility Areas (out of the total of 37) on which Council has received an average score which is defined as having:
an Importance rating of at least 3.96 (on the border-line of ‘4’= ‘Important’), and
Performance not more than 1.5% below or above Average (where Average Performance 67.65% - the (calculated) Average Total Performance Index).
68.3%
65.0% 66.0% 67.0% 68.0% 69.0%
Informing theCommunity
Average Performer

118
Areas of Least Importance Only 3 of the 37 Responsibility Areas have not been considered in formulating the previous three lists (Highest Performers, Lowest Performers and Average Performers) because they did not have an Importance rating greater than 3.96, or 4 when rounded (i.e.= ‘Important’). Nevertheless, they do exist, and are listed below - ranked by their Performance score, as used in the previous three tables. Despite their Importance rating being regarded as fairly low, by the Community at large, Councils cannot avoid expending resources upon them, as they are very Important to some members of the community (e.g. Sporting & Recreational Facilities is rated as ‘important’ by 48.7% of respondents). Hence, the detailed data on these particular areas has to be examined, to formulate priorities - as these show the proportions of the community who have varying priorities.
The High Priority Areas The Responsibility Areas, that have the largest ‘gaps’ between their scores for Performance and their scores for Importance, also appear near the top of the Importance ranking and at the bottom of the Performance ranking. These are the Areas where residents are expressing high levels of dissatisfaction with Performance levels and are awarding strong ‘should try harder’ scores. Key feedback on other aspects
The customer satisfaction research also comprised some additional questions about various other aspects of Council activity which Council was interested in receiving feedback on. Where appropriate comparisons were made with results from Council’s research undertaken in 2016. It is useful to highlight some key feedback on these other aspects, some of which validates finding from the customer satisfaction research component of this survey.
Firstly, for the questions asked around perceptions of Council, it was clear that respondents felt a strong sense of community, with high levels (over 90%) of agreement was in relation to the following aspects:
‘Redlands is a good place to live’ (97%)
‘Would recommend Redlands Coast as a place to live’ (92.3%)
‘Feel a good sense of belonging here’ (90.3%)
77.1%
76.9%
65.9%
60.0% 62.0% 64.0% 66.0% 68.0% 70.0% 72.0% 74.0% 76.0% 78.0%
Cultural & Entertainment Facilities
Sporting & Recreational Facilities
Cycleways
Least Important (<3.96)

119
However, highest level of disagreement (81.3%) on a key aspect of Council’s management, was in relation to respondent opposition to apartment, terrace houses, small lots etc as they do not appeal as a housing choice. This aligns with respondent feedback about how they think Council is managing the City, with almost two thirds (63%) indicating that they did not think that Council was doing a good job at managing growth and in particular providing housing choice. This view is also validated in the ratings that Council received for this theme in the customer satisfaction component of this research. This is obviously a key area that the community is concerned about and needs to be addressed to significantly improve satisfaction levels in the future.
In terms of specific questions on Council performance, just over half (54%) of respondents, when considering performance of Council felt ‘about the same’ in terms of level of positivity about Council and 7% of respondents were generally ‘more positive’ about Council’s performance. For the 37% of respondents who were less positive about Council, their reason primarily related to:
Council not providing services in their area
Overdevelopment - allowing too many houses/apartments
Lack of infrastructure – too much traffic and parking congestion
Lack of leadership – poor decision making and not listening to the community
Loss of rural environment, including impact on natural environment and loss of habitat
These reasons for dissatisfaction also further validates low performing areas, highlighted in the customer satisfaction component of the research.
Community understanding of Aboriginal Heritage was another key area that Council has been tracking community awareness, and for this survey 83% of respondents had ‘strong knowledge’ (16%) or ‘were aware’ (67%) of local Aboriginal community. This is in comparison to 2016, where 76% of respondents had a strong level of knowledge or awareness of the Aboriginal community of Redlands.
Providing information to the community was another key tracking area for this survey and as in 2016, the main source of information was from mail/letter box drops – 58.4% in 2019 versus 49% in 2016. However, the popularity of receiving information from Council website decreased from 32% in 2016 to 16.9% in 2019.
The majority (50.7%) of respondents nominated mail/letter box drops as their preferred method of receiving information about Council. By comparison in 2016, 60% of respondents nominated mail/letter box drops.

120
Performance Improvement Targets This charts shows a list of targets for improvement where elements have performance ratings 1.5% or more below the average performance assessment of 67.65%, but which also have relatively high (=/>4) levels of importance. There are others close to the cut-off not shown in this figure, although these are noted in the detailed findings.
These elements can be considered as priorities for enhancement of overall performance. Attention to these elements will lead to the greatest overall increase in the weighted performance indices. This 2019 customer satisfaction survey provides a solid foundation for Redland City Council to review its targets for improving its performance ratings. The results show that Redlands is tracking just below its Metro Fringe counterparts, and also for Queensland, in term of overall performance when compared with LGAQ 2017 survey results. Albeit, this comparison is limited given, as previously noted, that Redlands chose to slightly modify the standard responsibility areas tracked by the LGAQ survey. However, this research will enable future ongoing tracking studies to be undertaken by Redland City Council, to monitor the degree of success it is having in reaching their performance improvement targets.
65.7%
65.1%
64.2%
64.1%
64.0%
63.1%
62.2%
61.6%
61.2%
59.7%
59.3%
58.4%
58.4%
56.6%
56.6%
56.1%
53.9%
53.6%
67.65%
50.0% 55.0% 60.0% 65.0% 70.0%
Heritage Protection
Community Development
Footpaths, Kerbing, Guttering
Road Maintenance
Environmental Controls
Road Construction
Revenue-raising
Providing Leadership & Advocacy
Development of Tourism
Public Transport
Evironment Protection & Conservation
Consulting the community
Financial Management
Economic Development/Local Employment
Traffic Management
Responding to the Community
Parking Facilities
Town Planning
Total Performance Index
Performance Improvement Targets