communitylife survey technicalreport 2019/20
TRANSCRIPT

Community Life Survey Technical Report
201920
copy Kantar Public 2020
Acknowledgements
Our thanks go to all respondents who gave up their time to take part in the Community Life Survey
We would also like to thank The Community Life Survey Team at the Department for Digital Culture
Media and Sport
Information on the Community Life Survey and associated publications are available from
httpswwwgovukgovernmentcollectionscommunity-life-survey--2
For further information please contact
Community Life Survey Team
DCMS
100 Parliament Street
London
SW1A 2BQ
Email evidencedcmsgovuk
Contents
1 Introduction4
2 Development 6
3 Sampling 10
4 Questionnaire 15
5 Fieldwork 17
6 Data Processing 23
7 Weighting 26
8 Standard errors 33
9 Data user guide 55
10 Appendices58
1 Introduction
This technical report covers the Community Life Online and Paper Survey in 201920 Technical
reports for previous years are available on the UK Data Archive
Background to the survey
The Community Life Survey has been conducted by Kantar on behalf of the Department for Digital Culture Media and Sport since 20121 The online and paper data set from every survey year between 201213 and 201819 is available on the UK Data Service The 201920 data set will be available a few months after publication of the report and a data user guide can be found in Chapter 9 of this report
Survey Objectives
The Community Life Survey provides Official Statistics on issues that are key to encouraging social action and empowering communities including volunteering charitable giving community engagement well-being and loneliness
The key objectives of the survey are to
Provide robust nationally representative data on behaviours and attitudes within
communities to inform and direct policy and action in these areas
Provide data of value to all users including public bodies external stakeholders and the
public engaging with end users to refine and develop the survey as appropriate
Underpin further research and debate on building stronger communities
Survey Design
The Community Life Survey 201920 is conducted via an online and paper methodology using
Address Based Online Surveying (ABOS) an affordable method of surveying the general population
that still employs random sampling techniques ABOS is also sometimes referred to as ldquopush to webrdquo
methodology In brief this methodology takes the following approach
1 A stratified random sample of addresses is drawn from the Royal Mailrsquos postcode address file
and an invitation letter is sent to lsquothe residentsrsquo of each one containing username(s) and
password(s) plus the URL of the survey website
2 Respondents can log on using this information and complete the survey as they might any
other online survey with the option to stop and restart their survey when it suits them
3 Non-responders receive up to two reminder letters with some respondents receiving paper
questionnaires alongside the second reminder letter2
1Between 2012-13 and 2015-16 the survey was conducted on behalf of the Cabinet Office
2 Further information on which respondents receive a paper questionnaire in the second reminder can be found in section 331
4 Once the questionnaire is complete the specific username and password cannot be used
again ensuring data confidentiality from others with access to this information
5 Paper questionnaires are also available on request for those who are unable to take part
online The paper questionnaire is a reduced version of the online survey
For further details about push to web please see lsquoAn introduction to address-based online surveyingrsquo3
Questionnaire
Respondents can complete the survey online or by completing a paper questionnaire The survey asks about a range of topics including identify social networks sense of community civic engagement volunteering social action subjective wellbeing and loneliness
The paper questionnaire covers the same topics as the online survey however the paper questionnaire is reduced in length More information about the survey used in both modes can be found in Chapter 4
Weighting
The survey data is weighted to compensate for variations in sampling and response probability The inferential population is lsquoall adults in England aged 16+ and living in private residencersquo
The data is calibrated to ensure that the weighted sample matches population totals for several dimensions Gender by age group degree level education by age group housing tenure region household size ethnic group and internet usage by age group As respondents can complete the survey online or paper questionnaire there are different weights for online only and online and paper questions More information about the weighting process can be found in Chapter 7
3 httpthe-sraorgukjournal-social-research-practice
2 Development
The Community Life Survey first took place in 201213 and was conducted via a face-to-face
methodology The survey incorporated key measures and replicated the main methodology from the
Citizenship Survey which was conducted from 2001 to 2011 The face-to-face survey was effective in
providing a robust and nationally representative Official Statistic however the method was
expensive and resource intensive As a result Kantar was commissioned to carry out development
work to explore the feasibility of incorporating onlinepaper methods of data collection which cost
significantly less than face-to-face interviews for future survey years
The programme of methodological development work was carried out in parallel to the face-to-face
survey and conducted between 2012 and 20154 It comprised four separate stages
Stage 1 Testing and refining an initial field model for onlinepaper survey delivery
Stage 2 Larger scale onlinepaper pilot conducted alongside the face-to-face survey
Stage 3 Testing the feasibility of sampling all adults in the household instead of one selected at
random
Stage 4 Study to investigate the relative contribution of sample effects and mode effects in
explaining estimate differences between face-to-face and onlinepaper modes
Online and Paper Survey Development
As the methodology is relatively new the survey has continued to evolve as further evidence
becomes available (see below for references) Developments by survey year are detailed in
summary below more details can be found in the relevant yearrsquos technical report
Online and paper developments by Survey Year
201213 The first Community Life Survey took place
Conducted using a face-to-face methodology The survey incorporated key measures and
replicated the main methodology from the previous Citizenship Survey (commissioned by the
4 For more information on the findings of this development work please see Rebecca Hamlyn Alice Fitzpatrick and Joel
Williams (2015) Investigating the viability of moving from a face-to-face to an online postal mode
(httpswwwgovukgovernmentuploadssystemuploadsattachment_datafile466921Investigating_the_the_viability_of_movi
ng_from_a_face-to-face_to_an_online_postal_mode_FINALpdf)
Department for Communities and Local Government5 from 2001 to 2011) Details of the
methodology and achieved samples can be found in the 2012-13 technical report6
2012 Large-scale ABOS Test
A large-scale test of the Address Based Online Sampling (ABOS) design was conducted
after Kantar7 were commissioned to explore cost effective methods for future survey years
The aim of the test was to scope and test a potential field model for onlinepostal survey delivery The test was based on a relatively large-scale random probability survey with c 6700 issued addresses with invitations to access the online survey sent out by post At each address one adult aged 16+ was invited to take part with selection based on the adult in the household who had the ldquolast birthdayrdquo Up to two postal reminders were sent to each address to maximise response
Four different incentive packages were tested in the first letter pound5 conditional voucher pound10 conditional voucher pound5 unconditional voucher included no incentive (the control group) A random subset of non-responders received a postal questionnaire with their second
reminder which they could complete instead of the online version The paper version of the
questionnaire was an edited version of the online interview with a reduced number of
questions as the full survey was too lengthy to accommodate on paper
For more detailed results of this development work please see the full report for 2012138
201314 Full scale test
Based on recommendations for an optimal design arising from Stage 1 a larger scale onlinepostal test survey was conducted which ran concurrently with the standard face-to-face survey during the survey year April 2013-March 2014
A larger annual sample size of c10000 achieved onlinepostal questionnaires over the survey year provided a more robust test of differences in a) sample composition and b) measurement between onlinepostal and face-to-face modes
The larger sample size also allowed some initial exploration of the relative contribution of samplingfieldwork methods and data collection mode in explaining differences between onlinepostal and face-to-face survey estimates Alongside the full-scale test the feasibility of sampling all adults in the household instead of one selected at random was also explored This involved an additional issued sample of n=1400 addresses in Quarter 3 which were issued with different instructions for selecting which adults should complete the survey all other features of the survey were the same
In this variant the invitation letter invited all adults in the household (up to a maximum of four) to complete the survey with an incentive of a pound10 voucher offered to each responding adult This was proposed as a solution to the problem of non-compliance with within-household sampling instructions identified at Stage 1
The study allowed a comparison of the all adults vs single adult design on several measures
including completion behaviour associated with higher household conditional incentives
sample profile and data quality For full details please see the technical report for 2013149
5 Now the Ministry of Housing Communities and Local Government
6 httpdocukdataserviceacukdoc7433mrdocpdf7433_community_life_survey_technical_reportpdf
7 Then TNS-BMRB
8 httpswwwgovukgovernmentuploadssystemuploadsattachment_datafile325872Annex_B_-_Summary_of_web_experiment_findings_2012-13pdf
9 httpdocukdataserviceacukdoc7737mrdocpdf7737_community_life_2013-14_web_survey_technical_reportpdf
201415 The any adult approach was adopted into the survey
Following the work exploring the feasibility of sampling all adults in the household conducted
alongside the 201314 survey the all adult design was adopted into the survey design
A study was also conducted to investigate the relative contribution of sample effects and mode effects in explaining differences between face-to-face and onlinepostal mode For
details and analysis of these experiments please see experiment report10
201516 50 of selected addresses received a second reminder with two copies of the
paper questionnaire
In 201516 the design of the survey was amended so that up to two copies of the paper
questionnaire were included in reminder mailings targeted towards more deprived areas
This was done to limit between-strata variance in response Paper questionnaires remained
available to all households on request
201617 Survey moved to an online and paper design only
In 201617 the survey moved to a solely online and paper design The overall design of the
201617 online and paper survey remained largely unchanged from the 201516 survey
However the design was modified to achieve minimum usable samples of BAME groups For
full details please see the technical report for 20161711
201718 Overall design remained largely unchanged from 201617
Paper questionnaires were sent out in the second reminder to approximately two thirds of
households and they were also available on request to all households
Invitations for the 201718 survey were sent out to 31059 addresses with 7558 online
interviews and 2659 paper questionnaires completed over the course of the year Full details
of sampling and response are covered in detail within the technical report for 20171812
201819 Overall design remained unchanged Letter experiment conducted
Paper questionnaires were sent out in the second reminder to approximately two thirds of
households and they were also available on request to all households
Invitations for the 201819 survey were sent out to 31761 addresses with 7902 online
interviews and 2725 paper questionnaires completed over the course of the year Full
details of sampling and response are covered in detail in this technical report
An experiment was conducted in Q2 to test the effectiveness of a new letter design
Experiment letters were developed following a review of best practice and wider literature
and issued to half the sample in Q2 Full details of this experiment are available in the
10httpsassetspublishingservicegovukgovernmentuploadssystemuploadsattachment_datafile663700Disentangling_sam ple_and_mode_effects_on_the_Community_Life_Survey_-_Nov_2017_revisionpdf
11httpsassetspublishingservicegovukgovernmentuploadssystemuploadsattachment_datafile651589Community_Life__ Online_and_Paper_Survey_Technical_Report_-_2016-17_v4_FINALpdf
12httpsassetspublishingservicegovukgovernmentuploadssystemuploadsattachment_datafile770554Community_Life_O nline_and_Paper_Survey_Technical_Report_2017-18pdf
201819 technical report13 The experiment letters were adopted for the full sample in Q3 and
Q4
201920 Overall design remained unchanged
Paper questionnaires were sent out in the second reminder to approximately two thirds of
households and they were also available on request to all households
Invitations for the 201920 survey were sent out to 31728 addresses with 7849 online
interviews and 2394 paper questionnaires completed over the course of the year Full
details of sampling and response are covered in detail in this technical report
13httpsassetspublishingservicegovukgovernmentuploadssystemuploadsattachment_datafile820606Community_Life_O nline_and_Paper_Survey_Technical_Report_-_201819pdf
3 Sampling
Sample design objectives
The 201920 Community Life Survey sample design had to achieve several objectives
A responding sample size of at least 10500 adults in England aged 16+ with the assumption that
up to 500 would be edited from the dataset leaving a total of at least 10000
A responding sample size of Black and Minority Ethnic (BAME) respondents of c2000 after
editing
An overall effective sample size of c6000
lsquoUsablersquo sample sizes for each of four most prevalent ethnic categories ((i) White British (ii) Asian
ethnic groups (iii) Black ethnic groups and (iv) other ethnic groups combined)
The lsquoeffectiversquo sample size in this context reflects the statistical value of the data after weighti1ng to
compensate for unequal sampling probabilities As a general rule the more the sample needs to be
weighted the smaller the effective sample size relative to the actual responding sample size
An equal probability sample of addresses would not have allowed all these objectives to be achieved
so a stratified unequal probability sample of addresses was drawn
The sample frame was the Royal Mail Postcode Address File (PAF) which includes c99 of all
residential addresses in England
Address sampling protocol
Before sampling from the Royal Mail Postcode Address File the residential addresses14 in each
ethnic mix stratum were sorted by (i) expected response stratum (ii) local authority and (iii) postcode
A random start-point was selected within each ethnic mix stratum before a systematic sample of
addresses was drawn with an interval suitable to obtain the target number of addresses for that
stratum A 25 over-sample was included (taking the total number of sampled addresses up from
31730 to 39662) to provide a reserve pool In the event no addresses were required from the
reserve pool
The main sample addresses (ie excluding the reserve pool) were systematically allocated (with
equal probability) to one of quarters 1 2 3 or 4 and then further subdivided (with equal probability)
into two batches each with a different issue date Historically the response rate in quarter 4 (January
to March) has been higher than in other quarters so only 235 of the sample is allocated to that
quarter with 255 allocated to each other quarter
14 The lsquosmall userrsquo subset of the Postcode Address File was used as the sample frame This is thought to contain nearly all residential addresses as well as a subset of non-residential addresses that cannot be separately identified as such
The primary stratum Ethnic mix
Because the sample design objectives are all focused on ethnic group sample sizes the primary
stratum defined addresses in terms of their ethnic mix Ten ethnic mix strata were defined using a k-
means clustering algorithm This algorithm sorted all Lower Layer Super Output Areas (LSOAs) in
England into ten groups on the basis of a set of 2011 census variables Each variable was equal to
the (estimated) proportion of adults in LSOA t who self-identified as part of ethnic group g There
were seven of these variables
White British in LSOA t
Indian in LSOA t
Pakistani in LSOA t
Bangladeshi in LSOA t
Black African in LSOA t
Black Caribbean in LSOA t
White (not British) in LSOA t
The k-means algorithm identified a clustering solution that maximised the difference in cluster-level
means across all the input variables15 Each cluster is one ethnic mix stratum All addresses in each
LSOA were included in the ethnic mix stratum of that LSOA Within each of these ten ethnic mix
strata a single address sampling fraction was applied but this fraction varied between strata These
strata were first used for the 201617 Community Life Survey
The secondary stratum Expected response rate
The secondary stratum was first used for the 201718 survey Each LSOA in England was placed into
one of five strata based on its modelled response rate if (i) no paper questionnaires were included in
the 2nd reminder and (ii) no 3rd reminders were used As with the ethnic mix strata all addresses in
each LSOA were included in the expected response stratum of that LSOA The model was based on
data from the 201617 survey and each LSOA was allocated to an expected response stratum on that
basis To keep stratum definitions consistent over time this model has not been updated since the
201617 survey However it is highly unlikely that any LSOA has been allocated to a wholly
inappropriate stratum
The five strata were defined as follows
1 lt025 expected online responses per sampled address
2 gt=025lt030 expected online responses per sampled address
3 gt=030lt035 expected online responses per sampled address
4 gt=035lt040 expected online responses per sampled address
5 gt=040 expected online responses per sampled address
15 The algorithm needed to be run several times with different lsquoseed valuesrsquo to ensure that the solution was stable (did not vary much as a function of the seed value selection) However only one run was used to define strata
The expected number of responses was estimated via a generalised linear model and is a function of
the local LSOArsquos region ethnic mix stratum index of multiple deprivation and four summary variables
each representing a different dimension of census data16
In each secondary stratum a different data collection design was used in strata 1 and 2 every 2nd
reminder contained two paper questionnaires to encourage response in stratum 3 a random 46 of
2nd reminders contained two paper questionnaires in strata 4 and 5 no 2nd reminders contained
paper questionnaires The intention was to reduce the between-strata variance in response rate to the
following levels
Stratum 1 = 027 expected responses per sampled address
Stratum 2 = 036 expected responses per sampled address
Stratum 3 = 034 expected responses per sampled address
Stratum 4 = 034 expected responses per sampled address
Stratum 5 = 041 expected responses per sampled address
Address sample sizes in each stratum
The primary and secondary strata were crossed to form 43 final strata (not 50 because seven
combinations were empty) Because the sampling fraction did not vary within the ten ethnic mix strata
it was only necessary to calculate the number of addresses to sample for each of these primary strata
rather than for every one of the 43 final strata
The number of addresses to sample in each ethnic mix stratum was calculated using data from the
2016-18 surveys This data allowed estimation of the expected response rate in each of the 43 final
strata given the data collection design used in each one The same data was also used to estimate
relative response for each ethnic group compared to what would be expected given its Census
distribution
From this it was assumed that
The White British ethnic group would respond at 11 times the expected rate
Asian ethnic groups would respond at 08 times the expected rate
Black ethnic groups would respond at 06 times the expected rate
Other ethnic groups combined would respond at 11 times the expected rate
Using this data Kantar used a solving algorithm to identify a design that maximised the total effective
sample size given the constraining sample design objectives outlined at the start of this report
section The final design is shown in table 31
16 The profile of each LSOA is represented by a set of six Census-derived lsquoprincipal componentrsquo scores each reflecting a different aspect of that LSOA One of these principal components is strongly correlated with the neighbourhoodrsquos index of multiple deprivation one is correlated with the proportion of accommodation units that are flats one with the presence of students one with the share of the population aged 65+ and two are correlated with different aspects of the ethnic mix Four of the six factors proved to be significant predictors of response to the Community Life Survey
In detail a statistical technique called PCA was used to form uncorrelated linear combinations (lsquoprincipal componentsrsquo) of 42 LSOA-level Census proportions (eg of 16-24s with degree-level qualifications) The first principal component accounts for as much variance as possible across the 42 input variables Successive components explain the - progressively smaller ndash residual variance and are all (by design) uncorrelated with each other These principal components were then lsquorotatedrsquo using the varimax algorithm which seeks to minimise the number of input variables that have high correlations with each of the first f factors (f is user-specified but should explain a high percentage of the total variance f = 6 in this case explaining 77 of the total variance) The varimax rotation method simplifies interpretation compared to other rotation methods and compared to the initial (un-rotated) principal components
Table 31 Ethnic mix strata and the target number of addresses to sample in each
Ethnic mix stratum
White British
Asian Black Other Share of Census population
Share of address sample
Addresses to sample
1 44 39 5 12 12 22 694
2 49 18 16 18 29 64 2019
3 47 13 8 32 39 92 2925
4 88 3 1 8 207 172 5465
5 17 60 9 15 18 39 1248
6 66 13 5 16 73 114 3607
7 15 67 7 11 11 26 829
8 27 23 23 27 44 116 3676
9 95 1 0 4 449 231 7332
10 79 7 3 11 118 124 3935
All 80 7 3 9 1000 1000 31730
Table 32 shows the expected responding sample size for each ethnic group as well as the expected
effective sample size after weighting to compensate for unequal sampling probabilities
Table 32 Expected sample sizes for each ethnic group
Ethnic group Expected sample size (after editing)
Expected effective sample size
after weighting17
White British 7148 6145
Asian 1070 913
Black 363 321
Other groups 1419 1138
All 10000 8523
(All Non-White British groups)
(2852) (2318)
17 This ignores the variable-specific effects of sample stratification and clustering by household The latter will tend to further reduce the effective sample size
Within-address sampling protocol
At each address all permanently resident adults aged 16+ were invited to take part in the survey
although only four serial numbers were included in the letter (more could be requested for larger
households) It is worth noting that a small fraction (lt3) of addresses in England contain more than
one household There is no household selection stage so at these addresses the selected
household is the one that picks up the invitation letter
4 Questionnaire
Overview
The questionnaire for the 201920 survey was intended to provide comparable data to previous years
As a result minimal changes were made to the questionnaire
Questionnaire development
The questionnaire was reviewed and updated to reflect current policy priorities and best practice As a
result the following changes were made
CivPart In the last 12 months that is since [DATE ONE YEAR AGO] have you [Attended a public
meeting rally or taken part in a public demonstration or protestrsquo A comma was added following the
word lsquomeetingrsquo
GGroup In the last 4 weeks have you given money to charity in any of the following ways Please
exclude donating goods or prizes A new answer code was added lsquoDonation ndash made through
contactless technologyrsquo The wording at response code Did not give money to charity was updated
from Did not give to charity These changes were also added to the paper questionnaire
Lon1Lon2Lon3LonOft How often do you feel that you lack companionshipHow often do you feel
left outHow often do you feel isolated from others lonely Following the experiment conducted in
the 201819 survey year these questions were added into the subjective wellbeing section following
on from WellB3 LonOft was moved to follow on from Lon3
Vnbv How important is it for you personally that you have opportunities to mix with people from
different backgrounds This question was added to the Your Community section following
STrustGen2 This question was also added to the paper questionnaire
Online Questionnaire Content 201920
The final Community Life Online Survey 201920 consisted of the following modules
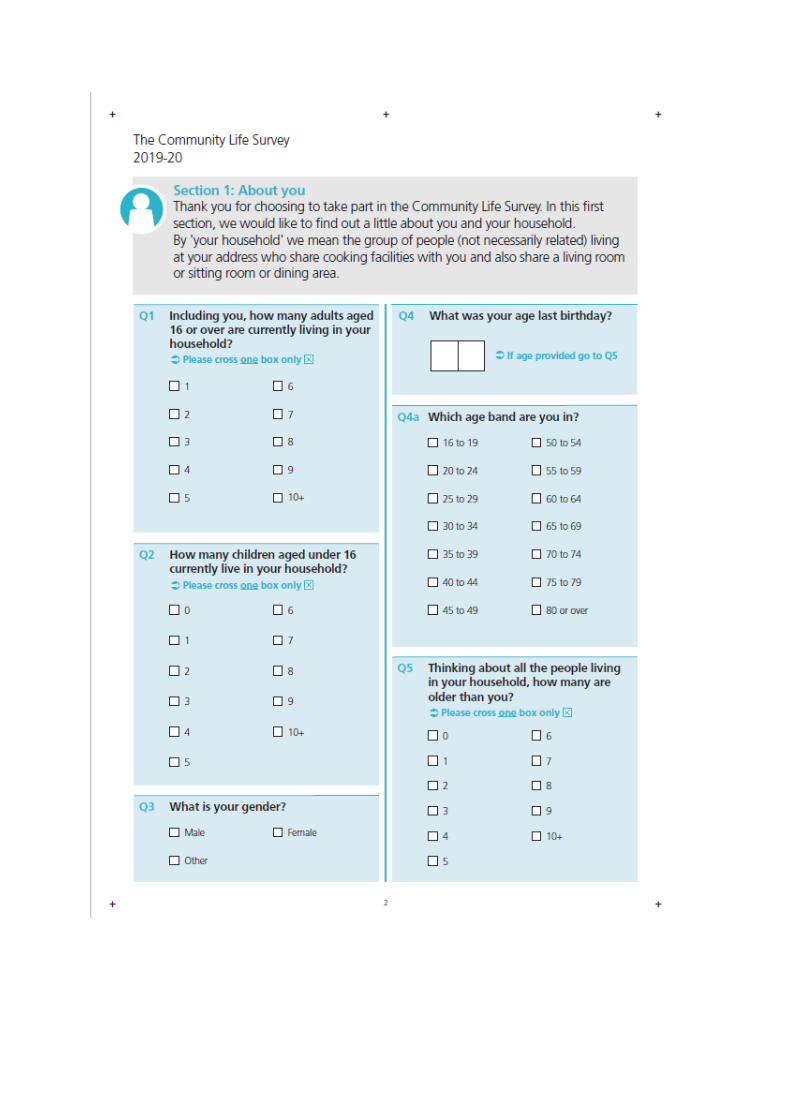
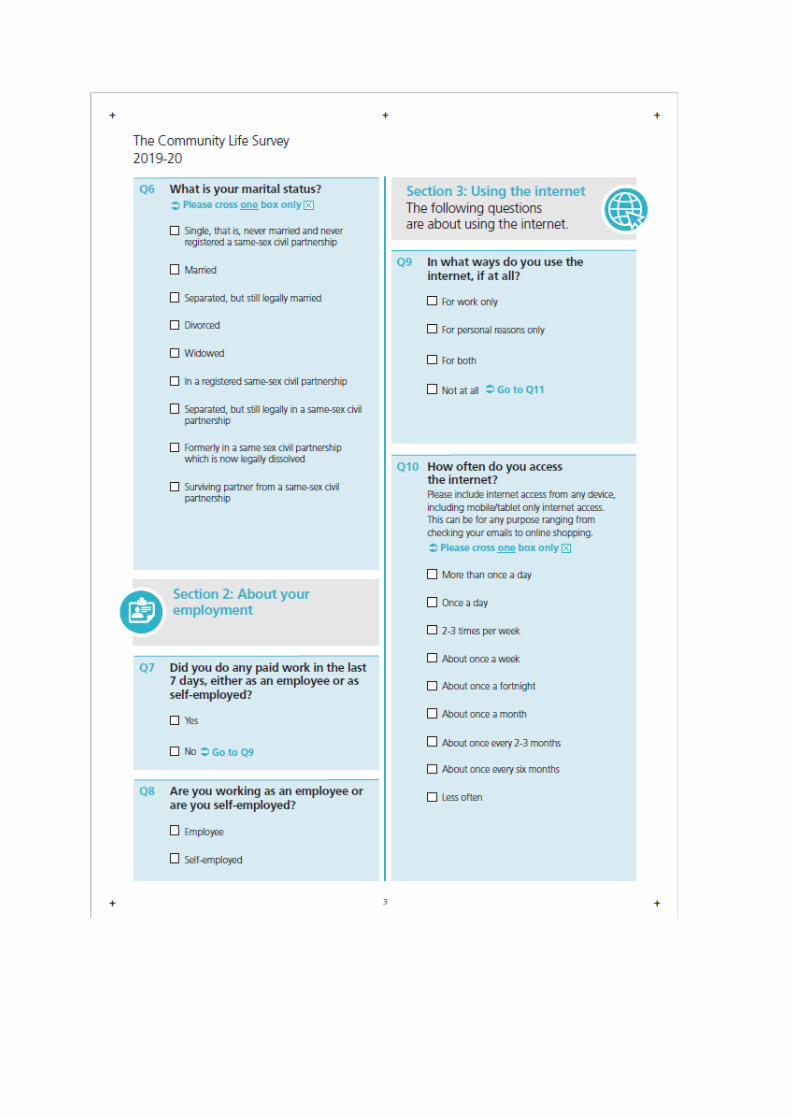
Demographics ndash details of the household including the number of adults and children the gender
and age of people within the household and details of the relationships within the household
Identity and Social Networks ndash basic demographic information on the respondentrsquos friends and
how often and how they communicate with friends and family that they do not live with
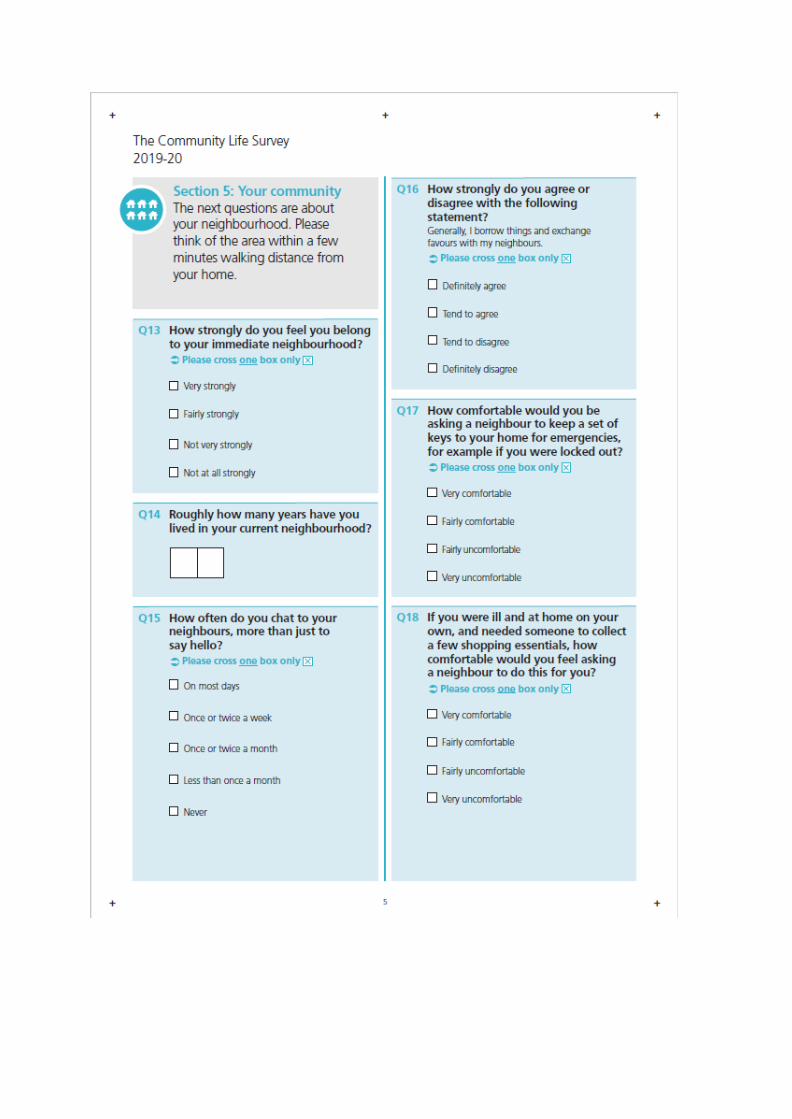
Your Community ndash the respondentrsquos sense of belonging to their immediate neighbourhood local
area and Britain as well as their relationships with neighbours and their satisfaction with the local
area
Civic Engagement ndash involvement in local affairs community decision making through formal roles
or groups and their ability to influence decisions affecting both the local area and Britain
Volunteering ndash involvement with groups clubs or organisations giving help through these groups
(known as formal volunteering) volunteering through work previous lapsed volunteering giving
help as an individual to someone who is not a relative (known as informal volunteering) and
charitable giving in the past four weeks
Social Action ndash awareness of local people getting involved in their local area to either set up a
new service or amenity stop the closure of a service or amenity stop something happening
helping to run a local service or amenity help to organise a community event such as a street
party or helping with any other issues affecting the local area whether the respondent is
personally involved in any of these activities what they do how they became involved why they
became involved and if they are not involved why they are not
Subjective Wellbeing and loneliness ndash the respondentrsquos feelings on aspects of their life
including the extent to which they feel the things they do in life are worthwhile levels of happiness
and satisfaction and feelings of anxiety and loneliness
Demographics Part Two ndash covers other demographic information such as the general health of
the respondent and their citizenship employment status education and income This section ends
by asking if the respondent would be happy to be recontacted in any follow up research
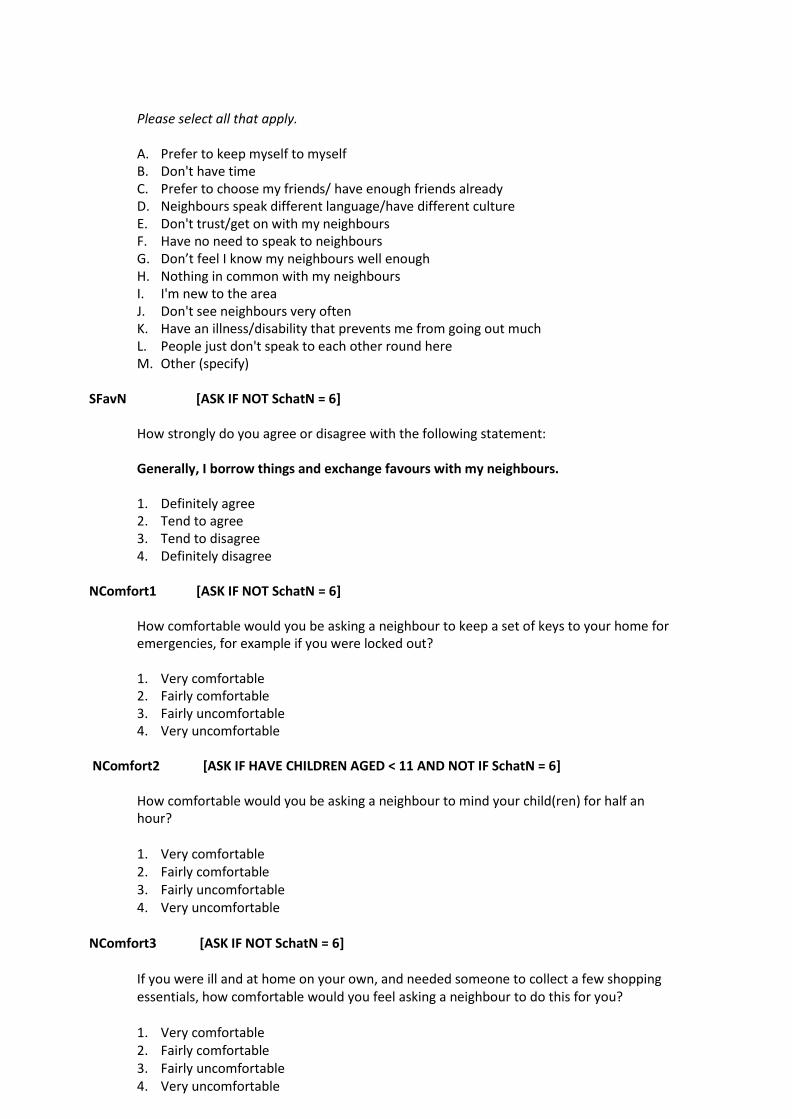
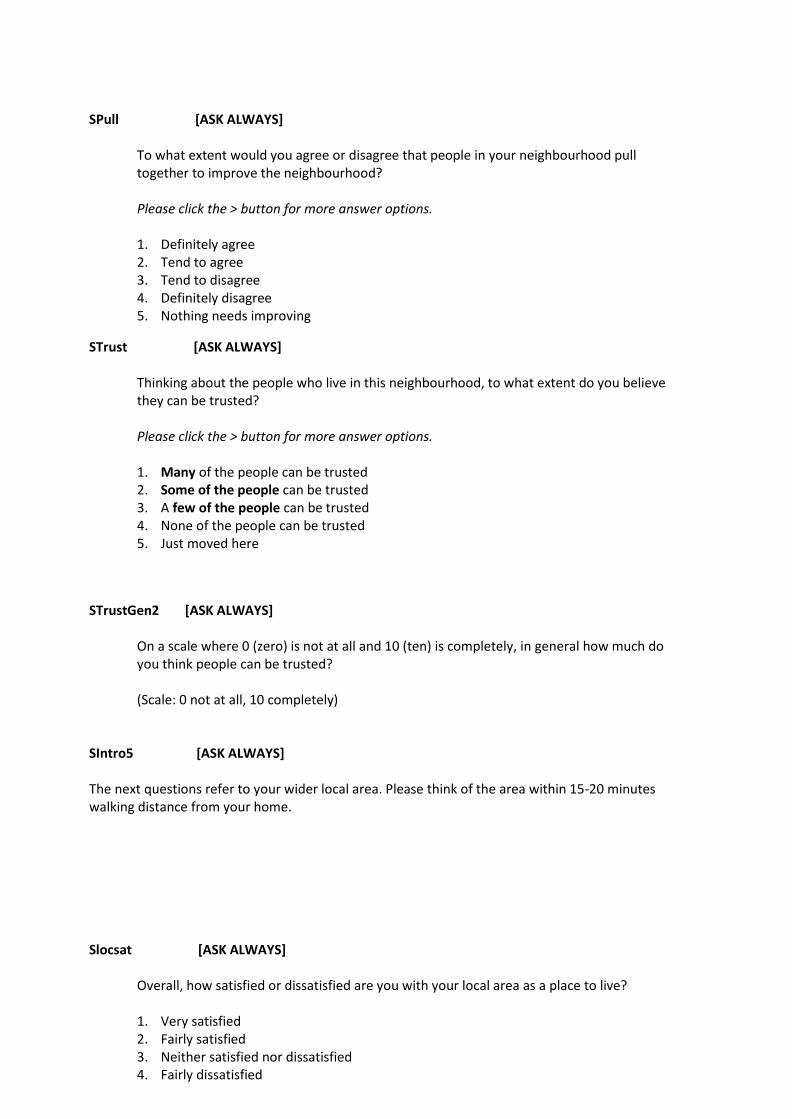
A copy of the online questionnaire can be found in Appendix A
For the online questionnaire ldquoDonrsquot knowrdquo and ldquoPrefer not to sayrdquo were presented on a second screen
for the majority of questions with the exception of a small number of more sensitive demographic
questions where they appear on the first screen For a few questions additional codes were also
included on a second screen These codes are included in the questionnaire in Appendix A If a
respondent clicked forward without selecting an answer then these answer codes would appear This
was done to replicate the initial face-to-face approach used in previous years where these codes
were not seen by respondents For full details please see the technical report for 2015-1618
Paper Questionnaire Content 201920
The paper version of the questionnaire covered a smaller subset of questions than the online survey
though still covered the same subject areas outlined in section 43 The paper questionnaire was
reduced in length as the time taken to complete the online survey averaged around half an hour
which was not deemed appropriate for a paper questionnaire
The question wording used in both the online and the paper versions of the questionnaire was the
same In total around 50 of the questions included in the online questionnaire were included in the
paper questionnaire
Given it is not possible to hide answer codes in paper questionnaires ldquoDonrsquot know and ldquoPrefer not to
sayrdquo answer codes were generally omitted from the paper questionnaire However given the sensitive
nature of the wellbeing and loneliness questions these options were retained for these questions
Respondents were also informed on the front page of the paper questionnaire that if they did not
remember know or want to answer a question then they could cross the relevant box where shown
or leave the question blank
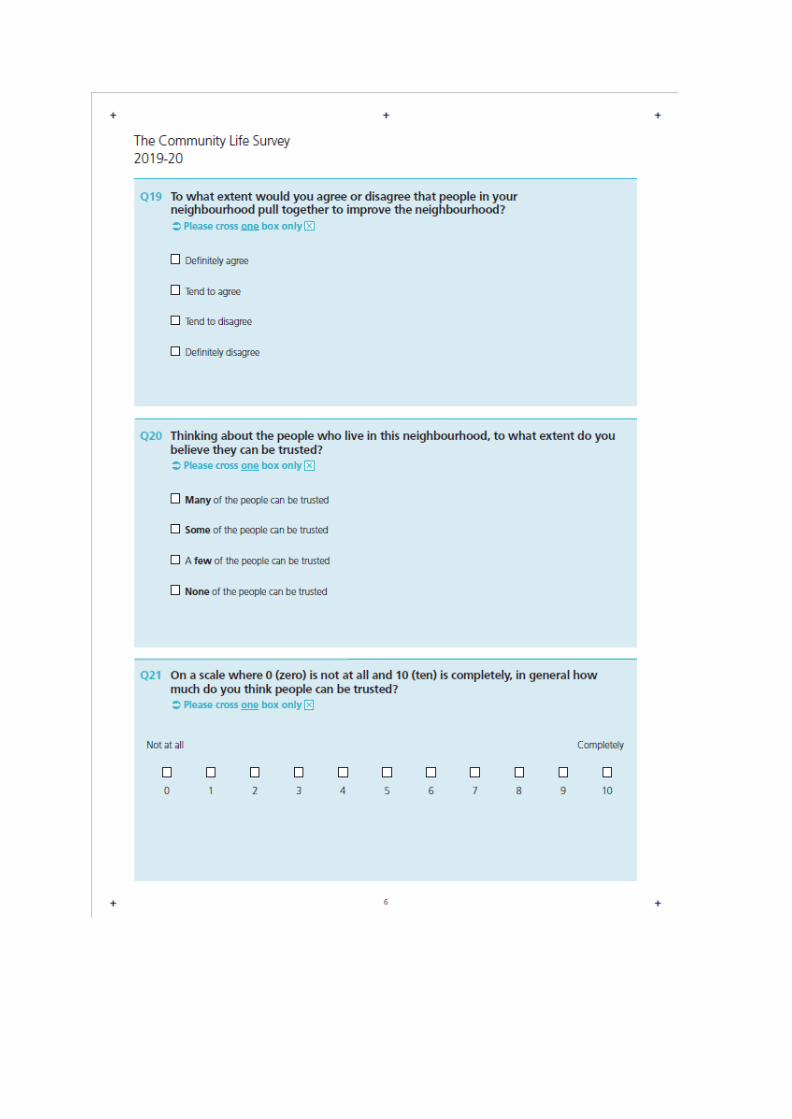
A copy of the paper questionnaire can be found in Appendix B
18 httpdocukdataserviceacukdoc8124mrdocpdf8124_community_life_web_survey_technical_report_2015-16_finalpdf
5 Fieldwork
Introduction
Fieldwork for the Community Life Survey 201920 was conducted between April 2019 and March
2020 with sample issued on a quarterly basis Each quarterrsquos sample was split into two batches the
first of which began at the start of the quarter and the second began midway through the quarter The
specific fieldwork dates for each quarter are shown below in table 51
Table 51 Fieldwork dates
Quarter Fieldwork start Fieldwork end
Quarter 1 24 April 2019 30 June 2019
Quarter 2 10 July 2019 29 September 2019
Quarter 3 2 October 2019 29 December 2019
Quarter 4 8 January 2020 29 March 2020
The paper questionnaire acted as an add-on to the online survey and was made available to around
60 of respondents at the second reminder stage based on the response probability strata as
descripted in section 331 The paper questionnaire was also available on request to all respondents
who preferred to complete the survey on paper or who were unable to complete online
Contact procedures
521 Online letters
All sampled addresses were sent a letter in a white envelope with an On Her Majesties Service logo
The letter invited up to four people aged 16 or over in the household to take part in the survey The
letter directed respondents to wwwcommlifecouk and provided information on how to log in to the
survey Four sets of unique reference numbers and passwords were provided to each address for the
respondents to log in with
The letter informed the resident(s) that they would be able to claim a pound10 shopping voucher after
completing the survey as a thank you for taking part (see section 54 for details of incentives) The
letter also provided an email address and freephone number for resident(s) to contact Kantar on in
case they wanted more information regarding the survey or needed to request a postal questionnaire
The back of the letter contained important information including the purpose of the survey how the
addresses were selected data protection the voluntary nature of the survey and the importance of
taking part It also included information for those respondents who wished to take part via postal
questionnaire informing them that if requested a paper version of the survey will be posted to them
along with a pre-paid envelope to allow it to be returned at no extra cost
Letters were posted on a Wednesday to allow for them to arrive by Friday to maximise responses
over the weekend
Two weeks after the initial invitation letters were sent a reminder letter was sent out to all addresses
where the survey had not been completed by all household members19
A further two weeks after the first reminder was sent out a second reminder was posted There were
three separate second reminder letters each with slightly different text One version contained one
postal questionnaire another had two postal questionnaires and the other was a reminder letter only
As outlined in table 52 below roughly 60 of these second reminders contained paper versions of
the questionnaire along with pre-paid return envelopes This is based on the response probability
strata (see section 23) The majority of households that received paper questionnaires with their
reminder letters received two copies Respondents state the number of adults in the household as
part of the survey so those with only one remaining household adult who has not completed the
survey receive one copy of the paper questionnaire Reminder letters were not sent to households
which had chosen to opt-out or had already requested paper questionnaires
Table 52 Breakdown of second reminder letters with paper questionnaires
Stratum (IMD) Method
1 (Lowest response probability strata) Paper questionnaires in all second reminders
2 Paper questionnaires in all second reminders
3 Paper questionnaires in 46 of second
reminders
4 No paper questionnaires in reminders
5 (Highest response probability strata) No paper questionnaires in reminders
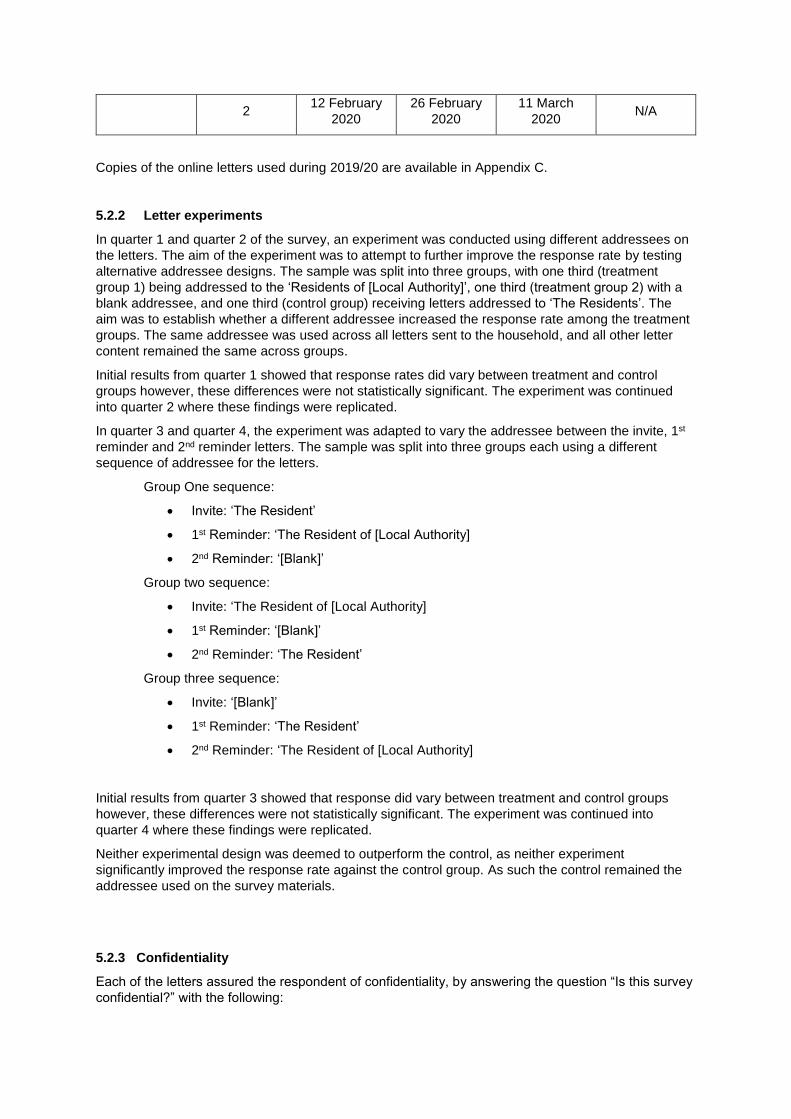
The specific dates for each letter dispatch over the 201920 survey year are outlined below in table
53
Table 53 Letter dispatch dates
Quarter Batch Initial letter
First
reminder
letter
Second
reminder
letter
Third
reminder
letter
Quarter 1
1 23 April 2019 8 May 2019 22 May 2019 NA
2 15 May 2019 29 May 2019 12 June 2019 NA
Quarter 2
1 10 July 2019 24 July 2019 7 August
2019 NA
2 14 August
2019
28 August
2019
11 September
2019 NA
Quarter 3
1 2 October
2019
16 October
2019
30 October
2019 NA
2 6 November
2019
20 November
2019
12 December
2019 NA
Quarter 4 1 8 January
2020
22 January
2020
5 February
2020 NA
19 The total number of household members is collected in the first interview completed
2 12 February
2020
26 February
2020
11 March
2020 NA
Copies of the online letters used during 201920 are available in Appendix C
522 Letter experiments
In quarter 1 and quarter 2 of the survey an experiment was conducted using different addressees on
the letters The aim of the experiment was to attempt to further improve the response rate by testing
alternative addressee designs The sample was split into three groups with one third (treatment
group 1) being addressed to the lsquoResidents of [Local Authority]rsquo one third (treatment group 2) with a
blank addressee and one third (control group) receiving letters addressed to lsquoThe Residentsrsquo The
aim was to establish whether a different addressee increased the response rate among the treatment
groups The same addressee was used across all letters sent to the household and all other letter
content remained the same across groups
Initial results from quarter 1 showed that response rates did vary between treatment and control
groups however these differences were not statistically significant The experiment was continued
into quarter 2 where these findings were replicated
In quarter 3 and quarter 4 the experiment was adapted to vary the addressee between the invite 1st
reminder and 2nd reminder letters The sample was split into three groups each using a different
sequence of addressee for the letters
Group One sequence
Invite lsquoThe Residentrsquo
1st Reminder lsquoThe Resident of [Local Authority]
2nd Reminder lsquo[Blank]rsquo
Group two sequence
Invite lsquoThe Resident of [Local Authority]
1st Reminder lsquo[Blank]rsquo
2nd Reminder lsquoThe Residentrsquo
Group three sequence
Invite lsquo[Blank]rsquo
1st Reminder lsquoThe Residentrsquo
2nd Reminder lsquoThe Resident of [Local Authority]
Initial results from quarter 3 showed that response did vary between treatment and control groups
however these differences were not statistically significant The experiment was continued into
quarter 4 where these findings were replicated
Neither experimental design was deemed to outperform the control as neither experiment
significantly improved the response rate against the control group As such the control remained the
addressee used on the survey materials
523 Confidentiality
Each of the letters assured the respondent of confidentiality by answering the question ldquoIs this survey confidentialrdquo with the following
ldquoYes The information that is collected will only be used for research and statistical purposes Your
name and address details are kept separate from your answers and will not be passed on to any
other organisation
No individual will be identifiable from the results Your answers will be combined with others that take
part in the survey You will not receive any lsquojunk mailrsquo as a result of taking partrdquo
Fieldwork figures
The next section outlines the fieldwork figures and response rates achieved on the 201920 survey
Figures from the online survey are outlined first followed by the paper figures and then both modes
combined
531 Online fieldwork
When discussing fieldwork figures in this section response rates are referred to in two different ways
Household response rate ndash This is the percentage of households contacted as part of the
survey in which at least one questionnaire was completed
Individual response rate ndash This is the estimated response rate amongst all adults that were
eligible to complete the survey
The target number of completed questionnaires required on the online survey over the 201920
survey year was 8000 equating to 2000 per quarter In total 31728 addresses were sampled20
from which 7849 interviews were achieved having removed 700 after validation checks21 At least
one interview was completed in 6938 households which represented an online household response
rate of 1685
In an online survey of this nature no information is known about the reason for non-response in each
individual household However it can be assumed that 8 of the addresses in the sample were not
residential and were therefore ineligible to complete the survey Once deadwood22 addresses are
accounted for the final online household response rate was 1831
The expected number of eligible individuals per residential address was averaged at 189 per
address therefore the total number of eligible adults sampled was 55169 The online survey was
completed by 7849 people indicating an online individual response rate of 1422
The full breakdown of the fieldwork figures and response rates are available in table 54
Table 54 Online response rates by quarter
Quarter
No of
sampled
addresses
No of
completed
questionnaires
No
households
completed
Household
response
rate (excl
deadwood)
Individual
response
rate (excl
deadwood)
Quarter 1 8102 1931 1332 1787 1371
Quarter 2 8100 2065 1398 1876 1466
20 For more information on the address sampling protocol please see section 33
21 For more information on the validation checks please see section 62
22 Deadwood refers to addresses which are not eligible to complete the survey such as second homes vacant properties or business addresses These addresses were not included in survey response rate calculations
ndash
Quarter 3 8089 1955 1327 1783 1390
Quarter 4 7437 1898 1289 1884 1468
Total 31728 7849 5346 1831 1422
532 Paper fieldwork
Over the course of the 2019-20 survey year 355 paper questionnaires were requested across 260
households This represented about 1 of the overall sampled households Paper questionnaires
were returned by 189 respondents making a response rate of 5323 amongst those who requested
a paper version of the questionnaire
The number of paper questionnaires returned over the survey year including both those requested by
respondents and those included within the second reminder is shown in table 55
Table 55 Number of paper questionnaires returned by quarter
Quarter No of paper questionnaires returned by
quarter
Quarter 1 613
Quarter 2 670
Quarter 3 581
Quarter 4 530
Total 2394
533 Combined fieldwork figures
By combining the 7849 completed online surveys and the 2394 returned paper questionnaires the
total number of interviews completed for the 201920 survey stands at 10243 interviews The
combined household response rate including online and paper interviews therefore reached 2186
and after accounting for deadwood addresses the overall household response rate was 2377 The
overall individual response rate was 1857
The overall fieldwork figures including online and paper interviews are broken down by quarter in
table 56
Table 56 Combined online and paper fieldwork figures by quarter
Quarter
No of
sampled
addresses
No of
interviews
achieved
online + paper
No
households
completed
Household
response
rate (excl
deadwood)
Individual
response
rate (excl
deadwood)
Quarter 1 8102 2544 1732 2324 1806
Quarter 2 8100 2735 1851 2484 1942
Quarter 3 8089 2536 1714 2303 1803
Quarter 4 7437 2428 1641 2398 1878
Total 31728 10243 6938 2377 1857
53 Combined fieldwork figures ndash weighted
Due to the sample approach which targets certain ethnic groups23 addresses with a lower than
average expected response probability were over sampled As a result this means the response rate
is not population-representative However weighting can rectify this resulting in a population-
representative 158 individual response rate for online only and a population-representative overall
(online or paper) individual response rate of 194
Incentive system
All respondents that completed the Community Life Survey were given a pound10 shopping voucher as a
thank you for taking part
541 Online incentives
The pound10 incentive available to respondents who completed the survey online comprised online
vouchers which were provided by email or gift cards which were sent in the post Online vouchers
were emailed to respondents within 24 hours whilst paper vouchers were sent in the post and arrived
within one week of the order Online survey respondents could choose which voucher they received
from a choice of four
541 Paper incentives
Respondents who returned the paper questionnaire were also provided with a pound10 shopping voucher
This voucher was sent in the post and could be used at a variety of high street stores Once the
completed questionnaire was returned by the respondent vouchers were posted to them within five
working days
Survey length
The median completion length of the online surveys with outliers excluded24 was 28 minutes and 30 seconds and the mean was 33 minutes and 06 seconds25 This is based on full surveys and does not include partial completions
23 For more information on the sample design please see sections 31-34
24 Cases with a completion time of less than 10 minutes or greater than 150 minutes were removed from the calculation
25 This figure is calculated by removing outliers which were any interviews shorter than 10 minutes or longer than 150 minutes
6 Data Processing
Editing
Online
Where clearly relevant the Computer Assisted Web Interviewing program (CAWI) specified numerical
ranges to ensure answers were sensible Logic checks were also scripted to check answers that may
not be feasible eg if the respondent coded they are an employee initially but self-employed at a
subsequent question
Paper
With paper questionnaires there are a number of completion errors in the data that need to be
resolved These errors generally arise for the following reasons
Cases where the individual selects more than one response to a single coded question
Cases where individuals can select more than one response however they select two conflicting answers such as none of these and a valid survey response
Cases where responses are left blank even though the respondent should have answered the question
Cases where the individual fails to select an answer for a filter question but then provides an answer for subsequent questions relating to the filter question
In these situations respondents were coded as system missing (either Donrsquot know or Refused)
Data Quality
With interview-based surveys we have confidence that almost all the data is collected in a controlled
manner and from the right individual
With most self-completion survey methods there is no interviewer to do this work so it must be
accomplished via other methods With that in mind an algorithm to validate responses post-fieldwork
was used
The algorithm utilises relevant classic indicators of proxy careless or fraudulent completion including
(i) inconsistencies in household data when multiple completed questionnaires have been received
from the same household (ii) use of the same email address by multiple respondents when providing
the necessary details to receive the incentive (iii) suspiciously short completion times and (iv)
excessive missing data rates
Other indicators such as flat-lining through question sets with the same response codes were not
included as the questionnaire uses very few grid style questions
This approach led us to remove c6 of cases from the 201920 Community Life survey a rate that is
low enough for us to be largely confident of the datarsquos veracity
Coding
Post-interview coding was undertaken by members of the Kantar coding department The code
frames are set-up to match those used in the face-to-face version of the survey The coding
department coded verbatim responses recorded for fully open questions and lsquoother specifyrsquo
questions as well as occupation classifications
Occupation and socio-economic class
Occupation details were collected for the respondent and were coded according to the Standard
Occupational Classification (2010) This was carried out by coders at Kantar using the computer-
assisted coding process CASCOT Respondents were also coded according to Standard Industrial
Classification (2010) and NS-SEC was derived from industry and occupation details
Derived variables
A list of the main derived variables is provided in Appendix D
The following geo-demographic variables were added to the data
Region (formerly Government Office Region)
Urbanrural indicator
Percentage of households in the Ward headed by someone from a non-white ethnic minority group
Inner city PSU indicator
Police Force Area
ACORN classification
ONS ward classification
Health board
Primary Care Organisation
LSOA area
ONS district level classification
Output area classification
Index of Multiple Deprivation for England
Income deprivation for England
Employment deprivation for England
Health deprivation for England
Education Skills and Training deprivation for England
Barriers to housing and services deprivation for England
Crime and disorder deprivation for England
Living and environment deprivation for England
Data outputs
The Department for Digital Culture Media and Sport received a full de-identified cumulative SPSS
dataset including derived geo-demographic and weighting variables at the end of the survey year
Non-disclosive data for the 201920 online survey will be made available to download through the UK
Data Service in autumn 2020 (httpdiscoverukdataserviceacuk)
7 Weighting
The Community Life Survey data has been weighted to compensate for variations in sampling
probability and also to partially compensate for variations in response probability within the
population A weight has been produced for use with data collected from both the online and paper
questionnaires and another weight has been produced for use with data collected only from the online
questionnaire In both cases the inferential population is lsquoall adults in England aged 16+ and living in
a private residencersquo
Step 1 was to calculate an address sampling weight This is equal to one divided by the address
sampling probability This sampling probability varied between the ten ethnic mix strata but did not
vary within these strata
Step 2 was to model the expected number of completed questionnaires from each sampled address
as a function of
(i) lsquoethnic mixrsquo stratum
(ii) lsquoexpected responsersquo stratum
(iii) the prior expected number of residents aged 16+26
(iv) region
(v) a set of six orthogonally rotated principal components (or lsquofactorsrsquo) describing census population
distributions for the local LSOA
Based on this (count-based GLM) model the expected number of completed questionnaires (online
or paper) and the expected number of online questionnaires was estimated for each sampled
address An address response weight was calculated equal to
1(expected number of completed questionnaires prior expected number of residents aged 16+))
For online-only data this formula was the same except that the expected number of completed
questionnaires was replaced by the expected number of completed online questionnaires
The product of the weights produced from steps 1 and 2 was used as a base weight for step 3
calibrating the sample to population totals Because step 2 produces a different address response
weight for onlinepaper data than it does for online-only data there are two base weights ndash one for
onlinepaper data and one for online-only data Consequently step 3 produces two calibration
weights as well
The data was calibrated to ensure the weighted sample matched population totals for seven
dimensions
(i) genderage group
26 This was estimated based on a separate Kantar analysis of response and survey data from the 2015-17 Crime Survey of England amp Wales (England-only subset)
-
(ii) degree level educationage group
(iii) housing tenure
(iv) region
(v) household size
(vi) ethnic group and
(vii) internet usageage group
The population totals were drawn from the ONS Labour Force Survey (LFS) of October to December
2019 which is itself weighted to ONS population estimates for England (for gender age and region)
The exception was dimension (vii) ndash internet usage by age group ndash for which the distributional data
comes from the January to March 2019 LFS Internet usage is only collected in the January to March
edition of the LFS
Table 71 Population per age band
Age band LFS Oct Dec 2019 total
16 to 19 2398020
20 to 24 3389995
25 to 29 3765664
30 to 34 3805238
35 to 39 3719625
40 to 44 3418887
45 to 49 3662802
50 to 54 3869915
55 to 59 3687495
60 to 64 3134142
65 to 69 2781521
70 to 74 2768050
75+ 4514151
Table 72 Population by age band and gender
-
-
Age band LFS Oct Dec 2019 total
Males Females
16-24 2957616 2830399
25-34 3813348 3757554
35-44 3539287 3599225
45-54 3714247 3818470
55-64 3350985 3470652
65-74 2669363 2880208
75+ 1999126 2515025
Table 73 Population within region
Region LFS Oct Dec 2019 total aged 16+
North East 2147383
North West 5824822
Yorkshire amp Humberside 4381611
East Midlands 3864284
West Midlands 4689718
East 4990253
London 7142245
South East 7322948
South West 4552241
Table 74 Highest educational level crossed by age (25-64 only)
- -
-
-
-
Age group LFS Oct Dec 2019 total with a Degree LFS Oct Dec 2019 total with
no Degree
25-29 1689464 2076200
30-39 3436419 4088444
40-49 2817245 4264444
50-64 2902407 7789145
Table 75 Housing tenure
Housing tenure LFS Oct Dec 2019 total aged 16+
Living in property owned outright 14715140
Living in property owned with mortgage 15537773
Living in property with other tenure 14662591
Table 76 Household size
Household size (all residents) LFS Oct Dec 2019 total aged 16+
1 7891739
2+ 37023766
Table 77 Ethnic group
Ethnic group LFS Oct Dec 2019 total aged 16+
White 38813585
Indian 1177999
PakistaniBangladeshi 1243016
Black 1571442
Other 2109464
Table 78 Internet usage crossed by age
- -Internet usageage LFS Oct Dec 2019 total based on Jan Mar
2019 distributional data aged 16+
Aged 16-64 34851783
Aged 65-74 some internet usage 4835568
Aged 65-74 no internet usage 714003
Aged 75+ some internet usage 2452178
Aged 75+ no internet usage 2061973
One way of assessing the impact of weighting the data is to estimate the weighting efficiency for each
subpopulation in the seven-dimension weighting matrix In effect this weighting efficiency illustrates
the impact of the other six weighting dimensions and reflects the amount of weighting that is required
for each subpopulation The more weighting that is required the less representative the unweighted
responding sample is likely to be This will be partly due to variations in sampling probability within
each subpopulation but also due to variations in response probability
Weighting efficiency is equal to one divided by the design effect due to weighting The design effect
due to weighting is equal to 1+[(sgmg)2] where sg is the standard deviation of the weights within
subpopulation g and mg is the mean weight within subpopulation g Weighting efficiency is also equal
to the effective sample size divided by the actual sample size where effective sample size accounts
only for the weighting and not for other design aspects such as sample stratification and clustering
The overall weighting efficiency was 73 It was slightly higher 76 for the online-only weight
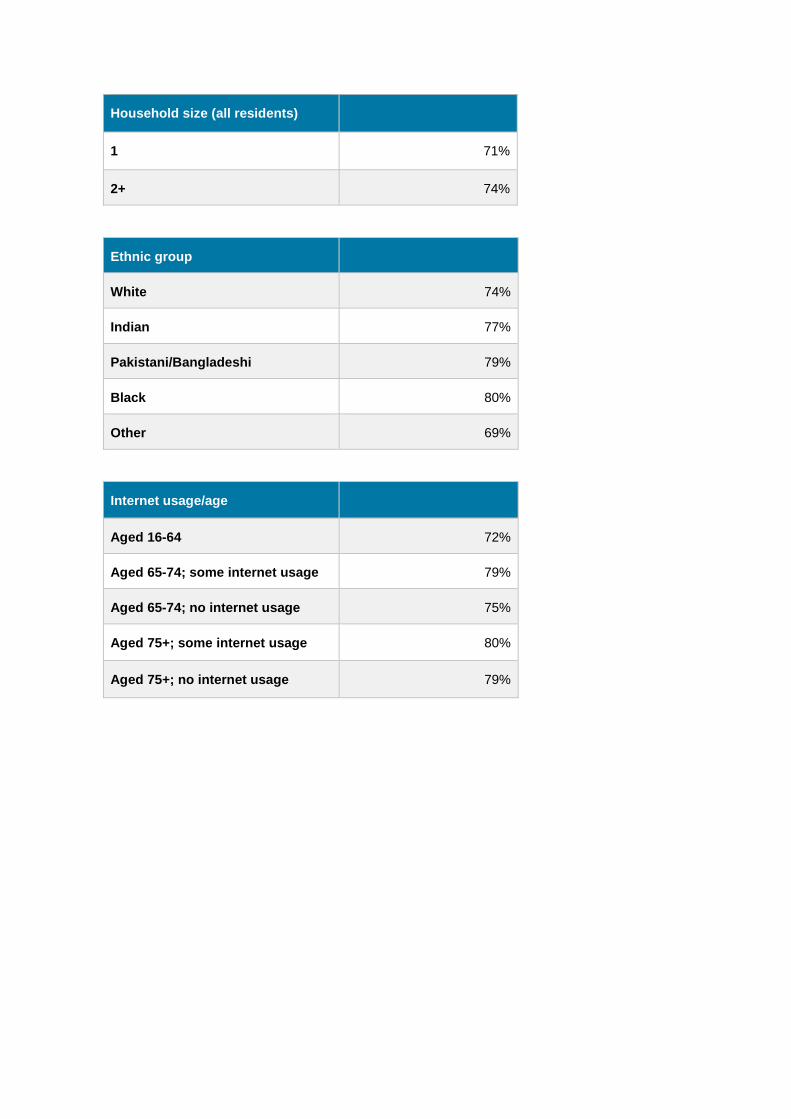
Table 79 Weighting efficiencies for marginal subpopulations defined in the weighting matrix
Age band Gender
Males Females
16-24 75 75
25-34 74 73
35-44 74 72
45-54 76 76
55-64 76 77
65-74 79 78
75+ 79 77
Region
North East 83
North West 77
Yorkshire amp Humberside 78
East Midlands 74
West Midlands 74
East 79
London 82
South East 77
South West 83
Age group Degree No degree
25-29 71 75
30-39 69 75
40-49 72 74
50-64 74 77
Housing tenure
Living in property owned outright 75
Living in property owned with
mortgage
77
Living in property with other
tenure
73
Household size (all residents)
1 71
2+ 74
Ethnic group
White 74
Indian 77
PakistaniBangladeshi 79
Black 80
Other 69
Internet usageage
Aged 16-64 72
Aged 65-74 some internet usage 79
Aged 65-74 no internet usage 75
Aged 75+ some internet usage 80
Aged 75+ no internet usage 79
8 Standard errors
Introduction
The tables in this chapter show estimates of standard errors for key variables with the survey
Sources of error in surveys
Survey results are subject to various sources of error Error can be divided into two types systematic
and random error
Systematic error
Systematic error or bias covers those sources of error that will not average to zero over repeats of the
survey Bias may occur for example if a part of the population is excluded from the sampling frame
or because respondents to the survey are different from non-respondents with respect to the survey
variables It may also occur if the instrument used to measure a population characteristic is imperfect
Substantial efforts have been made to avoid such systematic errors For example the sample has
been drawn at random from a comprehensive frame two modes and multiple reminders have been
used to encourage response and all elements of the questionnaire were thoroughly tested before
being used
Random error
Random error is always present to some extent in survey measurement If a survey is repeated
multiple times minor differences will be present each time due to chance Over multiple repeats of the
same survey these errors will average to zero The most important component of random error is
sampling error which is the error that arises because the estimate is based on a random sample
rather than a full census of the population The results obtained for a single sample may by chance
vary from the true values for the population but the error would be expected to average to zero over a
large number of samples The amount of between-sample variation depends on both the size of the
sample and the sample design The impact of this random variation is reflected in the standard errors
presented here
Random error may also follow from other sources such as variations in respondentsrsquo interpretation of
the questions or variations in the way different interviewers ask questions Efforts are made to
minimise these effects through pilot work and interviewer training
Standard errors for complex sample designs
The Community Life Survey employs a systematic sample design and the data is both clustered by
address and weighted to compensate for non-response bias These features will impact upon the
standard errors for each survey estimate in a unique way Generally speaking systematic sampling
will reduce standard errors while data clustering and weighting will increase them If the complex
sample design is ignored the standard errors will be wrong and usually too narrow
The standard errors quoted below have been estimated using the SPSS Complex Samples module
which employs a Taylor Series Expansion method to do this The tables include a lsquodesign factorrsquo
which is the ratio of the estimated standard error to the standard error we would obtain if we ignored
the sample design In general this averages at approximately 13 but varies somewhat between
survey variables
Table 81 Participation in civic engagement and voluntary activities
Characteristic Population Weighted
percent ()
Unweighted
base
(affirmative
response)
Standard
error
Design
factor
(deft)
Percentage Number Percentage Number
Participation in civic engagement or voluntary activities
Those taking part
at least once a
month in
Informal
volunteering
All 28 2904 06 122
Formal
volunteering
All 23 2281 05 128
Any volunteering All 39 4007 06 125
Those taking part
at least once in
the last 12
months in
Civic participation All 41 4278 06 129
Civic consultation All 21 2203 05 124
Civic activism All 8 906 3 117
Informal
volunteering
All 53 5507 06 125
Formal
volunteering
All 37 3776 06 128
Any volunteering All 64 6532 6 126
Table 82 Participation in civic engagement and formal volunteering at least once in the last year by sex age ethnicity and disability
Characteristics Population Weighted
percent ()
Unweighted
base
(affirmative
response)
Standard
error
Design
factor
(deft)
Percentage Number Percentage Number
Civic Participation Male 41 1915 09 122
Female 41 2327 08 120
16-24 37 370 19 126
25-34 44 785 15 126
35-49 45 1167 12 121
50-64 42 1020 12 120
65-74 40 631 15 118
75+ 28 277 18 115
White 41 3499 07 126
Asian 39 292 23 132
Black 33 134 29 123
Mixed 37 166 30 134
Other 29 35 47 112
Limiting Long
Term Limiting
Illness (LLTI)
Disability27
45 915 13 116
No LLTI
Disability
42 2595 08 124
27 All LLTIDisability calculations based on online only data
Civic consultation Male 21 1016 07 116
Female 21 1168 06 119
16-24 15 146 13 117
25-34 17 319 11 122
35-49 23 598 10 122
50-64 23 561 10 120
65-74 25 392 14 122
75+ 19 173 16 118
White 21 1786 06 122
Asian 19 140 17 124
Black 21 82 24 118
Mixed 19 85 24 134
Other 21 31 41 110
LLTI Disability 23 461 11 116
No LLTI
Disability
21 1297 06 116
Civic activism Male 8 410 05 113
Female 8 483 04 114
16-24 5 63 08 106
25-34 6 122 07 116
35-49 8 215 06 114
50-64 8 210 06 115
65-74 12 185 10 120
75+ 10 104 12 112
White 8 703 03 115
Asian 9 60 14 136
Black 11 45 16 107
Mixed 9 49 15 114
Other 9 9 32 121
LLTI Disability 10 213 08 112
No LLTI
Disability
8 495 04 117
Formal volunteering Male 36 1635 09 120
Female 39 2110 08 118
16-24 40 376 19 122
25-34 29 529 14 127
35-49 41 1020 12 123
50-64 37 903 12 122
65-74 42 625 15 119
75+ 33 294 19 118
White 38 3027 07 126
Asian 35 276 22 128
Black 39 153 29 118
Mixed 32 148 31 142
Other 34 38 59 136
LLTI Disability 39 757 13 118
No LLTI
Disability
41 2440 08 124
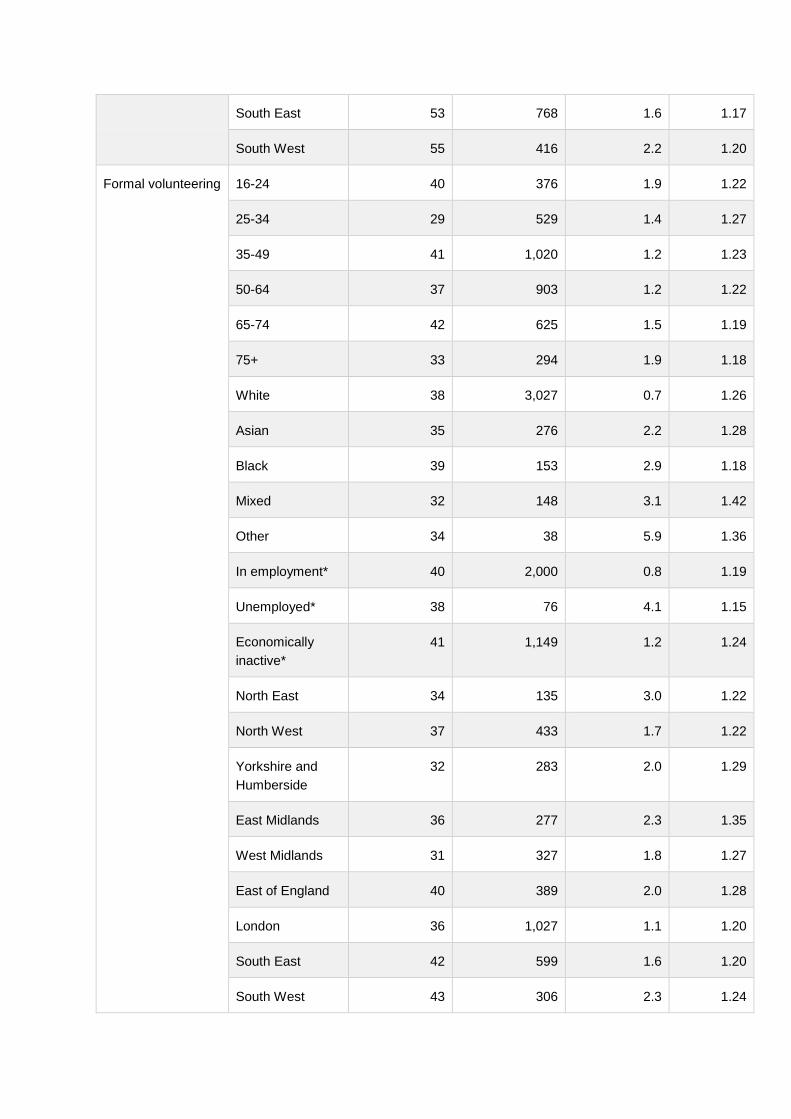
Table 83 Informal or formal volunteering within the last month and the last 12 months broken down by age ethnicity employment status and region
Characteristics Population Weighted
percent ()
Unweighted
base
(affirmative
response)
Standard
error
Design
factor
(deft)
Percentage Number Percentage Number
At least once a
month
Informal
volunteering
16-24 30 306 17 119
25-34 24 418 12 122
35-49 24 635 10 120
50-64 27 694 10 114
65-74 36 532 15 120
75+ 33 291 19 118
White 28 2295 06 120
Asian 27 212 19 118
Black 37 140 27 111
Mixed 28 126 27 128
Other 34 43 52 120
In employment28 26 1247 07 115
Unemployed 25 49 35 108
Economically
inactive
35 938 11 121
North East 28 113 27 116
North West 30 355 16 115
Yorkshire and
Humberside
31 270 18 117
East Midlands 26 220 18 120
West Midlands 28 298 16 118
28 All in employmentunemployedeconomically inactive calculations based on online only data
East of England 26 253 17 124
London 28 788 10 118
South East 27 390 14 116
South West 27 211 19 115
Formal volunteering 16-24 23 216 16 121
25-34 16 279 11 123
35-49 21 520 10 125
50-64 23 575 10 122
65-74 31 455 14 121
75+ 25 219 17 119
White 23 1901 06 126
Asian 15 117 15 122
Black 24 90 25 117
Mixed 19 86 25 135
Other 18 19 54 155
In employment 22 1094 07 120
Unemployed 19 38 33 112
Economically
inactive
29 783 11 124
North East 22 90 25 119
North West 23 268 16 128
Yorkshire and
Humberside
20 179 16 121
East Midlands 20 168 18 125
West Midlands 19 189 16 130
East of England 25 245 16 120
London 20 577 09 119
South East 26 367 14 121
South West 28 198 21 126
At least once in
the last year
Informal
volunteering
16-24 48 492 20 123
25-34 49 881 15 122
35-49 55 1424 12 123
50-64 53 1304 12 116
65-74 61 908 15 117
75+ 52 463 20 117
White 53 4358 07 123
Asian 52 414 22 122
Black 60 238 28 116
Mixed 48 229 33 141
Other 54 65 57 125
In employment 54 2685 08 119
Unemployed 55 103 42 113
Economically
inactive
56 1549 11 122
North East 52 203 29 115
North West 53 626 17 118
Yorkshire and
Humberside
51 453 20 119
East Midlands 52 419 21 122
West Midlands 55 578 20 130
East of England 52 515 20 125
London 53 1529 12 123
South East 53 768 16 117
South West 55 416 22 120
Formal volunteering 16-24 40 376 19 122
25-34 29 529 14 127
35-49 41 1020 12 123
50-64 37 903 12 122
65-74 42 625 15 119
75+ 33 294 19 118
White 38 3027 07 126
Asian 35 276 22 128
Black 39 153 29 118
Mixed 32 148 31 142
Other 34 38 59 136
In employment 40 2000 08 119
Unemployed 38 76 41 115
Economically
inactive
41 1149 12 124
North East 34 135 30 122
North West 37 433 17 122
Yorkshire and
Humberside
32 283 20 129
East Midlands 36 277 23 135
West Midlands 31 327 18 127
East of England 40 389 20 128
London 36 1027 11 120
South East 42 599 16 120
South West 43 306 23 124
Table 84 Any volunteering in the last year broken down by sex age and region
Characteristic Population Weighted
percent ()
Unweighted
base
(affirmative
response)
Standard
error
Design
factor
(deft)
Percentage Number Percentage Number
Any formal or
informal
volunteering at
least once in last
year
Male 61 2813 09 121
Female 66 3658 08 120
16-24 63 625 18 119
25-34 60 1056 14 123
35-49 67 1694 11 121
50-64 63 1548 12 119
65-74 70 1052 14 116
75+ 57 511 20 119
North East 61 237 30 120
North West 65 751 16 116
Yorkshire and the
Humber
59 527 20 123
East Midlands 62 493 22 127
West Midlands 63 655 19 130
East of England 64 639 19 128
London 63 1797 11 123
South East 66 940 15 122
South West 67 493 20 126
Table 85 Whether gave to charity in the last four weeks broken down by sex age ethnicity and region
Characteristics Population Weighted
percent ()
Unweighted
base
(affirmative
response)
Standard
error
Design
factor
(deft)
Percentage Number Percentage Number
Gave to charity in
the last 4 weeks
Male 70 3199 09 127
Female 79 4270 07 122
16-24 55 559 20 123
25-34 66 1164 15 134
35-49 77 1906 10 125
50-64 79 1906 10 119
65-74 84 1261 11 120
75+ 85 705 16 127
White 75 6039 06 133
Asian 73 569 20 128
Black 70 274 29 125
Mixed 70 343 32 147
Other 56 68 56 122
North East 74 279 25 112
North West 75 870 18 141
Yorkshire and the
Humber
74 637 20 134
East Midlands 73 601 20 126
West Midlands 74 759 17 127
East of England 75 752 19 138
London 72 2014 11 129
South East 77 1088 14 129
South West 75 553 20 126
Table 86 Banded amount given to charity in the four weeks prior to interview
Characteristic Population Weighted
percent ()
Unweighted
base
(affirmative
response)
Standard
error
Design
factor (deft)
Percentage Number Percentage Number
Banded amount
given to charity
pound0-pound4 All 13 693 5 118
pound5-pound9 All 18 953 6 118
pound10-pound19 All 27 1435 7 118
pound20-pound49 All 27 1509 7 118
Over pound50 All 15 854 6 118
Table 87 Whether aware of or involved in social action broken down by sex and age
Characteristic Population Weighted
percent ()
Unweighted
base
(affirmative
response)
Standard
error
Design factor
(deft)
Percentage Number Percentage Number
Aware of social
action29
Male 31 1132 09 117
Female 33 1406 09 117
16-24 27 226 18 117
25-34 25 379 14 120
35-49 33 712 12 117
50-64 34 646 13 115
29 Based on online only data
65-74 39 406 17 115
75+ 38 160 27 114
All 32 2546 07 128
Involved in social
action
Male 16 763 07 119
Female 16 870 06 119
16-24 14 130 14 123
25-34 11 203 09 118
35-49 17 422 09 124
50-64 17 414 09 120
65-74 24 334 13 122
75+ 17 138 15 118
All 16 1651 05 127
Table 88 The extent to which people agree that people in their neighbourhood pull together to improve the area
Characteristic Population Weighted
percent ()
Unweighted
base
(affirmative
response)
Standard
error
Design
factor
(deft)
Percentage Number Percentage Number
Whether agree or
disagree that people
in this
neighbourhood pull
together to improve
the neighbourhood
Definitely agree 14 1333 04 128
Tend to agree 45 4365 06 128
Tend to
disagree
28 2976 06 128
Definitely
disagree
13 1395 04 128
Agree 59 5698 07 133
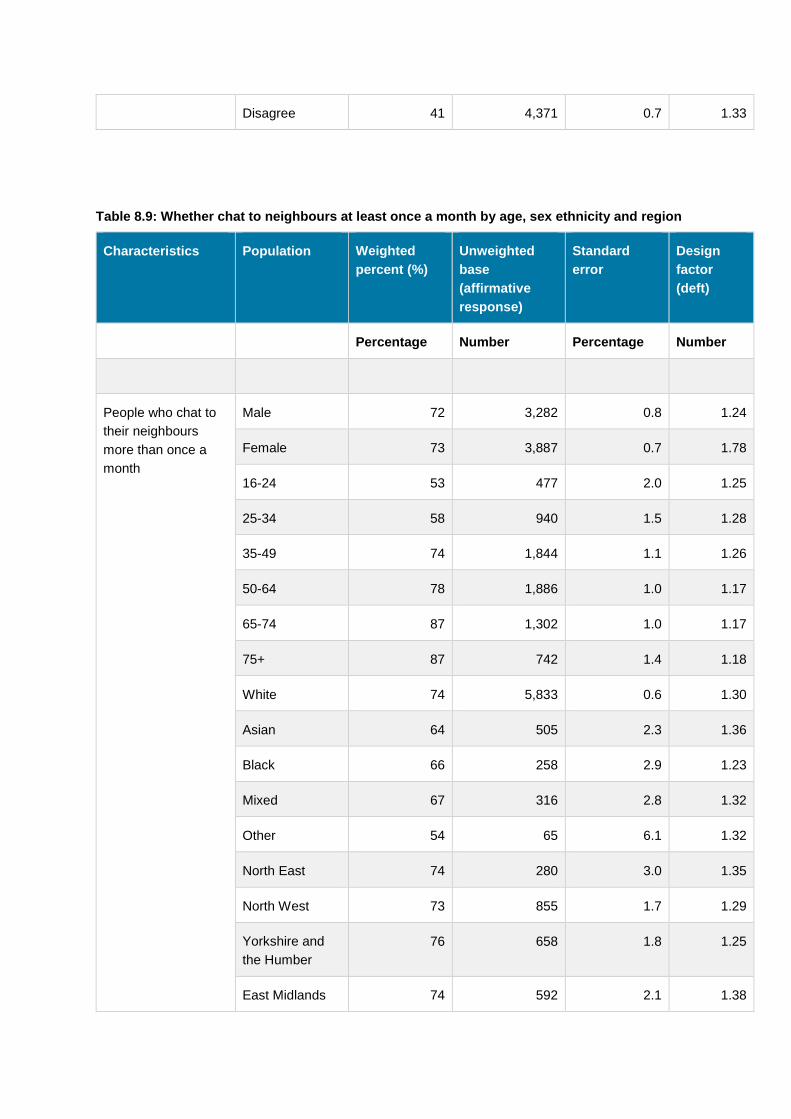
Disagree 41 4371 07 133
Table 89 Whether chat to neighbours at least once a month by age sex ethnicity and region
Characteristics Population Weighted
percent ()
Unweighted
base
(affirmative
response)
Standard
error
Design
factor
(deft)
Percentage Number Percentage Number
People who chat to
their neighbours
more than once a
month
Male 72 3282 08 124
Female 73 3887 07 178
16-24 53 477 20 125
25-34 58 940 15 128
35-49 74 1844 11 126
50-64 78 1886 10 117
65-74 87 1302 10 117
75+ 87 742 14 118
White 74 5833 06 130
Asian 64 505 23 136
Black 66 258 29 123
Mixed 67 316 28 132
Other 54 65 61 132
North East 74 280 30 135
North West 73 855 17 129
Yorkshire and
the Humber
76 658 18 125
East Midlands 74 592 21 138
West Midlands 75 770 17 125
East of England 74 725 18 132
London 65 1822 11 126
South East 71 994 15 125
South West 76 553 20 129
Table 810 Whether people feel they belong strongly to their neighbourhood or Britain
Characteristic Population Weighted
percent ()
Unweighted
base
(affirmative
response)
Standard
error
Design
factor
(deft)
Percentage Number Percentage Number
Whether feel they
belong strongly to
Britain30
Veryfairly
strongly
84 6429 06 127
Not very
strongly
12 1061 05 127
Not at all
strongly
4 330 3 127
Whether feel they
belong strongly to
their neighbourhood
Veryfairly
strongly
63 6216 06 123
Not very
strongly
27 2875 06 123
Not at all
strongly
10 1112 04 123
Table 811 Whether people feel they belong strongly to their neighbourhood or Britain by sex age and ethnicity
Characteristic Population Weighted
percent ()
Unweighted
base
(affirmative
response)
Standard
error
Design
factor
(deft)
30 Based on online only data
Percentage Number Percentage Number
Strongly belong to
Britain
Male 83 2911 07 118
Female 85 3498 06 112
16-24 78 665 16 117
25-34 76 1088 14 128
35-49 80 1691 10 118
50-64 87 1572 09 111
65-74 92 968 09 108
75+ 96 399 10 100
White 84 5163 06 122
Asian 85 607 16 119
Black 86 217 23 107
Mixed 77 159 33 112
Other 78 62 57 121
Strongly belong to
local neighbourhood
Male 62 2737 09 122
Female 63 3413 08 120
16-24 55 517 21 129
25-34 51 859 15 129
35-49 63 1569 12 124
50-64 65 1542 12 120
65-74 71 1067 14 120
75+ 73 612 18 119
White 63 4879 07 129
Asian 67 512 22 129
Black 62 242 30 122
Mixed 63 298 29 130
Other 44 54 58 126
Table 812 Satisfaction with local area as a place to live
Characteristics Population Weighted
percent ()
Unweighted
base
(affirmative
response)
Standard
error
Design
factor
(deft)
Percentage Number Percentage Number
Satisfaction with
local area
Veryfairly
satisfied
76 7572 05 122
Neither satisfied
nor dissatisfied
15 1580 04 122
Very Fairly
dissatisfied
9 1068 04 122
Table 813 Community cohesion by sex age ethnicity and region
Characteristics Population Weighted
percent ()
Unweighted
base
(affirmative
response)
Standard
error
Design
factor
(deft)
Percentage Number Percentage Number
Agree that people
from different
backgrounds get on
Male 81 3673 07 126
Female 82 4472 06 123
well together in the
local area 16-24 80 788 17 128
25-34 77 1380 14 136
35-49 82 2055 10 128
50-64 83 1976 09 117
65-74 85 1253 11 116
75+ 87 725 14 122
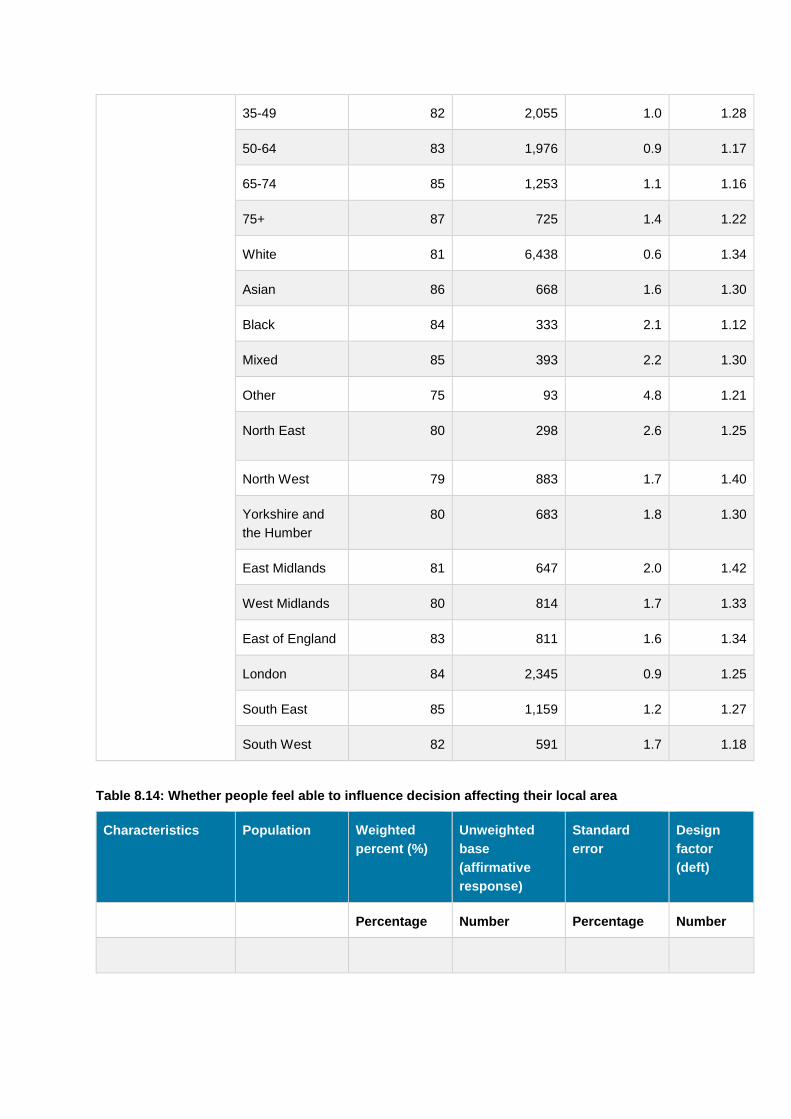
White 81 6438 06 134
Asian 86 668 16 130
Black 84 333 21 112
Mixed 85 393 22 130
Other 75 93 48 121
North East 80 298 26 125
North West 79 883 17 140
Yorkshire and
the Humber
80 683 18 130
East Midlands 81 647 20 142
West Midlands 80 814 17 133
East of England 83 811 16 134
London 84 2345 09 125
South East 85 1159 12 127
South West 82 591 17 118
Table 814 Whether people feel able to influence decision affecting their local area
Characteristics Population Weighted
percent ()
Unweighted
base
(affirmative
response)
Standard
error
Design
factor
(deft)
Percentage Number Percentage Number
Able to influence
decision affecting
their local area
Yes able to
influence
decisions
27 2827 06 128
Table 815 Whether able to influence decisions affecting their local area by sex age and ethnicity
Characteristics Population Weighted
percent ()
Unweighted
base
(affirmative
response)
Standard
error
Design
factor
(deft)
Percentage Number Percentage Number
Able to influence
decisions affect their
local area
Male 26 1236 08 119
Female 27 1555 07 120
16-24 26 265 16 115
25-34 24 454 13 124
35-49 30 809 11 124
50-64 29 706 11 119
65-74 24 371 13 120
75+ 23 205 17 115
White 25 2037 06 125
Asian 35 274 20 120
Black 45 167 32 125
Mixed 33 171 28 128
Other 44 55 56 122
Table 816 How important it is to be able to influence decisions affecting their local area
Characteristics Population Weighted
percent ()
Unweighted
base
(affirmative
response)
Standard
error
Design
factor
(deft)
Percentage Number Percentage Number
How important it is to
be able to influence
decisions affecting
the local area
Important 57 5922 06 131
Not important 43 4232 06 131
Table 817 Whether people would like to be more involved in decisions made by their local council
Characteristics Population Weighted
percent ()
Unweighted
base
(affirmative
response)
Standard
error
Design
factor
(deft)
Percentage Number Percentage Number
Whether would like
to be more involved
in decision made by
the local council31
Yes 53 4383 07 129
No 45 3265 07 129
Depends on the
issue
2 170 07 129
Table 818 How often people feel lonely
Characteristics Population Weighted
percent ()
Unweighted
base
(affirmative
response)
Standard
error
Design
factor
(deft)
Percentage Number Percentage Number
31 Based on online only data
How often feel lonely Oftenalways 6 661 03 122
Some of the
time
18 1830 05 122
Occasionally 23 2376 05 122
Hardly ever 32 3108 06 122
Never 21 2091 05 122
Table 819 Whether people borrow things and exchange favours with their neighbours
Characteristics Population Weighted
percent ()
Unweighted
base
(affirmative
response)
Standard
error
Design
factor
(deft)
Percentage Number Percentage Number
Whether people
borrow things and
exchange favours
Definitely agree 10 1058 04 128
Tend to agree 25 2477 05 128
with neighbours Tend to
disagree
27 2657 06 128
Definitely
disagree
38 3997 06 128
Table 820 Whether people think their area has got better or worse over the last two years
Characteristics Population Weighted
percent ()
Unweighted
base
(affirmative
response)
Standard
error
Design
factor
(deft)
Percentage Number Percentage Number
Whether area has
got better or worse
over the last two
years
The area has
got better
14 1470 05 131
The area has
got worse
26 2564 06 131
The area has
not changed
much
60 5369 07 131
9 Data user guide
This chapter provides a user guide for those conducting analysis of the Community Life Survey
dataset The dataset will be made available on the UK Data Service in SPSS format and the guide
assumes that analysis will be conducted in SPSS
Selecting cases for analysis
The sample consists of an unweighted base of 10243 interviews
Quarters
The dataset contains data from fieldwork between 24th April 2019 and 1st April 2020 broken down into
four quarters To perform analysis on an individual quarter use the variable lsquoQuarterrsquo and select the
appropriate
Quarter 1 24th April ndash 30th June 2019
Quarter 2 10th July ndash 29h September 2019
Quarter 3 2nd October ndash 29th December 2019
Quarter 4 8th January ndash 29th March 2030
For example to look at Quarter 4 data only within the SPSS file select data select cases filter if
Quarter=4 and then run crosstabs and frequencies as normal
Variables
The dataset is ordered in the following way
1 Unique serial number
2 Demographic information such as number of adults in the household age gender marital
status and information on children under the age of 16 living in the household
3 The survey question responses in the same order as the questions appear in the questionnaire
(please see Appendix A for the questionnaire)
4 Derived variables (please see Appendix D for a full list)
5 Geo-demographic files
6 Weight variables
Any queries on published variables should be sent to (evidencedcmsgovuk) in the first instance
Variables are named exactly to match the questionnaire names Where the respondent was able to
give multiple answers to one question (a multiple response question) the question has been
represented in the dataset by a number of variables one for each possible answer which are coded
as yes or no depending on whether the respondent chose this response or not This aids analysis as
it avoids the need to recode each multiple response question
Mode of completion
Nearly three quarter of interviews were completed online versus one quarter completed by paper
questionnaire The paper questionnaire was shorter than the online survey only containing roughly
50 of the questions Data users should be aware that some questions which only appeared in the
web survey will have a smaller base size as a result A variable titled lsquoModersquo is included in the data
which indicates whether each interview was completed online or by post
The two versions of the questionnaire can be viewed in Appendix A and B
Missing Values
For the majority of variables lsquoDonrsquot knowrsquo and lsquoPrefer not to sayrsquo responses are set as missing values
within the dataset In situations where the respondent was not asked the question either due to the
question being added in a later quarter or removed in a previous quarter or due to routing within the
questionnaire responses are also set as missing values All missing values are labelled appropriately
to distinguish between the different responses
Weighting
To analyse the data at the individual level SRCaliW should be used to weight the data Eight sets of
weights are included within the dataset Table 91 below details the separate weight variables and
their use
Table 91 Weights used on the 201920 survey
Weight Description
SRCaliW Scaled individual weight for combined
online and paper sample for the entire
survey year
RespondentCalibrationWeight Individual weight for combined online and
paper sample for the entire survey year
SRCaliww32 Scaled individual weight for online only
sample for the entire survey year Use for
data collected on the online survey only
32 SRCaliww should be used for any break variables that are only collected in the online data regardless of whether the question was included on paper
RespondentCalibrationWeight_Web Individual weight for combined online only
sample for the entire year Use for data
collected on the online survey only
StandardisedAddressSamplingWeight Address sampling weight
StandardisedBaseWeight Respondent base weight for calibration
WithinHouseholdDesignWeight Household design weight
StandardisedBaseWeight_Web Respondent base weight for calibration ndash
online survey only
10Appendices
Appendix A Community Life Online Survey Questionnaire
Appendix B Community Life Paper Questionnaire
Appendix C Advance Online Letter Reminder Online Letter and Paper Letter
Appendix D List of derived variables created for the Community Life Survey
Appendix A Community Life Online Survey
Questionnaire
Community Life Survey 201920 Online Questionnaire
Table of Contents SECTION 1 DEMOGRAPHICS 62 SECTION 2 IDENTITY AND SOCIAL NETWORKS 67
SECTION 3 YOUR COMMUNITY 70
SECTION 4 CIVIC ENGAGEMENT 75
SECTION 5 VOLUNTEERING 80
SECTION 6 SOCIAL ACTION 90
SECTION 7 SUBJECTIVE WELLBEING 94 SECTION 8 DEMOGRAPHICS PART 2 99
Changes from 20182019
Questions updated
Lon1
Lon2
Lon3
LonOft
CivPart
Vnbv
GGroup
SECTION 1 DEMOGRAPHICS
TIMING POINT 1
INTRO [ASK ALL]
Thank you for choosing to take part in the Community Life Survey
Please click the (gt) button to start the survey
INTRO2 [ASK ALL] In this first section we would like to find out a little about your household By your household we mean the group of people (not necessarily related) living at your address who share cooking facilities with you and also share a living room or sitting room or dining area
The information is used to understand the experiences of different groups but will not identify you or anyone in your household
NUMADULTS [ASK ALL]
Including you how many adults aged 16 or over are currently living in your household
110
NAMADULT [ASK ALL]
We would like to gather some information about the people you live with so that we can understand the experiences of different types of households
Please enter the first name or initials of each adult currently aged 16 or over in your household
If you do not wish to enter names please give an initial or other title for each person which you will recognise at later questions (eg lsquowifersquo lsquoeldest sonrsquo)
ENTER NAMES
SEX [ASK ALL]
[Names from NAMADULT pulled through]
What is the gender of each adult in your household 1 Male 2 Female 3 Other
AGEIF [ASK ALL]
[Names from NAMADULT pulled through]
How old are each of the adults in your household
Please click the (gt) button for more answer options
1699 AGEIF2 [ASK IF AGEIF = DK OR REF]
[Names from NAMADULT pulled through]
Which of the following age bands does each adult in the household come under
1 16 to 19 2 20 to 24 3 25 to 29 4 30 to 34 5 35 to 39 6 40 to 44 7 45 to 49 8 50 to 54 9 55 to 59 10 60 to 64 11 65 to 69 12 70 to 74 13 75 to 79 14 80 or over
MARS [ASK ALL]
What is your marital status
1 single that is never married and never registered a same-sex civil partnership 2 married 3 separated but still legally married 4 divorced 5 widowed 6 in a registered same-sex civil partnership 7 separated but still legally in a same-sex civil partnership 8 formerly in a same-sex civil partnership which is now legally dissolved 9 surviving partner from a same-sex civil partnership
LIVE [ASK IF MORE THAN ONE ADULT IN HOUSEHOLD AND MARS = 1 OR 3 OR 4 OR 5 OR 7 OR 8 OR 9 OR DKREF]
Are you living with someone in this household as a couple
1 Yes 2 No
NCHIL
How many children aged under 16 currently live in your household
010 CAGE2 [ASK IF NCHILgt0]
(IF ONE CHILD) How old are they 0hellip15
(IF 2+ CHILDREN) You said that there are (x) children in this household Please enter their ages starting with the oldest child
Please click the (gt) button for more answer options
[Set up as a grid age in the sequence below dependent on how many children live in the household a space to be provided to type in age]
Oldest child Second oldest child Third oldest child
BCAGE2 [ASK IF CAGE 2=DKREF]
(IF ONE CHILD) Which age band applies to the child in your household
(IF 2+ CHILDREN) You said that there are (x) children in this household Please select the age band which applies to each child starting with the oldest child
[Set up as a grid with drop down boxes in the sequence below dependent on how many children live in the household]
Oldest child Second oldest child Third oldest child
1 0 - 4 2 5 ndash 10 3 11 ndash 15
REL [ASK IF MORE THAN ONE PERSON IN THE HOUSEHOLD]
Using the list below please select all of the people you live with Please include everyone you live with including adults and children
Please select all that apply
Please click the (gt) button for more answer options 1 A husband wife civil partner or other cohabiting partner 2 Son or daughter(s) ndash including adoptedstepfoster 3 Brother or sister(s) ndash including adoptedstepfoster 4 Another relative(s) 5 Non-relative(s)
[CHECK ON AGAINST NUMBER OF PEOPLE IN THE HOUSEHOLD AFTER THIS QUESTION]
DIntro1 [ASK ALL]
Next are some questions about your employment
DWorkA [ASK ALL]
Do you currently have a paid job 1 Yes 2 No
DWorkA1 [ASK IF DWORKA = 1]
Are you working as an employee or are you self-employed
1 Employee 2 Self-employed
DWorkA2 [ASK IF SELF-EMPLOYED AT DWORKA1]
Have you become self-employed in the last 12 months
(If you were previously self-employed and have returned to self-employment in the last 12 months please select Yes)
1 Yes
2 No
IntIntro [ASK ALWAYS]
The following questions are about using the internet
IntUseB [ASK ALWAYS]
In what ways do you use the internet if at all
1 For work only 2 For personal reasons only 3 For both 4 Not at all
IntOft [ASK IF INTUSEB = 123]
How often do you access the internet
Please include internet access from any device including mobiletablet only internet access This can be for any purpose ranging from checking your emails to online shopping
1 More than once a day
2 Once a day 3 2-3 times per week 4 About once a week 5 About once a fortnight 6 About once a month 7 About once every 2-3 months 8 About once every six months 9 Less often
SECTION 2 IDENTITY AND SOCIAL NETWORKS
TIMING POINT 2
SIntro6 [ASK ALWAYS]
Now some questions about your friends
SRace [ASK ALL]
What proportion of your friends are of the same ethnic group as you
Please click the gt button for more answer options
1 All the same as me 2 More than a half 3 About a half 4 Less than a half 5 Dont have any friends
SFaith [ASK IF (NOT SRACE=5 (DONrsquoT HAVE ANY FRIENDS))]
What proportion of your friends are of the same religious group as you
Please click the gt button for more answer options
1 All the same as me 2 More than a half 3 About a half 4 Or less than a half 5 Not part of any faith group
Sage [ASK IF (NOT SRACE=5 (DONrsquoT HAVE ANY FRIENDS))]
What proportion of your friends are of the same age group as you
1 All the same as me 2 More than a half 3 About a half 4 Or less than a half
SEduc [ASK IF (NOT SRACE=5 (DONrsquoT HAVE ANY FRIENDS))]
What proportion of your friends have a similar level of education to you
1 All the same as me
2 More than a half
3 About a half
4 Or less than a half
FamIntro [ASK ALWAYS]
The next few questions are about how often you personally contact your family members and friends Please do not include any people you live with
FrndRel1-4
Please do not include any people you live with
On averagehow often do you
More than once a day
Once a day
2-3 times per week
About once a week
About once a fortnight
About once a month
Less often than once a month
Never
Meet up in person with family members or friends
Speak on the phone or video or audio call via the internet with family members or friends
Email or write to family members or friends
Exchange text messages or instant messages with family members or friends
FrndSat1-2 [ASK ALL]
How much do you agree or disagree with the following statements
Definitely agree
Tend to agree
Tend to disagree
Definitely disagree
If I needed help there are people who would be there for me
If I wanted company or to socialise there are people I can call on
Counton1 [ASK ALL]
Is there anyone who you can really count on to listen to you when you need to talk
Please click the (gt) button for more answer options
1 Yes one person 2 Yes more than one person 3 No one
SECTION 3 YOUR COMMUNITY
TIMING POINT 3
SIntro2 [ASK ALWAYS]
The next questions are about your neighbourhood
SBeNeigh [ASK ALWAYS]
First how strongly do you feel you belong to your immediate neighbourhood
Please think of the area within a few minutes walking distance from your home
1 Very strongly 2 Fairly strongly 3 Not very strongly 4 Not at all strongly
SBeGB [ASK ALWAYS]
How strongly do you feel you belong to Britain
1 Very strongly 2 Fairly strongly 3 Not very strongly 4 Not at all strongly
SLive [ASK ALWAYS]
Roughly how many years have you lived in your current neighbourhood
Answer must be in the range from 0 up to 120 ___
SchatN [ASK ALWAYS]
How often do you chat to your neighbours more than to just say hello
Please click the (gt) button for more answer options
1 On most days 2 Once or twice a week 3 Once or twice a month 4 Less than once a month 5 Never 6 Dont have any neighbours
NBarr [ASK IF SChatN=345]
Why dont you chat to your neighbours more often
Please select all that apply
A Prefer to keep myself to myself B Dont have time C Prefer to choose my friends have enough friends already D Neighbours speak different languagehave different culture E Dont trustget on with my neighbours F Have no need to speak to neighbours G Donrsquot feel I know my neighbours well enough H Nothing in common with my neighbours I Im new to the area J Dont see neighbours very often K Have an illnessdisability that prevents me from going out much L People just dont speak to each other round here M Other (specify)
SFavN [ASK IF NOT SchatN = 6]
How strongly do you agree or disagree with the following statement
Generally I borrow things and exchange favours with my neighbours
1 Definitely agree 2 Tend to agree 3 Tend to disagree 4 Definitely disagree
NComfort1 [ASK IF NOT SchatN = 6]
How comfortable would you be asking a neighbour to keep a set of keys to your home for emergencies for example if you were locked out
1 Very comfortable 2 Fairly comfortable 3 Fairly uncomfortable 4 Very uncomfortable
NComfort2 [ASK IF HAVE CHILDREN AGED lt 11 AND NOT IF SchatN = 6]
How comfortable would you be asking a neighbour to mind your child(ren) for half an hour
1 Very comfortable 2 Fairly comfortable 3 Fairly uncomfortable 4 Very uncomfortable
NComfort3 [ASK IF NOT SchatN = 6]
If you were ill and at home on your own and needed someone to collect a few shopping essentials how comfortable would you feel asking a neighbour to do this for you
1 Very comfortable 2 Fairly comfortable 3 Fairly uncomfortable 4 Very uncomfortable
SPull [ASK ALWAYS]
To what extent would you agree or disagree that people in your neighbourhood pull together to improve the neighbourhood
Please click the gt button for more answer options
1 Definitely agree 2 Tend to agree 3 Tend to disagree 4 Definitely disagree 5 Nothing needs improving
STrust [ASK ALWAYS]
Thinking about the people who live in this neighbourhood to what extent do you believe they can be trusted
Please click the gt button for more answer options
1 Many of the people can be trusted 2 Some of the people can be trusted 3 A few of the people can be trusted 4 None of the people can be trusted 5 Just moved here
STrustGen2 [ASK ALWAYS]
On a scale where 0 (zero) is not at all and 10 (ten) is completely in general how much do you think people can be trusted
(Scale 0 not at all 10 completely)
SIntro5 [ASK ALWAYS]
The next questions refer to your wider local area Please think of the area within 15-20 minutes walking distance from your home
Slocsat [ASK ALWAYS]
Overall how satisfied or dissatisfied are you with your local area as a place to live
1 Very satisfied 2 Fairly satisfied 3 Neither satisfied nor dissatisfied 4 Fairly dissatisfied
5 Very dissatisfied
STogeth [ASK ALWAYS]
To what extent do you agree or disagree that your local area is a place where people from different backgrounds get on well together
Please click the gt button for more answer options
1 Definitely agree 2 Tend to agree 3 Tend to disagree 4 Definitely disagree 5 There are too few people in the local area 6 People in this area are all of the same background
BetWors2 (QB5) [ASK ALL]
Do you think that over the past two years your area has hellip
1 got better to live in
2 got worse to live in
3 not changed much (hasnrsquot got better or worse) 4 Have not lived here long enough to say
Assets2 (QB1) [ASK ALL]
Which of these are located within a 15-20 minute walk from your home
1 Generalgrocery shop
2 Pub
3 Park
4 Library
5 Community centrehall
6 Sports centreclub
7 Youth centreclub
8 Health centreGP
9 Chemist
10 Post Office
11 Primary school
12 Secondary school
13 Churchplace of worship
14 Public transport links
15 None of the above
SatAsset [ASK ALL]
Generally how satisfied are you with the local services and amenities in your local area
1 Very satisfied 2 Fairly satisfied 3 Neither satisfied nor dissatisfied 4 Fairly dissatisfied 5 Very dissatisfied
Vnbv [ASK ALL]
How important is it for you personally that you have opportunities to mix with people from different backgrounds
1 Very important
2 Important
3 Neither important nor unimportant
4 Not very important
5 Not at all important
SECTION 4 CIVIC ENGAGEMENT
TIMING POINT 4
PIntro1 [ASK ALWAYS]
The next questions are about influencing political decisions and local affairs
CivPart [ASK ALWAYS]
In the last 12 months that is since [DATE ONE YEAR AGO] have youhellip
Please select all that apply
1 Contacted a local official such as a local councillor MP government official mayor or public official working for the local council (Please do not include any contact for personal reasons eg housing repairs or contact through work)
2 Attended a public meeting rally or taken part in a public demonstration or protest 3 Signed a paper petition or an onlinee-petition 4 None of these
Partoft [ASK IF NOT ((NONE IN CIVPART)
And over the last 12 months how often have you done [this kind of thingall of the things yoursquove just mentioned] This includes
[LIST THINGS MENTIONED]
1 At least once a week 2 Less than once a week but at least once a month 3 Less often than once a month
CivConsult [ASK ALL]
In the last 12 months that is since [DATE ONE YEAR AGO] have you taken part in a consultation about local services or issues in your local area through any of these ways
Please select all that apply
1 Completing a paper or online questionnaire 2 Attending a public meeting 3 Being involved in a face-to-face or online group 4 None of these
Conoft [ASK IF NOT ((NONE IN CIVCONSULT)]
And over the last 12 months how often have you done [this kind of thingall of the things yoursquove just mentioned] This includes
[LIST THINGS MENTIONED]
1 At least once a week 2 Less than once a week but at least once a month 3 Less often than once a month
CivActIntro [ASK ALL]
The following questions are about activities in your local community
CivAct1 [ASK ALL AGED 18 AND OVER]
In the last 12 months that is since [DATE ONE YEAR AGO] have you done any of these things Please include any activities you have already mentioned but not any related to your job
Please select all that apply
1 Been a local councillor (for local authority town or parish) 2 Been a school governor 3 Been a volunteer Special Constable 4 Been a Magistrate 5 None of the above
CivAct2 [ASK ALWAYS]
And again in the last 12 months that is since [DATE ONE YEAR AGO] have you been a member of any of the following decision making groups in your local area Please include online groups and any activities you have already mentioned Please do not include any activities related to your job
Please select all that apply
1 A group making decisions on local health services 2 A decision making group set up to regenerate the local area 3 A decision making group set up to tackle local crime problems 4 A tenants group decision making committee 5 A group making decisions on local education services 6 A group making decisions on local services for young people 7 Another group making decisions on services in the local community 8 None of these
PAffLoc [ASK ALWAYS]
To what extent do you agree or disagree that you personally can influence decisions
affecting your local area
Please click the (gt) button for more answer options
1 Definitely agree 2 Tend to agree 3 Tend to disagree 4 Definitely disagree
PInfl [ASK ALWAYS]
How important is it for you personally to feel that you can influence decisions in your local area
1 Very important 2 Quite important 3 Not very important 4 Not at all important
PCSat [ASK ALWAYS]
Generally speaking would you like to be more involved in the decisions your local council makes which affect your local area
Please click the gt button for more answer options
1 Yes 2 No 3 Depends on the issue
PIfHow [ASK ALWAYS]
If you wanted to influence decisions in your local area how would you go about it
Please select all that apply
Please click the (gt) button for more answer options
A Contact the local council a council official B Contact my local councillor C Contact my MP D Contact my assembly member (for London) E Sign a paper petition F Sign an e-petitiononline petition G Organise a paper petition H Organise an e-petitiononline petition I Attend a local council meeting J Attend a public meeting K Contact local media or journalists L Organise a group (eg campaignaction group) M Other (specify)
PIfEas [ASK ALWAYS]
Which if any of these might make it easier for you to influence decisions in your local area
Please select all that apply
Please click the (gt) button for more answer options
1 If I had more time 2 If the local council got in touch with me and asked me 3 If I could give my opinion online by email 4 If I knew what issues were being considered 5 If it was easy to contact my local councillor 6 If I knew who my local councillor was 7 If I could get involved in a group (not online) making decisions about issues affecting
my local areaneighbourhood 8 If I could get involved in an online group making decisions about issues affecting my
local areaneighbourhood 9 Something else (specify) 10 Nothing
LocVote [ASK IF AGED gt 17]
Did you vote in the last local government election
Please exclude election of local police and crime commissioners
1 Yes 2 No 3 Not eligible to vote
SECTION 5 VOLUNTEERING
TIMING POINT 5
FIntro1 ASK ALWAYS]
The next questions are about your involvement with groups clubs or organisations
FGroupIntro [ASK ALWAYS]
Web For each of the following types of groups clubs or organisations please state whether you have been involved with any of these during the last 12 months that is since [DATE ONE YEAR AGO]
Thats anything youve taken part in supported or that youve helped in any way either on your own or with others Please exclude giving money or anything that was a requirement of your job or organised through your employer
Postal Have you been involved with any of the following groups clubs or organisations during the last 12 months
Please donrsquot put a cross in the box if you have only given money or done something that was part of your job or organised through your employer
FGroupA-FGroupP [ASK ALL]
Yes No
Childrens educationschools (eg Parent Teacher Associations School governor Supporting fairs and fundraising Helping in school Running pupilsrsquo clubs)
Youthchildrens activities (outside school) (eg Youth clubs Sports clubs Hobby or cultural groups for children)
Education for adults (eg Attending or teaching classes Mentoring Cultural groups Students Union College governor)
Sportexercise (taking part coaching or going to watch) (eg Sports clubs or groups (eg football swimming fishing golf keep-fit hiking) Supporter clubs)
Religion (eg Attending a place of worship (church chapel mosque temple synagogue) Attending faith-based groups SaturdaySunday School)
Politics (eg Membership of or involvement with political groups Serving as local councillor)
Older people (eg Involved with groups clubs or organisations for older people eg Age UK Pensionerrsquos clubs visiting transporting or representing older people)
Health Disability and Social welfare (eg Medical research charities Hospital visiting Disability groups Social welfare (eg Oxfam NSPCC Samaritans Citizens Advice Bureau) Offering respite care Self-help groups (eg Alcoholics Anonymous))
Safety First Aid (eg Red Cross St Johns Ambulance Life Saving RNLI Mountain Rescue Helping after a disaster)
The environment animals (eg National organisations (eg Greenpeace National Trust RSPCA) Local conservation groups Preservation societies)
Justice and Human Rights (eg Special Constable Magistrate Legal advice centre Victim Support Prison visiting or aftercare Justice and peace groups Community or race relations LGBT groups National organisations (eg Amnesty International))
Local community or neighbourhood groups (eg Tenantsrsquo Residentsrsquo Association Neighbourhood Watch community group local pressure group)
Citizens Groups (eg Rotary Club Lionrsquos Club Womenrsquos Institute (WI) Freemasons) Hobbies RecreationArtsSocial clubs (e g Clubs or groups for the Arts (eg theatres museums amateur dramatics orchestras) Hobby or cultural groups (eg local history club Social club)
Trade union activity (e g Membership of or involvement with a trade union)
Other_P [ASK ALL]
Have you been involved with any other groups clubs or organisations in the last 12 months
1 Yes 2 No
P_Oth [ASK IF Other_P=1]
Please enter the other activities you have been involved with in the last 12 months into the box below
FInfo [ASK IF YES AT ANY OF A-P AT FGROUP]
The next questions are about your involvement with the groups clubs and organisations yoursquove just selected
These are [List groups selected at FGROUP - main titles only]
FUnPd [ASK IF YES AT ANY OF FGROUPA-P]
In the last 12 months that is since [DATE ONE YEAR AGO] have you given unpaid help to [the group club or organisationany of the groups clubs or organisations] yoursquove just selected in any of the following ways
____
Please select all that apply
A Raising or handling moneytaking part in sponsored events B Leading a groupmember of a committee C Getting other people involved D Organising or helping to run an activity or event E Visiting people F Befriending or mentoring people G Giving adviceinformationcounselling H Secretarial admin or clerical work I Providing transportdriving J Representing K Campaigning L Other practical help (eg helping out at school shopping) M Any other help
None of the above
FUnOft [ASK IF YES AT ANY OF FGROUPA-P AND AT LEAST ONE OF CODES A-M SELECTED AT FUnPd)]
Over the last 12 months how often have you helped [thisthese] group(s) club(s) or organisation(s)
1 At least once a week 2 Less than once a week but at least once a month 3 Less often than once a month
FUnHrs [ASK IF YES AT ANY OF FGROUPA-P AND AT LEAST ONE OF CODES A-L SELECTED AT FUnPd]
Now just thinking about the last 4 weeks Approximately how many hours have you spent helping thisthese] group(s) club(s) or organisation(s) in the last 4 weeks
If you are not sure please provide your best estimate
FIndGpA [ASK IF YES AT ANY OF FGROUPA-P AND AT LEAST ONE OF CODES A-L SELECTED AT FUnPd]
How did you find out about opportunities to give unpaid help to [thisthese groups(s) club(s) or organisation(s)
Please select all that apply
A Through previously using services provided by the group
B From someone else already involved in the group C From a friend not involved in the groupby word of mouth D Place of worship E School college university F Doctors surgery Community Centre Library G Promotional eventsvolunteer fair H Local events I Local newspaper J National newspaper K TV or radio (local or national) L Volunteer bureau or centre M Employers volunteering scheme N wwwdo-itorguk O National Citizen Service P Other internetorganisational website Q Other way (specify)
MxFVol2 [ASK IF YES AT ANY OF FGROUPA-P AND AT LEAST ONE OF CODES A-L SELECTED AT FUnPd]
Thinking about the unpaid help yoursquove given in the last 12 months have you mixed with
Please select all that apply
1 People of different age groups 2 People of different ethnic groups or religions 3 People with a different social or educational background 4 People who live in different neighbourhoods 5 None of these
MxFVol3 [ASK ALL EXCEPT THOSE SAYING NONE OF THESE AT MxFVol2]
Still thinking about the unpaid help yoursquove given in the last 12 months how often have you mixed with the people you have just mentioned
Please think about all of the people you mix with as part of this activity
Please click the (gt) button for more answer options
1 Daily 2 Weekly 3 Monthly
4 At least once a year 5 Less often than once a year
VolBen [ASK IF (YES AT ANY OF FGROUPA-P AND AT LEAST ONE OF CODES A-L SELECTED AT FUnPd]
Did you start helping these groups clubs or organisations for any of the following reasons
Please select all that apply
1 I wanted to improve thingshelp people 2 I wanted to meet peoplemake friends 3 The cause was really important to me 4 My friendsfamily did it 5 It was connected with the needs of my familyfriends 6 I felt there was a need in my community 7 I thought it would give me a chance to learn new skills 8 I thought it would give me a chance to use my existing skills 9 It helps me get on in my career 10 Its part of my religious belief to help people 11 Its part of my philosophy of life to help people 12 It gave me a chance to get a recognised qualification 13 I had spare time to do it 14 I felt there was no one else to do it 15 None of these
EIntro [ASK IF DWORKA1 = EMPLOYEE]
Now some questions about Employer Supported Volunteering
GEmpVol2 [ASK IF DWORKA1 = EMPLOYEE]
Some employers have schemes for employees to help with community projects voluntary or charity organisations or to give money Have you participated in any activities of this sort that were encouraged by your employer in the last 12 months that is since DATE
Please click the (gt) button for more answer options
1 Yes - helping only 2 Yes ndash giving money only 3 Yes - BOTH helping AND giving money 4 No
GOften [ASK IF GEmpVol2 = 1 OR 3]
Approximately how many days have you spent giving this kind of help in the last 12 months
1 Less than a day 2 One day 3 Two days 4 Three days 5 Four days 6 Five or more days
BVLon IF ( FGROUPA-P ALL = NO) OR (FUNPD = NONE)]
If yes at least one of FGroupA-P AND none at funpd use this text (1) Yoursquove said that during the last 12 months you have not done any of the following things for any groups clubs or organisations Have you done any of these things ndash unpaid ndash for a group club or organisationrsquo in the last five years (that is since YEAR) Please select all that apply
IF no at ALL OF FGROUPA-P use this text (2) You said earlier that you have not been involved with any groups clubs or organisations in the last 12 months Have you done any of the following things - unpaid - for a group club or organisation in the last five years (that is since YEAR) Please select all that apply
(A) Raising or handling moneytaking part in sponsored events (B) Leading the groupmember of a committee (C) Organising or helping to run an activity or event (D) Visiting people (E) Befriending or mentoring people (F) Giving adviceinformationcounselling (G) Secretarial admin or clerical work (H) Providing transportdriving (I) Representing (J) Campaigning (K) Other practical help (eg helping out at school shopping) (L) Any other help None of the above
VYFreq [ASK IF ANY OF CODES A-L SELECTED AT BVLon]
Thinking about the unpaid help you have given to any group club or organisation in the past on average how frequently did you do this
1 At least once a week 2 Less than once a week but at least once a month 3 Less frequently than once a month 4 It was a one-off occasion
VYStop [ASK IF ANY OF CODES A-L SELECTED AT BVLon]
What were the main reasons you stopped giving unpaid help to any groups clubs or organisations
Please select all that apply
A Not enough time - due to changing homework circumstances B Not enough time ndash getting involved took up too much time C Groupcluborganisation finishedclosed D Moved away from area E Due to health problems or old age F Groupcluborganisation wasnt relevant to me anymore G Lost interest H It was a one-off activity or event I Felt I had done my bit someone elsersquos turn to get involved J Got involved in another activity instead K Didnt get asked to do the things Id like to L Felt the groupcluborganisation was badly organised M Felt my efforts werent always appreciated N It was too bureaucratic too much concern about risk and liability O Activity linked to my schoolcollegeuniversityjob I have now left P I didnt feel my contribution made a difference Q Other reason (specify)
BVHelp [ASK IF (FGROUPA-P ALL = NO) OR (FUNPD = NONE) OR (FUNOFT = LESS OFTEN OR DONrsquoT KNOW)]
If FUnoFT=Less often use this text 1) You said earlier that you help group(s) club(s)organisation(s) occasionally that is less than once a month Would you like to spend any more time helping groups clubs or organisations
If FUnoFT= Donrsquot Know use this text (2) You said earlier that you help group(s)club(s)organisation(s) Would you like to spend any more time helping groups clubs or organisations
Otherwise use this text (3) Would you like to spend any time helping groups clubs or organisations
1 Yes 2 No
VBarr [ASK IF (FGROUPA-P ALL = NO) OR (FUNPD = NONE) OR (FUNOFT = LESS OFTEN OR DONrsquoT KNOW)]
If never volunteered formally ((FGroup A-P ALL = NO OR FunPd= None) AND BVLONG = NONE) use this text (1) Which if any of these are reasons why you donrsquot give unpaid help to groups clubs or organisations
If former formal volunteer (BVLon= A-L) use this text (2) Which if any of these are reasons why you have not given unpaid help to groups clubs or organisations in the last 12 months
If irregular formal volunteer (FunOft= Less than once a month OR Donrsquot Know) use this text (3) Which if any of these are reasons why you donrsquot give unpaid help to groups clubs or organisations more regularly
Please select all that apply
A I have work commitments B I have to look after childrenthe home C I have to look after someone who is elderly or ill D I have to study E I do other things with my spare time F Irsquom not the right age G I dont know any groups that need help H I havent heard about opportunities to give help I couldnrsquot find opportunities I Im new to the area J I have never thought about it K I have an illness or disability that I feel prevents me from getting involved L It is not my responsibility M Other reason (specify)
IIntro1 [ASK ALWAYS]
The next section asks about any unpaid help you as an individual may have given to other people that is apart from any help given through a group club or organisation This could be help for a friend neighbour or someone else but not a relative
IHlp [ASK ALWAYS]
In the last 12 months that is since [DATE ONE YEAR AGO] have you done any of these things unpaid for someone who was not a relative
Please select all that apply
1 Keeping in touch with someone who has difficulty getting out and about (visiting in person telephoning or e-mailing)
2 Doing shopping collecting pension or paying bills 3 Cooking cleaning laundry gardening or other routine household jobs 4 Decorating or doing any kind of home or car repairs 5 Babysitting or caring for children 6 Sitting with or providing personal care (eg washing dressing) for someone who is sick
or frail 7 Looking after a property or a pet for someone who is away 8 Giving advice 9 Writing letters or filling in forms 10 Representing someone (for example talking to a council department or to a doctor) 11 Transporting or escorting someone (for example to a hospital or on an outing) 12 Anything else 13 No help given in last 12 months
IHlpOft [ASK IF NOT IHLP=13 (NONE)]
Over the last 12 months that is since [DATE ONE YEAR AGO] about how often have you done [thisthese things]
This includes (LIST RESPONSES GIVEN AT IHLP)
1 At least once a week 2 Less than once a week but at least once a month 3 Less often than once a month
IHlpHrs [ASK IF NOT IHLP=13 (NONE)]
In the last 4 weeks approximately how many hours have you spent doing [thisthese things If you are not sure please provide your best estimate
Answer must be in the range from 0 up to 999 ____
GIntro1 [ASK ALWAYS]
Next are some questions about giving to charity
GGroup [ASK ALL]
_____
In the last 4 weeks have you given money to charity in any of the following ways Please exclude donating goods or prizes
Please select all that apply
Donations A Money to collecting tins (eg door-to-door in the street in a pub at work on a shop
counter etc) B Collection at church mosque or other place of worship C Collections using a charity envelopecheque in the post D Covenant or debit from salary payroll giving E Donation ndash via direct debit standing order F Giving to people begging on the street G Donation ndash in person or on phone (excluding online or via text message) H Donation ndash onlinevia website I Donation - by text message J Donation - via an ATMcash machine K Donation ndash made through contactless technology Purchasesfundraising L Buying raffle tickets (NOT national or health lottery) M Buying goods from a charity shop catalogue or online N Making a purchase where the price includes a charitable donationor where you can
add a charitable donation to the purchase O Buying tickets or spending money at fundraising events (eg charity dinners fetes
jumble sales) Sponsorship P Sponsorship (not online) Q Sponsorship (online) Other R Other method of giving (excluding donating goods or prizes) (specify) S Did not give money to charity
GivAmt [ASK IF NOT GGROUP= DID NOT GIVE TO CHARITY AND NOT DK OR REF]
Approximately how much have you given to charity in the last 4 weeks
Please enter the amount to the nearest pound
Please exclude buying goods
If you are not sure please provide your best estimate
Caus4w [ASK IF NOT GGROUP= DID NOT GIVE TO CHARITY AND NOT DK OR REF]
To which of these causes have you given money in the last 4 weeks
Please select all that apply
A Schools colleges universities or other education B Children or young people (outside school) C Sportsexercise D ReligionPlace of Worship E Older people F Overseas Aid Disaster Relief G Medical Research H Hospitals and Hospices I Physical Mental HealthcareDisabled people (including blind or deaf people) J Social Welfare K Conservation the environment and heritage L Animal Welfare M The arts and museums N Hobbies Recreation Social clubs O Other (specify) None of these
CausLN [ASK IF NOT GGROUP= DID NOT GIVE TO CHARITY AND NOT DK OR REF]
Were these donations for
1 Local charities 2 National or international charities 3 Both local charities and national or international charities
TEUse2 (QB2) [ASK ALL]
Would any of these things encourage you to start giving to charity or to increase the
amount you currently give
Please select all that apply
1 More information about charities I could support
2 Knowing that my money will be spent locally
3 Receiving letteremail of thanks from the charity
4 Receiving information on what has been done with my donation
5 Being asked to increase my donation
6 Confidence that the money will be used efficiently
7 More tax efficient methods (eg Gift Aid giving via self-assessment)
8 More generous tax relief
9 Being asked by someone I know
10 Having more money
11 If payroll giving were available
12 If the charity helped mesomeone close to me
13 None of these
SECTION 6 SOCIAL ACTION
TIMING POINT 6a
SAIntro [ASK ALL]
The next questions are about getting involved in your local area
LocAtt [ASK ALL]
To what extent do you agree or disagree with the following statement
When people in this area get involved in their local community they really can change the way that their area is run
1 Definitely agree 2 Tend to agree 3 Neither agree nor disagree 4 Tend to disagree 5 Definitely disagree
LocInvNew2 [ASK ALL]
Have you been involved in any of the following activities in the last 12 months that is
DATE Please only include those activities that were unpaid
Please donrsquot include anything where you signed a petition but took no further action
Please select all that apply
1 Trying to set up a new serviceamenity for local residents
2 Trying to stop the closure of a serviceamenity
3 Trying to stop something else happening in my local area
4 Running local services on a voluntary basis (eg childcare youth services parks
community centres)
5 Organising a community event (eg street party)
6 Another local issue (specify)
7 None of these
LocPeopNew [ASK IF NOT ALL CODES A-F SELECTED AT LocInvNew]
Have you been aware of other local people being involved in any of these activities over the last 12 months
[LIST FILTERED TO EXCLUDES ANY RESPONSES SELECTED AT LOCINVNEW]
[DISPLAY ON SCREEN] In the last 12 months I have been aware of other local people getting involved in
1 Trying to set up a new serviceamenity for local residents
2 Trying to stop the closure of a serviceamenity
3 Trying to stop something else happening in my local area
4 Running local services on a voluntary basis (eg childcare youth services parks
community centres)
5 Organising a community event (eg street party)
6 Another local issue (specify)
7 None of these
LocAct [IF ANY CODED AT LocInvNew2 ]
In the last 12 months in what ways have you been involved in [this activity or issue these activities or issues]
[DISPLAY CODES SELECTED AT LocInvNew2]
Please select all that apply
A I started up the activity (solely or jointly) B I managed the activity (solely or jointly) C I participated in a discussion on this issueevent (online or in person) D I helped fundraise E I got more people involved F I contributed specialist skills G I donated money H I offered non-monetary donations or contributions I I campaigned J I helped raise awareness locally K I helped organise a petition L I signed a petition M I offered other practical support N Other (specify)
LocOft [IF ANY CODED AT LocInvNew 2]
On how many occasions in the last 12 months have you spent time helping with [this
activity or issue all of these activities or issues]
[DISPLAY CODES SELECTED AT LocInvNew2]
1 On one occasion only 2 On 2 or 3 occasions 3 On four or five occasions 4 Or more frequently
LocHow [IF ANY CODED AT LocInvNew 2]
How did you find out how to get involved with [this activity or issue these activities or issues]
[DISPLAY CODES SELECTED AT LocInvNew2]
Please select all that apply
A I was the personone of the people who started the action B I was asked to get involved by someone I already knew C I was asked to get involved by someone I hadnrsquot previously known D I saw a leafletposterflyer E I read about it in the local newspaper F Via a local community neighbourhood residents group G Via an online forum or social network site H Other (specify)
LocMot2 (QB4) [ASK IF ANY CODED AT LocInvNew2] Why did you get involved in [the local issue or activityall of the local issues or activities]
[DISPLAY CODES SELECTED AT LocInvNew2] Please select all that apply
1 To serve my communityfelt it was my responsibility
2 To improve local servicesnot happy with existing provision
3 To resolve an issue
4 My political beliefs
5 An earlier positive experience of getting involved
6 I was asked to get involved
7 To have my say
8 To meet peoplemake friends
9 It was connected to the needs of familyfriends
10 To give me a chance to learn new skillsuse my existing skills
11 To help my career
12 I had spare time to do it
13 I wanted an interest outside of work
14 Other (please specify)
LocWant [ASK IF ANY OF CODES A-F SELECTED AT LocPeopNew AND LocInvNew = NONE OF THESE]
You said you had been aware of other local people in your area getting involved with
[ONLY DISPLAY ANSWERS SELECTED AT LocPeopNew]
- Trying to set up a new service or amenity - Trying to stop the closure of a service or amenity - Trying to stop something happening in your local area - Running local services on a voluntary basis - Organising a community event such as a street party - Another issue affecting your local area
Would you like to have been involved in [this local issue any of these local issues]
1 Yes 2 No
LocBarr1 [ASK IF LocWant = ASK IF ANY OF CODES A-F SELECTED AT LocPeopNew AND LocInvNew = NONE OF THESE]
IF YES AT LocWant Why didnt you get involved in this [this local issue or activity any of these local issues or activities]
IF NO At LocWant Why didnt you want to get involved in [this local issue or activity any of these local issues or activities]
[ONLY DISPLAY ANSWERS SELECTED AT LocPeopNew]
Please select all that apply
1 I dont have time 2 I do other voluntary activities 3 Was not asked to get involved 4 Have never thought about it 5 Did not know how to get involved 6 Due to illness or disability 7 Donrsquot feel its my responsibility 8 Did not feel I could make a difference 9 Donrsquot have the right skills 10 Not confident enough 11 Donrsquot know people in my area well enough 12 I donrsquot get on with people in my local area 13 Didnrsquot agree with the issue or feel strongly enough about it 14 Red tape bureaucracylegal barriers 15 Just not interested 16 Other reason (specify)
SECTION 7 SUBJECTIVE WELLBEING
TIMING POINT 7
Wellintro [ASK ALWAYS]
The next questions ask about your feelings on aspects of your life They are included to help measure peoplersquos wellbeing and the information produced will not identify you or anyone in your household
There are no right or wrong answers For each of these questions please give an answer on a scale of 0 to ten where 0 is not at all and 10 is completely
WellB1 [ASK ALWAYS]
Overall how satisfied are you with your life nowadays
Please click the (gt) button for more answer options
(SCALE 0 (Not at all satisfied) to 10 (completely satisfied))
WellB4 [ASK ALWAYS]
Overall to what extent do you feel the things you do in your life are worthwhile
Please click the (gt) button for more answer options
(SCALE 0 (not at all worthwhile) to 10 (completely worthwhile))
WellB2 [ASK ALWAYS]
Overall how happy did you feel yesterday
Please click the (gt) button for more answer options
(SCALE 0 (not at all happy) to 10 (completely happy))
WellB3 [ASK ALWAYS]
Overall how anxious did you feel yesterday
Please click the (gt) button for more answer options
(SCALE 0 (not at all anxious) to 10 (completely anxious))
Lon1 [ASK ALWAYS]
How often do you feel that you lack companionship
Please click the (gt) button for more answer options
A Often
B Some of the time
C Hardly ever or Never
Lon2 [ASK ALWAYS]
How often do you feel left out
Please click the (gt) button for more answer options
A Often
B Some of the time
C Hardly ever or Never
Lon3 [ASK ALWAYS]
How often do you feel isolated from others
Please click the (gt) button for more answer options
A Often
B Some of the time
C Hardly ever or Never
LonOft [ASK ALWAYS]
How often do you feel lonely
Please click the (gt) button for more answer options
A Oftenalways B Some of the time C Occasionally D Hardly ever E Never
SECTION 8 DEMOGRAPHICS PART 2
TIMING POINT 8
IntroHTen2 [ASK ALWAYS]
The following questions are about you and your circumstances
HTen1 [ASK ALWAYS]
Do you (or your household) own or rent this accommodation
Please click the (gt) button for more answer options
1 Own it outright 2 Buying it with the help of a mortgage loan 3 Part own and part rent (shared ownership) 4 Rent it (includes all those who are on Housing Benefit or Local Housing Allowance) 5 Live here rent-free (including rent-free in relatives friends property but excluding
squatters) 6 Squatting
HLLord [ASK IF (HTEN1 = 3 4 OR 5)]
Who is the landlord
Please select the first one that applies
1 The local authority council ALMO 2 A housing association RSL charitable trust or Local Housing Company 3 Employer (organisation) of a household member 4 Another organisation 5 Relative acquaintance of any current household member from before this tenancy
started 6 Employer (individual) of a household member 7 Another individual private landlord
Ethnic [ASK ALWAYS]
Which one of the following best describes your ethnic group or background
Please select one option
WHITE 1 EnglishWelshScottishNorthern IrishBritish 2 Irish 3 Gypsy or Irish Traveller 4 Any other White background (specify) MIXED 5 White and Black Caribbean 6 White and Black African 7 White and Asian 8 Any other mixedmultiple ethnic background (specify) ASIAN OR ASIAN BRITISH 9 Indian 10 Pakistani 11 Bangladeshi 12 Chinese 13 Any other Asian background (specify) BLACK OR BLACK BRITISH 14 African 15 Caribbean 16 Any other BlackAfricanCaribbean background (specify) OTHER ETHNIC GROUP 17 Arab 18 Any other ethnic group (specify)
19 Prefer not to say
Citzen [ASK ALWAYS]
Are you a citizen of any of the following
Citizenship means you are entitled to a passport issued by that country
Please select all that apply
Please click the (gt) button for more answer options
1 The United Kingdom (Great Britain and Northern Ireland)
2 Republic of Ireland
3 Any other member state of the European Union
4 Any other country elsewhere in the world
SMain [ASK ALWAYS]
Which language do you speak most often at home Please choose your main language If you speak English and another language equally please select both of these codes
Please click the (gt) button for more answer options
1 English 2 Other language
SGood [ASK IF SMain NE =1]
In day-to-day life how good are you at speaking English when you need to For example to have a conversation on the telephone or talk to a professional such as a teacher or a doctor
Please click the (gt) button for more answer options
1 Very good
2 Fairly good
3 Not very good
4 Not at all good
Relig [ASK ALWAYS]
What is your religion even if you are not currently practising
Please click the (gt) button for more answer options
1 No religion 2 Christian 3 Buddhist 4 Hindu 5 Jewish 6 Muslim 7 Sikh 8 Any other religion 9 Prefer not to say
RelAct [ASK IF NOT RELIG=1]
Do you consider that you are actively practising your religion
Please click the (gt) button for more answer options
1 Yes 2 No 3 Prefer not to say
GHealth [ASK ALWAYS]
How is your health in general
Please click the (gt) button for more answer options
1 Very good 2 Good 3 Fair 4 Bad 5 Very bad
DIll [ASK ALWAYS]
[]Do you have any physical or mental health conditions or illnesses lasting or expected to last for 12 months or more
Please click the (gt) button for more answer options
1 Yes 2 No
DIll2 [ASK IF DIL1=1]
[] Does your condition or illnessdo any of your conditions or illnesses] reduce your ability to carry out day-to-day activities
Please click the (gt) button for more answer options
1 Yes ndash a lot 2 Yes ndash a little 3 No
RCare [ASK ALWAYS]
Do you have any caring responsibilities for a member of your immediate family or a close relative outside of your household who has any long-standing illness disability or infirmity
Please click the (gt) button for more answer options
1 Yes 2 No
RCareHrs [ASK IF RCare=1]
Including travelling time approximately how long do you spend caring for this personthese people in an average week
Please click the (gt) button for more answer options
1 0-2 hours
2 3-4 hours
3 5-9 hours
4 10-19 hours
5 20-29 hours
6 30 hours or more
SId [ASK ALL]
Which of the following best describes how you think of yourself
We are asking this question so that we can compare the experiences of different groups in society
1 Heterosexual Straight 2 Gay Lesbian 3 Bisexual 4 Other 5 Prefer not to say
Employment Status TIMING POINT 9
EIntro1 [ASK ALWAYS]
The final questions about your work and employment
Wrking [ASK ALWAYS]
Did you do any paid work in the 7 days ending Sunday the [date last Sunday] either as an employee or as self-employed
1 Yes 2 No
SchemeT [ASK IF WRKING = (NO OR DKREF)]
Were you on a government scheme for employment training
1 Yes 2 No
JbAway [ASK IF WRKING = NO OR WRKING = DKREF AND (SCHEMET = NO OR SCHEMET = DKREF)]
Did you have a job or business you were away from
1 Yes 2 No 3 Irsquom waiting to take up a new jobbusiness already obtained
OwnBus [ASK IF (JBAWAY = NO) OR (JBAWAY = DKREF)]
Did you do any UNPAID work in that week for any business that you own
1 Yes 2 No
RelBus [ASK IF (OWNBUS = NO) OR (OWNBUS = DKREF)]
Did you do any unpaid work for a business that a relative owns
1 Yes 2 No
Looked [ASK IF( RELBUS = NODKREF AND JBAWAY = NODKREF)]
Were you looking for any kind of paid work or a place on a government training scheme at any time in the last 4 weeks
1 Yes 2 No
StartJ [ASK IF ((LOOKED = YES) OR (JBAWAY = WAITING)]
If a job or a place on a government training scheme had been available in the week ending Sunday the [date last Sunday] would you have been able to start within 2 weeks
1 Yes 2 No
LKTime [ASK IF ((LOOKED = YES) OR (LOOKED = WAIT)) OR (JBAWAY = WAITING)]
How long have you been looking for paid worka place on a government scheme
1 Not yet started 2 Less than 1 month 3 1 month but less than 3 months 4 3 months but less than 6 months 5 6 months but less than 12 months 6 12 months or more
Whynlk [ASK IF LOOKED = NO]
What was the main reason you did not look for work in the last 4 weeks
1 Student 2 Looking after the familyhome 3 Temporarily sick or injured 4 Long-term sick or disabled 5 Retired from paid work 6 Other reason
Whynsrt [ASK IF STARTJ = NO]
What was the MAIN reason you would not have been able to start work within two weeks
1 Student 2 Looking after the familyhome 3 Temporarily sick or injured 4 Long-term sick or disabled 5 Retired from paid work 6 Other reason
Infstud [ASK ALWAYS]
Are you at present [at school or 6th form college] enrolled on any full-time or part-time education course excluding leisure classes
Please include correspondence courses and open learning as well as other forms of full-time and part-time education course
1 Yes ndash full time student 2 Yes ndash part-time student 3 No
EverWk [ASK IF NOT ( WRKING = YES OR SCHEMET = YES OR JBAWAY = YES OR OWNBUS = YES OR RELBUS = YES)]
Have you EVER had a paid job apart from casual or holiday work (or the job you are waiting to begin)
1 Yes 2 No
LeavWk [ASK IF EVERWK=1]
When did you leave your last PAID job
Please enter the month and year below
[ASK IF (WRKING = YES) OR (SCHEMET = YES) OR (JBAWAY = YES) OR (OWNBUS = YES) OR (RELBUS = YES) OR (EVERWK = YES)]
OcOrg Which of the following types of organisation on this card [dodid] you work for
Please click the (gt) button for more answer options
1 Private sector firm or company including for example limited companies and PLCs 2 Nationalised industry or public corporation including for example the Post Office and
the BBC 3 Other public sector employer including for example Central GovernmentCivil
ServiceGovernment Agencies Local AuthorityLocal Educational Authority Universities Health AuthorityNHS HospitalsNHS TrustsGP surgeries PoliceArmed Forces
4 CharityVoluntary sector including for example charitable companies churches trade unions
5 Other (specify )
OccT
What was your [main job in the week ending Sunday the [DATE]your last main job]
Please enter your full job title
OccD What [dodid] you mainly do in your job] Please give as much detail as possible and include any special qualifications and training needed to do the job
Soft checkOccd [If less than 40 characters entered at OccD]
That is a short answer Please record as much detail as possible
Stat [AreWere] you working as an employee or [arewere] you self-employed
1 Employee 2 Self-employed
SVise [ASK IF STAT = 1]
In your job [dodid] you have formal responsibility for supervising the work of other employees
1 Yes 2 No
EmpNo [ASK IF STAT = 1]
How many people [workworked] for your employer at the place where you [workworked]
Please click the (gt) button for more answer options
1 1 to 24 2 25 to 249 3 250 to 499 4 500 or more
Solo [ASK IF STAT = 2]
[AreWere] you working on your own or [dodid] you have employees
1 On ownwith partner(s) but no employees 2 With employees
SENo [ASK IF SOLO = 2]
How many people [dodid] you employ at the place where you [workworked]
1 1 to 24 2 25 to 249 3 250 to 499 4 500 or more
FtPtWk [ASK IF (WRKING = YES) OR (SCHEMET = YES) OR (JBAWAY = YES) OR (OWNBUS = YES) OR (RELBUS = YES) OR (EVERWK = YES)]
In your (main) job [arewere] you working
1 Full time (30+ hours a week) 2 Part time (less than 30 hours per week)
Ifpqual [ASK IF AGED lt 70]
Do you have any qualifications from each of the following
Please select all that apply
1 From school college or university 2 Connected with work 3 From government schemes 4 No qualifications
Edqual [ASK IF IFPQUAL = 123DKPREFER NOT TO SAY]
Starting from the top of this list please look down the list of qualifications and select the first one you come to that you have passed
1 Higher degreepostgraduate qualifications 2 First degree (including BEd) Postgraduate Diplomas Certificates (including PGCE)
Professional qualifications at Degree level (eg chartered accountant surveyor) NVQSVQ Level 4 or 5
3 Diplomas in higher education other HE qualification HNC HND BTEC higher Teaching qualifications for schools further education (below degree level) Nursing other medical qualifications (below degree level) RSA Higher Diploma
4 AAS levels SCE higher Scottish Certificate 6th Year Studies NVQ SVQ GSVQ level 3 GNVQ Advanced ONC OND BTEC National City and Guilds Advanced Craft Final level Part III RSA Advanced Diploma
5 Trade Apprenticeships 6 O level GCSE Grades A-C SCE Standard Ordinary Grades 1-3 NVQSVQ GSVQ level
2 GNVQ intermediate BTEC SCOTVEC First General diploma City and Guilds Craft Ordinary level Part II RSA Diploma
7 O levelGCSE grade D-G SCE StandardOrdinary grades below 3 NVQSVQ GSVQ level 1 GNVQ foundation BTEC SCOTVEC First General certificate City and Guilds Part I RSA Stage I-III SCOTVEC modules Junior Certificate
8 Other qualifications including overseas
[IncIntro] [ASK ALWAYS]
The next questions are about income It is important for us to know so we can understand how it influences peoplersquos behaviours and attitudes Please remember that all the information collected is completely confidential and will only be used for the purposes of producing statistics
INCOMERP
Please select the income group which represents [your personalyou and your husbandrsquoswifersquos partnerrsquos combined] income in the last 12 months that is since DATE from all sources before any deductions such as income tax or National Insurance
Please click the (gt) button for more answer options
WEEKLY MONTHLY ANNUAL 1 A Up to pound49 Up to pound216 Up to pound2599 2 B pound50 up to pound99 pound217 up to pound432 pound2600 up to pound5199 3 C pound100 up to pound199 pound433 up to pound866 pound5200 up to pound10399 4 D pound200 up to pound299 pound867 up to pound1299 pound10400 up to pound15599 5 E pound300 up to pound399 pound1300 up to pound1732 pound15600 up to pound20799 6 F pound400 up to pound499 pound1733 up to pound2166 pound20800 up to pound25999 7 G pound500 up to pound599 pound2167 up to pound2599 pound26000 up to pound31199 8 H pound600 up to pound699 pound2600 up to pound3032 pound31200 up to pound36399 9 I pound700 up to pound799 pound3033 up to pound3466 pound36400 up to pound41599 10 J pound800 up to pound899 pound3467 up to pound3899 pound41600 up to pound46799 11 K pound900 up to pound999 pound3900 up to pound4332 pound46800 up to pound51999 12 L pound1000 up to pound1449 pound4333 up to pound6249 pound52000 up to pound74999 13 M pound1450 up to pound1929 pound6250 up to pound8349 pound75000 up to pound99999
14 N pound1930 up to pound2879 pound8350 up to pound12499 pound100000 up to pound149999 15 O pound2880 or more pound12500 or more pound150000 or more
IncomeX [ASK IF MAR = 2 OR 6 OR LIVE = 1 OR 3]
Please select the income group which represents your total PERSONAL income in the last 12 months that is since DATE before any deductions for tax etc Please include income from earnings self employment benefits pensions and interest from savings
Please click the (gt) button for more answer options
WEEKLY 1 A Up to pound49 2 B pound50 up to pound99 3 C pound100 up to pound199 4 D pound200 up to pound299 5 E pound300 up to pound399 6 F pound400 up to pound499 7 G pound500 up to pound599 8 H pound600 up to pound699 9 I pound700 up to pound799 10 J pound800 up to pound899 11 K pound900 up to pound999 12 L pound1000 up to pound1449 13 M pound1450 up to pound1929 14 N pound1930 up to pound2879 15 O pound2880 or more
MONTHLY Up to pound216 pound217 up to pound432 pound433 up to pound866 pound867 up to pound1299 pound1300 up to pound1732 pound1733 up to pound2166 pound2167 up to pound2599 pound2600 up to pound3032 pound3033 up to pound3466 pound3467 up to pound3899 pound3900 up to pound4332 pound4333 up to pound6249 pound6250 up to pound8349 pound8350 up to pound12499 pound12500 or more
ANNUAL Up to pound2599 pound2600 up to pound5199 pound5200 up to pound10399 pound10400 up to pound15599 pound15600 up to pound20799 pound20800 up to pound25999 pound26000 up to pound31199 pound31200 up to pound36399 pound36400 up to pound41599 pound41600 up to pound46799 pound46800 up to pound51999 pound52000 up to pound74999 pound75000 up to pound99999 pound100000 up to pound149999 pound150000 or more
FOLLOWUP [ASK ALWAYS]
This survey is conducted by Kantar Public an independent social research organisation We may like to contact you again with questions relating to this survey or to help with other connected research for the Government or a charity Would it be okay for us to contact you within the next two years
This will involve us keeping a secure record of your name email address andor telephone number for two years Your contact details will not be used for any other purposes and will be destroyed after two years If you answer yes you are giving your permission for us to re-contact you within the next two years to discuss taking part in follow-up research You are not agreeing to take part in any research
1 Yes 2 No
FOLLOWP2 [ASK ALWAYS]
If follow up research related to this survey was being conducted on behalf of the government or a charity would you be willing for Kantar Public to securely pass your name contact details and information from this survey to another research organisation so they could contact you within the next two years
This will involve us keeping a secure record of your name email address andor telephone number for two years Your contact details will only be shared for valid research purposes and will be destroyed after two years
If you answer lsquoyesrsquo you are giving your permission to be re-contacted to discuss taking part in follow-up research within the next two years by another research organisation You are not agreeing to take part in any research
1 Yes 2 No
GiveTel [ASK IF FOLLOWUP = 1 OR FOLLOWUP2 = 1]
Please enter your telephone number in case we want to contact you for any follow up research
ENTER TELEPHONE NUMBER _______________ Prefer not to give my telephone number
PEREMAIL [ASK IF FOLLOWUP = 1 OR FOLLOWUP2 = 1]
Do you have a home or work email address that you access at least once a month
1 Yes 2 No
EMAIL [ASK IF ((FOLLOWUP = 1 OR FOLLOWUP2 = 1) AND PEREMAIL = 1)]
Please enter your email address in case we want to contact you for any follow up research
ENTER EMAIL ADDRESS Prefer not to give my email address
ASK IF gt 1 ADULT AGED 16+ IN HOUSEHOLD Qflw1 Did you discuss any elements of the survey with any other household members either before or during the process of completing the survey
1 Yes 2 No
ASK IF Q1 = Yes
Qflw2 What did you discuss with other members of your household Please select all that apply
1 The survey in general (eg what it is about whether to complete it) 2 The broad content of the survey (eg what sort of issues it covers) 3 How to respond to specific questions in the survey 4 Other (please type in details of what else you discussed)
QFraud [ASK ALWAYS] The Community Life Survey is conducted on behalf of HM Government The quality of the data is very important so please read the statement below and tick the box underneath to confirm you are ready to submit
Confirm full name
I confirm that all of my answers were given honestly and represent my own personal views
TICK BOX
TIMING POINT 10
Appendix B Community Life Paper Questionnaire
Appendix C Advanced Online Letter (with FAQs) Reminder Online Letter Paper Letter
Department for Digital Culture Media and Sport
100 Parliament Street
London SW1A 2BQ
The Resident(s) Street name Town
CountyCountry Postcode
XX Month 20XX
The Community Life Survey Help build stronger communities
This is an invitation to take part in the Community Life Survey an official Government study that allows your views to be
heard on a range of issues affecting your neighbourhood
Your contribution will help strengthen local communities and allows the government charities and
other public sector organisations to track changes over time
Each person who completes the survey will receive a pound10 shopping voucher to thank them for their time
Itrsquos easy to take part Simply go online to wwwcommlifecouk and log in using one of the reference numbers and password
details provided below Up to four people aged 16 or over can take part in your household Each set of login details can only
be used once
The closing date for the survey is [DATE]
Ref No 123456 XXXXX
Ref No 123456 XXXXX
Ref No 123456 XXXXX
Ref No 123456 XXXX
The survey can be completed on a laptop tablet or smartphone If you are unable to complete the survey online and require
a paper version of the questionnaire please use the contact details below
I hope you enjoy the questionnaire and the opportunity to express your thoughts and opinions about your local area
Yours faithfully
Jackie Orme
Head of Statistics Department for Digital Culture Media and Sport HM Government
Communitylifesurveykantarpubliccom
Why did we choose your address
As it is not possible to ask everyone to
take part in the survey we select a
sample of addresses to represent the
entire country
Your address was selected at random
from a list of private addresses held by
the Royal Mail
Who is conducting the survey
The survey is being conducted on behalf of
the Department for Digital Culture Media
and Sport by Kantar Public an
independent research agency
More information about the survey is
available online at httpswwwgovuk
governmentcollectionscommunity-life-
survey--2
Is this survey confidential
Yes The information that is collected will
only be used for research and statistical
purposes Your name and address details
are kept separate from your answers and
will not be passed on to any other
organisation
No individual or household will be
identifiable from the results Your answers
will be combined with others that take part
in the survey You will not receive any lsquojunk
mailrsquo as a result of taking part
Why are my views important
We need people from all age groups
and backgrounds to take part Your
views are important to us as without
them we may not have a representative
picture of the communities that people
live in
Data Protection
All information will be processed in
compliance with the Data Protection
Act 1998 and General Data Protection
Regulation for the performance of
official authority and public interest and
will only be held for as long as it is being
used to produce statistics
If you need further information please
contact dcmsdataprotectionculture
govuk or call 0800 158 2952
What do you need to do
Up to four people aged 16 or over in
your household simply need to go to
wwwcommlifecouk enter one of the
reference numbers and associated
password provided and complete the
questionnaire by the date shown on
the front of the letter If you would
like to take part but are unable to
complete the survey online please
contact the Kantar Public Information
Line and a paper version of the
questionnaire will be sent to you along
with a pre-paid envelope
How do I collect the voucher
Once you have completed the survey
you will be directed to the Perks website
where you can use the survey login
details to sign in and choose from a
range of different pound10 shopping
vouchers
How will the information be used
Information from this survey will help
government departments inform
policies aimed at building stronger
communities and enabling people to
play a more active role in their
communities and society
The information will also be used by
local decision-makers voluntary groups
local government and councils to
understand and drive improvements in
local communities
What are my rights
Completion of this survey is voluntary
We will ask for details such as your
views on the community We will also
ask you for sensitive information such as
your ethnicity and religion but you
donrsquot have to answer these questions
For more information see https
icoorgukfor-the-public
If you are not happy with the way we
are processing your data you have the
right to lodge a complaint to the
Information Commissionerrsquos Office
about our practices at
httpsicoorgukconcerns
Department for Digital Culture Media and Sport
100 Parliament Street
London SW1A 2BQ
The Resident(s) Street name Town
CountyCountry Postcode
XX Month 20XX
The Community Life Survey Help build stronger communities
We recently invited your household to take part in the Community Life Survey an official Government Our records
suggest that the survey has not yet been completed by all adults in your household We are writing again because of the
importance of your household in helping us to gather accurate information
This is your opportunity to make your views heard on a range of issues that affect your local
area
If you or anyone in your household have not taken part please follow the instructions below You will be able to collect your a pound10 shopping voucher at the end of the survey
Itrsquos easy to take part Simply go online to wwwcommlifecouk and log in using one of the reference numbers and
password details provided below Up to four people aged 16 or over can take part in your household Each set of login
details can only be used once
Ref No 123456 XXXXX
Ref No 123456 XXXXX
Ref No 123456 XXXXX
Ref No 123456 XXXX
The closing date for the survey is [DATE]
The survey can be completed on a laptop tablet or smartphone If you are unable to complete the survey online and
require a paper version of the questionnaire please use the contact details below
I hope you enjoy the questionnaire and the opportunity to express your thoughts and opinions about your local area
Yours faithfully
Jackie Orme
Head of Statistics Department for Digital Culture Media and Sport HM Government
Communitylifesurveykantarpubliccom
Department for Digital Culture Media and Sport
100 Parliament Street
London SW1A 2BQ
XX Month 20XX
The Community Life Survey
Help build stronger communities
We recently invited your household to take part in the Community Life Survey an official Government study
that allows your views to be heard on a range of issues affecting your local area Our records suggest that the
survey has not yet been completed by all adults in your household
Each person who completes the survey will receive a pound10 shopping voucher to thank them for their
time
In order to fully understand how people feel about their local area we need as many people to take part in this
important study as possible
Itrsquos easy to take part Simply go online to wwwcommlifecouk and log in using one of the reference numbers
and password details provided below Up to four people aged 16 or over can take part in your household Each
set of login details can only be used once
Ref No 123456 XXXXX
Ref No 123456 XXXXX
Ref No 123456 XXXXX
Ref No 123456 XXXX
To collect your pound10 shopping voucher please complete by [DATE] You can choose a voucher from a range of
retailers
The survey can be completed on a laptop tablet or smartphone If you are unable to complete the survey online and require a paper version of the questionnaire please use the contact details below Thank you for taking the time to tell us about your local area and contribute to an official government study
Yours faithfully
Jackie Orme
Head of Statistics Department for Digital Culture Media and Sport HM Government
Communitylifesurveykantarpubliccom
Appendix D Derived Variable Lists
Variable Name Description
rnssec Respondent Socio-Economic Classification (NS-SEC based on SOC2010) Operational Categories
rnssec8 Respondent Socio-Economic Classification (NS-SEC based on SOC2010) Analytic Categories - 8 groups
rnssec5 Respondent Socio-Economic Classification (NS-SEC based on SOC2010) Analytic Categories - 5 groups
rnssec3 Respondent Socio-Economic Classification (NS-SEC based on SOC2010) Analytic Categories - 3 groups
Rage3 Respondent age 3 categories
Rage3E Respondent age 3 categories for Ethnicity categories
Rage4 Respondent age 4 categories
R2age3 Respondent age2 3 categories
Rage5 Respondent age 5 categories
Rage6 Respondent age 6 categories
R2age6 Respondent age2 6 categories
R3age6 Respondent age (6 categories incl 25yrs in first)
Ragecat Respondent age 7 categories
Rage9 Respondent age 9 categories
Age2564 Respondent age binary grouping (25-64)
Nadlt60X Number of adults under 60 in household
Nadgt59 Number of adults 60 or over in household
Livharm1 Respondent marital status
Nslivarr Respondent living arrangements
Ethnic2 Ethnic group 2 categories
Ethnic4a Ethnic group 4 categories
Ethnic5a Ethnic group 5 categories
Ethnic6 Ethnic group 6 categories
Ethnic11a Ethnic group 11 categories
Rethage9a Respondents Ethnic origin and age (excludes MixedOther)
RSxage12 Respondent sex and age -12 categories
RSexeth6a Respondents sex and Ethnic group - excludes Mixed or Other
E5sex1 Sex within Ethnicity 10 categories
E11sex1 Sex within Ethnicity 11 categories
Xsmain1 English one of main languages
Relprac Whether actively practising Religion
Actrel Whether practising for each Religion
Actrel3 Whether practising Religion (3 groups)
RelBI Respondent Religion Christian and no Religion compared to all minority Religions
Relig7 Respondent Religion 7 categories Jewish included in other
Relstat Practice status for each Religion
E11Relig1 Ethno-Religious groups 11 categories
ZSBeGB How strongly do you belong to Britain
ZSBeNeigh How strongly do you belong to your neighbourhood
SLive5 How long lived in neighbourhood 5 categories
SLive7 How long lived in neighbourhood 7 categories
Zstogeth Agree (definitely or tend to) that local area is place where people from different backgrounds get on well together
Zslocsat How satisfied or dissatisfied with this local area as a place to live
Zcivpar1 Civic participation in last 12 months
Zcivpar3 Civic participation in last 12 months with missing values
Zcivmon1 Civic participation at least once a month
Zpconsul1 Any Civic consultation in past 12 months
Zcivcon1 Civic consultation at least once a month
ZPAffLoc Can you influence decisions affecting area
ZPInfl How important is it personally for you to be able to influence decisions in your local area
Zformon Formal volunteering at least once a month
Zforvol2 Formal volunteering in last 12 months with missing values
Zmxfvol1 Mixed at least once in the last 12 months with people from different ethnic groups religious groups age groups social or educational backgrounds and
those living in different neighbourhoods formal volunteering
Zforvol Formal volunteering in last 12 months
Funhrs2 Formal Volunteering hours-excluding large values
Zempvol1 Employer volunteering in last 12 months
Gemppar1 Employee participated in volunteering scheme
ZIhlpmon Informal help at least once a month
Zinfvol Informal help in last 12 months
Zinfvol2 Informal help in last 12 months with missing values
Ihlphrs2 Informal Volunteering hours-excluding large values
Zinffor Formal or informal volunteering in the last 12 months
Zinfform Formal or informal volunteering in the last month
Zanyvol Formal or informal or employer volunteering in the last 12 months
GivAmtx About how much (altogether) have you given to charity in the last 4 weeks
Givech1 Given money to charity in past 4 weeks (missing values coded as no)
Givech3 Given money to charity in past 4 weeks
GivAmtB Amount given to charity (Banded)
GivAmtB2 Amount given to charity (Banded)
GivAmt2 Amount giving to charity excluding values over 300
ZSPull To what extent would you agree or disagree that people in this neighbourhood pull together SPull collapsed
N13 Whether been a councillor or been a member of a group making decisions in the last 12 months
ZCivact1 Any civic activism activities in past 12 months (CivAct1)
ZCivact2 Any civic activism activities in past 12 months (CivAct2)
ZCivren Any civic activism in the past 12 months
Zcivren3 Any civic activism or consultation in the past 12 months
Zciveng1 Whether taken part in any civic engagement
ZEngFv1 Any civic engagement or formal volunteering in the last 12 months
Zdill Limiting long-term illnessdisability
Sid2 Respondent sexual identity 3 categories
Student Full-time student
Zquals Respondents (aged 16-69) Highest Qualification
Zquals1 Respondents Highest qualification all ages
Zqual2 No Formal Qualifications Formal Qualifications (web respondents only)
Zqual3 No Formal QualificationsFormal Qualifications
Zvolgps BME or no qualifications or limiting long term illness
ZIncomhh Respondent and partners (if applicable) gross income 9 categories
ZIncomer Respondent and partners (if applicable) gross income 9 categories
DVILO3a Respondent economic status 3 categories
DVILO4a Respondent economic status 4 categories
SOC10mg SOC 2010 Major Groups
SOC10smg SOC2010 Sub-Major Group
Zschatny Whether chat to neighbours more than to just say hello
Zschatnf Frequency of chatting to neighbours more than to just say hello
Zvyfreq Frequency of previous unpaid help given to a group club or organisation
ZSFavN Agree (definitely or tend to) that they borrow things and exchange favours with neighbours
ZLocAtt Whether agree or disagree that when people get involved in their local community they can really change the way an area is run
ZLocPeop1 Whether aware of local people getting involved in a local issueactivity
ZLocInv1 Whether been personally involved in helping out with local issueactivity
ZLocOft Number of occasion in the last 12 months have spent time helping with
activityissue in local area
pethdec Percentage of minority ethnic households in ward
- Structure Bookmarks
-
- Appendix D Derived Variable Lists
-

Acknowledgements
Our thanks go to all respondents who gave up their time to take part in the Community Life Survey
We would also like to thank The Community Life Survey Team at the Department for Digital Culture
Media and Sport
Information on the Community Life Survey and associated publications are available from
httpswwwgovukgovernmentcollectionscommunity-life-survey--2
For further information please contact
Community Life Survey Team
DCMS
100 Parliament Street
London
SW1A 2BQ
Email evidencedcmsgovuk
Contents
1 Introduction4
2 Development 6
3 Sampling 10
4 Questionnaire 15
5 Fieldwork 17
6 Data Processing 23
7 Weighting 26
8 Standard errors 33
9 Data user guide 55
10 Appendices58
1 Introduction
This technical report covers the Community Life Online and Paper Survey in 201920 Technical
reports for previous years are available on the UK Data Archive
Background to the survey
The Community Life Survey has been conducted by Kantar on behalf of the Department for Digital Culture Media and Sport since 20121 The online and paper data set from every survey year between 201213 and 201819 is available on the UK Data Service The 201920 data set will be available a few months after publication of the report and a data user guide can be found in Chapter 9 of this report
Survey Objectives
The Community Life Survey provides Official Statistics on issues that are key to encouraging social action and empowering communities including volunteering charitable giving community engagement well-being and loneliness
The key objectives of the survey are to
Provide robust nationally representative data on behaviours and attitudes within
communities to inform and direct policy and action in these areas
Provide data of value to all users including public bodies external stakeholders and the
public engaging with end users to refine and develop the survey as appropriate
Underpin further research and debate on building stronger communities
Survey Design
The Community Life Survey 201920 is conducted via an online and paper methodology using
Address Based Online Surveying (ABOS) an affordable method of surveying the general population
that still employs random sampling techniques ABOS is also sometimes referred to as ldquopush to webrdquo
methodology In brief this methodology takes the following approach
1 A stratified random sample of addresses is drawn from the Royal Mailrsquos postcode address file
and an invitation letter is sent to lsquothe residentsrsquo of each one containing username(s) and
password(s) plus the URL of the survey website
2 Respondents can log on using this information and complete the survey as they might any
other online survey with the option to stop and restart their survey when it suits them
3 Non-responders receive up to two reminder letters with some respondents receiving paper
questionnaires alongside the second reminder letter2
1Between 2012-13 and 2015-16 the survey was conducted on behalf of the Cabinet Office
2 Further information on which respondents receive a paper questionnaire in the second reminder can be found in section 331
4 Once the questionnaire is complete the specific username and password cannot be used
again ensuring data confidentiality from others with access to this information
5 Paper questionnaires are also available on request for those who are unable to take part
online The paper questionnaire is a reduced version of the online survey
For further details about push to web please see lsquoAn introduction to address-based online surveyingrsquo3
Questionnaire
Respondents can complete the survey online or by completing a paper questionnaire The survey asks about a range of topics including identify social networks sense of community civic engagement volunteering social action subjective wellbeing and loneliness
The paper questionnaire covers the same topics as the online survey however the paper questionnaire is reduced in length More information about the survey used in both modes can be found in Chapter 4
Weighting
The survey data is weighted to compensate for variations in sampling and response probability The inferential population is lsquoall adults in England aged 16+ and living in private residencersquo
The data is calibrated to ensure that the weighted sample matches population totals for several dimensions Gender by age group degree level education by age group housing tenure region household size ethnic group and internet usage by age group As respondents can complete the survey online or paper questionnaire there are different weights for online only and online and paper questions More information about the weighting process can be found in Chapter 7
3 httpthe-sraorgukjournal-social-research-practice
2 Development
The Community Life Survey first took place in 201213 and was conducted via a face-to-face
methodology The survey incorporated key measures and replicated the main methodology from the
Citizenship Survey which was conducted from 2001 to 2011 The face-to-face survey was effective in
providing a robust and nationally representative Official Statistic however the method was
expensive and resource intensive As a result Kantar was commissioned to carry out development
work to explore the feasibility of incorporating onlinepaper methods of data collection which cost
significantly less than face-to-face interviews for future survey years
The programme of methodological development work was carried out in parallel to the face-to-face
survey and conducted between 2012 and 20154 It comprised four separate stages
Stage 1 Testing and refining an initial field model for onlinepaper survey delivery
Stage 2 Larger scale onlinepaper pilot conducted alongside the face-to-face survey
Stage 3 Testing the feasibility of sampling all adults in the household instead of one selected at
random
Stage 4 Study to investigate the relative contribution of sample effects and mode effects in
explaining estimate differences between face-to-face and onlinepaper modes
Online and Paper Survey Development
As the methodology is relatively new the survey has continued to evolve as further evidence
becomes available (see below for references) Developments by survey year are detailed in
summary below more details can be found in the relevant yearrsquos technical report
Online and paper developments by Survey Year
201213 The first Community Life Survey took place
Conducted using a face-to-face methodology The survey incorporated key measures and
replicated the main methodology from the previous Citizenship Survey (commissioned by the
4 For more information on the findings of this development work please see Rebecca Hamlyn Alice Fitzpatrick and Joel
Williams (2015) Investigating the viability of moving from a face-to-face to an online postal mode
(httpswwwgovukgovernmentuploadssystemuploadsattachment_datafile466921Investigating_the_the_viability_of_movi
ng_from_a_face-to-face_to_an_online_postal_mode_FINALpdf)
Department for Communities and Local Government5 from 2001 to 2011) Details of the
methodology and achieved samples can be found in the 2012-13 technical report6
2012 Large-scale ABOS Test
A large-scale test of the Address Based Online Sampling (ABOS) design was conducted
after Kantar7 were commissioned to explore cost effective methods for future survey years
The aim of the test was to scope and test a potential field model for onlinepostal survey delivery The test was based on a relatively large-scale random probability survey with c 6700 issued addresses with invitations to access the online survey sent out by post At each address one adult aged 16+ was invited to take part with selection based on the adult in the household who had the ldquolast birthdayrdquo Up to two postal reminders were sent to each address to maximise response
Four different incentive packages were tested in the first letter pound5 conditional voucher pound10 conditional voucher pound5 unconditional voucher included no incentive (the control group) A random subset of non-responders received a postal questionnaire with their second
reminder which they could complete instead of the online version The paper version of the
questionnaire was an edited version of the online interview with a reduced number of
questions as the full survey was too lengthy to accommodate on paper
For more detailed results of this development work please see the full report for 2012138
201314 Full scale test
Based on recommendations for an optimal design arising from Stage 1 a larger scale onlinepostal test survey was conducted which ran concurrently with the standard face-to-face survey during the survey year April 2013-March 2014
A larger annual sample size of c10000 achieved onlinepostal questionnaires over the survey year provided a more robust test of differences in a) sample composition and b) measurement between onlinepostal and face-to-face modes
The larger sample size also allowed some initial exploration of the relative contribution of samplingfieldwork methods and data collection mode in explaining differences between onlinepostal and face-to-face survey estimates Alongside the full-scale test the feasibility of sampling all adults in the household instead of one selected at random was also explored This involved an additional issued sample of n=1400 addresses in Quarter 3 which were issued with different instructions for selecting which adults should complete the survey all other features of the survey were the same
In this variant the invitation letter invited all adults in the household (up to a maximum of four) to complete the survey with an incentive of a pound10 voucher offered to each responding adult This was proposed as a solution to the problem of non-compliance with within-household sampling instructions identified at Stage 1
The study allowed a comparison of the all adults vs single adult design on several measures
including completion behaviour associated with higher household conditional incentives
sample profile and data quality For full details please see the technical report for 2013149
5 Now the Ministry of Housing Communities and Local Government
6 httpdocukdataserviceacukdoc7433mrdocpdf7433_community_life_survey_technical_reportpdf
7 Then TNS-BMRB
8 httpswwwgovukgovernmentuploadssystemuploadsattachment_datafile325872Annex_B_-_Summary_of_web_experiment_findings_2012-13pdf
9 httpdocukdataserviceacukdoc7737mrdocpdf7737_community_life_2013-14_web_survey_technical_reportpdf
201415 The any adult approach was adopted into the survey
Following the work exploring the feasibility of sampling all adults in the household conducted
alongside the 201314 survey the all adult design was adopted into the survey design
A study was also conducted to investigate the relative contribution of sample effects and mode effects in explaining differences between face-to-face and onlinepostal mode For
details and analysis of these experiments please see experiment report10
201516 50 of selected addresses received a second reminder with two copies of the
paper questionnaire
In 201516 the design of the survey was amended so that up to two copies of the paper
questionnaire were included in reminder mailings targeted towards more deprived areas
This was done to limit between-strata variance in response Paper questionnaires remained
available to all households on request
201617 Survey moved to an online and paper design only
In 201617 the survey moved to a solely online and paper design The overall design of the
201617 online and paper survey remained largely unchanged from the 201516 survey
However the design was modified to achieve minimum usable samples of BAME groups For
full details please see the technical report for 20161711
201718 Overall design remained largely unchanged from 201617
Paper questionnaires were sent out in the second reminder to approximately two thirds of
households and they were also available on request to all households
Invitations for the 201718 survey were sent out to 31059 addresses with 7558 online
interviews and 2659 paper questionnaires completed over the course of the year Full details
of sampling and response are covered in detail within the technical report for 20171812
201819 Overall design remained unchanged Letter experiment conducted
Paper questionnaires were sent out in the second reminder to approximately two thirds of
households and they were also available on request to all households
Invitations for the 201819 survey were sent out to 31761 addresses with 7902 online
interviews and 2725 paper questionnaires completed over the course of the year Full
details of sampling and response are covered in detail in this technical report
An experiment was conducted in Q2 to test the effectiveness of a new letter design
Experiment letters were developed following a review of best practice and wider literature
and issued to half the sample in Q2 Full details of this experiment are available in the
10httpsassetspublishingservicegovukgovernmentuploadssystemuploadsattachment_datafile663700Disentangling_sam ple_and_mode_effects_on_the_Community_Life_Survey_-_Nov_2017_revisionpdf
11httpsassetspublishingservicegovukgovernmentuploadssystemuploadsattachment_datafile651589Community_Life__ Online_and_Paper_Survey_Technical_Report_-_2016-17_v4_FINALpdf
12httpsassetspublishingservicegovukgovernmentuploadssystemuploadsattachment_datafile770554Community_Life_O nline_and_Paper_Survey_Technical_Report_2017-18pdf
201819 technical report13 The experiment letters were adopted for the full sample in Q3 and
Q4
201920 Overall design remained unchanged
Paper questionnaires were sent out in the second reminder to approximately two thirds of
households and they were also available on request to all households
Invitations for the 201920 survey were sent out to 31728 addresses with 7849 online
interviews and 2394 paper questionnaires completed over the course of the year Full
details of sampling and response are covered in detail in this technical report
13httpsassetspublishingservicegovukgovernmentuploadssystemuploadsattachment_datafile820606Community_Life_O nline_and_Paper_Survey_Technical_Report_-_201819pdf
3 Sampling
Sample design objectives
The 201920 Community Life Survey sample design had to achieve several objectives
A responding sample size of at least 10500 adults in England aged 16+ with the assumption that
up to 500 would be edited from the dataset leaving a total of at least 10000
A responding sample size of Black and Minority Ethnic (BAME) respondents of c2000 after
editing
An overall effective sample size of c6000
lsquoUsablersquo sample sizes for each of four most prevalent ethnic categories ((i) White British (ii) Asian
ethnic groups (iii) Black ethnic groups and (iv) other ethnic groups combined)
The lsquoeffectiversquo sample size in this context reflects the statistical value of the data after weighti1ng to
compensate for unequal sampling probabilities As a general rule the more the sample needs to be
weighted the smaller the effective sample size relative to the actual responding sample size
An equal probability sample of addresses would not have allowed all these objectives to be achieved
so a stratified unequal probability sample of addresses was drawn
The sample frame was the Royal Mail Postcode Address File (PAF) which includes c99 of all
residential addresses in England
Address sampling protocol
Before sampling from the Royal Mail Postcode Address File the residential addresses14 in each
ethnic mix stratum were sorted by (i) expected response stratum (ii) local authority and (iii) postcode
A random start-point was selected within each ethnic mix stratum before a systematic sample of
addresses was drawn with an interval suitable to obtain the target number of addresses for that
stratum A 25 over-sample was included (taking the total number of sampled addresses up from
31730 to 39662) to provide a reserve pool In the event no addresses were required from the
reserve pool
The main sample addresses (ie excluding the reserve pool) were systematically allocated (with
equal probability) to one of quarters 1 2 3 or 4 and then further subdivided (with equal probability)
into two batches each with a different issue date Historically the response rate in quarter 4 (January
to March) has been higher than in other quarters so only 235 of the sample is allocated to that
quarter with 255 allocated to each other quarter
14 The lsquosmall userrsquo subset of the Postcode Address File was used as the sample frame This is thought to contain nearly all residential addresses as well as a subset of non-residential addresses that cannot be separately identified as such
The primary stratum Ethnic mix
Because the sample design objectives are all focused on ethnic group sample sizes the primary
stratum defined addresses in terms of their ethnic mix Ten ethnic mix strata were defined using a k-
means clustering algorithm This algorithm sorted all Lower Layer Super Output Areas (LSOAs) in
England into ten groups on the basis of a set of 2011 census variables Each variable was equal to
the (estimated) proportion of adults in LSOA t who self-identified as part of ethnic group g There
were seven of these variables
White British in LSOA t
Indian in LSOA t
Pakistani in LSOA t
Bangladeshi in LSOA t
Black African in LSOA t
Black Caribbean in LSOA t
White (not British) in LSOA t
The k-means algorithm identified a clustering solution that maximised the difference in cluster-level
means across all the input variables15 Each cluster is one ethnic mix stratum All addresses in each
LSOA were included in the ethnic mix stratum of that LSOA Within each of these ten ethnic mix
strata a single address sampling fraction was applied but this fraction varied between strata These
strata were first used for the 201617 Community Life Survey
The secondary stratum Expected response rate
The secondary stratum was first used for the 201718 survey Each LSOA in England was placed into
one of five strata based on its modelled response rate if (i) no paper questionnaires were included in
the 2nd reminder and (ii) no 3rd reminders were used As with the ethnic mix strata all addresses in
each LSOA were included in the expected response stratum of that LSOA The model was based on
data from the 201617 survey and each LSOA was allocated to an expected response stratum on that
basis To keep stratum definitions consistent over time this model has not been updated since the
201617 survey However it is highly unlikely that any LSOA has been allocated to a wholly
inappropriate stratum
The five strata were defined as follows
1 lt025 expected online responses per sampled address
2 gt=025lt030 expected online responses per sampled address
3 gt=030lt035 expected online responses per sampled address
4 gt=035lt040 expected online responses per sampled address
5 gt=040 expected online responses per sampled address
15 The algorithm needed to be run several times with different lsquoseed valuesrsquo to ensure that the solution was stable (did not vary much as a function of the seed value selection) However only one run was used to define strata
The expected number of responses was estimated via a generalised linear model and is a function of
the local LSOArsquos region ethnic mix stratum index of multiple deprivation and four summary variables
each representing a different dimension of census data16
In each secondary stratum a different data collection design was used in strata 1 and 2 every 2nd
reminder contained two paper questionnaires to encourage response in stratum 3 a random 46 of
2nd reminders contained two paper questionnaires in strata 4 and 5 no 2nd reminders contained
paper questionnaires The intention was to reduce the between-strata variance in response rate to the
following levels
Stratum 1 = 027 expected responses per sampled address
Stratum 2 = 036 expected responses per sampled address
Stratum 3 = 034 expected responses per sampled address
Stratum 4 = 034 expected responses per sampled address
Stratum 5 = 041 expected responses per sampled address
Address sample sizes in each stratum
The primary and secondary strata were crossed to form 43 final strata (not 50 because seven
combinations were empty) Because the sampling fraction did not vary within the ten ethnic mix strata
it was only necessary to calculate the number of addresses to sample for each of these primary strata
rather than for every one of the 43 final strata
The number of addresses to sample in each ethnic mix stratum was calculated using data from the
2016-18 surveys This data allowed estimation of the expected response rate in each of the 43 final
strata given the data collection design used in each one The same data was also used to estimate
relative response for each ethnic group compared to what would be expected given its Census
distribution
From this it was assumed that
The White British ethnic group would respond at 11 times the expected rate
Asian ethnic groups would respond at 08 times the expected rate
Black ethnic groups would respond at 06 times the expected rate
Other ethnic groups combined would respond at 11 times the expected rate
Using this data Kantar used a solving algorithm to identify a design that maximised the total effective
sample size given the constraining sample design objectives outlined at the start of this report
section The final design is shown in table 31
16 The profile of each LSOA is represented by a set of six Census-derived lsquoprincipal componentrsquo scores each reflecting a different aspect of that LSOA One of these principal components is strongly correlated with the neighbourhoodrsquos index of multiple deprivation one is correlated with the proportion of accommodation units that are flats one with the presence of students one with the share of the population aged 65+ and two are correlated with different aspects of the ethnic mix Four of the six factors proved to be significant predictors of response to the Community Life Survey
In detail a statistical technique called PCA was used to form uncorrelated linear combinations (lsquoprincipal componentsrsquo) of 42 LSOA-level Census proportions (eg of 16-24s with degree-level qualifications) The first principal component accounts for as much variance as possible across the 42 input variables Successive components explain the - progressively smaller ndash residual variance and are all (by design) uncorrelated with each other These principal components were then lsquorotatedrsquo using the varimax algorithm which seeks to minimise the number of input variables that have high correlations with each of the first f factors (f is user-specified but should explain a high percentage of the total variance f = 6 in this case explaining 77 of the total variance) The varimax rotation method simplifies interpretation compared to other rotation methods and compared to the initial (un-rotated) principal components
Table 31 Ethnic mix strata and the target number of addresses to sample in each
Ethnic mix stratum
White British
Asian Black Other Share of Census population
Share of address sample
Addresses to sample
1 44 39 5 12 12 22 694
2 49 18 16 18 29 64 2019
3 47 13 8 32 39 92 2925
4 88 3 1 8 207 172 5465
5 17 60 9 15 18 39 1248
6 66 13 5 16 73 114 3607
7 15 67 7 11 11 26 829
8 27 23 23 27 44 116 3676
9 95 1 0 4 449 231 7332
10 79 7 3 11 118 124 3935
All 80 7 3 9 1000 1000 31730
Table 32 shows the expected responding sample size for each ethnic group as well as the expected
effective sample size after weighting to compensate for unequal sampling probabilities
Table 32 Expected sample sizes for each ethnic group
Ethnic group Expected sample size (after editing)
Expected effective sample size
after weighting17
White British 7148 6145
Asian 1070 913
Black 363 321
Other groups 1419 1138
All 10000 8523
(All Non-White British groups)
(2852) (2318)
17 This ignores the variable-specific effects of sample stratification and clustering by household The latter will tend to further reduce the effective sample size
Within-address sampling protocol
At each address all permanently resident adults aged 16+ were invited to take part in the survey
although only four serial numbers were included in the letter (more could be requested for larger
households) It is worth noting that a small fraction (lt3) of addresses in England contain more than
one household There is no household selection stage so at these addresses the selected
household is the one that picks up the invitation letter
4 Questionnaire
Overview
The questionnaire for the 201920 survey was intended to provide comparable data to previous years
As a result minimal changes were made to the questionnaire
Questionnaire development
The questionnaire was reviewed and updated to reflect current policy priorities and best practice As a
result the following changes were made
CivPart In the last 12 months that is since [DATE ONE YEAR AGO] have you [Attended a public
meeting rally or taken part in a public demonstration or protestrsquo A comma was added following the
word lsquomeetingrsquo
GGroup In the last 4 weeks have you given money to charity in any of the following ways Please
exclude donating goods or prizes A new answer code was added lsquoDonation ndash made through
contactless technologyrsquo The wording at response code Did not give money to charity was updated
from Did not give to charity These changes were also added to the paper questionnaire
Lon1Lon2Lon3LonOft How often do you feel that you lack companionshipHow often do you feel
left outHow often do you feel isolated from others lonely Following the experiment conducted in
the 201819 survey year these questions were added into the subjective wellbeing section following
on from WellB3 LonOft was moved to follow on from Lon3
Vnbv How important is it for you personally that you have opportunities to mix with people from
different backgrounds This question was added to the Your Community section following
STrustGen2 This question was also added to the paper questionnaire
Online Questionnaire Content 201920
The final Community Life Online Survey 201920 consisted of the following modules
Demographics ndash details of the household including the number of adults and children the gender
and age of people within the household and details of the relationships within the household
Identity and Social Networks ndash basic demographic information on the respondentrsquos friends and
how often and how they communicate with friends and family that they do not live with
Your Community ndash the respondentrsquos sense of belonging to their immediate neighbourhood local
area and Britain as well as their relationships with neighbours and their satisfaction with the local
area
Civic Engagement ndash involvement in local affairs community decision making through formal roles
or groups and their ability to influence decisions affecting both the local area and Britain
Volunteering ndash involvement with groups clubs or organisations giving help through these groups
(known as formal volunteering) volunteering through work previous lapsed volunteering giving
help as an individual to someone who is not a relative (known as informal volunteering) and
charitable giving in the past four weeks
Social Action ndash awareness of local people getting involved in their local area to either set up a
new service or amenity stop the closure of a service or amenity stop something happening
helping to run a local service or amenity help to organise a community event such as a street
party or helping with any other issues affecting the local area whether the respondent is
personally involved in any of these activities what they do how they became involved why they
became involved and if they are not involved why they are not
Subjective Wellbeing and loneliness ndash the respondentrsquos feelings on aspects of their life
including the extent to which they feel the things they do in life are worthwhile levels of happiness
and satisfaction and feelings of anxiety and loneliness
Demographics Part Two ndash covers other demographic information such as the general health of
the respondent and their citizenship employment status education and income This section ends
by asking if the respondent would be happy to be recontacted in any follow up research
A copy of the online questionnaire can be found in Appendix A
For the online questionnaire ldquoDonrsquot knowrdquo and ldquoPrefer not to sayrdquo were presented on a second screen
for the majority of questions with the exception of a small number of more sensitive demographic
questions where they appear on the first screen For a few questions additional codes were also
included on a second screen These codes are included in the questionnaire in Appendix A If a
respondent clicked forward without selecting an answer then these answer codes would appear This
was done to replicate the initial face-to-face approach used in previous years where these codes
were not seen by respondents For full details please see the technical report for 2015-1618
Paper Questionnaire Content 201920
The paper version of the questionnaire covered a smaller subset of questions than the online survey
though still covered the same subject areas outlined in section 43 The paper questionnaire was
reduced in length as the time taken to complete the online survey averaged around half an hour
which was not deemed appropriate for a paper questionnaire
The question wording used in both the online and the paper versions of the questionnaire was the
same In total around 50 of the questions included in the online questionnaire were included in the
paper questionnaire
Given it is not possible to hide answer codes in paper questionnaires ldquoDonrsquot know and ldquoPrefer not to
sayrdquo answer codes were generally omitted from the paper questionnaire However given the sensitive
nature of the wellbeing and loneliness questions these options were retained for these questions
Respondents were also informed on the front page of the paper questionnaire that if they did not
remember know or want to answer a question then they could cross the relevant box where shown
or leave the question blank
A copy of the paper questionnaire can be found in Appendix B
18 httpdocukdataserviceacukdoc8124mrdocpdf8124_community_life_web_survey_technical_report_2015-16_finalpdf
5 Fieldwork
Introduction
Fieldwork for the Community Life Survey 201920 was conducted between April 2019 and March
2020 with sample issued on a quarterly basis Each quarterrsquos sample was split into two batches the
first of which began at the start of the quarter and the second began midway through the quarter The
specific fieldwork dates for each quarter are shown below in table 51
Table 51 Fieldwork dates
Quarter Fieldwork start Fieldwork end
Quarter 1 24 April 2019 30 June 2019
Quarter 2 10 July 2019 29 September 2019
Quarter 3 2 October 2019 29 December 2019
Quarter 4 8 January 2020 29 March 2020
The paper questionnaire acted as an add-on to the online survey and was made available to around
60 of respondents at the second reminder stage based on the response probability strata as
descripted in section 331 The paper questionnaire was also available on request to all respondents
who preferred to complete the survey on paper or who were unable to complete online
Contact procedures
521 Online letters
All sampled addresses were sent a letter in a white envelope with an On Her Majesties Service logo
The letter invited up to four people aged 16 or over in the household to take part in the survey The
letter directed respondents to wwwcommlifecouk and provided information on how to log in to the
survey Four sets of unique reference numbers and passwords were provided to each address for the
respondents to log in with
The letter informed the resident(s) that they would be able to claim a pound10 shopping voucher after
completing the survey as a thank you for taking part (see section 54 for details of incentives) The
letter also provided an email address and freephone number for resident(s) to contact Kantar on in
case they wanted more information regarding the survey or needed to request a postal questionnaire
The back of the letter contained important information including the purpose of the survey how the
addresses were selected data protection the voluntary nature of the survey and the importance of
taking part It also included information for those respondents who wished to take part via postal
questionnaire informing them that if requested a paper version of the survey will be posted to them
along with a pre-paid envelope to allow it to be returned at no extra cost
Letters were posted on a Wednesday to allow for them to arrive by Friday to maximise responses
over the weekend
Two weeks after the initial invitation letters were sent a reminder letter was sent out to all addresses
where the survey had not been completed by all household members19
A further two weeks after the first reminder was sent out a second reminder was posted There were
three separate second reminder letters each with slightly different text One version contained one
postal questionnaire another had two postal questionnaires and the other was a reminder letter only
As outlined in table 52 below roughly 60 of these second reminders contained paper versions of
the questionnaire along with pre-paid return envelopes This is based on the response probability
strata (see section 23) The majority of households that received paper questionnaires with their
reminder letters received two copies Respondents state the number of adults in the household as
part of the survey so those with only one remaining household adult who has not completed the
survey receive one copy of the paper questionnaire Reminder letters were not sent to households
which had chosen to opt-out or had already requested paper questionnaires
Table 52 Breakdown of second reminder letters with paper questionnaires
Stratum (IMD) Method
1 (Lowest response probability strata) Paper questionnaires in all second reminders
2 Paper questionnaires in all second reminders
3 Paper questionnaires in 46 of second
reminders
4 No paper questionnaires in reminders
5 (Highest response probability strata) No paper questionnaires in reminders
The specific dates for each letter dispatch over the 201920 survey year are outlined below in table
53
Table 53 Letter dispatch dates
Quarter Batch Initial letter
First
reminder
letter
Second
reminder
letter
Third
reminder
letter
Quarter 1
1 23 April 2019 8 May 2019 22 May 2019 NA
2 15 May 2019 29 May 2019 12 June 2019 NA
Quarter 2
1 10 July 2019 24 July 2019 7 August
2019 NA
2 14 August
2019
28 August
2019
11 September
2019 NA
Quarter 3
1 2 October
2019
16 October
2019
30 October
2019 NA
2 6 November
2019
20 November
2019
12 December
2019 NA
Quarter 4 1 8 January
2020
22 January
2020
5 February
2020 NA
19 The total number of household members is collected in the first interview completed
2 12 February
2020
26 February
2020
11 March
2020 NA
Copies of the online letters used during 201920 are available in Appendix C
522 Letter experiments
In quarter 1 and quarter 2 of the survey an experiment was conducted using different addressees on
the letters The aim of the experiment was to attempt to further improve the response rate by testing
alternative addressee designs The sample was split into three groups with one third (treatment
group 1) being addressed to the lsquoResidents of [Local Authority]rsquo one third (treatment group 2) with a
blank addressee and one third (control group) receiving letters addressed to lsquoThe Residentsrsquo The
aim was to establish whether a different addressee increased the response rate among the treatment
groups The same addressee was used across all letters sent to the household and all other letter
content remained the same across groups
Initial results from quarter 1 showed that response rates did vary between treatment and control
groups however these differences were not statistically significant The experiment was continued
into quarter 2 where these findings were replicated
In quarter 3 and quarter 4 the experiment was adapted to vary the addressee between the invite 1st
reminder and 2nd reminder letters The sample was split into three groups each using a different
sequence of addressee for the letters
Group One sequence
Invite lsquoThe Residentrsquo
1st Reminder lsquoThe Resident of [Local Authority]
2nd Reminder lsquo[Blank]rsquo
Group two sequence
Invite lsquoThe Resident of [Local Authority]
1st Reminder lsquo[Blank]rsquo
2nd Reminder lsquoThe Residentrsquo
Group three sequence
Invite lsquo[Blank]rsquo
1st Reminder lsquoThe Residentrsquo
2nd Reminder lsquoThe Resident of [Local Authority]
Initial results from quarter 3 showed that response did vary between treatment and control groups
however these differences were not statistically significant The experiment was continued into
quarter 4 where these findings were replicated
Neither experimental design was deemed to outperform the control as neither experiment
significantly improved the response rate against the control group As such the control remained the
addressee used on the survey materials
523 Confidentiality
Each of the letters assured the respondent of confidentiality by answering the question ldquoIs this survey confidentialrdquo with the following
ldquoYes The information that is collected will only be used for research and statistical purposes Your
name and address details are kept separate from your answers and will not be passed on to any
other organisation
No individual will be identifiable from the results Your answers will be combined with others that take
part in the survey You will not receive any lsquojunk mailrsquo as a result of taking partrdquo
Fieldwork figures
The next section outlines the fieldwork figures and response rates achieved on the 201920 survey
Figures from the online survey are outlined first followed by the paper figures and then both modes
combined
531 Online fieldwork
When discussing fieldwork figures in this section response rates are referred to in two different ways
Household response rate ndash This is the percentage of households contacted as part of the
survey in which at least one questionnaire was completed
Individual response rate ndash This is the estimated response rate amongst all adults that were
eligible to complete the survey
The target number of completed questionnaires required on the online survey over the 201920
survey year was 8000 equating to 2000 per quarter In total 31728 addresses were sampled20
from which 7849 interviews were achieved having removed 700 after validation checks21 At least
one interview was completed in 6938 households which represented an online household response
rate of 1685
In an online survey of this nature no information is known about the reason for non-response in each
individual household However it can be assumed that 8 of the addresses in the sample were not
residential and were therefore ineligible to complete the survey Once deadwood22 addresses are
accounted for the final online household response rate was 1831
The expected number of eligible individuals per residential address was averaged at 189 per
address therefore the total number of eligible adults sampled was 55169 The online survey was
completed by 7849 people indicating an online individual response rate of 1422
The full breakdown of the fieldwork figures and response rates are available in table 54
Table 54 Online response rates by quarter
Quarter
No of
sampled
addresses
No of
completed
questionnaires
No
households
completed
Household
response
rate (excl
deadwood)
Individual
response
rate (excl
deadwood)
Quarter 1 8102 1931 1332 1787 1371
Quarter 2 8100 2065 1398 1876 1466
20 For more information on the address sampling protocol please see section 33
21 For more information on the validation checks please see section 62
22 Deadwood refers to addresses which are not eligible to complete the survey such as second homes vacant properties or business addresses These addresses were not included in survey response rate calculations
ndash
Quarter 3 8089 1955 1327 1783 1390
Quarter 4 7437 1898 1289 1884 1468
Total 31728 7849 5346 1831 1422
532 Paper fieldwork
Over the course of the 2019-20 survey year 355 paper questionnaires were requested across 260
households This represented about 1 of the overall sampled households Paper questionnaires
were returned by 189 respondents making a response rate of 5323 amongst those who requested
a paper version of the questionnaire
The number of paper questionnaires returned over the survey year including both those requested by
respondents and those included within the second reminder is shown in table 55
Table 55 Number of paper questionnaires returned by quarter
Quarter No of paper questionnaires returned by
quarter
Quarter 1 613
Quarter 2 670
Quarter 3 581
Quarter 4 530
Total 2394
533 Combined fieldwork figures
By combining the 7849 completed online surveys and the 2394 returned paper questionnaires the
total number of interviews completed for the 201920 survey stands at 10243 interviews The
combined household response rate including online and paper interviews therefore reached 2186
and after accounting for deadwood addresses the overall household response rate was 2377 The
overall individual response rate was 1857
The overall fieldwork figures including online and paper interviews are broken down by quarter in
table 56
Table 56 Combined online and paper fieldwork figures by quarter
Quarter
No of
sampled
addresses
No of
interviews
achieved
online + paper
No
households
completed
Household
response
rate (excl
deadwood)
Individual
response
rate (excl
deadwood)
Quarter 1 8102 2544 1732 2324 1806
Quarter 2 8100 2735 1851 2484 1942
Quarter 3 8089 2536 1714 2303 1803
Quarter 4 7437 2428 1641 2398 1878
Total 31728 10243 6938 2377 1857
53 Combined fieldwork figures ndash weighted
Due to the sample approach which targets certain ethnic groups23 addresses with a lower than
average expected response probability were over sampled As a result this means the response rate
is not population-representative However weighting can rectify this resulting in a population-
representative 158 individual response rate for online only and a population-representative overall
(online or paper) individual response rate of 194
Incentive system
All respondents that completed the Community Life Survey were given a pound10 shopping voucher as a
thank you for taking part
541 Online incentives
The pound10 incentive available to respondents who completed the survey online comprised online
vouchers which were provided by email or gift cards which were sent in the post Online vouchers
were emailed to respondents within 24 hours whilst paper vouchers were sent in the post and arrived
within one week of the order Online survey respondents could choose which voucher they received
from a choice of four
541 Paper incentives
Respondents who returned the paper questionnaire were also provided with a pound10 shopping voucher
This voucher was sent in the post and could be used at a variety of high street stores Once the
completed questionnaire was returned by the respondent vouchers were posted to them within five
working days
Survey length
The median completion length of the online surveys with outliers excluded24 was 28 minutes and 30 seconds and the mean was 33 minutes and 06 seconds25 This is based on full surveys and does not include partial completions
23 For more information on the sample design please see sections 31-34
24 Cases with a completion time of less than 10 minutes or greater than 150 minutes were removed from the calculation
25 This figure is calculated by removing outliers which were any interviews shorter than 10 minutes or longer than 150 minutes
6 Data Processing
Editing
Online
Where clearly relevant the Computer Assisted Web Interviewing program (CAWI) specified numerical
ranges to ensure answers were sensible Logic checks were also scripted to check answers that may
not be feasible eg if the respondent coded they are an employee initially but self-employed at a
subsequent question
Paper
With paper questionnaires there are a number of completion errors in the data that need to be
resolved These errors generally arise for the following reasons
Cases where the individual selects more than one response to a single coded question
Cases where individuals can select more than one response however they select two conflicting answers such as none of these and a valid survey response
Cases where responses are left blank even though the respondent should have answered the question
Cases where the individual fails to select an answer for a filter question but then provides an answer for subsequent questions relating to the filter question
In these situations respondents were coded as system missing (either Donrsquot know or Refused)
Data Quality
With interview-based surveys we have confidence that almost all the data is collected in a controlled
manner and from the right individual
With most self-completion survey methods there is no interviewer to do this work so it must be
accomplished via other methods With that in mind an algorithm to validate responses post-fieldwork
was used
The algorithm utilises relevant classic indicators of proxy careless or fraudulent completion including
(i) inconsistencies in household data when multiple completed questionnaires have been received
from the same household (ii) use of the same email address by multiple respondents when providing
the necessary details to receive the incentive (iii) suspiciously short completion times and (iv)
excessive missing data rates
Other indicators such as flat-lining through question sets with the same response codes were not
included as the questionnaire uses very few grid style questions
This approach led us to remove c6 of cases from the 201920 Community Life survey a rate that is
low enough for us to be largely confident of the datarsquos veracity
Coding
Post-interview coding was undertaken by members of the Kantar coding department The code
frames are set-up to match those used in the face-to-face version of the survey The coding
department coded verbatim responses recorded for fully open questions and lsquoother specifyrsquo
questions as well as occupation classifications
Occupation and socio-economic class
Occupation details were collected for the respondent and were coded according to the Standard
Occupational Classification (2010) This was carried out by coders at Kantar using the computer-
assisted coding process CASCOT Respondents were also coded according to Standard Industrial
Classification (2010) and NS-SEC was derived from industry and occupation details
Derived variables
A list of the main derived variables is provided in Appendix D
The following geo-demographic variables were added to the data
Region (formerly Government Office Region)
Urbanrural indicator
Percentage of households in the Ward headed by someone from a non-white ethnic minority group
Inner city PSU indicator
Police Force Area
ACORN classification
ONS ward classification
Health board
Primary Care Organisation
LSOA area
ONS district level classification
Output area classification
Index of Multiple Deprivation for England
Income deprivation for England
Employment deprivation for England
Health deprivation for England
Education Skills and Training deprivation for England
Barriers to housing and services deprivation for England
Crime and disorder deprivation for England
Living and environment deprivation for England
Data outputs
The Department for Digital Culture Media and Sport received a full de-identified cumulative SPSS
dataset including derived geo-demographic and weighting variables at the end of the survey year
Non-disclosive data for the 201920 online survey will be made available to download through the UK
Data Service in autumn 2020 (httpdiscoverukdataserviceacuk)
7 Weighting
The Community Life Survey data has been weighted to compensate for variations in sampling
probability and also to partially compensate for variations in response probability within the
population A weight has been produced for use with data collected from both the online and paper
questionnaires and another weight has been produced for use with data collected only from the online
questionnaire In both cases the inferential population is lsquoall adults in England aged 16+ and living in
a private residencersquo
Step 1 was to calculate an address sampling weight This is equal to one divided by the address
sampling probability This sampling probability varied between the ten ethnic mix strata but did not
vary within these strata
Step 2 was to model the expected number of completed questionnaires from each sampled address
as a function of
(i) lsquoethnic mixrsquo stratum
(ii) lsquoexpected responsersquo stratum
(iii) the prior expected number of residents aged 16+26
(iv) region
(v) a set of six orthogonally rotated principal components (or lsquofactorsrsquo) describing census population
distributions for the local LSOA
Based on this (count-based GLM) model the expected number of completed questionnaires (online
or paper) and the expected number of online questionnaires was estimated for each sampled
address An address response weight was calculated equal to
1(expected number of completed questionnaires prior expected number of residents aged 16+))
For online-only data this formula was the same except that the expected number of completed
questionnaires was replaced by the expected number of completed online questionnaires
The product of the weights produced from steps 1 and 2 was used as a base weight for step 3
calibrating the sample to population totals Because step 2 produces a different address response
weight for onlinepaper data than it does for online-only data there are two base weights ndash one for
onlinepaper data and one for online-only data Consequently step 3 produces two calibration
weights as well
The data was calibrated to ensure the weighted sample matched population totals for seven
dimensions
(i) genderage group
26 This was estimated based on a separate Kantar analysis of response and survey data from the 2015-17 Crime Survey of England amp Wales (England-only subset)
-
(ii) degree level educationage group
(iii) housing tenure
(iv) region
(v) household size
(vi) ethnic group and
(vii) internet usageage group
The population totals were drawn from the ONS Labour Force Survey (LFS) of October to December
2019 which is itself weighted to ONS population estimates for England (for gender age and region)
The exception was dimension (vii) ndash internet usage by age group ndash for which the distributional data
comes from the January to March 2019 LFS Internet usage is only collected in the January to March
edition of the LFS
Table 71 Population per age band
Age band LFS Oct Dec 2019 total
16 to 19 2398020
20 to 24 3389995
25 to 29 3765664
30 to 34 3805238
35 to 39 3719625
40 to 44 3418887
45 to 49 3662802
50 to 54 3869915
55 to 59 3687495
60 to 64 3134142
65 to 69 2781521
70 to 74 2768050
75+ 4514151
Table 72 Population by age band and gender
-
-
Age band LFS Oct Dec 2019 total
Males Females
16-24 2957616 2830399
25-34 3813348 3757554
35-44 3539287 3599225
45-54 3714247 3818470
55-64 3350985 3470652
65-74 2669363 2880208
75+ 1999126 2515025
Table 73 Population within region
Region LFS Oct Dec 2019 total aged 16+
North East 2147383
North West 5824822
Yorkshire amp Humberside 4381611
East Midlands 3864284
West Midlands 4689718
East 4990253
London 7142245
South East 7322948
South West 4552241
Table 74 Highest educational level crossed by age (25-64 only)
- -
-
-
-
Age group LFS Oct Dec 2019 total with a Degree LFS Oct Dec 2019 total with
no Degree
25-29 1689464 2076200
30-39 3436419 4088444
40-49 2817245 4264444
50-64 2902407 7789145
Table 75 Housing tenure
Housing tenure LFS Oct Dec 2019 total aged 16+
Living in property owned outright 14715140
Living in property owned with mortgage 15537773
Living in property with other tenure 14662591
Table 76 Household size
Household size (all residents) LFS Oct Dec 2019 total aged 16+
1 7891739
2+ 37023766
Table 77 Ethnic group
Ethnic group LFS Oct Dec 2019 total aged 16+
White 38813585
Indian 1177999
PakistaniBangladeshi 1243016
Black 1571442
Other 2109464
Table 78 Internet usage crossed by age
- -Internet usageage LFS Oct Dec 2019 total based on Jan Mar
2019 distributional data aged 16+
Aged 16-64 34851783
Aged 65-74 some internet usage 4835568
Aged 65-74 no internet usage 714003
Aged 75+ some internet usage 2452178
Aged 75+ no internet usage 2061973
One way of assessing the impact of weighting the data is to estimate the weighting efficiency for each
subpopulation in the seven-dimension weighting matrix In effect this weighting efficiency illustrates
the impact of the other six weighting dimensions and reflects the amount of weighting that is required
for each subpopulation The more weighting that is required the less representative the unweighted
responding sample is likely to be This will be partly due to variations in sampling probability within
each subpopulation but also due to variations in response probability
Weighting efficiency is equal to one divided by the design effect due to weighting The design effect
due to weighting is equal to 1+[(sgmg)2] where sg is the standard deviation of the weights within
subpopulation g and mg is the mean weight within subpopulation g Weighting efficiency is also equal
to the effective sample size divided by the actual sample size where effective sample size accounts
only for the weighting and not for other design aspects such as sample stratification and clustering
The overall weighting efficiency was 73 It was slightly higher 76 for the online-only weight
Table 79 Weighting efficiencies for marginal subpopulations defined in the weighting matrix
Age band Gender
Males Females
16-24 75 75
25-34 74 73
35-44 74 72
45-54 76 76
55-64 76 77
65-74 79 78
75+ 79 77
Region
North East 83
North West 77
Yorkshire amp Humberside 78
East Midlands 74
West Midlands 74
East 79
London 82
South East 77
South West 83
Age group Degree No degree
25-29 71 75
30-39 69 75
40-49 72 74
50-64 74 77
Housing tenure
Living in property owned outright 75
Living in property owned with
mortgage
77
Living in property with other
tenure
73
Household size (all residents)
1 71
2+ 74
Ethnic group
White 74
Indian 77
PakistaniBangladeshi 79
Black 80
Other 69
Internet usageage
Aged 16-64 72
Aged 65-74 some internet usage 79
Aged 65-74 no internet usage 75
Aged 75+ some internet usage 80
Aged 75+ no internet usage 79
8 Standard errors
Introduction
The tables in this chapter show estimates of standard errors for key variables with the survey
Sources of error in surveys
Survey results are subject to various sources of error Error can be divided into two types systematic
and random error
Systematic error
Systematic error or bias covers those sources of error that will not average to zero over repeats of the
survey Bias may occur for example if a part of the population is excluded from the sampling frame
or because respondents to the survey are different from non-respondents with respect to the survey
variables It may also occur if the instrument used to measure a population characteristic is imperfect
Substantial efforts have been made to avoid such systematic errors For example the sample has
been drawn at random from a comprehensive frame two modes and multiple reminders have been
used to encourage response and all elements of the questionnaire were thoroughly tested before
being used
Random error
Random error is always present to some extent in survey measurement If a survey is repeated
multiple times minor differences will be present each time due to chance Over multiple repeats of the
same survey these errors will average to zero The most important component of random error is
sampling error which is the error that arises because the estimate is based on a random sample
rather than a full census of the population The results obtained for a single sample may by chance
vary from the true values for the population but the error would be expected to average to zero over a
large number of samples The amount of between-sample variation depends on both the size of the
sample and the sample design The impact of this random variation is reflected in the standard errors
presented here
Random error may also follow from other sources such as variations in respondentsrsquo interpretation of
the questions or variations in the way different interviewers ask questions Efforts are made to
minimise these effects through pilot work and interviewer training
Standard errors for complex sample designs
The Community Life Survey employs a systematic sample design and the data is both clustered by
address and weighted to compensate for non-response bias These features will impact upon the
standard errors for each survey estimate in a unique way Generally speaking systematic sampling
will reduce standard errors while data clustering and weighting will increase them If the complex
sample design is ignored the standard errors will be wrong and usually too narrow
The standard errors quoted below have been estimated using the SPSS Complex Samples module
which employs a Taylor Series Expansion method to do this The tables include a lsquodesign factorrsquo
which is the ratio of the estimated standard error to the standard error we would obtain if we ignored
the sample design In general this averages at approximately 13 but varies somewhat between
survey variables
Table 81 Participation in civic engagement and voluntary activities
Characteristic Population Weighted
percent ()
Unweighted
base
(affirmative
response)
Standard
error
Design
factor
(deft)
Percentage Number Percentage Number
Participation in civic engagement or voluntary activities
Those taking part
at least once a
month in
Informal
volunteering
All 28 2904 06 122
Formal
volunteering
All 23 2281 05 128
Any volunteering All 39 4007 06 125
Those taking part
at least once in
the last 12
months in
Civic participation All 41 4278 06 129
Civic consultation All 21 2203 05 124
Civic activism All 8 906 3 117
Informal
volunteering
All 53 5507 06 125
Formal
volunteering
All 37 3776 06 128
Any volunteering All 64 6532 6 126
Table 82 Participation in civic engagement and formal volunteering at least once in the last year by sex age ethnicity and disability
Characteristics Population Weighted
percent ()
Unweighted
base
(affirmative
response)
Standard
error
Design
factor
(deft)
Percentage Number Percentage Number
Civic Participation Male 41 1915 09 122
Female 41 2327 08 120
16-24 37 370 19 126
25-34 44 785 15 126
35-49 45 1167 12 121
50-64 42 1020 12 120
65-74 40 631 15 118
75+ 28 277 18 115
White 41 3499 07 126
Asian 39 292 23 132
Black 33 134 29 123
Mixed 37 166 30 134
Other 29 35 47 112
Limiting Long
Term Limiting
Illness (LLTI)
Disability27
45 915 13 116
No LLTI
Disability
42 2595 08 124
27 All LLTIDisability calculations based on online only data
Civic consultation Male 21 1016 07 116
Female 21 1168 06 119
16-24 15 146 13 117
25-34 17 319 11 122
35-49 23 598 10 122
50-64 23 561 10 120
65-74 25 392 14 122
75+ 19 173 16 118
White 21 1786 06 122
Asian 19 140 17 124
Black 21 82 24 118
Mixed 19 85 24 134
Other 21 31 41 110
LLTI Disability 23 461 11 116
No LLTI
Disability
21 1297 06 116
Civic activism Male 8 410 05 113
Female 8 483 04 114
16-24 5 63 08 106
25-34 6 122 07 116
35-49 8 215 06 114
50-64 8 210 06 115
65-74 12 185 10 120
75+ 10 104 12 112
White 8 703 03 115
Asian 9 60 14 136
Black 11 45 16 107
Mixed 9 49 15 114
Other 9 9 32 121
LLTI Disability 10 213 08 112
No LLTI
Disability
8 495 04 117
Formal volunteering Male 36 1635 09 120
Female 39 2110 08 118
16-24 40 376 19 122
25-34 29 529 14 127
35-49 41 1020 12 123
50-64 37 903 12 122
65-74 42 625 15 119
75+ 33 294 19 118
White 38 3027 07 126
Asian 35 276 22 128
Black 39 153 29 118
Mixed 32 148 31 142
Other 34 38 59 136
LLTI Disability 39 757 13 118
No LLTI
Disability
41 2440 08 124
Table 83 Informal or formal volunteering within the last month and the last 12 months broken down by age ethnicity employment status and region
Characteristics Population Weighted
percent ()
Unweighted
base
(affirmative
response)
Standard
error
Design
factor
(deft)
Percentage Number Percentage Number
At least once a
month
Informal
volunteering
16-24 30 306 17 119
25-34 24 418 12 122
35-49 24 635 10 120
50-64 27 694 10 114
65-74 36 532 15 120
75+ 33 291 19 118
White 28 2295 06 120
Asian 27 212 19 118
Black 37 140 27 111
Mixed 28 126 27 128
Other 34 43 52 120
In employment28 26 1247 07 115
Unemployed 25 49 35 108
Economically
inactive
35 938 11 121
North East 28 113 27 116
North West 30 355 16 115
Yorkshire and
Humberside
31 270 18 117
East Midlands 26 220 18 120
West Midlands 28 298 16 118
28 All in employmentunemployedeconomically inactive calculations based on online only data
East of England 26 253 17 124
London 28 788 10 118
South East 27 390 14 116
South West 27 211 19 115
Formal volunteering 16-24 23 216 16 121
25-34 16 279 11 123
35-49 21 520 10 125
50-64 23 575 10 122
65-74 31 455 14 121
75+ 25 219 17 119
White 23 1901 06 126
Asian 15 117 15 122
Black 24 90 25 117
Mixed 19 86 25 135
Other 18 19 54 155
In employment 22 1094 07 120
Unemployed 19 38 33 112
Economically
inactive
29 783 11 124
North East 22 90 25 119
North West 23 268 16 128
Yorkshire and
Humberside
20 179 16 121
East Midlands 20 168 18 125
West Midlands 19 189 16 130
East of England 25 245 16 120
London 20 577 09 119
South East 26 367 14 121
South West 28 198 21 126
At least once in
the last year
Informal
volunteering
16-24 48 492 20 123
25-34 49 881 15 122
35-49 55 1424 12 123
50-64 53 1304 12 116
65-74 61 908 15 117
75+ 52 463 20 117
White 53 4358 07 123
Asian 52 414 22 122
Black 60 238 28 116
Mixed 48 229 33 141
Other 54 65 57 125
In employment 54 2685 08 119
Unemployed 55 103 42 113
Economically
inactive
56 1549 11 122
North East 52 203 29 115
North West 53 626 17 118
Yorkshire and
Humberside
51 453 20 119
East Midlands 52 419 21 122
West Midlands 55 578 20 130
East of England 52 515 20 125
London 53 1529 12 123
South East 53 768 16 117
South West 55 416 22 120
Formal volunteering 16-24 40 376 19 122
25-34 29 529 14 127
35-49 41 1020 12 123
50-64 37 903 12 122
65-74 42 625 15 119
75+ 33 294 19 118
White 38 3027 07 126
Asian 35 276 22 128
Black 39 153 29 118
Mixed 32 148 31 142
Other 34 38 59 136
In employment 40 2000 08 119
Unemployed 38 76 41 115
Economically
inactive
41 1149 12 124
North East 34 135 30 122
North West 37 433 17 122
Yorkshire and
Humberside
32 283 20 129
East Midlands 36 277 23 135
West Midlands 31 327 18 127
East of England 40 389 20 128
London 36 1027 11 120
South East 42 599 16 120
South West 43 306 23 124
Table 84 Any volunteering in the last year broken down by sex age and region
Characteristic Population Weighted
percent ()
Unweighted
base
(affirmative
response)
Standard
error
Design
factor
(deft)
Percentage Number Percentage Number
Any formal or
informal
volunteering at
least once in last
year
Male 61 2813 09 121
Female 66 3658 08 120
16-24 63 625 18 119
25-34 60 1056 14 123
35-49 67 1694 11 121
50-64 63 1548 12 119
65-74 70 1052 14 116
75+ 57 511 20 119
North East 61 237 30 120
North West 65 751 16 116
Yorkshire and the
Humber
59 527 20 123
East Midlands 62 493 22 127
West Midlands 63 655 19 130
East of England 64 639 19 128
London 63 1797 11 123
South East 66 940 15 122
South West 67 493 20 126
Table 85 Whether gave to charity in the last four weeks broken down by sex age ethnicity and region
Characteristics Population Weighted
percent ()
Unweighted
base
(affirmative
response)
Standard
error
Design
factor
(deft)
Percentage Number Percentage Number
Gave to charity in
the last 4 weeks
Male 70 3199 09 127
Female 79 4270 07 122
16-24 55 559 20 123
25-34 66 1164 15 134
35-49 77 1906 10 125
50-64 79 1906 10 119
65-74 84 1261 11 120
75+ 85 705 16 127
White 75 6039 06 133
Asian 73 569 20 128
Black 70 274 29 125
Mixed 70 343 32 147
Other 56 68 56 122
North East 74 279 25 112
North West 75 870 18 141
Yorkshire and the
Humber
74 637 20 134
East Midlands 73 601 20 126
West Midlands 74 759 17 127
East of England 75 752 19 138
London 72 2014 11 129
South East 77 1088 14 129
South West 75 553 20 126
Table 86 Banded amount given to charity in the four weeks prior to interview
Characteristic Population Weighted
percent ()
Unweighted
base
(affirmative
response)
Standard
error
Design
factor (deft)
Percentage Number Percentage Number
Banded amount
given to charity
pound0-pound4 All 13 693 5 118
pound5-pound9 All 18 953 6 118
pound10-pound19 All 27 1435 7 118
pound20-pound49 All 27 1509 7 118
Over pound50 All 15 854 6 118
Table 87 Whether aware of or involved in social action broken down by sex and age
Characteristic Population Weighted
percent ()
Unweighted
base
(affirmative
response)
Standard
error
Design factor
(deft)
Percentage Number Percentage Number
Aware of social
action29
Male 31 1132 09 117
Female 33 1406 09 117
16-24 27 226 18 117
25-34 25 379 14 120
35-49 33 712 12 117
50-64 34 646 13 115
29 Based on online only data
65-74 39 406 17 115
75+ 38 160 27 114
All 32 2546 07 128
Involved in social
action
Male 16 763 07 119
Female 16 870 06 119
16-24 14 130 14 123
25-34 11 203 09 118
35-49 17 422 09 124
50-64 17 414 09 120
65-74 24 334 13 122
75+ 17 138 15 118
All 16 1651 05 127
Table 88 The extent to which people agree that people in their neighbourhood pull together to improve the area
Characteristic Population Weighted
percent ()
Unweighted
base
(affirmative
response)
Standard
error
Design
factor
(deft)
Percentage Number Percentage Number
Whether agree or
disagree that people
in this
neighbourhood pull
together to improve
the neighbourhood
Definitely agree 14 1333 04 128
Tend to agree 45 4365 06 128
Tend to
disagree
28 2976 06 128
Definitely
disagree
13 1395 04 128
Agree 59 5698 07 133
Disagree 41 4371 07 133
Table 89 Whether chat to neighbours at least once a month by age sex ethnicity and region
Characteristics Population Weighted
percent ()
Unweighted
base
(affirmative
response)
Standard
error
Design
factor
(deft)
Percentage Number Percentage Number
People who chat to
their neighbours
more than once a
month
Male 72 3282 08 124
Female 73 3887 07 178
16-24 53 477 20 125
25-34 58 940 15 128
35-49 74 1844 11 126
50-64 78 1886 10 117
65-74 87 1302 10 117
75+ 87 742 14 118
White 74 5833 06 130
Asian 64 505 23 136
Black 66 258 29 123
Mixed 67 316 28 132
Other 54 65 61 132
North East 74 280 30 135
North West 73 855 17 129
Yorkshire and
the Humber
76 658 18 125
East Midlands 74 592 21 138
West Midlands 75 770 17 125
East of England 74 725 18 132
London 65 1822 11 126
South East 71 994 15 125
South West 76 553 20 129
Table 810 Whether people feel they belong strongly to their neighbourhood or Britain
Characteristic Population Weighted
percent ()
Unweighted
base
(affirmative
response)
Standard
error
Design
factor
(deft)
Percentage Number Percentage Number
Whether feel they
belong strongly to
Britain30
Veryfairly
strongly
84 6429 06 127
Not very
strongly
12 1061 05 127
Not at all
strongly
4 330 3 127
Whether feel they
belong strongly to
their neighbourhood
Veryfairly
strongly
63 6216 06 123
Not very
strongly
27 2875 06 123
Not at all
strongly
10 1112 04 123
Table 811 Whether people feel they belong strongly to their neighbourhood or Britain by sex age and ethnicity
Characteristic Population Weighted
percent ()
Unweighted
base
(affirmative
response)
Standard
error
Design
factor
(deft)
30 Based on online only data
Percentage Number Percentage Number
Strongly belong to
Britain
Male 83 2911 07 118
Female 85 3498 06 112
16-24 78 665 16 117
25-34 76 1088 14 128
35-49 80 1691 10 118
50-64 87 1572 09 111
65-74 92 968 09 108
75+ 96 399 10 100
White 84 5163 06 122
Asian 85 607 16 119
Black 86 217 23 107
Mixed 77 159 33 112
Other 78 62 57 121
Strongly belong to
local neighbourhood
Male 62 2737 09 122
Female 63 3413 08 120
16-24 55 517 21 129
25-34 51 859 15 129
35-49 63 1569 12 124
50-64 65 1542 12 120
65-74 71 1067 14 120
75+ 73 612 18 119
White 63 4879 07 129
Asian 67 512 22 129
Black 62 242 30 122
Mixed 63 298 29 130
Other 44 54 58 126
Table 812 Satisfaction with local area as a place to live
Characteristics Population Weighted
percent ()
Unweighted
base
(affirmative
response)
Standard
error
Design
factor
(deft)
Percentage Number Percentage Number
Satisfaction with
local area
Veryfairly
satisfied
76 7572 05 122
Neither satisfied
nor dissatisfied
15 1580 04 122
Very Fairly
dissatisfied
9 1068 04 122
Table 813 Community cohesion by sex age ethnicity and region
Characteristics Population Weighted
percent ()
Unweighted
base
(affirmative
response)
Standard
error
Design
factor
(deft)
Percentage Number Percentage Number
Agree that people
from different
backgrounds get on
Male 81 3673 07 126
Female 82 4472 06 123
well together in the
local area 16-24 80 788 17 128
25-34 77 1380 14 136
35-49 82 2055 10 128
50-64 83 1976 09 117
65-74 85 1253 11 116
75+ 87 725 14 122
White 81 6438 06 134
Asian 86 668 16 130
Black 84 333 21 112
Mixed 85 393 22 130
Other 75 93 48 121
North East 80 298 26 125
North West 79 883 17 140
Yorkshire and
the Humber
80 683 18 130
East Midlands 81 647 20 142
West Midlands 80 814 17 133
East of England 83 811 16 134
London 84 2345 09 125
South East 85 1159 12 127
South West 82 591 17 118
Table 814 Whether people feel able to influence decision affecting their local area
Characteristics Population Weighted
percent ()
Unweighted
base
(affirmative
response)
Standard
error
Design
factor
(deft)
Percentage Number Percentage Number
Able to influence
decision affecting
their local area
Yes able to
influence
decisions
27 2827 06 128
Table 815 Whether able to influence decisions affecting their local area by sex age and ethnicity
Characteristics Population Weighted
percent ()
Unweighted
base
(affirmative
response)
Standard
error
Design
factor
(deft)
Percentage Number Percentage Number
Able to influence
decisions affect their
local area
Male 26 1236 08 119
Female 27 1555 07 120
16-24 26 265 16 115
25-34 24 454 13 124
35-49 30 809 11 124
50-64 29 706 11 119
65-74 24 371 13 120
75+ 23 205 17 115
White 25 2037 06 125
Asian 35 274 20 120
Black 45 167 32 125
Mixed 33 171 28 128
Other 44 55 56 122
Table 816 How important it is to be able to influence decisions affecting their local area
Characteristics Population Weighted
percent ()
Unweighted
base
(affirmative
response)
Standard
error
Design
factor
(deft)
Percentage Number Percentage Number
How important it is to
be able to influence
decisions affecting
the local area
Important 57 5922 06 131
Not important 43 4232 06 131
Table 817 Whether people would like to be more involved in decisions made by their local council
Characteristics Population Weighted
percent ()
Unweighted
base
(affirmative
response)
Standard
error
Design
factor
(deft)
Percentage Number Percentage Number
Whether would like
to be more involved
in decision made by
the local council31
Yes 53 4383 07 129
No 45 3265 07 129
Depends on the
issue
2 170 07 129
Table 818 How often people feel lonely
Characteristics Population Weighted
percent ()
Unweighted
base
(affirmative
response)
Standard
error
Design
factor
(deft)
Percentage Number Percentage Number
31 Based on online only data
How often feel lonely Oftenalways 6 661 03 122
Some of the
time
18 1830 05 122
Occasionally 23 2376 05 122
Hardly ever 32 3108 06 122
Never 21 2091 05 122
Table 819 Whether people borrow things and exchange favours with their neighbours
Characteristics Population Weighted
percent ()
Unweighted
base
(affirmative
response)
Standard
error
Design
factor
(deft)
Percentage Number Percentage Number
Whether people
borrow things and
exchange favours
Definitely agree 10 1058 04 128
Tend to agree 25 2477 05 128
with neighbours Tend to
disagree
27 2657 06 128
Definitely
disagree
38 3997 06 128
Table 820 Whether people think their area has got better or worse over the last two years
Characteristics Population Weighted
percent ()
Unweighted
base
(affirmative
response)
Standard
error
Design
factor
(deft)
Percentage Number Percentage Number
Whether area has
got better or worse
over the last two
years
The area has
got better
14 1470 05 131
The area has
got worse
26 2564 06 131
The area has
not changed
much
60 5369 07 131
9 Data user guide
This chapter provides a user guide for those conducting analysis of the Community Life Survey
dataset The dataset will be made available on the UK Data Service in SPSS format and the guide
assumes that analysis will be conducted in SPSS
Selecting cases for analysis
The sample consists of an unweighted base of 10243 interviews
Quarters
The dataset contains data from fieldwork between 24th April 2019 and 1st April 2020 broken down into
four quarters To perform analysis on an individual quarter use the variable lsquoQuarterrsquo and select the
appropriate
Quarter 1 24th April ndash 30th June 2019
Quarter 2 10th July ndash 29h September 2019
Quarter 3 2nd October ndash 29th December 2019
Quarter 4 8th January ndash 29th March 2030
For example to look at Quarter 4 data only within the SPSS file select data select cases filter if
Quarter=4 and then run crosstabs and frequencies as normal
Variables
The dataset is ordered in the following way
1 Unique serial number
2 Demographic information such as number of adults in the household age gender marital
status and information on children under the age of 16 living in the household
3 The survey question responses in the same order as the questions appear in the questionnaire
(please see Appendix A for the questionnaire)
4 Derived variables (please see Appendix D for a full list)
5 Geo-demographic files
6 Weight variables
Any queries on published variables should be sent to (evidencedcmsgovuk) in the first instance
Variables are named exactly to match the questionnaire names Where the respondent was able to
give multiple answers to one question (a multiple response question) the question has been
represented in the dataset by a number of variables one for each possible answer which are coded
as yes or no depending on whether the respondent chose this response or not This aids analysis as
it avoids the need to recode each multiple response question
Mode of completion
Nearly three quarter of interviews were completed online versus one quarter completed by paper
questionnaire The paper questionnaire was shorter than the online survey only containing roughly
50 of the questions Data users should be aware that some questions which only appeared in the
web survey will have a smaller base size as a result A variable titled lsquoModersquo is included in the data
which indicates whether each interview was completed online or by post
The two versions of the questionnaire can be viewed in Appendix A and B
Missing Values
For the majority of variables lsquoDonrsquot knowrsquo and lsquoPrefer not to sayrsquo responses are set as missing values
within the dataset In situations where the respondent was not asked the question either due to the
question being added in a later quarter or removed in a previous quarter or due to routing within the
questionnaire responses are also set as missing values All missing values are labelled appropriately
to distinguish between the different responses
Weighting
To analyse the data at the individual level SRCaliW should be used to weight the data Eight sets of
weights are included within the dataset Table 91 below details the separate weight variables and
their use
Table 91 Weights used on the 201920 survey
Weight Description
SRCaliW Scaled individual weight for combined
online and paper sample for the entire
survey year
RespondentCalibrationWeight Individual weight for combined online and
paper sample for the entire survey year
SRCaliww32 Scaled individual weight for online only
sample for the entire survey year Use for
data collected on the online survey only
32 SRCaliww should be used for any break variables that are only collected in the online data regardless of whether the question was included on paper
RespondentCalibrationWeight_Web Individual weight for combined online only
sample for the entire year Use for data
collected on the online survey only
StandardisedAddressSamplingWeight Address sampling weight
StandardisedBaseWeight Respondent base weight for calibration
WithinHouseholdDesignWeight Household design weight
StandardisedBaseWeight_Web Respondent base weight for calibration ndash
online survey only
10Appendices
Appendix A Community Life Online Survey Questionnaire
Appendix B Community Life Paper Questionnaire
Appendix C Advance Online Letter Reminder Online Letter and Paper Letter
Appendix D List of derived variables created for the Community Life Survey
Appendix A Community Life Online Survey
Questionnaire
Community Life Survey 201920 Online Questionnaire
Table of Contents SECTION 1 DEMOGRAPHICS 62 SECTION 2 IDENTITY AND SOCIAL NETWORKS 67
SECTION 3 YOUR COMMUNITY 70
SECTION 4 CIVIC ENGAGEMENT 75
SECTION 5 VOLUNTEERING 80
SECTION 6 SOCIAL ACTION 90
SECTION 7 SUBJECTIVE WELLBEING 94 SECTION 8 DEMOGRAPHICS PART 2 99
Changes from 20182019
Questions updated
Lon1
Lon2
Lon3
LonOft
CivPart
Vnbv
GGroup
SECTION 1 DEMOGRAPHICS
TIMING POINT 1
INTRO [ASK ALL]
Thank you for choosing to take part in the Community Life Survey
Please click the (gt) button to start the survey
INTRO2 [ASK ALL] In this first section we would like to find out a little about your household By your household we mean the group of people (not necessarily related) living at your address who share cooking facilities with you and also share a living room or sitting room or dining area
The information is used to understand the experiences of different groups but will not identify you or anyone in your household
NUMADULTS [ASK ALL]
Including you how many adults aged 16 or over are currently living in your household
110
NAMADULT [ASK ALL]
We would like to gather some information about the people you live with so that we can understand the experiences of different types of households
Please enter the first name or initials of each adult currently aged 16 or over in your household
If you do not wish to enter names please give an initial or other title for each person which you will recognise at later questions (eg lsquowifersquo lsquoeldest sonrsquo)
ENTER NAMES
SEX [ASK ALL]
[Names from NAMADULT pulled through]
What is the gender of each adult in your household 1 Male 2 Female 3 Other
AGEIF [ASK ALL]
[Names from NAMADULT pulled through]
How old are each of the adults in your household
Please click the (gt) button for more answer options
1699 AGEIF2 [ASK IF AGEIF = DK OR REF]
[Names from NAMADULT pulled through]
Which of the following age bands does each adult in the household come under
1 16 to 19 2 20 to 24 3 25 to 29 4 30 to 34 5 35 to 39 6 40 to 44 7 45 to 49 8 50 to 54 9 55 to 59 10 60 to 64 11 65 to 69 12 70 to 74 13 75 to 79 14 80 or over
MARS [ASK ALL]
What is your marital status
1 single that is never married and never registered a same-sex civil partnership 2 married 3 separated but still legally married 4 divorced 5 widowed 6 in a registered same-sex civil partnership 7 separated but still legally in a same-sex civil partnership 8 formerly in a same-sex civil partnership which is now legally dissolved 9 surviving partner from a same-sex civil partnership
LIVE [ASK IF MORE THAN ONE ADULT IN HOUSEHOLD AND MARS = 1 OR 3 OR 4 OR 5 OR 7 OR 8 OR 9 OR DKREF]
Are you living with someone in this household as a couple
1 Yes 2 No
NCHIL
How many children aged under 16 currently live in your household
010 CAGE2 [ASK IF NCHILgt0]
(IF ONE CHILD) How old are they 0hellip15
(IF 2+ CHILDREN) You said that there are (x) children in this household Please enter their ages starting with the oldest child
Please click the (gt) button for more answer options
[Set up as a grid age in the sequence below dependent on how many children live in the household a space to be provided to type in age]
Oldest child Second oldest child Third oldest child
BCAGE2 [ASK IF CAGE 2=DKREF]
(IF ONE CHILD) Which age band applies to the child in your household
(IF 2+ CHILDREN) You said that there are (x) children in this household Please select the age band which applies to each child starting with the oldest child
[Set up as a grid with drop down boxes in the sequence below dependent on how many children live in the household]
Oldest child Second oldest child Third oldest child
1 0 - 4 2 5 ndash 10 3 11 ndash 15
REL [ASK IF MORE THAN ONE PERSON IN THE HOUSEHOLD]
Using the list below please select all of the people you live with Please include everyone you live with including adults and children
Please select all that apply
Please click the (gt) button for more answer options 1 A husband wife civil partner or other cohabiting partner 2 Son or daughter(s) ndash including adoptedstepfoster 3 Brother or sister(s) ndash including adoptedstepfoster 4 Another relative(s) 5 Non-relative(s)
[CHECK ON AGAINST NUMBER OF PEOPLE IN THE HOUSEHOLD AFTER THIS QUESTION]
DIntro1 [ASK ALL]
Next are some questions about your employment
DWorkA [ASK ALL]
Do you currently have a paid job 1 Yes 2 No
DWorkA1 [ASK IF DWORKA = 1]
Are you working as an employee or are you self-employed
1 Employee 2 Self-employed
DWorkA2 [ASK IF SELF-EMPLOYED AT DWORKA1]
Have you become self-employed in the last 12 months
(If you were previously self-employed and have returned to self-employment in the last 12 months please select Yes)
1 Yes
2 No
IntIntro [ASK ALWAYS]
The following questions are about using the internet
IntUseB [ASK ALWAYS]
In what ways do you use the internet if at all
1 For work only 2 For personal reasons only 3 For both 4 Not at all
IntOft [ASK IF INTUSEB = 123]
How often do you access the internet
Please include internet access from any device including mobiletablet only internet access This can be for any purpose ranging from checking your emails to online shopping
1 More than once a day
2 Once a day 3 2-3 times per week 4 About once a week 5 About once a fortnight 6 About once a month 7 About once every 2-3 months 8 About once every six months 9 Less often
SECTION 2 IDENTITY AND SOCIAL NETWORKS
TIMING POINT 2
SIntro6 [ASK ALWAYS]
Now some questions about your friends
SRace [ASK ALL]
What proportion of your friends are of the same ethnic group as you
Please click the gt button for more answer options
1 All the same as me 2 More than a half 3 About a half 4 Less than a half 5 Dont have any friends
SFaith [ASK IF (NOT SRACE=5 (DONrsquoT HAVE ANY FRIENDS))]
What proportion of your friends are of the same religious group as you
Please click the gt button for more answer options
1 All the same as me 2 More than a half 3 About a half 4 Or less than a half 5 Not part of any faith group
Sage [ASK IF (NOT SRACE=5 (DONrsquoT HAVE ANY FRIENDS))]
What proportion of your friends are of the same age group as you
1 All the same as me 2 More than a half 3 About a half 4 Or less than a half
SEduc [ASK IF (NOT SRACE=5 (DONrsquoT HAVE ANY FRIENDS))]
What proportion of your friends have a similar level of education to you
1 All the same as me
2 More than a half
3 About a half
4 Or less than a half
FamIntro [ASK ALWAYS]
The next few questions are about how often you personally contact your family members and friends Please do not include any people you live with
FrndRel1-4
Please do not include any people you live with
On averagehow often do you
More than once a day
Once a day
2-3 times per week
About once a week
About once a fortnight
About once a month
Less often than once a month
Never
Meet up in person with family members or friends
Speak on the phone or video or audio call via the internet with family members or friends
Email or write to family members or friends
Exchange text messages or instant messages with family members or friends
FrndSat1-2 [ASK ALL]
How much do you agree or disagree with the following statements
Definitely agree
Tend to agree
Tend to disagree
Definitely disagree
If I needed help there are people who would be there for me
If I wanted company or to socialise there are people I can call on
Counton1 [ASK ALL]
Is there anyone who you can really count on to listen to you when you need to talk
Please click the (gt) button for more answer options
1 Yes one person 2 Yes more than one person 3 No one
SECTION 3 YOUR COMMUNITY
TIMING POINT 3
SIntro2 [ASK ALWAYS]
The next questions are about your neighbourhood
SBeNeigh [ASK ALWAYS]
First how strongly do you feel you belong to your immediate neighbourhood
Please think of the area within a few minutes walking distance from your home
1 Very strongly 2 Fairly strongly 3 Not very strongly 4 Not at all strongly
SBeGB [ASK ALWAYS]
How strongly do you feel you belong to Britain
1 Very strongly 2 Fairly strongly 3 Not very strongly 4 Not at all strongly
SLive [ASK ALWAYS]
Roughly how many years have you lived in your current neighbourhood
Answer must be in the range from 0 up to 120 ___
SchatN [ASK ALWAYS]
How often do you chat to your neighbours more than to just say hello
Please click the (gt) button for more answer options
1 On most days 2 Once or twice a week 3 Once or twice a month 4 Less than once a month 5 Never 6 Dont have any neighbours
NBarr [ASK IF SChatN=345]
Why dont you chat to your neighbours more often
Please select all that apply
A Prefer to keep myself to myself B Dont have time C Prefer to choose my friends have enough friends already D Neighbours speak different languagehave different culture E Dont trustget on with my neighbours F Have no need to speak to neighbours G Donrsquot feel I know my neighbours well enough H Nothing in common with my neighbours I Im new to the area J Dont see neighbours very often K Have an illnessdisability that prevents me from going out much L People just dont speak to each other round here M Other (specify)
SFavN [ASK IF NOT SchatN = 6]
How strongly do you agree or disagree with the following statement
Generally I borrow things and exchange favours with my neighbours
1 Definitely agree 2 Tend to agree 3 Tend to disagree 4 Definitely disagree
NComfort1 [ASK IF NOT SchatN = 6]
How comfortable would you be asking a neighbour to keep a set of keys to your home for emergencies for example if you were locked out
1 Very comfortable 2 Fairly comfortable 3 Fairly uncomfortable 4 Very uncomfortable
NComfort2 [ASK IF HAVE CHILDREN AGED lt 11 AND NOT IF SchatN = 6]
How comfortable would you be asking a neighbour to mind your child(ren) for half an hour
1 Very comfortable 2 Fairly comfortable 3 Fairly uncomfortable 4 Very uncomfortable
NComfort3 [ASK IF NOT SchatN = 6]
If you were ill and at home on your own and needed someone to collect a few shopping essentials how comfortable would you feel asking a neighbour to do this for you
1 Very comfortable 2 Fairly comfortable 3 Fairly uncomfortable 4 Very uncomfortable
SPull [ASK ALWAYS]
To what extent would you agree or disagree that people in your neighbourhood pull together to improve the neighbourhood
Please click the gt button for more answer options
1 Definitely agree 2 Tend to agree 3 Tend to disagree 4 Definitely disagree 5 Nothing needs improving
STrust [ASK ALWAYS]
Thinking about the people who live in this neighbourhood to what extent do you believe they can be trusted
Please click the gt button for more answer options
1 Many of the people can be trusted 2 Some of the people can be trusted 3 A few of the people can be trusted 4 None of the people can be trusted 5 Just moved here
STrustGen2 [ASK ALWAYS]
On a scale where 0 (zero) is not at all and 10 (ten) is completely in general how much do you think people can be trusted
(Scale 0 not at all 10 completely)
SIntro5 [ASK ALWAYS]
The next questions refer to your wider local area Please think of the area within 15-20 minutes walking distance from your home
Slocsat [ASK ALWAYS]
Overall how satisfied or dissatisfied are you with your local area as a place to live
1 Very satisfied 2 Fairly satisfied 3 Neither satisfied nor dissatisfied 4 Fairly dissatisfied
5 Very dissatisfied
STogeth [ASK ALWAYS]
To what extent do you agree or disagree that your local area is a place where people from different backgrounds get on well together
Please click the gt button for more answer options
1 Definitely agree 2 Tend to agree 3 Tend to disagree 4 Definitely disagree 5 There are too few people in the local area 6 People in this area are all of the same background
BetWors2 (QB5) [ASK ALL]
Do you think that over the past two years your area has hellip
1 got better to live in
2 got worse to live in
3 not changed much (hasnrsquot got better or worse) 4 Have not lived here long enough to say
Assets2 (QB1) [ASK ALL]
Which of these are located within a 15-20 minute walk from your home
1 Generalgrocery shop
2 Pub
3 Park
4 Library
5 Community centrehall
6 Sports centreclub
7 Youth centreclub
8 Health centreGP
9 Chemist
10 Post Office
11 Primary school
12 Secondary school
13 Churchplace of worship
14 Public transport links
15 None of the above
SatAsset [ASK ALL]
Generally how satisfied are you with the local services and amenities in your local area
1 Very satisfied 2 Fairly satisfied 3 Neither satisfied nor dissatisfied 4 Fairly dissatisfied 5 Very dissatisfied
Vnbv [ASK ALL]
How important is it for you personally that you have opportunities to mix with people from different backgrounds
1 Very important
2 Important
3 Neither important nor unimportant
4 Not very important
5 Not at all important
SECTION 4 CIVIC ENGAGEMENT
TIMING POINT 4
PIntro1 [ASK ALWAYS]
The next questions are about influencing political decisions and local affairs
CivPart [ASK ALWAYS]
In the last 12 months that is since [DATE ONE YEAR AGO] have youhellip
Please select all that apply
1 Contacted a local official such as a local councillor MP government official mayor or public official working for the local council (Please do not include any contact for personal reasons eg housing repairs or contact through work)
2 Attended a public meeting rally or taken part in a public demonstration or protest 3 Signed a paper petition or an onlinee-petition 4 None of these
Partoft [ASK IF NOT ((NONE IN CIVPART)
And over the last 12 months how often have you done [this kind of thingall of the things yoursquove just mentioned] This includes
[LIST THINGS MENTIONED]
1 At least once a week 2 Less than once a week but at least once a month 3 Less often than once a month
CivConsult [ASK ALL]
In the last 12 months that is since [DATE ONE YEAR AGO] have you taken part in a consultation about local services or issues in your local area through any of these ways
Please select all that apply
1 Completing a paper or online questionnaire 2 Attending a public meeting 3 Being involved in a face-to-face or online group 4 None of these
Conoft [ASK IF NOT ((NONE IN CIVCONSULT)]
And over the last 12 months how often have you done [this kind of thingall of the things yoursquove just mentioned] This includes
[LIST THINGS MENTIONED]
1 At least once a week 2 Less than once a week but at least once a month 3 Less often than once a month
CivActIntro [ASK ALL]
The following questions are about activities in your local community
CivAct1 [ASK ALL AGED 18 AND OVER]
In the last 12 months that is since [DATE ONE YEAR AGO] have you done any of these things Please include any activities you have already mentioned but not any related to your job
Please select all that apply
1 Been a local councillor (for local authority town or parish) 2 Been a school governor 3 Been a volunteer Special Constable 4 Been a Magistrate 5 None of the above
CivAct2 [ASK ALWAYS]
And again in the last 12 months that is since [DATE ONE YEAR AGO] have you been a member of any of the following decision making groups in your local area Please include online groups and any activities you have already mentioned Please do not include any activities related to your job
Please select all that apply
1 A group making decisions on local health services 2 A decision making group set up to regenerate the local area 3 A decision making group set up to tackle local crime problems 4 A tenants group decision making committee 5 A group making decisions on local education services 6 A group making decisions on local services for young people 7 Another group making decisions on services in the local community 8 None of these
PAffLoc [ASK ALWAYS]
To what extent do you agree or disagree that you personally can influence decisions
affecting your local area
Please click the (gt) button for more answer options
1 Definitely agree 2 Tend to agree 3 Tend to disagree 4 Definitely disagree
PInfl [ASK ALWAYS]
How important is it for you personally to feel that you can influence decisions in your local area
1 Very important 2 Quite important 3 Not very important 4 Not at all important
PCSat [ASK ALWAYS]
Generally speaking would you like to be more involved in the decisions your local council makes which affect your local area
Please click the gt button for more answer options
1 Yes 2 No 3 Depends on the issue
PIfHow [ASK ALWAYS]
If you wanted to influence decisions in your local area how would you go about it
Please select all that apply
Please click the (gt) button for more answer options
A Contact the local council a council official B Contact my local councillor C Contact my MP D Contact my assembly member (for London) E Sign a paper petition F Sign an e-petitiononline petition G Organise a paper petition H Organise an e-petitiononline petition I Attend a local council meeting J Attend a public meeting K Contact local media or journalists L Organise a group (eg campaignaction group) M Other (specify)
PIfEas [ASK ALWAYS]
Which if any of these might make it easier for you to influence decisions in your local area
Please select all that apply
Please click the (gt) button for more answer options
1 If I had more time 2 If the local council got in touch with me and asked me 3 If I could give my opinion online by email 4 If I knew what issues were being considered 5 If it was easy to contact my local councillor 6 If I knew who my local councillor was 7 If I could get involved in a group (not online) making decisions about issues affecting
my local areaneighbourhood 8 If I could get involved in an online group making decisions about issues affecting my
local areaneighbourhood 9 Something else (specify) 10 Nothing
LocVote [ASK IF AGED gt 17]
Did you vote in the last local government election
Please exclude election of local police and crime commissioners
1 Yes 2 No 3 Not eligible to vote
SECTION 5 VOLUNTEERING
TIMING POINT 5
FIntro1 ASK ALWAYS]
The next questions are about your involvement with groups clubs or organisations
FGroupIntro [ASK ALWAYS]
Web For each of the following types of groups clubs or organisations please state whether you have been involved with any of these during the last 12 months that is since [DATE ONE YEAR AGO]
Thats anything youve taken part in supported or that youve helped in any way either on your own or with others Please exclude giving money or anything that was a requirement of your job or organised through your employer
Postal Have you been involved with any of the following groups clubs or organisations during the last 12 months
Please donrsquot put a cross in the box if you have only given money or done something that was part of your job or organised through your employer
FGroupA-FGroupP [ASK ALL]
Yes No
Childrens educationschools (eg Parent Teacher Associations School governor Supporting fairs and fundraising Helping in school Running pupilsrsquo clubs)
Youthchildrens activities (outside school) (eg Youth clubs Sports clubs Hobby or cultural groups for children)
Education for adults (eg Attending or teaching classes Mentoring Cultural groups Students Union College governor)
Sportexercise (taking part coaching or going to watch) (eg Sports clubs or groups (eg football swimming fishing golf keep-fit hiking) Supporter clubs)
Religion (eg Attending a place of worship (church chapel mosque temple synagogue) Attending faith-based groups SaturdaySunday School)
Politics (eg Membership of or involvement with political groups Serving as local councillor)
Older people (eg Involved with groups clubs or organisations for older people eg Age UK Pensionerrsquos clubs visiting transporting or representing older people)
Health Disability and Social welfare (eg Medical research charities Hospital visiting Disability groups Social welfare (eg Oxfam NSPCC Samaritans Citizens Advice Bureau) Offering respite care Self-help groups (eg Alcoholics Anonymous))
Safety First Aid (eg Red Cross St Johns Ambulance Life Saving RNLI Mountain Rescue Helping after a disaster)
The environment animals (eg National organisations (eg Greenpeace National Trust RSPCA) Local conservation groups Preservation societies)
Justice and Human Rights (eg Special Constable Magistrate Legal advice centre Victim Support Prison visiting or aftercare Justice and peace groups Community or race relations LGBT groups National organisations (eg Amnesty International))
Local community or neighbourhood groups (eg Tenantsrsquo Residentsrsquo Association Neighbourhood Watch community group local pressure group)
Citizens Groups (eg Rotary Club Lionrsquos Club Womenrsquos Institute (WI) Freemasons) Hobbies RecreationArtsSocial clubs (e g Clubs or groups for the Arts (eg theatres museums amateur dramatics orchestras) Hobby or cultural groups (eg local history club Social club)
Trade union activity (e g Membership of or involvement with a trade union)
Other_P [ASK ALL]
Have you been involved with any other groups clubs or organisations in the last 12 months
1 Yes 2 No
P_Oth [ASK IF Other_P=1]
Please enter the other activities you have been involved with in the last 12 months into the box below
FInfo [ASK IF YES AT ANY OF A-P AT FGROUP]
The next questions are about your involvement with the groups clubs and organisations yoursquove just selected
These are [List groups selected at FGROUP - main titles only]
FUnPd [ASK IF YES AT ANY OF FGROUPA-P]
In the last 12 months that is since [DATE ONE YEAR AGO] have you given unpaid help to [the group club or organisationany of the groups clubs or organisations] yoursquove just selected in any of the following ways
____
Please select all that apply
A Raising or handling moneytaking part in sponsored events B Leading a groupmember of a committee C Getting other people involved D Organising or helping to run an activity or event E Visiting people F Befriending or mentoring people G Giving adviceinformationcounselling H Secretarial admin or clerical work I Providing transportdriving J Representing K Campaigning L Other practical help (eg helping out at school shopping) M Any other help
None of the above
FUnOft [ASK IF YES AT ANY OF FGROUPA-P AND AT LEAST ONE OF CODES A-M SELECTED AT FUnPd)]
Over the last 12 months how often have you helped [thisthese] group(s) club(s) or organisation(s)
1 At least once a week 2 Less than once a week but at least once a month 3 Less often than once a month
FUnHrs [ASK IF YES AT ANY OF FGROUPA-P AND AT LEAST ONE OF CODES A-L SELECTED AT FUnPd]
Now just thinking about the last 4 weeks Approximately how many hours have you spent helping thisthese] group(s) club(s) or organisation(s) in the last 4 weeks
If you are not sure please provide your best estimate
FIndGpA [ASK IF YES AT ANY OF FGROUPA-P AND AT LEAST ONE OF CODES A-L SELECTED AT FUnPd]
How did you find out about opportunities to give unpaid help to [thisthese groups(s) club(s) or organisation(s)
Please select all that apply
A Through previously using services provided by the group
B From someone else already involved in the group C From a friend not involved in the groupby word of mouth D Place of worship E School college university F Doctors surgery Community Centre Library G Promotional eventsvolunteer fair H Local events I Local newspaper J National newspaper K TV or radio (local or national) L Volunteer bureau or centre M Employers volunteering scheme N wwwdo-itorguk O National Citizen Service P Other internetorganisational website Q Other way (specify)
MxFVol2 [ASK IF YES AT ANY OF FGROUPA-P AND AT LEAST ONE OF CODES A-L SELECTED AT FUnPd]
Thinking about the unpaid help yoursquove given in the last 12 months have you mixed with
Please select all that apply
1 People of different age groups 2 People of different ethnic groups or religions 3 People with a different social or educational background 4 People who live in different neighbourhoods 5 None of these
MxFVol3 [ASK ALL EXCEPT THOSE SAYING NONE OF THESE AT MxFVol2]
Still thinking about the unpaid help yoursquove given in the last 12 months how often have you mixed with the people you have just mentioned
Please think about all of the people you mix with as part of this activity
Please click the (gt) button for more answer options
1 Daily 2 Weekly 3 Monthly
4 At least once a year 5 Less often than once a year
VolBen [ASK IF (YES AT ANY OF FGROUPA-P AND AT LEAST ONE OF CODES A-L SELECTED AT FUnPd]
Did you start helping these groups clubs or organisations for any of the following reasons
Please select all that apply
1 I wanted to improve thingshelp people 2 I wanted to meet peoplemake friends 3 The cause was really important to me 4 My friendsfamily did it 5 It was connected with the needs of my familyfriends 6 I felt there was a need in my community 7 I thought it would give me a chance to learn new skills 8 I thought it would give me a chance to use my existing skills 9 It helps me get on in my career 10 Its part of my religious belief to help people 11 Its part of my philosophy of life to help people 12 It gave me a chance to get a recognised qualification 13 I had spare time to do it 14 I felt there was no one else to do it 15 None of these
EIntro [ASK IF DWORKA1 = EMPLOYEE]
Now some questions about Employer Supported Volunteering
GEmpVol2 [ASK IF DWORKA1 = EMPLOYEE]
Some employers have schemes for employees to help with community projects voluntary or charity organisations or to give money Have you participated in any activities of this sort that were encouraged by your employer in the last 12 months that is since DATE
Please click the (gt) button for more answer options
1 Yes - helping only 2 Yes ndash giving money only 3 Yes - BOTH helping AND giving money 4 No
GOften [ASK IF GEmpVol2 = 1 OR 3]
Approximately how many days have you spent giving this kind of help in the last 12 months
1 Less than a day 2 One day 3 Two days 4 Three days 5 Four days 6 Five or more days
BVLon IF ( FGROUPA-P ALL = NO) OR (FUNPD = NONE)]
If yes at least one of FGroupA-P AND none at funpd use this text (1) Yoursquove said that during the last 12 months you have not done any of the following things for any groups clubs or organisations Have you done any of these things ndash unpaid ndash for a group club or organisationrsquo in the last five years (that is since YEAR) Please select all that apply
IF no at ALL OF FGROUPA-P use this text (2) You said earlier that you have not been involved with any groups clubs or organisations in the last 12 months Have you done any of the following things - unpaid - for a group club or organisation in the last five years (that is since YEAR) Please select all that apply
(A) Raising or handling moneytaking part in sponsored events (B) Leading the groupmember of a committee (C) Organising or helping to run an activity or event (D) Visiting people (E) Befriending or mentoring people (F) Giving adviceinformationcounselling (G) Secretarial admin or clerical work (H) Providing transportdriving (I) Representing (J) Campaigning (K) Other practical help (eg helping out at school shopping) (L) Any other help None of the above
VYFreq [ASK IF ANY OF CODES A-L SELECTED AT BVLon]
Thinking about the unpaid help you have given to any group club or organisation in the past on average how frequently did you do this
1 At least once a week 2 Less than once a week but at least once a month 3 Less frequently than once a month 4 It was a one-off occasion
VYStop [ASK IF ANY OF CODES A-L SELECTED AT BVLon]
What were the main reasons you stopped giving unpaid help to any groups clubs or organisations
Please select all that apply
A Not enough time - due to changing homework circumstances B Not enough time ndash getting involved took up too much time C Groupcluborganisation finishedclosed D Moved away from area E Due to health problems or old age F Groupcluborganisation wasnt relevant to me anymore G Lost interest H It was a one-off activity or event I Felt I had done my bit someone elsersquos turn to get involved J Got involved in another activity instead K Didnt get asked to do the things Id like to L Felt the groupcluborganisation was badly organised M Felt my efforts werent always appreciated N It was too bureaucratic too much concern about risk and liability O Activity linked to my schoolcollegeuniversityjob I have now left P I didnt feel my contribution made a difference Q Other reason (specify)
BVHelp [ASK IF (FGROUPA-P ALL = NO) OR (FUNPD = NONE) OR (FUNOFT = LESS OFTEN OR DONrsquoT KNOW)]
If FUnoFT=Less often use this text 1) You said earlier that you help group(s) club(s)organisation(s) occasionally that is less than once a month Would you like to spend any more time helping groups clubs or organisations
If FUnoFT= Donrsquot Know use this text (2) You said earlier that you help group(s)club(s)organisation(s) Would you like to spend any more time helping groups clubs or organisations
Otherwise use this text (3) Would you like to spend any time helping groups clubs or organisations
1 Yes 2 No
VBarr [ASK IF (FGROUPA-P ALL = NO) OR (FUNPD = NONE) OR (FUNOFT = LESS OFTEN OR DONrsquoT KNOW)]
If never volunteered formally ((FGroup A-P ALL = NO OR FunPd= None) AND BVLONG = NONE) use this text (1) Which if any of these are reasons why you donrsquot give unpaid help to groups clubs or organisations
If former formal volunteer (BVLon= A-L) use this text (2) Which if any of these are reasons why you have not given unpaid help to groups clubs or organisations in the last 12 months
If irregular formal volunteer (FunOft= Less than once a month OR Donrsquot Know) use this text (3) Which if any of these are reasons why you donrsquot give unpaid help to groups clubs or organisations more regularly
Please select all that apply
A I have work commitments B I have to look after childrenthe home C I have to look after someone who is elderly or ill D I have to study E I do other things with my spare time F Irsquom not the right age G I dont know any groups that need help H I havent heard about opportunities to give help I couldnrsquot find opportunities I Im new to the area J I have never thought about it K I have an illness or disability that I feel prevents me from getting involved L It is not my responsibility M Other reason (specify)
IIntro1 [ASK ALWAYS]
The next section asks about any unpaid help you as an individual may have given to other people that is apart from any help given through a group club or organisation This could be help for a friend neighbour or someone else but not a relative
IHlp [ASK ALWAYS]
In the last 12 months that is since [DATE ONE YEAR AGO] have you done any of these things unpaid for someone who was not a relative
Please select all that apply
1 Keeping in touch with someone who has difficulty getting out and about (visiting in person telephoning or e-mailing)
2 Doing shopping collecting pension or paying bills 3 Cooking cleaning laundry gardening or other routine household jobs 4 Decorating or doing any kind of home or car repairs 5 Babysitting or caring for children 6 Sitting with or providing personal care (eg washing dressing) for someone who is sick
or frail 7 Looking after a property or a pet for someone who is away 8 Giving advice 9 Writing letters or filling in forms 10 Representing someone (for example talking to a council department or to a doctor) 11 Transporting or escorting someone (for example to a hospital or on an outing) 12 Anything else 13 No help given in last 12 months
IHlpOft [ASK IF NOT IHLP=13 (NONE)]
Over the last 12 months that is since [DATE ONE YEAR AGO] about how often have you done [thisthese things]
This includes (LIST RESPONSES GIVEN AT IHLP)
1 At least once a week 2 Less than once a week but at least once a month 3 Less often than once a month
IHlpHrs [ASK IF NOT IHLP=13 (NONE)]
In the last 4 weeks approximately how many hours have you spent doing [thisthese things If you are not sure please provide your best estimate
Answer must be in the range from 0 up to 999 ____
GIntro1 [ASK ALWAYS]
Next are some questions about giving to charity
GGroup [ASK ALL]
_____
In the last 4 weeks have you given money to charity in any of the following ways Please exclude donating goods or prizes
Please select all that apply
Donations A Money to collecting tins (eg door-to-door in the street in a pub at work on a shop
counter etc) B Collection at church mosque or other place of worship C Collections using a charity envelopecheque in the post D Covenant or debit from salary payroll giving E Donation ndash via direct debit standing order F Giving to people begging on the street G Donation ndash in person or on phone (excluding online or via text message) H Donation ndash onlinevia website I Donation - by text message J Donation - via an ATMcash machine K Donation ndash made through contactless technology Purchasesfundraising L Buying raffle tickets (NOT national or health lottery) M Buying goods from a charity shop catalogue or online N Making a purchase where the price includes a charitable donationor where you can
add a charitable donation to the purchase O Buying tickets or spending money at fundraising events (eg charity dinners fetes
jumble sales) Sponsorship P Sponsorship (not online) Q Sponsorship (online) Other R Other method of giving (excluding donating goods or prizes) (specify) S Did not give money to charity
GivAmt [ASK IF NOT GGROUP= DID NOT GIVE TO CHARITY AND NOT DK OR REF]
Approximately how much have you given to charity in the last 4 weeks
Please enter the amount to the nearest pound
Please exclude buying goods
If you are not sure please provide your best estimate
Caus4w [ASK IF NOT GGROUP= DID NOT GIVE TO CHARITY AND NOT DK OR REF]
To which of these causes have you given money in the last 4 weeks
Please select all that apply
A Schools colleges universities or other education B Children or young people (outside school) C Sportsexercise D ReligionPlace of Worship E Older people F Overseas Aid Disaster Relief G Medical Research H Hospitals and Hospices I Physical Mental HealthcareDisabled people (including blind or deaf people) J Social Welfare K Conservation the environment and heritage L Animal Welfare M The arts and museums N Hobbies Recreation Social clubs O Other (specify) None of these
CausLN [ASK IF NOT GGROUP= DID NOT GIVE TO CHARITY AND NOT DK OR REF]
Were these donations for
1 Local charities 2 National or international charities 3 Both local charities and national or international charities
TEUse2 (QB2) [ASK ALL]
Would any of these things encourage you to start giving to charity or to increase the
amount you currently give
Please select all that apply
1 More information about charities I could support
2 Knowing that my money will be spent locally
3 Receiving letteremail of thanks from the charity
4 Receiving information on what has been done with my donation
5 Being asked to increase my donation
6 Confidence that the money will be used efficiently
7 More tax efficient methods (eg Gift Aid giving via self-assessment)
8 More generous tax relief
9 Being asked by someone I know
10 Having more money
11 If payroll giving were available
12 If the charity helped mesomeone close to me
13 None of these
SECTION 6 SOCIAL ACTION
TIMING POINT 6a
SAIntro [ASK ALL]
The next questions are about getting involved in your local area
LocAtt [ASK ALL]
To what extent do you agree or disagree with the following statement
When people in this area get involved in their local community they really can change the way that their area is run
1 Definitely agree 2 Tend to agree 3 Neither agree nor disagree 4 Tend to disagree 5 Definitely disagree
LocInvNew2 [ASK ALL]
Have you been involved in any of the following activities in the last 12 months that is
DATE Please only include those activities that were unpaid
Please donrsquot include anything where you signed a petition but took no further action
Please select all that apply
1 Trying to set up a new serviceamenity for local residents
2 Trying to stop the closure of a serviceamenity
3 Trying to stop something else happening in my local area
4 Running local services on a voluntary basis (eg childcare youth services parks
community centres)
5 Organising a community event (eg street party)
6 Another local issue (specify)
7 None of these
LocPeopNew [ASK IF NOT ALL CODES A-F SELECTED AT LocInvNew]
Have you been aware of other local people being involved in any of these activities over the last 12 months
[LIST FILTERED TO EXCLUDES ANY RESPONSES SELECTED AT LOCINVNEW]
[DISPLAY ON SCREEN] In the last 12 months I have been aware of other local people getting involved in
1 Trying to set up a new serviceamenity for local residents
2 Trying to stop the closure of a serviceamenity
3 Trying to stop something else happening in my local area
4 Running local services on a voluntary basis (eg childcare youth services parks
community centres)
5 Organising a community event (eg street party)
6 Another local issue (specify)
7 None of these
LocAct [IF ANY CODED AT LocInvNew2 ]
In the last 12 months in what ways have you been involved in [this activity or issue these activities or issues]
[DISPLAY CODES SELECTED AT LocInvNew2]
Please select all that apply
A I started up the activity (solely or jointly) B I managed the activity (solely or jointly) C I participated in a discussion on this issueevent (online or in person) D I helped fundraise E I got more people involved F I contributed specialist skills G I donated money H I offered non-monetary donations or contributions I I campaigned J I helped raise awareness locally K I helped organise a petition L I signed a petition M I offered other practical support N Other (specify)
LocOft [IF ANY CODED AT LocInvNew 2]
On how many occasions in the last 12 months have you spent time helping with [this
activity or issue all of these activities or issues]
[DISPLAY CODES SELECTED AT LocInvNew2]
1 On one occasion only 2 On 2 or 3 occasions 3 On four or five occasions 4 Or more frequently
LocHow [IF ANY CODED AT LocInvNew 2]
How did you find out how to get involved with [this activity or issue these activities or issues]
[DISPLAY CODES SELECTED AT LocInvNew2]
Please select all that apply
A I was the personone of the people who started the action B I was asked to get involved by someone I already knew C I was asked to get involved by someone I hadnrsquot previously known D I saw a leafletposterflyer E I read about it in the local newspaper F Via a local community neighbourhood residents group G Via an online forum or social network site H Other (specify)
LocMot2 (QB4) [ASK IF ANY CODED AT LocInvNew2] Why did you get involved in [the local issue or activityall of the local issues or activities]
[DISPLAY CODES SELECTED AT LocInvNew2] Please select all that apply
1 To serve my communityfelt it was my responsibility
2 To improve local servicesnot happy with existing provision
3 To resolve an issue
4 My political beliefs
5 An earlier positive experience of getting involved
6 I was asked to get involved
7 To have my say
8 To meet peoplemake friends
9 It was connected to the needs of familyfriends
10 To give me a chance to learn new skillsuse my existing skills
11 To help my career
12 I had spare time to do it
13 I wanted an interest outside of work
14 Other (please specify)
LocWant [ASK IF ANY OF CODES A-F SELECTED AT LocPeopNew AND LocInvNew = NONE OF THESE]
You said you had been aware of other local people in your area getting involved with
[ONLY DISPLAY ANSWERS SELECTED AT LocPeopNew]
- Trying to set up a new service or amenity - Trying to stop the closure of a service or amenity - Trying to stop something happening in your local area - Running local services on a voluntary basis - Organising a community event such as a street party - Another issue affecting your local area
Would you like to have been involved in [this local issue any of these local issues]
1 Yes 2 No
LocBarr1 [ASK IF LocWant = ASK IF ANY OF CODES A-F SELECTED AT LocPeopNew AND LocInvNew = NONE OF THESE]
IF YES AT LocWant Why didnt you get involved in this [this local issue or activity any of these local issues or activities]
IF NO At LocWant Why didnt you want to get involved in [this local issue or activity any of these local issues or activities]
[ONLY DISPLAY ANSWERS SELECTED AT LocPeopNew]
Please select all that apply
1 I dont have time 2 I do other voluntary activities 3 Was not asked to get involved 4 Have never thought about it 5 Did not know how to get involved 6 Due to illness or disability 7 Donrsquot feel its my responsibility 8 Did not feel I could make a difference 9 Donrsquot have the right skills 10 Not confident enough 11 Donrsquot know people in my area well enough 12 I donrsquot get on with people in my local area 13 Didnrsquot agree with the issue or feel strongly enough about it 14 Red tape bureaucracylegal barriers 15 Just not interested 16 Other reason (specify)
SECTION 7 SUBJECTIVE WELLBEING
TIMING POINT 7
Wellintro [ASK ALWAYS]
The next questions ask about your feelings on aspects of your life They are included to help measure peoplersquos wellbeing and the information produced will not identify you or anyone in your household
There are no right or wrong answers For each of these questions please give an answer on a scale of 0 to ten where 0 is not at all and 10 is completely
WellB1 [ASK ALWAYS]
Overall how satisfied are you with your life nowadays
Please click the (gt) button for more answer options
(SCALE 0 (Not at all satisfied) to 10 (completely satisfied))
WellB4 [ASK ALWAYS]
Overall to what extent do you feel the things you do in your life are worthwhile
Please click the (gt) button for more answer options
(SCALE 0 (not at all worthwhile) to 10 (completely worthwhile))
WellB2 [ASK ALWAYS]
Overall how happy did you feel yesterday
Please click the (gt) button for more answer options
(SCALE 0 (not at all happy) to 10 (completely happy))
WellB3 [ASK ALWAYS]
Overall how anxious did you feel yesterday
Please click the (gt) button for more answer options
(SCALE 0 (not at all anxious) to 10 (completely anxious))
Lon1 [ASK ALWAYS]
How often do you feel that you lack companionship
Please click the (gt) button for more answer options
A Often
B Some of the time
C Hardly ever or Never
Lon2 [ASK ALWAYS]
How often do you feel left out
Please click the (gt) button for more answer options
A Often
B Some of the time
C Hardly ever or Never
Lon3 [ASK ALWAYS]
How often do you feel isolated from others
Please click the (gt) button for more answer options
A Often
B Some of the time
C Hardly ever or Never
LonOft [ASK ALWAYS]
How often do you feel lonely
Please click the (gt) button for more answer options
A Oftenalways B Some of the time C Occasionally D Hardly ever E Never
SECTION 8 DEMOGRAPHICS PART 2
TIMING POINT 8
IntroHTen2 [ASK ALWAYS]
The following questions are about you and your circumstances
HTen1 [ASK ALWAYS]
Do you (or your household) own or rent this accommodation
Please click the (gt) button for more answer options
1 Own it outright 2 Buying it with the help of a mortgage loan 3 Part own and part rent (shared ownership) 4 Rent it (includes all those who are on Housing Benefit or Local Housing Allowance) 5 Live here rent-free (including rent-free in relatives friends property but excluding
squatters) 6 Squatting
HLLord [ASK IF (HTEN1 = 3 4 OR 5)]
Who is the landlord
Please select the first one that applies
1 The local authority council ALMO 2 A housing association RSL charitable trust or Local Housing Company 3 Employer (organisation) of a household member 4 Another organisation 5 Relative acquaintance of any current household member from before this tenancy
started 6 Employer (individual) of a household member 7 Another individual private landlord
Ethnic [ASK ALWAYS]
Which one of the following best describes your ethnic group or background
Please select one option
WHITE 1 EnglishWelshScottishNorthern IrishBritish 2 Irish 3 Gypsy or Irish Traveller 4 Any other White background (specify) MIXED 5 White and Black Caribbean 6 White and Black African 7 White and Asian 8 Any other mixedmultiple ethnic background (specify) ASIAN OR ASIAN BRITISH 9 Indian 10 Pakistani 11 Bangladeshi 12 Chinese 13 Any other Asian background (specify) BLACK OR BLACK BRITISH 14 African 15 Caribbean 16 Any other BlackAfricanCaribbean background (specify) OTHER ETHNIC GROUP 17 Arab 18 Any other ethnic group (specify)
19 Prefer not to say
Citzen [ASK ALWAYS]
Are you a citizen of any of the following
Citizenship means you are entitled to a passport issued by that country
Please select all that apply
Please click the (gt) button for more answer options
1 The United Kingdom (Great Britain and Northern Ireland)
2 Republic of Ireland
3 Any other member state of the European Union
4 Any other country elsewhere in the world
SMain [ASK ALWAYS]
Which language do you speak most often at home Please choose your main language If you speak English and another language equally please select both of these codes
Please click the (gt) button for more answer options
1 English 2 Other language
SGood [ASK IF SMain NE =1]
In day-to-day life how good are you at speaking English when you need to For example to have a conversation on the telephone or talk to a professional such as a teacher or a doctor
Please click the (gt) button for more answer options
1 Very good
2 Fairly good
3 Not very good
4 Not at all good
Relig [ASK ALWAYS]
What is your religion even if you are not currently practising
Please click the (gt) button for more answer options
1 No religion 2 Christian 3 Buddhist 4 Hindu 5 Jewish 6 Muslim 7 Sikh 8 Any other religion 9 Prefer not to say
RelAct [ASK IF NOT RELIG=1]
Do you consider that you are actively practising your religion
Please click the (gt) button for more answer options
1 Yes 2 No 3 Prefer not to say
GHealth [ASK ALWAYS]
How is your health in general
Please click the (gt) button for more answer options
1 Very good 2 Good 3 Fair 4 Bad 5 Very bad
DIll [ASK ALWAYS]
[]Do you have any physical or mental health conditions or illnesses lasting or expected to last for 12 months or more
Please click the (gt) button for more answer options
1 Yes 2 No
DIll2 [ASK IF DIL1=1]
[] Does your condition or illnessdo any of your conditions or illnesses] reduce your ability to carry out day-to-day activities
Please click the (gt) button for more answer options
1 Yes ndash a lot 2 Yes ndash a little 3 No
RCare [ASK ALWAYS]
Do you have any caring responsibilities for a member of your immediate family or a close relative outside of your household who has any long-standing illness disability or infirmity
Please click the (gt) button for more answer options
1 Yes 2 No
RCareHrs [ASK IF RCare=1]
Including travelling time approximately how long do you spend caring for this personthese people in an average week
Please click the (gt) button for more answer options
1 0-2 hours
2 3-4 hours
3 5-9 hours
4 10-19 hours
5 20-29 hours
6 30 hours or more
SId [ASK ALL]
Which of the following best describes how you think of yourself
We are asking this question so that we can compare the experiences of different groups in society
1 Heterosexual Straight 2 Gay Lesbian 3 Bisexual 4 Other 5 Prefer not to say
Employment Status TIMING POINT 9
EIntro1 [ASK ALWAYS]
The final questions about your work and employment
Wrking [ASK ALWAYS]
Did you do any paid work in the 7 days ending Sunday the [date last Sunday] either as an employee or as self-employed
1 Yes 2 No
SchemeT [ASK IF WRKING = (NO OR DKREF)]
Were you on a government scheme for employment training
1 Yes 2 No
JbAway [ASK IF WRKING = NO OR WRKING = DKREF AND (SCHEMET = NO OR SCHEMET = DKREF)]
Did you have a job or business you were away from
1 Yes 2 No 3 Irsquom waiting to take up a new jobbusiness already obtained
OwnBus [ASK IF (JBAWAY = NO) OR (JBAWAY = DKREF)]
Did you do any UNPAID work in that week for any business that you own
1 Yes 2 No
RelBus [ASK IF (OWNBUS = NO) OR (OWNBUS = DKREF)]
Did you do any unpaid work for a business that a relative owns
1 Yes 2 No
Looked [ASK IF( RELBUS = NODKREF AND JBAWAY = NODKREF)]
Were you looking for any kind of paid work or a place on a government training scheme at any time in the last 4 weeks
1 Yes 2 No
StartJ [ASK IF ((LOOKED = YES) OR (JBAWAY = WAITING)]
If a job or a place on a government training scheme had been available in the week ending Sunday the [date last Sunday] would you have been able to start within 2 weeks
1 Yes 2 No
LKTime [ASK IF ((LOOKED = YES) OR (LOOKED = WAIT)) OR (JBAWAY = WAITING)]
How long have you been looking for paid worka place on a government scheme
1 Not yet started 2 Less than 1 month 3 1 month but less than 3 months 4 3 months but less than 6 months 5 6 months but less than 12 months 6 12 months or more
Whynlk [ASK IF LOOKED = NO]
What was the main reason you did not look for work in the last 4 weeks
1 Student 2 Looking after the familyhome 3 Temporarily sick or injured 4 Long-term sick or disabled 5 Retired from paid work 6 Other reason
Whynsrt [ASK IF STARTJ = NO]
What was the MAIN reason you would not have been able to start work within two weeks
1 Student 2 Looking after the familyhome 3 Temporarily sick or injured 4 Long-term sick or disabled 5 Retired from paid work 6 Other reason
Infstud [ASK ALWAYS]
Are you at present [at school or 6th form college] enrolled on any full-time or part-time education course excluding leisure classes
Please include correspondence courses and open learning as well as other forms of full-time and part-time education course
1 Yes ndash full time student 2 Yes ndash part-time student 3 No
EverWk [ASK IF NOT ( WRKING = YES OR SCHEMET = YES OR JBAWAY = YES OR OWNBUS = YES OR RELBUS = YES)]
Have you EVER had a paid job apart from casual or holiday work (or the job you are waiting to begin)
1 Yes 2 No
LeavWk [ASK IF EVERWK=1]
When did you leave your last PAID job
Please enter the month and year below
[ASK IF (WRKING = YES) OR (SCHEMET = YES) OR (JBAWAY = YES) OR (OWNBUS = YES) OR (RELBUS = YES) OR (EVERWK = YES)]
OcOrg Which of the following types of organisation on this card [dodid] you work for
Please click the (gt) button for more answer options
1 Private sector firm or company including for example limited companies and PLCs 2 Nationalised industry or public corporation including for example the Post Office and
the BBC 3 Other public sector employer including for example Central GovernmentCivil
ServiceGovernment Agencies Local AuthorityLocal Educational Authority Universities Health AuthorityNHS HospitalsNHS TrustsGP surgeries PoliceArmed Forces
4 CharityVoluntary sector including for example charitable companies churches trade unions
5 Other (specify )
OccT
What was your [main job in the week ending Sunday the [DATE]your last main job]
Please enter your full job title
OccD What [dodid] you mainly do in your job] Please give as much detail as possible and include any special qualifications and training needed to do the job
Soft checkOccd [If less than 40 characters entered at OccD]
That is a short answer Please record as much detail as possible
Stat [AreWere] you working as an employee or [arewere] you self-employed
1 Employee 2 Self-employed
SVise [ASK IF STAT = 1]
In your job [dodid] you have formal responsibility for supervising the work of other employees
1 Yes 2 No
EmpNo [ASK IF STAT = 1]
How many people [workworked] for your employer at the place where you [workworked]
Please click the (gt) button for more answer options
1 1 to 24 2 25 to 249 3 250 to 499 4 500 or more
Solo [ASK IF STAT = 2]
[AreWere] you working on your own or [dodid] you have employees
1 On ownwith partner(s) but no employees 2 With employees
SENo [ASK IF SOLO = 2]
How many people [dodid] you employ at the place where you [workworked]
1 1 to 24 2 25 to 249 3 250 to 499 4 500 or more
FtPtWk [ASK IF (WRKING = YES) OR (SCHEMET = YES) OR (JBAWAY = YES) OR (OWNBUS = YES) OR (RELBUS = YES) OR (EVERWK = YES)]
In your (main) job [arewere] you working
1 Full time (30+ hours a week) 2 Part time (less than 30 hours per week)
Ifpqual [ASK IF AGED lt 70]
Do you have any qualifications from each of the following
Please select all that apply
1 From school college or university 2 Connected with work 3 From government schemes 4 No qualifications
Edqual [ASK IF IFPQUAL = 123DKPREFER NOT TO SAY]
Starting from the top of this list please look down the list of qualifications and select the first one you come to that you have passed
1 Higher degreepostgraduate qualifications 2 First degree (including BEd) Postgraduate Diplomas Certificates (including PGCE)
Professional qualifications at Degree level (eg chartered accountant surveyor) NVQSVQ Level 4 or 5
3 Diplomas in higher education other HE qualification HNC HND BTEC higher Teaching qualifications for schools further education (below degree level) Nursing other medical qualifications (below degree level) RSA Higher Diploma
4 AAS levels SCE higher Scottish Certificate 6th Year Studies NVQ SVQ GSVQ level 3 GNVQ Advanced ONC OND BTEC National City and Guilds Advanced Craft Final level Part III RSA Advanced Diploma
5 Trade Apprenticeships 6 O level GCSE Grades A-C SCE Standard Ordinary Grades 1-3 NVQSVQ GSVQ level
2 GNVQ intermediate BTEC SCOTVEC First General diploma City and Guilds Craft Ordinary level Part II RSA Diploma
7 O levelGCSE grade D-G SCE StandardOrdinary grades below 3 NVQSVQ GSVQ level 1 GNVQ foundation BTEC SCOTVEC First General certificate City and Guilds Part I RSA Stage I-III SCOTVEC modules Junior Certificate
8 Other qualifications including overseas
[IncIntro] [ASK ALWAYS]
The next questions are about income It is important for us to know so we can understand how it influences peoplersquos behaviours and attitudes Please remember that all the information collected is completely confidential and will only be used for the purposes of producing statistics
INCOMERP
Please select the income group which represents [your personalyou and your husbandrsquoswifersquos partnerrsquos combined] income in the last 12 months that is since DATE from all sources before any deductions such as income tax or National Insurance
Please click the (gt) button for more answer options
WEEKLY MONTHLY ANNUAL 1 A Up to pound49 Up to pound216 Up to pound2599 2 B pound50 up to pound99 pound217 up to pound432 pound2600 up to pound5199 3 C pound100 up to pound199 pound433 up to pound866 pound5200 up to pound10399 4 D pound200 up to pound299 pound867 up to pound1299 pound10400 up to pound15599 5 E pound300 up to pound399 pound1300 up to pound1732 pound15600 up to pound20799 6 F pound400 up to pound499 pound1733 up to pound2166 pound20800 up to pound25999 7 G pound500 up to pound599 pound2167 up to pound2599 pound26000 up to pound31199 8 H pound600 up to pound699 pound2600 up to pound3032 pound31200 up to pound36399 9 I pound700 up to pound799 pound3033 up to pound3466 pound36400 up to pound41599 10 J pound800 up to pound899 pound3467 up to pound3899 pound41600 up to pound46799 11 K pound900 up to pound999 pound3900 up to pound4332 pound46800 up to pound51999 12 L pound1000 up to pound1449 pound4333 up to pound6249 pound52000 up to pound74999 13 M pound1450 up to pound1929 pound6250 up to pound8349 pound75000 up to pound99999
14 N pound1930 up to pound2879 pound8350 up to pound12499 pound100000 up to pound149999 15 O pound2880 or more pound12500 or more pound150000 or more
IncomeX [ASK IF MAR = 2 OR 6 OR LIVE = 1 OR 3]
Please select the income group which represents your total PERSONAL income in the last 12 months that is since DATE before any deductions for tax etc Please include income from earnings self employment benefits pensions and interest from savings
Please click the (gt) button for more answer options
WEEKLY 1 A Up to pound49 2 B pound50 up to pound99 3 C pound100 up to pound199 4 D pound200 up to pound299 5 E pound300 up to pound399 6 F pound400 up to pound499 7 G pound500 up to pound599 8 H pound600 up to pound699 9 I pound700 up to pound799 10 J pound800 up to pound899 11 K pound900 up to pound999 12 L pound1000 up to pound1449 13 M pound1450 up to pound1929 14 N pound1930 up to pound2879 15 O pound2880 or more
MONTHLY Up to pound216 pound217 up to pound432 pound433 up to pound866 pound867 up to pound1299 pound1300 up to pound1732 pound1733 up to pound2166 pound2167 up to pound2599 pound2600 up to pound3032 pound3033 up to pound3466 pound3467 up to pound3899 pound3900 up to pound4332 pound4333 up to pound6249 pound6250 up to pound8349 pound8350 up to pound12499 pound12500 or more
ANNUAL Up to pound2599 pound2600 up to pound5199 pound5200 up to pound10399 pound10400 up to pound15599 pound15600 up to pound20799 pound20800 up to pound25999 pound26000 up to pound31199 pound31200 up to pound36399 pound36400 up to pound41599 pound41600 up to pound46799 pound46800 up to pound51999 pound52000 up to pound74999 pound75000 up to pound99999 pound100000 up to pound149999 pound150000 or more
FOLLOWUP [ASK ALWAYS]
This survey is conducted by Kantar Public an independent social research organisation We may like to contact you again with questions relating to this survey or to help with other connected research for the Government or a charity Would it be okay for us to contact you within the next two years
This will involve us keeping a secure record of your name email address andor telephone number for two years Your contact details will not be used for any other purposes and will be destroyed after two years If you answer yes you are giving your permission for us to re-contact you within the next two years to discuss taking part in follow-up research You are not agreeing to take part in any research
1 Yes 2 No
FOLLOWP2 [ASK ALWAYS]
If follow up research related to this survey was being conducted on behalf of the government or a charity would you be willing for Kantar Public to securely pass your name contact details and information from this survey to another research organisation so they could contact you within the next two years
This will involve us keeping a secure record of your name email address andor telephone number for two years Your contact details will only be shared for valid research purposes and will be destroyed after two years
If you answer lsquoyesrsquo you are giving your permission to be re-contacted to discuss taking part in follow-up research within the next two years by another research organisation You are not agreeing to take part in any research
1 Yes 2 No
GiveTel [ASK IF FOLLOWUP = 1 OR FOLLOWUP2 = 1]
Please enter your telephone number in case we want to contact you for any follow up research
ENTER TELEPHONE NUMBER _______________ Prefer not to give my telephone number
PEREMAIL [ASK IF FOLLOWUP = 1 OR FOLLOWUP2 = 1]
Do you have a home or work email address that you access at least once a month
1 Yes 2 No
EMAIL [ASK IF ((FOLLOWUP = 1 OR FOLLOWUP2 = 1) AND PEREMAIL = 1)]
Please enter your email address in case we want to contact you for any follow up research
ENTER EMAIL ADDRESS Prefer not to give my email address
ASK IF gt 1 ADULT AGED 16+ IN HOUSEHOLD Qflw1 Did you discuss any elements of the survey with any other household members either before or during the process of completing the survey
1 Yes 2 No
ASK IF Q1 = Yes
Qflw2 What did you discuss with other members of your household Please select all that apply
1 The survey in general (eg what it is about whether to complete it) 2 The broad content of the survey (eg what sort of issues it covers) 3 How to respond to specific questions in the survey 4 Other (please type in details of what else you discussed)
QFraud [ASK ALWAYS] The Community Life Survey is conducted on behalf of HM Government The quality of the data is very important so please read the statement below and tick the box underneath to confirm you are ready to submit
Confirm full name
I confirm that all of my answers were given honestly and represent my own personal views
TICK BOX
TIMING POINT 10
Appendix B Community Life Paper Questionnaire
Appendix C Advanced Online Letter (with FAQs) Reminder Online Letter Paper Letter
Department for Digital Culture Media and Sport
100 Parliament Street
London SW1A 2BQ
The Resident(s) Street name Town
CountyCountry Postcode
XX Month 20XX
The Community Life Survey Help build stronger communities
This is an invitation to take part in the Community Life Survey an official Government study that allows your views to be
heard on a range of issues affecting your neighbourhood
Your contribution will help strengthen local communities and allows the government charities and
other public sector organisations to track changes over time
Each person who completes the survey will receive a pound10 shopping voucher to thank them for their time
Itrsquos easy to take part Simply go online to wwwcommlifecouk and log in using one of the reference numbers and password
details provided below Up to four people aged 16 or over can take part in your household Each set of login details can only
be used once
The closing date for the survey is [DATE]
Ref No 123456 XXXXX
Ref No 123456 XXXXX
Ref No 123456 XXXXX
Ref No 123456 XXXX
The survey can be completed on a laptop tablet or smartphone If you are unable to complete the survey online and require
a paper version of the questionnaire please use the contact details below
I hope you enjoy the questionnaire and the opportunity to express your thoughts and opinions about your local area
Yours faithfully
Jackie Orme
Head of Statistics Department for Digital Culture Media and Sport HM Government
Communitylifesurveykantarpubliccom
Why did we choose your address
As it is not possible to ask everyone to
take part in the survey we select a
sample of addresses to represent the
entire country
Your address was selected at random
from a list of private addresses held by
the Royal Mail
Who is conducting the survey
The survey is being conducted on behalf of
the Department for Digital Culture Media
and Sport by Kantar Public an
independent research agency
More information about the survey is
available online at httpswwwgovuk
governmentcollectionscommunity-life-
survey--2
Is this survey confidential
Yes The information that is collected will
only be used for research and statistical
purposes Your name and address details
are kept separate from your answers and
will not be passed on to any other
organisation
No individual or household will be
identifiable from the results Your answers
will be combined with others that take part
in the survey You will not receive any lsquojunk
mailrsquo as a result of taking part
Why are my views important
We need people from all age groups
and backgrounds to take part Your
views are important to us as without
them we may not have a representative
picture of the communities that people
live in
Data Protection
All information will be processed in
compliance with the Data Protection
Act 1998 and General Data Protection
Regulation for the performance of
official authority and public interest and
will only be held for as long as it is being
used to produce statistics
If you need further information please
contact dcmsdataprotectionculture
govuk or call 0800 158 2952
What do you need to do
Up to four people aged 16 or over in
your household simply need to go to
wwwcommlifecouk enter one of the
reference numbers and associated
password provided and complete the
questionnaire by the date shown on
the front of the letter If you would
like to take part but are unable to
complete the survey online please
contact the Kantar Public Information
Line and a paper version of the
questionnaire will be sent to you along
with a pre-paid envelope
How do I collect the voucher
Once you have completed the survey
you will be directed to the Perks website
where you can use the survey login
details to sign in and choose from a
range of different pound10 shopping
vouchers
How will the information be used
Information from this survey will help
government departments inform
policies aimed at building stronger
communities and enabling people to
play a more active role in their
communities and society
The information will also be used by
local decision-makers voluntary groups
local government and councils to
understand and drive improvements in
local communities
What are my rights
Completion of this survey is voluntary
We will ask for details such as your
views on the community We will also
ask you for sensitive information such as
your ethnicity and religion but you
donrsquot have to answer these questions
For more information see https
icoorgukfor-the-public
If you are not happy with the way we
are processing your data you have the
right to lodge a complaint to the
Information Commissionerrsquos Office
about our practices at
httpsicoorgukconcerns
Department for Digital Culture Media and Sport
100 Parliament Street
London SW1A 2BQ
The Resident(s) Street name Town
CountyCountry Postcode
XX Month 20XX
The Community Life Survey Help build stronger communities
We recently invited your household to take part in the Community Life Survey an official Government Our records
suggest that the survey has not yet been completed by all adults in your household We are writing again because of the
importance of your household in helping us to gather accurate information
This is your opportunity to make your views heard on a range of issues that affect your local
area
If you or anyone in your household have not taken part please follow the instructions below You will be able to collect your a pound10 shopping voucher at the end of the survey
Itrsquos easy to take part Simply go online to wwwcommlifecouk and log in using one of the reference numbers and
password details provided below Up to four people aged 16 or over can take part in your household Each set of login
details can only be used once
Ref No 123456 XXXXX
Ref No 123456 XXXXX
Ref No 123456 XXXXX
Ref No 123456 XXXX
The closing date for the survey is [DATE]
The survey can be completed on a laptop tablet or smartphone If you are unable to complete the survey online and
require a paper version of the questionnaire please use the contact details below
I hope you enjoy the questionnaire and the opportunity to express your thoughts and opinions about your local area
Yours faithfully
Jackie Orme
Head of Statistics Department for Digital Culture Media and Sport HM Government
Communitylifesurveykantarpubliccom
Department for Digital Culture Media and Sport
100 Parliament Street
London SW1A 2BQ
XX Month 20XX
The Community Life Survey
Help build stronger communities
We recently invited your household to take part in the Community Life Survey an official Government study
that allows your views to be heard on a range of issues affecting your local area Our records suggest that the
survey has not yet been completed by all adults in your household
Each person who completes the survey will receive a pound10 shopping voucher to thank them for their
time
In order to fully understand how people feel about their local area we need as many people to take part in this
important study as possible
Itrsquos easy to take part Simply go online to wwwcommlifecouk and log in using one of the reference numbers
and password details provided below Up to four people aged 16 or over can take part in your household Each
set of login details can only be used once
Ref No 123456 XXXXX
Ref No 123456 XXXXX
Ref No 123456 XXXXX
Ref No 123456 XXXX
To collect your pound10 shopping voucher please complete by [DATE] You can choose a voucher from a range of
retailers
The survey can be completed on a laptop tablet or smartphone If you are unable to complete the survey online and require a paper version of the questionnaire please use the contact details below Thank you for taking the time to tell us about your local area and contribute to an official government study
Yours faithfully
Jackie Orme
Head of Statistics Department for Digital Culture Media and Sport HM Government
Communitylifesurveykantarpubliccom
Appendix D Derived Variable Lists
Variable Name Description
rnssec Respondent Socio-Economic Classification (NS-SEC based on SOC2010) Operational Categories
rnssec8 Respondent Socio-Economic Classification (NS-SEC based on SOC2010) Analytic Categories - 8 groups
rnssec5 Respondent Socio-Economic Classification (NS-SEC based on SOC2010) Analytic Categories - 5 groups
rnssec3 Respondent Socio-Economic Classification (NS-SEC based on SOC2010) Analytic Categories - 3 groups
Rage3 Respondent age 3 categories
Rage3E Respondent age 3 categories for Ethnicity categories
Rage4 Respondent age 4 categories
R2age3 Respondent age2 3 categories
Rage5 Respondent age 5 categories
Rage6 Respondent age 6 categories
R2age6 Respondent age2 6 categories
R3age6 Respondent age (6 categories incl 25yrs in first)
Ragecat Respondent age 7 categories
Rage9 Respondent age 9 categories
Age2564 Respondent age binary grouping (25-64)
Nadlt60X Number of adults under 60 in household
Nadgt59 Number of adults 60 or over in household
Livharm1 Respondent marital status
Nslivarr Respondent living arrangements
Ethnic2 Ethnic group 2 categories
Ethnic4a Ethnic group 4 categories
Ethnic5a Ethnic group 5 categories
Ethnic6 Ethnic group 6 categories
Ethnic11a Ethnic group 11 categories
Rethage9a Respondents Ethnic origin and age (excludes MixedOther)
RSxage12 Respondent sex and age -12 categories
RSexeth6a Respondents sex and Ethnic group - excludes Mixed or Other
E5sex1 Sex within Ethnicity 10 categories
E11sex1 Sex within Ethnicity 11 categories
Xsmain1 English one of main languages
Relprac Whether actively practising Religion
Actrel Whether practising for each Religion
Actrel3 Whether practising Religion (3 groups)
RelBI Respondent Religion Christian and no Religion compared to all minority Religions
Relig7 Respondent Religion 7 categories Jewish included in other
Relstat Practice status for each Religion
E11Relig1 Ethno-Religious groups 11 categories
ZSBeGB How strongly do you belong to Britain
ZSBeNeigh How strongly do you belong to your neighbourhood
SLive5 How long lived in neighbourhood 5 categories
SLive7 How long lived in neighbourhood 7 categories
Zstogeth Agree (definitely or tend to) that local area is place where people from different backgrounds get on well together
Zslocsat How satisfied or dissatisfied with this local area as a place to live
Zcivpar1 Civic participation in last 12 months
Zcivpar3 Civic participation in last 12 months with missing values
Zcivmon1 Civic participation at least once a month
Zpconsul1 Any Civic consultation in past 12 months
Zcivcon1 Civic consultation at least once a month
ZPAffLoc Can you influence decisions affecting area
ZPInfl How important is it personally for you to be able to influence decisions in your local area
Zformon Formal volunteering at least once a month
Zforvol2 Formal volunteering in last 12 months with missing values
Zmxfvol1 Mixed at least once in the last 12 months with people from different ethnic groups religious groups age groups social or educational backgrounds and
those living in different neighbourhoods formal volunteering
Zforvol Formal volunteering in last 12 months
Funhrs2 Formal Volunteering hours-excluding large values
Zempvol1 Employer volunteering in last 12 months
Gemppar1 Employee participated in volunteering scheme
ZIhlpmon Informal help at least once a month
Zinfvol Informal help in last 12 months
Zinfvol2 Informal help in last 12 months with missing values
Ihlphrs2 Informal Volunteering hours-excluding large values
Zinffor Formal or informal volunteering in the last 12 months
Zinfform Formal or informal volunteering in the last month
Zanyvol Formal or informal or employer volunteering in the last 12 months
GivAmtx About how much (altogether) have you given to charity in the last 4 weeks
Givech1 Given money to charity in past 4 weeks (missing values coded as no)
Givech3 Given money to charity in past 4 weeks
GivAmtB Amount given to charity (Banded)
GivAmtB2 Amount given to charity (Banded)
GivAmt2 Amount giving to charity excluding values over 300
ZSPull To what extent would you agree or disagree that people in this neighbourhood pull together SPull collapsed
N13 Whether been a councillor or been a member of a group making decisions in the last 12 months
ZCivact1 Any civic activism activities in past 12 months (CivAct1)
ZCivact2 Any civic activism activities in past 12 months (CivAct2)
ZCivren Any civic activism in the past 12 months
Zcivren3 Any civic activism or consultation in the past 12 months
Zciveng1 Whether taken part in any civic engagement
ZEngFv1 Any civic engagement or formal volunteering in the last 12 months
Zdill Limiting long-term illnessdisability
Sid2 Respondent sexual identity 3 categories
Student Full-time student
Zquals Respondents (aged 16-69) Highest Qualification
Zquals1 Respondents Highest qualification all ages
Zqual2 No Formal Qualifications Formal Qualifications (web respondents only)
Zqual3 No Formal QualificationsFormal Qualifications
Zvolgps BME or no qualifications or limiting long term illness
ZIncomhh Respondent and partners (if applicable) gross income 9 categories
ZIncomer Respondent and partners (if applicable) gross income 9 categories
DVILO3a Respondent economic status 3 categories
DVILO4a Respondent economic status 4 categories
SOC10mg SOC 2010 Major Groups
SOC10smg SOC2010 Sub-Major Group
Zschatny Whether chat to neighbours more than to just say hello
Zschatnf Frequency of chatting to neighbours more than to just say hello
Zvyfreq Frequency of previous unpaid help given to a group club or organisation
ZSFavN Agree (definitely or tend to) that they borrow things and exchange favours with neighbours
ZLocAtt Whether agree or disagree that when people get involved in their local community they can really change the way an area is run
ZLocPeop1 Whether aware of local people getting involved in a local issueactivity
ZLocInv1 Whether been personally involved in helping out with local issueactivity
ZLocOft Number of occasion in the last 12 months have spent time helping with
activityissue in local area
pethdec Percentage of minority ethnic households in ward
- Structure Bookmarks
-
- Appendix D Derived Variable Lists
-