company update - july 22, 2015
TRANSCRIPT
Company UpdateJuly 22, 2015

Certain statements and information contained in this presentation constitute “forward‐looking statements” within the meaning of the Private Securities Litigation Reform Act of 1995. Where any forward‐looking statement includes a statement about the assumptions of bases underlying the forward‐looking statement, we caution that, while we believe these assumptions or bases to be reasonable and made in good faith, assumed facts or bases almost always vary from actual results, and the differences between assumed facts or bases and actual results can be material, depending on the circumstances. Where, in any forward‐looking statement, our management expresses an expectation as to future results, such expectation is expressed in good faith and is believed to have a reasonable basis. We cannot assure you, however, that the statement of expectation will result or be achieved or accomplished. These statements relate to analyses and other information that are based on forecasts of future results and estimates of amounts not yet determinable. These statements also relate to our future prospects, developments and business strategies. Forward‐looking statements typically include words or phrases such as “anticipate,” “believe,” “could,” “estimate,” “expect,” “forecast,” “intend,” “our ability to,” “plan,” “potential,” “projected,” “should,” “target,” “will,” “would,” or other similar words, or negatives of such words, which are generally not historical in nature. Such forward‐looking statements specifically include statements involving: client contract opportunities; contract dayrate amounts; future operational performance and cashflow; contract backlog; revenue efficiency levels; construction, timing and delivery of newbuilddrillships; capital expenditures; market conditions; cost adjustments; estimated rig availability; expected direct rig operating costs; shore based support costs; selling, general and administrative expenses; income tax expense; expected amortization of deferred revenue and deferred mobilization expenses; and expected depreciation and interest expense for our existing credit facilities and senior bonds. These forward‐looking statements are based on our current expectations and beliefs concerning future developments and their potential effect on us. While management believes that these forward‐looking statements are reasonable as and when made, there can be no assurance that future developments affecting us will be those that we anticipate. All comments concerning our expectations for future revenue and operating results are based on our forecasts for our existing operations and do not include the potential impact of any future acquisitions or dispositions. Our forward‐looking statements involve significant risks and uncertainties (many of which are beyond our control) and assumptions that could cause actual results to differ materially from our historical experience and our present expectations, plans or projections. Important factors that could cause actual results to differ materially from projected cashflows and other projections in our forward‐looking statements include, but are not limited to: levels of offshore drilling activity, reduced capital expenditures by our clients and general market conditions; our ability to secure and maintain drilling contracts, including possible cancellation, renegotiation or suspension of drilling contracts as a result of mechanical difficulties, performance, market changes, regulatory or other approvals, or other reasons; changes in worldwide rig supply and demand, competition and technology; outcome of negotiations with the shipyard regarding the delay of our rig; our ability to favorably revise our current debt covenants; risks inherent to shipyard rig construction, repair, maintenance or enhancement, including delays; unplanned downtime and other risks associated with offshore rig operations, including unscheduled repairs or extended maintenance; governmental action, strikes, public health threats, civil unrest and political and economic uncertainties; relocations, severe weather or hurricanes; environmental or other liabilities, risks or losses; governmental regulatory, legislative and permitting requirements affecting drilling operations; our ability to attract and retain skilled personnel on commercially reasonable terms; impact of potential licensing or patent litigation; terrorism, piracy and military action; and the outcome of litigation, legal proceedings, investigations or other claims or contract disputes.
For additional information regarding known material risk factors that could cause our actual results to differ from our projected results, please see our filings with the Securities and Exchange Commission (SEC), including our Annual Report on Form 20‐F and Current Reports on Form 6‐K. These documents are available through our website at www.pacificdrilling.com or through the SEC’s Electronic Data and Analysis Retrieval System at www.sec.gov.
Existing and prospective investors are cautioned not to place undue reliance on forward‐looking statements, which speak only as of the date hereof. We undertake no obligation to publicly update or revise any forward‐looking statements after the date they are made, whether as a result of newinformation, future events or otherwise.
Forward looking statements

Succeeding in a tough market
3
Pacific Drilling distinguished by operational excellence and cost management Operational excellence more important than ever: expect market to be very tough for at least 18 months – Clients want the rigs that deliver– PACD management focused on minimizing downtime & maximizing rig efficiency– PACD has highest average rig capability and industry‐leading UDW operating performance
Cost management is key, while maintaining longer‐term optionality & marketability– Rig opex per day reduced every quarter since beginning 2014– Recent initiatives delivering approximately $100 million annual run rate savings (~20%)– G & A reduced over 15% during 2Q2015– Maintaining ability to restart idle rigs within 90 days of contract award while significantly
reducing costs
96.995.3
91.1
97.1 95.998.4
95.2 95.5
50
55
60
65
70
75
80
85
90
95
100
2013Q3
2013Q4
2014Q1
2014Q2
2014Q3
2014Q4
2015Q1
2015Q2
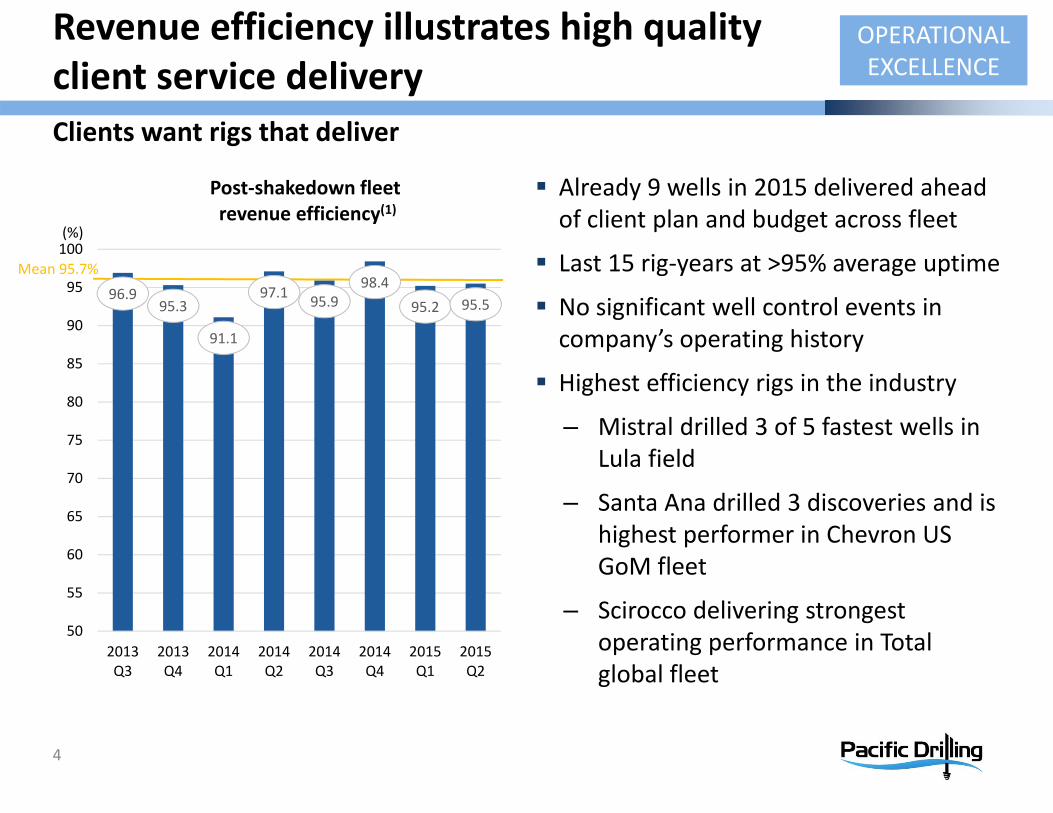
Post‐shakedown fleetrevenue efficiency(1)
(%)
Revenue efficiency illustrates high quality client service deliveryClients want rigs that deliver
Already 9 wells in 2015 delivered ahead of client plan and budget across fleet
Last 15 rig‐years at >95% average uptime
No significant well control events in company’s operating history
Highest efficiency rigs in the industry
– Mistral drilled 3 of 5 fastest wells in Lula field
– Santa Ana drilled 3 discoveries and is highest performer in Chevron US GoM fleet
– Scirocco delivering strongest operating performance in Total global fleet
OPERATIONAL EXCELLENCE
Mean 95.7%
4
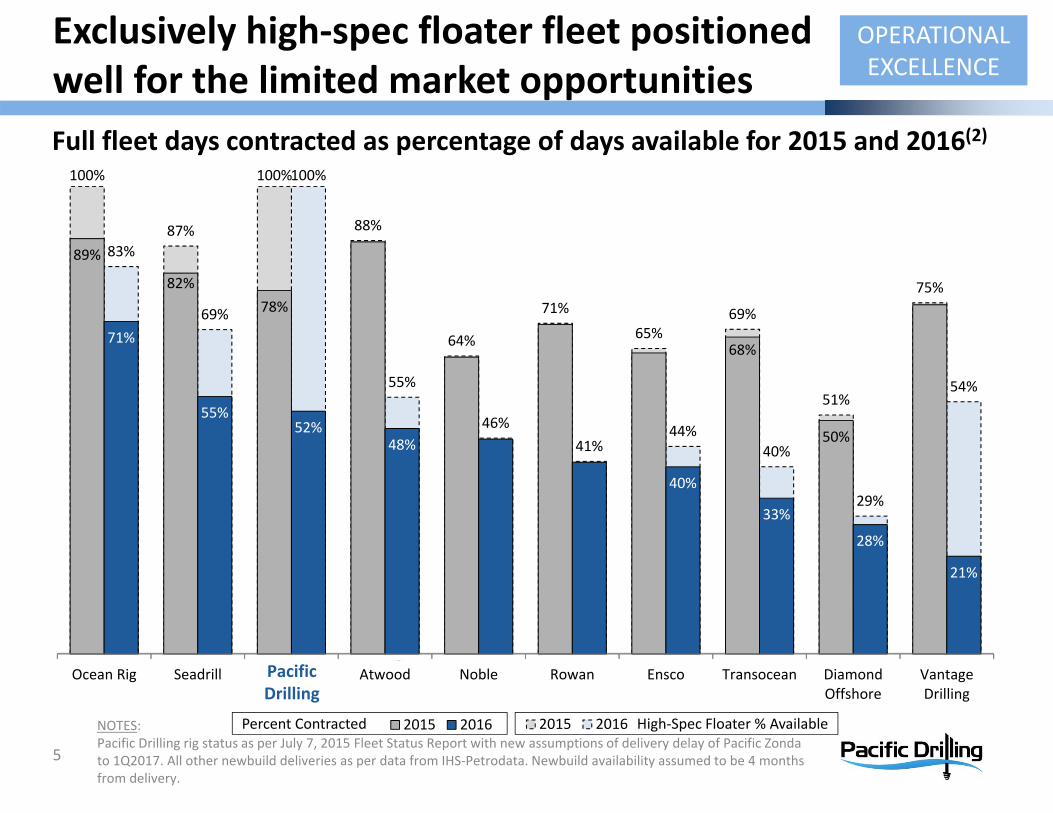
Percent Contracted High‐Spec Floater % Available
100%
87%
100%
88%
64%
71%
65%69%
51%
75%
83%
69%
100%
55%
46%41%
44%40%
29%
54%
Ocean Rig Seadrill Atwood Noble Rowan Ensco Transocean DiamondOffshore
VantageDrilling
2015 2016
Pacific Drilling
89%
82%78%
68%
50%
71%
55%52%
48%
40%
33%
28%
21%
Ocean Rig Seadrill Atwood Noble Rowan Ensco Transocean DiamondOffshore
VantageDrilling
2015 2016
Pacific Drilling
NOTES:Pacific Drilling rig status as per July 7, 2015 Fleet Status Report with new assumptions of delivery delay of Pacific Zondato 1Q2017. All other newbuild deliveries as per data from IHS‐Petrodata. Newbuild availability assumed to be 4 months from delivery.
5
Full fleet days contracted as percentage of days available for 2015 and 2016(2)
Exclusively high‐spec floater fleet positioned well for the limited market opportunities
OPERATIONAL EXCELLENCE

Solid $1.9 billion contract backlog
6
Contract status as of July 21, 2015
Chevron Nigeria, $586k/d2 year extension
Total Nigeria, $499k/d2 year extension
Chevron USGoM, $490k/d5 year contract
CVX Nigeria, $660k/d2 year contract
Chevron USGoM, $558k/d5 year contract
Construction Mobilization Firm Contract
Pacific Bora
Pacific Scirocco
Pacific Zonda
Pacific Mistral
Pacific Santa Ana
Pacific Khamsin
Pacific Sharav
Pacific Meltem
20172015
Expected Delivery to Active Fleet: First Quarter 2017
2016
Available
Available
OPERATIONAL EXCELLENCE
Existing contract provisions provide that any contract terminations are at least EBITDA neutral

$32m cost savings delivered; $75m total 2015 target; $100m annual run‐rate target
7
Labor and personnel costs
• Travel• Variable compensation elements
• Overhead headcount
• Benefits• Training
Maintenance expenses
• Engineering & major projects
• Deferral of non‐critical normal and project maintenance
Operations expenses
• Materials & supplies
• Catering• Customs• Rentals• Vessel inspections
Miscellaneous expenses
• Agent fees• Communications• Insurance• Other drilling‐related costs
COST MANAGEMENT
Sources of savings
Supported by 3rd party price reductions
Targeting on contract average rig opex reduction from $178k/day to $165k/day
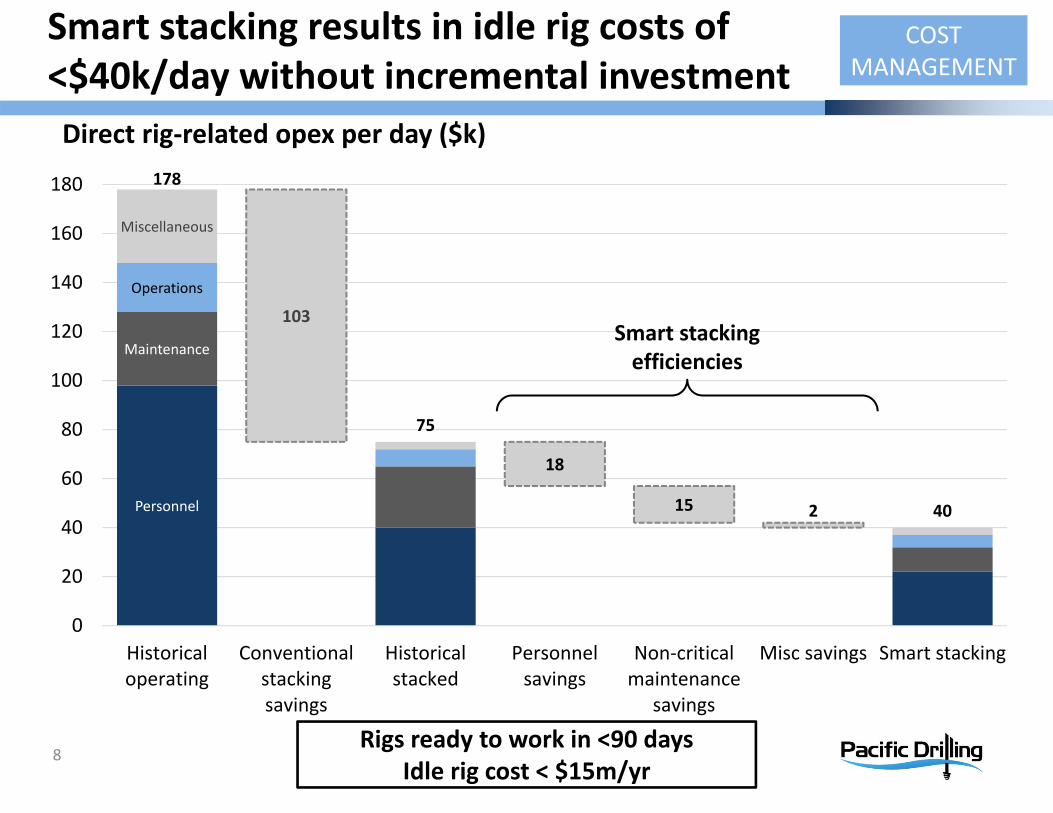
Smart stacking results in idle rig costs of <$40k/day without incremental investment
8
Direct rig‐related opex per day ($k)
215
18
103
Personnel
Maintenance
Operations
Miscellaneous
178
75
40
0
20
40
60
80
100
120
140
160
180
Historicaloperating
Conventionalstackingsavings
Historicalstacked
Personnelsavings
Non‐criticalmaintenance
savings
Misc savings Smart stacking
Rigs ready to work in <90 daysIdle rig cost < $15m/yr
Smart stacking efficiencies
COST MANAGEMENT
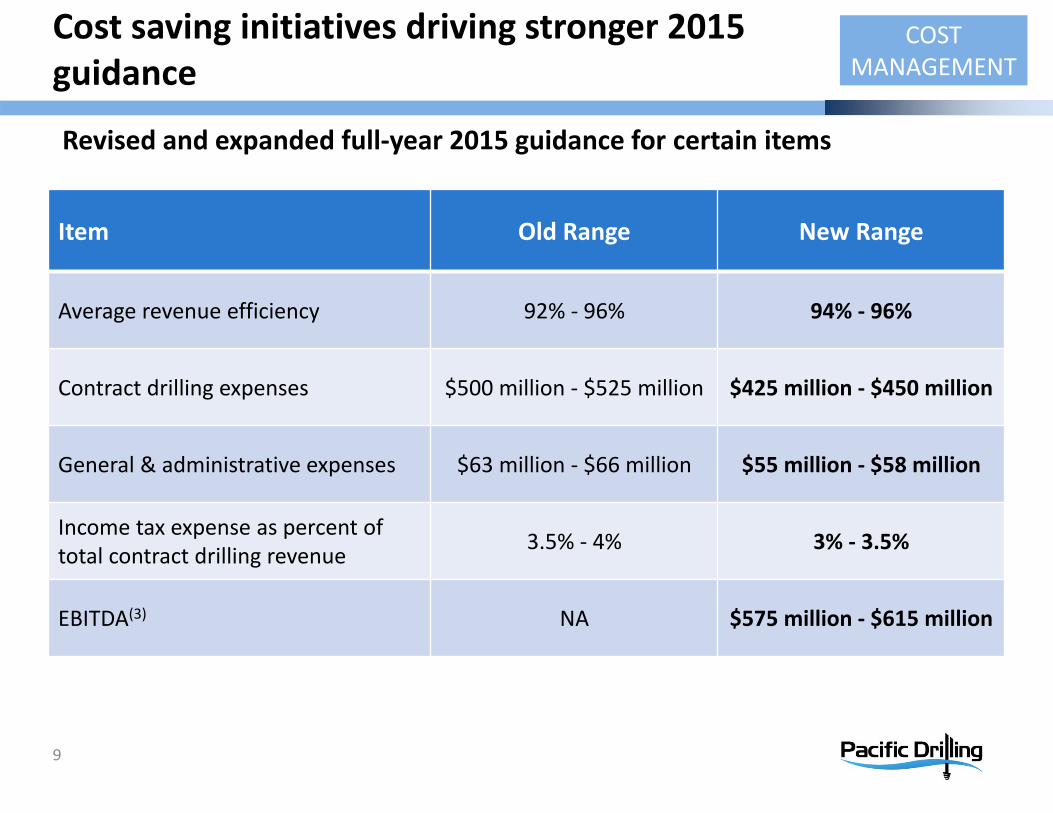
Cost saving initiatives driving stronger 2015 guidance
9
Revised and expanded full‐year 2015 guidance for certain items
Item Old Range New Range
Average revenue efficiency 92% ‐ 96% 94% ‐ 96%
Contract drilling expenses $500 million ‐ $525 million $425 million ‐ $450 million
General & administrative expenses $63 million ‐ $66 million $55 million ‐ $58 million
Income tax expense as percent of total contract drilling revenue 3.5% ‐ 4% 3% ‐ 3.5%
EBITDA(3) NA $575 million ‐ $615 million
COST MANAGEMENT

25%
30%
35%
40%
45%
50%
55%
60%
65%
3Q 2013 4Q 2013 1Q 2014 2Q 2014 3Q 2014 4Q 2014 1Q 2015 2Q 2015
10
Continuing to deliver industry‐leading EBITDA margin with only 5 rigs on contractRange of adjusted EBITDA/revenue for offshore drillers(3),(4)
PACD Peer Offshore Driller AverageNOTES:• Peer Offshore Driller Average includes PACD and publicly available information for ATW, DO, ESV, NE, ORIG, RDC, RIG, and SDRL.• EBITDA is as reported by Bloomberg (adjusted to remove impacts from impairment for DO, RIG, ESV, NE).
Current expected range
FINANCIAL STRENGTH

11
Projected positive EBITDA through 2017 even with no additional contracts
FINANCIAL STRENGTH
1086 1090
715
280
335
860
2014 2015 2016 2017
518 494370
275
115 280
2014 2015 2016 2017
563 596
345
5
220
580
2014 2015 2016 2017
EBITDA ($m)
Costs ($m)Revenue ($m)
In absence of new contracts, liquidity sufficient to meet all expected cash uses through refinancing of Khamsin at end of 2017.
Actuals Current backlog only Current expectations for additional backlog
10501140
485555
565 585

Operating cash flow and existing facilities expected to cover 2017 debt maturity
12
FINANCIAL STRENGTH
NOTES:• Capex as per Investor Toolkit dated Mar. 31, 2015.• Commitments shown as net of gross interest since interest has been deducted when calculating cash flow from operations.• Cash flow from operations projected using $300k/day for contract rollovers/extensions. Projected cashflow from operations
assumes operating fleet size of 7 rigs at end of 2016 and 8 rigs at end of 2017. Costs as per guidance on slide 9. Includes assumptions for idle time prior to or between contracts for rigs which are currently uncontracted.
As of July 21, 2015, existing facilities provide up to $700 million of undrawn capacity
Excess liquidity available to repay existing borrowings
as necessary
Existing cash
Conditional debt(5)
Currently available debt capacity
Anticipated operating cash flow through end 2017
224
401
500 500
615
550
150
105
935$1,125
$1,740
3Q15 4Q15 1Q16 2Q16 3Q16 4Q16 1Q17 2Q17 3Q17 4Q17 Totalcommitments
Sourcesthrough endof 2017Debt Amortization Capex Debt Maturity

Valuation attractive relative to peers before benefit of cost saving initiatives
13
FINANCIAL STRENGTH
NOTES:• Peer Offshore Driller Average includes ATW, DO, ESV, NE, ORIG, RDC, RIG, and SDRL
Thomson Reuters consensus as of July 20, 2015
FY2015 Multiples PACD Peer Average
Price/Earnings 4.38 5.42
Price/Cash Flow 1.38 2.47
Price/Book Value 0.32 0.51

Ongoing initiatives to further strengthen financial position
14
Delay of Pacific Zonda delivery currently under discussion with shipyard
Initiated discussions with agent banks for post‐2015 debt covenant revisions
Further cost reductions to include:‐ Rationalization of non‐critical maintenance expense and capital expense‐ Further optimization of rig stacking‐ Additional adjustments to personnel costs‐ Additional improvement of vendor terms
FINANCIAL STRENGTH

Investor contact
Pacific DrillingAmy RoddyVP Corporate Services
11700 Katy FreewaySuite 175Houston, Texas 77079USA
Phone: +1 832‐255‐0502Email: [email protected]
www.pacificdrilling.com
15
Footnotes
16
1. Revenue efficiency is defined as actual contractual dayrate revenue (excluding mobilization fees, upgrade reimbursements and other revenue sources) divided by the maximum amount of contractual dayrate revenue that could have been earned during a certain period. Post‐shakedown revenue efficiency represents levels of average revenue efficiency which are typical for ongoing operations. Revenue efficiency is typically lower during shakedown, when a newbuild rig is undergoing the initial break‐in of equipment.
2. Data from IHS‐Petrodata as of Jul. 8, 2015. Pacific Drilling rig status as per July Fleet Status Report. Assume delivery delay of Pacific Zonda to 1Q2017. Rig specification analysis & classification index by Pacific Drilling. Chart includes all floating rigs of classification index >5.5. Newbuild availability assumed to be 4 months from delivery.
3. EBITDA is a non‐GAAP measure. EBITDA is defined as earnings before interest, taxes, depreciation and amortization. The most comparable GAAP financial measure to EBITDA is net income, which includes interest, taxes, depreciation and amortization. EBITDA is included herein because it is used by management to measure the company's operations. Management believes that EBITDA presents useful information to investors regarding the company's operating performance.
4. EBITDA margin is defined as EBITDA divided by contract drilling revenue. Management uses this operational metric to track company results and believes that this measure provides additional information that consolidates the impact of our operating efficiency as well as the operating and support costs incurred in achieving the revenue performance.
5. Under the existing terms of our 2014 Revolving Credit Facility, we currently will have access to $150.0 million, provided that Pacific Zonda is delivered prior to October 31, 2015 and a satisfactory drilling contract is signed.