company update | metals | india research nvs wealth...
TRANSCRIPT
NVS Wealth Managers
Nifty 9,521
Sensex 30,922
Nifty PE 24.23
Sensex PE 22.64
Sector Metals
BSE Code 532286
NSE Code JINDALSTEL
FV 1
Market Cap (Rs. Cr) 11,264
Market Cap (US$ mn) 1,746
Equity Share Cap. 91.5
2r
Stock Data
Stock Performance (%)
52-week high/low Rs. 135.30/62.55
6M 12M
Absolute (%) 78.15 81.70
Shareholding Pattern (%)
Sensex and stock movement
1st July, 2017
CMP: 123 BUY
Company Update | Metals | India Research
Jindal Steel and Power Ltd.
Jindal Steel and Power Ltd. (JSPL), a member of O.P. Jindal group since 1952, is currently headed by
Mr. Naveen Jindal, Chairman and has a dominant presence in steel, power, mining and
infrastructure sectors. JSPL currently is one of the largest producer of steel in India with a total
installed capacity of 6.75 MT, state of the art power plant with an aggregate capacity of 5,049 MW,
with a topline of Rs. 22,696 Crs. for the year ended 31st March, 2017.
The company has embarked upon its journey to expand the steel capacity by 4 MT (total plant
capacity post expansion of 6 MT) by ramping up its Angul facility in the state of Odisha taking the total
installed capacity to 10.75 MT, making JSPL the fourth largest steel producer of India (Indian
operations having a capacity of around 8.75 MT) and one of the top 35 steel producer across the globe.
In line with the recent ramping up of the Angul facility, JSPL Chairman Mr. Naveen Jindal pointed to
the exciting days for JSPL and the company is on the cusp of turnaround, during his recent interview,
where he remarked “I hope from October, we will be breaking even from the Angul plant. From July,
we hope that we will be doing much better and we will be producing 0.2 million tonne of steel every
month. The blast furnace has started to produce and everything is going on well. This year, we hope to
produce six million tonne of steel in India and more than 1.5 million tonne in Oman, so we will be
producing more than 7.5 million tonne”.
Mr. Naveen Jindal further commented, “commissioning of the four million tonne per annum (MTPA)
steel capacity at the company‟s Angul facility in Odisha today would contribute a lot in the financial
turnaround of the company.”
From Q3FY17 the performance of the company is on the strong road to recovery and with JSPL
recently declaring its Q4FY17 results where the consolidated EBITDA/Tonne increased to around
Rs. 7,500 (Rs. 6,000-Q4FY16) and the net loss narrowed to Rs. 100 Crs. in Q4FY17 (net loss Rs. 636
Crs.-Q4FY16) helped by better performance of its steel business. JSPL plans to increase its steel
production by 50% to 7.5 MT in current fiscal year as compared to 4.8 MT in FY17 and is working
to generate an EBITDA of Rs. 10,000 Crs. which will aid in faster contribution to interest payouts.
JSPL with consolidated debt of around Rs. 40,000 Crs, is in the final stage of completing the
expansion which will lead to improved utilization, cost savings, incremental operating profits and
the company expects to be relatively debt free in next four to five years thereby ushering exciting
times for the company’s stakeholders just like the good old days.
As a part of monetisation plans, JSPL has approved the divestment of 1,000 MW unit at Tamnar to
JSW Energy at an Enterprise Value of Rs. 6,500 Crs., which is subject to regulatory approvals and
certain conditions including achievement of PPA’s before the closing date as on 30th
June, 2018. The
entire proceeds from the sale would be used to reduce the existing debt of the company thus giving a
boost to the cash flows.
JSPL had posted its lifetime best performance in FY2012 with top line of Rs. 18,209 Crs., PBT of
Rs. 5,189 Crs. and PAT of over Rs. 3,960 Crs. on an equity of Rs. 93.48 Crs. with market price
touching over Rs. 724 per share in April 2011 (FY2012) having a market capitalization of Rs. 67,680
Crs. However in FY2010 the market price touched an all time high of Rs. 796 per share in August
2010 having a whopping market capitalization of little over Rs. 74,120 Crs. (US $ 11.49 Billion) thus
creating huge wealth for its stakeholders.
Post FY2014 JSPL experienced adverse impact due to cancellation of coal block and volatility in Raw
Material prices and share price touched a low of Rs. 48 per share in February 2016, having a market
capitalization of Rs. 4,392 Crs. Currently the stock is trading in the range of Rs.123 with a market
capitalization of around Rs. 11,264 Crs. (US $ 1.75 Billion).
JSPL is available at a very attractive price, considering that the company’s 70% of the product
profile consists of long products which are primarily used in construction and infrastructure
activities should auger well for JSPL. Also the steel industry appears to be promising with the recent
initiatives taken by the Government of India such as the „MIP, Anti Dumping Duty, Smart Cities,
Enhanced Investment in Infrastructure, Housing for All, Power for All‟ and such other initiatives.
We do believe that JSPL is on the threshold of a turnaround and we recommend
a strong accumulation with a view of 3-4 years.
(Conversion Rate of 64.5 per US $)
NVS Wealth Managers
JSPL combines expertise with
experience to deliver state-of-the-art
products spanning across steel,
power, mining and infrastructure
sectors.
JSPL steel making capacity post
expansion at Angul facility will reach
10.75 MT from a current capacity of
6.75 MT
JSPL has a strong product mix that
includes flat products from 5mm to
150mm, long products such as rail,
parallel flange beams, channels,
angles, wire rods and Jindal‟s
PANTHER TMT rebars along with
value added innovative products
like pre fabricated structures,
speed floors and welded wire mesh
I. JSPL- THE COMPANY PROFILE AND PRODUCT
PORTFOLIO
Jindal Steel and Power Ltd. (JSPL), is a member of O.P. Jindal group
since 1952, is currently headed by Mr. Naveen Jindal, Chairman and has
a dominant presence in steel, power, mining and infrastructure sectors
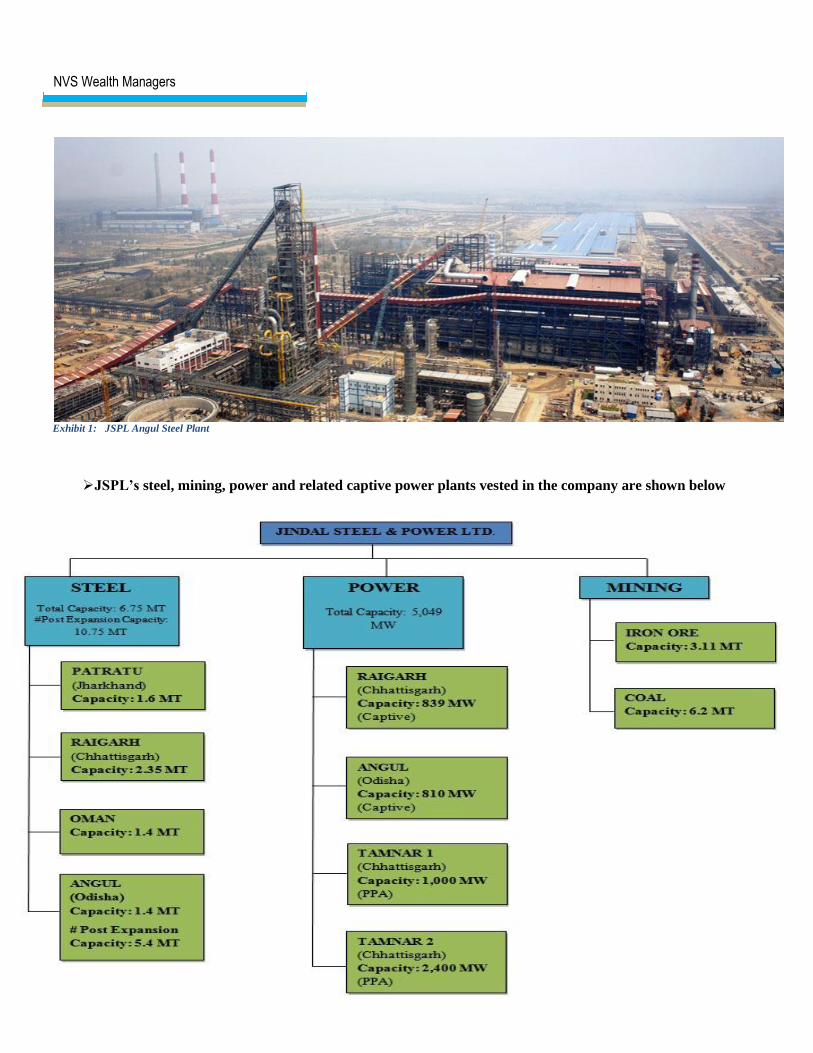
JSPL operates and owns four steel plants at Raigarh, Angul, Patratu
and Oman, along with Pellet manufacturing plant at Barbil and Power
plants at Tamnar along with Mining facilities in Australia,
Mozambique and South Africa. The steel making capacity of JSPL post
expansion at Angul facility will reach 10.75 MT from a current capacity
of 6.75 MT.
JSPL’s state of the art integrated steel plants manufacture a range of
innovative products for diverse industries. JSPL has a strong product mix
that includes flat products to a whole range of long products such as long
rails, parallel flange beams, channels, angles and some of the value
added products like pre fabricated structures, speed floor among others
having application across sectors like Defence, Railways, Construction,
Fabrication, Agricultural Equipments, Auto, Power and host of other
infrastructure sectors.
JSPL achieved the highest ever yearly steel production of over 4.8 MT
in FY2017 as compared to 4.6 MT in FY2016. Even the Pellets
recorded the highest yearly production at 7.5 MT (83% capacity
utilization). JSPL plans increase production of steel by 50% to 7.5MT
and export over 1 MT of steel and 2 MT of Pellets in FY2018.
JSPL’s Angul plant is in the final stage of completion and the plant
should commence with the production from June-July, 2017. Angul Steel
Plant would include a state of the art coke oven, Sinter Plant, coal
gasification plant, DRI plant and so on. Commencement of this mill
would provide JSPL with a capability of producing widest plate of 5 mtrs.
in width that can find application in ships, tanks and defence tankers,
special grade billets, rebar and so on.
Jindal Power Ltd. (JPL) a subsidiary of JSPL is a leading private power
company in India across the energy spectrum. JSPL became the first
private player in the country to set up an Independent Power Plant (IPP).
Buoyed by the success of its 1000 MW plant at Tamnar, JPL has
further expanded its presence in Tamnar with a 2,400 MW Thermal
Power Plant. As on date the total consolidated power production
capacity of company stands close to 5,049 MW (including captive
power plants and PPA plants).
JSPL may wade into ammonia and urea production as they can use
the spare gas from their coal gasification plant at Angul. JSPL has
around 75,000-90,000 of m3
of spare gas which can be used for setting
up of ammonia and urea facility. An investment to the tune of Rs.
1,000 Crs. would be required to set up a 0.4 MT capacity ammonia
plant.
NVS Wealth Managers
Exhibit 1: JSPL Angul Steel Plant
JSPL’s steel, mining, power and related captive power plants vested in the company are shown below

NVS Wealth Managers
II. JSPL- STEADY CUSTOMER BASE OF MARQUEE CORPORATES
III. JSPL- THE MANAGEMENT VISION AND EXUDING CONFIDENCE
We are reproducing below some of the excerpts from the annual report, chairman letter, interview of the
chairman Mr. Naveen Jindal and CEO Mr. Ravi Uppal which exudes huge confidence about future of
JSPL.
“We are on the strong road to recovery, and in FY18 we should be able to come with a net positive
number for PAT (Profit After Tax)” was quoted by Mr. Ravi Uppal in his telephonic interview with
Mint.
JSPL chairman Mr. Naveen Jindal is "relieved beyond words" after going through the "worst possible
time" in business in the last 2-3 years. With the commissioning of India's largest blast furnace ,Mr. Jindal said
“The blast furnace and its commissioning is a huge moment for us. We were supposed to get it done last
year. We worked under tremendous fund constraints. I am relieved we could complete the project. It is
India's biggest blast furnace and can produce 12,000 tonnes of hot metal per day or 4.2 million tonnes per
year. With the sinter plant and coke ovens running, we are now a fully integrated steel plant.”
He further elaborated on the JSPL debt position “By debt-free, I mean to be relatively debt-free. If debt is 3-
4 times our EBIDTA level, we are better off. We hope to achieve it from our higher earnings in the next
few years. JSPL is working to generate an EBIDTA of Rs 10,000 crore.”
JSPL chairman Mr. Naveen Jindal in a press release during the Dedication Ceremony of its Angul Facility
quoted, “JSPL has always aspired to enhance its participation in the socio-economic development of the
Nation. The completion of all major core iron & steelmaking installations at the 6 MTPA Steel Plant at

NVS Wealth Managers
Angul is a major landmark defining the future growth trajectory of JSPL”, he further quoted “The
completion of Odisha’s largest steel plant demonstrates JSPL’s impeccable project execution capabilities;
fuelled by passion, commitment and dedication of 25,000 Jindalites, with support of over 1 lakh families
anchored by the JSPL ecosystem. We will aspire to grow exponentially in line with the National steel
production capacity target of 300 MTPA by 2030. We continue to dream bigger and continuously work
towards building a nation of our dreams"
JSPL chairman Mr. Naveen Jindal interview where he remarked “I hope from October, we will be
breaking even from the Angul plant. From July, we hope that we will be doing much better and we will
be producing 0.2 million tonne of steel every month. The blast furnace has started to produce and
everything is going on well. This year, we hope to produce six million tonne of steel in India and more
than 1.5 million tonne in Oman, so we will be producing more than 7.5 million tonne”
“At JSPL, we have always been focused on the India- first strategy; and our overarching objective is to
take Indian enterprise and enterprenuership to the global centre stage. We are aware that there are
short-term challenges in our journey; but we are steadily building our overall resilience against
headwinds to grow sustainably in a world marked by volatility, complexity and uncertainity. As a part of
that strategy, we implemented multiple initiatives during the year.We re-organised and re-engineered
our business to optimize cost, enhance capital efficiency and productivity of our workforce. We also
strengthened our consolidated steel production and sales significantly; achieved breakthrough orders and
deliveries; focused on new product development; and also accomplished important milestones in our
power business. It is indeed heart warming to note that despite challenges, JSPL is today among the
frontrunners in the global steel domain”
All these indications point that the company is on the cusp of turnaround
and holds an exciting future for JSPL.
IV. GLOBAL STEEL SCENARIO
In April, 2017 “The World Steel Association” (WSA) released its Short Range Outlook (SRO) for 2017
and 2018. The global steel demand decreased by 0.8% to 1,488 MT in CY2016, following a contraction of
3.0% in CY2015, WSA forecasts that global steel demand will increase by 1.3% to 1,535 MT in CY2017.
In CY2018, it is forecast that global steel demand will grow by 0.9% and will reach 1,549 MT. India is the
third largest producer of steel in the world next to China and Japan, which registered a growth of 7.4%
to 96 MT in CY2016. China continues to dominate the global crude steel production accounting for almost
50% of total production.
FY2018 is believed to see a cyclical upturn in the steel demand with a continuing recovery in the
developed economies and an accelerating growth momentum in the emerging and developing economies
like India, Mexico and South East Asia, while several emerging markets are showing sings of deceleration
growth.
China, the world's largest producer and consumer of steel has cut production of about 150 MT of steel by
FY2020 which comprises around 9% of its total production capacity. China historically produced more, as
they were supported by their local banks, but due to recent economic and environmental scenarios, the assets
are under stress and the plants have become inefficient.
The per capita steel consumption in India is currently pegged at 63 Kgs in CY2016 against 61 Kgs in CY2015
(Growth of 3%) as compared to 493 Kgs in China, 492 Kgs in Japan, 1130 Kgs in South Korea and to
world average level of 208 Kgs per annum. Steel is the foundation of the last 100 years of progress and
will be equally fundamental to meeting the challenges of the next 100 years.
NVS Wealth Managers
V. JSPL AND INDIAN STEEL SCENARIO
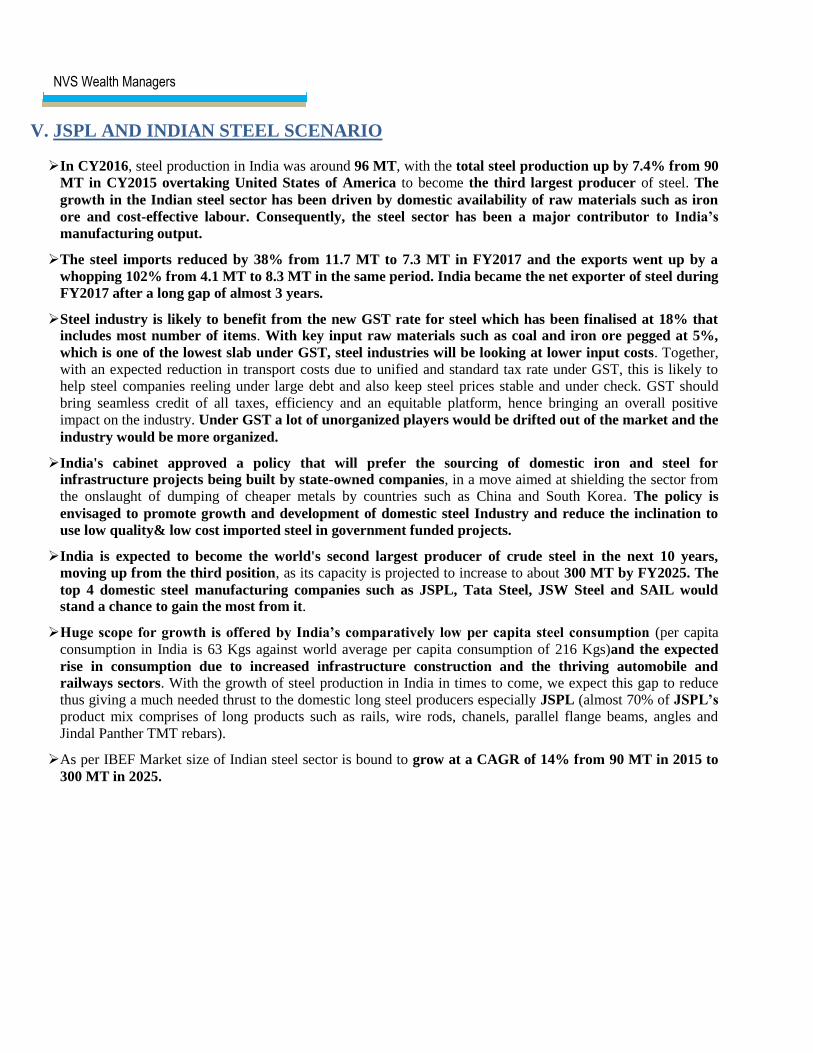
In CY2016, steel production in India was around 96 MT, with the total steel production up by 7.4% from 90
MT in CY2015 overtaking United States of America to become the third largest producer of steel. The
growth in the Indian steel sector has been driven by domestic availability of raw materials such as iron
ore and cost-effective labour. Consequently, the steel sector has been a major contributor to India’s
manufacturing output.
The steel imports reduced by 38% from 11.7 MT to 7.3 MT in FY2017 and the exports went up by a
whopping 102% from 4.1 MT to 8.3 MT in the same period. India became the net exporter of steel during
FY2017 after a long gap of almost 3 years.
Steel industry is likely to benefit from the new GST rate for steel which has been finalised at 18% that
includes most number of items. With key input raw materials such as coal and iron ore pegged at 5%,
which is one of the lowest slab under GST, steel industries will be looking at lower input costs. Together,
with an expected reduction in transport costs due to unified and standard tax rate under GST, this is likely to
help steel companies reeling under large debt and also keep steel prices stable and under check. GST should
bring seamless credit of all taxes, efficiency and an equitable platform, hence bringing an overall positive
impact on the industry. Under GST a lot of unorganized players would be drifted out of the market and the
industry would be more organized.
India's cabinet approved a policy that will prefer the sourcing of domestic iron and steel for
infrastructure projects being built by state-owned companies, in a move aimed at shielding the sector from
the onslaught of dumping of cheaper metals by countries such as China and South Korea. The policy is
envisaged to promote growth and development of domestic steel Industry and reduce the inclination to
use low quality& low cost imported steel in government funded projects.
India is expected to become the world's second largest producer of crude steel in the next 10 years,
moving up from the third position, as its capacity is projected to increase to about 300 MT by FY2025. The
top 4 domestic steel manufacturing companies such as JSPL, Tata Steel, JSW Steel and SAIL would
stand a chance to gain the most from it.
Huge scope for growth is offered by India’s comparatively low per capita steel consumption (per capita
consumption in India is 63 Kgs against world average per capita consumption of 216 Kgs)and the expected
rise in consumption due to increased infrastructure construction and the thriving automobile and
railways sectors. With the growth of steel production in India in times to come, we expect this gap to reduce
thus giving a much needed thrust to the domestic long steel producers especially JSPL (almost 70% of JSPL’s
product mix comprises of long products such as rails, wire rods, chanels, parallel flange beams, angles and
Jindal Panther TMT rebars).
As per IBEF Market size of Indian steel sector is bound to grow at a CAGR of 14% from 90 MT in 2015 to
300 MT in 2025.
NVS Wealth Managers
VI. JINDAL POWER LTD (JSPL’s Subsidiary) AND INDIAN POWER SCENARIO
Jindal Power Ltd. (JPL), a wholly owned subsidiary of JSPL is India’s first private sector entity to have set
up a mega power plant (1,000 MW capacity) at Tamnar, Chhattisgarh. It was this plant which paved the
way to inspire almost 50,000 MW power generation plant in private sector. Buoyed by the success of 1,000
MW plant, JPL further expanded its presence in Tamnar with a 2,400 MW thermal plant, thus becoming the
largest power station complex in the state of Chhattisgarh with a facility of 3,400 MW at a single location.
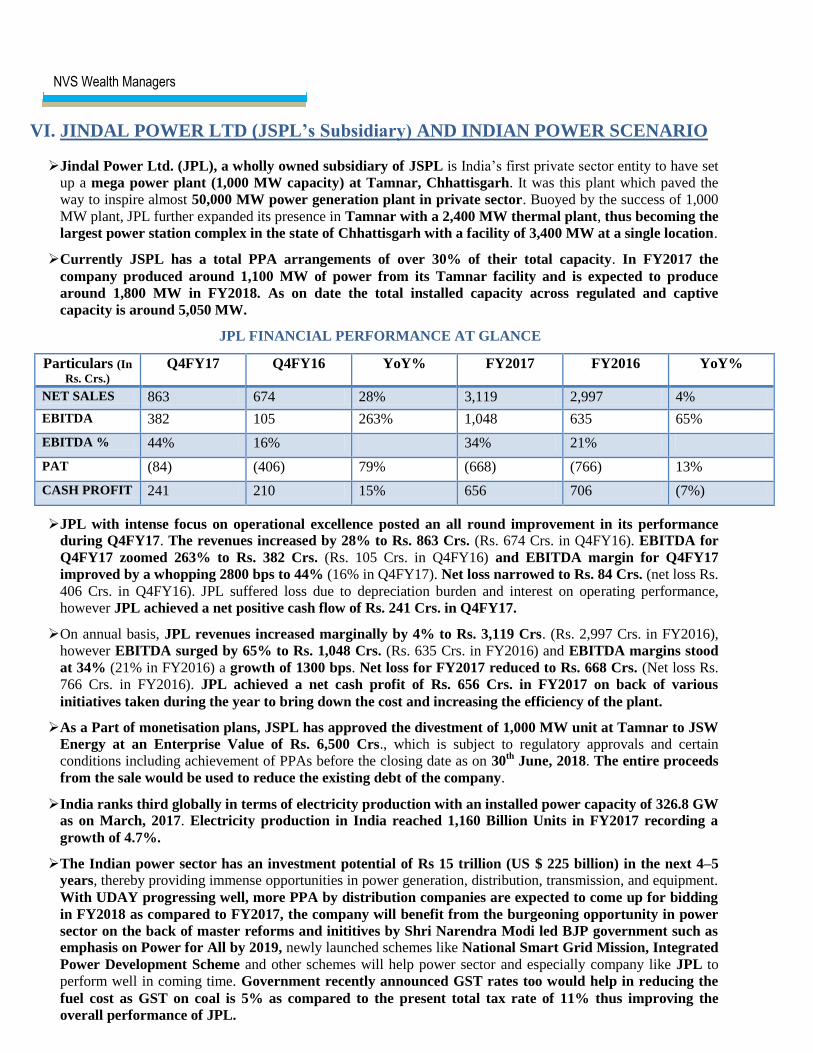
Currently JSPL has a total PPA arrangements of over 30% of their total capacity. In FY2017 the
company produced around 1,100 MW of power from its Tamnar facility and is expected to produce
around 1,800 MW in FY2018. As on date the total installed capacity across regulated and captive
capacity is around 5,050 MW.
JPL FINANCIAL PERFORMANCE AT GLANCE
Particulars (In
Rs. Crs.) Q4FY17 Q4FY16 YoY% FY2017 FY2016 YoY%
NET SALES 863 674 28% 3,119 2,997 4%
EBITDA 382 105 263% 1,048 635 65%
EBITDA % 44% 16% 34% 21%
PAT (84) (406) 79% (668) (766) 13%
CASH PROFIT 241 210 15% 656 706 (7%)
JPL with intense focus on operational excellence posted an all round improvement in its performance
during Q4FY17. The revenues increased by 28% to Rs. 863 Crs. (Rs. 674 Crs. in Q4FY16). EBITDA for
Q4FY17 zoomed 263% to Rs. 382 Crs. (Rs. 105 Crs. in Q4FY16) and EBITDA margin for Q4FY17
improved by a whopping 2800 bps to 44% (16% in Q4FY17). Net loss narrowed to Rs. 84 Crs. (net loss Rs.
406 Crs. in Q4FY16). JPL suffered loss due to depreciation burden and interest on operating performance,
however JPL achieved a net positive cash flow of Rs. 241 Crs. in Q4FY17.
On annual basis, JPL revenues increased marginally by 4% to Rs. 3,119 Crs. (Rs. 2,997 Crs. in FY2016),
however EBITDA surged by 65% to Rs. 1,048 Crs. (Rs. 635 Crs. in FY2016) and EBITDA margins stood
at 34% (21% in FY2016) a growth of 1300 bps. Net loss for FY2017 reduced to Rs. 668 Crs. (Net loss Rs.
766 Crs. in FY2016). JPL achieved a net cash profit of Rs. 656 Crs. in FY2017 on back of various
initiatives taken during the year to bring down the cost and increasing the efficiency of the plant.
As a Part of monetisation plans, JSPL has approved the divestment of 1,000 MW unit at Tamnar to JSW
Energy at an Enterprise Value of Rs. 6,500 Crs., which is subject to regulatory approvals and certain
conditions including achievement of PPAs before the closing date as on 30th
June, 2018. The entire proceeds
from the sale would be used to reduce the existing debt of the company.
India ranks third globally in terms of electricity production with an installed power capacity of 326.8 GW
as on March, 2017. Electricity production in India reached 1,160 Billion Units in FY2017 recording a
growth of 4.7%.
The Indian power sector has an investment potential of Rs 15 trillion (US $ 225 billion) in the next 4–5
years, thereby providing immense opportunities in power generation, distribution, transmission, and equipment.
With UDAY progressing well, more PPA by distribution companies are expected to come up for bidding
in FY2018 as compared to FY2017, the company will benefit from the burgeoning opportunity in power
sector on the back of master reforms and inititives by Shri Narendra Modi led BJP government such as
emphasis on Power for All by 2019, newly launched schemes like National Smart Grid Mission, Integrated
Power Development Scheme and other schemes will help power sector and especially company like JPL to
perform well in coming time. Government recently announced GST rates too would help in reducing the
fuel cost as GST on coal is 5% as compared to the present total tax rate of 11% thus improving the
overall performance of JPL.
NVS Wealth Managers
Initiatives by GOI such as
Make in India, Power for All
by 2019, Housing for All and
so on are likely to drive the
demand for steel and power in
India significantly.
JSPL has a dominant presence in
long products such as rails and
with FDI and higher Government
budget in rail infrastructure and
set up of high speed trains like
Tejas Express is likely to boost
JSPL sales.
JSPL manufactures India‟s
widest steel plates of upto 5 mtrs.
in width that finds applications in
manufacturing of ships, tanks,
aircrafts and so on. This is likely
to drive the steel demand for the
company.
With housing demand on rise and
GOI initiatives such as PMAYG
and Housing for All, JSPL one of
the largest steel manufacturer of
India stands a chance to gain
from it.
With Indian auto industry
witnessing a rebound in demand
and growing at a CAGR of 9.4%,
such a scenario augurs well with
JSPL and the demand for steel
will grow in coming years.
VII. JSPL- DEMAND DRIVERS
The rate of urbanization and urban renewal is expected to rise significantly
in the near future thus fostering growth of the steel and power industry in
the country. India is presently only about 31% urban and with higher
migration, newer centres of development and Government of India
initiatives such as Make in India, Power for All by 2019 and Housing
for All (as per union budget 2017-18, 1 Cr. affordable houses for All by
2019), etc. are likely to drive the demand for steel and power in the Country
significantly. There is a corresponding increase in demand for housing,
transportation, consumer goods and public infrastructure, all of which are
likely to drive steel and power demand in the Country significantly.
The Government of india is aiming to target higher investments by
prioritizing the decongestion of heavy haul routes and speeding up
trains. The railway ministry has earmarked an investment of US $
133.5 billion towards the development of railways sector over next few
years ending FY2019. The Government of India has moved quickly to
enable Foreign Direct Investment (FDI) in railways to improve
infrastructure for freight and high-speed trains with a total FDI inflows
of US $ 789 million between FY2000 to FY2016. Initiatives taken by
Government of India and one of the longest single piece rail manufacturer in
India would help JSPL to boost its sale.
The Government of India is encouraging self-reliance in the defence
sector; and is also encouraging Indian private sector players to
manufacture defence equipment. The country currently imports
significant quantity of steel annually to meet its defence requirements. With
JSPL manufacturing India’s widest plate mill of upto 5mtrs. in width,
is used in manufacturing of tanks, ships, aircrafts and so on. This is
likely to drive the steel demand for the company.
Construction activities contribute over 10% of India’s GDP. The Indian
real estate market is expected to touch US $ 180 billion by 2020. With a
clear focus on affordable housing and homebuyers the Union Budget 2017-
18 assigned infrastructure status to affordable housing projects to
facilitate higher investments, in line with the government’s aim to provide
housing for all. The allocation under the Pradhan Mantri Aawas Yojana-
Gramin (PMAYG) was also increased to Rs. 23,000 Crs. from last
year’s Rs. 15,000 Crs. All these steps taken by the Government of India
would give a boost to the overall steel demand in the country and JSPL one
of the leaders in steel industry in India will stand a chance to gain from it.
Demographic trends further support the case for increasing steel
demand in India. Each year approximately 12 million people join the
workforce in India. There is a corresponding increase in demand for
housing, transportation, consumer goods and public infrastructure, all
of which are major drivers for steel demand.
Union Budget 2017-18 has allocated a sum of Rs. 3,96,135 Crs. for
infrastructure like roads, railways, ports, airports etc. This will aid the
demand for steel going forward and JSPL being one of the largest steel
producer is ought to be the beneficiary in coming years.
The big steel producers tend to be a big automobile producing countries. As
is well known, India is becoming auto hub in the world where many
NVS Wealth Managers
As the per capita steel
consumption in the country
increases from the current 63
Kgs to the world average level
of 216 Kgs, there is no looking
back for the India Steel
Industry.
As the per capita power
consumption in India
increases from the current
level of 768 Kwh per year to
1,932 Kwh per year in Mexico,
2,516 Kwh in Brazil and 4,310
Kwh in China, there is a
humongous scope for the
India Power Sector in years to
come.
global auto companies have set up/ will be setting up plants such as
VW, Suzuki, Toyota, Honda, etc. With India automobile industry
witnessing a rebound in demand and growing at the rate of 9.4% CAGR,
such a scenario augurs well for the domestic steel sector and the demand for
steel is going to increase in coming years. India is expected to reach world
average per capita consumption of steel in coming 10 years and this
should hugely benefit JSPL in years to come.
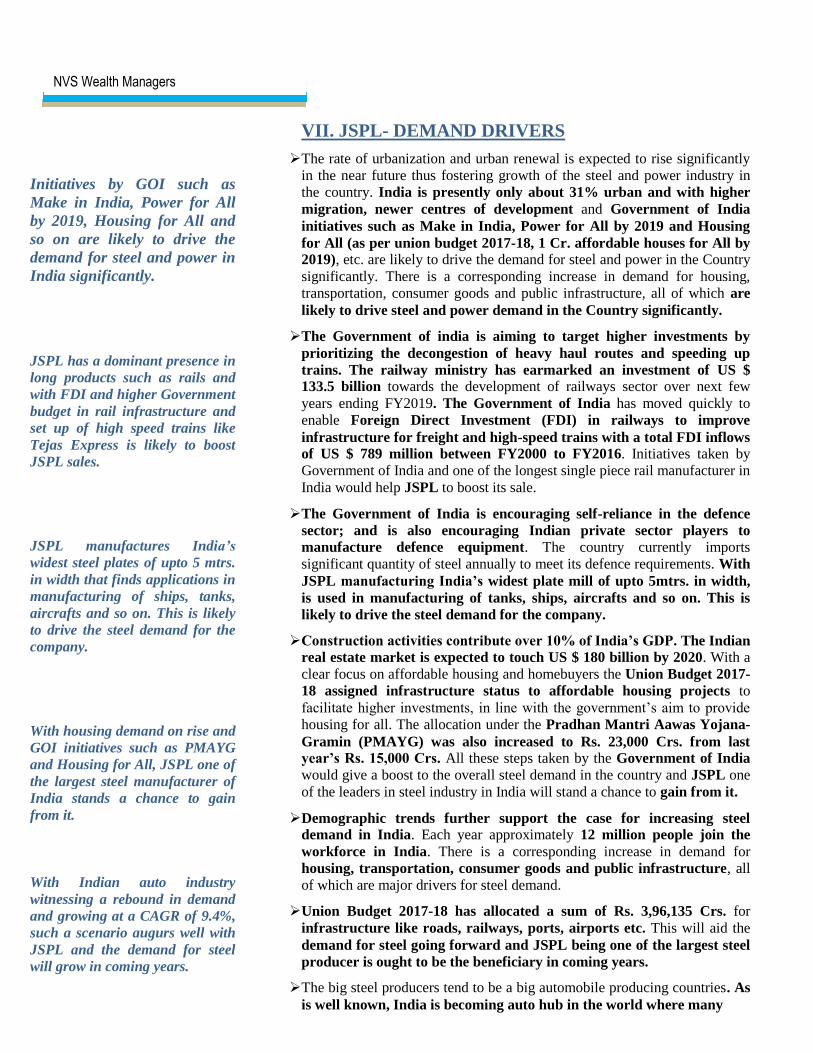
As the per capita steel consumption in the country increases from the
current 63 Kgs even to the world average level of 216 Kgs, there is no
looking back for the Indian Steel Industry.
With 300 million people with absolute no access to electricity and 819
million people still relying on domestic/ traditional fuels for cooking
and general heating purpose, Government of India has launched a
scheme called Power for All by 2019, which will ensure continuous and
uninterrupted electricity supply to all households, industries and commercial
establishments by creating and improving necessary infrastructure. Such
initiatives taken by the Government of India gives a boost to Private
Sector players such as JPL (Wholly Owned Subsidiary of JPSL) to
enter in a PPA contract with State Electricity Boards. Considering the
thrust given by GOI in power sector and with more power plants to be
commissioned in years to come, would drive the demand for steel to set
up such facilities.
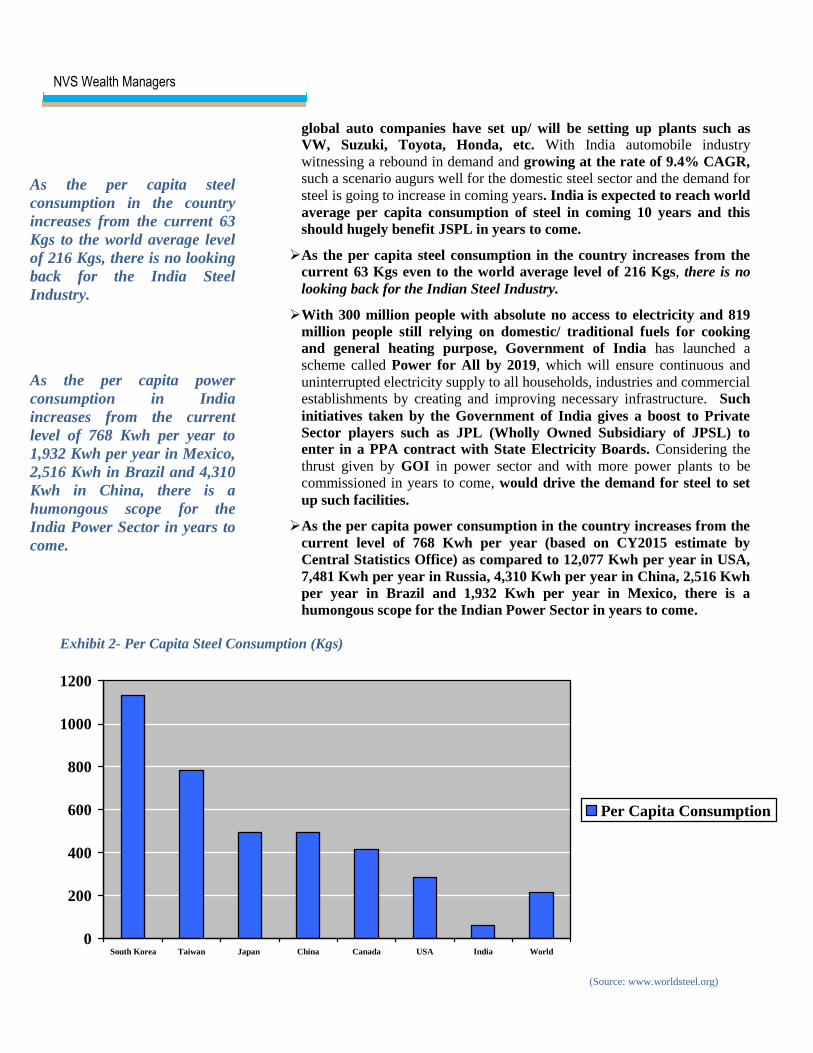
As the per capita power consumption in the country increases from the
current level of 768 Kwh per year (based on CY2015 estimate by
Central Statistics Office) as compared to 12,077 Kwh per year in USA,
7,481 Kwh per year in Russia, 4,310 Kwh per year in China, 2,516 Kwh
per year in Brazil and 1,932 Kwh per year in Mexico, there is a
humongous scope for the Indian Power Sector in years to come.
Exhibit 2- Per Capita Steel Consumption (Kgs)
0
200
400
600
800
1000
1200
South Korea Taiwan Japan China Canada USA India World
Per Capita Consumption
(Source: www.worldsteel.org)
NVS Wealth Managers
Exhibit 3- Kwh Consumption Per Person Per year
0
2000
4000
6000
8000
10000
12000
14000
USA Australia China SA Brazil Mexico India
Kwh Consumption
(Source: www.wikipedia.com)
VIII. JSPL – THE RAW MATERIAL LINKAGES
The two most important raw material to produce a saleable steel are Iron Ore and Coking coal. JSPL has iron
ore linkage to a certain extent and at present around 30% of its iron ore requirement is supported by
their integrated mines (JSPL requires around 1.6 MT of iron ore to manufacture every tonne of steel),
with rest being procured from open market. As per the latest developments around 250 licenses of the mines
are about to expire in next three years. As a result of which the market is flooded with excess supply of
iron ore and the same is available at a lower cost.
JSPL requires around 0.6 MT of coal to manufacture every 1 MT of steel. JSPL has coal linkages of
around 1.75 MT across its mining facilities at Mozambique and Australia and is completely hedged upto
1.75 MT and the rest is procured from Coal India.
As per the latest developments JSPL has secured additional coal linkage of over 0.5 MT for their captive
power plant. The coal linkages, secured for a 5-year duration, will provide steady supply of fuel to Captive
Power plants run by the company for its steel making operations. The coal linkages will ensure a steady
supply of thermal coal required to feed the Captive Power Plants at calorific costs significantly beneficial than
coal procured through e-auctions.

NVS Wealth Managers
IX. JSPL- ROAD MAP TO SUCCESS
JSPL’s Angul plant is in the final stage of completion and the plant should commence with the production
from July, 2017. The facility would include a state of the art coke oven, Sinter Plant, coal gasification plant,
DRI plant and so on. Angul facility, Odisha would take the total installed capacity to 10.75 MT, making
JSPL the fourth largest steel producer of India (Indian operations having a capacity of around 8.75 MT) and
one of the top 35 steel producer across the globe.
As a part of monetisation plans, JSPL has approved the divestment of 1,000 MW unit at Tamnar to JSW
Energy at an Enterprise Value of Rs. 6,500 Crs., which is subject to regulatory approvals and certain
conditions including achievement of PPA’s before the closing date as on 30th
June, 2018. The entire proceeds
from the sale would be used to reduce the existing debt of the company thus giving a boost to the cash
flows.
Realisations have also increased from Rs.35,000 per tonne for Steel Plate in April 2016 to Rs.41,500 per
tonne in April-May, 2017 and from Rs.35,000 per tonne in April 2016 to Rs.39,500 per tonne for HRC.
JSPL has almost 100% Margins in their rails (Manufactured at a cost of Rs. 28,000 per tonne and sold at
around Rs. 46,000 per tonne) and high speed rails manufacturing (Manufactured at a cost of Rs. 30,000 per
tonne and sold at around Rs. 60,000 per tonne) it is therefore obvious that realisations have substantialy
improved and same should get positively refelected gradually in the performance of company going forward.
Recently JSPL also approved allotment of 4,80,00,000 convertible warrants (price of Rs.119-125) which
exudes the management confidence towards the future growth and progess of the company.
X. JSPL- DELEVERAGING OF (CONSOLIDATED) BALANCE SHEET (as on 31
st March, 2017)
LIABILITIES ASSETS
Particulars Amount (Rs. Crs.) Particulars Amount (Rs. Crs.)
Long Term Borrowings 32,598 Fixed Assets 62,190
Short Term Borrowings 7,360 Investment Property 32
Financial Assets 1,876
Total 39,958 Total 64,098
As on 31st March, 2017 the total debt (Long term + short term) stands at Rs. 39,958 Crs. and the
monetisable assets (excluding intangible assets and loans & advances) stands at Rs. 64,098. Out of the
total debt outstanding around Rs. 10,500 Crs. is dedicated to the power business (Captive + PPA) and the
rest belongs to all the other verticals. Out of the total debt around Rs. 7,360 Crs. is working capital which
is required for the daily operations of the business and we expect the same not go narrow down any
further in near future.
However the company has undergone a planned reallocation of capital to deleverage its balance sheet. To
achieve the said vision JSPL has approved the divestment of 1,000 MW unit at Tamnar to JSW Energy at
an Enterprise Value of Rs. 6,500 Crs.(Rs. 6.5 Crs. per MW). This should reduce the long term debt to a
little under 27,000 Crs. We believe, going forward should the company divest its balance 2,400 MW Tamnar 2
PPA power project, the company can expect a further reduction in its debt by around Rs. 15,500 Crs. (Rs. 6.5
Crs. per MW X 2,400 MW PPA plant). Thus achieving a healthy and a strong balance sheet.
NVS Wealth Managers
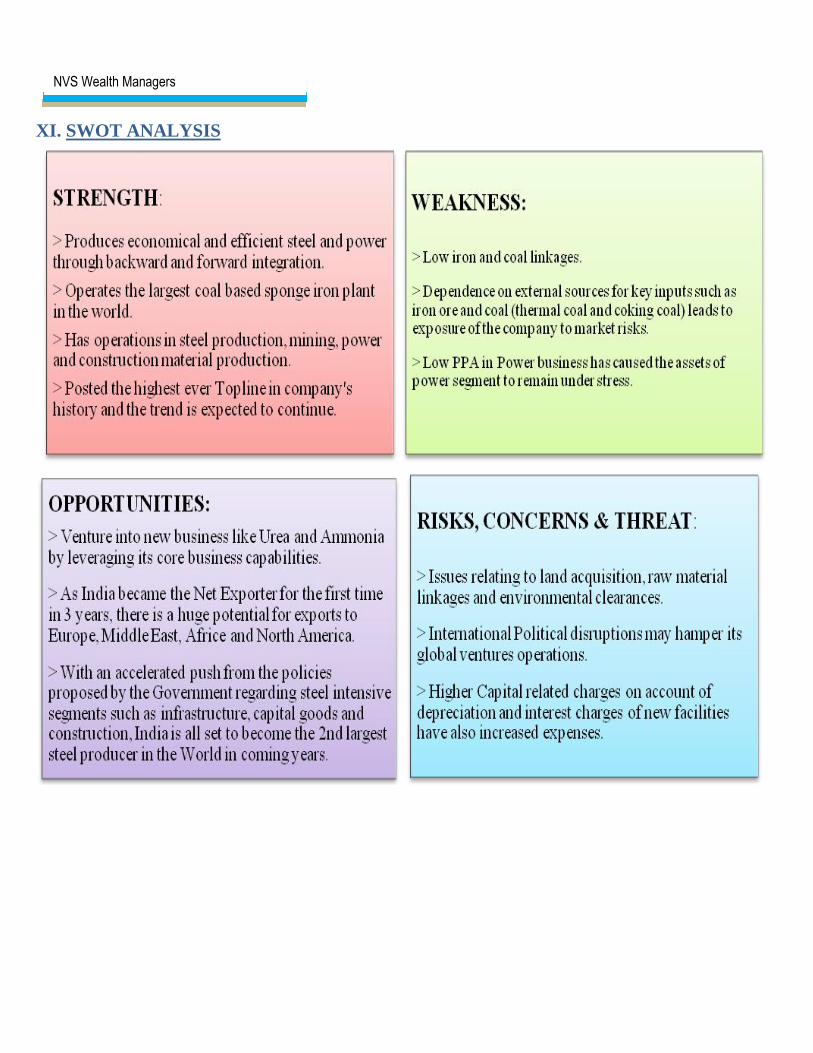
XI. SWOT ANALYSIS
NVS Wealth Managers
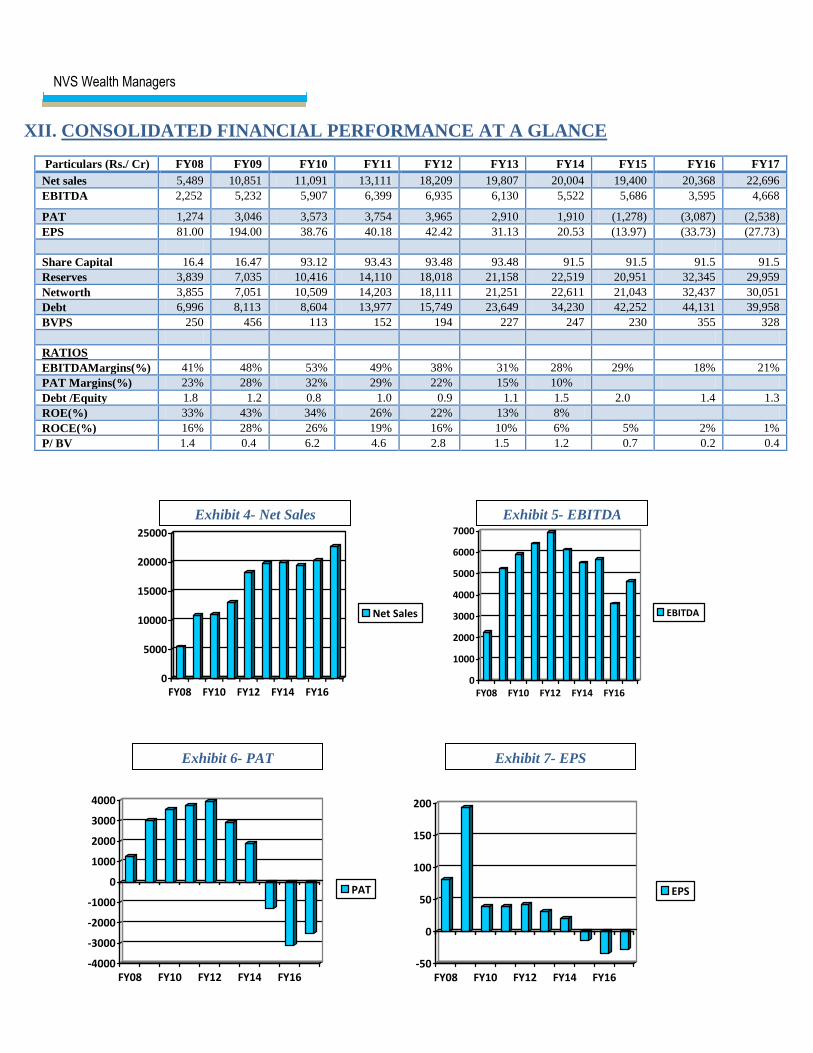
XII. CONSOLIDATED FINANCIAL PERFORMANCE AT A GLANCE
0
5000
10000
15000
20000
25000
FY08 FY10 FY12 FY14 FY16
Net Sales
0
1000
2000
3000
4000
5000
6000
7000
FY08 FY10 FY12 FY14 FY16
EBITDA
-4000
-3000
-2000
-1000
0
1000
2000
3000
4000
FY08 FY10 FY12 FY14 FY16
PAT
-50
0
50
100
150
200
FY08 FY10 FY12 FY14 FY16
EPS
Particulars (Rs./ Cr) FY08 FY09 FY10 FY11 FY12 FY13 FY14 FY15 FY16 FY17
Net sales 5,489 10,851 11,091 13,111 18,209 19,807 20,004 19,400 20,368 22,696
EBITDA 2,252 5,232 5,907 6,399 6,935 6,130 5,522 5,686 3,595 4,668
PAT 1,274 3,046 3,573 3,754 3,965 2,910 1,910 (1,278) (3,087) (2,538)
EPS 81.00 194.00 38.76 40.18 42.42 31.13 20.53 (13.97) (33.73) (27.73)
Share Capital 16.4 16.47 93.12 93.43 93.48 93.48 91.5 91.5 91.5 91.5
Reserves 3,839 7,035 10,416 14,110 18,018 21,158 22,519 20,951 32,345 29,959
Networth 3,855 7,051 10,509 14,203 18,111 21,251 22,611 21,043 32,437 30,051
Debt 6,996 8,113 8,604 13,977 15,749 23,649 34,230 42,252 44,131 39,958
BVPS 250 456 113 152 194 227 247 230 355 328
RATIOS
EBITDAMargins(%) 41% 48% 53% 49% 38% 31% 28% 29% 18% 21%
PAT Margins(%) 23% 28% 32% 29% 22% 15% 10%
Debt /Equity 1.8 1.2 0.8 1.0 0.9 1.1 1.5 2.0 1.4 1.3
ROE(%) 33% 43% 34% 26% 22% 13% 8%
ROCE(%) 16% 28% 26% 19% 16% 10% 6% 5% 2% 1%
P/ BV 1.4 0.4 6.2 4.6 2.8 1.5 1.2 0.7 0.2 0.4
Exhibit 4- Net Sales Exhibit 5- EBITDA
Exhibit 6- PAT Exhibit 7- EPS
NVS Wealth Managers
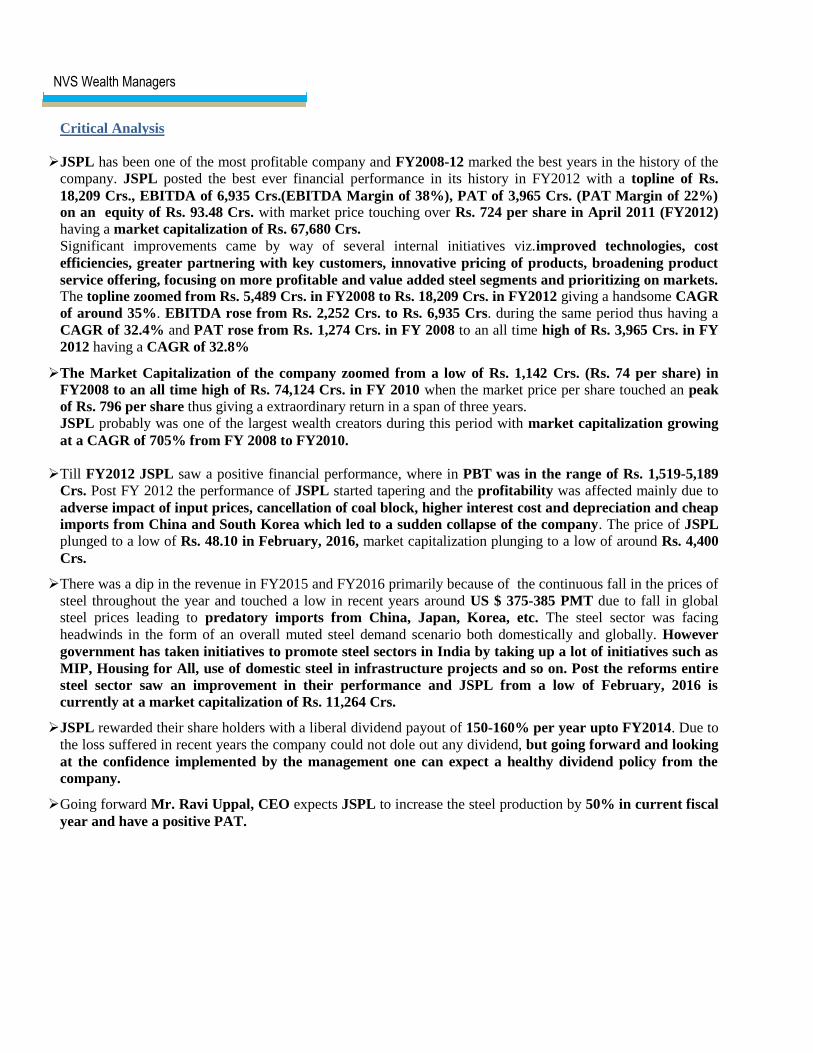
Critical Analysis
JSPL has been one of the most profitable company and FY2008-12 marked the best years in the history of the
company. JSPL posted the best ever financial performance in its history in FY2012 with a topline of Rs.
18,209 Crs., EBITDA of 6,935 Crs.(EBITDA Margin of 38%), PAT of 3,965 Crs. (PAT Margin of 22%)
on an equity of Rs. 93.48 Crs. with market price touching over Rs. 724 per share in April 2011 (FY2012)
having a market capitalization of Rs. 67,680 Crs.
Significant improvements came by way of several internal initiatives viz.improved technologies, cost
efficiencies, greater partnering with key customers, innovative pricing of products, broadening product
service offering, focusing on more profitable and value added steel segments and prioritizing on markets. The topline zoomed from Rs. 5,489 Crs. in FY2008 to Rs. 18,209 Crs. in FY2012 giving a handsome CAGR
of around 35%. EBITDA rose from Rs. 2,252 Crs. to Rs. 6,935 Crs. during the same period thus having a
CAGR of 32.4% and PAT rose from Rs. 1,274 Crs. in FY 2008 to an all time high of Rs. 3,965 Crs. in FY
2012 having a CAGR of 32.8%
The Market Capitalization of the company zoomed from a low of Rs. 1,142 Crs. (Rs. 74 per share) in
FY2008 to an all time high of Rs. 74,124 Crs. in FY 2010 when the market price per share touched an peak
of Rs. 796 per share thus giving a extraordinary return in a span of three years.
JSPL probably was one of the largest wealth creators during this period with market capitalization growing
at a CAGR of 705% from FY 2008 to FY2010.
Till FY2012 JSPL saw a positive financial performance, where in PBT was in the range of Rs. 1,519-5,189
Crs. Post FY 2012 the performance of JSPL started tapering and the profitability was affected mainly due to
adverse impact of input prices, cancellation of coal block, higher interest cost and depreciation and cheap
imports from China and South Korea which led to a sudden collapse of the company. The price of JSPL
plunged to a low of Rs. 48.10 in February, 2016, market capitalization plunging to a low of around Rs. 4,400
Crs.
There was a dip in the revenue in FY2015 and FY2016 primarily because of the continuous fall in the prices of
steel throughout the year and touched a low in recent years around US $ 375-385 PMT due to fall in global
steel prices leading to predatory imports from China, Japan, Korea, etc. The steel sector was facing
headwinds in the form of an overall muted steel demand scenario both domestically and globally. However
government has taken initiatives to promote steel sectors in India by taking up a lot of initiatives such as
MIP, Housing for All, use of domestic steel in infrastructure projects and so on. Post the reforms entire
steel sector saw an improvement in their performance and JSPL from a low of February, 2016 is
currently at a market capitalization of Rs. 11,264 Crs.
JSPL rewarded their share holders with a liberal dividend payout of 150-160% per year upto FY2014. Due to
the loss suffered in recent years the company could not dole out any dividend, but going forward and looking
at the confidence implemented by the management one can expect a healthy dividend policy from the
company.
Going forward Mr. Ravi Uppal, CEO expects JSPL to increase the steel production by 50% in current fiscal
year and have a positive PAT.

NVS Wealth Managers
XIII. Valuation & Recommendation
JSPL crashed from high of Rs. 796 per share in August, 2010 (little over Rs. 74,000 Crs. in market
capitalization) to a low of Rs. 48.10 per share in February, 2016 (Rs. 4,392 Crs. in market capitalization)
and is currently around Rs.123 per share (around Rs. 11,260 Crs. in market capitalization). JSPL has
currently the BV per share of Rs. 328 per share as against the CMP of Rs. 123, making it available at an
attractive valuation of only 0.38x the BV- A MUST ACCUMULATE FOR ALL INVESTOR.
It will be interesting to note that JSW steel, one of the peer, has a BV of Rs. 74 per share and is currently
trading at Rs. 195-200 per share, with a P/Bv at a 2.7x, SAIL having a BV of Rs. 90 per share and is
currently trading at Rs. 56-58, with a P/BV at a 0.7x, Tata Steel (consolidated) has a BV of Rs. 406 per
share and is currently trading at Rs. 540-545 per share thus having a P/BV of 1.3x, indicating that JSPL
has strong potential for appreciation from the present level.
JSPL has been one of the most competitive steel producer in the country. This leads us to believe that
investors in JSPL has a long journey to travel from a current market capitalization of around 11,000 Crs.
to a top of 74,000 Crs. post the expansion at Angul plant, improved and robust financial performance.
The company will benefit from the burgeoning opportunity in steel sector on the back of master reforms and
inititives by Shri Narendra Modi led BJP government to use locally manufactured steel in Government
projects coupled with renewed thrust on infrastructue, Housing for All, Make in India, Smart Cities,
growth in automotive industry, etc. should auger well as JSPL has majority of its production in long
products thus leading to higher demand and margins.
Recently the promoters have been allotted 4,80,00,000 convertible equity warrants at Rs.125 per share
aggregating to Rs.600 Crs which exudes the confidence of the management towards the future of the
company.
All the above pointers lead us to believe for the positive turnaround in the fortunes of the company and
we recommend investors to get invested with a medium to long term view of atleast 24 months to reap
rich dividends.
XIV. Source
JSPL Annual Report FY2016
JSPL Investor Presentation Q4FY2017
www.worldsteel.org
IBEF Steel Report
JSPL Chairman Mr. Naveen Jindal Interview with Business Standard and Economic Times
JSPL CEO Mr. Ravi Uppal interview with Mint
www.jindalsteelpower.com
Disclosures and Disclaimers:
This report has been prepared and issued by NVS Wealth Managers Pvt. Ltd. "SEBI registered Investment Advisers".
NVS Wealth Managers
NVS Wealth Managers (NVS) is a subsidiary of NVS Brokerage Pvt. Ltd. (Stock Broking member of BSE & NSE,
registered with SEBI). This report is prepared and distributed by NVS for information purposes only and neither the
information contained herein nor any opinion expressed should be construed or deemed to be construed as solicitation
or as offering advice for the purposes of the purchase or sale of any security, investment or derivatives. The information
and opinions contained in the Report were considered by NVS to be valid when published. The report also contains
information provided to NVS by third parties. The source of such information will usually be disclosed in the report.
Whilst NVS has taken all reasonable steps to ensure that this information is correct, NVS does not offer any warranty as
to the accuracy or completeness of such information. The ownership of any investment decision(s) shall exclusively vest
with the investor after analyzing all possible risk factors and by exercise of his/her its independent discretion & NVS
shall not be liable or held liable for any consequences thereof. . Prices are subject to market risks which may result in
appreciation or depreciation of investments. Past performance is not necessarily indicative of future results.
This report does not have regard to the specific investment objectives, financial situation and the particular needs of any
specific person who may receive this report. Investors must undertake independent analysis with their own legal, tax
and financial advisors and reach their own conclusion regarding the appropriateness of investing in any securities or
investment strategies discussed or recommended in this report and should understand that statements regarding future
prospects may not be realized. The reports issued from NVS are non-discretionary and non-participation basis. In no
circumstances it is to be used or considered as an offer to sell or a solicitation of any offer to buy or sell the Securities
mentioned in it. The information contained in the reports may have been taken from trade and statistical services and
other sources, which we believe are reliable. NVS or any of its group/associate/affiliate companies do not guarantee that
such information is accurate or complete and it should not be relied upon as such. Any opinions expressed reflect
judgments at this date and are subject to change without notice.
Important: These disclosures and disclaimers must be read in conjunction with the report of which it forms part. Receipt
and use of the report is subject to all aspects of these disclosures and disclaimers. Additional information about the
issuers and securities discussed in this report is available on request.
Certifications: The analyst(s) who prepared this report hereby certifies that the views expressed in this report accurately
reflect the analyst’s personal views about all of the subject issuers and/or securities, that the analyst/entity/associate
have no known material conflict of interest, no financial interest and no part of the analyst’s compensation was, is or
will be, directly or indirectly, related to the specific views or recommendations contained in this report. The analyst has
not served as an officer, director or employee of the subject company. The analyst and related parties have not dealt in
shares of the subject company before 30 days of the report being made public and will not deal for the next 5 days, as
per SEBI (Research Analyst) Regulations, 2014.
Independence: NVS has established information barriers between Research & other business groups. As a result NVS
does not disclose certain client relationships with or compensation received from, subject issuers in these reports. NVS
has not had an investment banking relationship with, and has not received any compensation for investment banking
services from, the subject issuers in the past twelve (12) months, and NVS does not anticipate receiving or intend to
seek compensation for investment banking services from the subject issuers in the next three (3) months. The analyst/
entity or its associates have not received any compensation for products or services other than investment banking or
merchant banking or brokerage services from the subject company in the past twelve months. The analyst/ entity has not
managed or co-managed public offering of securities for the subject company in the past twelve months.
The analyst or its associates have not received any compensation or other benefits from the Subject Company or third
party in connection with the report. The subject company is not and was not a client during twelve months preceding the
date of distribution of the report.

NVS Wealth Managers
The analyst or NVS is not a market maker in the securities mentioned in this report, although it or its affiliates may hold
either long or short positions in such securities. NVS or the analysts do not hold more than 1% of the shares of the
company (ies) covered in this report at any time immediately preceding the date of publication of the report. However,
NVS, associate companies and their clients might be holding this stock in their personal capacities.
Suitability and Risks: This report is for informational purposes only and is not tailored to the specific investment
objectives, financial situation or particular requirements of any individual recipient hereof. Certain securities may give
rise to substantial risks and may not be suitable for certain investors. . It is therefore important carefully/personally
review your entire investment portfolio to ensure that it meets your investment goals and is well within your risk
tolerance, including your objectives for asset and issuer diversification.
The value of any security may be positively or adversely affected by changes in foreign exchange or interest rates, as
well as by other financial, economic or political factors. Past performance is not necessarily indicative of future
performance or results.
Sources, Completeness and Accuracy: The material herein is based upon information obtained from sources that NVS
and the analyst believe to be reliable, but neither NVS nor the analyst represents or guarantees that the information
contained herein is accurate or complete and it should not be relied upon as such. Opinions expressed herein are current
opinions as of the date appearing on this material and are subject to change without notice. Furthermore, NVS is under
no obligation to update or keep the information current.
Copyright: The copyright in this report belongs exclusively to NVS. All rights are reserved. Any unauthorized use or
disclosure is prohibited. No reprinting or reproduction, in whole or in part, is permitted without NVS’s prior consent,
except that a recipient may reprint it for internal circulation only and only if it is reprinted in its entirety.
Caution: Risk of loss in trading can be substantial. You should carefully consider whether trading is appropriate for you
in light of your experience, objectives, financial resources and other relevant circumstances.
Method: We have not rated the stock.
Rating Scale: This is a guide to the rating system used by our team. Our rating system comprises six rating categories,
with a corresponding risk rating.
Contact Details:
Corporate Office Address: 702, Embassy Centre, Nariman Point, Mumbai – 400 021 Tel.:+91 22 6631 5511/12,
Fax: +91 22 61539134 Email: [email protected] Website: www.nvswealthmanagers.com