comparative analysis of hardness in different … · comparative analysis of hardness in different...
TRANSCRIPT

Proceedings in Manufacturing Systems, Volume 10, Issue 3, 2015, 123−130
ISSN 2067-9238
COMPARATIVE ANALYSIS OF HARDNESS IN DIFFERENT ZONES OF WELD
Nicolae GRIGORE*
PhD. Student, University “Politehnica” of Bucharest, Department of Materials Technology and Welding, Bucharest, Romania
Abstract: This paper studies the HV 10 Vickers hardness values measured on the end zones (beginning and end) of the samples taken for approval of welding technologies to analyze the situation less common welding technology without end plates. These values are then compared with those determined by meas-urements made in areas of welds means to assess the degree of deviation from the recommended values for steel grade analyzed. It was chosen for homologating of a welding process a steel sheet of thickness 20 mm of P355NL1 quality welded by the processes 141 + 111 + 121. The work presents the macroscopic and microscopic analysis of samples and preheats temperature calculation, calculation and estimation of carbon equivalent maximum hardness in the heat affected zone when welding steel P355NL1. In these ar-eas of the beginning and end of the seam, there is a situation similar to welding the weld below 100 mm in length, where the thermal field propagates in welding non-steady state compared to the middle portion of long welded row, where the heat propagates quasi-stationary regime.
Keywords: weld, hardness HV 10, homologation, HAZ, WIG welding.
1. INTRODUCTION 1
Currently, the approval procedures for welding, welders’ authorization or extension of authorization/ certification of welders is performed based on standard-ized welded samples with lengths of about 500mm, and the end portion with length of 20mm is removed. The ends of the sample welds are not used for the tests, be-lieving that they contain nonconformities due to transient process of welding regime.
In technical literature [1], it is specified that in these beginning and end of line zones, the thermal field propa-gates in a non-steady state, which is isotherms bend and thicken, which can be proved by the colors appearing on the surface of sheets when cleaned and polished to metal-lic luster. Thickening of isotherms is explained by the increase of temperature gradients, by the increase of temperature gradients, by the increase of the cooling rate in these critical zones at the beginning and at the end of the line, implicitly by the decrease of the time of cooling t8/5.
But there are situations where, in the welding tech-nology, it is not possible to attach some little plates on which to start or finish welded seams.
The present article studies the values of HV 10 Vick-ers hardness in these beginning and end zones of the welding is made without putting on the technological plates at the beginning and at the end, compared to the values of HV 10 Vickers hardness measured in the mid-dle part of the weld.
In these zones at the beginning and at the end of the weld, a similarity to the case of welding in short lines and multilayer welding, with the weld length less than
* Corresponding author: Splaiul Independentei 313, sector 6, 060042, Bucharest, Romania Tel.: +40 723362876, E-mail addresses: [email protected]
100 mm, can be noticed. We choose for homologating a welding process, a
steel sheet of 20 mm thickness, P355NL1 quality, welded by the following processes: 141 + 111 + 121. The added materials are the followings: CORBOROD Mo ø2 + SANBAZ ø3.2 + OS2 ø4 + FLUX OP121TTW.
Symbolizing of welding processes used for homolo-gation: • 141 – inert gas electric arc welding with wolfram
electrode (WIG welding); • 111 – electric arc welding with coated electrode; • 121 – submerged arc welding with wire electrode. 2. EXPERIMENTAL PROCEDURE
DESCRIPTION
2.1. Specific features of P355NL1 base material
P355NL1 steel is steel for pressure vessels, a non-alloyed, quality, fine-grained, with flow limit 355 N/mm2, normalized, used at low temperatures.
The correspondence of P355NL1 steel to other equiv-alent steel names is given in Table 1 [2]. P355NL1 steel has the following chemical composition at analysis on liquid steel for flat and long products (Table 2) [2−3]:
2.2. Added material used for welding
P355NL1 steel For homologation of welding probe, three welding
processes were used: The root of weld was welded by 141 process- inert
gas electric arc welding with wolfram electrode (WIG welding), using as added material, wire of CARBOROD Mo quality, 2 mm in diameter.
This welding process-electric arc welding in inert gas medium with wolfram electrode is chosen especially for root welding, due first of all to a controlled penetration that allows an excellent control on the formation of the

124 N. Grigore / Proceedings in Manufacturing Systems, Vol. 10, Iss. 3, 2015 / 123−130
Table 1 Correspondence of P355NL1 steel to other equivalent steel names [2]
EN Steel Type
According to EN
10027 – 2
DIN Steel Type
DIN No. STAS 500/2 United States of America
ASTM, AISI
Europe St. EU
EN 10025
P355NL1 1.0566 TStE 355 17102 OL52-4kf, normalized
A 36-207, A 510, AP / FP, A299, A516 (70) (485), A573 (70) (485), A618 (II), A633 (D), A678(A), A707(L1), A707 (L2), A714 (II), A724
Fe 510 D1
Table 2 Chemical Composition of P355NL1 steel [2, 3]
Steel
Deo
xida
tion
Deg
ree
Sub
grou
p
C %
Si %
max
Mn %
max
P %
max
S %
max
Cu %
max
Ni %
max
Al %
max
V %
max
P355NL1 FF QS 0.18 0.50 0.90…1.65 0.025 0.020 0.55 0.50 0.020 0.12
weld root, characterized mainly by protection of liquid bath offered by inert gas that is used.
• Welding parameters for 141 process are as follows:
Is = 100 A, Ua = 13 V, Polarity: DC+, Welding rate: 8 cm/min, Welding energy: 10.50 kJ/cm, Electrod type: WL 20 ø3.2 mm − Wolfram 20 Lan-
thanum 2%. Five lines of filling the gap were welded by 111 pro-
cess – electric arc welding with coated electrode, using as added material, SANBAZ ø3.2 mm electrodes.
Welding process electric – manual with coated elec-trodes, is characterized by a versatile quality and thick-ness of base materials used, as well as welding positions.
• Welding parameters for 111 process are as follows: Is = 129, Ua =23 V, Polarity: DC+, Welding rate: 19 cm/min, Welding energy: 9.40 kJ/cm.
• Final layers are made by 121 process – submerged arc welding with wire electrode, having as added ma-terial OE-S2 4 mm in diameter wire, and as flux OP 121TTW. The submerged arc welding (SAW) process is suited
to make relatively thick welds, with easy access at weld-ing position, with a high facing rate, with a high degree of utilization of added material, with a very high quality of weld no matter operator’s skill, as there is a big possi-bility of alloying the weld by wire and flux.
Welding parameters for 121 process are as follows:
Is = 575 A, Ua = 29 V, Polarity: DC+, Welding rate: 55 cm/min, Welding energy: 17.40 kJ/cm.
3. RESEARCH RESULTS
3.1. HV 10 Vickers hardness tests to the welded sample
We cut the edges of the welded sample without tech-nological plates at the beginning and at the end, using an alternative saw, according to Fig. 1. These have been then cut off for the macro and microscopical analysis, as well for making HV 10 Vickers hardness tests: Fig. 2 corresponding to the macroscopic map for the specimen cut off from the beginning stub of the sample and Fig. 3, corresponding to the macroscopic map for the specimen cut off from the end of the sample (crater area).
Further on, they have been metallographycally pol-ished using abrasive paper (with granulation 400, 600, 800, 1000, 1500), after which abrasive powder (Topol 1, Topol 2 and Topol 3), with granulations from 3 to 0.1 µm.
After that, the polished surfaces were etched with a metallographic etchant specific to low-alloyed steels (Nital 4% for the macrostructure and Nital 2% for the microstructure).
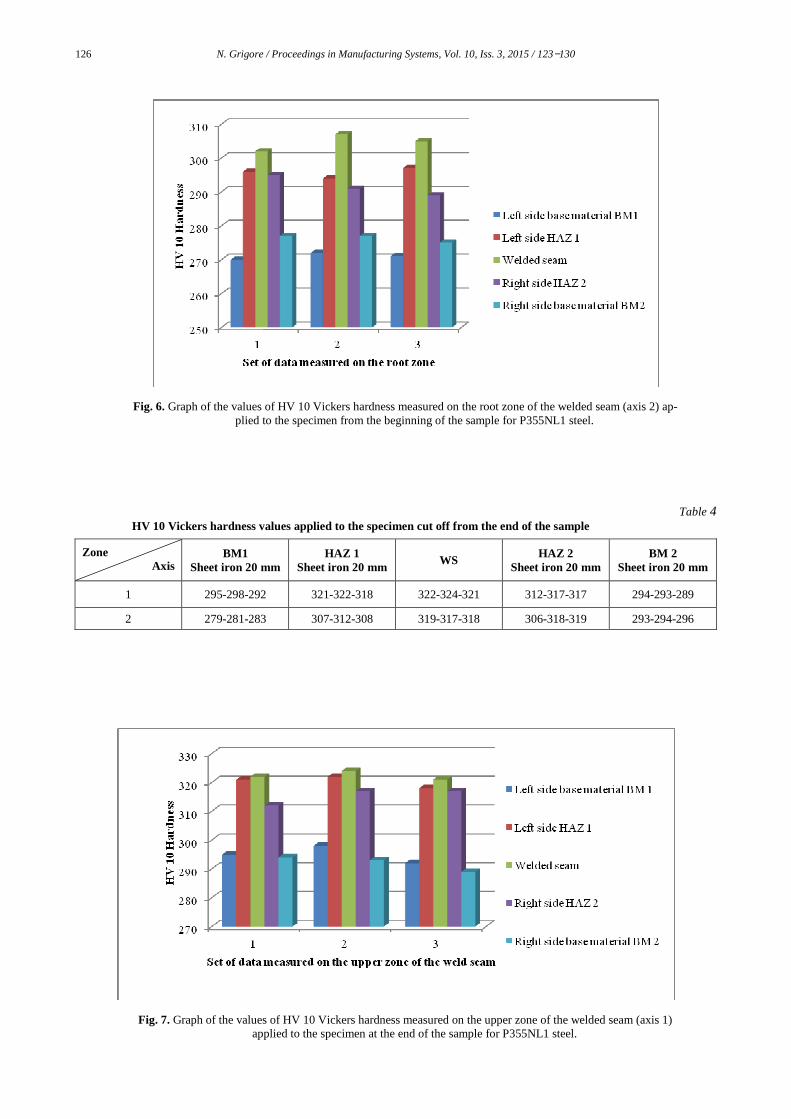
In order to establish HV 10 Vickers hardness values, two test axis have been established on the sample, repre-sented in Fig. 4, on which three sets of HV 10 Vickers hardness were applied for each axis on the two base materials BM1, BM2, on the two heat – affected zones HAZ 1, HAZ 2, as well as in the welded seam WS, with the determined values in Table 3 (illustrated in Fig. 5 for the set of data measured on the upper zone of the welded seam and in Fig. 6 for the set of data measured on the root of weld) for the welded sample applied to the speci-men from the beginning of the sample, and Table 4 (il-lustrated in Fig. 7 for the set of data measured on the upper zone of the welded seam and in Fig. 8 for the set of data measured on the root of weld) applied to the speci-men at the end of the sample.

N. Grigore / Proceedings in Manufacturing Systems, Vol. 10, Iss. 3, 2015 / 123−130 125
Fig. 1. Image with sampling from the beginning and from
the end of the welded plate for homologating the welding process. (1:4 scale).
Fig. 2. Macroscopical image for the specimen cut off the beginning edge of the sample. (1:1.3 scale).
Fig. 3. Macroscopical image for the specimen cut off the
end of the sample (the crater area). (1:1.3 scale).
Fig. 4. Graphical representation on two axes of the zones of hardness sampling for P355NL1 steel.
Table 3 HV 10 Vickers hardness values applied to the specimen cut off from the beginning of the sample
Zone Axis
BM1 Sheet iron 20 mm
HAZ 1 Sheet iron 20 mm WS HAZ 2
Sheet iron 20 mm BM 2
Sheet iron 20 mm
1 289-290-288 302-303-301 319-314-310 299-298-288 275-276-271
2 270-272-271 296-294-297 302-307-305 295-291-289 277-277-275
Fig. 5. Graph of the values of HV 10 Vickers hardness measured on the upper zone of the welded seam (axis 1) applied to the specimen from the beginning of the sample for P355NL1 steel.
126 N. Grigore / Proceedings in Manufacturing Systems, Vol. 10, Iss. 3, 2015 / 123−130
Fig. 6. Graph of the values of HV 10 Vickers hardness measured on the root zone of the welded seam (axis 2) ap-plied to the specimen from the beginning of the sample for P355NL1 steel.
Table 4 HV 10 Vickers hardness values applied to the specimen cut off from the end of the sample
Zone Axis
BM1 Sheet iron 20 mm
HAZ 1 Sheet iron 20 mm
WS HAZ 2 Sheet iron 20 mm
BM 2 Sheet iron 20 mm
1 295-298-292 321-322-318 322-324-321 312-317-317 294-293-289
2 279-281-283 307-312-308 319-317-318 306-318-319 293-294-296
Fig. 7. Graph of the values of HV 10 Vickers hardness measured on the upper zone of the welded seam (axis 1) applied to the specimen at the end of the sample for P355NL1 steel.

N. Grigore / Proceedings in Manufacturing Systems, Vol. 10, Iss. 3, 2015 / 123−130 127
Fig. 8. Graph of the values of HV 10 Vickers hardness measured on the root zone of the welded seam (axis 2) applied to the specimen at the end of the sample for P355NL1 steel.
In order to compare, if we measure the HV 10 Vick-
ers hardness values in the middle part of the weld bead, according to Table 5, illustrated in Fig. 9 for the set of data measured on the upper zone of the welded seam and in Fig. 10 for the set of data measured on the root of weld, we notice an increase of the values of the HV 10 Vickers hardness measured in the beginning and end
zones of the weld bead, compared to the values of the HV 10 Vickers hardness values measured in the middle part of the weld bead, as well as an increase of the values of hardness for the end zone of the weld (crater), com-pared to the values of hardness corresponding to the beginning zone of the weld.
Table 5
Values of the HV 10 Vickers hardness measured in the middle part of the weld bead of P355NL1 steel
Zone Axis
BM 1 Sheet iron 20 mm
HAZ 1 Sheet iron 20 mm
WS HAZ 2 Sheet iron 20 mm
BM 2 Sheet iron 20 mm
1 202-205-203 209-208-207 219-224-221 207-207-209 202-201-203
2 201-204-203 210-211-210 218-224-217 205-207-206 201-202-201
Fig. 9. Graph of the values of HV 10 Vickers hardness measured on the upper zone of the welded seam (axis 1) on a specimen taken off the middle part of the weld, corresponding to P355NL1 steel.

128 N. Grigore / Proceedings in Manufacturing Systems, Vol. 10, Iss. 3, 2015 / 123−130
Fig. 10. Graph of the values of HV 10 Vickers hardness measured on the root zone of the welded seam (axis 2) on a specimen taken off the middle part of the weld, corresponding to P355NL1 steel.
3.2. Evaluation of the quality of welded sample of
P355NL1 steel taken from the end zones
During the cooling and solidification of the built-up metal, a series of constituents appear in its composition, which give it special properties and special behaviors during service.
Analysis was made by optical microscopy according to SR EN 1321:2000, STAS 7626-79, CR 12361:1996 + AC: 1997 [10−12].
The microscope used was Olympus GX51 equipped with a software specialized in image processing − AnalySis.
Hardness was measured according to EN ISO 6507-1 on surfaces that have been cut off and etched with metallographic etchant. Hardness was measured by Vickers method, using Shimadzu HMV 2T device, under the fallowing conditions: 24 °C temperature, 60% humidity.
Studying the microstructures in Fig. 11, a–f, we no-tice as follows:
• Fig. 11,a − Base material: P355NL1 steel. The micro-structure contains ferrite and pearlite situated in lines because of the plastic deformation process (lamina-tion). Magnifying power: 200×. Chemical etching: Nital 2%.
• Fig. 11,b − Heat affected zone - HAZ (overheating). An increase of the granulation in the adjacent zone to the fusion line is manifest. Magnifying power: 200 x. Chemical etching: Nital 2%.
• Fig. 11,c − Recrystallization zone in the HAZ. Fine ferritic-pearlitic granulation. Magnifying power: 500×. Chemical etching: Nital 2%.
• Fig. 11,d − Normalizing zone in the HAZ. Very fine ferritic-pearlitic granulation. Magnifying power: 100×. Chemical etching: Nital 2%.
• Fig. 11,e − Overheating zone in the HAZ. Oversize ferritic-pearlitic-martensitic granulation. Islands of martensite, Widmanstatten type acicular and modified pearlite are present. Magnifying power: 200×. Chem-ical etching: Nital 2%.
• Fig. 11,f − Welded seam. The dendritic microstruc-ture oriented in the direction of the heat flow. Magni-fying power: 200×. Chemical etching: Nital 2%.
3.3. Establishing the preheating temperature, calcula-
tion of the carbon equivalent and evaluation of maximum hardness in heat-affected zone for welding P355NL1 steel. By calculating equivalent carbon after the method of
International Welding Institute for P355NL1 steel [4]:
( )
.3080101520
.VMoCrNiMn
CC e =+++++= (1)
Having in view that for welding P355NL1 steel we
have chosen SANBAZ electrode, which is a basic coated electrode, and according to the value of carbon equiva-lent, to the P355NL1 steel is given weldability number Is − D classification [4]:
For Ce = 0.28 ÷ 0.32 ⇒ Is ⇒ D. (2) For the calculation of preheating temperature the
Seferian method was used [4]:
( )250350 .CtT pr −⋅= [°C]. (3) Ct = total equivalent carbon, calculated depending on
the chemical composition of the steel and on the sheet thickness:
. Ct se CC += (4)
Ce represents the equivalent carbon:
,3910Mo90
7
18
Ni
9
CrMnCe .C =++++= (5)
where Cs represents the carbon introduced based on the thickness of the material:
,03910005.0Cs .Cs e =⋅⋅=
(6)
where s represents the material thickness, in mm.

N. Grigore / Proceedings in Manufacturing Systems, Vol. 10, Iss. 3, 2015 / 123−130 129
a b
c d
e f
Fig. 11. Microscopical images of the specimen of the welded sample made of P355NL1 steel:
a − base material: P355NL1 steel; b − the heat affected zone − HAZ (overheating); c − recrystallization zone in the HAZ; d − the normalizing zone in the HAZ;
e − the overheating zone in the HAZ; f − the welded seam.
43010.C t = 230=prT °C. (7)
The behavior of weld joint to cracking is determined
by the calculation of maximum hardness from HAZ, using the formula (8) [5−9]:
−⋅+⋅+= )50767189( cmmax PCH
.X PC cm 10) (HV arctan)661711101( ⋅⋅−⋅+− (8)
. 3270510152060202030
.BVMoCrNiCuMnSi
CPcm =⋅++++++++= (9)
X is calculated using the formula:
( ).
7605505430
01119075010log 58
cm
cm/
P.C..
P.C.. tX
⋅−⋅+⋅−⋅++= (10)
. 94603101040613
73log 58 ..MoNiVMn
C. t / =−
++++⋅= (11)
4391,X −= 10. HV380=maxH (12)
We notice that the value of calculated maximum HV
10 Vickers hardness in the heat-affected zone is superior to the effectively measured values of hardness in the two cases: the beginning and the end parts of welds, as well as the middle parts of welds.
4. CONCLUSIONS
For the steel we studied, P355NL1, by the analysis and the control of HV 10 Vickers hardness applied to the beginning and end of the weld bead, as well as in the middle part of the weld bead, measured on the material, on the heat-affected zone and on the weld seam, we no-tice higher values of the hardness in the beginning and
Martensite Widmanstatten Fer-
rite

130 N. Grigore / Proceedings in Manufacturing Systems, Vol. 10, Iss. 3, 2015 / 123−130
end zones of the weld bead, compared to the middle part of the weld bead.
These end zones of the welded seam are a centre of non-conformities due to the transitory welding condi-tions. For this reason, the beginning and the end parts of the welded samples used for homologation of welding processes, for welders’ authorization or for prolongation of welders’ authorization/certification, are cut off and samples for mechanical tests are not made.
The situation is similar to the case of repair by weld-ing, which is comparable to the case of short lines weld-ing compared to the case of long welds, where the corre-sponding values of the HV 10 Vickers hardness meas-ured on the beginning and end zones of the weld bead are higher than the values of the hardness measured in the middle of the long welded line, measured in the zones of the base material, on the heat-affected zone and on the welded seam. We understand by long welded line the welded line longer than 100 mm. REFERENCES
[1] V. Micloşi, Tratamente termice conexe sudării prin topire a oţelurilor, (Thermal Treatment Connected to Fusion Welding of Steels), Book. I, Sudura Publishing House, Timişoara, 2003.
[2] B. Wischnewski, The big, nearly all complete steel index, avaible at:
http://www.peacesoftware.de/einigewerte/ste
elindex.html, accessed: 2014-01-13. [3] *** The European Standard EN 10028-2:2003, Flat
products made of steels for pressure purposes − Part 2: Non-alloy and alloy steels with specified elevated tem-perature properties.
[4] Gh. Zgura, G. Iacobescu and others, Tehnologia sudarii prin topire, (Fusion Welding Procedure), Politehnica Press Publishing House, Bucharest, 2007.
[5] C.L.M. Cottrel, Hardness equivalent may lead to a more critical measure of weldability, Metal Construction, 1984.
[6] C.I. Duren, Formulae for calculating the maximum hard-ness in the heat-affected zone of welded joints, Doc. IIE IX-1356-85.
[7] J.C. Ion, and others, A second report on diagrams of microstructure and hardness for heat-affected zone in weld, Doc IIW IX 1326-84.
[8] H. Suzuki, A new formula estimating HAZ maximum hardness in welded steel, Doc. IIW IX-1351-85.
[9] H. Suzuki, A new formula estimating HAZ maximum hardness in welded steel, Doc. IIW IX-1409-86.
[10] *** CR 12361:1996 + AC: 1997, Destructive Tests On Welds In Metallic Materials.
[11] *** EN 1321:2000, Destructive Tests on Welds in Me-tallic Materials; Macroscopic and Microscopic Examina-tion of Welds.
[12] *** STAS 7626-1979, Macrostructura Oţelurilor. Constituienţi. (Macrostructure of Steels. Constituents).