comparative evaluation of fluoride varnishes, self
TRANSCRIPT

RESEARCH Open Access
Comparative evaluation of fluoridevarnishes, self-assembling peptide-basedremineralization agent, and enamel matrixprotein derivative on artificial enamelremineralization in vitroYağmur Lena Sezici1 , Enver Yetkiner2 , Arzu Aykut Yetkiner3* , Ece Eden3 and Rengin Attin4
Abstract
Background: One of the most unfavorable side effects of fixed orthodontic treatment is white spot lesions (WSLs).Although the most important approach is prevention of WSLs, it is also essential to evaluate the efficacy of theremineralization agents. However, there is no concurrence in the literature with respect to the remineralizationprocess of these agents. The objective of the present study was to evaluate the effects of different fluoridevarnishes, enamel matrix protein, and self-assembling peptide derivatives with varying chemical compositions onremineralization of artificially created WSLs in vitro using quantitative light-induced fluorescence (QLF).
Methods: Artificial WSLs were created on bovine enamel samples using acidic buffer solution (pH 5, 10 days).Specimens were randomly allocated to six groups (n = 10/group): (1) Emdogain (Straumann, Basel, Switzerland), (2)Curodont Repair (Credentis AG, Switzerland), (3) Duraphat (Colgate-Palmolive, New York, NY), (4) Clinpro XT (3 MESPE, Pymble, New South Wales, Australia), (5) Enamel Pro Varnish (Premier Dental Products, PA, USA), and (6)control (untreated). The agents were applied to the WSLs according to the manufacturers’ instructions.Fluorescence loss (ΔF), lesion area (area), and impact (ΔQ) values of enamel surfaces were quantified by QLF-DBiluminatorTM (Inspektor-Pro, Amsterdam, The Netherlands) at baseline and after 7, 14, and 21 days of application ofthe respective materials.
Results: ΔF value presented a significantly decreasing trend throughout the 21 days for all groups except theDuraphat and Enamel Pro varnishes. The changes between 14th and 21st days of the Clinpro XT varnish applicationwere significantly higher than Emdogain, Curodont, and Enamel Pro. The Curodont group showed higher lesion areachanges between the first and second week in comparison to the Emdogain, Clinpro XT, and Enamel Pro groups,whereas Clinpro XT assured the highest reduction from the second to the third week of the observation period.
(Continued on next page)
© The Author(s). 2021 Open Access This article is licensed under a Creative Commons Attribution 4.0 International License,which permits use, sharing, adaptation, distribution and reproduction in any medium or format, as long as you giveappropriate credit to the original author(s) and the source, provide a link to the Creative Commons licence, and indicate ifchanges were made. The images or other third party material in this article are included in the article's Creative Commonslicence, unless indicated otherwise in a credit line to the material. If material is not included in the article's Creative Commonslicence and your intended use is not permitted by statutory regulation or exceeds the permitted use, you will need to obtainpermission directly from the copyright holder. To view a copy of this licence, visit http://creativecommons.org/licenses/by/4.0/.
* Correspondence: [email protected] of Pedodontics, Faculty of Dentistry, Ege University, Izmir,TurkeyFull list of author information is available at the end of the article
Lena Sezici et al. Progress in Orthodontics (2021) 22:4 https://doi.org/10.1186/s40510-020-00345-1

(Continued from previous page)
Conclusions: The fluorescence loss was significantly reduced with enamel matrix protein, self-assembling peptide, andlight-curable fluoride varnishes in the analysis for 21 days. Curodont and Clinpro XT were effective in diminishing thefluorescence loss and lesion area compared to the Duraphat, Enamel Pro fluoride varnishes, and Emdogain in differenttime points.
Keywords: White spot lesions, Remineralization, Light-induced fluorescence, Fluoride varnish, Enamel matrix protein,Self-assembling peptide
BackgroundWhite spot lesion (WSL) is the first clinical sign of en-amel demineralization which may progress to dental car-ies or an arrested demineralized area if not treated at anearly stage [1]. Fixed orthodontic appliances cause reten-tive areas that are difficult to ensure the oral hygiene,which leads to plaque accumulation. The risk of WSLformation increases due to orthodontic treatment with areported incidence of 46–73% [1, 2], especially in pa-tients with poor oral hygiene [3].The most important aspect of WSL management is the
prevention of new lesions forming. Good oral hygienemaintenance, reducing dietary carbohydrate consumption,and using fluoridated dental care materials constitute themain prerequisites for this purpose [4]. For the treatmentof already present lesions, minimally invasive treatmentsare advocated for the maximum preservation of healthyenamel and remineralization of affected areas [4, 5].Current approaches for remineralization of initial lesionsaim to reduce the solubility of enamel by inhibiting thedemineralization of hydroxyapatites. The most establishedelement for prevention against caries is fluoride, whichaims to harden the mineral surface layer and inhibit itsprogression. Fluoride, best known for its preventive effecton caries, aims at hardening the mineral surface layer,thus inactivating the caries by inhibiting its progression[5]. Among all the methods of fluoride application, fluor-ide varnish is the preferred method as they are lessdependent on patient compliance [6]. However, fluoridedoes not diffuse in the demineralized subsurface zone [7]and conventional fluoride varnish have to be applied re-peated range from once every 2 weeks to four topical ap-plications a year to maintain their effectiveness. Currently,fluoride varnish application is being used in a conven-tional and light-curable form to reduce the frequent appli-cation [6].With the advent of enamel matrix proteins, self-
assembling peptides were shown to be used in theremineralization process of enamel, dentin, and cemen-tum [6]. Self-assembling peptides form a three-dimensional matrix that helps the remineralization ofsubsurface lesions. The short hydrophilic peptide withintheir molecular design enables the assembly of the struc-ture into the fibers. It has been reported that the self-
assembling peptide P11-4 with high affinity to calciumions in saliva also leads to the formation of enamel crys-tals around the enamel matrix. The self-assembling pep-tide described in combination with guided enamelregeneration is based on the rational design of a shorthydrophilic peptide that assembles into fibers, forming a3-dimensional matrix that has been used forremineralization of subsurface lesions [7, 8]. It has beenreported that the self-assembling peptide P11-4 with highaffinity to calcium ions in saliva also leads to the forma-tion of enamel crystals around the enamel matrix [9]. Asa commercially available product, Emdogain, which ismainly used for guided tissue regeneration, is composedof the hydrophobic enamel matrix proteins [10]. Thisrevolutionary product also has attracted much attentionfor the remineralization process of enamel in the pastyears. Its protein constituents have been claimed to havethe potential to advocate remineralization process of en-amel and dentin [10, 11]. However, only a few studies[11–14] have been evaluated its potential.There is a growing body of literature that recognizes
the role of fluoride varnishes; however, to the best of ourknowledge, despite the frequent use of fluoride productsas prophylaxis, no in vivo or in vitro study has directlyor indirectly compared the effect of varying fluoride var-nishes, self-assembling peptides, and enamel matrix pro-tein on enamel demineralization. Therefore, the primaryobjective of this study was to compare the effects of top-ical application of conventional fluoride varnishes, light-curable fluoride varnish, self-assembling peptides, andenamel matrix proteins in the treatment of enameldemineralization in vitro by means of quantitative light-induced fluorescence (QLF). The null hypothesis wasthat the application of fluoride varnishes, self-assemblingpeptides, and enamel matrix proteins cannot improvethe remineralization process of WSLs.
MethodsSample preparationBovine incisors (n = 10/group) stored in 0.5% chlor-amine solution at 4 °C no longer than 6months were ini-tially cut from their roots under water irrigation. Enameldiscs with a diameter of 5 mm were cut from the labialaspect of each crown using a custom-made diamond-
Lena Sezici et al. Progress in Orthodontics (2021) 22:4 Page 2 of 12

coated trephine bur (80 μm, Intensiv SA, Lugano-Grancia, Switzerland). They were then flattened fromthe bottom to approximately 3 mm in height (Struers,Birmensdorf, Switzerland). Each piece was randomly al-located to six groups. They were embedded with theirlabial surfaces exposed in auto-polymerizing acrylic resin(Palapress; Heraeus Kulzer, Wehrheim, Germany) in cy-lindrical molds with a size of 6 mm diameter and 3mmthickness. The specimens were ground flat and polishedwith water-cooled carborundum discs (1200, 2400, and4000 grit; Struers, Erkrat, Germany) and stored in tapwater until demineralization procedure. The enamel sur-face was covered with a perforated tape, leaving a de-fined area in 3mm diameter. The remaining area wasdemineralized in an acidic buffer solution for 14 days.
Demineralization procedureDemineralization was achieved by immersing the speci-mens in acidic buffer solution (pH 5, 37 °C, 10 days) ac-cording to Buskes et al. [15]. The solution was renewedeach second day to keep the pH constant. Subsequently,specimens were removed from the solution and thor-oughly washed with deionized water. Examination ofsamples was performed under magnification to deter-mine the opacity change before the experiment (Fig. 1).
Remineralization proceduresFollowing demineralization, the specimens were treatedby one-time application of the undermentioned groupsas follows:
(1) Enamel matrix proteins: Lyophilized Emdogain(Straumann, Basel, Switzerland) was dissolved in 1mL 0.05M acetic acid and stored for 30 min at 4 °Cto a final concentration of 30 mg/mL and deliveredfrom syringes loaded with 0.7 mL. During eachtreatment, one drop of Emdogain gel was placed onthe surface of the carious lesion and daubed into avery thin layer that covered the lesion surface.
(2) Self-assembling peptide (SAP): Curodont (CurodontRepair, Credentis AG, Switzerland) (P11-4oligopeptide solution) was mixed with 0.05 mLdeionized water, and one drop was applied and leftfor 5 min on the demineralized enamel surfaces.
(3) Duraphat varnish (Colgate-Palmolive, New York,NY) (5% NaF and 2.26% F): The enamel surfacereceived a single topical application of aconventional fluoride varnish with a brushapplicator after mixing thoroughly.
(4) Clinpro XT (3M ESPE, Pymble, New South Wales,Australia): The paste and the liquid componentswere mixed for 15 s using an agate spatula.Consistent mix was then applied as a thin layerover the etched enamel surface with the aid ofapplicator brush and light-cured for 20 s.
(5) Enamel Pro Varnish (Premier Dental Products, PA,USA): Varnish was stirred with an applicator brushand mixed thoroughly. A thin coat of varnishapplied across tooth surfaces.
(6) Control: Specimens remained untreated. Thechemical compositions of the materials aresummarized in Table 1. All procedures involvingair/water syringe were performed using a custom-made device assuring standard distance to the spec-imens from the application tips and standard pres-sures provided by the air/water syringe. Afterstoring the specimens in artificial saliva at roomtemperature for 4 h, the remineralization productswere carefully removed with the swabs and 50%acetone solution. The tapes were then removed andthe specimens were then submerged back into therenewed artificial saliva to imitate the intraoral con-ditions. Artificial saliva was prepared according tothe formula given by Klimek et al. [16] and wasrenewed every 2 days. The pH value of the artificialsaliva solution for the groups was measured rangedbetween 6.5 and 6.8.
QLF measurementsAt baseline (after the demineralization process) (T0) andafter 7 (T1), 14 (T2), and 21 (T3) days, QLF images weretaken by the same author (A.A.Y) using QLF-D Bilumi-natorTM (Inspektor Research Systems BV, Amsterdam,The Netherlands). Between three and five views weretaken of the specimens so that good quality imagescould be captured of each lesion. Each sample was driedfor 5 s with compressed air before imaging. Images werecaptured using a custom-built, high-resolution, fluores-cence imaging system. The camera and illuminator weremounted in a geometry stabilizing unit (State-of-the-artIn Vitro Research setup). This, together with video repo-sitioning software, enabled specimens to be accuratelyrepositioned at each observation. The images were
Fig. 1 The opacity change of a demineralized bovine incisor
Lena Sezici et al. Progress in Orthodontics (2021) 22:4 Page 3 of 12

acquired using the QLF-D BiluminatorTM software(Inspektor Research Systems BV, Amsterdam, TheNetherlands) with the video repositioning software and agrab level of 0.95 set for the 7-, 14-, and 21-day images.The obtained images were stocked on a hard drive and aunique subject identifier was allocated.QLF provides mainly 3 variables: ΔF (%), area (mm2),
and ΔQ (mm2 × %). ΔF is the percentage fluorescenceloss comparing sound enamel to an identified lesion.Threshold for ΔF is set to 5%, indicating that any fluor-escence loss below this level is considered as noise. Areaof the lesion is calculated as pixels considered by theanalysis software as representing demineralized enamel(i.e., those with a fluorescence loss of 5% or more). ΔQis the product of ΔF and area and indicates the volumeof the lesion [17]. After the calculation of the samples’ΔF, ΔF max, area, and ΔQ values, the data wereexported as text files and imported into Excel (Micro-soft, Redmond, WA) using a custom macro.
Statistical analysisA sample size of 10 in each group was calculated to have80% power to detect a difference in means of 1.69 ac-cording to our pilot study results. This assumes that thegroup 1 standard deviation is 6.72 and the group 2standard deviation is 7.35 using a two-group Sat-terthwaite t test with a 0.05 two-sided significance level.Statistical analysis was performed with SPSS software,
version 21.0 (SPSS Inc., Chicago, IL, USA). A Shapiro-Wilk test was performed to assess the distribution of data.As the data were normally distributed, one-way ANOVAwas conducted to analyze possible differences between thegroups at the same time points and the differences be-tween the time points. The mean difference in ΔF, ΔFmax, area, and ΔQ, observed in different time pointswithin each group, was analyzed using one-way ANOVA,followed by Tukey’s post hoc test. Statistical significancewas established at p < 0.05.
ResultsThe mean ΔF, ΔF max, area, and ΔQ, standard devi-ation, and minimum/maximum values of measurementsat baseline, after 7, 14, and 21 days for each group are
presented in Table 2. The baseline parameters (ΔF, ΔFmax, area, and ΔQ) did not differ significantly amongthe 6 groups (p = 0.793, p = 0.538, p = 0.449, and p =0.108, respectively). The changes obtained between timepoints and significant differences between groups at eachtime point are shown in Table 3.
Fluorescence loss (ΔF)The application of the Emdogain resulted in a significantdecrease of the fluorescence loss during the first week (p= 0.001). Following the 14 days, ΔF decreased signifi-cantly in Emdogain, Curodont, and control groups (p =0.021, p = 0.001, p = 0.022, respectively). ΔF value pre-sented a significantly decreasing trend throughout the21 days for all groups except the Duraphat and EnamelPro varnishes. Fluorescence loss was reduced signifi-cantly for Curodont than Emdogain and Clinpro XT be-tween 7th and 14th day (p = 0.002). The changesbetween T2 and T3 days of the Clinpro XT varnish ap-plication were significantly higher than Emdogain, Curo-dont, and Enamel Pro.
Maximum fluorescence loss (ΔF max)Following the application of the products, ΔF max valuepresented a significant decrease in all groups after 21days except for the Duraphat and Enamel Pro varnishesgroups. Highest change obtained between the first andthe second week was in the Curodont group. However,the Clinpro XT varnish application was shown a signifi-cantly higher reduction than Curodont from the secondweek to the 21st day.
Lesion area (area)A distinct decrease in the lesion area was determined inthe control, Curodont, and Clinpro XT groups at theend of the observation period (p = 0.009, p < 0.001, p <0.001, respectively). The Curodont application induced asignificant change in area component even after the 14days (p < 0.001). The Curodont group showed higher le-sion area changes between T1 and T2 in comparison tothe Emdogain, Clinpro XT, and Enamel Pro® groups,whereas Clinpro XT assured the highest reduction fromthe second to the third week of the observation period.
Table 1 Composition of the products according to the manufacturers’ information
Product Manufacturer Chemical composition
Emdogain Straumann, Basel, Switzerland Composed of a mixture of hydrophobic enamel matrix proteins derived from6-month-old porcine tooth buds containing amelogenin, enamelin, tuftelin,amelin, and ameloblastin, in a propylene glycol alginate (PGA).
Curodont Curodont Repair, Credentis AG, Switzerland P11-4 peptide
Duraphat Colgate-Palmolive, New York, NY 5% sodium fluoride varnish (22,600 ppm fluoride)
Clinpro 3 M ESPE, Pymble, New South Wales, Australia 5% sodium fluoride white varnish, tri-calcium phosphate
Enamel Pro Premier Dental Products, PA, USA 5% sodium fluoride varnish, ACP formula
Lena Sezici et al. Progress in Orthodontics (2021) 22:4 Page 4 of 12

Table 2 Intragroup comparisons of QLF scores between timeline intervals
Groups Time intervals Output Minimum Maximum Mean SD P (ΔF) P (ΔF max) P (ΔQ) P (area)
Control T0 ΔF0 14.30 34.50 26.03 A 8.12 0.001 0.007 0.001 0.016
ΔF0 max 27.00 55.00 40.13 A 9.34
ΔQ0 53,670.00 213,802.00 110,111.88 A 51,720.45
Area0 2017.00 6419.00 4263.50 A 1384.97
T1 ΔF1 6.30 29.40 17.70 A 7.11
ΔF1 max 10.00 40.00 28.38 A 10.68
ΔQ1 1220.00 112,055.00 62,244.00 A 39,148.39
ΔArea1 195.00 5028.00 3184.00 A 1551.10
T2 ΔF2 0.00 23.20 13.71 B 8.93
ΔF2 max 0.00 45.00 24.25 A 16.10
ΔQ2 0.00 84,561.00 46,730.75 B 33,183.38
ΔArea2 0.00 5505.00 2612.13 A 1930.73
T3 ΔF3 0.00 19.00 8.36 B 7.68
ΔF3 max 0.00 32.00 15.50 B 14.36
ΔQ3 0.00 64,173.00 22,160.13 B 25,505.00
ΔArea3 0.00 3436.00 1464.63 B 1599.99
Emdogain T0 ΔF0 11.20 24.40 20.00 A 4.64 0.001 0.027 0.005 0.216
ΔF0 max 25.00 36.00 32.38 A 3.66
ΔQ0 1394.00 137,731.00 89,036.00 A 41,904.33
Area0 124.00 6798.00 4290.13 A 2095.13
T1 ΔF1 8.30 15.80 10.66 B 2.53
ΔF1 max 15.00 31.00 20.50 B 5.53
ΔQ1 2503.00 70,911.00 31,330.75 B 22,947.29
ΔArea1 192.00 5262.00 2883.13 B 1700.05
T2 ΔF2 7.40 22.10 13.23 B 5.78
ΔF2 max 13.00 38.00 24.75 A 9.57
ΔQ2 11,680.00 110,764.00 49,656.13 A 41,037.88
ΔArea2 1568.00 5828.00 3288.63 A 1685.34
T3 ΔF3 6.10 16.70 10.89 B 3.86
ΔF3 max 9.00 41.00 21.88 A 10.87
ΔQ3 2253.00 71,179.00 28,932.88 A 25,220.13
ΔArea3 226.00 4274.00 2405.88 A 1693.33
Curodont T0 ΔF0 13.60 36.40 22.93 A 7.63 < 0.001 < 0.001 < 0.001 < 0.001
ΔF0 max 28.00 55.00 38.25 A 8.96
ΔQ0 74,907.00 205,354.00 115,478.38 A 52,158.27
Area0 3907.00 6734.00 5414.38 A 1000.16
T1 ΔF1 8.30 27.50 18.40 A 7.43
ΔF1 max 16.00 43.00 30.88 A 9.20
ΔQ1 17,690.00 163,146.00 88,866.75 A 50,511.48
ΔArea1 2140.00 6054.00 4597.50 A 1286.11
T2 ΔF2 5.60 17.00 10.03 BB 4.45
ΔF2 max 7.00 29.00 16.58 BB 9.31
ΔQ2 67.00 91,812.00 26,772.50 BB 33,943.70
ΔArea2 12.00 5403.00 2174.13 BB 1844.96
Lena Sezici et al. Progress in Orthodontics (2021) 22:4 Page 5 of 12

Table 2 Intragroup comparisons of QLF scores between timeline intervals (Continued)
Groups Time intervals Output Minimum Maximum Mean SD P (ΔF) P (ΔF max) P (ΔQ) P (area)
T3 ΔF3 5.50 15.30 8.54 BB 3.46
ΔF3 max 6.00 29.00 16.75 BB 8.33
ΔQ3 90.00 53,863.00 17,041.88 BB 20,199.98
ΔArea3 16.00 3527.00 1748.75 BB 1326.62
Duraphat T0 ΔF0 6.90 42.30 20.00 A 14.95 0.313 0.641 0.348 0.405
ΔF0 max 11.00 61.00 32.00 A 20.14
ΔQ0 5531.00 282,872.00 95,174.13 A 117,752.60
Area0 749.00 6681.00 3475.25 A 2186.93
T1 ΔF1 7.00 37.30 16.45 A 13.09
ΔF1 max 13.00 60.00 28.88 A 19.25
ΔQ1 8228.00 228,229.00 69,704.63 A 85,594.07
ΔArea1 1177.00 6332.00 3053.50 A 1923.82
T2 ΔF2 6.90 29.00 14.16 A 9.27
ΔF2 max 12.00 55.00 25.13 A 16.69
ΔQ2 1189.00 141,413.00 42,272.00 A 47,123.66
ΔArea2 172.00 4877.00 2360.25 A 1535.93
T3 ΔF3 0.00 23.30 9.23 A 6.62
ΔF3 max 0.00 48.00 20.75 A 16.52
ΔQ3 0.00 124,739.00 27,494.13 A 41,258.29
ΔArea3 0.00 5363.00 1974.13 A 1918.22
Clinpro XT T0 ΔF0 7.70 34.10 21.24 A 10.41 0.002 0.001 0.012 < 0.001
ΔF0 max 13.00 48.00 33.50 A 11.95
ΔQ0 20,036.00 230,424.00 101,547.25 A 74,454.11
Area0 2587.00 6749.00 4223.13 A 1438.53
T1 ΔF1 6.20 30.80 15.04 A 7.70
ΔF1 max 10.00 52.00 29.25 A 14.93
ΔQ1 1255.00 210,619.00 58,227.5 A 66,253.18
ΔArea1 167.00 6831.00 2975.63 A 2070.24
T2 ΔF2 9.00 23.60 17.33 A 4.93
ΔF2 max 19.00 41.00 30.13 A 8.56
ΔQ2 12,163.00 158,883.00 71,085.00 A 44,661.17
ΔArea2 1354.00 6745.00 3785.75 A 1585.04
T3 ΔF3 0.00 8.00 6.16 BB 2.62
ΔF3 max 0.00 17.00 10.63 BBB 5.21
ΔQ3 0.00 10,941.00 4806.00 B 5189.88
ΔArea3 0.00 1390.00 631.75 BBB 651.32
Enamel Pro T0 ΔF0 11.50 38.20 20.79 A 8.19 0.569 0.159 0.450 0.370
ΔF0 max 19.00 53.00 31.88 A 10.60
ΔQ0 39,319.00 197,340.00 88,195.13 A 51,282.32
Area0 3004.00 51,645.00 9850.13 A 16,900.88
T1 ΔF1 6.40 35.50 16.74 A 10.28
ΔF1 max 9.00 57.00 27.00 A 16.07
ΔQ1 1715.00 138,231.00 57,311.88 A 50,640.73
ΔArea1 269.00 4555.00 2766.63 A 1463.68
Lena Sezici et al. Progress in Orthodontics (2021) 22:4 Page 6 of 12
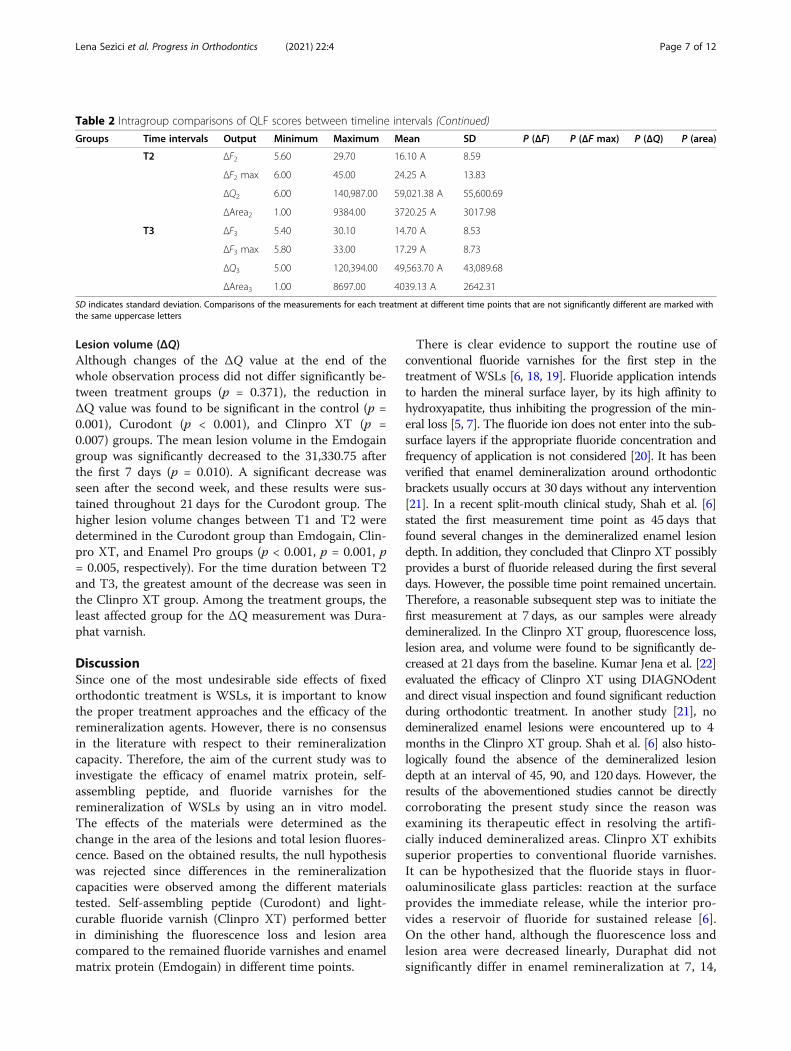
Lesion volume (ΔQ)Although changes of the ΔQ value at the end of thewhole observation process did not differ significantly be-tween treatment groups (p = 0.371), the reduction inΔQ value was found to be significant in the control (p =0.001), Curodont (p < 0.001), and Clinpro XT (p =0.007) groups. The mean lesion volume in the Emdogaingroup was significantly decreased to the 31,330.75 afterthe first 7 days (p = 0.010). A significant decrease wasseen after the second week, and these results were sus-tained throughout 21 days for the Curodont group. Thehigher lesion volume changes between T1 and T2 weredetermined in the Curodont group than Emdogain, Clin-pro XT, and Enamel Pro groups (p < 0.001, p = 0.001, p= 0.005, respectively). For the time duration between T2and T3, the greatest amount of the decrease was seen inthe Clinpro XT group. Among the treatment groups, theleast affected group for the ΔQ measurement was Dura-phat varnish.
DiscussionSince one of the most undesirable side effects of fixedorthodontic treatment is WSLs, it is important to knowthe proper treatment approaches and the efficacy of theremineralization agents. However, there is no consensusin the literature with respect to their remineralizationcapacity. Therefore, the aim of the current study was toinvestigate the efficacy of enamel matrix protein, self-assembling peptide, and fluoride varnishes for theremineralization of WSLs by using an in vitro model.The effects of the materials were determined as thechange in the area of the lesions and total lesion fluores-cence. Based on the obtained results, the null hypothesiswas rejected since differences in the remineralizationcapacities were observed among the different materialstested. Self-assembling peptide (Curodont) and light-curable fluoride varnish (Clinpro XT) performed betterin diminishing the fluorescence loss and lesion areacompared to the remained fluoride varnishes and enamelmatrix protein (Emdogain) in different time points.
There is clear evidence to support the routine use ofconventional fluoride varnishes for the first step in thetreatment of WSLs [6, 18, 19]. Fluoride application intendsto harden the mineral surface layer, by its high affinity tohydroxyapatite, thus inhibiting the progression of the min-eral loss [5, 7]. The fluoride ion does not enter into the sub-surface layers if the appropriate fluoride concentration andfrequency of application is not considered [20]. It has beenverified that enamel demineralization around orthodonticbrackets usually occurs at 30 days without any intervention[21]. In a recent split-mouth clinical study, Shah et al. [6]stated the first measurement time point as 45 days thatfound several changes in the demineralized enamel lesiondepth. In addition, they concluded that Clinpro XT possiblyprovides a burst of fluoride released during the first severaldays. However, the possible time point remained uncertain.Therefore, a reasonable subsequent step was to initiate thefirst measurement at 7 days, as our samples were alreadydemineralized. In the Clinpro XT group, fluorescence loss,lesion area, and volume were found to be significantly de-creased at 21 days from the baseline. Kumar Jena et al. [22]evaluated the efficacy of Clinpro XT using DIAGNOdentand direct visual inspection and found significant reductionduring orthodontic treatment. In another study [21], nodemineralized enamel lesions were encountered up to 4months in the Clinpro XT group. Shah et al. [6] also histo-logically found the absence of the demineralized lesiondepth at an interval of 45, 90, and 120 days. However, theresults of the abovementioned studies cannot be directlycorroborating the present study since the reason wasexamining its therapeutic effect in resolving the artifi-cially induced demineralized areas. Clinpro XT exhibitssuperior properties to conventional fluoride varnishes.It can be hypothesized that the fluoride stays in fluor-oaluminosilicate glass particles: reaction at the surfaceprovides the immediate release, while the interior pro-vides a reservoir of fluoride for sustained release [6].On the other hand, although the fluorescence loss andlesion area were decreased linearly, Duraphat did notsignificantly differ in enamel remineralization at 7, 14,
Table 2 Intragroup comparisons of QLF scores between timeline intervals (Continued)
Groups Time intervals Output Minimum Maximum Mean SD P (ΔF) P (ΔF max) P (ΔQ) P (area)
T2 ΔF2 5.60 29.70 16.10 A 8.59
ΔF2 max 6.00 45.00 24.25 A 13.83
ΔQ2 6.00 140,987.00 59,021.38 A 55,600.69
ΔArea2 1.00 9384.00 3720.25 A 3017.98
T3 ΔF3 5.40 30.10 14.70 A 8.53
ΔF3 max 5.80 33.00 17.29 A 8.73
ΔQ3 5.00 120,394.00 49,563.70 A 43,089.68
ΔArea3 1.00 8697.00 4039.13 A 2642.31
SD indicates standard deviation. Comparisons of the measurements for each treatment at different time points that are not significantly different are marked withthe same uppercase letters
Lena Sezici et al. Progress in Orthodontics (2021) 22:4 Page 7 of 12

Table 3 Intergroup comparisons of the QLF measurements’ changes between different time points
Time periods Group Output Minimum Maximum Mean SD P (ΔF) P (ΔF max) P (ΔQ) P (area)
T1-T0 Control ΔF − 17.00 − 1.10 − 8.33 A 5.69 0.207 0.205 0.348 0.386
ΔF max − 22.00 − 2.00 − 11.75 A 7.34
ΔQ − 101,747.00 − 13,521.00 − 47,867.88 A 37,369.17
Area − 4157.00 1250.00 − 1079.50 A 1588.22
Emdogain ΔF − 14.60 1.80 − 9.34 A 5.30
ΔF max − 18.00 6.00 − 11.88 A 7.83
ΔQ − 86,808.00 1109.00 − 57,705.25 A 29,299.65
Area − 5064.00 68.00 − 1407.00 A 1600.74
Curodont ΔF − 9.50 − 1.60 − 4.53 A 2.59
ΔF max − 14.00 − 2.00 − 7.38 A 4.07
ΔQ − 57,217.00 − 10,041.00 − 26,611.63 A 16,529.55
Area − 3349.00 405.00 − 816.88 A 1159.37
Duraphat ΔF − 16.50 7.90 − 3.55 A 7.51
ΔF max − 21.00 18.00 − 3.13 A 12.76
ΔQ − 109,326.00 47,995.00 − 25,469.50 A 50,026.95
Area − 2254.00 1468.00 − 421.75 A 1415.32
Clinpro XT ΔF − 15.70 − 0.10 − 6.20 A 6.09
ΔF max − 23.00 10.00 − 4.25 A 9.95
ΔQ − 104,528.00 − 9011.00 − 43,319.75 A 38,896.37
Area − 2450.00 82.00 − 1247.50 A 900.27
Enamel Pro ΔF − 12.70 0.00 − 4.05 A 4.56
ΔF max − 18.00 4.00 − 4.88 A 8.41
ΔQ − 59,109.00 − 1659.00 − 30,883.25 A 22,864.84
Area − 47,753.00 − 45.00 − 7083.50 A 16,470.76
T2-T1 Control ΔF − 11.30 4.30 − 3.99 A 4.98 0.001 0.001 < 0.001 0.001
ΔF max − 18.00 5.00 − 4.13 A 7.22
ΔQ − 47,304.00 12,798.00 − 15,513.25 A 20,137.28
Area − 4184.00 477.00 − 571.88 A 1496.28
Emdogain ΔF − 7.30 12.30 2.56 A 7.00
ΔF max − 12.00 19.00 4.25 A 9.68
ΔQ − 48,086.00 76,082.00 18,325.38 A 42,654.17
Area − 1797.00 2886.00 405.50 A 1723.90
Curodont ΔF − 14.40 0.90 − 8.38 B 4.78
ΔF max − 24.40 1.00 − 14.30 B 8.42
ΔQ − 97,885.00 6214.00 − 62,094.25 B 30,329.38
Area − 4415.00 453.00 − 2423.38 B 1710.05
Duraphat ΔF − 10.60 0.70 − 2.29 A 4.15
ΔF max − 14.00 1.00 − 3.75 A 4.68
ΔQ − 105,347.00 8796.00 − 27,432.63 A 43,319.05
Area − 2094.00 1039.00 − 693.25 A 946.19
Clinpro XT ΔF − 7.20 9.20 2.29 A 5.73
ΔF max − 12.00 13.00 0.88 AC 10.55
ΔQ − 51,736.00 59,677.00 12,857.50 AC 35,486.55
Area − 1040.00 2812.00 810.13 AC 1284.18
Lena Sezici et al. Progress in Orthodontics (2021) 22:4 Page 8 of 12

Table 3 Intergroup comparisons of the QLF measurements’ changes between different time points (Continued)
Time periods Group Output Minimum Maximum Mean SD P (ΔF) P (ΔF max) P (ΔQ) P (area)
Enamel Pro ΔF − 6.10 5.60 − 0.64 A 4.00
ΔF max − 12.00 4.00 − 2.75 A 5.47
ΔQ − 35,100.00 25,841.00 1709.50 AC 19,359.69
Area − 1507.00 6214.00 953.63 AC 2285.35
T3-T2 Control ΔF − 16.40 3.10 − 5.35 A 6.37 0.007 0.021 0.010 0.003
ΔF max − 26.00 5.00 − 8.75 A 11.04
ΔQ − 84,039.00 9708.00 − 24,570.63 A 29,727.75
Area − 5428.00 0.00 − 1147.50 A 1890.12
Emdogain ΔF − 8.60 8.20 − 2.34 A 6.28
ΔF max − 11.00 26.00 − 2.88 A 12.26
ΔQ − 64,486.00 48,354.00 − 20,723.25 A 37,101.79
Area − 2852.00 1594.00 − 882.75 A 1534.34
Curodont ΔF − 7.00 9.70 − 1.49 A 5.06
ΔF max − 11.00 21.00 0.18 A 10.23
ΔQ − 56,413.00 53,796.00 − 9730.63 A 32,246.90
Area − 2577.00 3507.00 − 425.38 A 1849.69
Duraphat ΔF − 15.80 1.10 − 4.94 A 5.53
ΔF max − 18.00 28.00 − 4.38 A 14.74
ΔQ − 56,593.00 14,038.00 − 14,777.88 AC 21,291.83
Area − 1648.00 1316.00 − 386.13 AC 1032.35
Clinpro XT ΔF − 17.90 − 1.30 − 11.16 B 6.13
ΔF max − 34.00 − 2.00 − 19.50 B 11.03
ΔQ − 158,393.00 − 1495.00 − 66,279.00 B 48,597.85
Area − 6660.00 36.00 − 3154.00 B 2081.90
Enamel Pro ΔF − 4.90 0.70 − 1.40 AC 1.89
ΔF max − 14.70 3.80 − 6.96 A 6.02
ΔQ − 44,949.00 1899.00 − 9457.68 AC 16,258.16
Area − 687.00 2343.00 318.88 AC 986.34
T3-T0 Control ΔF − 26.50 − 10.70 − 17.66 A 4.91 0.053 0.120 0.371 0.847
ΔF max − 34.00 − 11.00 − 24.63 A 8.81
ΔQ − 213,280.00 − 3485.00 − 87,951.75 A 60,618.08
Area − 6342.00 1358.00 − 2798.88 A 2607.69
Emdogain ΔF − 14.50 3.10 − 9.1125 A 5.80429
ΔF max − 25.00 7.00 − 10.5000 A 11.52637
ΔQ − 98,877.00 1832.00 − 60,103.1250 A 34,929.37284
Area − 4277.00 428.00 − 1884.2500 A 1812.62318
Curodont ΔF − 26.40 − 5.80 − 14.39 A 6.94
ΔF max − 37.00 − 5.00 − 21.50 A 10.94
ΔQ − 169,955.00 − 28,410.00 − 98,436.50 A 46,423.11
Area − 5503.00 − 388.00 − 3665.63 A 1822.66
Duraphat ΔF − 31.40 1.40 − 10.78 A 11.42
ΔF max − 39.00 30.00 − 11.25 A 21.42
ΔQ − 271,266.00 25,531.00 − 67,680.00 A 100,288.28
Area − 5620.00 2783.00 − 1501.13 A 2627.37
Lena Sezici et al. Progress in Orthodontics (2021) 22:4 Page 9 of 12
and 21 days from the baseline. Since this result alsosupports previous researches [6, 23] that showed thelow remineralization potential of the Duraphat varnishfor the longer duration, conventional fluoride varnishcan be recommended to be applied more frequently.The results of the present study also revealed that En-amel Pro Varnish had insufficient effects among thestudied materials in treating the WSLs. Enamel ProVarnish is another 5% sodium fluoride varnish thatadditionally contains amorphous calcium phosphate(ACP) formula [24]. These findings were attributed tothe formation of ACP crystals and apatite on enamelsurface.The changes in the samples of the control group from
baseline to day 21 suggest that some naturalremineralization of WSLs occurred. Previous studies [23,25] determined that the artificial saliva solution, which isfrequently used as a negative control group in in vitrostudies, displayed remineralizing potential for WSLs.Therefore, the decrease in fluorescence loss and lesionarea can be contributed to the daily renewal of the artifi-cial saliva at pH range between 6.5 and 6.8 throughoutthe whole present trial. However, it should be kept inmind that the remineralization was limited, and somespecimens in the control group had no naturalremineralization.As expected, following the 14 days of the self-
assembling peptide P11-4 (Curodont) application, a sig-nificant decrease was seen in ΔF, ΔF max, area, and ΔQof the WSLs. The Curodont group showed higher QLFmeasurement changes between the first and secondweek in comparison to the Emdogain and Clinpro XTgroups. Previous studies [8, 11, 23] comparing theremineralization activities of fluoride-containing agentsalso suggest Curodont as it represents the superior effi-cacy. In the two different in vitro studies [23, 26], self-assembling peptide P11-4 resulted a significant change inthe fluorescence values at the 7th day, and an in vivostudy carried out by Brunton et al. [27] showed similarfindings of the remineralization in the lesion area from
the 8th day. The mechanism of the self-assembling pep-tide P11-4 for the treatment of WSLs can be explained bythe formation of de novo hydroxyapatite crystals. Sincethese structures are formed in a tangential form aroundthe matrix fibers, a more “fan-type” structure is expected[7, 28]. However, the opacity of the natural enamel origi-nates from the prismatic structure of the crystals; there-fore, the entire fading of the WSLs cannot be expectedfollowing Curodont application.Another notable result was that significant differences
in fluorescence loss between baseline and the end of theobservation period were found in samples on whichEmdogain was applied. Although Emdogain, comprisingenamel matrix proteins, has been used widely in dentis-try [10, 11], up to date, there are a few studies [11–14]undertaken the direct application of Emdogain to evalu-ate the efficacy of remineralization stimulation potentialof initial enamel caries. The results of the present studyare quite similar to that of Schmidlin et al. [11] in whichthe application of enamel matrix proteins on artificialcarious lesions seen to improve the re-hardening of thelesions, even in deeper layers. Together these findingssuggest that Emdogain may promote remineralization ofinitial enamel carious lesions. This is consistent with aprevious study [14] that confirmed the regeneration ofthe enamel prism-like tissue with the presence of Emdo-gain. Researchers attributed this effect to the molecularmechanisms of the product that include the preventionof the crystal fusion of premature crystals, the control ofhydroxyapatite crystal morphology and elongation, andthe control of the nucleation and regulation of thegrowth of the crystals in order to form the mineralizedenamel covering the crowns of teeth [13, 14].In this study, samples were acquired from bovine
lower incisors in order to facilitate homogenous alloca-tion of specimens from the same crown to the six testgroups. Although human and bovine enamel are notidentical in genetic and environmental features [29], ithas been stated that bovine enamel could be in a bettercondition with a more uniform composition, particularly
Table 3 Intergroup comparisons of the QLF measurements’ changes between different time points (Continued)
Time periods Group Output Minimum Maximum Mean SD P (ΔF) P (ΔF max) P (ΔQ) P (area)
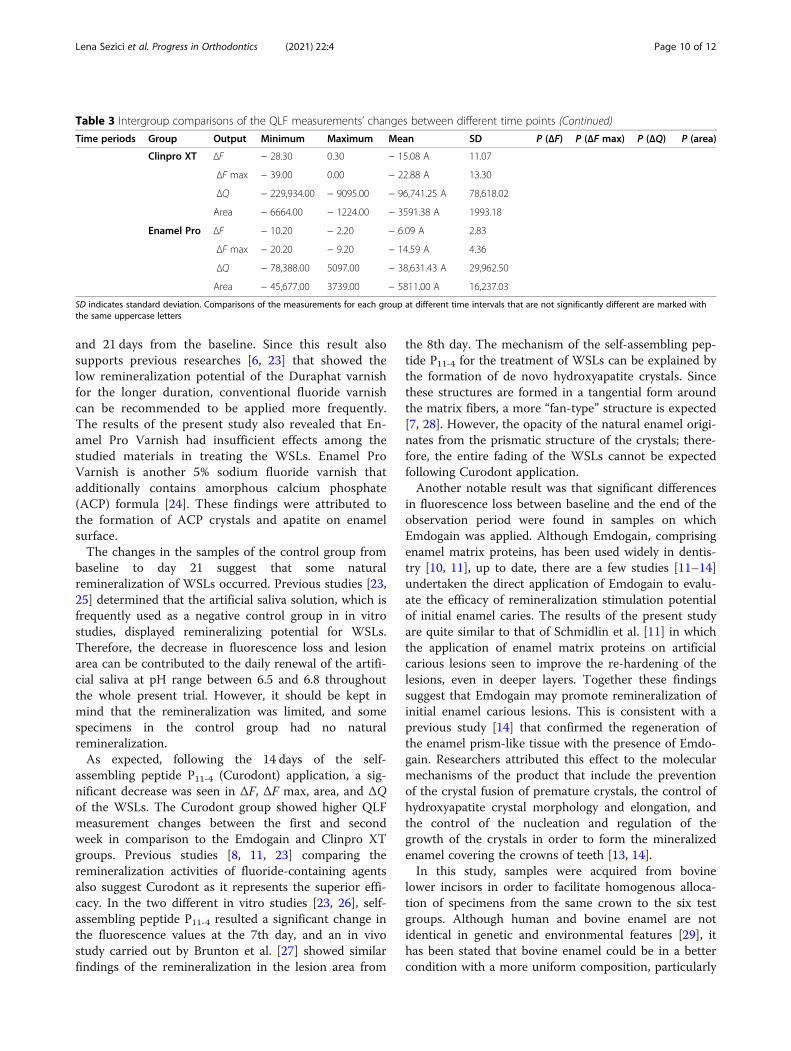
Clinpro XT ΔF − 28.30 0.30 − 15.08 A 11.07
ΔF max − 39.00 0.00 − 22.88 A 13.30
ΔQ − 229,934.00 − 9095.00 − 96,741.25 A 78,618.02
Area − 6664.00 − 1224.00 − 3591.38 A 1993.18
Enamel Pro ΔF − 10.20 − 2.20 − 6.09 A 2.83
ΔF max − 20.20 − 9.20 − 14.59 A 4.36
ΔQ − 78,388.00 5097.00 − 38,631.43 A 29,962.50
Area − 45,677.00 3739.00 − 5811.00 A 16,237.03
SD indicates standard deviation. Comparisons of the measurements for each group at different time intervals that are not significantly different are marked withthe same uppercase letters
Lena Sezici et al. Progress in Orthodontics (2021) 22:4 Page 10 of 12

when a large crown size for preparing more samplesfrom the same tooth was necessary [30]. Artificial carieslesions occurred rapidly in bovine enamel in comparisonto the human teeth, even the mineral distributions oftheir lesions were almost equivalent [11, 31]. Since theresults were only used for the interpretation of the com-parison within the different groups of the present studyand the changes within the same sample in differenttime points, we considered that the advantages of prefer-ring bovine teeth will be acceptable.The QLF-D is based on the same principle but with an
enhanced light source and filter system compared withthe traditional QLF method [32]. All specimens weredried and the images were captured with standardizedsettings. By using QLF-D, an in vitro standard was devel-oped to capture the images in the same position andfrom the same angle. Unfortunately, the researcher incharge of product application knew which agent was ap-plied. However, the examiners who conducted the im-aging acquisition and the analysis of the images wereblinded to the intervention allocation.The results of this study revealed significant differ-
ences between initial and 21th days of QLF measure-ments in all groups except conventional fluoridevarnishes. Although the present study did not mimic theexact real-life settings, the results have the potential toprovide useful information on the remineralization ef-fectiveness of different varnishes. Further in vivo studieswould be beneficial to verify the treatment efficacy ofdifferent fluoride varnishes, enamel matrix protein, andself-assembling peptide on WSLs during or after ortho-dontic treatment.
ConclusionsWithin the limitations of this study, the following couldbe concluded:
– The null hypothesis was rejected. A significantregain in fluorescence was observed in all studiedmaterials except the Duraphat and Enamel Profluoride varnishes. With respect to the reduction inlesion area, there were significant differences in thecontrol, Curodont, and Clinpro XT groups at theend of the observation period.
– The fluorescence gain in the self-assembling peptide(Curodont) group was significantly higher comparedto Emdogain and Clinpro XT between the first andsecond week of application. After 14 days, ClinproXT varnish had the highest potential to decreasefluorescence loss and lesion area. It may be advisableto use combined of self-assembling peptides andlight-curable fluoride varnish with prolonged dur-ation of treatment period to increase the effect.
AbbreviationsWSLs: White spot lesions; QLF: Quantitative light-induced fluorescence;ΔF: Fluorescence loss; ΔQ: Lesion volume
AcknowledgementsNot applicable
Authors’ contributionsYLS carried out the data analysis and manuscript editing. EY and AAYparticipated in the laboratorial data acquisition and manuscript correction.EY, AAY, and EE participated in the manuscript correction. EE and REparticipated in the design of the study and manuscript correction. Allauthors read and approved the final manuscript.
FundingThe authors declared that this study has received no funding.
Availability of data and materialsThe datasets used and/or analyzed during the current study are availablefrom the corresponding author on reasonable request.
Ethics approval and consent to participateThe ethical approval of this study was waived as mentioned in themanuscript by the Institutional Animal Care and Use Committee.
Consent for publicationNot applicable.
Competing interestsThe authors declare that they have no competing interests.
Author details1Private Practice, Izmir, Turkey. 2Department of Orthodontics, Faculty ofDentistry, Ege University, Izmir, Turkey. 3Department of Pedodontics, Facultyof Dentistry, Ege University, Izmir, Turkey. 4Clinic for Orthodontics andPediatric Dentistry, University of Zurich, Zurich, Switzerland.
Received: 23 August 2020 Accepted: 2 December 2020
References1. Richter AE, Arruda AO, Peters MC, Sohn W. Incidence of caries lesions
among patients treated with comprehensive orthodontics. Am J OrthodDentofacial Orthop. 2011;139:657–64.
2. Tufekci E, Dixon JS, Gunsolley JC, Lindauer SJ. Prevalence of white spotlesions during orthodontic treatment with fixed appliances. Angle Orthod.2011;81:206–10.
3. Abufarwa M, Noureldin A, Campbell PM, Buschang PH. The longevity ofcasein phosphopeptide-amorphous calcium phosphate fluoride varnish’spreventative effects: assessment of white spot lesion formation. AngleOrthod. 2019;89:10–5.
4. Bergstrand F, Twetman S. A review on prevention and treatment of post-orthodontic white spot lesions - evidence-based methods and emergingtechnologies. Open Dent J. 2011;5:158–62.
5. Gao SS, Zhang S, Mei ML, Lo EC, Chu CH. Caries remineralisation andarresting effect in children by professionally applied fluoride treatment - asystematic review. BMC Oral Health. 2016;16:12.
6. Shah M, Paramshivam G, Mehta A, et al. Comparative assessment ofconventional and light-curable fluoride varnish in the prevention of enameldemineralization during fixed appliance therapy: a split-mouth randomizedcontrolled trial. Eur J Orthod. 2018;40:132–9.
7. Bröseler F, Tietmann C, Bommer C, Drechsel T, Heinzel-Gutenbrunner M,Jepsen S. Randomised clinical trial investigating self-assembling peptideP11-4 in the treatment of early caries. Clin Oral Investig. 2020;24:123–32.
8. Alkilzy M, Santamaria RM, Schmoeckel J, Splieth CH. Treatment of cariouslesions using self-assembling peptides. Adv Dent Res. 2018;29:42–7.
9. Soares R, De Ataide IN, Fernandes M, Lambor R. Assessment of enamelremineralisation after treatment with four different remineralisingagents: a scanning electron microscopy (SEM) study. J Clin Diagn Res.2017;11:ZC136–41.
Lena Sezici et al. Progress in Orthodontics (2021) 22:4 Page 11 of 12
10. Grandin HM, Gemperli AC, Dard M. Enamel matrix derivative: a review ofcellular effects in vitro and a model of molecular arrangement andfunctioning. Tissue Eng Part B Rev. 2012;18:181–202.
11. Schmidlin P, Zobrist K, Attin T, Wegehaupt F. In vitro re-hardening ofartificial enamel caries lesions using enamel matrix proteins or self-assembling peptides. J Appl Oral Sci. 2016;24:31–6.
12. Bächli K, Schmidlin PR, Wegehaupt F, Paqué F, Ramenzoni L, Botter S.Remineralization of artificial dentin caries using dentin and enamel matrixproteins. Materials (Basel). 2019;12:2116.
13. Xiang C, Ran J, Yang Q, Li W, Zhou X, Zhang L. Effects of enamel matrixderivative on remineralisation of initial enamel carious lesions in vitro. ArchOral Biol. 2013;58:362–9.
14. Cao Y, Mei ML, Li QL, Lo EC, Chu CH. Enamel prism-like tissue regenerationusing enamel matrix derivative. J Dent. 2014;42:1535–42.
15. Buskes JA, Christoffersen J, Arends J. Lesion formation and lesionremineralization in enamel under constant composition conditions. A newtechnique with applications. Caries Res. 1985;19:490–6.
16. Klimek J, Hellwig E, Ahrens G. Fluoride taken up by plaque, by theunderlying enamel and by clean enamel from three fluoride compoundsin vitro. Caries Res. 1982;16:156–61.
17. de Josselin de Jong E, Sundström F, Westerling H, Tranaeus S, ten Bosch JJ,Angmar-Månsson B. A new method for in vivo quantification of changes ininitial enamel caries with laser fluorescence. Caries Res. 1995;29:2–7.
18. Øgaard B, Larsson E, Henriksson T, Birkhed D, Bishara SE. Effects ofcombined application of antimicrobial and fluoride varnishes in orthodonticpatients. Am J Orthod Dentofacial Orthop. 2001;120:28–35.
19. Benson PE, Parkin N, Dyer F, Millett DT, Furness S, Germain P. Fluorides forthe prevention of early tooth decay (demineralised white lesions) duringfixed brace treatment. Cochrane Database Syst Rev. 2013;12:CD003809.
20. He T, Li X, Dong Y, et al. Comparative assessment of fluoride varnish andfluoride film for remineralization of postorthodontic white spot lesions inadolescents and adults over a 6-month period: a single-center, randomizedcontrolled clinical trial. Am J Orthod Dentofacial Orthop. 2016;149:810–9.
21. Mehta A, Paramshivam G, Chugh VK, Singh S, Halkai S, Kumar S. Effect oflight-curable fluoride varnish on enamel demineralization adjacent toorthodontic brackets: an in-vivo study. Am J Orthod Dentofacial Orthop.2015;148:814–20.
22. Kumar Jena A, Pal Singh S, Kumar Utreja A. Efficacy of resin-modified glassionomer cement varnish in the prevention of white spot lesions duringcomprehensive orthodontic treatment: a split-mouth study. J Orthod. 2015;42:200–7.
23. Üstün N, Aktören O. Analysis of efficacy of the self-assembling peptide-based remineralization agent on artificial enamel lesions. Microsc Res Tech.2019;82:1065–72.
24. Msallam FA, Grawish ME, Hafez AM, Abdelnaby YL. Decalcificationprevention around orthodontic brackets bonded to bleached enamel usingdifferent topical agents. Prog Orthod. 2017;18:15.
25. Ionta FQ, Mendonça FL, de Oliveira GC, et al. In vitro assessment of artificial salivaformulations on initial enamel erosion remineralization. J Dent. 2014;42:175–9.
26. Savas S, Kucukyilmaz E, Celik EU. Effects of remineralization agents onartificial carious lesions. Pediatr Dent. 2016;38:511–8.
27. Brunton PA, Davies RP, Burke JL, et al. Treatment of early caries lesionsusing biomimetic self-assembling peptides--a clinical safety trial. Br Dent J.2013;215:E6.
28. Kirkham J, Firth A, Vernals D, et al. Self-assembling peptide scaffoldspromote enamel remineralization. J Dent Res. 2007;86:426–30.
29. Laurance-Young P, Bozec L, Gracia L, et al. A review of the structure ofhuman and bovine dental hard tissues and their physicochemical behaviourin relation to erosive challenge and remineralisation. J Dent. 2011;39:266–72.
30. Yassen GH, Platt JA, Hara AT. Bovine teeth as substitute for human teeth indental research: a review of literature. J Oral Sci. 2011;53:273–82.
31. Lippert F, Lynch RJ. Comparison of Knoop and Vickers surface microhardnessand transverse microradiography for the study of early caries lesion formationin human and bovine enamel. Arch Oral Biol. 2014;59:704–10.
32. Min JH, Inaba D, Kim BI. Evaluation of resin infiltration using quantitativelight-induced fluorescence technology. Photodiagnosis Photodyn Ther.2016;15:6–10.
Publisher’s NoteSpringer Nature remains neutral with regard to jurisdictional claims inpublished maps and institutional affiliations.
Lena Sezici et al. Progress in Orthodontics (2021) 22:4 Page 12 of 12