comparative feeding biomechanics and … feeding biomechanics and behavioral ... comparative feeding...
TRANSCRIPT
i
COMPARATIVE FEEDING BIOMECHANICS AND BEHAVIORAL
PERFORMANCE OF FEEDING IN THE FAMILY KOGIIDAE AND
TURSIOPS TRUNCATUS (ODONTOCETI, CETACEA)
A Thesis
by
BRIAN EDWARD BLOODWORTH
Submitted to the Office of Graduate Studies of Texas A&M University
in partial fulfillment of the requirements for the degree of
MASTER OF SCIENCE
May 2006
Major Subject: Wildlife and Fisheries Sciences
ii
COMPARATIVE FEEDING BIOMECHANICS AND BEHAVIORAL
PERFORMANCE OF FEEDING IN THE FAMILY KOGIIDAE AND
TURSIOPS TRUNCATUS (ODONTOCETI, CETACEA)
A Thesis
by
BRIAN EDWARD BLOODWORTH
Submitted to the Office of Graduate Studies of Texas A&M University
in partial fulfillment of the requirements for the degree of
MASTER OF SCIENCE
Approved by: Chair of Committee, Christopher D. Marshall Committee Members, Daniel F. Cowan Markus Horning Jane M. Packard Raymond J. Tarpley Head of Department, Robert D. Brown
May 2006
Major Subject: Wildlife and Fisheries Sciences
iii
ABSTRACT
Comparative Feeding Biomechanics and Behavioral Performance of Feeding in
the Family Kogiidae and Tursiops truncatus (Odontoceti, Cetacea). (May 2006)
Brian Edward Bloodworth, B.S., Texas A&M University at Galveston
Chair of Advisory Committee: Dr. Christopher D. Marshall
Hyolingual biomechanics and kinematics in three species of two odontocete
genera were investigated to compare adaptations and performance of divergent
feeding strategies. Ram and suction feeding are two ends of a continuous
spectrum that is poorly-studied in odontocetes. Comparative anatomy identified
characters associated with feeding patterns of morphologically dissimilar and
evolutionary distant genera. Hyolingual investigations included measurements of
hyolingual muscle vectors and hyoid surface area/robustness. ANOVA’s
revealed Kogia basihyal and thyrohyal surface areas were significantly greater
than T. truncatus. However, most predicted muscle tension values were not
significantly different between genera. The presence of lateral gape occlusions,
broad basihyal and thyrohyals near the caudal oral cavity, and a broad, short
tongue were likely responsible for Kogia’s effective suction mechanism. These
features were absent, or reduced, in T. truncatus.
The feeding kinematics of dwarf and pygmy sperm whales (Kogia sima and
K. breviceps), and bottlenose dolphins (Tursiops truncatus) were characterized
iv
and compared incorporating the Ram-Suction Index (RSI). Mean RSI data
support a suction feeding strategy for the phylogenetically basal Kogia (-0.67;
S.D.±0.29) and a ram feeding strategy for the more-derived Tursiops (0.94;
S.D.±0.11). Tursiops displayed two ram-based feeding behaviors, closed gape
approach, where gape increased near food items, and open gape approach,
where gape was at least 50% of maximum in the first video field. Four feeding
phases were identified in both odontocetes: preparatory, jaw opening, gular
depression, and jaw closing. The mean Kogia feeding cycle duration (470 ms;
S.D.±139) was significantly shorter (P<0.003) than all Tursiops groups (pooled:
863 ms; S.D.±337, closed gape approach: 662 ms; S.D.±207, open gape
approach: 1211 ms; S.D.±207). Kogia mean maximum gape angle (39.8˚;
S.D.±18.9), mean maximum opening, and closing gape angle velocities (293˚/s;
S.D.±261 and 223˚/s; S.D.±121, respectively) were significantly greater
(P<0.005) than pooled Tursiops mean maximum gape angle (24.8˚; S.D.±6.6),
mean maximum opening and closing gape angle velocities (84˚/s; S.D.±56 and
120˚/s; S.D.±54, respectively). Negative Kogia RSI values were correlated with
increasing maximum hyoid depression and retraction, wide gape angle, and
rapid opening gape velocity. Kinematic data support functional hypotheses that
odontocetes generate suction by rapid depression of the hyoid and tongue.

v
ACKNOWLEDGEMENTS
I thank several individuals and organizations for their assistance in the
studies conducted. My committee chair and advisor, Dr. Christopher D. Marshall
provided me with the opportunities to conduct this research. My committee
members, Daniel Cowan, Jane Packard, Markus Horning, and Raymond Tarpley
were also invaluable in their constructive critique of these studies. I thank Nélio
Barros, Petra and David Cunningham-Smith, Charles Manire, and the volunteer
staff of Mote Marine Laboratory and the Dolphin and Whale Hospital in
Sarasota, Florida. Without their assistance in all aspects of these studies, this
thesis would not have been possible. Daniel Cowan and the staff and
volunteers of the Texas Marine Mammal Stranding Network were likewise
instrumental in providing specimens for the anatomical portion of this thesis.
Dudley Wigdahl and the zoological staff of SeaWorld of Texas also provided
essential opportunities for videography of bottlenose dolphins. I acknowledge
the Southeast United States Stranding Network of the National Marine Fisheries
Service for the opportunity to conduct this research. Funding was provided by
the Texas Institute of Oceanography, Department of Marine Biology at Texas
A&M University at Galveston, Texas A&M University Regents Fellowship to BEB
and the Erma Lee and Luke Mooney Graduate Travel Grant.

vi
I sincerely thank my loving wife Michelle, without whose support this
project may not have reached fruition. My mom and dad, Janice and Kenneth,
were both critical in helping me complete this degree.
vii
TABLE OF CONTENTS
Page
ABSTRACT……………………………………………………………………… iii
ACKNOWLEDGEMENTS…….………………………………………………… v
TABLE OF CONTENTS…….………………………………………………….. vii
LIST OF FIGURES……………………………………………………………… x
LIST OF TABLES….……………………………………………………………. xii
CHAPTER I INTRODUCTION……………………………………………………….. 1
1.1 Statement of Problem....………………………………….. 1 1.2 Kogia Life History……..……..………………………….… 3
1.2.1 Morphology..……………………………………. 3 1.2.2 Abundance and Diet…………………………… 4
1.2.3 Distribution..………...…………………………. . 5 1.2.4 Kogia in Captivity………..…...…………..…… 6
1.3 Tursiops truncatus Life History………………………..…. 7 1.4 Feeding Kinematics, Behavior and Anatomy..…………. 8 1.5 Specific Aims......……..………………………….……. …. 11
II MATERIALS AND METHODS……………………………………… 13
2.1 Hyolingual Anatomy……………………………….……… 13
2.1.1 Specific Aim 1……...………………….……… 13 2.1.2 Salvage Collection……..…………….……… 14 2.1.3 Hyolingual Myology………………….……… 15 2.1.4 Muscle Characterization……..…...………… 16
2.1.5 Hyoid Osteology……..……………….……… 18 2.1.6 Statistical Analyses…..………..……...…..… 18
2.2 Behavioral Performance……...……….………….….…… 19 2.2.1 Specific Aim 2………………………………… 19
viii
CHAPTER Page
2.2.2 Subjects…………...…………………………… 19 2.2.3 Feeding Trials……...………………………..… 20
2.2.4 Kinematic Variables and Analyses……..…... 23 2.2.5 Statistics…………………..……...………….... 25
III RESULTS…………………………………………...…………….….. 26
3.1 Kogia Hyolingual Osteology…………....……………….. 26 3.2 Tursiops truncatus Hyolingual Osteology…...…...…….. 34 3.3 Comparative Hyoid Osteology…...……………………… 36 3.4 Kogia Hyolingual Myology…...……………………..……. 37
3.4.1 Mylohyoideus………………..….………….… 44 3.4.2 Geniohyoideus…………………….………..... 47 3.4.3 Sternohyoideus……………………………..... 47 3.4.4 Thyrohyoideus….…………...…..….…….….. 48 3.4.5 Stylohyoideus…….…..….….….………….... 48
3.4.6 Hyoglossus……………..………….……….... 49 3.4.7 Interhyoideus………...…………….….…….... 49
3.4.8 Genioglossus..……..…….………………...... 50 3.4.9 Styloglossus…..…...…..…..……………..…... 50 3.4.10 Sternothyroideus....….….……..…..……….. 51 3.4.11 Cricothyroideus....…….....……...………….. 51 3.4.12 Orbicularis Oris...…...………...…………….. 51 3.4.13 Buccinator...…………...…..…...……….….. 52 3.4.14 Biomechanical Modeling........………….…. 52
3.5 Tursiops truncatus Hyolingual Myology………………… 56 3.5.1 Mylohyoideus…...…….…...………….……… 56 3.5.2 Geniohyoideus……………………………….. 59 3.5.3 Sternohyoideus………………...……………. 59 3.5.4 Thyrohyoideus...…….…………….…………. 60 3.5.5 Stylohyoideus……………....………...……… 60 3.5.6 Hyoglossus…………….……………...……… 61 3.5.7 Interhyoideus………….……………………… 61 3.5.8 Genioglossus…......….………………………. 62 3.5.9 Styloglossus……...…………….…………….. 62 3.5.10 Sternothyroideus………..…..……………… 63 3.5.11 Cricothyroideus……...…..…………………. 63 3.5.12 Orbicularis Oris…….....……………………. 63 3.5.13 Buccinator……...……......………………….. 64 3.5.14 Biomechanical Modeling……..…………..… 64
3.6 Comparative Hyolingual Myology………………..…...…. 66 3.7 Feeding Behavior……...………..………………………… 67
ix
CHAPTER Page
3.7.1 Kogia Feeding Behavior……….….………… 67 3.7.2 Kogia Feeding Kinematics…….……..……… 68 3.7.3 Tursiops truncatus Feeding Behavior…….… 72 3.7.4 Tursiops truncatus Feeding Kinematics….… 73 3.7.5 Comparative Odontocete Kinematics…….… 74
3.7.5.1 Kogia and pooled T. truncatus….…………….....……… 74
3.7.5.2 Tursiops truncatus Open and Closed Gape Approach Feeding..... 76
IV DISCUSSION………………………………………..………….….… 77
4.1 Biomechanics of Hyolingual Anatomy.….……………… 77 4.2 Implications of Hyolingual
Anatomy to Suction Feeding…………………………….. 80 4.3 Kinematics of Suction-Based Feeding……....…………. 86 4.4 Kinematics of Ram-Based Feeding……...……….…….. 90
V CONCLUSION……………………………………………………..... 93
LITERATURE CITED..………………………………….………………..……… 96
APPENDIX A………………………………………………….………………..… 109
APPENDIX B………………………………………………….……………..…… 110
VITA……………….…………………………………………………………...….. 134
x
LIST OF FIGURES
FIGURE Page
1 Experimental Setup.…………………………………………..……… 21
2 Kinematic Landmarks………………………………………….…….. 23
3 The Hyoid Apparatus of (A.) Canis familiaris (modified from Evans and Christensen, 1979) and (B.) K. breviceps (modified from Reidenberg and Laitman 1994) in Ventral View………………………………………………………. 27
4 Lateral Perspective of the Hyoid in a Representative Retracted Position for (A.) K. breviceps and (B.) T. truncatus….. 29
5 Ventral Views of the Ossified Hyoid Complex Elements from (A.) K. breviceps and (B.) T. truncatus. …………..…………...….. 30
6 Skulls, Mandibles, and Ossified Hyoid Elements of (A.) K. breviceps and (B.) T. truncatus Viewed from the Ventral Aspect..……………..…. ………………..…………….. 31
7 Caudal Musculature Associated with
the Kogia Hyolingual Complex...…………..………………………. 45
8 Ventral View of Rostral Kogia Hyolingual Muscles..……………… 46
9 Lateral View of Kogia Hyolingual Musculature……………………. 46
10 Kogia Biomechanical Model of Hyolingual Muscle Vectors..……………………………………..…. 54
11 Net Tension Vectors of Kogia Hyoid and
Tongue Depressors and Retractors.………………..…...………. 55
12 Ventral View of the Caudal Musculature Associated with the T. truncatus Hyolingual Complex.………...… 57
xi
FIGURE Page
13 Rostral T. truncatus Hyolingual Myology Viewed from
the Ventral Aspect...…………………........………………………… 58
14 Tursiops truncatus Hyolingual Musculature Viewed Laterally...……………………………….……. 58 15 Tursiops truncatus Biomechanical
Model of Hyolingual Muscle Vectors.….……..……………..……. 65 16 Tursiops truncatus Net Hyolingual
Depression and Retraction Vectors..……………………….……….. 66 17 Kogia and T. truncatus Feeding Near the Beginning
of the Observed Feeding Cycle and at Maximum Gape…...……… 69 18 Profiles of Key Kinematic Variables in Kogia and T. truncatus as a Percentage of Total Feeding Cycle Duration: Gape, Gular Depression, Gular Retraction and Prey Distance. …….…….……………………………………………. 71
xii
LIST OF TABLES
TABLE Page
1 Stranding Parameters of Specimens Used in Hyolingual Anatomy Studies…..….………………………… 15
2 Mean Hyoid Osteology Values for K. sima, K. breviceps, Pooled Kogia, and T. truncatus….……………..……… 33 3 Scaled Means of Hyoid Osteology Variables for K. sima, K. breviceps, Pooled Kogia, and T. truncatus at a Standardized Body Length of 227 cm.…..……….. 33 4 Mean Hyolingual Myology Length and Angle Values for K. sima, K. breviceps,
Pooled Kogia, and T. truncatus...…………..……….…………...…… 38
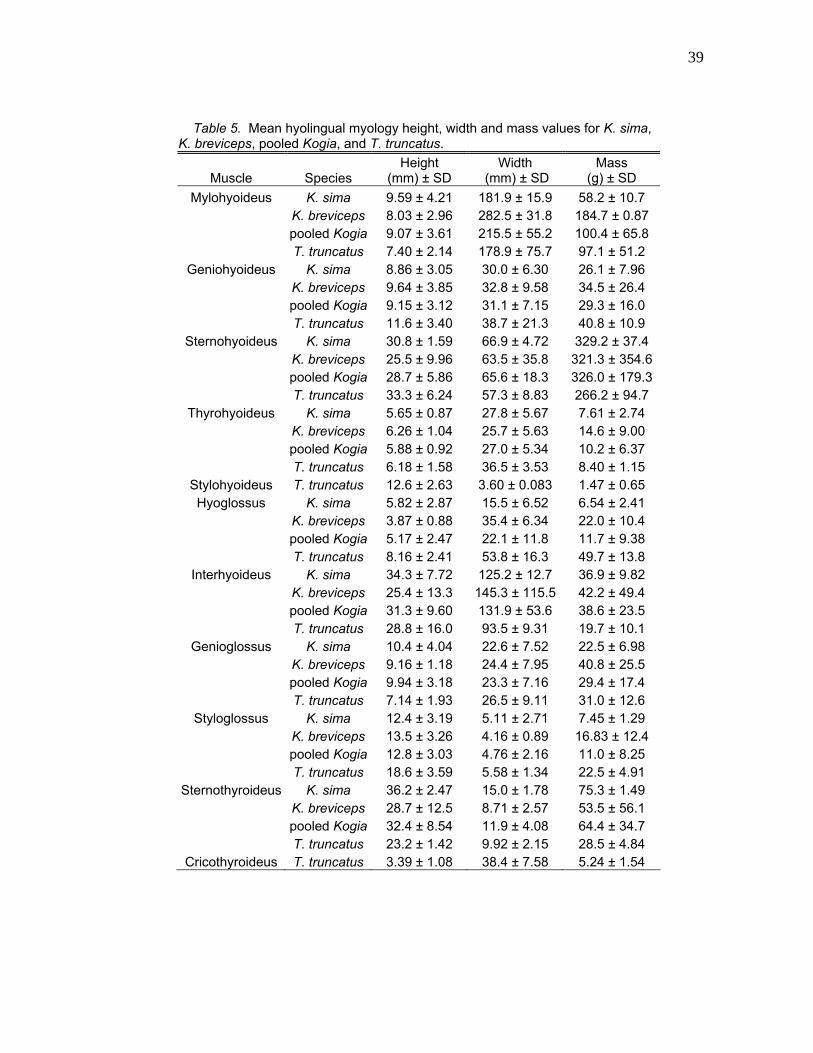
5 Mean Hyolingual Myology Height, Width, and Mass Values for K. sima, K. breviceps, Pooled Kogia, and T. truncatus…..………….………………………. 39
6 Mean Hyolingual Myology Values for Physiological Cross-Sectional Area (PCSA), Physiological Maximum Tetanic Tension (PMTT), Morphological Cross-Sectional Area (MCSA), and Morphological Maximum Tetanic Tension (MMTT) for
K. sima, K. breviceps, Pooled Kogia, and T. truncatus.…………… 40 7 Scaled Means of Hyolingual Myology Length and Angle Variables for K. sima, K. breviceps,
Pooled Kogia, and T. truncatus at a Standardized Body Length of 252 cm..….……………………..….. 41
8 Scaled Means of Hyolingual Myology Height,
Width, and Mass Variables for K. sima, K. breviceps, Pooled Kogia, and T. truncatus at a Standardized Body Length of 252 cm………….……………………………….…... 42

xiii
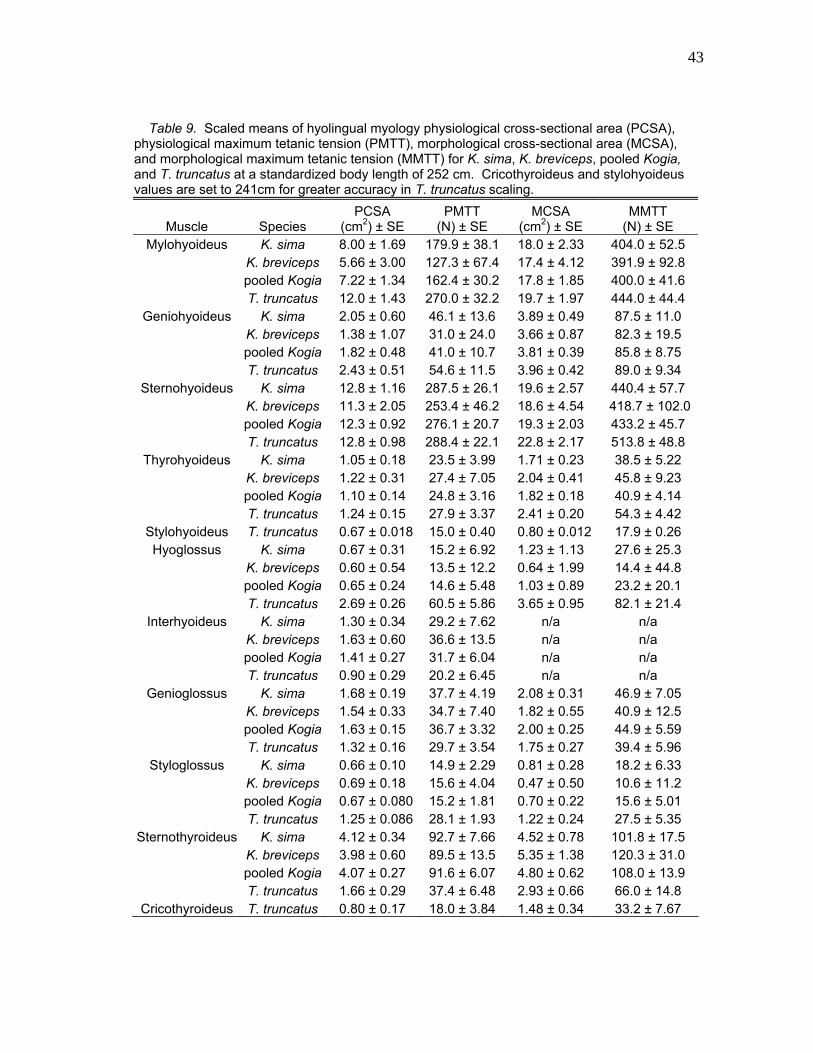
TABLE Page 9 Scaled Means of Hyolingual Myology Physiological Cross-Sectional Area (PCSA), Physiological Maximum Tetanic Tension (PMTT), Morphological Cross-Sectional Area (MCSA), and Morphological Maximum Tetanic Tension (MMTT) for K. sima, K. breviceps, Pooled Kogia, and T. truncatus at a Standardized Body Length of 252 cm…..…..……………..………... 43
10 Summary of Feeding Kinematic Variable Means and Standard Deviations for Kogia, Pooled T. truncatus, T. truncatus Open Gape Approach, and T. truncatus Closed Gape Approach.……....…….…………………. 70 11 Capture Distances and Durations from Onset of Feeding Cycle for Two Kogia Species and Kogia Pooled Data, Pooled T. truncatus, Open Gape Approach (OGA), and T. truncatus Closed Gape Approach (CGA).…..……………..… 75
1
CHAPTER I
INTRODUCTION
1.1 Statement of Problem
Odontocete (toothed whale) feeding behavior has been studied for over 50
years and produced a wealth of information on a variety of predatory aspects.
Such work has focused on diet (e.g., Slijper 1962, Barros and Odell 1990,
Cockcroft and Ross 1990a, Werth 2000b), behavior (e.g., Herman 1980,
Bel’kovich 1991, Wells et al. 1999, Connor et al. 2000, Gannon et al. 2005),
distribution and movement patterns (e.g., Slijper 1962, Kenney 1990, Forcada
2002), and physiology (e.g., Pabst et al. 1999, Clarke 1978, 2003, Stewart
2002). Additionally, the morphological and evolutionary diversity of odontocete
taxa supports widely different feeding strategies (e.g., Berta and Sumich 1999).
However, few studies have addressed the functional morphology or
biomechanics of odontocete feeding to validate functional hypotheses of how
these strategies operate (e.g., Werth 2000b). The goals of this thesis are to
characterize and compare the biomechanical and behavioral aspects of prey
capture in two widely-dissimilar odontocete genera, Kogia (pygmy and dwarf
_______________ This thesis follows the style of Marine Mammal Science.
2
sperm whale) and T. truncatus (bottlenose dolphins). Results will clarify
odontocete feeding strategies in an ecological and evolutionary context.
The feeding strategy of Kogia is of particular interest due to their basal
phylogenetic position within Odontoceti and relatively distant evolutionary
relationship to delphinids (Milinkovitch et al. 1994, Berta and Sumich 1999,
Geisler and Sanders 2003). In addition, Kogia possess characteristics typical of
odontocetes that presumably use suction. The snout is blunt and the mouth is
short, with reduced dentition; few, if any, teeth are present in the maxillae. The
gracile, under slung mandibles contain up to 16 pairs of fang-like teeth (Handley
1966, Ross 1978, Caldwell and Caldwell 1989) that are likely advantageous in
retaining squid in the mouth. As in other potential suction feeding odontocetes,
Kogia are primarily teuthophagous (Pinedo 1987, Klages et al. 1989, Dos
Santos and Haimovici 2001, Wang et al. 2002). The derived oral morphology in
other species would appear to physically restrict the feeding mode to obligatory
suction feeding. For example, male strap-toothed beaked whales (Mesoplodon
layardii) possess single pairs of mandibular teeth that grow over the maxillae
and constrain the jaws beyond a minimal gape that would make ram-based prey
capture difficult (Heyning and Mead, 1996). The throat grooves and enlarged
hyolingual musculature of ziphiids, physeterids, and kogiids are presumably
adaptations for increasing oral volume related to suction feeding (Clarke et al.
1968, Reidenberg and Laitman 1994, Heyning and Mead 1996, Werth 2005).
Robust hyolingual musculature is also present in the short-finned pilot whale

3
(Globicephala melas; Werth 1992, Reidenberg and Laitman 1994), which is the
only odontocete in which a kinematic feeding investigation has validated the use
of suction (Werth 2000a).
1.2 Kogia Life History
1.2.1 Morphology
Kogia is a poorly-known genus most closely related to sperm whales
(Physeter macrocephalus), but separated into its own family (Kogiidae; Rice
1998) based upon cranial morphology (Gill 1871, Schulte 1917, Heyning 1989,
Bianucci and Landini 1999) and genetic distance (Árnason et al. 1993,
Milinkovitch et al. 1994, Ross et al. 2003). Kogiidae is composed of two
morphologically similar species, the dwarf sperm whale (K. sima) and pygmy
sperm whale (K. breviceps). Both species are robustly built, counter-shaded
dark-gray dorsolaterally and cream ventrally, with a light crescent pigmentation
on either lateral meatus termed the “false gill” (Hubbs 1951, Yamada 1954, Hale
1963, Ross 1978). The two species are accurately differentiated by cranial
characters, such as dorsal cranial fossa slope, sagittal septum slope,
condylobasal length, and mandibular symphasis length (Yamada 1954, Handley
1966, Ross 1978, Nagorsen 1985, Huckstadt and Antezana 2001). External
characters, such as dorsal fin height and placement, tooth count, presence of
throat grooves, total body length, melon shape, and eye placement allow for
rapid but less accurate species diagnosis (Yamada 1954, Handley 1966, Ross
1978, Leatherwood and Reeves 1983, Nagorsen 1985, Caldwell and Caldwell
4
1989, Wynne and Schwartz 1999, Huckstadt and Antezana 2001). Although not
recognized as separate species until 1966 (Yamada 1954, Handley 1966), data
from stranded K. sima and K. breviceps have helped clarify Kogia life history.
Kogia sima are born at approximately 1.0 m (Handley 1966, Ross 1978) and
may reach 2.7 m (Handley 1966, Ross 1978) and 280 kg (Leatherwood et al.
1988). Kogia breviceps are generally larger; length at birth averages1.2 m
(Caldwell and Golley 1965, Caldwell et al. 1971b, Ross 1978) and individuals
may reach 4.25 m in length (Caldwell et al. 1971b) and 417 kg (Tomilin 1957).
Sexual maturity is attained at 2.1-2.2 m for both K. sima sexes, while K.
breviceps females become mature at 2.7-2.8 m versus 2.7-3.0 m for males
(Ross 1978). Conception and parturition have been proposed to occur from
autumn to spring for K. breviceps (Caldwell et al. 1971a, b, Ross 1978,
Leatherwood and Reeves 1983, Nagorsen 1985, Leatherwood et al. 1988,
Caldwell and Caldwell 1989, Wynne and Schwartz 1999). However, the paucity
of data on free-ranging Kogia (Baird et al. 1993) leaves this area unresolved and
life expectancy, movement patterns and ecological parameters are virtually
unknown.
1.2.2 Abundance and Diet
Kogia life history is sparsely described primarily due to the genera’s deep-
water distribution, cryptic coloration (Balance and Pitman 1998, Mullin and
Fulling 2004), inconspicuous surface blows (Leatherwood et al. 1988) and long
dive durations (Scott et al. 2001, pers. obs.). Shipboard observations from the
5
eastern tropical Pacific indicate that K. sima remains generally pelagic while K.
breviceps is more-common in continental shelf and slope waters (Robert Pittman
pers. comm.). However, Ross (1978) suggested an inverse occurrence in South
Africa based on proportions of nearshore versus offshore prey in the stomachs
of stranded specimens. In the Gulf of Mexico (GOM), Kogia are present year-
round in water depths of 400-3500 m, but are most-frequently observed in
regions of 400-1000 m (Mullin et al. 1994, Davis et al. 1998, Baumgartner et al.
2001). These areas include locations of frequent upwelling events that
concentrate zooplankton biomass and cephalopod prey along the continental
shelf (Davis et al. 1998). Kogia stomach content analyses support deep-water
cephalopods as the staple diet, with myctophid fishes and shrimps as secondary
prey (Fitch and Brownell 1968, Ross 1978, 1984, Pinedo 1987, Klages et al.
1989, McAlpine et al. 1997, Wang et al. 2002). Stomach contents (Gaskin 1967,
Fitch and Brownell 1968, Nagorsen 1985), hemoglobin oxygen binding capacity
(Lenfant 1969), and long dive durations (Scott and Cordaro 1987, pers. obs.)
support a deep-diving ability in Kogia.
1.2.3 Distribution
Strandings and shipboard sightings confirm a worldwide temperate and
tropical Kogia distribution. Kogia have been reported in the Pacific from Chile
(Sanino and Yaňez 1996) north to Mexico (Vidal et al. 1987) and Canada
(Nagorsen 1985), west through Hawaii (Nitta 1991), Guam (Kami and Lujan
1976), New Caledonia (Sylvestre 1988), Japan (Yamada 1954), and Australia
6
(Hale 1962). In the Atlantic, Kogia occur along the Brazilian coast (Pinedo
1987), in the Caribbean Sea (Caldwell et al. 1973), and near the United States
and Canada (McAlpine et al. 1997). This range extends eastward to Senegal
(Maigret and Robineau 1981), the Azores (Martins et al. 1985), Spain (Abollo et
al. 1998), and northern Europe, as well as the Mediterranean Sea (Baccetti et al.
1991). In the Indian Ocean, stranded Kogia have been documented from South
Africa (Ross 1978), Oman (Gallagher and van Bree 1980), India (Owen 1867),
and Australia (Hale 1963). When sighted in the GOM, Kogia are usually solitary,
but may form groups of up to eight individuals (Mullin et al. 1994, Baumgartner
et al. 2001). These association data support limited Kogia inter- and intra-
specific interactions (Balance and Pitman 1998) and little or no reliance on
groups for feeding and anti-predatory strategies. However, there are few
published Kogia field studies and most individual-based information has come
from live stranded specimens.
1.2.4 Kogia in Captivity
Kogia are difficult to maintain in captivity. Sylvestre (1983) reported that of
33 rehabilitation attempts in the United States, all died within one month. Mote
Marine Laboratory (MML) in Sarasota, Florida has engaged in the most
extensive and successful rehabilitations of live stranded Kogia, but have not yet
been able to permanently maintain or release them. The longest captive
durations for K. sima and K. breviceps were at MML, where subjects involved in
this thesis study survived for 21 and 15 months, respectively. Necropsies of
7
unsuccessful Kogia rehabilitations have identified gastrointestinal ruptures,
blockages, torsions or impactions and stress-induced cardiomyopathy as most-
frequent causes of death (Manire et al. 2004). These findings support veterinary
observations that Kogia are acutely affected by dietary and environmental
changes (Manire et al. 2004). Although rehabilitations of Kogia at MML have not
yet led to their release or permanent maintenance, this facility provides unique
research opportunities to address basic biological questions in Kogiidae.
1.3 Tursiops truncatus Life History
Bottlenose dolphins (T. truncatus) are generally regarded as the most-
thoroughly studied cetaceans to date (Wells and Scott 2002, Bernd Würsig pers.
comm.) and have been the subjects of extensive observation. Atlantic
bottlenose dolphins are countershaded light-gray to nearly black dorsolaterally
and cream to pink ventrally. Body size is robust, with recorded total lengths up
to 400 cm, but normally only reaching 300 cm (Fraser 1974, Leatherwood et al.
1988, Cockcroft and Ross 1990b, Mead and Potter 1990). Depending upon
population, neonates are born at 84 to 140 cm (Wells and Scott 2002) during a
calving season generally in late-spring to early-summer (Leatherwood et al.
1988, Scott et al. 1990, pers. obs.). Sexual maturity is reached at 5 to13 years
(> 230 cm) for females and 9 to 14 years (> 235 cm) for males (Ross and
Cockcroft 1990b). Females may be reproductive for up to 48 years of age
(Wells and Scott 1999) and produce a calf every 3-6 years (Connor et al. 2000).
8
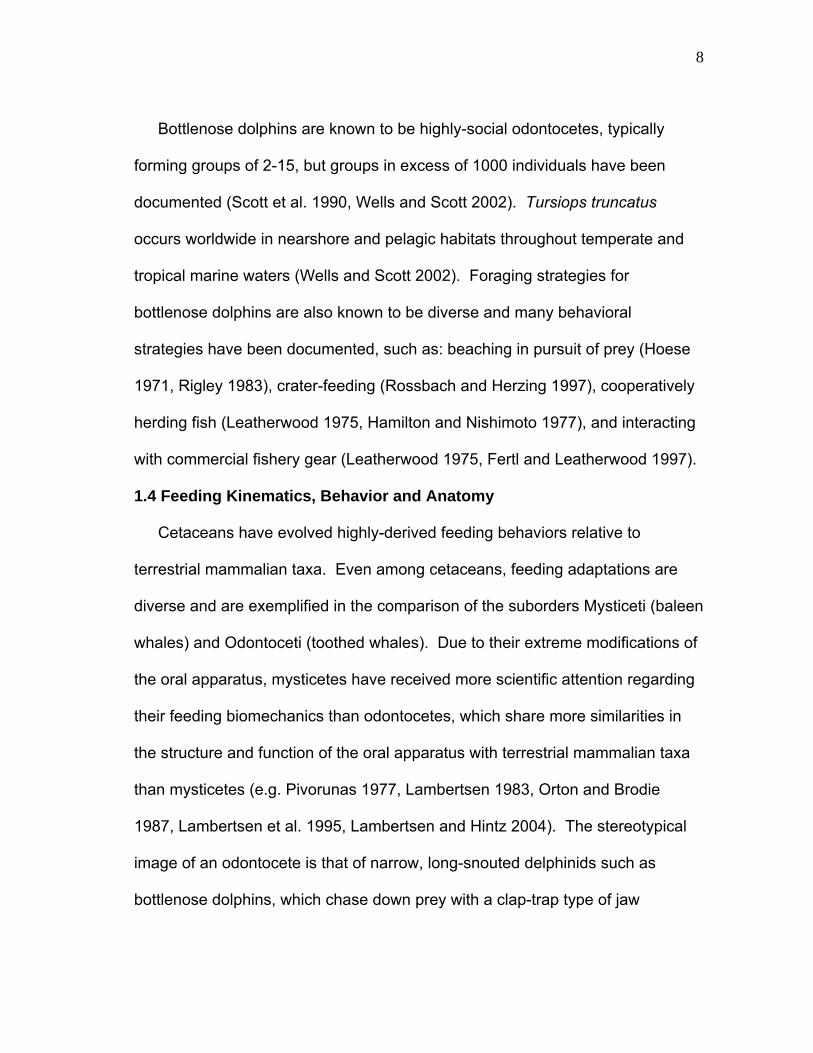
Bottlenose dolphins are known to be highly-social odontocetes, typically
forming groups of 2-15, but groups in excess of 1000 individuals have been
documented (Scott et al. 1990, Wells and Scott 2002). Tursiops truncatus
occurs worldwide in nearshore and pelagic habitats throughout temperate and
tropical marine waters (Wells and Scott 2002). Foraging strategies for
bottlenose dolphins are also known to be diverse and many behavioral
strategies have been documented, such as: beaching in pursuit of prey (Hoese
1971, Rigley 1983), crater-feeding (Rossbach and Herzing 1997), cooperatively
herding fish (Leatherwood 1975, Hamilton and Nishimoto 1977), and interacting
with commercial fishery gear (Leatherwood 1975, Fertl and Leatherwood 1997).
1.4 Feeding Kinematics, Behavior and Anatomy
Cetaceans have evolved highly-derived feeding behaviors relative to
terrestrial mammalian taxa. Even among cetaceans, feeding adaptations are
diverse and are exemplified in the comparison of the suborders Mysticeti (baleen
whales) and Odontoceti (toothed whales). Due to their extreme modifications of
the oral apparatus, mysticetes have received more scientific attention regarding
their feeding biomechanics than odontocetes, which share more similarities in
the structure and function of the oral apparatus with terrestrial mammalian taxa
than mysticetes (e.g. Pivorunas 1977, Lambertsen 1983, Orton and Brodie
1987, Lambertsen et al. 1995, Lambertsen and Hintz 2004). The stereotypical
image of an odontocete is that of narrow, long-snouted delphinids such as
bottlenose dolphins, which chase down prey with a clap-trap type of jaw

9
containing numerous homodont teeth (Winge 1921, Howell 1930, Slijper 1962,
Norris and Møhl 1983, Heyning 1989, Rommel 1990). However, non-delphinids
possess a wider morphological diversity than delphinids (Gaskin 1976). In
contrast to the stereotypical odontocete image, many odontocetes possess blunt
rostra, reduced dentition (Norris and Møhl 1983, Heyning and Mead 1996, Werth
2000a), feed on squid (teuthophagous), and may use suction as their primary
mode of prey capture. Examples of such odontocetes include: pilot whales
(Globicephala; Brown 1962, Werth 2000a), harbor porpoises (Phocoena
phocoena; Kastelein et al. 1997), beaked whales (Ziphiidae; Heyning and Mead
1996), and sperm whales (Physeteridae and Kogiidae; Caldwell et al. 1966,
Werth 2005). Elongated rostra are likely not supportive of suction feeding due to
the relatively short distances over which negative intraoral pressures are exerted
on the water column (Wainwright, 2001), reducing their utility to most delphinids.
However, the underlying biomechanics of odontocete feeding have not been
systematically investigated. Although there is a wealth of information on
odontocete anatomy, there are surprisingly far fewer behavioral investigations to
test functional hypotheses based on anatomical studies alone. A rare example
of this are negative pressure measurements of suction feeding in captive P.
phocoena (Kastelein et al. 1997).
The hyoid is the basis of the functional complex associated with mammalian
suction feeding (Thexton et al. 1998, Werth 2000b). Fishes exploit their dense
environment to draw prey into the mouth by rapid hyoid depression, cranial
10
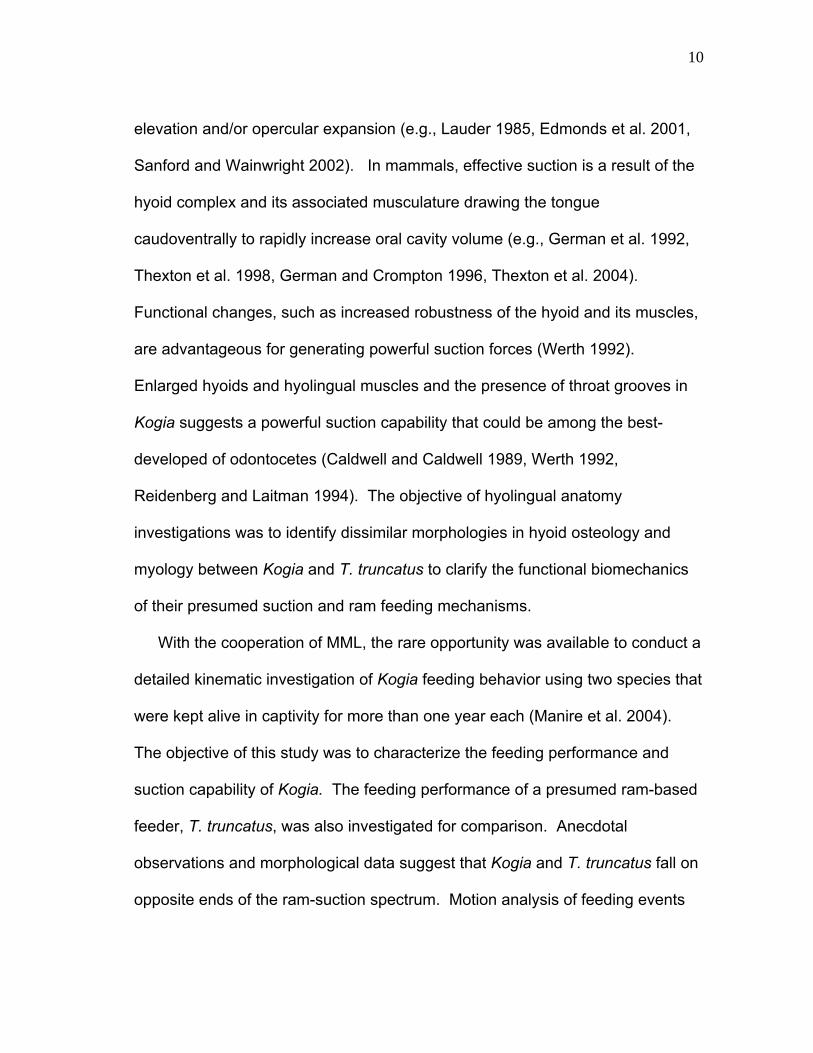
elevation and/or opercular expansion (e.g., Lauder 1985, Edmonds et al. 2001,
Sanford and Wainwright 2002). In mammals, effective suction is a result of the
hyoid complex and its associated musculature drawing the tongue
caudoventrally to rapidly increase oral cavity volume (e.g., German et al. 1992,
Thexton et al. 1998, German and Crompton 1996, Thexton et al. 2004).
Functional changes, such as increased robustness of the hyoid and its muscles,
are advantageous for generating powerful suction forces (Werth 1992).
Enlarged hyoids and hyolingual muscles and the presence of throat grooves in
Kogia suggests a powerful suction capability that could be among the best-
developed of odontocetes (Caldwell and Caldwell 1989, Werth 1992,
Reidenberg and Laitman 1994). The objective of hyolingual anatomy
investigations was to identify dissimilar morphologies in hyoid osteology and
myology between Kogia and T. truncatus to clarify the functional biomechanics
of their presumed suction and ram feeding mechanisms.
With the cooperation of MML, the rare opportunity was available to conduct a
detailed kinematic investigation of Kogia feeding behavior using two species that
were kept alive in captivity for more than one year each (Manire et al. 2004).
The objective of this study was to characterize the feeding performance and
suction capability of Kogia. The feeding performance of a presumed ram-based
feeder, T. truncatus, was also investigated for comparison. Anecdotal
observations and morphological data suggest that Kogia and T. truncatus fall on
opposite ends of the ram-suction spectrum. Motion analysis of feeding events
11
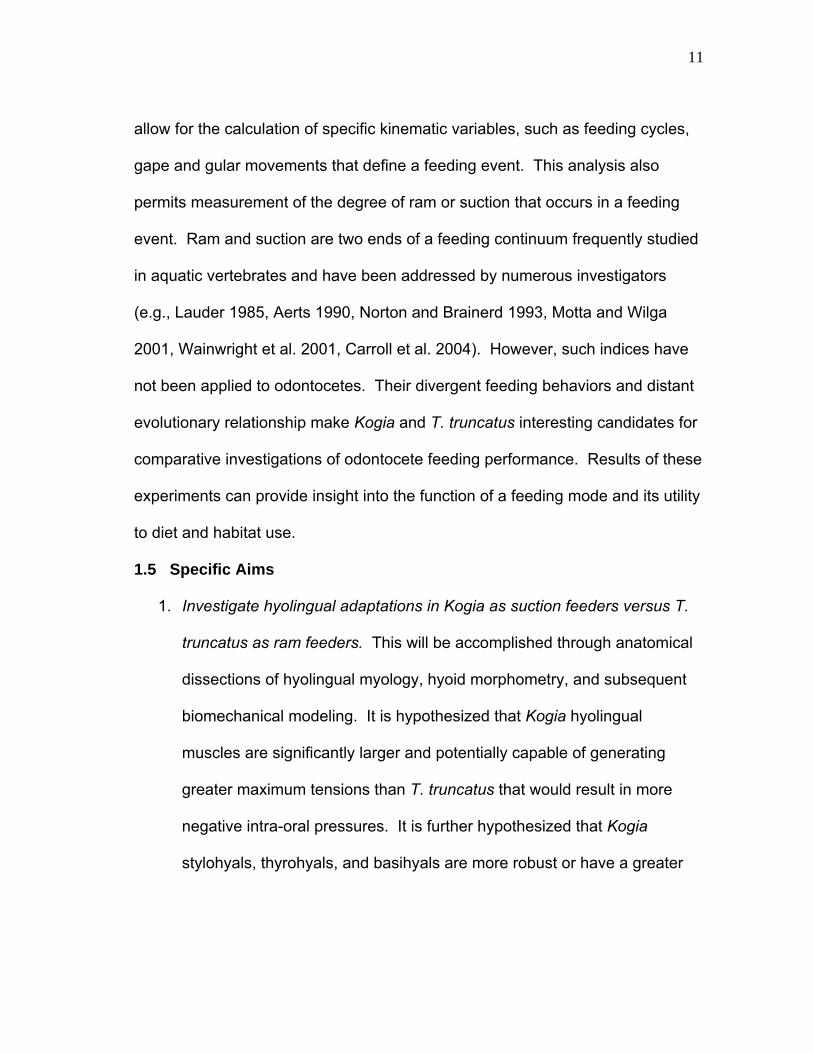
allow for the calculation of specific kinematic variables, such as feeding cycles,
gape and gular movements that define a feeding event. This analysis also
permits measurement of the degree of ram or suction that occurs in a feeding
event. Ram and suction are two ends of a feeding continuum frequently studied
in aquatic vertebrates and have been addressed by numerous investigators
(e.g., Lauder 1985, Aerts 1990, Norton and Brainerd 1993, Motta and Wilga
2001, Wainwright et al. 2001, Carroll et al. 2004). However, such indices have
not been applied to odontocetes. Their divergent feeding behaviors and distant
evolutionary relationship make Kogia and T. truncatus interesting candidates for
comparative investigations of odontocete feeding performance. Results of these
experiments can provide insight into the function of a feeding mode and its utility
to diet and habitat use.
1.5 Specific Aims
1. Investigate hyolingual adaptations in Kogia as suction feeders versus T.
truncatus as ram feeders. This will be accomplished through anatomical
dissections of hyolingual myology, hyoid morphometry, and subsequent
biomechanical modeling. It is hypothesized that Kogia hyolingual
muscles are significantly larger and potentially capable of generating
greater maximum tensions than T. truncatus that would result in more
negative intra-oral pressures. It is further hypothesized that Kogia
stylohyals, thyrohyals, and basihyals are more robust or have a greater
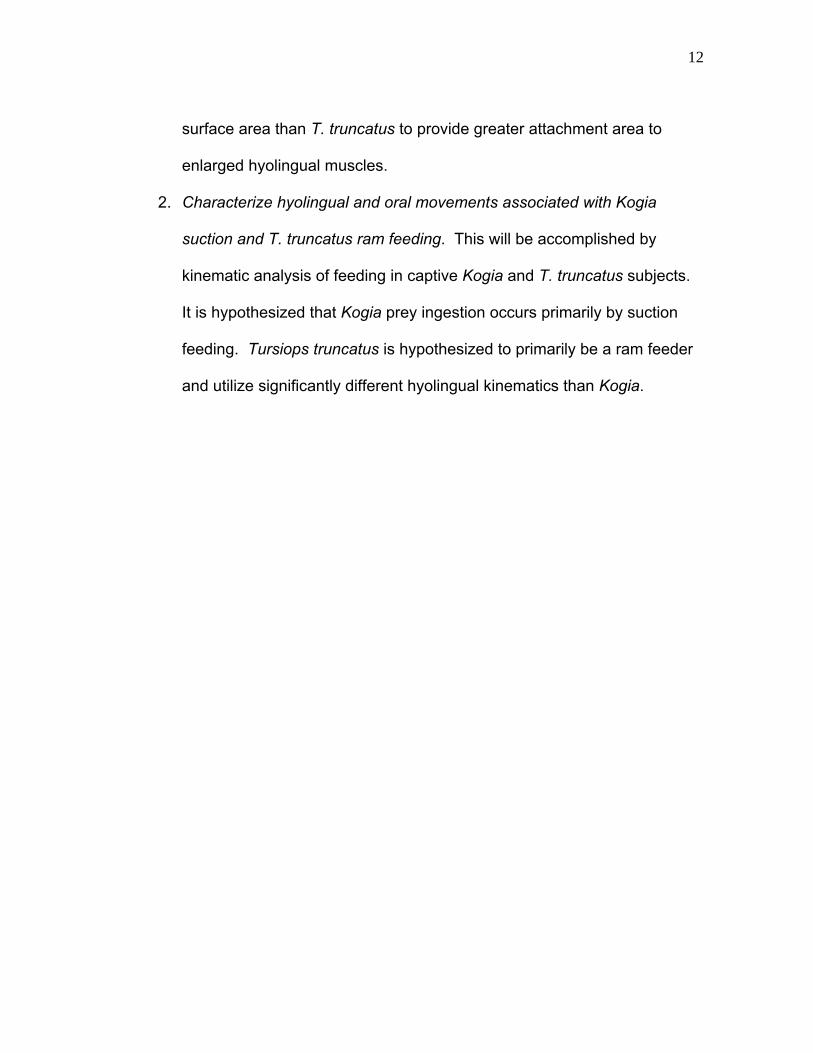
12
surface area than T. truncatus to provide greater attachment area to
enlarged hyolingual muscles.
2. Characterize hyolingual and oral movements associated with Kogia
suction and T. truncatus ram feeding. This will be accomplished by
kinematic analysis of feeding in captive Kogia and T. truncatus subjects.
It is hypothesized that Kogia prey ingestion occurs primarily by suction
feeding. Tursiops truncatus is hypothesized to primarily be a ram feeder
and utilize significantly different hyolingual kinematics than Kogia.

13
CHAPTER II
MATERIALS AND METHODS 2.1 Hyolingual Anatomy
2.1.1 Specific Aim 1
Investigate hyolingual adaptations in Kogia as suction feeders versus T.
truncatus as ram feeders. It was hypothesized that Kogia hyolingual muscles are
capable of significantly greater estimated maximum tensions than T. truncatus to
produce a more forceful hyoid retraction and depression during suction feeding
events. To address this, heads of necropsy specimens were dissected and
hyolingual muscles excised. Muscle length, mass, width, and height (at center
of mass) were measured with vernier calipers and cross-sections photographed
for measurement with Image J (NIH, Bethesda, MD). Data were used to
calculate predicted maximum tetanic forces for interspecies comparisons. It was
also hypothesized that Kogia stylohyals, basihyals, and thyrohyals are more
robust and exhibited greater surface areas than T. truncatus to increase
attachment area for hyolingual muscles. This hypothesis was tested by
removing and cleaning hyoid bones from necropsy specimens. Photographs of
thyrohyals and basihyals were analyzed using Image J to measure ventral
surface area. Stylohyal lengths and maximum widths (at the mid-length) were
measured with vernier calipers and a ratio taken as an index of stylohyal
14
robustness. Kogia and T. truncatus surface area and stylohyal ratios were
compared by ANCOVA analyses and interspecies differences characterized.
2.1.2 Salvage Collection
The investigation of Kogia and Tursiops hyolingual anatomy was conducted
using salvage material from five K. sima, four K. breviceps and six T. truncatus
heads collected from code 2 or 3 stranded specimens with the assistance of the
Texas Marine Mammal Stranding Network (TMMSN) and Mote Marine
Laboratory (MML) under NOAA Southeast Regional Office Salvage Permit
Number SER02-259 to Dr. Christopher Marshall. Life history data from collected
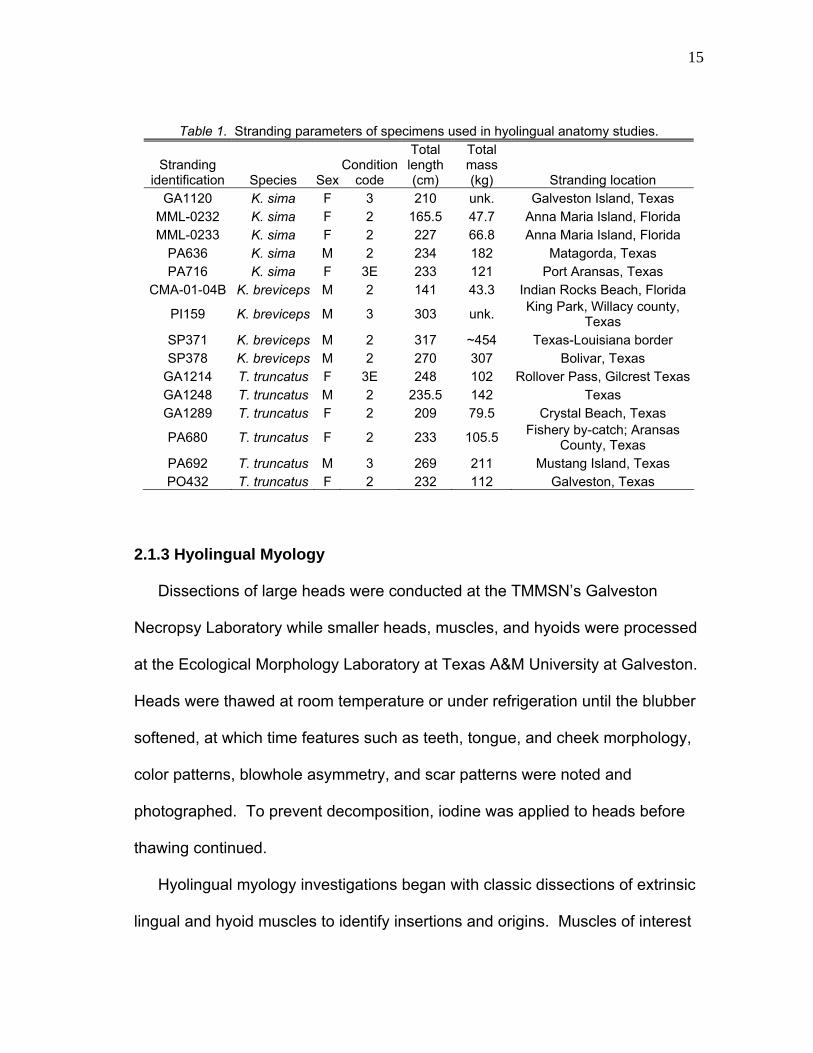
specimens are summarized in Table 1. Heads were decapitated during
necropsies, and in some cases, transected through the sternohyoideus,
thyrohyoideus, cricothyroideus, and sternothyroideus. However, when possible,
all hyolingual muscles were retained by the disarticulation of ribs and transecting
the ventral cervical musculature and blubber to free the head and sternum from
the body. Heads were frozen at -7º to -25º C until thawed for hyolingual
dissection.
15
Table 1. Stranding parameters of specimens used in hyolingual anatomy studies.
Stranding identification Species Sex
Condition code
Total length (cm)
Total mass (kg) Stranding location
GA1120 K. sima F 3 210 unk. Galveston Island, Texas MML-0232 K. sima F 2 165.5 47.7 Anna Maria Island, Florida MML-0233 K. sima F 2 227 66.8 Anna Maria Island, Florida
PA636 K. sima M 2 234 182 Matagorda, Texas PA716 K. sima F 3E 233 121 Port Aransas, Texas
CMA-01-04B K. breviceps M 2 141 43.3 Indian Rocks Beach, Florida
PI159 K. breviceps M 3 303 unk. King Park, Willacy county, Texas
SP371 K. breviceps M 2 317 ~454 Texas-Louisiana border SP378 K. breviceps M 2 270 307 Bolivar, Texas
GA1214 T. truncatus F 3E 248 102 Rollover Pass, Gilcrest TexasGA1248 T. truncatus M 2 235.5 142 Texas GA1289 T. truncatus F 2 209 79.5 Crystal Beach, Texas
PA680 T. truncatus F 2 233 105.5 Fishery by-catch; Aransas County, Texas
PA692 T. truncatus M 3 269 211 Mustang Island, Texas PO432 T. truncatus F 2 232 112 Galveston, Texas
2.1.3 Hyolingual Myology
Dissections of large heads were conducted at the TMMSN’s Galveston
Necropsy Laboratory while smaller heads, muscles, and hyoids were processed
at the Ecological Morphology Laboratory at Texas A&M University at Galveston.
Heads were thawed at room temperature or under refrigeration until the blubber
softened, at which time features such as teeth, tongue, and cheek morphology,
color patterns, blowhole asymmetry, and scar patterns were noted and
photographed. To prevent decomposition, iodine was applied to heads before
thawing continued.
Hyolingual myology investigations began with classic dissections of extrinsic
lingual and hyoid muscles to identify insertions and origins. Muscles of interest
16
included hyoid muscles (sternohyoideus, mylohyoideus, thyrohyoideus,
geniohyoideus, stylohyoideus, and interhyoideus) and the tongue’s extrinsic
muscles (genioglossus, hyoglossus, and styloglossus). The sternothyroideus
was measured as a potential laryngeal retractor. Muscle angles were measured
relative to the palatal plane (horizontal) in situ to assist vector analysis of the
hyolingual complex and to calculate potential depressive and retractive tensions
of each muscle or muscle groups in biomechanical models of Kogia and T.
truncatus feeding. This was accomplished by placing a protractor along a given
muscle and the specimen’s long axis. The angle of a muscle’s line of pull
relative to the body was measured three times at different locations for right and
left muscles and a mean calculated. Individual muscles were then removed for
cross-sectional area measurements.
2.1.4 Muscle Characterization
Physiological cross-sectional area (PCSA) was obtained following
procedures adapted from Spector et al. (1980), Powell et al. (1984), and Loeb
and Gans (1986) and morphological cross-sectional area (MCSA) from Gordon
(1984) and Huber and Motta (2004). However, following several unsuccessful
attempts to measure muscle fiber length in dissected specimens, fiber length
was assumed to be equal to muscle length. This assumption was based on data
from mammalian strap muscles (McMahon 1984). Each muscle’s PCSA was
determined following Spector et al. (1980), Powell et al. (1984), and Loeb and
Gans (1986):

17
PCSA = (muscle mass)*(cos θ)/(FL)*(muscle density)
where cos θ was the mean fiber angle relative to a muscle’s line of pull, FL was
the mean fiber length (cm), and muscle density was assumed to be 1.056 g/cm3
(Mendez and Key 1960, Murphy and Beardsley 1974). Muscle height and width
were also collected. In situ muscle angles in the transverse plane were also
collected.
The MCSA of each muscle was obtained by photographing a muscle in
cross-section at its center of mass with a Nikon Coolpix 885 digital camera. A
metric ruler was included for scale. The perimeter was traced from digital
photographs three times in Image J and a mean of each muscle’s surface area
(MCSA) was calculated. Estimated physiological and morphological maximum
tetanic tension (PMTT and MMTT, respectively) from PCSA and MCSA were
calculated following procedures adapted from Spector et al. (1980), Powell et al.
(1984), and Loeb and Gans (1986):
PMTT or MMTT = (CSA)*(specific tension)
where specific tension was assumed to be 22.5 N/cm2 (Roy et al. 1982, Spector
et al. 1980). PMTT (more representative of in situ condition) and muscle lines of
pull relative to the palatal plane formed vectors in the biomechanical model.
Vectors were used to identify the amount of depressive and retractive tension
available for hyolingual motion during a feeding event. The overall resultant
vector of depressive and retractive tension components was used to identify
initial hyolingual movement in response to simultaneous muscle contraction.
18
2.1.5 Hyoid Osteology
To test the hypothesis that Kogia basihyal and thyrohyal surface areas were
greater than T. truncatus, hyoids were removed, cleared of tissue, and dried for
morphometric analysis. The ventral aspects of basihyals and thyrohyals with
metric scale were photographed and the perimeter of each bone outlined three
times with Image J to calculate a mean ventral surface area for muscle
attachment. Each stylohyal was similarly cleared of tissue and dried. The
length and maximum width at the mid-length were measured with vernier
calipers. A stylohyal robustness index was developed by dividing the width by
the length. The tympanohyal, stylohyal, and epihyal arc of rotation in the palatal
plane was measured by protractor from digital images of the hyoid in its basal
and fully depressed/retracted positions.
2.1.6 Statistical Analyses
Myological and osteological data were grouped by species or genus and
analyzed. Comparisons included K. sima to K. breviceps and Kogia to T.
truncatus. To compensate for scaling effects of body size, Analysis of
Covariance (ANCOVA) (α ≤ 0.05) was used to identify significant differences in
cross-sectional area and maximum tetanic tension using total length or mass as
covariates (SPSS Statistical Software package 11.0). The most-reliable scaled
means were standardized to the total body length that produced the greatest r2
value. To identify differences in right versus left muscles and hyoid dimensions,
one-way Analysis of Variance (ANOVA) (α ≤ 0.05) identified differences between

19
Kogia species and T. truncatus. Where three or more data points were available
for each muscle’s PMTT or MMTT, normality was met in all K. sima, K.
breviceps, pooled Kogia, and T. truncatus groups, with the exception of K.
breviceps genioglossus MMTT (0.018), pooled Kogia hyoglossus MMTT (0.048)
and styloglossus PMTT (0.030), and T. truncatus geniohyoideus PMTT (0.012).
2.2 Behavioral Performance 2.2.1 Specific Aim 2
Characterize hyolingual and oral movements associated with Kogia suction
and T. truncatus ram feeding. It was hypothesized that Kogia ingested prey
primarily by suction in several distinct stages while T. truncatus was primarily a
ram-based feeder and utilized significantly different hyolingual kinematics. To
compare and contrast Kogia feeding behavior with that of T. truncatus, feeding
performance trials of captive Kogia and T. truncatus were conducted.
Underwater video of feeding sequences was recorded and addressed by motion
analysis. Kinematic variables associated with feeding were measured and
compared in and between Kogia and T. truncatus.
2.2.2 Subjects
One female K. sima calf (“Simone”) and one female K. breviceps calf (“Ami”)
were subjects of behavioral performance investigations at MML (Sarasota,
Florida USA). Data were also collected from two adult male T. truncatus
subjects at SeaWorld of Texas (San Antonio, Texas USA). Both kogiids
stranded and were taken to MML for rehabilitation, where they became the only
20
kogiids to survive for more than one year in a captive setting (Manire et al.
2004). At the time of feeding trials, “Ami” was 10 - 11 months old, weighed
126.5 kg and was 203 cm in total body length. “Simone” was 10 - 12 months of
age, had a mean weight of 60 kg and was 160 cm in mean total body length.
Tursiops truncatus subjects included “Kai,” who was 26 years old, 344 kg and
308 cm in total body length, and “Clicker,” who was over 30 years old, 195 kg
and 249 cm in total body length. A total of 236 minutes of footage was collected
from Kogia feeding trials. A total of 85 minutes of footage was collected from T.
truncatus feeding trials. All investigations of Kogia and T. truncatus were
approved by Texas A&M University Laboratory Animal Care (AUP#2003-72),
SeaWorld, and MML’s Institutional Animal Care and Usage Committee.
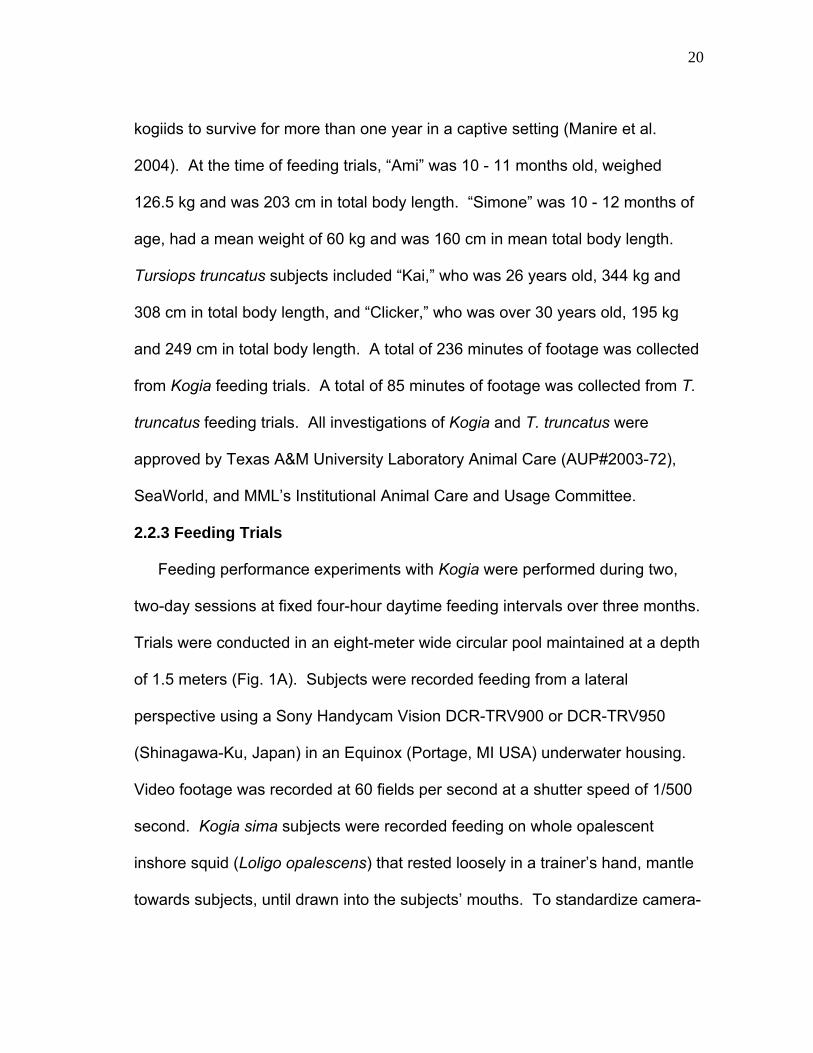
2.2.3 Feeding Trials
Feeding performance experiments with Kogia were performed during two,
two-day sessions at fixed four-hour daytime feeding intervals over three months.
Trials were conducted in an eight-meter wide circular pool maintained at a depth
of 1.5 meters (Fig. 1A). Subjects were recorded feeding from a lateral
perspective using a Sony Handycam Vision DCR-TRV900 or DCR-TRV950
(Shinagawa-Ku, Japan) in an Equinox (Portage, MI USA) underwater housing.
Video footage was recorded at 60 fields per second at a shutter speed of 1/500
second. Kogia sima subjects were recorded feeding on whole opalescent
inshore squid (Loligo opalescens) that rested loosely in a trainer’s hand, mantle
towards subjects, until drawn into the subjects’ mouths. To standardize camera-

21
Figure 1. Experimental setup. (A.) Kogia at MML and (B.) Tursiops truncatus at SeaWorld of Texas. All videotaping was conducted from the lateral perspective. Note one-meter squares for Kogia videotaping to maintain relatively constant distance to subject.
22
to-subject distance, the feeder and camera were stationed in one-meter
quadrants placed one meter apart. Subjects were offered food until they no
longer showed interest. No K. breviceps subjects were in captivity during the
study period. Footage of K. breviceps was provided subsequent to “Ami’s”
death and sequences that met the orientation and landmark criteria of clarity
were analyzed.
Tursiops truncatus feeding performance trials were conducted during four,
one-day sessions over five months. Subjects were held in a four-meter deep
pool and their lateral perspective was videotaped through a metal grated door
(Fig. 1B). Subjects were fed herring at a fixed location, one meter from the
camera. Herring were held underwater, head towards subjects, by a trainer
outside of the pool until subjects approached within two meters, at which time
food was released. Feeding trials occurred between 1000 and 1600 hours to
minimize variation in light conditions. Natural landmarks such as the center of
the eye were identified and, when possible, high-contrast zinc oxide dots were
placed on facial and pectoral regions to assist in the identification of homologous
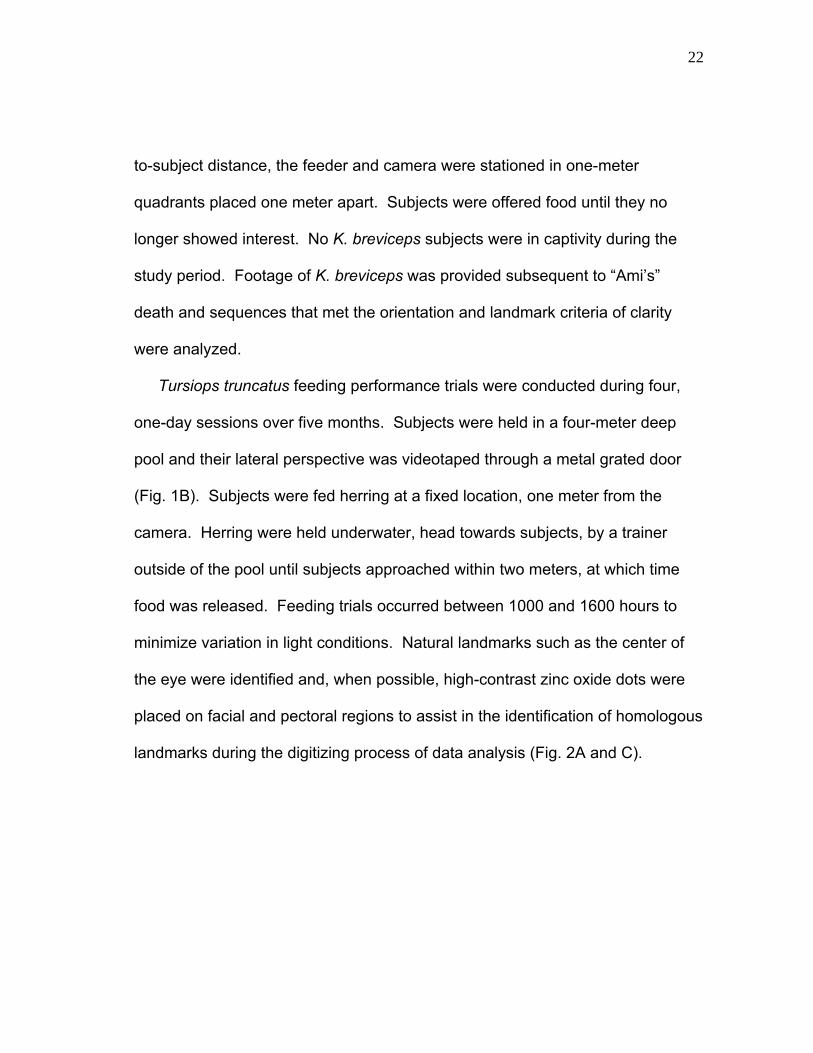
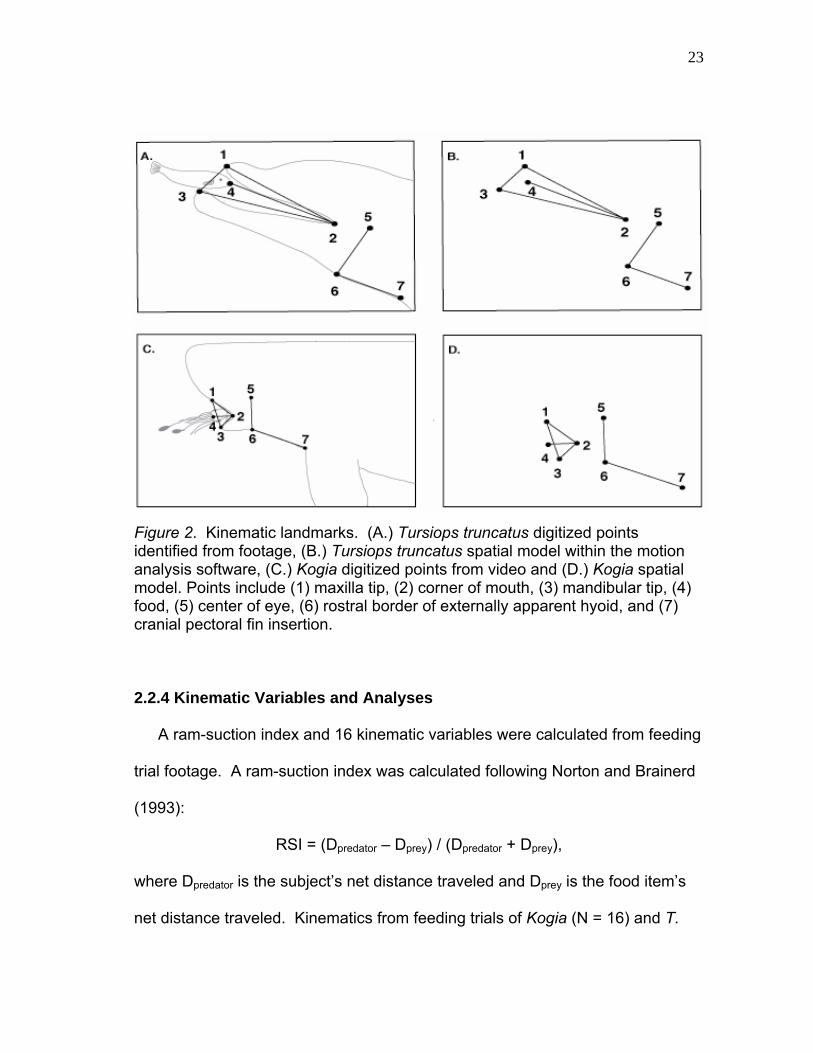
landmarks during the digitizing process of data analysis (Fig. 2A and C).
23
Figure 2. Kinematic landmarks. (A.) Tursiops truncatus digitized points identified from footage, (B.) Tursiops truncatus spatial model within the motion analysis software, (C.) Kogia digitized points from video and (D.) Kogia spatial model. Points include (1) maxilla tip, (2) corner of mouth, (3) mandibular tip, (4) food, (5) center of eye, (6) rostral border of externally apparent hyoid, and (7) cranial pectoral fin insertion.
2.2.4 Kinematic Variables and Analyses
A ram-suction index and 16 kinematic variables were calculated from feeding
trial footage. A ram-suction index was calculated following Norton and Brainerd
(1993):
RSI = (Dpredator – Dprey) / (Dpredator + Dprey),
where Dpredator is the subject’s net distance traveled and Dprey is the food item’s
net distance traveled. Kinematics from feeding trials of Kogia (N = 16) and T.

24
truncatus (N = 30) were analyzed using a motion analysis software package
(Peak Motus 8.1, Peak Performance Technologies, Denver, CO USA).
Homologous landmarks from each field (Fig. 2) were digitized in each feeding
sequence analyzed. Kinematic variables analyzed included: 1.) maximum gape,
the maximum distance from maxillary tip to mandibular tip; 2.) time to maximum
gape, the duration from when the jaws began to open until maximum gape; 3.)
maximum gape angle, the maximum angle from the maxillary tip to mouth vertex
or corner of the mouth (COM) to mandibular tip; 4.) maximum opening gape
angle velocity, the greatest angular rate of jaw opening; 5.) maximum closing
gape angle velocity, the greatest angular rate of jaw closure; 6.) maximum gular
depression, the greatest increase in distance from the eye to external rostral
border of the hyoid; 7.) time to maximum gular depression, the duration from
start of gular depression to maximum gular depression; 8.) maximum gular
retraction, the greatest decrease in distance from the cranial pectoral fin
insertion to external rostral border of the hyoid; 9.) time to maximum gular
retraction, the duration from start of gular retraction to maximum gular retraction;
10.) maximum tongue retraction, the greatest decrease in distance from tongue
tip to COM; 11.) predator-food distance, the horizontal distance from the food
item to maxillary tip at the start of the feeding cycle; 12.) suction distance, the
horizontal distance traveled by the food item during the feeding cycle; 13.) ram
distance, the horizontal distance traveled by the predator during the feeding
cycle; 14.) maximum food velocity, the greatest change in distance per time of

25
the food in a feeding event; 15) maximum hydraulic jetting, the greatest distance
traveled by food when ejected from the mouth during mouth closure; and 16)
maximum hydraulic jetting velocity, the greatest change in distance per time of
food while exiting the mouth.
2.2.5 Statistics
Normality was calculated with the Shapiro-Wilk normality test (Z ≥ 0.05) and
variance obtained with Levene’s test for equality of variance (s2 ≤ 0.05). When
both variance and normality requirements were met, analyses of variance
(ANOVA’s) were performed to determine significant differences (α ≤ 0.05) of
kinematic variables between feeding trials. Post-hoc analyses utilized Scheffe’s
test to determine which subjects and subject groups were significantly different.
If variance was significant but normality was met, data were analyzed by
independent sample T-tests (α ≤ 0.05). Non-parametric data were analyzed
using Mann-Whitney U tests (α ≤ 0.05). Correlation analyses assessed the
positive or negative relatedness of RSI, timing of feeding events and gape and
gular displacements. Pearson’s “r” correlation test calculated significant
correlations in parametric data and Spearman’s rho test was implemented for
non-parametric data.
26
CHAPTER III
RESULTS
3.1 Kogia Hyolingual Osteology
The Kogia hyoid apparatus was composed of the same elements present in
terrestrial mammals: tympanohyal, stylohyal, ceratohyal, epihyal, basihyal, and
thyrohyal (Fig. 3). The first three segments, the tympanohyal, stylohyal, and
ceratohyal, formed a straight rostroventral and medially directed chain. The
epihyal redirected caudally to attach to the expansive basihyal located centrally
along the mid-sagittal plane ventral to the proximal hyoid elements. From here,
the thyrohyals branched caudolaterally and, with the basihyal, formed a broad
surface area for hyal, sternal, and lingual muscle attachment. However,
significant reduction of some elements was apparent. In Kogia specimens of
shorter total body length, the tympanohyals and epihyals consisted of large,
cartilaginous rods. In larger specimens, both elements were reduced to small,
cartilaginous plates between the stylohyals and tympanic bones (tympanohyal)
or ceratohyals (epihyal). Kogia basihyals and thyrohyals had a pitted
appearance and seemed to have a high volume of empty space within the bone
matrix relative to other bones, such as the skull and vertebrae. This apparent
low bone density was apparent in all hyal bones, as illustrated by the fact that all
ossified hyoid elements floated in water. Caudoventral hyoid movement was
less in K. sima than in K. breviceps due to a thyrohyal-thyroid cartilage ligament

27
that severely limited hyoid mobility. As a result of this, the basihyal and
thyrohyals were incapable of movement away from the larynx, although the
tympanohyal, stylohyal, and epihyal were free to rotate roughly 30˚ in the palatal
plane (Fig. 4A). Kogia basihyal and thyrohyals were tightly connected to the
stylohyal by the interhyoideus muscle located between the hyoid elements,
which prevented significant separation of these elements.
Figure 3. Hyoid apparatus of (A.) Canis familiaris (modified from Evans and Christensen, 1979) and (B.) K. breviceps (modified from Reidenberg and Laitman, 1994) in ventral view.
The dorsal-most hyoid elements, the tympanohyals, were present as
cartilage rods that articulated to the tympanic bone and lacked any apparent
muscular attachment. A synovial joint was evident between the tympanohyal
and tympanic bone, but no such joint was identified between the tympanohyal
and stylohyal. The stylohyal (Fig. 4A, 5A, and 6A) was an ossified, roughly
ovoid element in cross-section located between the tympanohyal and epihyal.
This stylohyal was relatively longer in specimens of greater total body length and
appeared to displace the tympanohyal and epihyal with ontogenetic progression.
28
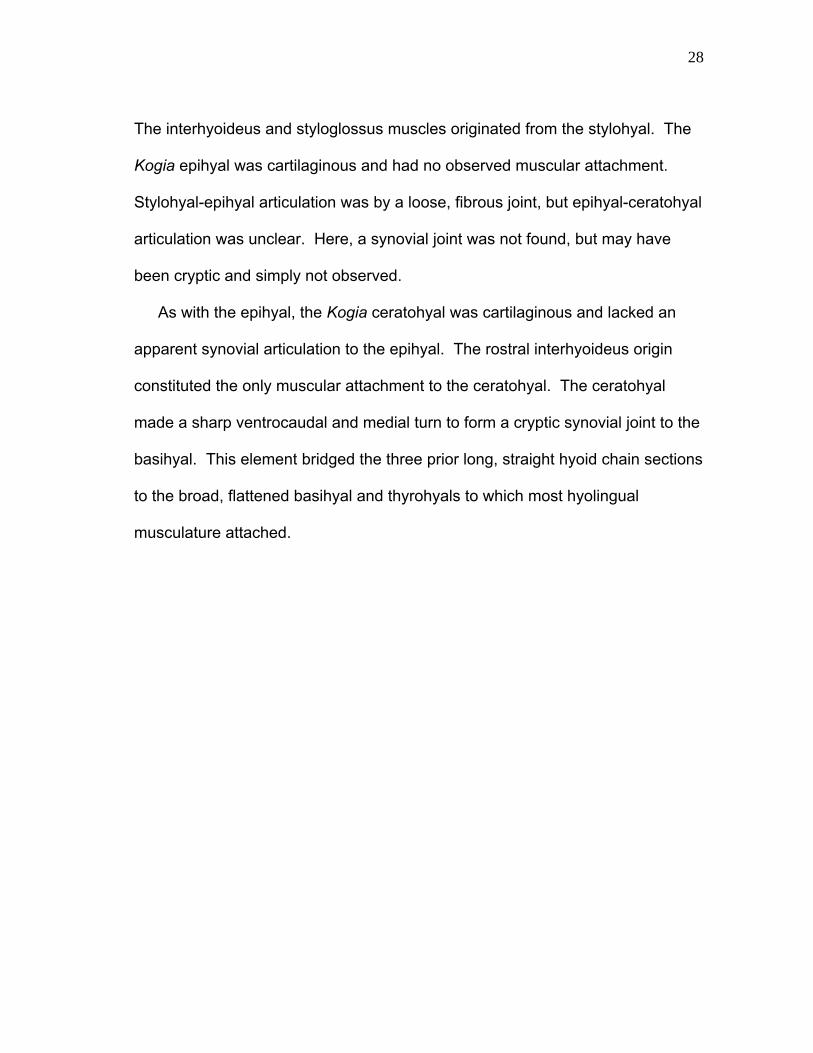
The interhyoideus and styloglossus muscles originated from the stylohyal. The
Kogia epihyal was cartilaginous and had no observed muscular attachment.
Stylohyal-epihyal articulation was by a loose, fibrous joint, but epihyal-ceratohyal
articulation was unclear. Here, a synovial joint was not found, but may have
been cryptic and simply not observed.
As with the epihyal, the Kogia ceratohyal was cartilaginous and lacked an
apparent synovial articulation to the epihyal. The rostral interhyoideus origin
constituted the only muscular attachment to the ceratohyal. The ceratohyal
made a sharp ventrocaudal and medial turn to form a cryptic synovial joint to the
basihyal. This element bridged the three prior long, straight hyoid chain sections
to the broad, flattened basihyal and thyrohyals to which most hyolingual
musculature attached.
29
Figure 4. Lateral perspective of the hyoid in a representative retracted position for (A.) K. breviceps and (B.) T. truncatus. Both stylohyals could be manually retracted to nearly 30° relative to the basal position. The interhyoideus muscle prevented significant movement of the basihyal or thyrohyals away from the stylohyals.
30
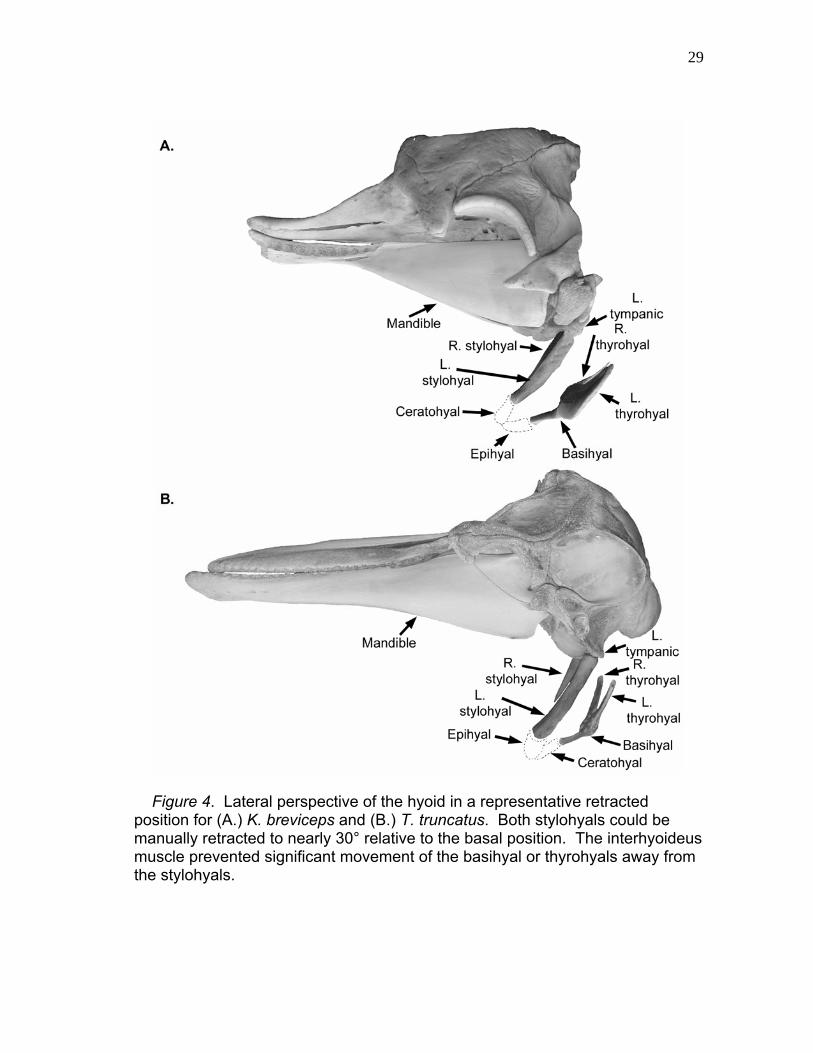
Figure 5. Ventral views of the ossified hyoid complex elements from (A.) K. breviceps and (B.) T. truncatus. Note prominences for epihyal articulations along the rostromedial basihyal surface.
31
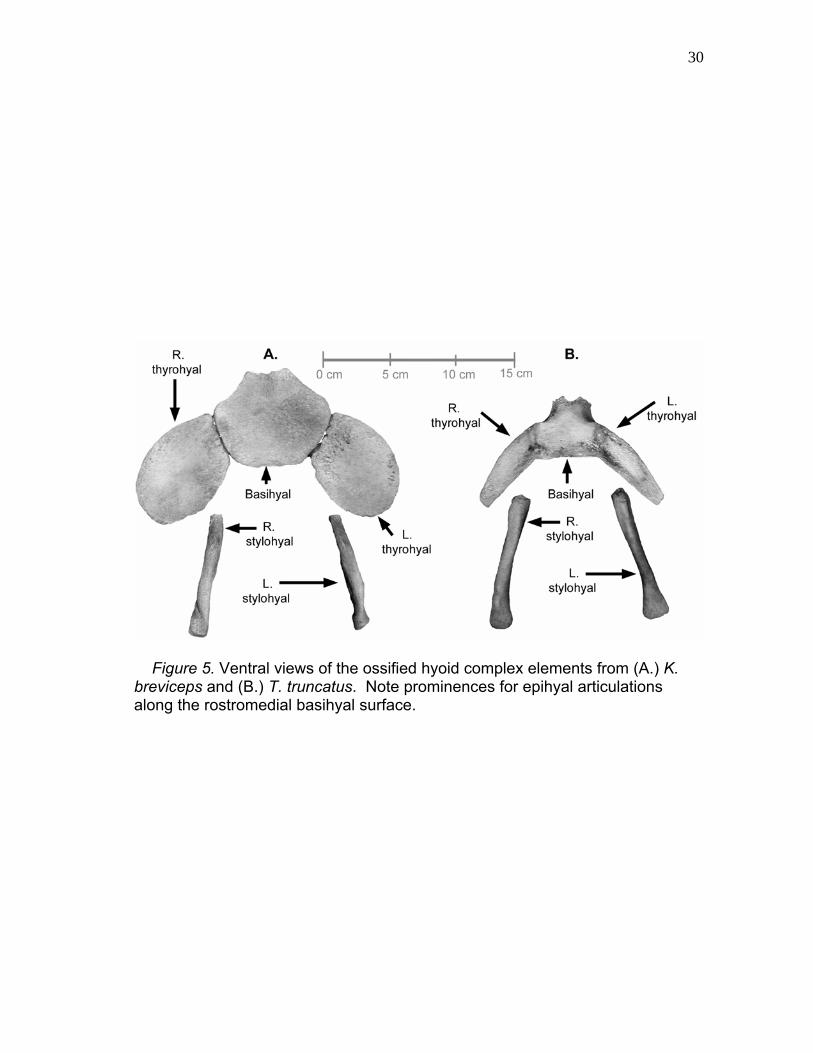
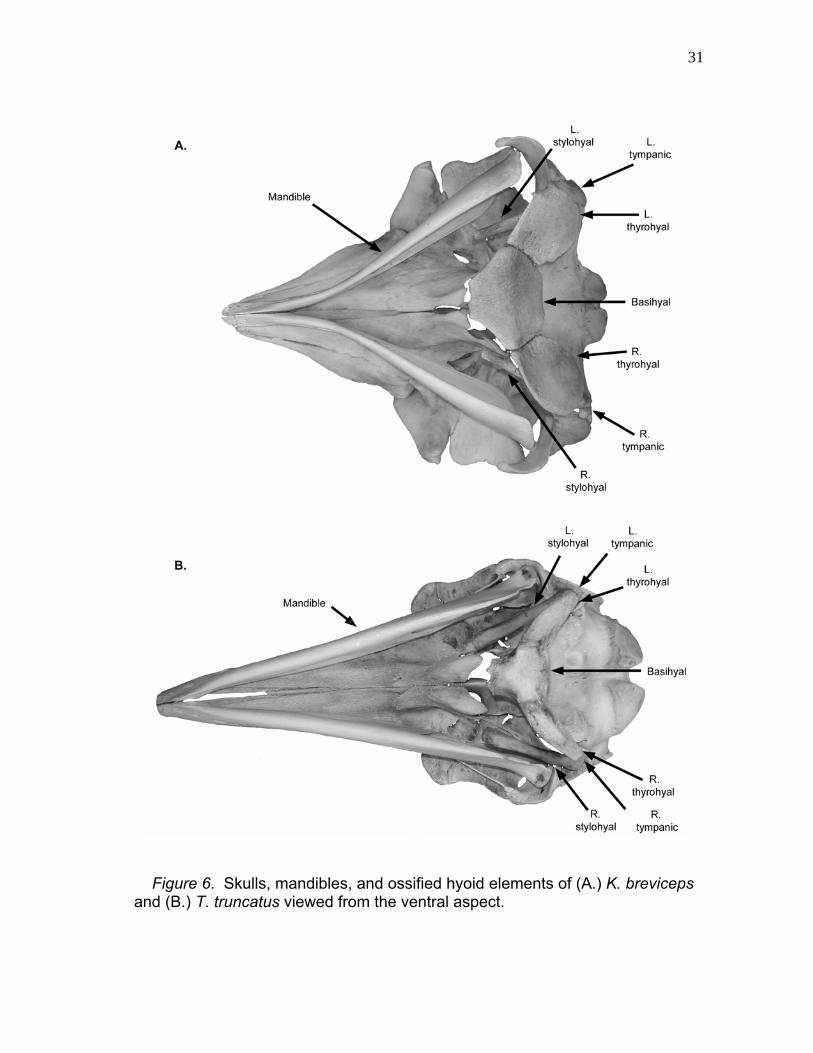
Figure 6. Skulls, mandibles, and ossified hyoid elements of (A.) K. breviceps and (B.) T. truncatus viewed from the ventral aspect.
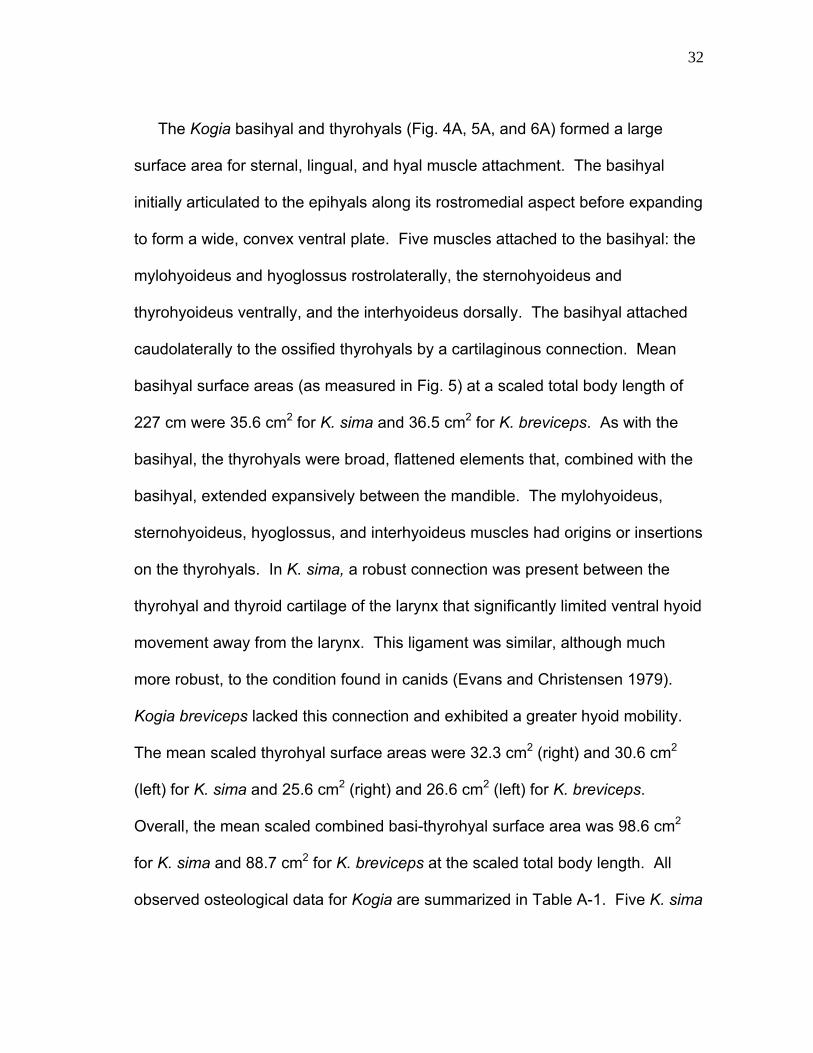
32
The Kogia basihyal and thyrohyals (Fig. 4A, 5A, and 6A) formed a large
surface area for sternal, lingual, and hyal muscle attachment. The basihyal
initially articulated to the epihyals along its rostromedial aspect before expanding
to form a wide, convex ventral plate. Five muscles attached to the basihyal: the
mylohyoideus and hyoglossus rostrolaterally, the sternohyoideus and
thyrohyoideus ventrally, and the interhyoideus dorsally. The basihyal attached
caudolaterally to the ossified thyrohyals by a cartilaginous connection. Mean
basihyal surface areas (as measured in Fig. 5) at a scaled total body length of
227 cm were 35.6 cm2 for K. sima and 36.5 cm2 for K. breviceps. As with the
basihyal, the thyrohyals were broad, flattened elements that, combined with the
basihyal, extended expansively between the mandible. The mylohyoideus,
sternohyoideus, hyoglossus, and interhyoideus muscles had origins or insertions
on the thyrohyals. In K. sima, a robust connection was present between the
thyrohyal and thyroid cartilage of the larynx that significantly limited ventral hyoid
movement away from the larynx. This ligament was similar, although much
more robust, to the condition found in canids (Evans and Christensen 1979).
Kogia breviceps lacked this connection and exhibited a greater hyoid mobility.
The mean scaled thyrohyal surface areas were 32.3 cm2 (right) and 30.6 cm2
(left) for K. sima and 25.6 cm2 (right) and 26.6 cm2 (left) for K. breviceps.
Overall, the mean scaled combined basi-thyrohyal surface area was 98.6 cm2
for K. sima and 88.7 cm2 for K. breviceps at the scaled total body length. All
observed osteological data for Kogia are summarized in Table A-1. Five K. sima
33
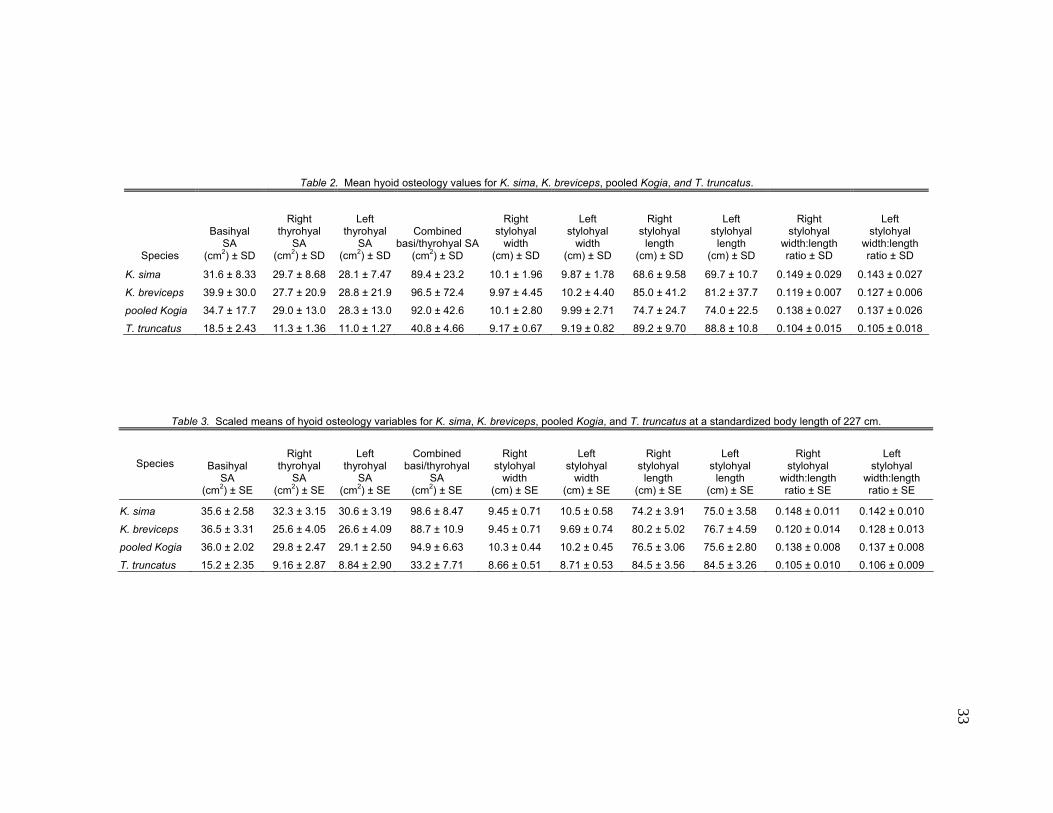
Table 2. Mean hyoid osteology values for K. sima, K. breviceps, pooled Kogia, and T. truncatus.
Species
Basihyal SA
(cm2) ± SD
Right thyrohyal
SA (cm2) ± SD
Left thyrohyal
SA (cm2) ± SD
Combined basi/thyrohyal SA
(cm2) ± SD
Right stylohyal
width (cm) ± SD
Left stylohyal
width (cm) ± SD
Right stylohyal
length (cm) ± SD
Left stylohyal
length (cm) ± SD
Right stylohyal
width:length ratio ± SD
Left stylohyal
width:length ratio ± SD
K. sima 31.6 ± 8.33 29.7 ± 8.68 28.1 ± 7.47 89.4 ± 23.2 10.1 ± 1.96 9.87 ± 1.78 68.6 ± 9.58 69.7 ± 10.7 0.149 ± 0.029 0.143 ± 0.027
K. breviceps 39.9 ± 30.0 27.7 ± 20.9 28.8 ± 21.9 96.5 ± 72.4 9.97 ± 4.45 10.2 ± 4.40 85.0 ± 41.2 81.2 ± 37.7 0.119 ± 0.007 0.127 ± 0.006
pooled Kogia 34.7 ± 17.7 29.0 ± 13.0 28.3 ± 13.0 92.0 ± 42.6 10.1 ± 2.80 9.99 ± 2.71 74.7 ± 24.7 74.0 ± 22.5 0.138 ± 0.027 0.137 ± 0.026
T. truncatus 18.5 ± 2.43 11.3 ± 1.36 11.0 ± 1.27 40.8 ± 4.66 9.17 ± 0.67 9.19 ± 0.82 89.2 ± 9.70 88.8 ± 10.8 0.104 ± 0.015 0.105 ± 0.018
Table 3. Scaled means of hyoid osteology variables for K. sima, K. breviceps, pooled Kogia, and T. truncatus at a standardized body length of 227 cm.
Species Basihyal SA
(cm2) ± SE
Right thyrohyal
SA (cm2) ± SE
Left thyrohyal
SA (cm2) ± SE
Combined basi/thyrohyal
SA (cm2) ± SE
Right stylohyal
width (cm) ± SE
Left stylohyal
width (cm) ± SE
Right stylohyal
length (cm) ± SE
Left stylohyal
length (cm) ± SE
Right stylohyal
width:length ratio ± SE
Left stylohyal
width:length ratio ± SE
K. sima 35.6 ± 2.58 32.3 ± 3.15 30.6 ± 3.19 98.6 ± 8.47 9.45 ± 0.71 10.5 ± 0.58 74.2 ± 3.91 75.0 ± 3.58 0.148 ± 0.011 0.142 ± 0.010
K. breviceps 36.5 ± 3.31 25.6 ± 4.05 26.6 ± 4.09 88.7 ± 10.9 9.45 ± 0.71 9.69 ± 0.74 80.2 ± 5.02 76.7 ± 4.59 0.120 ± 0.014 0.128 ± 0.013
pooled Kogia 36.0 ± 2.02 29.8 ± 2.47 29.1 ± 2.50 94.9 ± 6.63 10.3 ± 0.44 10.2 ± 0.45 76.5 ± 3.06 75.6 ± 2.80 0.138 ± 0.008 0.137 ± 0.008
T. truncatus 15.2 ± 2.35 9.16 ± 2.87 8.84 ± 2.90 33.2 ± 7.71 8.66 ± 0.51 8.71 ± 0.53 84.5 ± 3.56 84.5 ± 3.26 0.105 ± 0.010 0.106 ± 0.009
33

34
and four K. breviceps were incorporated in hyoid morphometry. Overall mean
values for hyoid osteology and at the standardized total body length are
summarized in Tables 2 and 3.
3.2 Tursiops truncatus Hyolingual Osteology
The same hyoid elements identified in Kogia were also found in T. truncatus:
tympanohyal, stylohyal, epihyal, ceratohyal, basihyal, and thyrohyal. Overall, the
hyoid chain was situated medially between the mandible and progressed
rostroventrally until the epihyals turned caudoventrally to the basihyal. The
tympanohyal, epihyal, and ceratohyal appeared reduced and lacked ossification.
The thyrohyals branched caudolaterally and were fused to the basihyal in larger
specimens. Basihyal and thyrohyal surface areas were reduced relative to
Kogia, although one additional muscle was found to insert on the lateral
thyrohyal. The T. truncatus hyoid was also of higher density than in Kogia. All
hyoid elements sank when placed in water and the pitted appearance present in
Kogia basihyal and thyrohyals was absent. The hyoid was capable of significant
ventrocaudal movement, with the tympanohyal, stylohyal, and epihyal capable of
-30˚ retraction from the basal position relative to the palatal plane (Fig. 4B).
However, the basihyal and thyrohyals were generally constrained from
significant extension, as the interhyoideus muscle between the stylohyal and the
basihyal and thyrohyal severely limited movement between these elements.
Tursiops truncatus tympanohyal, epihyal, and ceratohyal characteristics were
similar in several aspects to Kogia. The cartilaginous tympanohyal connected to
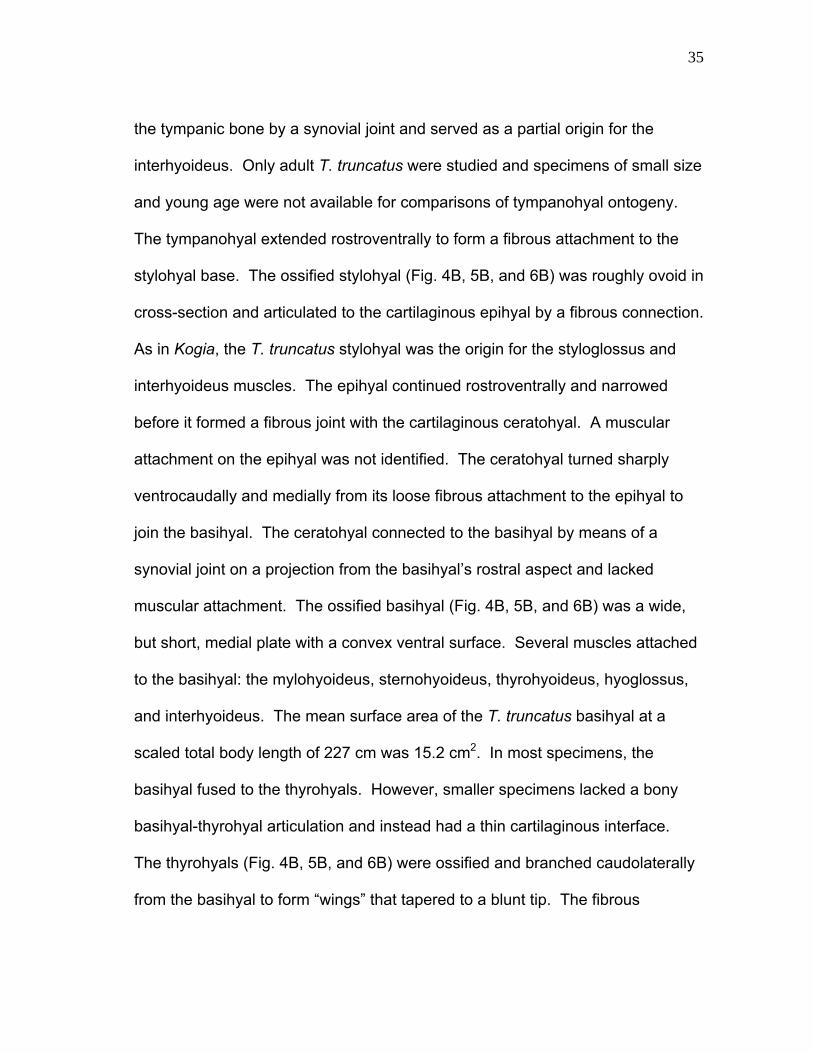
35
the tympanic bone by a synovial joint and served as a partial origin for the
interhyoideus. Only adult T. truncatus were studied and specimens of small size
and young age were not available for comparisons of tympanohyal ontogeny.
The tympanohyal extended rostroventrally to form a fibrous attachment to the
stylohyal base. The ossified stylohyal (Fig. 4B, 5B, and 6B) was roughly ovoid in
cross-section and articulated to the cartilaginous epihyal by a fibrous connection.
As in Kogia, the T. truncatus stylohyal was the origin for the styloglossus and
interhyoideus muscles. The epihyal continued rostroventrally and narrowed
before it formed a fibrous joint with the cartilaginous ceratohyal. A muscular
attachment on the epihyal was not identified. The ceratohyal turned sharply
ventrocaudally and medially from its loose fibrous attachment to the epihyal to
join the basihyal. The ceratohyal connected to the basihyal by means of a
synovial joint on a projection from the basihyal’s rostral aspect and lacked
muscular attachment. The ossified basihyal (Fig. 4B, 5B, and 6B) was a wide,
but short, medial plate with a convex ventral surface. Several muscles attached
to the basihyal: the mylohyoideus, sternohyoideus, thyrohyoideus, hyoglossus,
and interhyoideus. The mean surface area of the T. truncatus basihyal at a
scaled total body length of 227 cm was 15.2 cm2. In most specimens, the
basihyal fused to the thyrohyals. However, smaller specimens lacked a bony
basihyal-thyrohyal articulation and instead had a thin cartilaginous interface.
The thyrohyals (Fig. 4B, 5B, and 6B) were ossified and branched caudolaterally
from the basihyal to form “wings” that tapered to a blunt tip. The fibrous
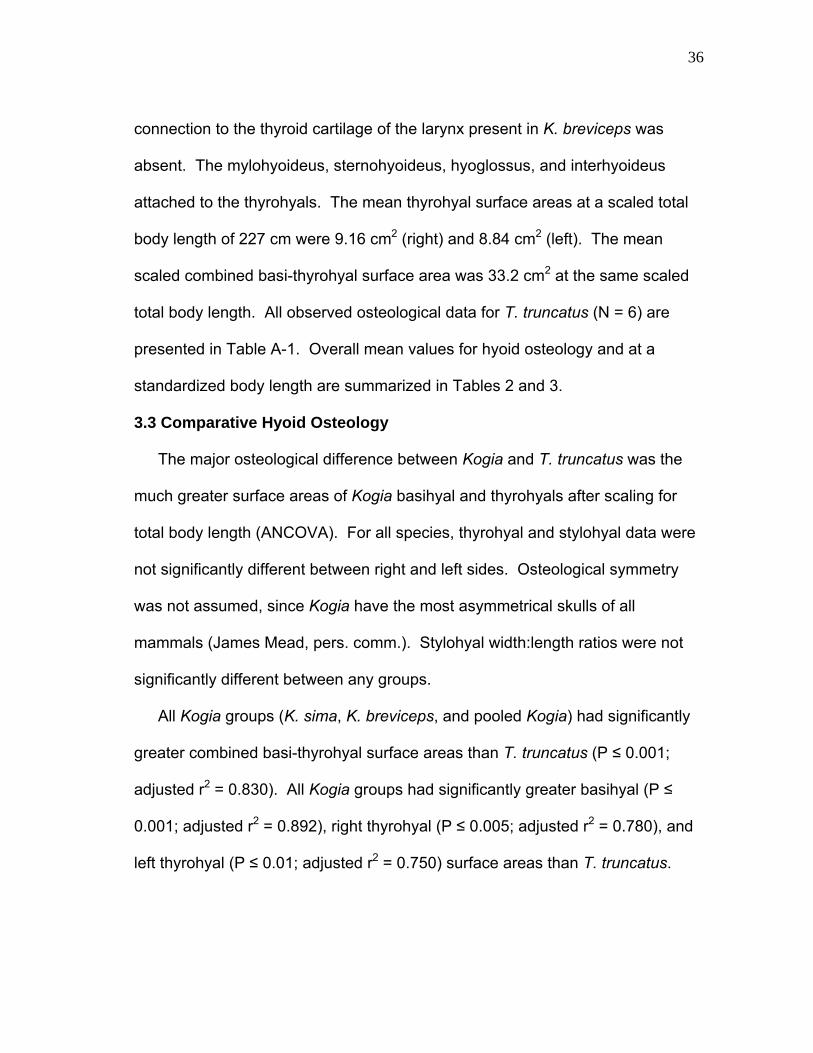
36
connection to the thyroid cartilage of the larynx present in K. breviceps was
absent. The mylohyoideus, sternohyoideus, hyoglossus, and interhyoideus
attached to the thyrohyals. The mean thyrohyal surface areas at a scaled total
body length of 227 cm were 9.16 cm2 (right) and 8.84 cm2 (left). The mean
scaled combined basi-thyrohyal surface area was 33.2 cm2 at the same scaled
total body length. All observed osteological data for T. truncatus (N = 6) are
presented in Table A-1. Overall mean values for hyoid osteology and at a
standardized body length are summarized in Tables 2 and 3.
3.3 Comparative Hyoid Osteology
The major osteological difference between Kogia and T. truncatus was the
much greater surface areas of Kogia basihyal and thyrohyals after scaling for
total body length (ANCOVA). For all species, thyrohyal and stylohyal data were
not significantly different between right and left sides. Osteological symmetry
was not assumed, since Kogia have the most asymmetrical skulls of all
mammals (James Mead, pers. comm.). Stylohyal width:length ratios were not
significantly different between any groups.
All Kogia groups (K. sima, K. breviceps, and pooled Kogia) had significantly
greater combined basi-thyrohyal surface areas than T. truncatus (P ≤ 0.001;
adjusted r2 = 0.830). All Kogia groups had significantly greater basihyal (P ≤
0.001; adjusted r2 = 0.892), right thyrohyal (P ≤ 0.005; adjusted r2 = 0.780), and
left thyrohyal (P ≤ 0.01; adjusted r2 = 0.750) surface areas than T. truncatus.

37
3.4 Kogia Hyolingual Myology
Investigations of Kogia hyolingual myology investigated the following
muscles: mylohyoideus, geniohyoideus, sternohyoideus, thyrohyoideus,
hyoglossus, interhyoideus, genioglossus, styloglossus, and sternothyroideus.
Myology was characterized by bilateral strap muscles that, with the exception of
lingual insertions, attached by aponeuroses to ossified and cartilaginous hyal,
laryngeal, and sternal elements. Of these muscles, the sternohyoideus was the
most massive and covered nearly the entire ventral basihyal and thyrohyal
surfaces. Means of Kogia hyolingual muscle variables are summarized in
Tables 4 through 6. Predicted values at a standardized total body length of 252
cm are presented in Tables 7 through 9. All observed myological data for K.
sima and K. breviceps muscle dimensions, cross-sectional areas, and maximum
tetanic tensions are available in Tables B-1 through B-22.

38
Table 4. Mean hyolingual myology length and angle values for K. sima, K. breviceps, pooled Kogia, and T. truncatus.
Muscle Species Length
(mm) ± SD Parasagittal angle
± SD Transverse angle
± SD Mylohyoideus K. sima 84.9 ± 13.0 -68.0 ± 12.9 -83.3 ± 22.0
K. breviceps 161.6 ± 37.3 -104.1 ± 5.48 -94.3 ± 13.9 pooled Kogia 110.5 ± 44.1 -80.0 ± 21.3 -87.0 ± 19.0 T. truncatus 80.2 ± 14.7 -69.7 ± 17.7 -82.3 ± 8.21
Geniohyoideus K. sima 132.0 ± 36.2 -14.5 ± 3.54 7.02 ± 1.01 K. breviceps 198.4 ± 101.5 -12.5 ± 13.4 7.14 ± 7.98 pooled Kogia 156.9 ± 69.8 -13.5 ± 8.10 7.07 ± 4.33 T. truncatus 213.6 ± 48.4 -23.6 ± 11.4 -1.27 ± 3.53
Sternohyoideus K. sima 255.0 ± 43.7 156.3 ± 6.35 10.4 ± 1.93 K. breviceps 259.8 ± 156.7 164.5 ± 4.95 6.84 ± 2.60 pooled Kogia 256.9 ± 84.3 159.6 ± 6.80 9.00 ± 2.73 T. truncatus 230.6 ± 40.4 152.6 ± 5.94 9.40 ± 3.23
Thyrohyoideus K. sima 88.4 ± 22.4 -166.3 ± 9.87 -14.3 ± 3.12 K. breviceps 113.6 ± 46.3 -157.0 ± 11.3 -6.42 ± 3.52 pooled Kogia 97.9 ± 32.7 -162.6 ± 10.3 -11.3 ± 5.05 T. truncatus 62.3 ± 14.6 -149.6 ± 20.0 -21.7 ± 20.4
Stylohyoideus T. truncatus 29.0 ± 13.1 -64.1 ± 9.48 -41.4 ± 6.70 Hyoglossus K. sima 114.4 ± 29.8 147.2 ± 10.5 -8.61 ± 3.14
K. breviceps 169.7 ± 50.7 128.0 ± 5.66 -26.9 ± 9.02 pooled Kogia 132.8 ± 43.2 141.7 ± 12.9 -14.7 ± 10.5 T. truncatus 171.6 ± 58.2 151.5 ± 8.78 -9.25 ± 13.0
Interhyoideus K. sima 16.8 ± 4.22 -133.2 ± 20.9 163.1 ± 11.7 K. breviceps 12.0 ± 3.11 -142.0 ± 5.66 136.0 ± 44.3 pooled Kogia 15.2 ± 4.34 -136.2 ± 17.0 154.0 ± 25.9 T. truncatus 12.7 ± 0.53 -138.3 ± 20.0 163.2 ± 14.8
Genioglossus K. sima 141.0 ± 12.4 -9.00 ± 3.61 -1.15 ± 6.13 K. breviceps 191.8 ± 93.9 -8.00 ± 3.46 -2.22 ± 6.94 pooled Kogia 160.0 ± 57.4 -8.63 ± 3.34 -1.55 ± 5.96 T. truncatus 202.2 ± 35.4 -11.7 ± 9.03 -2.33 ± 3.43
Styloglossus K. sima 139.5 ± 26.5 164.8 ± 5.72 -17.1 ± 5.16 K. breviceps 175.1 ± 67.2 156.3 ± 3.22 -4.83 ± 0.52 pooled Kogia 152.8 ± 45.1 161.6 ± 6.39 -12.5 ± 7.45 T. truncatus 204.9 ± 23.3 170.8 ± 3.82 -10.6 ± 1.59
Sternothyroideus K. sima 169.8 ± 21.4 148.5 ± 0.71 -6.34 ± 0.47 K. breviceps 181.7 ± 86.0 153.0 ± 7.07 -10.6 ± 11.0 pooled Kogia 175.8 ± 51.6 150.8 ± 4.86 -8.54 ± 6.83 T. truncatus 157.6 ± 18.8 134.8 ± 27.8 -1.40 ± 4.21
Cricothyroideus T. truncatus 58.0 ± 9.31 142.0 ± 9.78 17.9 ± 6.22
39
Table 5. Mean hyolingual myology height, width and mass values for K. sima, K. breviceps, pooled Kogia, and T. truncatus.
Muscle Species Height
(mm) ± SD Width
(mm) ± SD Mass
(g) ± SD Mylohyoideus K. sima 9.59 ± 4.21 181.9 ± 15.9 58.2 ± 10.7
K. breviceps 8.03 ± 2.96 282.5 ± 31.8 184.7 ± 0.87 pooled Kogia 9.07 ± 3.61 215.5 ± 55.2 100.4 ± 65.8 T. truncatus 7.40 ± 2.14 178.9 ± 75.7 97.1 ± 51.2
Geniohyoideus K. sima 8.86 ± 3.05 30.0 ± 6.30 26.1 ± 7.96 K. breviceps 9.64 ± 3.85 32.8 ± 9.58 34.5 ± 26.4 pooled Kogia 9.15 ± 3.12 31.1 ± 7.15 29.3 ± 16.0 T. truncatus 11.6 ± 3.40 38.7 ± 21.3 40.8 ± 10.9
Sternohyoideus K. sima 30.8 ± 1.59 66.9 ± 4.72 329.2 ± 37.4 K. breviceps 25.5 ± 9.96 63.5 ± 35.8 321.3 ± 354.6 pooled Kogia 28.7 ± 5.86 65.6 ± 18.3 326.0 ± 179.3 T. truncatus 33.3 ± 6.24 57.3 ± 8.83 266.2 ± 94.7
Thyrohyoideus K. sima 5.65 ± 0.87 27.8 ± 5.67 7.61 ± 2.74 K. breviceps 6.26 ± 1.04 25.7 ± 5.63 14.6 ± 9.00 pooled Kogia 5.88 ± 0.92 27.0 ± 5.34 10.2 ± 6.37 T. truncatus 6.18 ± 1.58 36.5 ± 3.53 8.40 ± 1.15
Stylohyoideus T. truncatus 12.6 ± 2.63 3.60 ± 0.083 1.47 ± 0.65 Hyoglossus K. sima 5.82 ± 2.87 15.5 ± 6.52 6.54 ± 2.41
K. breviceps 3.87 ± 0.88 35.4 ± 6.34 22.0 ± 10.4 pooled Kogia 5.17 ± 2.47 22.1 ± 11.8 11.7 ± 9.38 T. truncatus 8.16 ± 2.41 53.8 ± 16.3 49.7 ± 13.8
Interhyoideus K. sima 34.3 ± 7.72 125.2 ± 12.7 36.9 ± 9.82 K. breviceps 25.4 ± 13.3 145.3 ± 115.5 42.2 ± 49.4 pooled Kogia 31.3 ± 9.60 131.9 ± 53.6 38.6 ± 23.5 T. truncatus 28.8 ± 16.0 93.5 ± 9.31 19.7 ± 10.1
Genioglossus K. sima 10.4 ± 4.04 22.6 ± 7.52 22.5 ± 6.98 K. breviceps 9.16 ± 1.18 24.4 ± 7.95 40.8 ± 25.5 pooled Kogia 9.94 ± 3.18 23.3 ± 7.16 29.4 ± 17.4 T. truncatus 7.14 ± 1.93 26.5 ± 9.11 31.0 ± 12.6
Styloglossus K. sima 12.4 ± 3.19 5.11 ± 2.71 7.45 ± 1.29 K. breviceps 13.5 ± 3.26 4.16 ± 0.89 16.83 ± 12.4 pooled Kogia 12.8 ± 3.03 4.76 ± 2.16 11.0 ± 8.25 T. truncatus 18.6 ± 3.59 5.58 ± 1.34 22.5 ± 4.91
Sternothyroideus K. sima 36.2 ± 2.47 15.0 ± 1.78 75.3 ± 1.49 K. breviceps 28.7 ± 12.5 8.71 ± 2.57 53.5 ± 56.1 pooled Kogia 32.4 ± 8.54 11.9 ± 4.08 64.4 ± 34.7 T. truncatus 23.2 ± 1.42 9.92 ± 2.15 28.5 ± 4.84
Cricothyroideus T. truncatus 3.39 ± 1.08 38.4 ± 7.58 5.24 ± 1.54
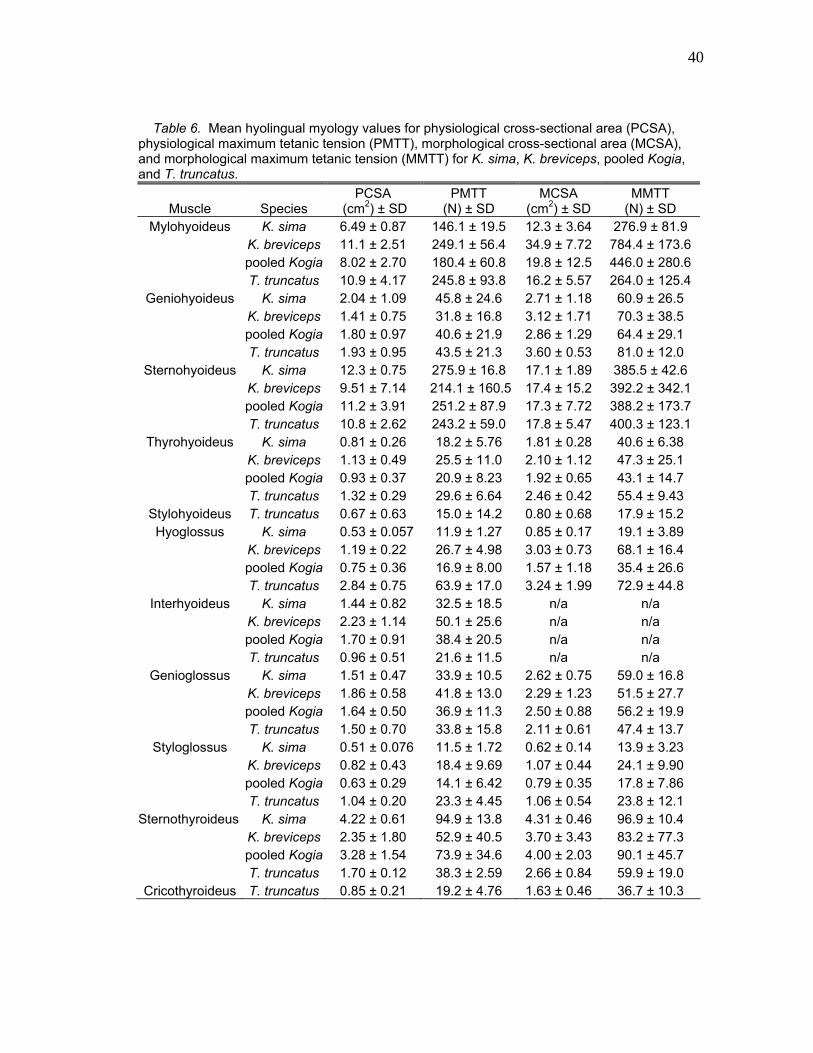
40
Table 6. Mean hyolingual myology values for physiological cross-sectional area (PCSA), physiological maximum tetanic tension (PMTT), morphological cross-sectional area (MCSA), and morphological maximum tetanic tension (MMTT) for K. sima, K. breviceps, pooled Kogia, and T. truncatus.
Muscle Species PCSA
(cm2) ± SD PMTT
(N) ± SD MCSA
(cm2) ± SD MMTT
(N) ± SD Mylohyoideus K. sima 6.49 ± 0.87 146.1 ± 19.5 12.3 ± 3.64 276.9 ± 81.9
K. breviceps 11.1 ± 2.51 249.1 ± 56.4 34.9 ± 7.72 784.4 ± 173.6 pooled Kogia 8.02 ± 2.70 180.4 ± 60.8 19.8 ± 12.5 446.0 ± 280.6 T. truncatus 10.9 ± 4.17 245.8 ± 93.8 16.2 ± 5.57 264.0 ± 125.4
Geniohyoideus K. sima 2.04 ± 1.09 45.8 ± 24.6 2.71 ± 1.18 60.9 ± 26.5 K. breviceps 1.41 ± 0.75 31.8 ± 16.8 3.12 ± 1.71 70.3 ± 38.5 pooled Kogia 1.80 ± 0.97 40.6 ± 21.9 2.86 ± 1.29 64.4 ± 29.1 T. truncatus 1.93 ± 0.95 43.5 ± 21.3 3.60 ± 0.53 81.0 ± 12.0
Sternohyoideus K. sima 12.3 ± 0.75 275.9 ± 16.8 17.1 ± 1.89 385.5 ± 42.6 K. breviceps 9.51 ± 7.14 214.1 ± 160.5 17.4 ± 15.2 392.2 ± 342.1 pooled Kogia 11.2 ± 3.91 251.2 ± 87.9 17.3 ± 7.72 388.2 ± 173.7 T. truncatus 10.8 ± 2.62 243.2 ± 59.0 17.8 ± 5.47 400.3 ± 123.1
Thyrohyoideus K. sima 0.81 ± 0.26 18.2 ± 5.76 1.81 ± 0.28 40.6 ± 6.38 K. breviceps 1.13 ± 0.49 25.5 ± 11.0 2.10 ± 1.12 47.3 ± 25.1 pooled Kogia 0.93 ± 0.37 20.9 ± 8.23 1.92 ± 0.65 43.1 ± 14.7 T. truncatus 1.32 ± 0.29 29.6 ± 6.64 2.46 ± 0.42 55.4 ± 9.43
Stylohyoideus T. truncatus 0.67 ± 0.63 15.0 ± 14.2 0.80 ± 0.68 17.9 ± 15.2 Hyoglossus K. sima 0.53 ± 0.057 11.9 ± 1.27 0.85 ± 0.17 19.1 ± 3.89
K. breviceps 1.19 ± 0.22 26.7 ± 4.98 3.03 ± 0.73 68.1 ± 16.4 pooled Kogia 0.75 ± 0.36 16.9 ± 8.00 1.57 ± 1.18 35.4 ± 26.6 T. truncatus 2.84 ± 0.75 63.9 ± 17.0 3.24 ± 1.99 72.9 ± 44.8
Interhyoideus K. sima 1.44 ± 0.82 32.5 ± 18.5 n/a n/a K. breviceps 2.23 ± 1.14 50.1 ± 25.6 n/a n/a pooled Kogia 1.70 ± 0.91 38.4 ± 20.5 n/a n/a T. truncatus 0.96 ± 0.51 21.6 ± 11.5 n/a n/a
Genioglossus K. sima 1.51 ± 0.47 33.9 ± 10.5 2.62 ± 0.75 59.0 ± 16.8 K. breviceps 1.86 ± 0.58 41.8 ± 13.0 2.29 ± 1.23 51.5 ± 27.7 pooled Kogia 1.64 ± 0.50 36.9 ± 11.3 2.50 ± 0.88 56.2 ± 19.9 T. truncatus 1.50 ± 0.70 33.8 ± 15.8 2.11 ± 0.61 47.4 ± 13.7
Styloglossus K. sima 0.51 ± 0.076 11.5 ± 1.72 0.62 ± 0.14 13.9 ± 3.23 K. breviceps 0.82 ± 0.43 18.4 ± 9.69 1.07 ± 0.44 24.1 ± 9.90 pooled Kogia 0.63 ± 0.29 14.1 ± 6.42 0.79 ± 0.35 17.8 ± 7.86 T. truncatus 1.04 ± 0.20 23.3 ± 4.45 1.06 ± 0.54 23.8 ± 12.1
Sternothyroideus K. sima 4.22 ± 0.61 94.9 ± 13.8 4.31 ± 0.46 96.9 ± 10.4 K. breviceps 2.35 ± 1.80 52.9 ± 40.5 3.70 ± 3.43 83.2 ± 77.3 pooled Kogia 3.28 ± 1.54 73.9 ± 34.6 4.00 ± 2.03 90.1 ± 45.7 T. truncatus 1.70 ± 0.12 38.3 ± 2.59 2.66 ± 0.84 59.9 ± 19.0
Cricothyroideus T. truncatus 0.85 ± 0.21 19.2 ± 4.76 1.63 ± 0.46 36.7 ± 10.3

41
Table 7. Scaled means of hyolingual myology length and angle variables for K. sima, K. breviceps, pooled Kogia, and T. truncatus at a standardized body length of 252 cm. Cricothyroideus and stylohyoideus values are set to 241 cm for greater accuracy in T. truncatus scaling.
Muscle Species Length
(mm) ± SE Parasagittal angle
± SE Transverse angle
± SE Mylohyoideus K. sima 107.4 ± 12.6 -69.7 ± 9.81 -82.9 ± 9.84
K. breviceps 117.0 ± 22.3 -67.6 ± 17.3 -82.9 ± 17.4 pooled Kogia 110.6 ± 10.0 -69.0 ± 7.77 -82.9 ± 7.80 T. truncatus 101.2 ± 10.7 -79.3 ± 8.30 -88.6 ± 8.33
Geniohyoideus K. sima 137.7 ± 35.3 -14.5 ± 7.55 8.49 ± 2.91 K. breviceps 187.0 ± 62.5 -3.13 ± 13.9 10.4 ± 5.14 pooled Kogia 154.2 ± 28.0 -10.7 ± 6.19 9.12 ± 2.30 T. truncatus 208.6 ± 29.9 -23.6± 5.05 -0.52 ± 2.46
Sternohyoideus K. sima 300.1 ± 24.3 160.4 ± 4.02 7.95 ± 1.54 K. breviceps 291.6 ± 42.9 166.2 ± 7.38 9.98 ± 2.73 pooled Kogia 297.3 ± 19.2 162.3 ± 3.30 8.62 ± 1.22 T. truncatus 245.8 ± 20.5 153.0 ± 2.69 7.75 ± 1.30
Thyrohyoideus K. sima 103.6 ± 3.28 -161.4 ± 13.0 -13.9 ± 2.70 K. breviceps 105.1 ± 5.81 -160.8 ± 23.9 -11.4 ± 4.78 pooled Kogia 104.1 ± 2.60 -161.2 ± 10.7 -13.0 ± 2.14 T. truncatus 79.6 ± 2.78 -146.9 ± 8.73 -8.12 ± 2.28
Stylohyoideus T. truncatus 29.0 ± 1.78 -64.1 ± 0.96 -41.4 ± 5.06 Hyoglossus K. sima 130.4 ± 36.8 148.6 ± 10.6 -13.7 ± 8.77
K. breviceps 102.1 ± 65.2 142.9 ± 19.5 -17.6 ± 15.5 pooled Kogia 121.0 ± 29.2 146.7 ± 8.71 -15.0 ± 6.94 T. truncatus 199.4 ± 31.2 148.6 ± 7.11 -16.0 ± 7.41
Interhyoideus K. sima 18.6 ± 1.00 -121.6 ± 13.7 172.4 ± 7.67 K. breviceps 17.7 ± 1.77 -133.8 ± 24.2 162.1 ± 13.6 pooled Kogia 18.3 ± 0.79 -125.6 ± 10.8 169.0 ± 6.08 T. truncatus 11.6 ± 0.84 -142.0 ± 11.6 164.8 ± 6.49
Genioglossus K. sima 156.0 ± 36.9 -7.98 ± 5.10 0.31 ± 3.148 K. breviceps 205.2 ± 65.2 -9.08 ± 9.36 -1.31 ± 5.57 pooled Kogia 172.4 ± 29.2 -8.35 ± 4.18 -0.90 ± 2.49 T. truncatus 227.8 ± 31.2 -9.38 ± 3.41 -2.98 ± 2.66
Styloglossus K. sima 169.5 ± 19.7 166.8 ± 3.54 -17.3 ± 5.00 K. breviceps 194.6 ± 34.9 165.7 ± 6.49 -13.2 ± 8.84 pooled Kogia 177.9 ± 15.6 166.4 ± 2.90 -15.9 ± 3.96 T. truncatus 220.3 ± 16.7 169.7 ± 2.37 -8.10 ± 4.23
Sternothyroideus K. sima 186.6 ± 11.3 147.6 ± 16.6 -8.71 ± 1.04 K. breviceps 182.3 ± 20.0 152.0 ± 30.5 -9.94 ± 1.83 pooled Kogia 185.1 ± 9.0 149.1 ± 13.6 -9.12 ± 0.82 T. truncatus 177.9 ± 9.57 133.9 ± 11.1 -1.43 ± 0.88
Cricothyroideus T. truncatus 60.8 ± 5.9 145.0 ± 4.93 15.2 ± 0.39

42
Table 8. Scaled means of hyolingual myology height, width, and mass variables for K. sima, K. breviceps, pooled Kogia, and T. truncatus at a standardized body length of 252 cm. Cricothyroideus and stylohyoideus values are set to 241 cm for greater accuracy in T. truncatus scaling.
Muscle Species Height
(mm) ± SE Width
(mm) ± SE Mass
(g) ± SE Mylohyoideus K. sima 11.1 ± 3.24 193.3 ± 51.2 93.3 ± 11.1
K. breviceps 11.7 ± 5.74 256.8 ± 90.6 82.0 ± 19.6 pooled Kogia 11.3 ± 2.57 214.5 ± 40.6 89.6 ± 8.78 T. truncatus 6.93 ± 2.74 193.1 ± 43.3 127.7 ± 9.38
Geniohyoideus K. sima 11.7 ± 2.00 40.1 ± 13.8 31.3 ± 6.91 K. breviceps 14.2 ± 3.54 22.2 ± 24.3 29.5 ± 12.2 pooled Kogia 12.5 ± 1.59 34.1 ± 10.9 30.7 ± 5.47 T. truncatus 9.91 ± 1.69 48.4 ± 11.6 49.7 ± 5.84
Sternohyoideus K. sima 31.5 ± 3.84 71.8 ± 5.19 406.7 ± 36.0 K. breviceps 26.7 ± 6.80 75.1 ± 9.18 365.0 ± 63.7 pooled Kogia 29.9 ± 3.05 72.9 ± 4.11 392.8 ± 28.6 T. truncatus 34.5 ± 3.25 65.1 ± 4.39 346.4 ± 30.5
Thyrohyoideus K. sima 5.87 ± 0.52 30.0 ± 1.78 11.8 ± 1.32 K. breviceps 6.53 ± 0.93 30.0 ± 3.14 13.5 ± 2.33 pooled Kogia 6.09 ± 0.42 30.0 ± 1.41 12.4 ± 1.04 T. truncatus 5.63 ± 0.44 34.4 ± 1.50 10.2 ± 1.11
Stylohyoideus T. truncatus 12.7 ± 1.48 3.60 ± 0.056 1.47 ± 0.17 Hyoglossus K. sima 7.07 ± 2.07 19.7 ± 8.08 11.0 ± 7.21
K. breviceps 5.28 ± 3.66 26.7 ± 14.3 1.26 ± 12.8 pooled Kogia 6.47 ± 1.64 22.1 ± 6.40 7.77 ± 5.71 T. truncatus 8.59 ± 1.75 48.0 ± 6.83 55.2 ± 6.10
Interhyoideus K. sima 37.2 ± 10.3 149.4 ± 17.3 50.8 ± 2.25 K. breviceps 26.7 ± 18.3 172.0 ± 30.5 50.8 ± 3.97 pooled Kogia 33.7 ± 8.18 156.9 ± 13.7 50.8 ± 1.78 T. truncatus 31.2 ± 8.74 109.8 ± 14.6 27.4 ± 1.90
Genioglossus K. sima 11.5 ± 3.21 27.3 ± 5.54 29.4 ± 4.06 K. breviceps 11.7 ± 5.68 24.1 ± 9.80 33.8 ± 7.19 pooled Kogia 11.6 ± 2.54 26.2 ± 4.39 30.9 ± 3.22 T. truncatus 5.30 ± 2.72 22.9 ± 4.69 32.5 ± 3.44
Styloglossus K. sima 15.3 ± 0.93 7.47 ± 1.61 12.5 ± 3.56 K. breviceps 15.3 ± 1.65 5.77 ± 2.84 15.5 ± 6.30 pooled Kogia 15.3 ± 0.74 6.90 ± 1.27 13.5 ± 2.82 T. truncatus 19.7 ± 0.79 5.50 ± 1.36 28.4 ± 3.01
Sternothyroideus K. sima 36.2 ± 1.62 14.2 ± 1.13 79.3 ± 1.02 K. breviceps 37.6 ± 2.86 13.4 ± 2.00 78.7 ± 1.81 pooled Kogia 36.6 ± 1.28 14.0 ± 0.90 79.1 ± 0.81 T. truncatus 23.5 ± 1.37 8.00 ± 0.96 34.4 ± 0.86
Cricothyroideus T. truncatus 3.92 ± 0.089 36.7 ± 5.08 5.23 ± 1.54
43
Table 9. Scaled means of hyolingual myology physiological cross-sectional area (PCSA), physiological maximum tetanic tension (PMTT), morphological cross-sectional area (MCSA), and morphological maximum tetanic tension (MMTT) for K. sima, K. breviceps, pooled Kogia, and T. truncatus at a standardized body length of 252 cm. Cricothyroideus and stylohyoideus values are set to 241cm for greater accuracy in T. truncatus scaling.
Muscle Species PCSA
(cm2) ± SE PMTT
(N) ± SE MCSA
(cm2) ± SE MMTT
(N) ± SE Mylohyoideus K. sima 8.00 ± 1.69 179.9 ± 38.1 18.0 ± 2.33 404.0 ± 52.5
K. breviceps 5.66 ± 3.00 127.3 ± 67.4 17.4 ± 4.12 391.9 ± 92.8 pooled Kogia 7.22 ± 1.34 162.4 ± 30.2 17.8 ± 1.85 400.0 ± 41.6 T. truncatus 12.0 ± 1.43 270.0 ± 32.2 19.7 ± 1.97 444.0 ± 44.4
Geniohyoideus K. sima 2.05 ± 0.60 46.1 ± 13.6 3.89 ± 0.49 87.5 ± 11.0 K. breviceps 1.38 ± 1.07 31.0 ± 24.0 3.66 ± 0.87 82.3 ± 19.5 pooled Kogia 1.82 ± 0.48 41.0 ± 10.7 3.81 ± 0.39 85.8 ± 8.75 T. truncatus 2.43 ± 0.51 54.6 ± 11.5 3.96 ± 0.42 89.0 ± 9.34
Sternohyoideus K. sima 12.8 ± 1.16 287.5 ± 26.1 19.6 ± 2.57 440.4 ± 57.7 K. breviceps 11.3 ± 2.05 253.4 ± 46.2 18.6 ± 4.54 418.7 ± 102.0 pooled Kogia 12.3 ± 0.92 276.1 ± 20.7 19.3 ± 2.03 433.2 ± 45.7 T. truncatus 12.8 ± 0.98 288.4 ± 22.1 22.8 ± 2.17 513.8 ± 48.8
Thyrohyoideus K. sima 1.05 ± 0.18 23.5 ± 3.99 1.71 ± 0.23 38.5 ± 5.22 K. breviceps 1.22 ± 0.31 27.4 ± 7.05 2.04 ± 0.41 45.8 ± 9.23 pooled Kogia 1.10 ± 0.14 24.8 ± 3.16 1.82 ± 0.18 40.9 ± 4.14 T. truncatus 1.24 ± 0.15 27.9 ± 3.37 2.41 ± 0.20 54.3 ± 4.42
Stylohyoideus T. truncatus 0.67 ± 0.018 15.0 ± 0.40 0.80 ± 0.012 17.9 ± 0.26 Hyoglossus K. sima 0.67 ± 0.31 15.2 ± 6.92 1.23 ± 1.13 27.6 ± 25.3
K. breviceps 0.60 ± 0.54 13.5 ± 12.2 0.64 ± 1.99 14.4 ± 44.8 pooled Kogia 0.65 ± 0.24 14.6 ± 5.48 1.03 ± 0.89 23.2 ± 20.1 T. truncatus 2.69 ± 0.26 60.5 ± 5.86 3.65 ± 0.95 82.1 ± 21.4
Interhyoideus K. sima 1.30 ± 0.34 29.2 ± 7.62 n/a n/a K. breviceps 1.63 ± 0.60 36.6 ± 13.5 n/a n/a pooled Kogia 1.41 ± 0.27 31.7 ± 6.04 n/a n/a T. truncatus 0.90 ± 0.29 20.2 ± 6.45 n/a n/a
Genioglossus K. sima 1.68 ± 0.19 37.7 ± 4.19 2.08 ± 0.31 46.9 ± 7.05 K. breviceps 1.54 ± 0.33 34.7 ± 7.40 1.82 ± 0.55 40.9 ± 12.5 pooled Kogia 1.63 ± 0.15 36.7 ± 3.32 2.00 ± 0.25 44.9 ± 5.59 T. truncatus 1.32 ± 0.16 29.7 ± 3.54 1.75 ± 0.27 39.4 ± 5.96
Styloglossus K. sima 0.66 ± 0.10 14.9 ± 2.29 0.81 ± 0.28 18.2 ± 6.33 K. breviceps 0.69 ± 0.18 15.6 ± 4.04 0.47 ± 0.50 10.6 ± 11.2 pooled Kogia 0.67 ± 0.080 15.2 ± 1.81 0.70 ± 0.22 15.6 ± 5.01 T. truncatus 1.25 ± 0.086 28.1 ± 1.93 1.22 ± 0.24 27.5 ± 5.35
Sternothyroideus K. sima 4.12 ± 0.34 92.7 ± 7.66 4.52 ± 0.78 101.8 ± 17.5 K. breviceps 3.98 ± 0.60 89.5 ± 13.5 5.35 ± 1.38 120.3 ± 31.0 pooled Kogia 4.07 ± 0.27 91.6 ± 6.07 4.80 ± 0.62 108.0 ± 13.9 T. truncatus 1.66 ± 0.29 37.4 ± 6.48 2.93 ± 0.66 66.0 ± 14.8
Cricothyroideus T. truncatus 0.80 ± 0.17 18.0 ± 3.84 1.48 ± 0.34 33.2 ± 7.67

44
3.4.1 Mylohyoideus
The mylohyoideus (Fig. 7 and 8) was a broad, relatively thin muscle that
originated upon the ventromedial mandibular border of both rami from the
mandibular symphasis to near the mandible’s caudal extent. Right and left
muscles inserted to a ventromedial raphe that formed a ventral lingual sling.
The insertion extended from the mandibular symphasis, rostrally, to near the
rostral basihyal border, caudally, where a “V” shaped fascial sheet joined right
and left muscles. Although thin medially (2-3 mm), the mylohyoideus thickened
(2-3 cm) laterally near its origin. Based on observed data, each mylohyoideus
was predicted to have a PMTT (MMTT) at a total body length of 252 cm of 179.9
N (404.0 N) at an angle of 110.3° relative to the palatal plane in K. sima, and
127.3 N (391.9 N) at 112.4° in K. breviceps, and 162.4 N (400.0 N) at 111.0° in
pooled Kogia. These values support the mylohyoideus as the second most
powerful Kogia hyolingual muscle. The mylohyoideus likely assisted in hyoid
return to its basal position. The mylohyoideus was tightly adhered to the
superficial platysma and digastricus, while the deep stylohyoideus, styloglossus,
hyoglossus, and genioglossus were loosely attached to the mylohyoideus by
fascia.

45
Figure 7. Caudal musculature associated with the Kogia hyolingual complex. MH = mylohyoideus, GH = geniohyoideus, SteH = sternohyoideus, TH = thyrohyoideus, and SC = sternocephalicus.
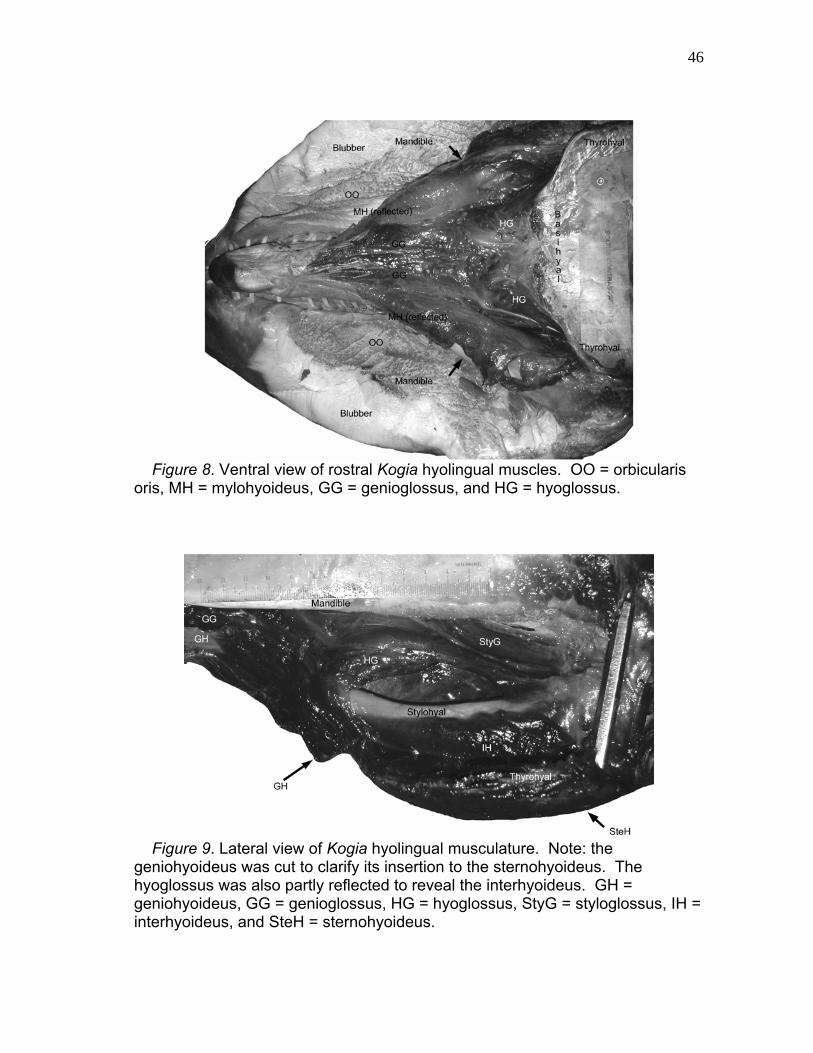
46
Figure 8. Ventral view of rostral Kogia hyolingual muscles. OO = orbicularis oris, MH = mylohyoideus, GG = genioglossus, and HG = hyoglossus.
Figure 9. Lateral view of Kogia hyolingual musculature. Note: the geniohyoideus was cut to clarify its insertion to the sternohyoideus. The hyoglossus was also partly reflected to reveal the interhyoideus. GH = geniohyoideus, GG = genioglossus, HG = hyoglossus, StyG = styloglossus, IH = interhyoideus, and SteH = sternohyoideus.

47
3.4.2 Geniohyoideus
The geniohyoideus (Fig. 7 and 9) originated upon the caudoventral surface of
the mandibular symphasis by a long tendon shared by right and left muscles.
Although fascicles intermingled caudally, a distinct division was present between
right and left muscles. A bony insertion was lacking, but an attachment directly
to the rostromedial border of the sternohyoideus was present. Muscle
measurements support predicted geniohyoideus PMTT (MMTT) and angles of
46.1 N (87.5 N) at 165.5° (relative to the palatal plane) in K. sima, 31.0 N (82.3
N) at 176.9° in K. breviceps, and 41.0 N (85.8 N) at 169.3° in pooled Kogia. The
geniohyoideus likely enhanced mandibular depression when the hyoid
depressed and, after mandibular elevation, assisted hyoid return to the basal
position. The geniohyoideus was loosely held by fascia the superficial
mylohyoideus and to the deep genioglossus along the entire genioglossal
length. The geniohyoideus near its insertion was also attached loosely by fascia
to the deep hyoglossus.
3.4.3 Sternohyoideus
The sternohyoideus (Fig. 7 and 9) originated upon the medial aspect of the
manubrium’s cranioventral surface. This massive strap muscle extended
craniodorsally to insert upon the entire ventral surface of the thyrohyals and
basihyal. The broad sternohyoideus insertion left only a thin border for
attachment of several hyolingual muscles to the rostral basihyal and thyrohyal
borders. Along its rostromedial border, the sternohyoideus formed an
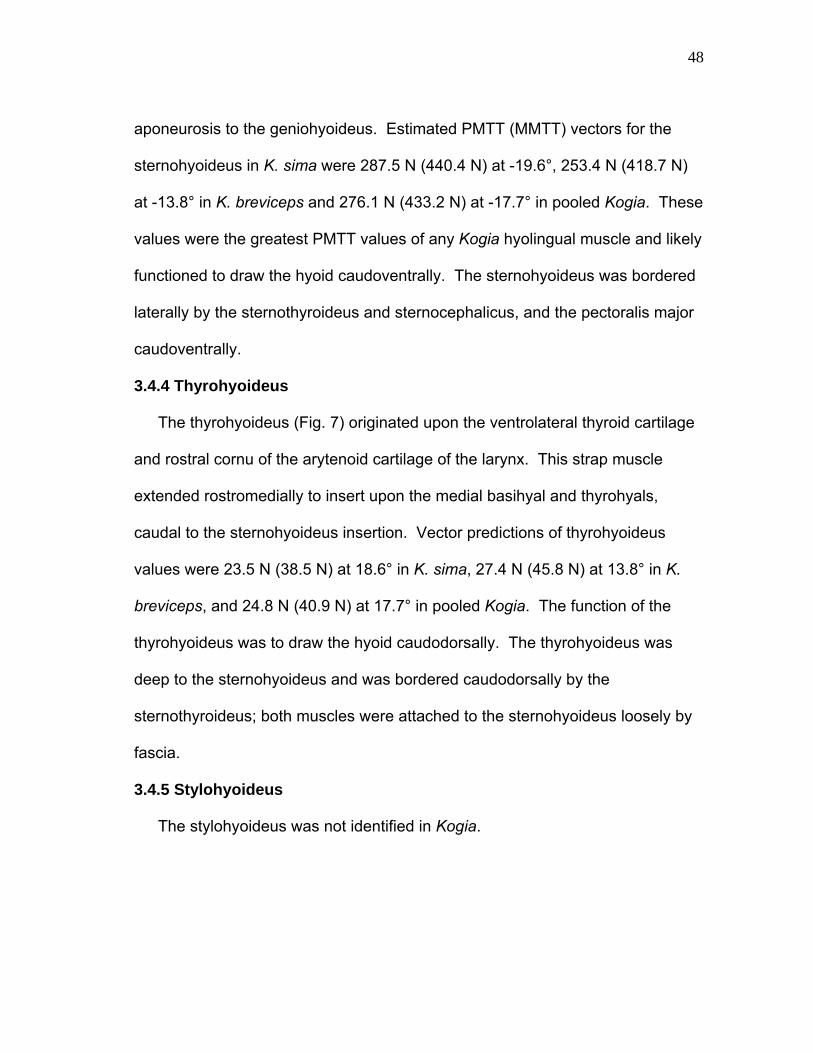
48
aponeurosis to the geniohyoideus. Estimated PMTT (MMTT) vectors for the
sternohyoideus in K. sima were 287.5 N (440.4 N) at -19.6°, 253.4 N (418.7 N)
at -13.8° in K. breviceps and 276.1 N (433.2 N) at -17.7° in pooled Kogia. These
values were the greatest PMTT values of any Kogia hyolingual muscle and likely
functioned to draw the hyoid caudoventrally. The sternohyoideus was bordered
laterally by the sternothyroideus and sternocephalicus, and the pectoralis major
caudoventrally.
3.4.4 Thyrohyoideus
The thyrohyoideus (Fig. 7) originated upon the ventrolateral thyroid cartilage
and rostral cornu of the arytenoid cartilage of the larynx. This strap muscle
extended rostromedially to insert upon the medial basihyal and thyrohyals,
caudal to the sternohyoideus insertion. Vector predictions of thyrohyoideus
values were 23.5 N (38.5 N) at 18.6° in K. sima, 27.4 N (45.8 N) at 13.8° in K.
breviceps, and 24.8 N (40.9 N) at 17.7° in pooled Kogia. The function of the
thyrohyoideus was to draw the hyoid caudodorsally. The thyrohyoideus was
deep to the sternohyoideus and was bordered caudodorsally by the
sternothyroideus; both muscles were attached to the sternohyoideus loosely by
fascia.
3.4.5 Stylohyoideus
The stylohyoideus was not identified in Kogia.
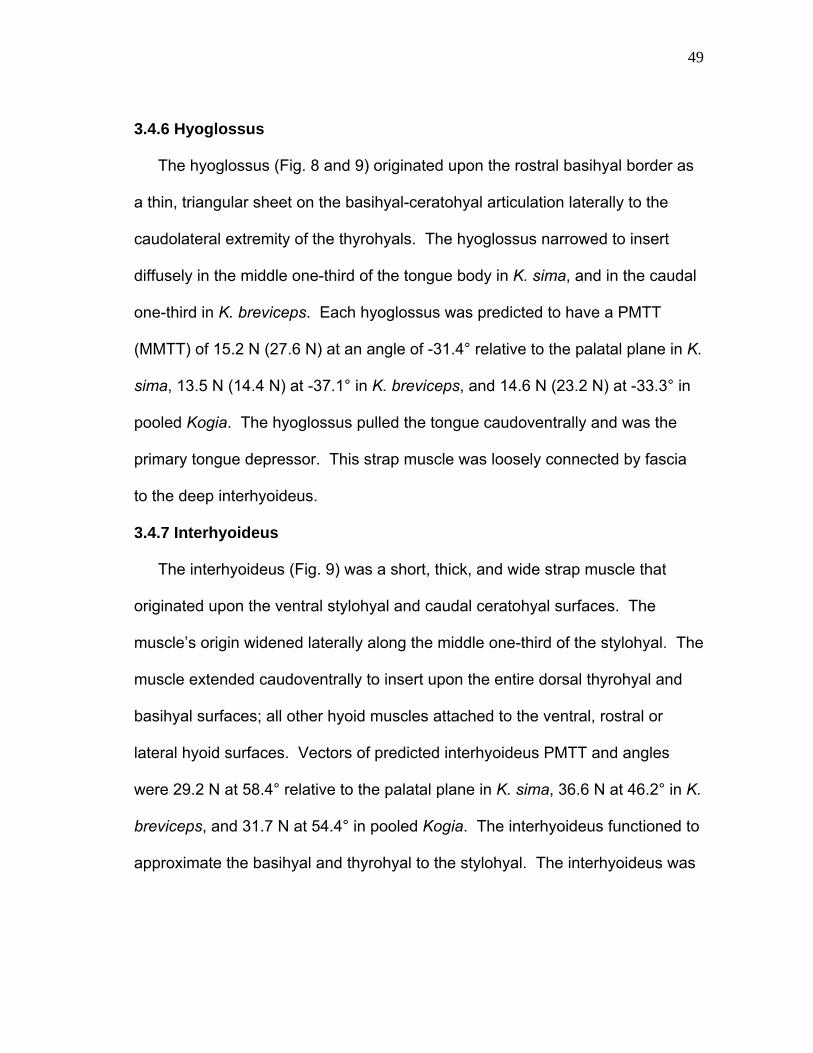
49
3.4.6 Hyoglossus
The hyoglossus (Fig. 8 and 9) originated upon the rostral basihyal border as
a thin, triangular sheet on the basihyal-ceratohyal articulation laterally to the
caudolateral extremity of the thyrohyals. The hyoglossus narrowed to insert
diffusely in the middle one-third of the tongue body in K. sima, and in the caudal
one-third in K. breviceps. Each hyoglossus was predicted to have a PMTT
(MMTT) of 15.2 N (27.6 N) at an angle of -31.4° relative to the palatal plane in K.
sima, 13.5 N (14.4 N) at -37.1° in K. breviceps, and 14.6 N (23.2 N) at -33.3° in
pooled Kogia. The hyoglossus pulled the tongue caudoventrally and was the
primary tongue depressor. This strap muscle was loosely connected by fascia
to the deep interhyoideus.
3.4.7 Interhyoideus
The interhyoideus (Fig. 9) was a short, thick, and wide strap muscle that
originated upon the ventral stylohyal and caudal ceratohyal surfaces. The
muscle’s origin widened laterally along the middle one-third of the stylohyal. The
muscle extended caudoventrally to insert upon the entire dorsal thyrohyal and
basihyal surfaces; all other hyoid muscles attached to the ventral, rostral or
lateral hyoid surfaces. Vectors of predicted interhyoideus PMTT and angles
were 29.2 N at 58.4° relative to the palatal plane in K. sima, 36.6 N at 46.2° in K.
breviceps, and 31.7 N at 54.4° in pooled Kogia. The interhyoideus functioned to
approximate the basihyal and thyrohyal to the stylohyal. The interhyoideus was
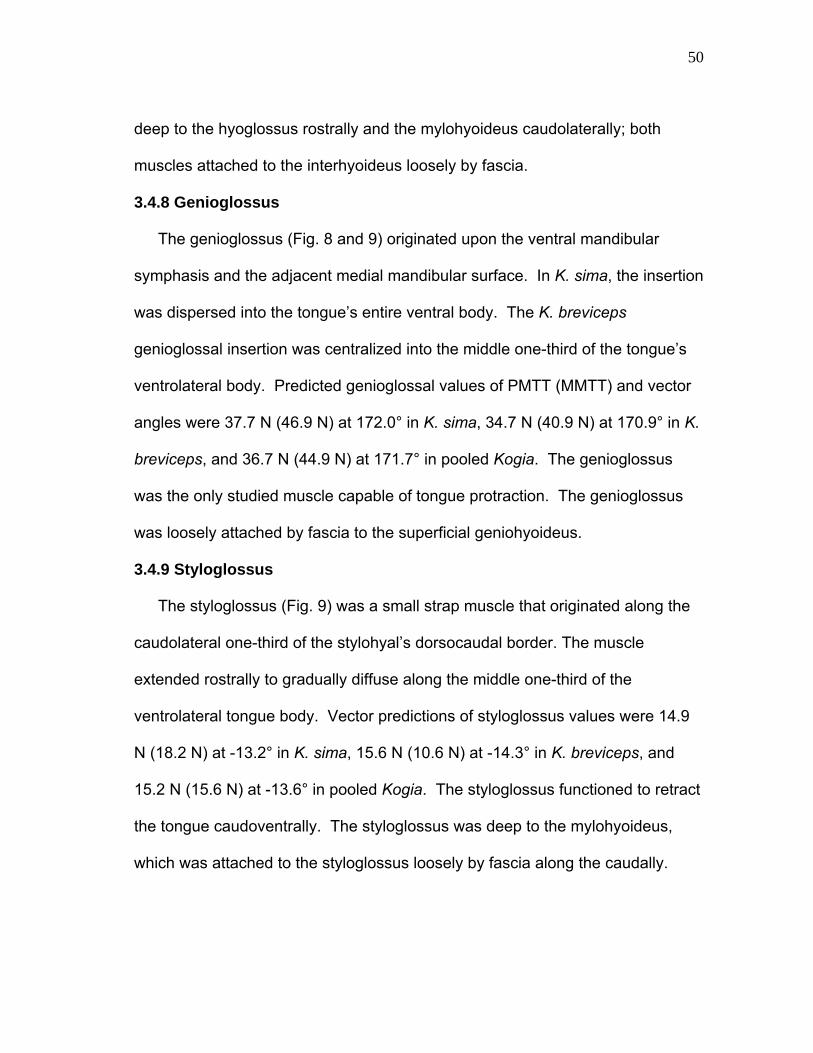
50
deep to the hyoglossus rostrally and the mylohyoideus caudolaterally; both
muscles attached to the interhyoideus loosely by fascia.
3.4.8 Genioglossus
The genioglossus (Fig. 8 and 9) originated upon the ventral mandibular
symphasis and the adjacent medial mandibular surface. In K. sima, the insertion
was dispersed into the tongue’s entire ventral body. The K. breviceps
genioglossal insertion was centralized into the middle one-third of the tongue’s
ventrolateral body. Predicted genioglossal values of PMTT (MMTT) and vector
angles were 37.7 N (46.9 N) at 172.0° in K. sima, 34.7 N (40.9 N) at 170.9° in K.
breviceps, and 36.7 N (44.9 N) at 171.7° in pooled Kogia. The genioglossus
was the only studied muscle capable of tongue protraction. The genioglossus
was loosely attached by fascia to the superficial geniohyoideus.
3.4.9 Styloglossus
The styloglossus (Fig. 9) was a small strap muscle that originated along the
caudolateral one-third of the stylohyal’s dorsocaudal border. The muscle
extended rostrally to gradually diffuse along the middle one-third of the
ventrolateral tongue body. Vector predictions of styloglossus values were 14.9
N (18.2 N) at -13.2° in K. sima, 15.6 N (10.6 N) at -14.3° in K. breviceps, and
15.2 N (15.6 N) at -13.6° in pooled Kogia. The styloglossus functioned to retract
the tongue caudoventrally. The styloglossus was deep to the mylohyoideus,
which was attached to the styloglossus loosely by fascia along the caudally.
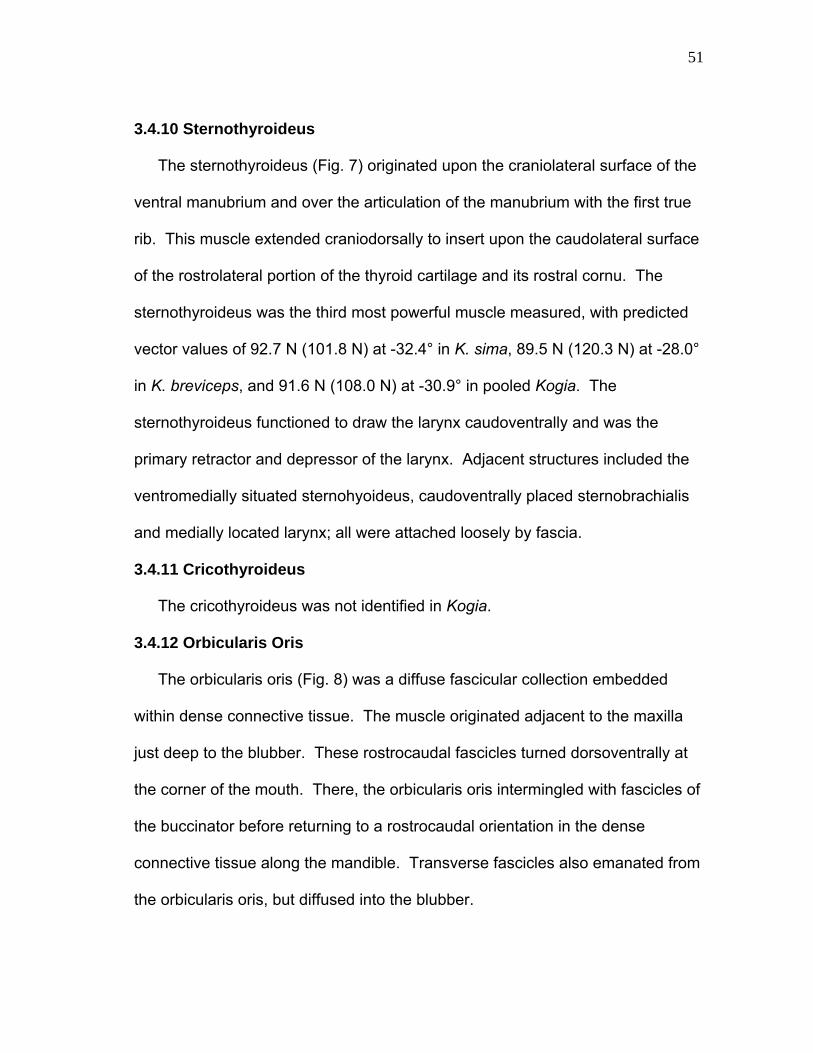
51
3.4.10 Sternothyroideus
The sternothyroideus (Fig. 7) originated upon the craniolateral surface of the
ventral manubrium and over the articulation of the manubrium with the first true
rib. This muscle extended craniodorsally to insert upon the caudolateral surface
of the rostrolateral portion of the thyroid cartilage and its rostral cornu. The
sternothyroideus was the third most powerful muscle measured, with predicted
vector values of 92.7 N (101.8 N) at -32.4° in K. sima, 89.5 N (120.3 N) at -28.0°
in K. breviceps, and 91.6 N (108.0 N) at -30.9° in pooled Kogia. The
sternothyroideus functioned to draw the larynx caudoventrally and was the
primary retractor and depressor of the larynx. Adjacent structures included the
ventromedially situated sternohyoideus, caudoventrally placed sternobrachialis
and medially located larynx; all were attached loosely by fascia.
3.4.11 Cricothyroideus
The cricothyroideus was not identified in Kogia.
3.4.12 Orbicularis Oris
The orbicularis oris (Fig. 8) was a diffuse fascicular collection embedded
within dense connective tissue. The muscle originated adjacent to the maxilla
just deep to the blubber. These rostrocaudal fascicles turned dorsoventrally at
the corner of the mouth. There, the orbicularis oris intermingled with fascicles of
the buccinator before returning to a rostrocaudal orientation in the dense
connective tissue along the mandible. Transverse fascicles also emanated from
the orbicularis oris, but diffused into the blubber.

52
3.4.13 Buccinator
The buccinator was a diffuse dorsoventrally directed muscle that originated
near the ventral maxillary border. The buccinator extended caudally to the
corner of the mouth, where its fascicles intermingled with those of the orbicularis
oris. From here, the buccinator shifted rostrally to border the mandible at the
level of the caudal-most mandibular tooth, where it fused with the platysma. The
orbicularis oris and buccinator partially composed a lateral mouth occlusion.
Based on manual manipulation of dissection specimens, this occlusal structure
was folded along the mandible when the mouth was closed or at minimal gape.
However, as the mandible depressed, a tissue flap composed of dense
connective tissue, skin, the orbicularis oris, and buccinator unfolded and formed
a flap along the side of the mouth.
3.4.14 Biomechanical Modeling
A biomechanical model of Kogia feeding was developed to identify muscle
function and describe mechanical advantage of hyoid retraction and depression.
Figure 10 identifies muscle vectors associated with hyolingual depression and
retraction. More than an order of magnitude separated PMTT values of the
greatest and least powerful muscles. Muscle vectors that depressed or
retracted the hyoid (sternohyoideus, thyrohyoideus, and sternothyroideus) are
summarized in Figure 11. Predicted PMTTs of hyoid depression and retraction
were calculated and resultant vectors determined to identify the predicted net
tension exerted upon the hyoid at the moment of contraction. The same vectors
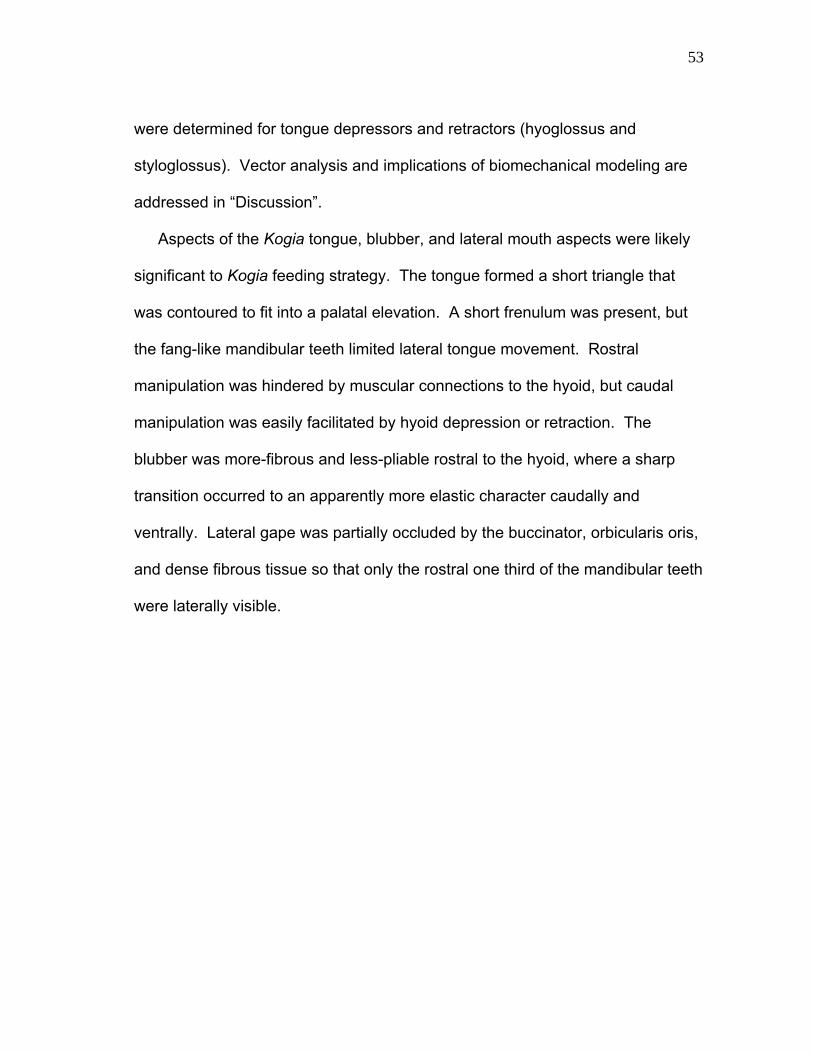
53
were determined for tongue depressors and retractors (hyoglossus and
styloglossus). Vector analysis and implications of biomechanical modeling are
addressed in “Discussion”.
Aspects of the Kogia tongue, blubber, and lateral mouth aspects were likely
significant to Kogia feeding strategy. The tongue formed a short triangle that
was contoured to fit into a palatal elevation. A short frenulum was present, but
the fang-like mandibular teeth limited lateral tongue movement. Rostral
manipulation was hindered by muscular connections to the hyoid, but caudal
manipulation was easily facilitated by hyoid depression or retraction. The
blubber was more-fibrous and less-pliable rostral to the hyoid, where a sharp
transition occurred to an apparently more elastic character caudally and
ventrally. Lateral gape was partially occluded by the buccinator, orbicularis oris,
and dense fibrous tissue so that only the rostral one third of the mandibular teeth
were laterally visible.
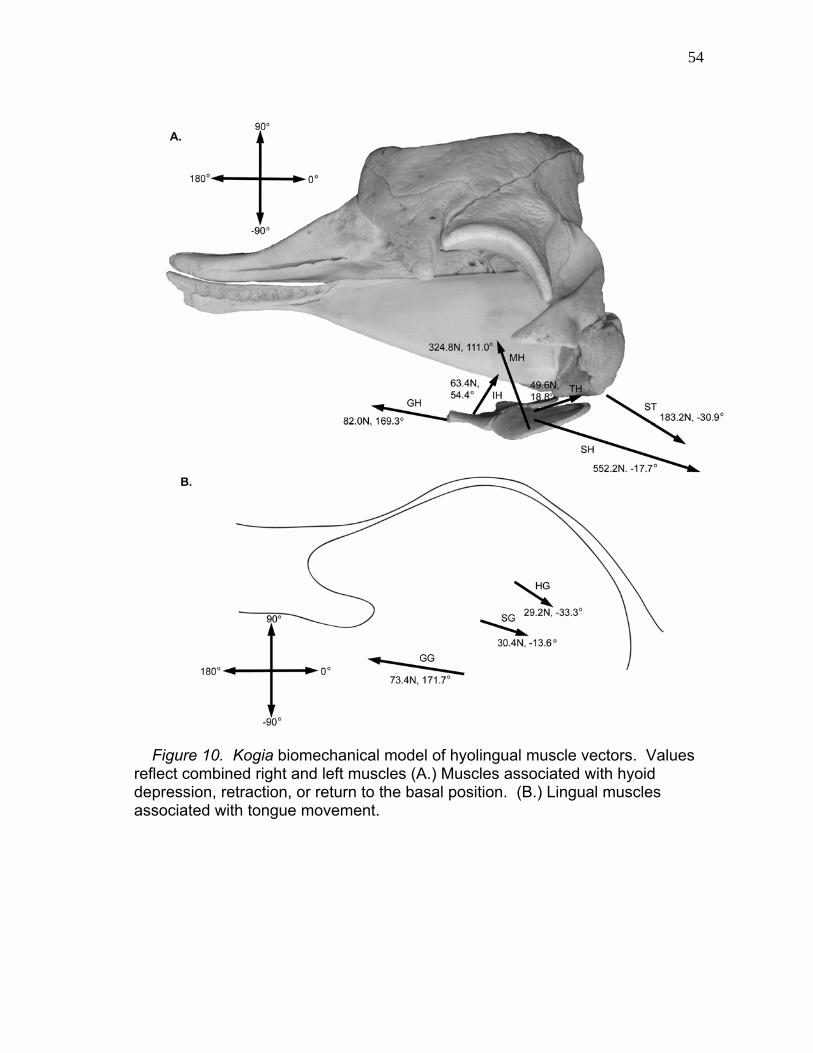
54
Figure 10. Kogia biomechanical model of hyolingual muscle vectors. Values reflect combined right and left muscles (A.) Muscles associated with hyoid depression, retraction, or return to the basal position. (B.) Lingual muscles associated with tongue movement.

55
Figure 11. Net tension vectors of Kogia hyoid and tongue depressors and retractors. (A.) The right and left sternohyoideus, thyrohyoideus, and sternothyroideus were hyoid depressors and retractors. (B.) The hyoglossus and styloglossus were tongue depressors and retractors.
56
3.5 Tursiops truncatus Hyolingual Myology
Tursiops truncatus hyolingual myology consisted of well-developed bilateral
strap muscles that, with the exception of extrinsic lingual muscles, attached by
aponeuroses to ossified or cartilaginous structures. As with Kogia, the most
robust of these was the sternohyoideus, which inserted upon most of the ventral
basihyal and thyrohyal surfaces. Stylohyoideus and cricothyroideus muscles
absent in Kogia were identified in T. truncatus. Mean T. truncatus hyolingual
muscle variables are summarized in Tables 4 through 6. Predicted values at a
standardized total body length of 252 cm are presented in Tables 7 through 9.
All observed myological data for K. sima and K. breviceps muscle dimensions,
cross-sectional areas and maximum-tetanic tensions are available in Tables B-1
through B-22. The hyolingual myology of T. truncatus was not expected to be as
robust as Kogia. However, most PMTT and MMTT means between the genera
were generally not significantly different (P < 0.05).
3.5.1 Mylohyoideus
The T. truncatus mylohyoideus (Fig. 12, 13, and 14) was a thin, delicate
muscle throughout most of its length. However, it thickened to several
centimeters near its origin along the medial aspect of each mandibular rami.
This origin included the entire space from the mandibular symphasis to near the
mandible’s caudal extent. Right and left mylohyoideus muscles traveled
ventromedially to insert upon a medial raphe. A “V” shaped fascial sheet joined
both sides at the mediocaudal aspect, but only extended approximately one-fifth
57
of the mylohyoideus’ width. The T. truncatus mylohyoideus was wider than in
Kogia and reflected the species’ telescoped mandible. As a whole, the
mylohyoideus formed a lingual sling that enclosed deeper hyolingual muscles.
The mylohyoideus was the second most-powerful muscle measured, with
predicted PMTT (MMTT) vector values of 270.0 N (444.0 N) at 100.7°. As in
Kogia, the T. truncatus mylohyoideus formed a lingual sling and could assist to
return the hyoid to its basal position. Superficially, the platysma rostrally and the
digastricus caudally were tightly adhered to the mylohyoideus. Several deeper
muscles were attached loosely by fascia, including the stylohyoideus,
styloglossus, hyoglossus, and genioglossus.
Figure 12. Ventral view of the caudal musculature associated with the T. truncatus hyolingual complex. MH = mylohyoideus, TH = thyrohyoideus, CT = cricothyroideus, SteH = sternohyoideus, and ST = sternothyroideus.

58
Figure 13. Rostral T. truncatus hyolingual myology viewed from the ventral aspect. Note the long geniohyoideus tendon of origin. MH = mylohyoideus, GG = genioglossus, GH = geniohyoideus, and TH = thyrohyoideus.
Figure 14. Tursiops truncatus hyolingual musculature viewed laterally. MH = mylohyoideus, GG = genioglossus, StyG = styloglossus, HG = hyoglossus, IH = interhyoideus, StyH = stylohyoideus, and SteH = sternohyoideus.
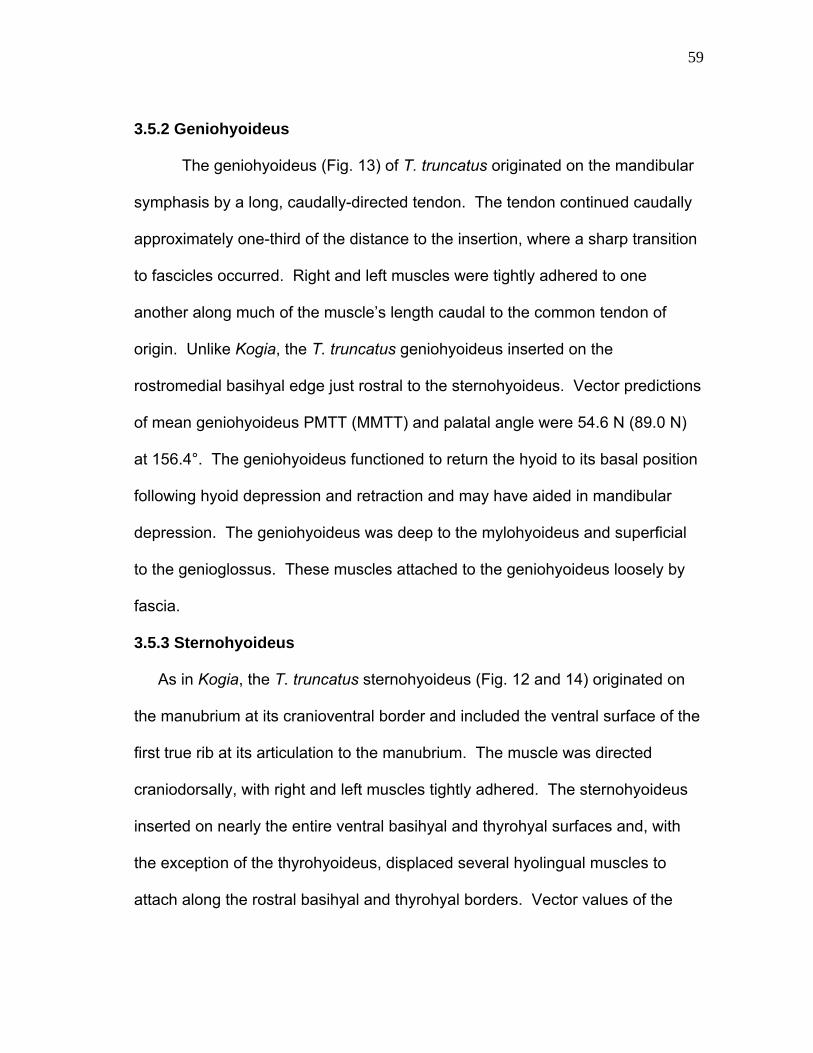
59
3.5.2 Geniohyoideus
The geniohyoideus (Fig. 13) of T. truncatus originated on the mandibular
symphasis by a long, caudally-directed tendon. The tendon continued caudally
approximately one-third of the distance to the insertion, where a sharp transition
to fascicles occurred. Right and left muscles were tightly adhered to one
another along much of the muscle’s length caudal to the common tendon of
origin. Unlike Kogia, the T. truncatus geniohyoideus inserted on the
rostromedial basihyal edge just rostral to the sternohyoideus. Vector predictions
of mean geniohyoideus PMTT (MMTT) and palatal angle were 54.6 N (89.0 N)
at 156.4°. The geniohyoideus functioned to return the hyoid to its basal position
following hyoid depression and retraction and may have aided in mandibular
depression. The geniohyoideus was deep to the mylohyoideus and superficial
to the genioglossus. These muscles attached to the geniohyoideus loosely by
fascia.
3.5.3 Sternohyoideus
As in Kogia, the T. truncatus sternohyoideus (Fig. 12 and 14) originated on
the manubrium at its cranioventral border and included the ventral surface of the
first true rib at its articulation to the manubrium. The muscle was directed
craniodorsally, with right and left muscles tightly adhered. The sternohyoideus
inserted on nearly the entire ventral basihyal and thyrohyal surfaces and, with
the exception of the thyrohyoideus, displaced several hyolingual muscles to
attach along the rostral basihyal and thyrohyal borders. Vector values of the

60
sternohyoideus were 288.4 N (513.8 N) at -27.0°, making the sternohyoideus the
most powerful muscle of the T. truncatus hyolingual complex and the primary
depressor and retractor of the hyoid by drawing the basihyal caudoventrally. A
direct attachment to the geniohyoideus was not present as it was in Kogia. The
sternohyoideus was bordered by three muscles that adhered to it loosely by
fascia: the sternothyroideus and sternocephalicus along the sternohyoideus’
lateral aspect, and the pectoralis major ventrally at the sternohyoideus’ origin.
3.5.4 Thyrohyoideus
The thyrohyoideus (Fig. 12 and 13) of T. truncatus originated from the
craniolateral surface of the rostral cornu and thyroid cartilage of the larynx. The
insertion was to the ventrocaudal and medial aspects of the basihyal in the only
space not occupied by the more-superficial sternohyoideus. Data support a
vector of predicted thyrohyoideus PMTT (MMTT) of 27.9 N (54.3 N) at 33.1°.
The thyrohyoideus functioned to draw the hyoid caudodorsally. The
thyrohyoideus was bordered rostrolaterally by the sternothyroideus and was
loosely attached to it by fascia.
3.5.5 Stylohyoideus
The stylohyoideus (Fig. 14) was identified only in T. truncatus. This muscle
originated on the ventrocaudal and caudolateral stylohyal surfaces at the
tympanic articulation and narrowed to an insertion tendon on the caudolateral tip
of the thyrohyal. The stylohyoideus was predicted to have a PMTT (MMTT) of
15.0 N (17.9 N) in an initial palatal direction of 115.9° at a standardized total
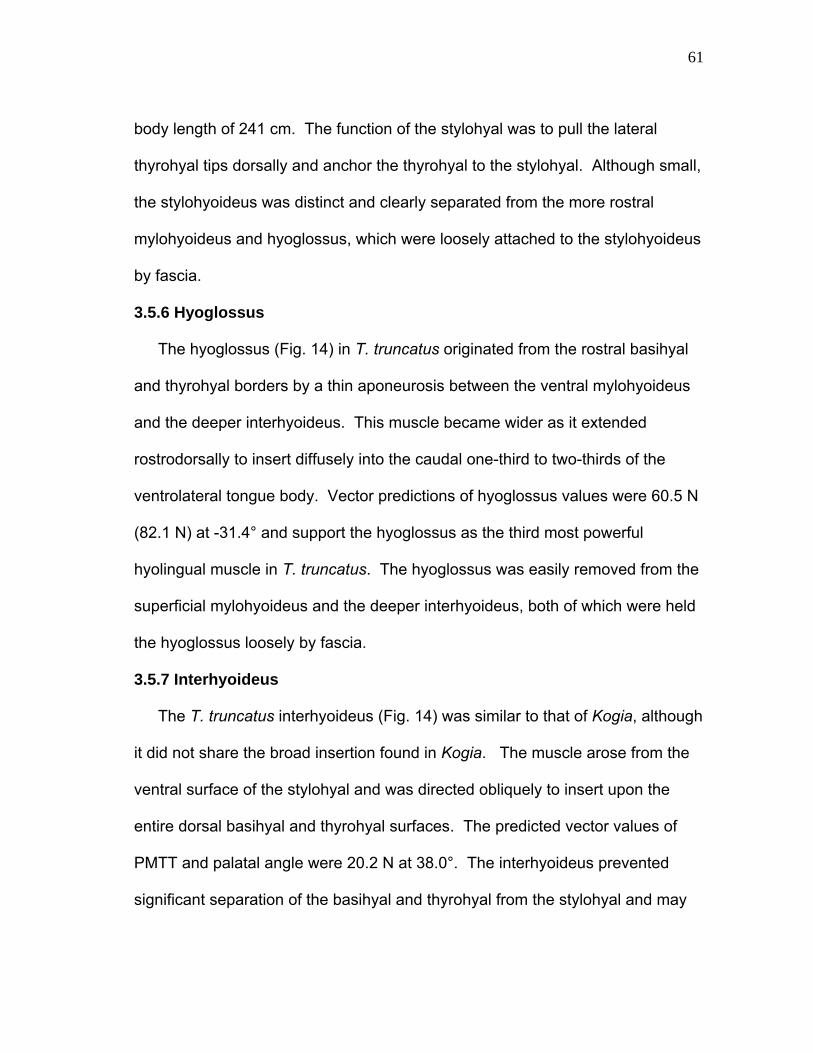
61
body length of 241 cm. The function of the stylohyal was to pull the lateral
thyrohyal tips dorsally and anchor the thyrohyal to the stylohyal. Although small,
the stylohyoideus was distinct and clearly separated from the more rostral
mylohyoideus and hyoglossus, which were loosely attached to the stylohyoideus
by fascia.
3.5.6 Hyoglossus
The hyoglossus (Fig. 14) in T. truncatus originated from the rostral basihyal
and thyrohyal borders by a thin aponeurosis between the ventral mylohyoideus
and the deeper interhyoideus. This muscle became wider as it extended
rostrodorsally to insert diffusely into the caudal one-third to two-thirds of the
ventrolateral tongue body. Vector predictions of hyoglossus values were 60.5 N
(82.1 N) at -31.4° and support the hyoglossus as the third most powerful
hyolingual muscle in T. truncatus. The hyoglossus was easily removed from the
superficial mylohyoideus and the deeper interhyoideus, both of which were held
the hyoglossus loosely by fascia.
3.5.7 Interhyoideus
The T. truncatus interhyoideus (Fig. 14) was similar to that of Kogia, although
it did not share the broad insertion found in Kogia. The muscle arose from the
ventral surface of the stylohyal and was directed obliquely to insert upon the
entire dorsal basihyal and thyrohyal surfaces. The predicted vector values of
PMTT and palatal angle were 20.2 N at 38.0°. The interhyoideus prevented
significant separation of the basihyal and thyrohyal from the stylohyal and may
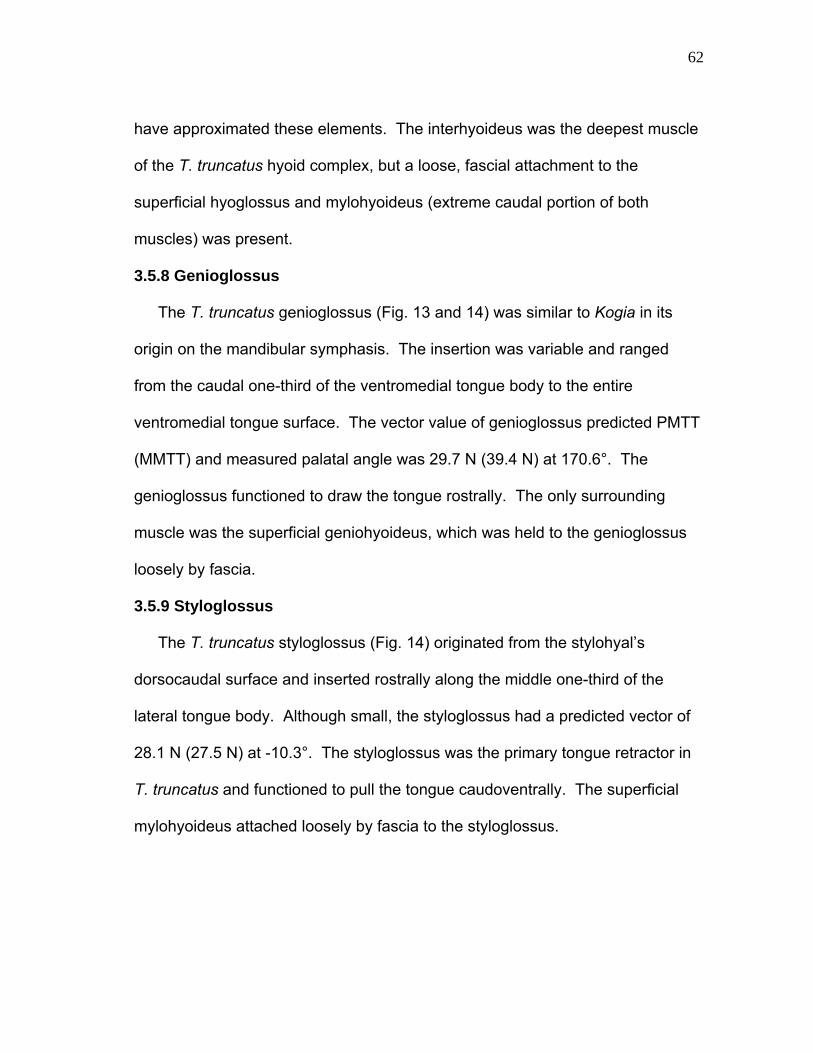
62
have approximated these elements. The interhyoideus was the deepest muscle
of the T. truncatus hyoid complex, but a loose, fascial attachment to the
superficial hyoglossus and mylohyoideus (extreme caudal portion of both
muscles) was present.
3.5.8 Genioglossus
The T. truncatus genioglossus (Fig. 13 and 14) was similar to Kogia in its
origin on the mandibular symphasis. The insertion was variable and ranged
from the caudal one-third of the ventromedial tongue body to the entire
ventromedial tongue surface. The vector value of genioglossus predicted PMTT
(MMTT) and measured palatal angle was 29.7 N (39.4 N) at 170.6°. The
genioglossus functioned to draw the tongue rostrally. The only surrounding
muscle was the superficial geniohyoideus, which was held to the genioglossus
loosely by fascia.
3.5.9 Styloglossus
The T. truncatus styloglossus (Fig. 14) originated from the stylohyal’s
dorsocaudal surface and inserted rostrally along the middle one-third of the
lateral tongue body. Although small, the styloglossus had a predicted vector of
28.1 N (27.5 N) at -10.3°. The styloglossus was the primary tongue retractor in
T. truncatus and functioned to pull the tongue caudoventrally. The superficial
mylohyoideus attached loosely by fascia to the styloglossus.

63
3.5.10 Sternothyroideus
The sternothyroideus (Fig. 12) of T. truncatus shared a similar origin to Kogia
along the manubrium’s craniolateral surface. This long strap muscle extended
cranially to insert upon the caudolateral anterior cornu of the laryngeal thyroid
cartilage. The predicted sternothyroideus PMTT (MMTT) and palatal angle
values were 37.4 N (66.0 N) at -46.1°. As in Kogia, the sternothyroideus was
the primary retractor and depressor of the larynx. Several structures bordered
the sternothyroideus along its path and attached loosely to it be fascia: the
sternohyoideus ventromedially, the sternobrachialis caudoventrally, and the
larynx near its insertion.
3.5.11 Cricothyroideus
The cricothyroideus (Fig. 12) was identified only in T. truncatus as a muscle
that originated upon the caudoventral and caudolateral border of the cricoid
cartilage of the larynx. This small muscle extended rostrodorsally to insert upon
the caudal border of the rostral cornu of the laryngeal thyroid cartilage. The
predicted cricothyroideus vector was 18.0 N (33.2 N) at -35.0° at a standardized
total body length of 241 cm. The cricothyroideus approximated the cricoid and
thyroid cartilages. The superficial sternohyoideus was the only muscle that
bordered the cricothyroideus and was loosely attached to it by fascia.
3.5.12 Orbicularis Oris
The orbicularis oris shared a similar structure in T. truncatus as in Kogia.
Fascicles were embedded within the dense connective tissue lateral to the
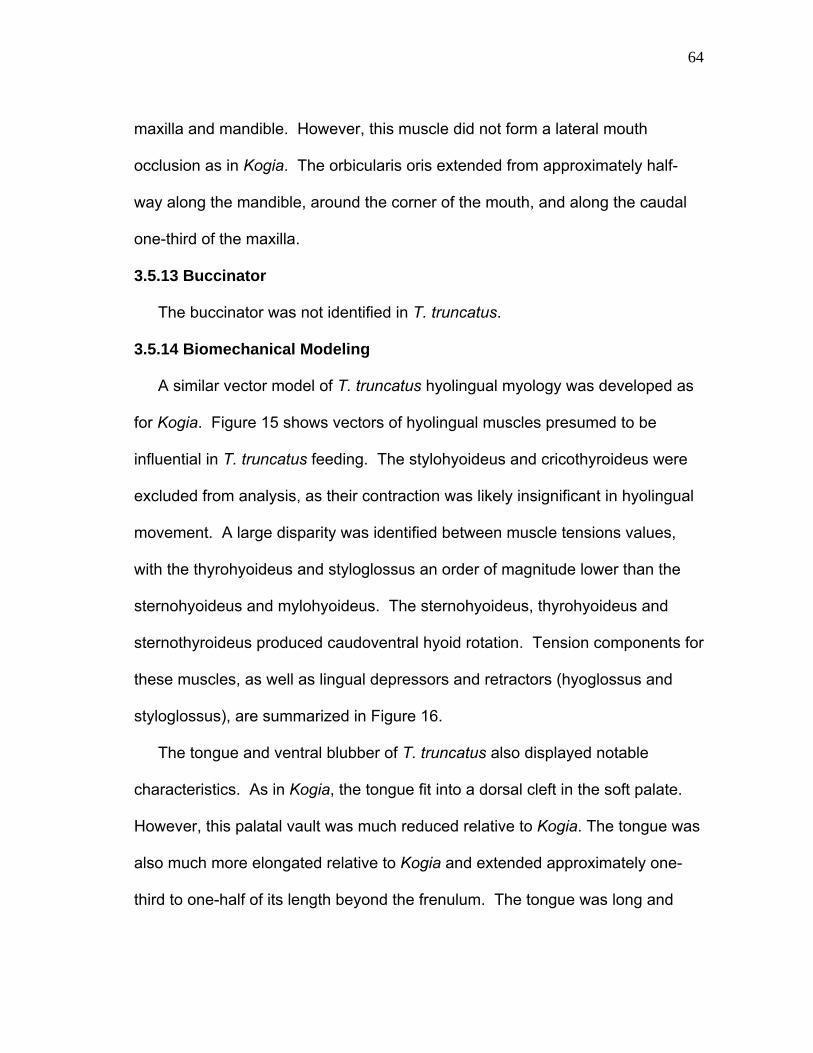
64
maxilla and mandible. However, this muscle did not form a lateral mouth
occlusion as in Kogia. The orbicularis oris extended from approximately half-
way along the mandible, around the corner of the mouth, and along the caudal
one-third of the maxilla.
3.5.13 Buccinator
The buccinator was not identified in T. truncatus.
3.5.14 Biomechanical Modeling
A similar vector model of T. truncatus hyolingual myology was developed as
for Kogia. Figure 15 shows vectors of hyolingual muscles presumed to be
influential in T. truncatus feeding. The stylohyoideus and cricothyroideus were
excluded from analysis, as their contraction was likely insignificant in hyolingual
movement. A large disparity was identified between muscle tensions values,
with the thyrohyoideus and styloglossus an order of magnitude lower than the
sternohyoideus and mylohyoideus. The sternohyoideus, thyrohyoideus and
sternothyroideus produced caudoventral hyoid rotation. Tension components for
these muscles, as well as lingual depressors and retractors (hyoglossus and
styloglossus), are summarized in Figure 16.
The tongue and ventral blubber of T. truncatus also displayed notable
characteristics. As in Kogia, the tongue fit into a dorsal cleft in the soft palate.
However, this palatal vault was much reduced relative to Kogia. The tongue was
also much more elongated relative to Kogia and extended approximately one-
third to one-half of its length beyond the frenulum. The tongue was long and
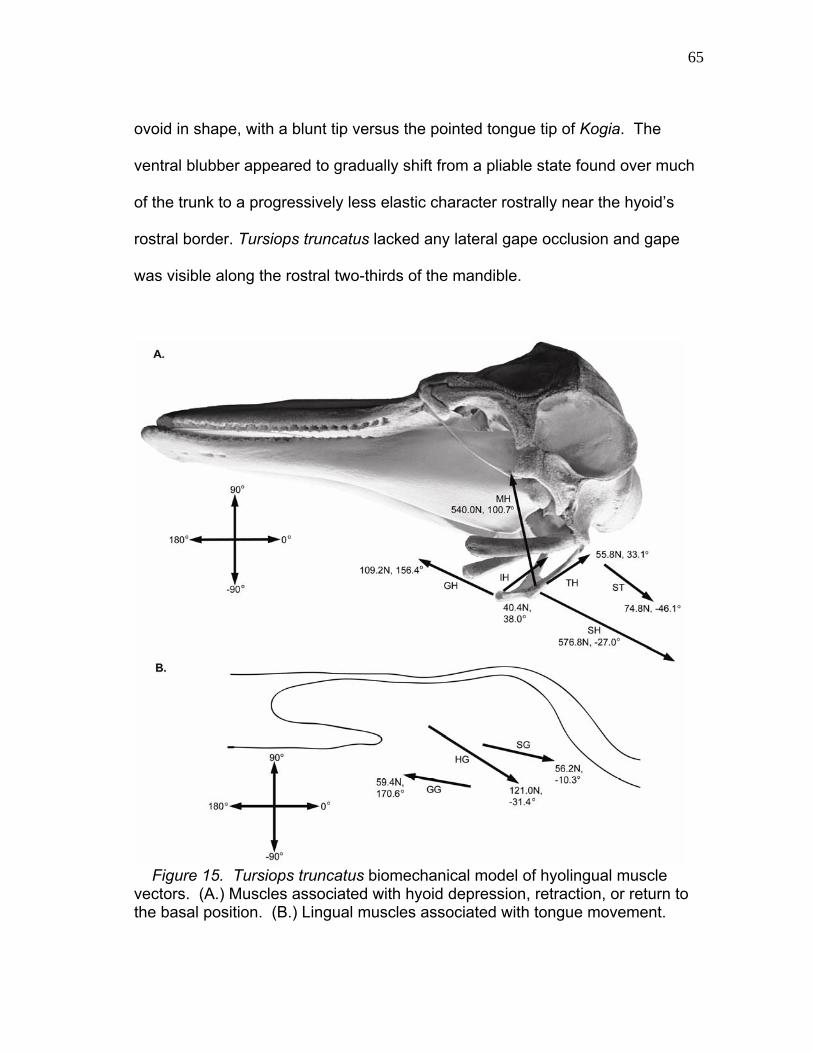
65
ovoid in shape, with a blunt tip versus the pointed tongue tip of Kogia. The
ventral blubber appeared to gradually shift from a pliable state found over much
of the trunk to a progressively less elastic character rostrally near the hyoid’s
rostral border. Tursiops truncatus lacked any lateral gape occlusion and gape
was visible along the rostral two-thirds of the mandible.
Figure 15. Tursiops truncatus biomechanical model of hyolingual muscle vectors. (A.) Muscles associated with hyoid depression, retraction, or return to the basal position. (B.) Lingual muscles associated with tongue movement.
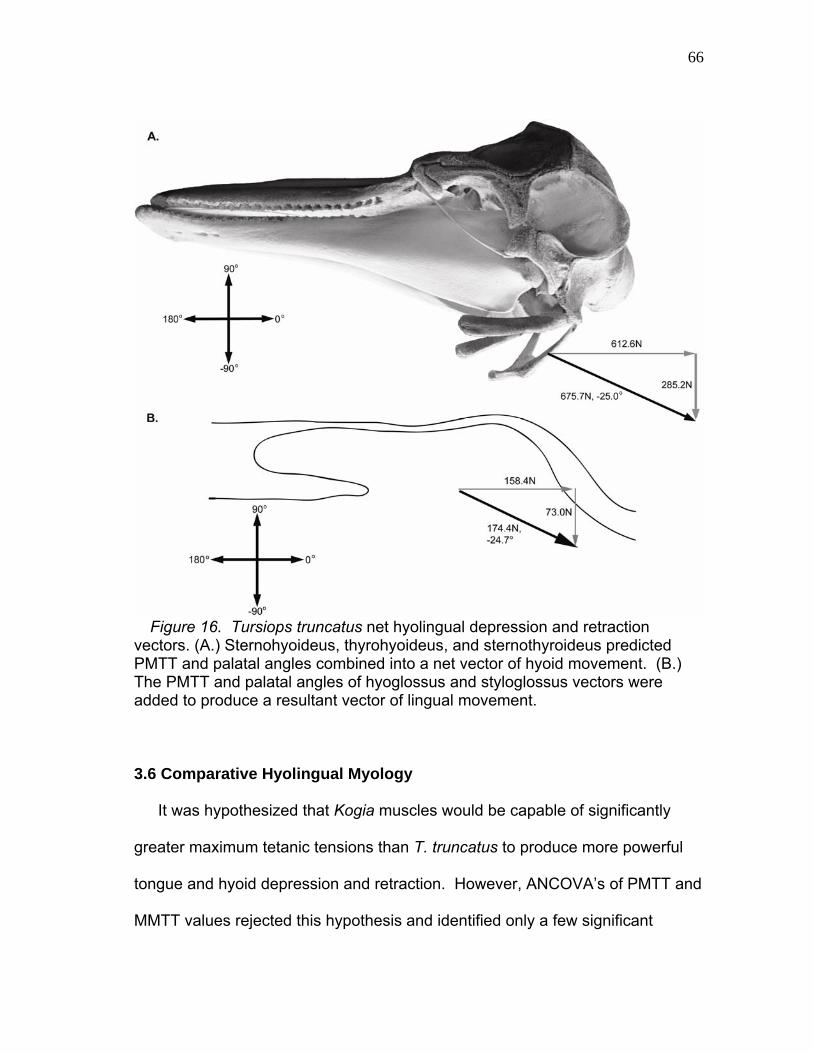
66
Figure 16. Tursiops truncatus net hyolingual depression and retraction vectors. (A.) Sternohyoideus, thyrohyoideus, and sternothyroideus predicted PMTT and palatal angles combined into a net vector of hyoid movement. (B.) The PMTT and palatal angles of hyoglossus and styloglossus vectors were added to produce a resultant vector of lingual movement.
3.6 Comparative Hyolingual Myology
It was hypothesized that Kogia muscles would be capable of significantly
greater maximum tetanic tensions than T. truncatus to produce more powerful
tongue and hyoid depression and retraction. However, ANCOVA’s of PMTT and
MMTT values rejected this hypothesis and identified only a few significant
67
differences between Kogia and T. truncatus PMTT after scaling for either total
body length or mass. Sidedness was not found to be significantly different
between right and left muscles in any species group. Styloglossus PMTT was
significantly less in K. sima (P < 0.005) and pooled Kogia (P < 0.01) than in T.
truncatus (adjusted r2 = 0.732). Hyoglossus PMTT was significantly less in all
Kogia groups (P < 0.05) than in T. truncatus (adjusted r2 = 0.758).
Sternothyroideus PMTT was significantly greater in K. sima (P < 0.01) and
pooled Kogia (P < 0.05) compared to T. truncatus (adjusted r2 = 0.656).
3.7 Feeding Behavior 3.7.1 Kogia Feeding Behavior
Kogia behavioral observations supported anatomical measurements that
hyoid depression and retraction, as well as the utility of lateral gape occlusion,
are significant for effective suction feeding. Kogia subjects either swam freely to
food items, or were stationary as food items were placed in front of their mouths
(Fig. 17A and B). Kogia feeding involved nearly simultaneous jaw opening,
gular depression and retraction. Minute fluctuations in gape and gular
movement were identified immediately prior to feeding. Observations indicated
food began an initial movement into the oral cavity with gape increase in
response to presumed suction forces. However, food velocity did not increase
rapidly until gular depression was observed. Once jaw opening began, it
progressed rapidly and extensively, with maximum gape angle frequently in
excess of 60º. Suction generation was likely aided by a tissue structure on each
68
side of the mandible that occluded lateral gape and assisted in forming a circular
aperture. Jaw closure was slower than opening and involved the gular region’s
return to its initial position.
3.7.2 Kogia Feeding Kinematics
Kogia kinematic variables are summarized in Table 10. The Kogia feeding
cycle (Fig. 18A) consisted of four phases: preparatory, jaw opening, gular
depression, and jaw closing. Phase I (preparatory) was observed when the
maxillary tip, mandibular tip, COM, eye, and external rostral border of the hyoid
were identified within a single video field, and gape was 25% greater than
minimum gape (to eliminate pre-feeding gape fluctuations). Phase II (jaw
opening) was initiated when gape began to increase by ≥ 0.2 cm/field. Phase III
(gular depression) began at maximum gape. Gular depression and retraction
were not exclusive to the gular depression phase, but also occurred in jaw
opening and closing phases. Phase IV (jaw closing) began when gape started
to close by ≥ 0.2 cm/field and ended when jaw closure decreased to ≤ 0.2
cm/field. Mean maximum gape angle, mean maximum opening gape angle
velocity and mean maximum gape occurred during phase II, while maximum
closing gape angle velocity, mean maximum gular depression, mean time to
maximum gular depression, mean maximum gular retraction, and mean time to
maximum gular retraction generally occurred in phase III.

69
Figure 17. Kogia and T. truncatus feeding near the beginning of the observed feeding cycle and at maximum gape. (A.) Kogia preparatory phase with minimal gape (B.) phase II ending with maximum gape. (C.) Tursiops truncatus closed gape approach feeding begins with slight gape, tucked pectoral fin, and forward motion and (D.) overtakes prey at maximum gape. (E) Tursiops truncatus open gape approach enters the frame at or near maximum gape, continues forward motion with open gape, and (F.) closes jaws as prey is overtaken.
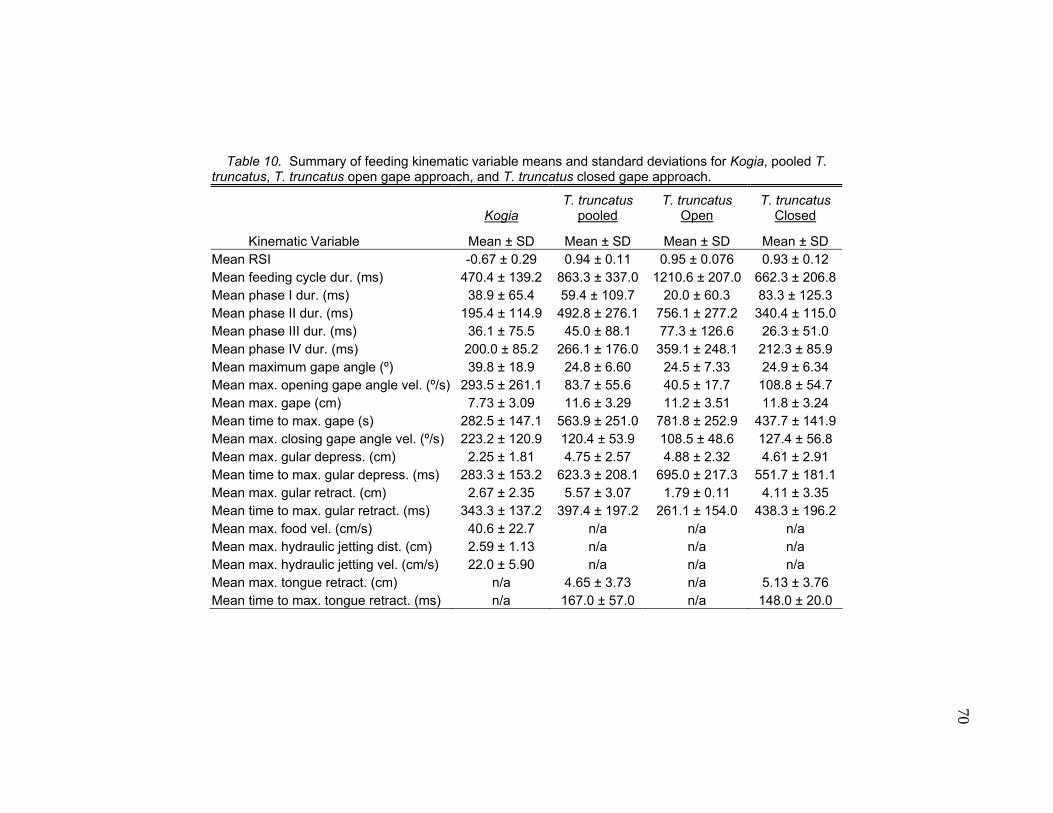
70
Table 10. Summary of feeding kinematic variable means and standard deviations for Kogia, pooled T. truncatus, T. truncatus open gape approach, and T. truncatus closed gape approach.
Kogia T. truncatus
pooled T. truncatus
Open T. truncatus
Closed
Kinematic Variable Mean ± SD Mean ± SD Mean ± SD Mean ± SD Mean RSI -0.67 ± 0.29 0.94 ± 0.11 0.95 ± 0.076 0.93 ± 0.12 Mean feeding cycle dur. (ms) 470.4 ± 139.2 863.3 ± 337.0 1210.6 ± 207.0 662.3 ± 206.8Mean phase I dur. (ms) 38.9 ± 65.4 59.4 ± 109.7 20.0 ± 60.3 83.3 ± 125.3 Mean phase II dur. (ms) 195.4 ± 114.9 492.8 ± 276.1 756.1 ± 277.2 340.4 ± 115.0Mean phase III dur. (ms) 36.1 ± 75.5 45.0 ± 88.1 77.3 ± 126.6 26.3 ± 51.0 Mean phase IV dur. (ms) 200.0 ± 85.2 266.1 ± 176.0 359.1 ± 248.1 212.3 ± 85.9 Mean maximum gape angle (º) 39.8 ± 18.9 24.8 ± 6.60 24.5 ± 7.33 24.9 ± 6.34 Mean max. opening gape angle vel. (º/s) 293.5 ± 261.1 83.7 ± 55.6 40.5 ± 17.7 108.8 ± 54.7 Mean max. gape (cm) 7.73 ± 3.09 11.6 ± 3.29 11.2 ± 3.51 11.8 ± 3.24 Mean time to max. gape (s) 282.5 ± 147.1 563.9 ± 251.0 781.8 ± 252.9 437.7 ± 141.9Mean max. closing gape angle vel. (º/s) 223.2 ± 120.9 120.4 ± 53.9 108.5 ± 48.6 127.4 ± 56.8 Mean max. gular depress. (cm) 2.25 ± 1.81 4.75 ± 2.57 4.88 ± 2.32 4.61 ± 2.91 Mean time to max. gular depress. (ms) 283.3 ± 153.2 623.3 ± 208.1 695.0 ± 217.3 551.7 ± 181.1Mean max. gular retract. (cm) 2.67 ± 2.35 5.57 ± 3.07 1.79 ± 0.11 4.11 ± 3.35 Mean time to max. gular retract. (ms) 343.3 ± 137.2 397.4 ± 197.2 261.1 ± 154.0 438.3 ± 196.2Mean max. food vel. (cm/s) 40.6 ± 22.7 n/a n/a n/a Mean max. hydraulic jetting dist. (cm) 2.59 ± 1.13 n/a n/a n/a Mean max. hydraulic jetting vel. (cm/s) 22.0 ± 5.90 n/a n/a n/a Mean max. tongue retract. (cm) n/a 4.65 ± 3.73 n/a 5.13 ± 3.76 Mean time to max. tongue retract. (ms) n/a 167.0 ± 57.0 n/a 148.0 ± 20.0
70
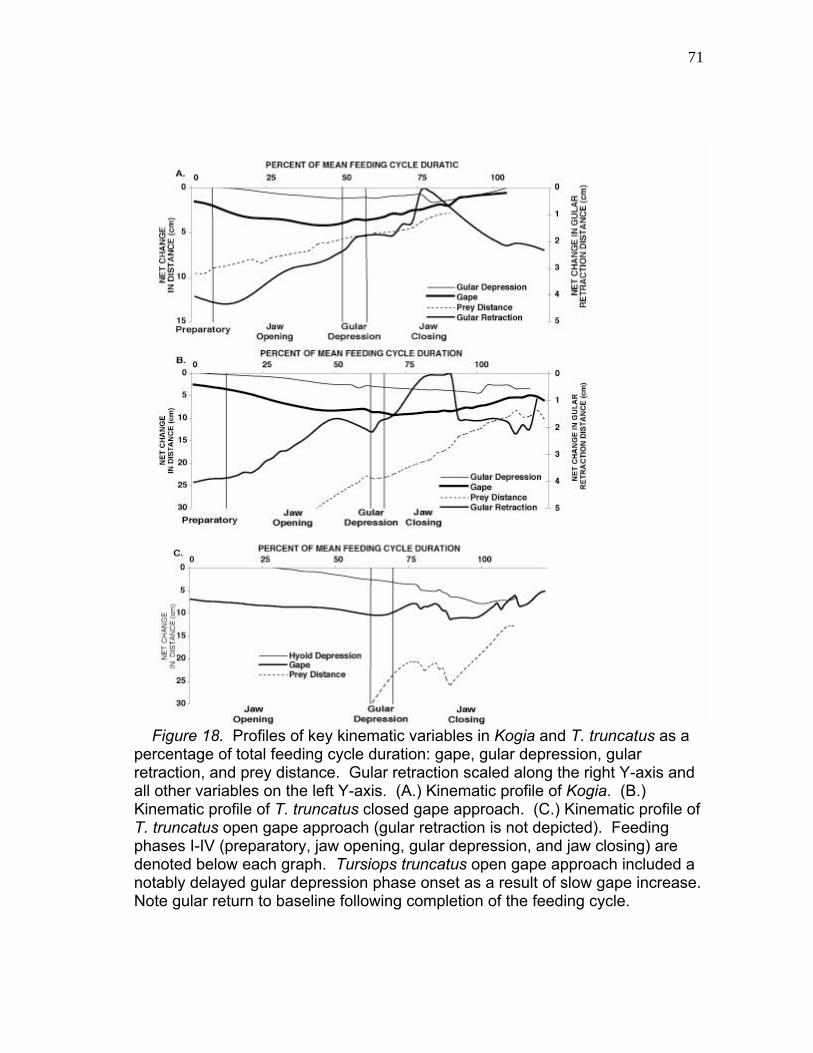
71
Figure 18. Profiles of key kinematic variables in Kogia and T. truncatus as a percentage of total feeding cycle duration: gape, gular depression, gular retraction, and prey distance. Gular retraction scaled along the right Y-axis and all other variables on the left Y-axis. (A.) Kinematic profile of Kogia. (B.) Kinematic profile of T. truncatus closed gape approach. (C.) Kinematic profile of T. truncatus open gape approach (gular retraction is not depicted). Feeding phases I-IV (preparatory, jaw opening, gular depression, and jaw closing) are denoted below each graph. Tursiops truncatus open gape approach included a notably delayed gular depression phase onset as a result of slow gape increase. Note gular return to baseline following completion of the feeding cycle.

72
Kogia correlation analysis supports a more negative RSI with decreased
time to maximum gape (Spearman’s rho; α ≤ 0.05) and slower maximum closing
gape angle velocity (Spearman’s rho; α ≤ 0.05). RSI values decreased in
association with increased time to maximum gular depression (Pearson’s ‘r’; α ≤
0.05) and increased maximum gular depression (Pearson’s ‘r’; α ≤ 0.05). RSI
also decreased with increased time to maximum gular retraction (Pearson’s ‘r’; α
≤ 0.01) and increased maximum gular retraction (Pearson’s ‘r’; α ≤ 0.01).
Maximum gular depression increased with maximum gular retraction
(Spearman’s rho; α ≤ 0.01). Time to maximum gape increased with larger
maximum gape and faster maximum food velocity (Pearson’s ‘r’; α ≤ 0.05).
3.7.3 Tursiops truncatus Feeding Behavior
Tursiops truncatus subjects exhibited distinct feeding behaviors from Kogia.
Feeding was more locomotory and subjects approached frozen herring from at
least three to four meters away. Some fluctuations in gape and gular movement
were noted immediately prior to feeding. Pectoral fins were frequently flared or
rotated outward with the lateral surface of the flipper faced forward (pronation),
presumably as an effort to slow forward progress within centimeters of food
items. Mandibular depression was slow and gular depression was extensive
relative to Kogia. Gular depression and retraction were not limited to the gular
depression phase and were observed in jaw opening and jaw closing phases
(Fig. 18B and C). Two distinct ram-based feeding patterns were identified, T.
truncatus open gape approach, and T. truncatus closed gape approach (Fig.
73
17C-F). Subjects performing T. truncatus open gape approach feeding behavior
entered the camera’s view with 50% of maximum gape or more. Gape
increased slowly to maximum gape while the subject swam to and captured the
food item, at which time the jaws closed. Tursiops truncatus closed gape
approach was utilized by both subjects, but T. truncatus open gape approach
was utilized only by “Clicker.” Subjects performing T. truncatus closed gape
approach feeding behavior entered the first video field at or near closed gape (<
3 cm gape); a preparatory phase was observed before the jaws rapidly opened
to maximum gape within centimeters of food. Gular depression and retraction
and tongue retraction were visible in most sequences.
3.7.4 Tursiops truncatus Feeding Kinematics
Pooled T. truncatus, open gape approach, and closed gape approach
feeding variables are summarized in Table 10. Four feeding phases
(preparatory, jaw opening, gular depression and jaw closing) were identified
(Fig. 18B and C). Phase I began when maxillary and mandibular tips were
identified and gape was 25% greater than minimum gape. The mean maximum
gape angle, mean maximum opening gape angle velocity, mean maximum gape
and mean time to maximum gape occurred in phase II. Mean maximum closing
gape angle velocity occurred in phase IV. Tursiops truncatus closed gape
approach feeding behavior was more representative of the pooled data while T.
truncatus open gape approach feeding behavior was more divergent. Phase I
was observed in only one of 11 T. truncatus open gape approach feeding

74
sequences, and the only trial in which tongue retraction was observed measured
1.31 cm and occurred in a time to maximum tongue retraction was 300 ms.
Pooled T. truncatus correlation analysis showed an increased maximum
gape angle with both increased maximum opening and closing gape angle
velocities (Pearson’s “r”; α ≤ 0.01). Tursiops truncatus open gape approach
correlations included increased maximum closing gape angle velocity with
increased maximum opening gape angle velocities (Spearman’s rho; α ≤ 0.05).
Maximum gape angle increased with both maximum opening and closing gape
angle velocity (Pearson’s “r”; α ≤ 0.01). Maximum gular depression increased
with increased maximum gular retraction (Spearman’s rho; α ≤ 0.01). Within T.
truncatus closed gape approach feeding mode, increased RSI correlated with
decreased feeding cycle duration (Spearman’s rho; α ≤ 0.01), and decreased
time to maximum gular depression (Spearman’s rho; α ≤ 0.05). Maximum
closing gape angle velocity increased with maximum opening gape angle
velocity (Pearson’s “r”; α ≤ 0.01). Maximum gape angle increased with both
increased maximum opening and increased closing gape angle velocity
(Pearson’s “r”; α ≤ 0.01).
3.7.5 Comparative Odontocete Kinematics 3.7.5.1 Kogia and Pooled T. truncatus
Numerous significant differences were demonstrated between genera. Mean
Kogia RSI values were significantly less than any T. truncatus group (pooled,
open gape, or closed gape trials) (P < 0.001). Kogia suction distances were
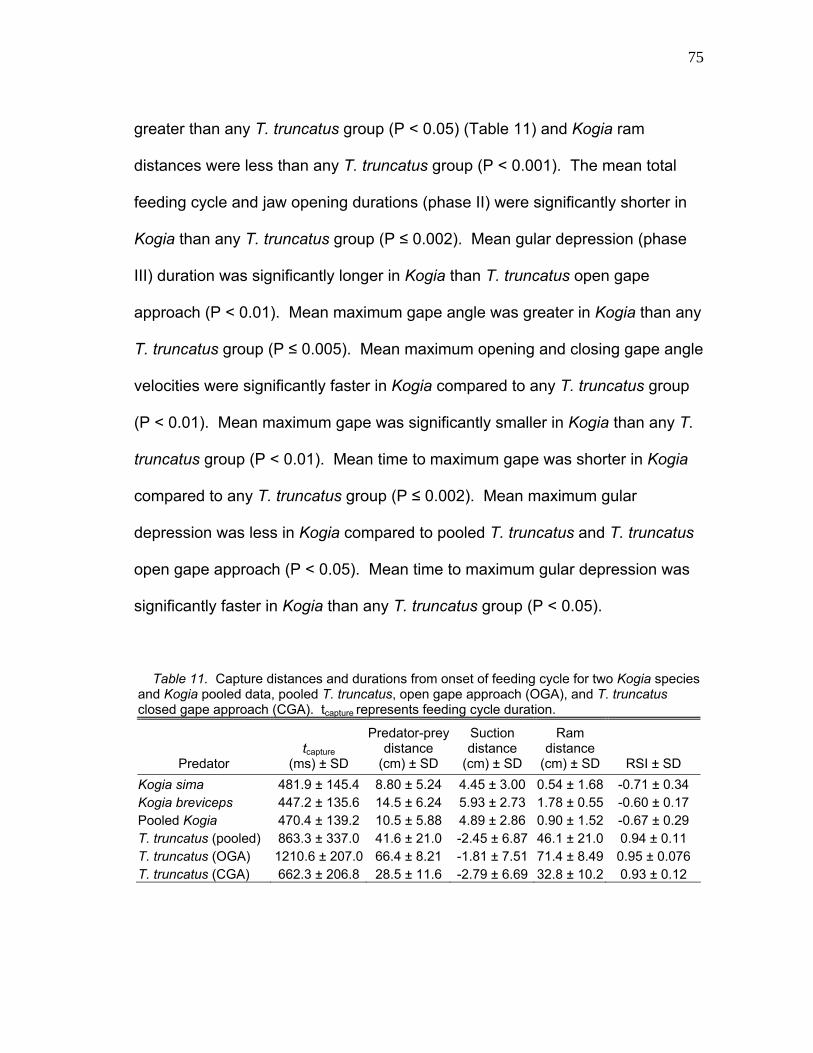
75
greater than any T. truncatus group (P < 0.05) (Table 11) and Kogia ram
distances were less than any T. truncatus group (P < 0.001). The mean total
feeding cycle and jaw opening durations (phase II) were significantly shorter in
Kogia than any T. truncatus group (P ≤ 0.002). Mean gular depression (phase
III) duration was significantly longer in Kogia than T. truncatus open gape
approach (P < 0.01). Mean maximum gape angle was greater in Kogia than any
T. truncatus group (P ≤ 0.005). Mean maximum opening and closing gape angle
velocities were significantly faster in Kogia compared to any T. truncatus group
(P < 0.01). Mean maximum gape was significantly smaller in Kogia than any T.
truncatus group (P < 0.01). Mean time to maximum gape was shorter in Kogia
compared to any T. truncatus group (P ≤ 0.002). Mean maximum gular
depression was less in Kogia compared to pooled T. truncatus and T. truncatus
open gape approach (P < 0.05). Mean time to maximum gular depression was
significantly faster in Kogia than any T. truncatus group (P < 0.05).
Table 11. Capture distances and durations from onset of feeding cycle for two Kogia species and Kogia pooled data, pooled T. truncatus, open gape approach (OGA), and T. truncatus closed gape approach (CGA). tcapture represents feeding cycle duration.
Predator tcapture
(ms) ± SD
Predator-prey distance
(cm) ± SD
Suction distance
(cm) ± SD
Ram distance
(cm) ± SD RSI ± SD Kogia sima 481.9 ± 145.4 8.80 ± 5.24 4.45 ± 3.00 0.54 ± 1.68 -0.71 ± 0.34 Kogia breviceps 447.2 ± 135.6 14.5 ± 6.24 5.93 ± 2.73 1.78 ± 0.55 -0.60 ± 0.17 Pooled Kogia 470.4 ± 139.2 10.5 ± 5.88 4.89 ± 2.86 0.90 ± 1.52 -0.67 ± 0.29 T. truncatus (pooled) 863.3 ± 337.0 41.6 ± 21.0 -2.45 ± 6.87 46.1 ± 21.0 0.94 ± 0.11 T. truncatus (OGA) 1210.6 ± 207.0 66.4 ± 8.21 -1.81 ± 7.51 71.4 ± 8.49 0.95 ± 0.076 T. truncatus (CGA) 662.3 ± 206.8 28.5 ± 11.6 -2.79 ± 6.69 32.8 ± 10.2 0.93 ± 0.12
76
3.7.5.2 Tursiops truncatus Open and Closed Gape Approach Feeding
Numerous significant differences were also demonstrated between T.
truncatus feeding modes. The mean ram distance of T. truncatus open gape
approach was significantly greater than pooled T. truncatus and T. truncatus
closed gape approach (P ≤ 0.005). Tursiops truncatus open gape approach
mean feeding cycle duration was longer than pooled T. truncatus or T. truncatus
closed gape approach (P < 0.02). The mean jaw opening duration was also
longer for T. truncatus open gape approach than for pooled T. truncatus (P <
0.02) and T. truncatus closed gape approach (P < 0.001). The mean gular
depression (phase III) duration was significantly longer in T. truncatus open
gape approach than T. truncatus closed gape approach (P < 0.01). Mean
maximum opening gape angle velocity was significantly slower in T. truncatus
open gape approach compared to pooled T. truncatus (P = 0.012) and T.
truncatus closed gape approach (P < 0.001). Mean time to maximum gape was
also significantly longer in T. truncatus open gape approach than pooled T.
truncatus or T. truncatus closed gape approach (P < 0.05). Mean maximum
gular retraction was significantly greater in T. truncatus open gape approach
compared to Tursiops closed gape approach (P < 0.05).
77
CHAPTER IV
DISCUSSION
4.1 Biomechanics of Hyolingual Anatomy
Although significant differences in maximum tetanic tension were not
identified between most Kogia and T. truncatus hyolingual muscles,
biomechanical modeling illustrated the importance of mechanical advantage and
leverage to feeding in Kogia. As in G. melas, the sternohyoideus was the
primary depressor and retractor of the hyoid (Werth 1992, 2000a). Initially, the
Kogia sternohyoideus orientation was roughly 19° relative to the palatal plane.
The basihyals and thyrohyals likely remained closely-spaced to the stylohyal by
the firm interhyoideus attachment. Therefore, most hyoid movement occurred at
the tympanohyal-tympanic bone articulation. As the Kogia sternohyoideus
contracted, initial hyoid movement was almost exclusively in the ventral
direction. The degree of depression decreased relative to retraction as the hyoid
swung ventrocaudally. During caudoventral hyoid retraction, the angular
difference (relative to the palatal plane) between the sternohyoideus insertion
and origin was reduced, effectively increasing the mechanical advantage for
retraction of the muscle. When the hyoid was fully retracted, the

78
sternohyoideus’ palatal angle was likely reduced to near 0°, making it a pure
hyoid retractor.
Although the sternohyoideus’ palatal angle relative was different between
Kogia and T. truncatus the difference was only 8° in scaled muscle angles. It is
doubtful that this minor difference can account for the divergent feeding behavior
observed between Kogia and Tursiops. Mechanical advantage might have been
greater in either Kogia or T. truncatus if the mean scaled stylohyal lengths (lever
arms) were longer in either genus. However, this was not the case. The lack of
greater PMTT or mechanical advantage in Kogia is surprising, as one or both of
these factors could increase the force transmitted for oral volume increase.
However, it is apparent that available tension is not the primary factor in suction
feeding ability. Additional factors, such as hyoid, orofacial, tongue, and skull
morphology, are dissimilar between Kogia and T. truncatus, and likely
responsible for their divergent feeding behavior.
Hyoid depression was somewhat of a retraction by-product, as basihyal and
thyrohyal retraction required ventral stylohyal rotation, which facilitated
caudoventral tongue movement due to hyolingual, hyoglossal, and styloglossal
attachments. In beaked and pilot whales, the genioglossus and hyoglossus
were also the primary tongue retractors (Heyning and Mead 1996, Werth
2000a). This is of evolutionary interest, as the tympanohyal-stylohyal-epihyal
chain facilitated both ventral and caudal tongue movement where no other
means appeared available. In theory, lingual muscle attachment to the nasal

79
bones could produce a purely caudal tongue motion. However, nasal bones
proximity to the caudal oral cavity would likely limit such motion. No ossified
structure is present ventral of the tongue for lingual depression. Although a thick
blubber layer is present, the elastic character of the blubber would likely reduce
the effectiveness of any strong lingual depressor originating from it. Although a
mobile hyoid is present in all vertebrates, Kogia hyoid size suggests that its
original function as a facilitator of caudoventral lingual movement has been
strongly conserved, possibly more so than any other cetacean.
The order and rapidity in which hyolingual muscles contracted was likely
influential in Kogia suction generation. Behavioral observations demonstrated
that gular depression and retraction coincided with mandibular depression (Fig.
15). To maximize intraoral pressure development, the sternohyoideus,
sternothyroideus, and thyrohyoideus almost certainly depressed and retracted
the hyoid, which in itself depressed the mandible by geniohyoideus insertion to
the sternohyoideus. Although cetaceans do not masticate (Werth 2000b), a
small digastricus was present to aid mandibular depression (Schulte and Smith
1918, Chaine 1914, Reidenberg and Laitman 1994, Heyning and Mead 1996).
Hyoid rotation alone likely pulled the tongue caudoventrally, but simultaneous
hyoglossal and styloglossal contraction at, or slightly after, initial hyoid rotation
likely enhanced the rapidity of oral volume increase. During hyoid depression
and retraction, the interhyoideus restrained basihyal and thyrohyal movement
away from the rest of the hyoid chain. Once these muscles reached or
80
approached maximum contraction, oral volume was likely maximized and oral
pressure peaked. Kinematic data showed that gape began to decrease before
maximum hyoid depression and retraction. This was likely critical to prey
capture. When the hyoid began returning to basal position before gape closure,
food was forced out of the mouth in hydraulic jetting events. However, when
gape closed before hyoid return and the long, fang-like teeth blocked food
escape, rostrodorsal hyoid rotation could not force food from the mouth. Jaw
closure was likely facilitated by the pterygoideus medialis, pterygoideus lateralis,
masseter, and temporalis (Schulte and Smith 1918, Reidenberg and Laitman
1994). The hyoid’s rostrodorsal return was likely a result of mylohyoideus
contraction, which also assisted lingual return. Rostral lingual movement could
be further assisted by genioglossal contraction. Mylohyoideus and genioglossus
contraction likely aided to increase positive oral pressures and produced the
observed hydraulic jetting. The interhyoideus may also have approximated the
basihyal and thyrohyals to the stylohyal and enhanced hydraulic jetting
capability.
4.2 Implications of Hyolingual Anatomy to Suction Feeding
The current understanding of vertebrate feeding supports the hyoid chain as
a primary facilitator of suction feeding (Lauder 1985, Thexton et al. 1998, Werth
2000b, Edmonds et al. 2001, Sanford and Wainwright 2002). Kogia’s suction
feeding ability and kinematic profile was established through behavioral
performance trials of free-swimming subjects. A normal aspect of this feeding
81
pattern was hyoid depression and retraction. It was hypothesized that Kogia
hyolingual musculature would be capable of larger maximum tensions than
Tursiops as an adaptation for better developed for suction feeding to produce a
more forceful hyoid rotation. Although Kogia hyoid muscles are known to be
large (Reidenberg and Laitman 1994) and were shown to be capable of high
maximum tetanic tensions, predicted muscle tensions were generally similar to
T. truncatus. The primary finding of hyolingual investigations was that a
combination of morphological features was likely responsible for the generation
of negative intraoral pressures during Kogia suction feeding
A significant morphological finding was that Kogia had combined basihyal
and thyrohyal surfaces areas that were several times larger than those of T.
truncatus. Heyning and Mead (1996) considered hyoid size and surface area
between cetacean suction and raptorial feeders and identified hyoid
enlargement as an adaptation for more robust sternohyoideus muscles in
suction-feeding beaked whales. Although Kogia also appeared to have larger
muscles relative to T. truncatus, this apparent difference may have stemmed
from the larger basihyal and thyrohyal surface areas for sternohyoideus
insertion. Although maximum tetanic tensions were not found to be significantly
different in this study, basihyal and thyrohyal size likely played a key role in the
development of presumably larger negative intraoral pressure in Kogia. By
having a larger oral surface area caudally, a greater intraoral volume was likely
displaced by caudoventral tongue and soft tissue movement than if a smaller

82
hyoid surface were retracted, such as in T. truncatus. It is probable that not only
the tongue, but also the pharyngeal region was distended by the broad hyoid’s
depression and retraction. As greater oral volume increase allows for more
negative oral pressure development, suction feeding ability was likely strongly
enhanced by hyoid enlargement. The ability of Kogia to depress and retract the
hyoid more rapidly than T. truncatus corresponded to a greater suction
component and likely enhanced an already significant suction feeding ability.
However, Kogia hyoid enlargement relative to T. truncatus was likely the primary
facilitator for effective Kogia suction feeding.
Hyoid enlargement raises the question of how can Kogia and T. truncatus
sternohyoideus muscles of comparable CSA attach to disparately sized
insertions. This discrepancy can be resolved by the more oblique
sternohyoideus insertion angle in Kogia relative to T. truncatus. As the angle of
a cross-section increases with departure from the perpendicular, the cross-
sectional area must also increase. This is relevant to the sternohyoideus’
insertion because, the more oblique the insertion angle, the greater the surface
area on the basihyal and thyrohyal required for insertion. The roughly 8°
difference in the palatal plane between Kogia and T. truncatus meant that the
Kogia sternohyoideus required a greater insertion area. Further, the basihyal
and thyrohyals of Kogia were generally situated at a palatal angle more
rostrocaudal than in T. truncatus. This made the Kogia sternohyoideus insertion
83
angle more oblique, which further necessitated a broader sternohyoideus
insertion area.
Although terrestrial mammals, such as canids, maintain most hyoid elements
as individual, ossified bones (except the tympanohyals), odontocetes may lose
ossification or develop fused elements. For example, T. truncatus ceratohyals
and epihyals are as cartilaginous elements and the thyrohyals can be fused to
the basihyal (Reidenberg and Laitman 1994). A similar condition exists in Kogia,
although the thyrohyals are retained as individual elements (Benham 1902, Hale
1962, Reidenberg and Laitman 1994). This brings into doubt the robustness of
the cetacean hyoid to withstand hyolingual muscle tensions. However,
cartilaginous elements identified in Kogia and T. truncatus generally lacked
attachments for hyolingual muscles and were likely not directly exposed to their
developed tensions. Tensions were likely transferred to these elements through
hyoid rotation, but their elastic properties likely accommodated these forces
through flexation. Even when whole heads were manually swung by the
basihyal, the hyoid chain remained in tact. Furthermore, the presence of
cartilaginous elements may aid significantly to hyoid motion. Cartilagenous
surfaces are a standard component of highly mobile vertebrate joints and
support fluid movement between bones. Cartilagenous elements likely have
similar importance in cetacean hyoid biomechanics. Future investigations of
hyoid cartilage composition may reveal how cartilaginous hyoid elements
84
accommodate rapid and forceful motion and their specific contributions to hyoid
biomechanics.
Cranial morphology was likely highly-influential in intraoral pressure
development. Kogia have the bluntest rostra of all odontocetes (Miller 1923)
and a relatively wider skull and mandible; adaptations that may in part be to
enhance suction feeding. To maximize a change in oral cavity volume, starting
volume should be minimized and volume displaced maximized. The short and
wide Kogia rostrum and mandible could effectively result in a greater change in
intraoral volume. This would permit Kogia to rapidly lower intraoral pressures
relative to a longer, narrower mouth, such as in T. truncatus. However, this may
not apply to all suction feeding cetaceans. Beaked whales have significantly
elongated rostra and are known to produce suction (Heyning and Mead 1996).
Further morphological, biomechanical, and kinematic investigation is necessary
to adequately describe cetacean suction feeding strategies.
Tongue morphology is critical for suction feeding in some marine mammals
(Gordon 1984) and is likely also significant for Kogia. Based on kinematic data,
the short, triangular tongue acted as a piston that rapidly and forcefully traveled
caudoventrally (via the hyoid apparatus) during a suction event. This action was
much more rapid in Kogia than T. truncatus and was likely more effective by the
tight fit of the Kogia tongue against a palatal elevation. The match between
tongue and palate was so similar that individual ridges in the tongue and palate
matched one another exactly. By pressing the tongue against the palate prior to

85
feeding, suction was likely enhanced by this seal displacing a larger volume
during tongue depression and retraction. Additionally, the presence of throat
grooves in the blubber ventral to the hyoid in some suspected suction feeders,
such as beaked whales, sperm whales, and K. sima may allow for additional
gular distension when the hyoid is retracted (Clarke et al. 1968, Heyning and
Mead 1991, 1996, Werth 2000b, 2005). Although the T. truncatus tongue also fit
into a palatal elevation, the match was not as close. Presumably, a ram-based
feeder would not require such an exact tongue-to-palate condition. The large
basihyal-thyrohyal and short, wide tongue in Kogia versus the small basi-
thyrohyal and large tongue in T. truncatus is likely significant in each genera’s
relative abilities to effectively increase oral volume while feeding.
Once developed, negative intraoral pressures must be directed for effective
suction feeding. In T. truncatus, any negative pressure generated likely
dissipated immediately along the lateral gape. However, the lateral mouth
occlusions of Kogia would have prevented pressure dissipation laterally. The
combination of a lateral occlusion and a short rostrum probably maintained a
negative pressure gradient that was directed to the rostral mouth opening. This
circular orifice presumably formed an efficient mechanism to draw water and
prey into the mouth. Walruses are known to purse their lips during suction
feeding potentially to restrict water flow away from prey items (Kastelein et al.
1994). The combination of oral and hyolingual morphology makes Kogia one of,
86
if not the best, morphologically-suited cetacean for the production of large,
directed, negative oral pressures necessary for suction feeding.
In summary, osteological and morphological features of Kogia and T.
truncatus hyolingual and oral regions support Kogia as effective suction feeders
and T. truncatus as ram feeders. Enlarged basihyals and thyrohyals relative to
T. truncatus were likely key in oral volume increase and validate the functional
hypothesis that enlarged hyoids are associated with suction feeding. A lateral
gape occlusion, vaulted palate with matching, short, tongue, short mouth, and
throat grooves are likely morphological adaptations for suction feeding in Kogia.
4.3 Kinematics of Suction-Based Feeding
The current functional hypothesis for negative intraoral pressure generation
by feeding marine mammals is the rapid depression and retraction of the tongue
by the hyoid apparatus. Much anatomical data exist to support this hypothesis
(e.g., Gordon 1984, Reidenberg and Laitman 1994, Heyning and Mead 1996,
this study). However, few cetacean investigations have examined the
mechanics of suction production. The major finding of this study is that the
kinematic profile of presumed suction feeders, K. breviceps and K. sima,
validates that these odontocetes use suction and supports the functional
hypothesis that suction is produced by rapid depression and retraction of the
tongue and associated gular structures, such as the hyoid apparatus.
Negative Kogia RSI values were likely generated by the simultaneous
depression and retraction of the hyoid apparatus, which in turn would have
87
depressed and retracted the tongue. The rapidity of this movement, relative to
T. truncatus, would likely have produced negative intraoral pressures and
analysis of feeding trial footage verifies that suction is produced (food moved
into the mouth), and is integral in the suction producing mechanism. In addition,
suction production was also likely influenced by the rapid increase in gape and
gape angle relative to T. truncatus. The fact that Kogia hyoid depression and
retraction were not as extensive as T. truncatus is likely a scaling factor and not
related to the relative magnitude of suction produced. Kogia subjects possessed
a mandible that was largely recessed within the confines of the head, and only
the distal one-third of the mandible was externally apparent compared to two-
thirds for T. truncatus. This resulted in a larger gape in T. truncatus compared to
Kogia. However, gape angle was greater in Kogia versus T. truncatus, and this
wide gape angle is likely one of the greatest of any odontocete, with the possible
exception of Physeter (Werth 2005). The short external mandible in conjunction
with the specialized tissue ridges on the lateral perimeter of the mandible served
to occlude the lateral gape of the jaw and helped produce a circular mouth
opening; a surprising adaptation in an odontocete. Other marine mammals,
such as walruses (Odobenus rosmarus; Kastelein et al. 1991) and belugas
(Delphinapterus leucas; Brodie 1989), use elaborate orofacial musculature to
occlude this region. Several throat grooves present in the gular region of K.
sima may have assisted in allowing greater depression and retraction of the
hyoid apparatus.

88
Kogia feeding must allow for the expulsion of water following food capture.
Kogia subjects generally maintained a partial gape subsequent to phase IV,
probably to allow water to exit. When Kogia subjects retained food after a
feeding event, squid were restrained by the mandibular teeth, but partial gape
was maintained. It appeared that only a light pressure was applied to food and it
was doubtful that a soft-bodied cephalopod could significantly encumber gape
closure. Furthermore, more forceful jaw closure could hinder squid removal
from the teeth. The opposite behavior to suction is the forceful ejection of water
out of the mouth, or hydraulic jetting. Hydraulic jetting was observed in 25% of
Kogia feeding trials and could be influential in the capture of benthic prey or in
manipulation of prey.
Two major caveats of the Kogia data were that subjects were young and that
feeding trials ended prematurely due to the death of both subjects. This event
was not unexpected since kogiids have a poor success rate in captivity
(Sylvestre 1983). The situation in this study was unique in that these subjects
survived for more than one year (Manire 2004). At the time of study, Kogia
subjects were less than one year old, at least partially dependent upon formula
diets, and did not swallow food in any recorded session. It is possible that
sucking behavior could have been derived from suckling as in other mammals
(Gordon and Herring 1987, German et al. 1992), and not completely
representative of feeding in adult Kogia. However, the K. breviceps subject had
consumed whole squid for the last 15 of 21 months of captivity. Food was
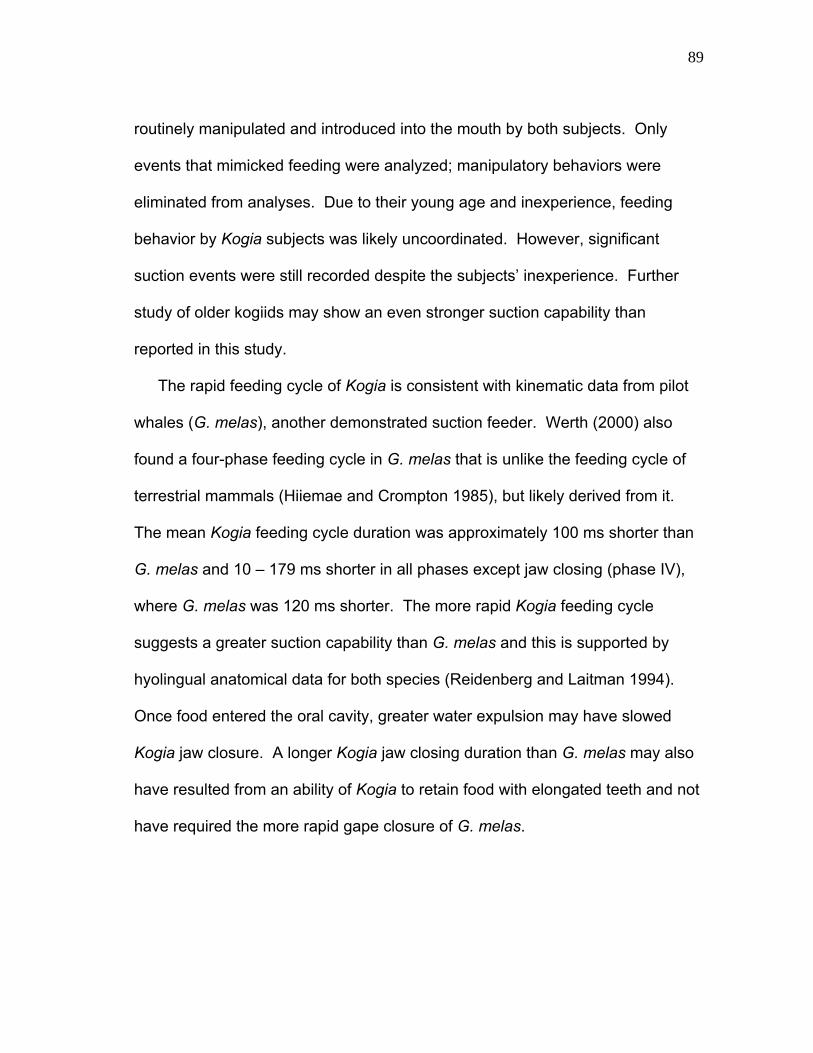
89
routinely manipulated and introduced into the mouth by both subjects. Only
events that mimicked feeding were analyzed; manipulatory behaviors were
eliminated from analyses. Due to their young age and inexperience, feeding
behavior by Kogia subjects was likely uncoordinated. However, significant
suction events were still recorded despite the subjects’ inexperience. Further
study of older kogiids may show an even stronger suction capability than
reported in this study.
The rapid feeding cycle of Kogia is consistent with kinematic data from pilot
whales (G. melas), another demonstrated suction feeder. Werth (2000) also
found a four-phase feeding cycle in G. melas that is unlike the feeding cycle of
terrestrial mammals (Hiiemae and Crompton 1985), but likely derived from it.
The mean Kogia feeding cycle duration was approximately 100 ms shorter than
G. melas and 10 – 179 ms shorter in all phases except jaw closing (phase IV),
where G. melas was 120 ms shorter. The more rapid Kogia feeding cycle
suggests a greater suction capability than G. melas and this is supported by
hyolingual anatomical data for both species (Reidenberg and Laitman 1994).
Once food entered the oral cavity, greater water expulsion may have slowed
Kogia jaw closure. A longer Kogia jaw closing duration than G. melas may also
have resulted from an ability of Kogia to retain food with elongated teeth and not
have required the more rapid gape closure of G. melas.
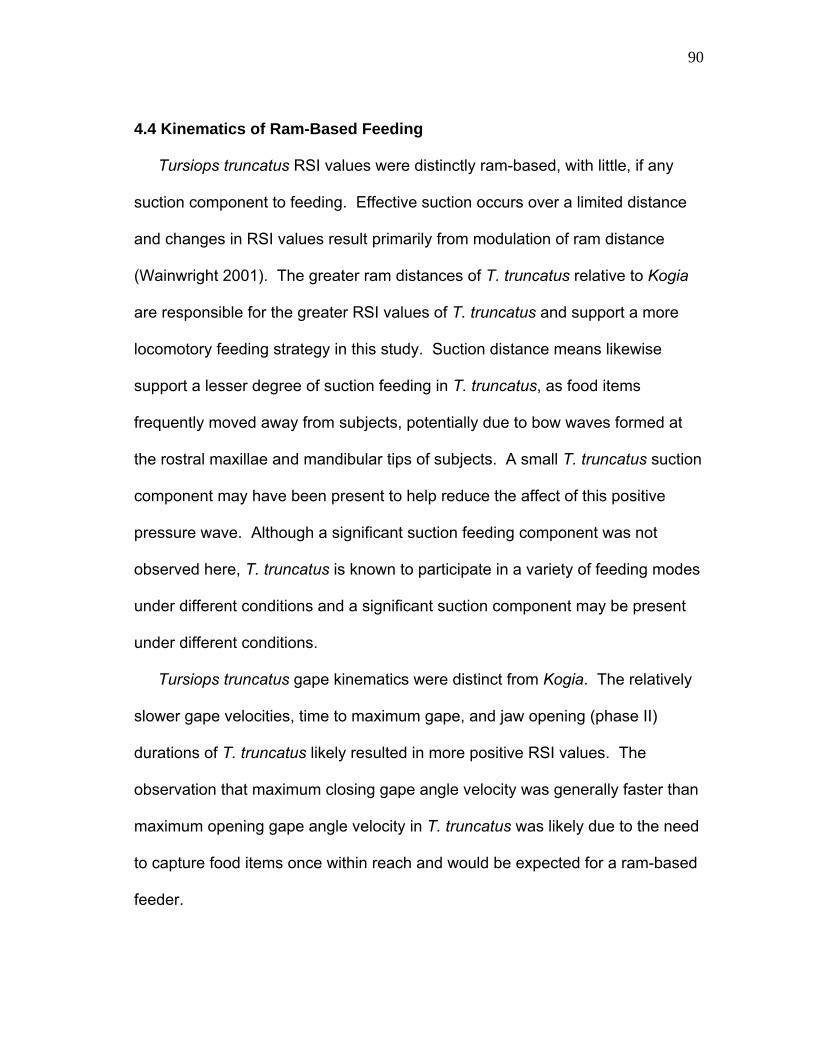
90
4.4 Kinematics of Ram-Based Feeding
Tursiops truncatus RSI values were distinctly ram-based, with little, if any
suction component to feeding. Effective suction occurs over a limited distance
and changes in RSI values result primarily from modulation of ram distance
(Wainwright 2001). The greater ram distances of T. truncatus relative to Kogia
are responsible for the greater RSI values of T. truncatus and support a more
locomotory feeding strategy in this study. Suction distance means likewise
support a lesser degree of suction feeding in T. truncatus, as food items
frequently moved away from subjects, potentially due to bow waves formed at
the rostral maxillae and mandibular tips of subjects. A small T. truncatus suction
component may have been present to help reduce the affect of this positive
pressure wave. Although a significant suction feeding component was not
observed here, T. truncatus is known to participate in a variety of feeding modes
under different conditions and a significant suction component may be present
under different conditions.
Tursiops truncatus gape kinematics were distinct from Kogia. The relatively
slower gape velocities, time to maximum gape, and jaw opening (phase II)
durations of T. truncatus likely resulted in more positive RSI values. The
observation that maximum closing gape angle velocity was generally faster than
maximum opening gape angle velocity in T. truncatus was likely due to the need
to capture food items once within reach and would be expected for a ram-based
feeder.

91
As in Kogia, T. truncatus hyoid movement occurred over most of the feeding
cycle and was not limited to the gular depression phase. Forward motion of T.
truncatus was essential in food capture. In several cases, numerous capelin
(Mallotus villosus) were simultaneously offered to T. truncatus subjects. Gape
and gular movements alone were insufficient to draw food items into the mouth
and in several trials successful food capture did not involve any hyoid
depression or retraction. This was a key behavioral difference between Kogia
and T. truncatus. Flaring of the pectoral fins appeared to slow forward motion in
T. truncatus subjects when in close proximity to food. Pectoral pronation was
similarly observed in a kinematic analysis of pilot whales (Werth 2000) to slow
forward motion in the final stages of food approach.
Tursiops truncatus closed and open gape approaches were different from
each other, but were both strongly ram-based. The slowly increasing gape of T.
truncatus open gape approach resulted in all significant differences of gape and
feeding duration variables between T. truncatus closed and open gape
approaches. Gular depression and retraction were observed even when a large
partial gape was present. A preparatory phase was observed in only one of 11
trials of T. truncatus open gape approach behavior and was not included in the
kinematic profile of T. truncatus open gape approach feeding (Fig. 4C).
However, it is likely that a preparatory phase was always present in T. truncatus
open gape approach, but occurred before the subject entered the video

92
camera’s field of view. Early gape may have served to slow forward motion by
increasing drag.
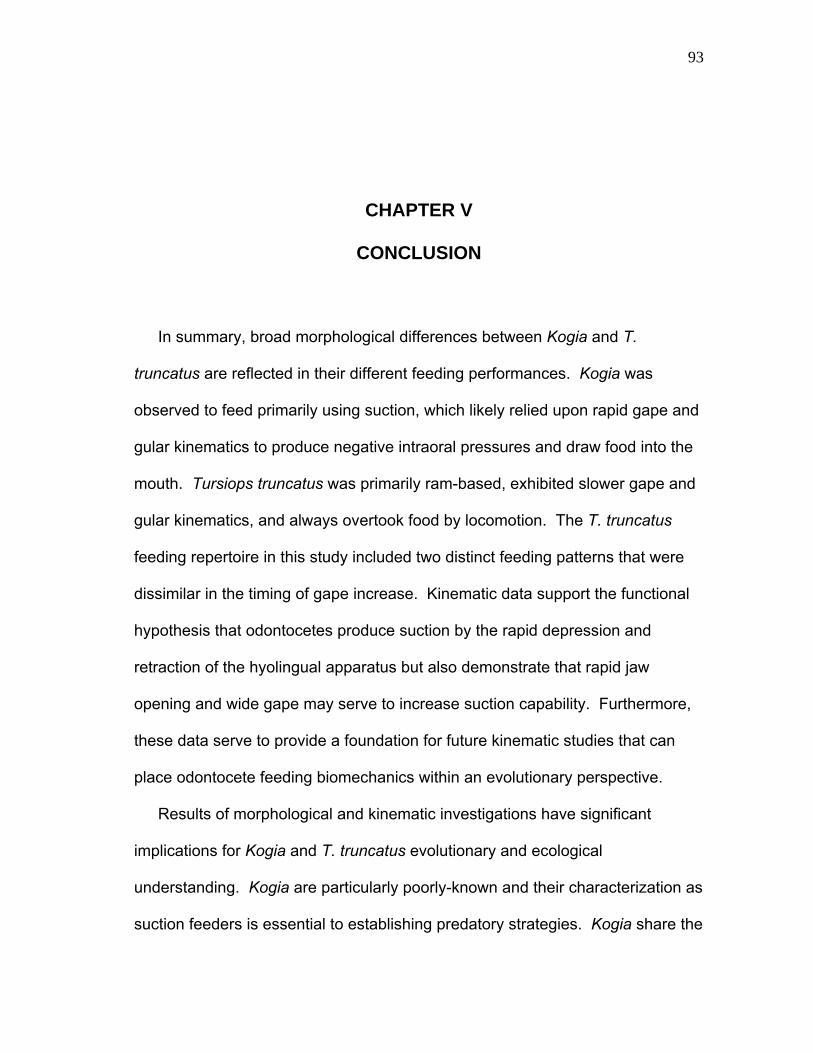
93
CHAPTER V
CONCLUSION
In summary, broad morphological differences between Kogia and T.
truncatus are reflected in their different feeding performances. Kogia was
observed to feed primarily using suction, which likely relied upon rapid gape and
gular kinematics to produce negative intraoral pressures and draw food into the
mouth. Tursiops truncatus was primarily ram-based, exhibited slower gape and
gular kinematics, and always overtook food by locomotion. The T. truncatus
feeding repertoire in this study included two distinct feeding patterns that were
dissimilar in the timing of gape increase. Kinematic data support the functional
hypothesis that odontocetes produce suction by the rapid depression and
retraction of the hyolingual apparatus but also demonstrate that rapid jaw
opening and wide gape may serve to increase suction capability. Furthermore,
these data serve to provide a foundation for future kinematic studies that can
place odontocete feeding biomechanics within an evolutionary perspective.
Results of morphological and kinematic investigations have significant
implications for Kogia and T. truncatus evolutionary and ecological
understanding. Kogia are particularly poorly-known and their characterization as
suction feeders is essential to establishing predatory strategies. Kogia share the

94
base of Odontodeti phylogeny with the Physeteridae and Ziphiidae, all of whom
are suspected or reported suction feeders. Also shared are a deep-diving
ability, teuthophagous diet, deep-water distribution, and the greatest degree of
mammalian cranium asymmetry. It seems likely that some or all of these
characteristics are linked to suction feeding, either as morphological and
behavior facilitators. These attributes may enable predation in physiologically
challenging niches. Kinematic results suggest that Kogia subjects voluntarily
remained nearly stationary while feeding. This aspect may be exploited by free-
ranging Kogia during deep dives for cephalopod prey. Kogia likely dive to a
depth where cephalopod prey are abundant and may remain stationary in or
move slowly through a prey school while employing suction to draw cephalopods
and myctophids into the mouth. This strategy would allow Kogia to avoid active
locomotion while at depth and maximize feeding duration.
Tursiops truncatus are well-known to actively locomote in pursuit of prey, but
biomechanical and kinematic aspects of T. truncatus feeding have not been
previously addressed. Surprisingly, hyolingual musculature in these raptorial
feeders was potentially as powerful as a suction feeder, demonstrating that force
alone is not a measure of suction feeding ability. Kinematic investigations
verified that T. truncatus is capable of more than one feeding pattern. This
suggests that T. truncatus motor patterns are flexible and subjects can modulate
feeding. This allows T. truncatus to be more effective predator by adapting to
variable conditions, such as prey type, size, location, and evasiveness. Further

95
investigation under a variety of conditions would likely show additional
modulation of feeding patterns than those observed in this study.
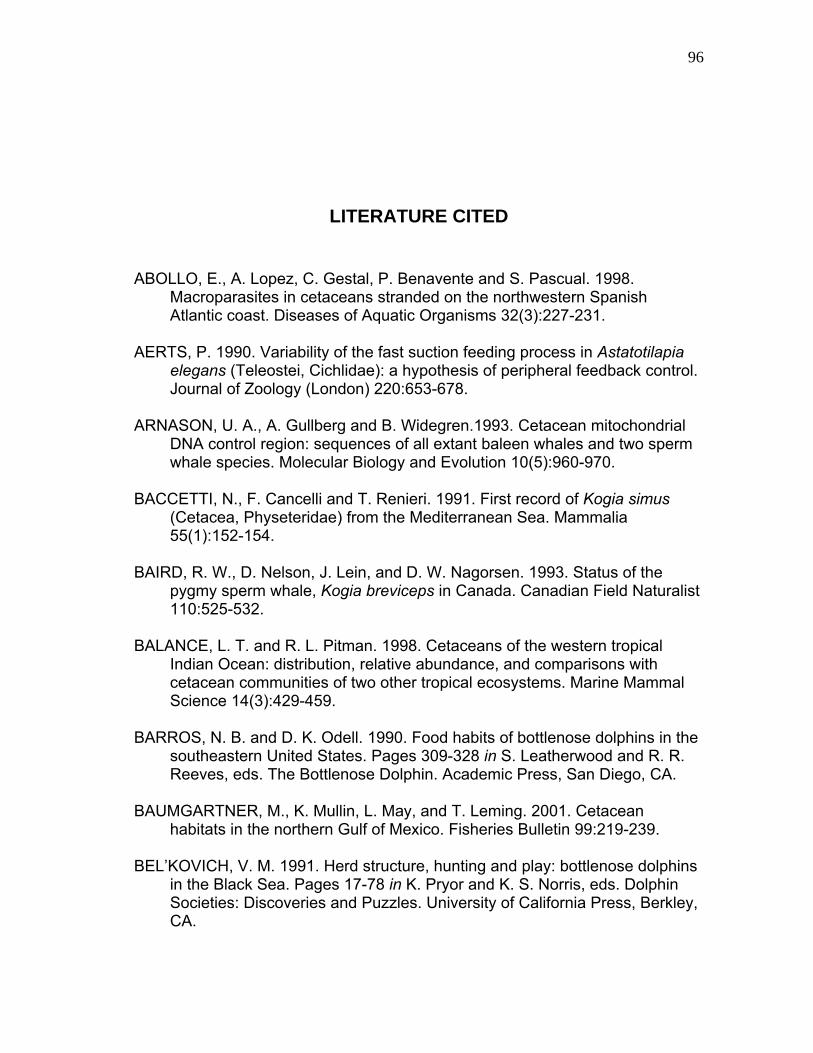
96
LITERATURE CITED
ABOLLO, E., A. Lopez, C. Gestal, P. Benavente and S. Pascual. 1998. Macroparasites in cetaceans stranded on the northwestern Spanish Atlantic coast. Diseases of Aquatic Organisms 32(3):227-231.
AERTS, P. 1990. Variability of the fast suction feeding process in Astatotilapia
elegans (Teleostei, Cichlidae): a hypothesis of peripheral feedback control. Journal of Zoology (London) 220:653-678.
ARNASON, U. A., A. Gullberg and B. Widegren.1993. Cetacean mitochondrial
DNA control region: sequences of all extant baleen whales and two sperm whale species. Molecular Biology and Evolution 10(5):960-970.
BACCETTI, N., F. Cancelli and T. Renieri. 1991. First record of Kogia simus
(Cetacea, Physeteridae) from the Mediterranean Sea. Mammalia 55(1):152-154.
BAIRD, R. W., D. Nelson, J. Lein, and D. W. Nagorsen. 1993. Status of the
pygmy sperm whale, Kogia breviceps in Canada. Canadian Field Naturalist 110:525-532.
BALANCE, L. T. and R. L. Pitman. 1998. Cetaceans of the western tropical
Indian Ocean: distribution, relative abundance, and comparisons with cetacean communities of two other tropical ecosystems. Marine Mammal Science 14(3):429-459.
BARROS, N. B. and D. K. Odell. 1990. Food habits of bottlenose dolphins in the
southeastern United States. Pages 309-328 in S. Leatherwood and R. R. Reeves, eds. The Bottlenose Dolphin. Academic Press, San Diego, CA.
BAUMGARTNER, M., K. Mullin, L. May, and T. Leming. 2001. Cetacean
habitats in the northern Gulf of Mexico. Fisheries Bulletin 99:219-239. BEL’KOVICH, V. M. 1991. Herd structure, hunting and play: bottlenose dolphins
in the Black Sea. Pages 17-78 in K. Pryor and K. S. Norris, eds. Dolphin Societies: Discoveries and Puzzles. University of California Press, Berkley, CA.
97
BENHAM, W. B. 1901. On the anatomy of Cogia breviceps. Proceedings of the
Zoological Society of London 1:107-134, plates 8-11, fig.s 7-8. BENHAM, W. B. 1902. Notes on the osteology of the short nosed sperm whale.
Proceedings of the Zoological Society of London 1:54-62. BERTA, A. and J. L. Sumich. 1999. Cetacean evolution and systematics. Pages
49-85 in A. Berta and J. L. Sumich, eds. Marine Mammals: Evolutionary Biology. Academic Press, San Diego, CA.
BIANUCCI, G. and W. Landini. 1999. Kogia pusilla from the middle Pliocene of
Tuscany (Italy) and a phylogenetic analysis of the family Kogiidae (Odontoceti, Cetacea) Rivista Italiana di Paleontologiae Stratigrafia 105(3):445-453.
BRODIE, P. F. 1989. The white whale Delphinapterus leucas (Pallas, 1776).
Pages 119-144 in S. H. Ridgeway and R. Harrison, eds. Handbook of Marine Mammals Volume 3. River Dolphins and the Larger Toothed Whales. Plenum Press, New York, NY.
BROWN, D. H. 1962. Further observations on the pilot whale in captivity.
Zoologica New York 47:59-64. CALDWELL, D. K. and M. C. Caldwell. 1989. Pygmy sperm whale Kogia
breviceps (de Blainville, 1838), dwarf sperm whale Kogia simus (Owen, 1866). Pages 235-260 in S. H. Ridgeway and R. Harrison, eds. Handbook of Marine Mammals Volume 4. Academic Press, London.
CALDWELL, D. K., M. C. Caldwell and G. Arrindell. 1973. Dwarf sperm whale,
Kogia simus, from the Lesser Antillean island of St. Vincent. Journal of Mammalogy 54:515-517.
CALDWELL, D. K., M. C. Caldwell and S. Zam. 1971a. A preliminary report on
some ectoparasites and nasal sac- parasites from small odontocete cetaceans from Florida and Georgia. Marineland of Florida Research Laboratory Technical Report 5:1-7.
CALDWELL, D. K. and F. B. Golley. 1965. Marine mammals from the coast of
Georgia to Cape Hatteras. Journal of the Elisha Mitchell Scientific Society 81(1):24-32.

98
CALDWELL, D. K., H. Neuhauser, M. C. Caldwell and H. Coolridge. 1971b. Recent records of marine mammals from the coasts of Georgia and South Carolina. Cetology 5:1-12.
CALDWELL, D. K., J. H. Prescott and M. C. Caldwell. 1966. Production of
pulsed sounds by the pygmy sperm whale, Kogia breviceps. Bulletin of the Southern California Academy of Science 65(4):245-248.
CARROLL, A. M., P. C. Wainwright, S. H. Kuskey, D. C. Collar and R. G.
Turingan. 2004. Morphology predicts suction feeding performance in centrarchid fishes. Journal of Experimental Biology 207:3873-3881.
CHAINE, J. 1914. Le digastrique abaisseur de la mandibule des mammifères.
Journal of Anatomy and Physiology 50:248-319. CLARKE, M. R. 1978. Buoyancy control as a function of the spermaceti organ in
the sperm whale. Journal of the Marine Biological Association of the United Kingdom 58:27-71.
CLARKE, M. R. 2003. Production and control of sound by the small sperm
whale, Kogia breviceps and K. sima and their implications for other Cetacea. Journal of the Marine Biological Association of the United Kingdom 83:241-263.
CLARKE, M. R., A. Aguayo and O. Paliza. 1968. Sperm whales of the southeast
Pacific. Scientific Results of Marine Biological Research 51:1-80. COCKCROFT, V. G. and G. J. B. Ross. 1990a. Food and feeding of the Indian
Ocean bottlenose dolphin off southern Natal, South Africa. Pages 295-308 in S. Leatherwood and R. R. Reeves, eds. The Bottlenose Dolphin. Academic Press, San Diego, CA.
COCKCROFT, V. G. and G. J. B. Ross. 1990b. Age, growth and reproduction of
bottlenose dolphins Tursiops truncatus from the east coast of South Africa. Fisheries Bulletin 88(2):289-302.
CONNOR, R. C., R. S. Wells, J. Mann and A. J. Read. 2000. The bottlenose
dolphin, Tursiops spp: social relationships in a fission-fusion society. Pages 91-126 in J. Mann, R. C. Connor, P. L. Tyack and H. Whitehead, eds. Cetacean Societies: Field Studies of Dolphins and Whales. University of Chicago Press, Chicago, IL.
DAVIS, R. W., G. Fargion, N. May, T. Leming, M. Baumgartner, W. Evans, L.
Hansen and K. Mullin. 1998. Physical habitat of cetaceans along the
99
continental slope in the north-central and western Gulf of Mexico. Marine Mammal Science 14(3):490-507.
DOS SANTOS, R. A. and M. Haimovici. 2001. Cephalopods in the diet of marine
mammals stranded or incidentally caught along southeastern and southern Brazil (21 - 34°S). Fisheries Research 52:99-112.
EDMONDS, M. A., P. J. Motta and R. E. Hueter. 2001. Food capture kinematics
of the suction feeding horn shark, Heterodontus francisci. Environmental Biology of Fishes 62:415-427.
EVANS, H. and G. Christensen. 1979. Muscles: muscles of the head. Pages
289-300 in H. Evans and G. Christensen, eds. Miller’s Anatomy of the Dog. W. B. Saunders Company, Philadelphia, PA.
FERTL, D. and S. Leatherwood. 1997. Cetacean interactions with trawls: a
preliminary review. Journal of Northwest Atlantic Fisheries Science 22:219-248.
FITCH, J. and Brownell. 1968. Fish otoliths in cetacean stomachs and their
importance in interpreting feeding habits. Journal of the Fisheries Research Board of Canada 25(12):2561-2574.
FORCADA, J. 2002. Distribution. Pages 327-333 in W. F. Perrin, B. Würsig and
J. G. M. Thewissen, eds. Encyclopedia of Maine Mammals. Academic Press, San Diego, CA.
FRASER, F. C. 1974. Report on Cetacea stranded on the British coasts from
1948 to 1966. British Museum of Natural History 14:65 pp., iii, 9 maps. GALLAGHER, M. and P. van Bree. 1980. On a dwarf sperm whale, Kogia simus
(Owen, 1866), from the sultanate of Oman. Zeitschrift fur Saugetierkunde 45:53-57.
GANNON, D. P., N. B. Barros, D. P. Nowacek, A. J. Read, D. M. Waples and R.
S. Wells. 2005. Prey detection by bottlenose dolphins (Tursiops truncatus): an experimental test of the passive listening hypothesis. Animal Behaviour 69:709-720.
GASKIN, D. E. 1967. Luminescence in a squid Moroteuthis sp. (probably ingens
Smith), and a possible feeding mechanism in the sperm whale Physeter catadon L. Tuatara 15(2):86-88.
100
GASKIN, D. E. 1976. The evolution, zoogeography and ecology of Cetacea. Oceanography and Marine Biology Annual Review 14:247-346.
GEISLER, J. and A. Sanders. 2003. Morphological evidence for the phylogeny
of Cetacea. Journal of Mammalian Evolution 10:23-129. GERMAN, R. Z. and A. W. Crompton. 1996. Ontogeny of suckling mechanisms
in opossums. Brain, Behavior and Evolution 48:157-164. GERMAN, R. Z., A. W. Crompton, L. C. Levitch and A. J. Thexton. 1992. The
mechanism of suckling in two species of infant mammal: miniature pigs and long-tailed macaques. Journal of Experimental Zoology 261:322-330.
GILL, T. 1871. The sperm whales, giant and pygmy. American Naturalist 4:723-
743, fig.s 164-176. GORDON, K. R. 1984. Models of tongue movement in the walrus (Odobenus
rosmarus). Journal of Morphology 182:179-196. GORDON, K. R. and S. W. Herring. 1987. Activity patterns within the
genioglossus during suckling in domestic dogs and pigs: interspecific and intraspecific plasticity. Brain, Behavior and Evolution 30:249-262.
HALE, H. 1962. The pigmy sperm whale (Kogia breviceps) on South Australian
coasts. Part III. Records of the South Australian Museum 14:197-230. HALE, H. 1963. Young female pigmy sperm whale (Kogia breviceps) from
Western and South Australia. Records of the South Australia Museum 14(3):561-577.
HAMILTON, P. V. and R. T. Nishimoto. 1977. Dolphin predation on mullet.
Florida Science 40(3):251-252. HANDLEY Jr., C. 1966. A synopsis of the genus Kogia (pygmy sperm whale).
Pages 62-69 in K. S. Norris, ed. Whales, Dolphins and Porpoises. University of California Press, Berkley, CA.
HERMAN, L. M. 1980. Cetacean Behavior: Mechanisms and Functions. Krieger
Publishing Company, Malabar, FL. 463 P. HEYNING, J. 1989. Comparative facial anatomy of beaked whales (Ziphiidae)
and a systematic revision among the families of extant Odontoceti. Contributions in Science 405:1-64.
101
HEYNING, J. E. and J. G. Mead. 1991. Feeding mechanisms of ziphiids: do beaked whales suck? Ninth Biennial Conference on the Biology of Marine Mammals. December 5-9, 1991. Chicago, IL. Page. 33.
HEYNING, J. E. and J. G. Mead. 1996. Suction feeding in beaked whales:
morphological and observational evidence. Contributions in Science 464:1-12.
HIIEMAE, K. M. and A. Crompton. 1985. Mastication, food transport, and
swallowing. Pages 262-290, 404-406 in M. Hildebrand, D. Bramble, K. Liem and D. Wake, eds. Functional Vertebrate Morphology. Belkamp Press of Harvard University Press, Harvard, MA
HOESE, H. D. 1971. Dolphin feeding out of water in a salt marsh. Journal of
Mammalogy 52(1):222-223. HOWELL, A. B., ed. 1930. Aquatic Mammals. Charles C. Thomas, Springfield,
IL. HUBBS, C. 1951. Eastern Pacific records and general distribution of the pygmy
sperm whale. Journal of Mammalogy 32:403-410. HUBER, D. R. and P. J. Motta. 2004. Comparative analysis of methods for
determining bite force in the spiny dogfish Squalus acanthias. Journal of Experimental Biology 301A:26-37.
HUCKSTADT, L. and T. Antezana. 2001. An observation of parturition in a
stranded Kogia breviceps. Marine Mammal Science 17(2):362-365. KAMI, H. and R. Lujan. 1976. Records of the dwarf sperm whale Kogia simus
from Guam. Micronesica 12:327-332. KASTELEIN, R. A., J. L. Dubbeldam and M. A. G. DeBakker. 1997. The
anatomy of the walrus head (Odobenus rosmarus). Part 5. The tongue and its function in walrus ecology. Aquatic Mammals 23:29-47.
KASTELEIN, R. A., N. M. Gerrits, and J. L. Dubbeldam. 1991. The anatomy of
the walrus head (Odobenus rosmarus). Part 2. Description of the muscles and of their role in feeding and haul-out behavior. Aquatic Mammals 17(3):156-180.
KASTELEIN, R. A., Muller, M. and Terlouw, A. 1994. Oral suction of a Pacific walrus (Odobenus rosmarus divergens) in air and under water. Zeitschrift fur Saugetierkunde 59:105-115.
102
KENNEY, R. D. 1990. Bottlenose dolphins off the northeastern United States. Pages 369-386 in S. Leatherwood and R. R. Reeves, eds. The Bottlenose Dolphin. Academic Press, San Diego, CA.
KLAGES, N., V. Cockcroft and P. Best. 1989. Stomach contents of pygmy Kogia
breviceps and dwarf Kogia simus sperm whales stranded on South African beaches. Abstracts of the Eighth Biennial Conference on the Biology of Marine Mammals. December 7-11, 1989. Pacific Grove, CA. Page 35.
LAMBERTSEN, R. H. 1983. Internal mechanisms of rorqual feeding. Journal of
Mammalogy 64:76-88. LAMBERTSEN, R. H. and R. J. Hintz. 2004. Maxillomandibular cam articulation
discovered in north Atlantic minke whale. Journal of Mammalogy 85(3):446-452.
LAMBERTSEN, R. H., N. Ulrich and J. Straley. 1995. Frontomandibular stay of
Balaenopteridae: a mechanism for momentum recapture during feeding. Journal of Mammalogy 76:877-899.
LAUDER, G. V. 1985. Aquatic feeding in lower vertebrates. Pages 210-229 in M.
Hildebrand, D. Bramble, K. Liem and D. Wake, eds. Functional Vertebrate Morphology. Belknap Press, Cambridge, MA.
LEATHERWOOD, S. H. 1975. Some observations of feeding behavior of
bottlenose dolphins (Tursiops truncatus) in the northern Gulf of Mexico and (Tursiops cd T. gilli) off southern California, Baja California, and Nayarit, Mexico. Marine Fisheries Research 37(9):10-16.
LEATHERWOOD, S. H. and R. R. Reeves. 1983. Pygmy sperm whale Kogia
breviceps, Dwarf sperm whale Kogia sima. Pages 90-96 in S. H. Leatherwood and R. R. Reeves, eds. The Sierra Club Handbook of Whales and Dolphins. Sierra Club Books, San Francisco, CA.
LEATHERWOOD, S. H., R. R. Reeves, W. Perrin and W. Evans. 1988.
Bottlenose dolphin, Pygmy sperm whale, Dwarf sperm whale. Pages 173-177, 193-200 in S. H. Leatherwood, R. R. Reeves, W. Perrin and W. Evans, eds. Whales, Dolphins and Porpoises of the Eastern North Pacific and Adjacent Arctic Waters. Dover Publications, New York, NY.
LENFANT, C. 1969. Physiological properties of blood of marine mammals.
Pages 95-116 in H. T. Anderson, ed. The Biology of Marine Mammals. Academic Press, San Diego, CA.
103
LOEB, G. E. and C. Gans. 1986. Anatomical techniques. Pages 319-322 in G. E. Loeb and C. Gans, eds. Electromyography for Experimentalists. University of Chicago Press, Chicago, IL.
MAIGRET, J. and D. Robineau. 1981. Le genre Kogia (Cetacea, Physeteridae)
sur les cotes du Senegal. Mammalia 45(2):199-204. MANIRE, C. A., H. L. Rheinhardt, N. B. Barros, L. Byrd and P. Cunningham-
Smith. 2004. An approach to the rehabilitation of Kogia sp. Aquatic Mammals 30(2):209-219.
MARTINS, H., M. Clarke, F. Reiner and R. Santos. 1985. A pygmy sperm whale,
Kogia breviceps (Blainville, 1838) (Cetacea: Odontoceti) stranded on Fail Island, Azores, with notes on cephalopod beaks in stomach. Arquipelago, Serie Ciencia da Natureza 6:63-70.
McALPINE, D., L. Murison and E. Hoberg. 1997. New records for the pygmy
sperm whale Kogia breviceps (Physeteridae) from Atlantic Canada with notes on diet and parasites. Marine Mammal Science 13(4):701-704.
McMAHON, T. 1984. Muscles, Reflexes, and Locomotion. Princeton Univ.
Press, Princeton, NJ. MEAD, J. G. and C. W. Potter. 1990. Natural history of bottlenose dolphins
along the central Atlantic coast. Pages 165-195 in S. Leatherwood and R. R. Reeves, eds. The Bottlenose Dolphin. Academic Press, San Diego, CA.
MENDEZ, J. and A. Key. 1960. Density and composition of mammalian muscle.
Metabolism, Clinical and Experimental 9:184-188. MILLER, G. S. Jr. 1923. The telescoping of the cetacean skull. Smithsonian
Miscellaneous Collections 76(5):1-71. MILINKOVITCH, M. C., A. Meyer and J. R. Powell. 1994. Phylogeny of all major
groups of cetaceans based on DNA sequences from three mitochondrial genes. Molecular Biology and Evolution 11(6):939-948.
MOTTA, P. J. and C. D. Wilga. 2001. Advances in the study of feeding
behaviors, mechanisms, and mechanics of sharks. Environmental Biology of Fishes 60:131-156.
MULLIN, K. D. and G. L. Fulling. 2004. Abundance of cetaceans in the oceanic
northern Gulf of Mexico. Marine Mammal Science 20(4):787-807.
104
MULLIN, K., W. Hoggard, C. Roden, R. Lohoefer, C. Rogers and B. Taggert. 1994. Cetaceans of the upper continental slope in the north-central Gulf of Mexico. Fisheries Bulletin 92:773-786.
MURPHY, R. A. and A. C. Beardsley. 1974. Mechanical properties of the cat
soleus muscle in situ. American Journal of Physiology 227:1008-1013. NAGORSEN, D. 1985. Kogia simus. Mammalian Species 239:1-6. NITTA, E. 1991. The marine mammal stranding network for Hawaii, an overview.
Pages 55-62 in J. Reynolds and D. Odell, eds. Marine Mammal Strandings in the United States. NOAA Technical Report NMFS 98.
NORRIS, K. S. and B. Møhl. 1983. Can odontocetes debilitate prey with sound?
American Naturalist 122:85-104. NORTON, S. and E. Brainerd. 1993. Convergence in the feeding mechanics of
ecomorphologically similar species in the Centrarchidae and Cichlidae. Journal of Experimental Biology 176:11-29.
ORTON, L. S. and P. F. Brodie. 1987. Engulfing mechanisms of fin whales.
Canadian Journal of Zoology 65:2898-2907. OWEN, R. 1867. Note to memoir on the Indian Cetacea collected by Sir Walter
Elliot. Transaction of the Zoological Society of London 6:171-174. PABST, D. A., S. A. Rommel and W. A. McLellan. 1999. The functional
morphology of marine mammals. Pages 15-72 in J. E. Reynolds III and S. A. Rommel, eds. Biology of Marine Mammals. Smithsonian Institution Press, Washington, DC.
PINEDO, M. 1987. First record of a dwarf sperm whale from the southwest
Atlantic, with reference to osteology, food habits and reproduction. Scientific Reports of the Whales Research Institute 38:171-186.
PITTMAN, R. Personal communication via oral presentation at Biology of Kogia
Workshop at 15th Biennial Conference on the Biology of Marine Mammals. National Marine Fisheries Service, Southwest Fisheries Science Center, La Jolla, CA.
PIVORUNAS, A. 1977. The fibrocartilage skeleton and related structures of the
ventral pouch of balaenopterid whales. Journal of Morphology 151:299-314.
105
POWELL, P. L., R. R. Roy, P. Kanim, M. A. Bello and V. R. Edgerton 1984. Predictability of skeletal muscle tension from architectural determinations in guinea pig hindlimbs. Journal of Applied Physiology: Respiratory, Environmental and Exercise Physiology 57:1715-1721.
REIDENBERG, J. and J. Laitman. 1994. Anatomy of the hyoid apparatus in
Odontoceti (toothed whales): specializations of their skeleton and musculature compared with those of terrestrial mammals. Anatomical Record 240:598-624.
RICE, D. 1998. Family Kogiidae. Pygmy sperm whale. Pages 83-85 in D.
Wartzok, ed. Marine Mammals of the World: Systematics and Distribution. Society for Marine Mammalogy Special Publication Number 4. Allen Press, Lawrence, KS.
RIGLEY, L. 1983. Dolphins feeding in a South Carolina salt marsh.
Whalewatcher 17(2):3-5. ROMMEL, S. A. 1990. Osteology of the bottlenose dolphin. Pages 29-49 in S.
Leatherwood and R. R. Reeves, eds. The Bottlenose Dolphin. Academic Press, San Diego, CA.
ROSS, G. J. B. 1978. Records of pygmy and dwarf sperm whales, genus Kogia,
from southern Africa, with biological notes and some comparisons. Annals of the Cape Provincial Museum of Natural History 11:259-327.
ROSS, G. J. B. 1984. The smaller Cetacea of the south east coast of southern
Africa. Annals of the Cape Provincial Museum of Natural History 15:173-411.
ROSS, G. J. B. and V. G. Cockcroft. 1990. Comments on Australian bottlenose
dolphins and the taxonomic status of Tursiops aduncus (Ehrenberg, 1832). Pages 101-128 in S. Leatherwood and R. R. Reeves, eds. The Bottlenose Dolphin. Academic Press, San Diego, CA.
ROSS, G. J. B., G. Lento, M. Dalebout, M. Goode, G. Ewing, P. McLaren, A.
Rodrigo, S. Laverty and C. Baker. 2003. DNA surveillance: web-based molecular identification of whales, dolphins and porpoises. Journal of Heredity 94(2):111-114.
ROSSBACH, K. A. and D. L. Herzing. 1997. Underwater observations of benthic
feeding bottlenose dolphins (Tursiops truncatus) near Grand Bahamas Island, Bahamas. Marine Mammal Science 11(2):498-503.

106
ROY, R. R., I. D. Meadows, K. M. Baldwin and V. R. Edgerton. 1982. Functional significance of compensatory overloaded rat fast muscle. Journal of Applied Physiology: Respiratory, Environmental and Exercise Physiology 52:473-478.
SANFORD, C. P. J. and P. C. Wainwright. 2002. Use of sonomicrometry
demonstrates the link between prey capture kinematics and suction pressure in largemouth bass. Journal of Experimental Biology 205:3445-3457.
SANINO, G. and Yaňez. 1996. Estudio del cachalote pigmeo Kogia breviceps
(Blainville, 1838), varado en la costa de Chile. Resúmenes, VII Reunión de Trabajo de Especialistas en Mamiferos Acuáticos de América del Sur and I Congreso de la Sociedad Latinoamericana de Especialistas en Mamiferos Acuáticos. 22-25 October 1996. Viňa del Mar, Chile. Page 93.
SCHULTE, H. 1917. The skull of Kogia breviceps Blainville. Bulletin of the
American Museum of Natural History 37(17):361-404. SCHULTE, H von W. and M. F. Smith. 1918. The external characters, skeletal
muscles, and peripheral nerves of Kogia breviceps (Blainville). Bulletin of the American Museum of Natural History 38:7-72.
SCOTT, M. and J. Cordaro. 1987. Behavioral observations of the dwarf sperm
whale, Kogia simus. Marine Mammal Science 3(4):353-354. SCOTT, M. D., A. A. Hohn, A. J. Westgate, J. R. Nicolas, B. R. Whitaker and W.
B. Campbell. 2001. A note on the release and tracking of a rehabilitated pygmy sperm whale (Kogia breviceps). Journal of Cetacean Research and Management 3(1):87-94.
SCOTT, M. D., R. S. Wells and A. B. Irvine. 1990. A long-term study of
bottlenose dolphins on the west coast of Florida. Pages 235-244 in S. Leatherwood and R. R. Reeves, eds. The Bottlenose Dolphin. Academic Press, San Diego, CA.
SLIJPER, E. 1962. Feeding. Pages 253-293 in E. Slijper, ed. Whales. Basic
Books, Inc, New York, NY. SPECTOR, S. A., P. F. Gardiner, R. F. Zernicke, R. R. Roy and V. R. Edgerton.
1980. Muscle architecture and force-velocity characteristics of cat soleus and medial gastrocnemius: implications for motor control. Journal of Neurophysiology 44:951-960.
107
STEWART, B. S. 2002. Diving behavior. Pages 333-344 in W. F. Perrin, B. Würsig and J.G.M. Thewissen, eds. Encyclopedia of Marine Mammals. Academic Press, San Diego, CA.
SYLVESTRE, J. 1983. Review of Kogia specimens (Physeteridae, Kogiinae)
kept alive in captivity. Investigations on Cetacea 15:201-219. SYLVESTRE, J. 1988. Note on three dwarf sperm whales Kogia simus (Owen,
1866) and comments on kogiids of Japanese coasts. Aquatic Mammals 14:120-122.
THEXTON, A. J., A. W. Crompton and R. Z. German. 1998. Transition from
suckling to drinking at weaning: a kinematic and electromyographic study in miniature pigs. Journal of Experimental Zoology 280:327-343.
THEXTON, A. J., A. W. Crompton, T. Owerkowicz and R. Z. German. 2004.
Correlation between intraoral pressures and tongue movements in the suckling pig. Archives of Oral Biology 49:567-575.
TOMILIN, A. G. 1957. Cetacea. V. G. Heptner, ed. Translation from Russian
original by Israel Program for Scientific Translations, Jerusalem, 1967. 717 p.
VIDAL, O., L. Findley, P. Turk and R. Boyer. 1987. Recent records of pygmy
sperm whales in the Gulf of California, Mexico. Marine Mammal Science 3(4):354-356.
WAINWRIGHT, P. C., L. A. Ferry-Graham, T. B. Waltzek, A. M. Carroll, C. D.
Husley and J. R. Grubich. 2001. Evaluating the use of ram and suction during prey capture by cichlid fishes. Journal of Experimental Biology 204:3039-3051.
WANG, M., W. Walker, K. Shao and L. Chou. 2002. Comparative analysis of the
diets of pygmy sperm whales and dwarf sperm whales in Taiwanese waters. Acta Zoologica Taiwanica 13(2):53-62.
WELLS, R. S., D. J. Boness and G. B. Rathbun. 1999. Behavior. Pages 324-422
in J. E. Reynolds III and S. A. Rommel, eds. Biology of Marine Mammals. Smithsonian Institution Press, Washington, DC.
WELLS, R. S. and M. D. Scott. 1999. Bottlenose dolphin Tursiops truncatus
(Montagu 1821). Pages 137-182 in S. H. Ridgway and R. R. Harrison, eds. Handbook of Marine Mammals Volume 6. Academic Press, San Diego, CA.
108
WELLS, R. S. and M. D. Scott. 2002. Bottlenose dolphins. Pages 122-128 in W. F. Perrin, B. Würsig and J. G. M. Thewissen, eds. Encyclopedia of Marine Mammals. Academic Press, San Diego, CA.
WERTH, A. J. 1992. Anatomy and Evolution of Odontocete Suction Feeding.
Ph.D. dissertation, Harvard University, Cambridge, MA. WERTH, A. J. 2000a. A kinematic study of suction feeding and associated
behavior in the long-finned pilot whale, Globicephala melas (Traill). Marine Mammal Science 16(2):299-314.
WERTH, A. J. 2000b. Feeding in marine mammals. Pages 487-526 in K.
Schwenk, ed. Feeding: Form, Function and Evolution in Tetrapod Vertebrates. Academic Press, San Diego, CA.
WERTH, A. J. 2005. Functional morphology of the sperm whale (Physeter
macrocephalus) tongue, with reference to suction feeding. Aquatic Mammals 30(3):405-418.
WINGE, H. 1921. A review of the interrelationships of Cetacea. Smithsonian
Miscellaneous Collections 72:1-97. WYNNE, K. and M. Schartz. 1999. Pygmy sperm whale, Dwarf sperm whale.
Pages 28-31 in K. Wynne and M. Schwartz, eds. Guide to Marine Mammals and Turtles of the U.S. Atlantic and Gulf of Mexico. Rhode Island Sea Grant, Narragansett, RI.
YAMADA, M. 1954. Some remarks on the pygmy sperm whale, Kogia. Scientific
Reports of the Whales Research Institute 9:37-61.
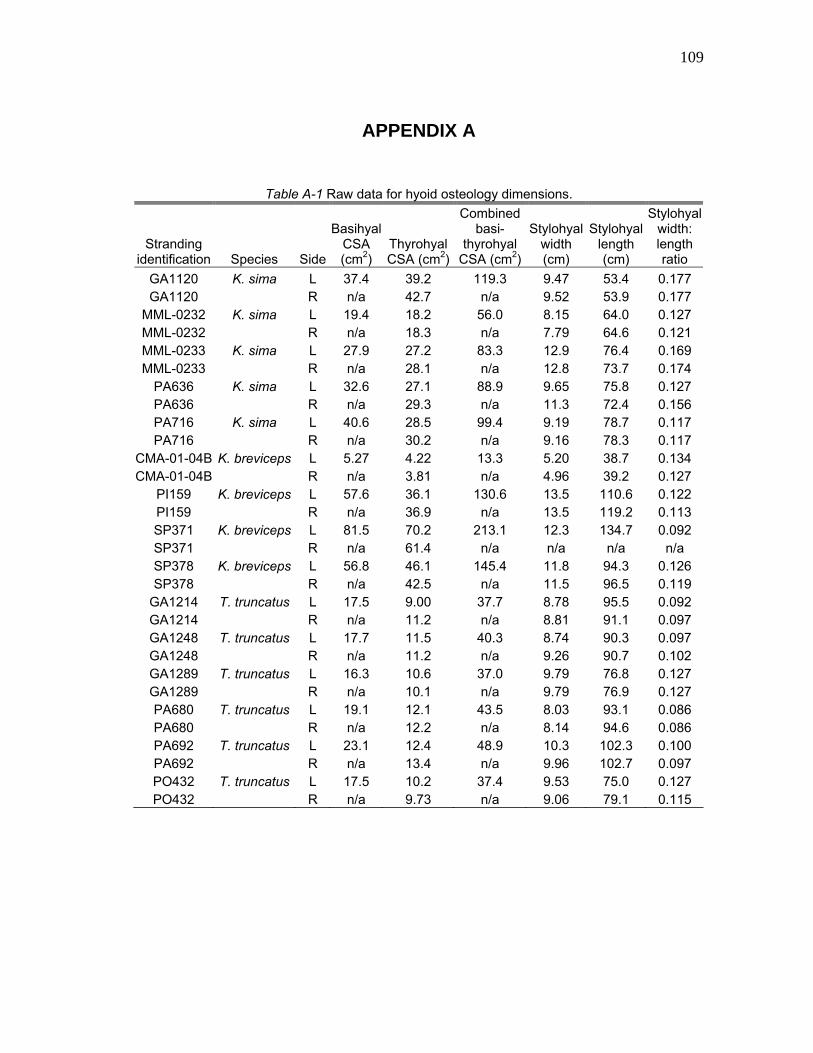
109
APPENDIX A
Table A-1 Raw data for hyoid osteology dimensions.
Stranding identification Species Side
Basihyal CSA (cm2)
Thyrohyal CSA (cm2)
Combined basi-
thyrohyal CSA (cm2)
Stylohyal width (cm)
Stylohyal length (cm)
Stylohyal width: length ratio
GA1120 K. sima L 37.4 39.2 119.3 9.47 53.4 0.177 GA1120 R n/a 42.7 n/a 9.52 53.9 0.177
MML-0232 K. sima L 19.4 18.2 56.0 8.15 64.0 0.127 MML-0232 R n/a 18.3 n/a 7.79 64.6 0.121 MML-0233 K. sima L 27.9 27.2 83.3 12.9 76.4 0.169 MML-0233 R n/a 28.1 n/a 12.8 73.7 0.174
PA636 K. sima L 32.6 27.1 88.9 9.65 75.8 0.127 PA636 R n/a 29.3 n/a 11.3 72.4 0.156 PA716 K. sima L 40.6 28.5 99.4 9.19 78.7 0.117 PA716 R n/a 30.2 n/a 9.16 78.3 0.117
CMA-01-04B K. breviceps L 5.27 4.22 13.3 5.20 38.7 0.134 CMA-01-04B R n/a 3.81 n/a 4.96 39.2 0.127
PI159 K. breviceps L 57.6 36.1 130.6 13.5 110.6 0.122 PI159 R n/a 36.9 n/a 13.5 119.2 0.113 SP371 K. breviceps L 81.5 70.2 213.1 12.3 134.7 0.092 SP371 R n/a 61.4 n/a n/a n/a n/a SP378 K. breviceps L 56.8 46.1 145.4 11.8 94.3 0.126 SP378 R n/a 42.5 n/a 11.5 96.5 0.119
GA1214 T. truncatus L 17.5 9.00 37.7 8.78 95.5 0.092 GA1214 R n/a 11.2 n/a 8.81 91.1 0.097 GA1248 T. truncatus L 17.7 11.5 40.3 8.74 90.3 0.097 GA1248 R n/a 11.2 n/a 9.26 90.7 0.102 GA1289 T. truncatus L 16.3 10.6 37.0 9.79 76.8 0.127 GA1289 R n/a 10.1 n/a 9.79 76.9 0.127 PA680 T. truncatus L 19.1 12.1 43.5 8.03 93.1 0.086 PA680 R n/a 12.2 n/a 8.14 94.6 0.086 PA692 T. truncatus L 23.1 12.4 48.9 10.3 102.3 0.100 PA692 R n/a 13.4 n/a 9.96 102.7 0.097 PO432 T. truncatus L 17.5 10.2 37.4 9.53 75.0 0.127 PO432 R n/a 9.73 n/a 9.06 79.1 0.115
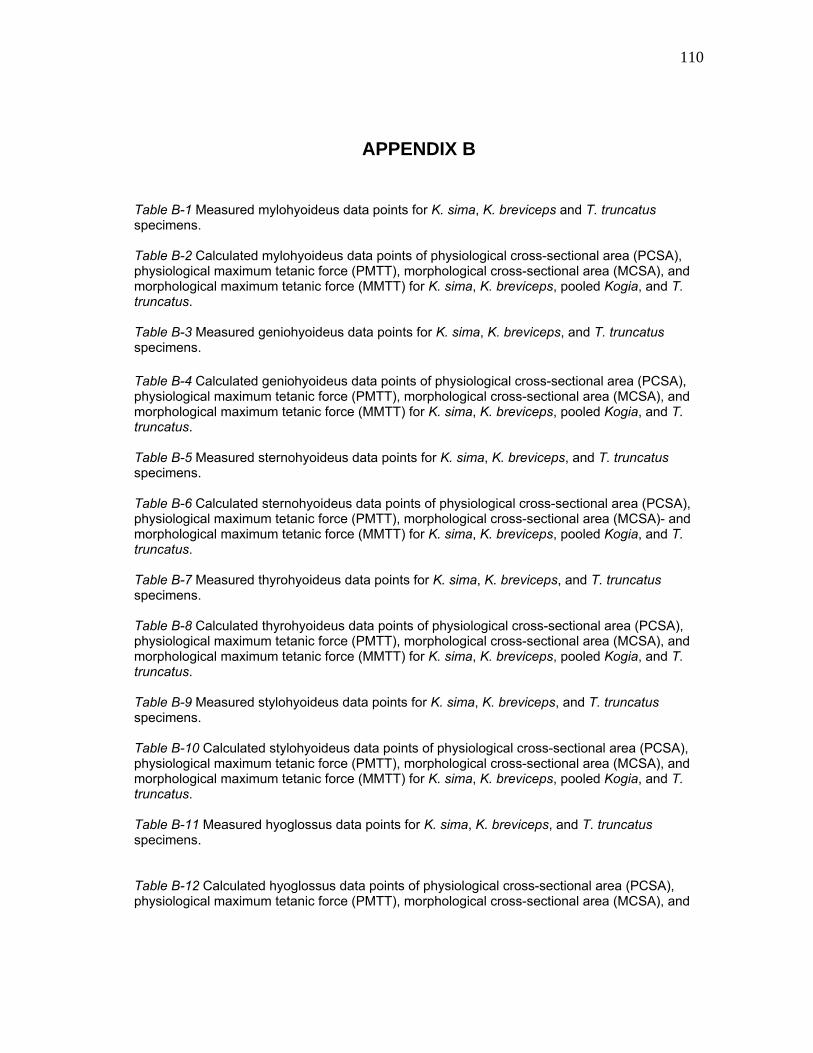
110
APPENDIX B
Table B-1 Measured mylohyoideus data points for K. sima, K. breviceps and T. truncatus specimens. Table B-2 Calculated mylohyoideus data points of physiological cross-sectional area (PCSA), physiological maximum tetanic force (PMTT), morphological cross-sectional area (MCSA), and morphological maximum tetanic force (MMTT) for K. sima, K. breviceps, pooled Kogia, and T. truncatus. Table B-3 Measured geniohyoideus data points for K. sima, K. breviceps, and T. truncatus specimens. Table B-4 Calculated geniohyoideus data points of physiological cross-sectional area (PCSA), physiological maximum tetanic force (PMTT), morphological cross-sectional area (MCSA), and morphological maximum tetanic force (MMTT) for K. sima, K. breviceps, pooled Kogia, and T. truncatus. Table B-5 Measured sternohyoideus data points for K. sima, K. breviceps, and T. truncatus specimens. Table B-6 Calculated sternohyoideus data points of physiological cross-sectional area (PCSA), physiological maximum tetanic force (PMTT), morphological cross-sectional area (MCSA)- and morphological maximum tetanic force (MMTT) for K. sima, K. breviceps, pooled Kogia, and T. truncatus. Table B-7 Measured thyrohyoideus data points for K. sima, K. breviceps, and T. truncatus specimens. Table B-8 Calculated thyrohyoideus data points of physiological cross-sectional area (PCSA), physiological maximum tetanic force (PMTT), morphological cross-sectional area (MCSA), and morphological maximum tetanic force (MMTT) for K. sima, K. breviceps, pooled Kogia, and T. truncatus. Table B-9 Measured stylohyoideus data points for K. sima, K. breviceps, and T. truncatus specimens. Table B-10 Calculated stylohyoideus data points of physiological cross-sectional area (PCSA), physiological maximum tetanic force (PMTT), morphological cross-sectional area (MCSA), and morphological maximum tetanic force (MMTT) for K. sima, K. breviceps, pooled Kogia, and T. truncatus. Table B-11 Measured hyoglossus data points for K. sima, K. breviceps, and T. truncatus specimens. Table B-12 Calculated hyoglossus data points of physiological cross-sectional area (PCSA), physiological maximum tetanic force (PMTT), morphological cross-sectional area (MCSA), and
111
morphological maximum tetanic force (MMTT) for K. sima, K. breviceps, pooled Kogia, and T. truncatus. Table B-13 Measured interhyoideus data points for K. sima, K. breviceps, and T. truncatus specimens. Table B-14 Calculated interhyoideus data points of physiological cross-sectional area (PCSA), physiological maximum tetanic force (PMTT), morphological cross-sectional area (MCSA), and morphological maximum tetanic force (MMTT) for K. sima, K. breviceps, pooled Kogia, and T. truncatus. Table B-15 Measured genioglossus data points for K. sima, K. breviceps, and T. truncatus specimens. Table B-16 Calculated genioglossus data points of physiological cross-sectional area (PCSA), physiological maximum tetanic force (PMTT), morphological cross-sectional area (MCSA), and morphological maximum tetanic force (MMTT) for K. sima, K. breviceps, pooled Kogia, and T. truncatus. Table B-17 Measured styloglossus data points for K. sima, K. breviceps, and T. truncatus specimens. Table B-18 Calculated styloglossus data points of physiological cross-sectional area (PCSA), physiological maximum tetanic force (PMTT), morphological cross-sectional area (MCSA), and morphological maximum tetanic force (MMTT) for K. sima, K. breviceps, pooled Kogia, and T. truncatus. Table B-19 Measured sternothyroideus data points for K. sima, K. breviceps, and T. truncatus specimens. Table B-20 Calculated sternothyroideus data points of physiological cross-sectional area (PCSA), physiological maximum tetanic force (PMTT), morphological cross-sectional area (MCSA) and morphological maximum tetanic force (MMTT) for K. sima, K. breviceps, pooled Kogia, and T. truncatus. Table B-21 Measured cricothyroideus data points for K. sima, K. breviceps, and T. truncatus specimens. Table B-22 Calculated cricothyroideus data points of physiological cross-sectional area (PCSA), physiological maximum tetanic force (PMTT), morphological cross-sectional area (MCSA), and morphological maximum tetanic force (MMTT) for K. sima, K. breviceps, pooled Kogia, and T. truncatus.

112
Table B-1
Stranding identification Species Side
Length (mm)
Parasagittal angle
Transverse angle
Height (mm)
Width (mm)
Mass (g)
GA1120 K. sima L n/a -66.0 -77.3 n/a n/a 71.3GA1120 R n/a -61.0 -86.3 n/a n/a n/a
MML-0232 K. sima L 75.6 -98.0 -107.6 9.08 202.8 54.4MML-0232 R n/a -80.8 -111.5 n/a n/a n/a MML-0233 K. sima L 129.0 -70.8 -68.6 8.48 186.0 83.4MML-0233 R 88.9 n/a n/a 6.24 165.0 49.1
PA636 K. sima L 73.6 -50.0 -64.0 7.39 184.1 55.7PA636 R 71.3 -65.0 -75.0 8.97 204.2 70.1PA716 K. sima L 101.7 -71.3 -90.0 15.7 175.9 73.6PA716 R 94.5 -70.7 -91.3 10.6 163.4 58.4
CMA-01-04B K. breviceps L n/a -69.3 -90.0 n/a n/a n/a CMA-01-04B R n/a -85.7 -88.7 n/a n/a n/a
SP371 K. breviceps L 208.0 -77.3 -95.4 6.65 363.7 185.3SP371 R 188.0 -100.3 -104.1 10.1 305.0 185.3SP378 K. breviceps L 135.2 -108.0 -84.5 5.94 260.0 184.1SP378 R 138.4 -88.7 -92.3 8.45 398.0 163.1
GA1214 T. truncatus L n/a n/a n/a n/a n/a n/a GA1214 R n/a n/a n/a n/a n/a n/a GA1248 T. truncatus L 95.9 -41.7 -46.0 n/a 233.9 n/a GA1248 R 95.8 -34.0 -45.3 n/a 238.7 n/a GA1289 T. truncatus L 65.7 -61.0 -73.7 7.41 207.4 44.3GA1289 R n/a n/a -82.0 n/a n/a n/a PA680 T. truncatus L 70.3 -90.0 -69.0 2.75 272.6 87.5PA680 R 85.4 n/a -74.0 2.65 n/a 111.6PA692 T. truncatus L 95.0 -90.0 -90.0 5.25 93.0 146.4PA692 R n/a n/a n/a n/a n/a n/a PO432 T. truncatus L 79.3 -59.0 -85.3 4.35 230.9 76.3PO432 R 79.8 -58.0 -83.3 9.53 236.2 100.5
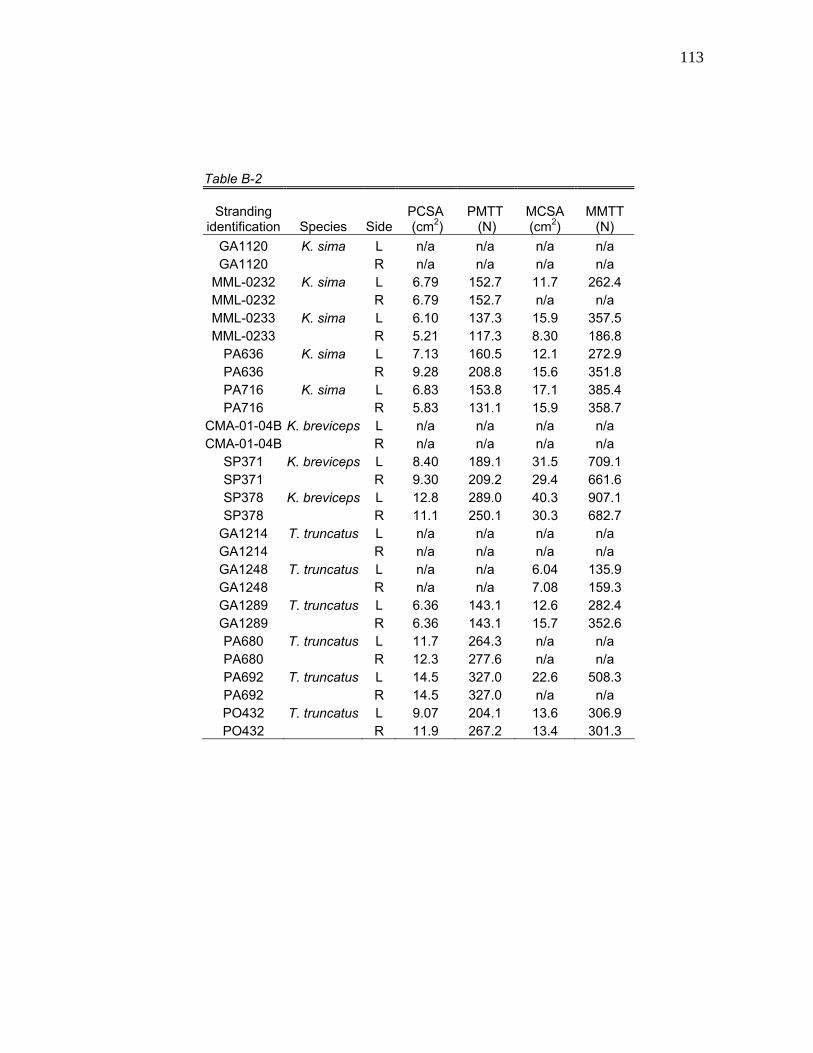
113
Table B-2
Stranding identification Species Side
PCSA (cm2)
PMTT (N)
MCSA (cm2)
MMTT (N)
GA1120 K. sima L n/a n/a n/a n/a GA1120 R n/a n/a n/a n/a
MML-0232 K. sima L 6.79 152.7 11.7 262.4 MML-0232 R 6.79 152.7 n/a n/a MML-0233 K. sima L 6.10 137.3 15.9 357.5 MML-0233 R 5.21 117.3 8.30 186.8
PA636 K. sima L 7.13 160.5 12.1 272.9 PA636 R 9.28 208.8 15.6 351.8 PA716 K. sima L 6.83 153.8 17.1 385.4 PA716 R 5.83 131.1 15.9 358.7
CMA-01-04B K. breviceps L n/a n/a n/a n/a CMA-01-04B R n/a n/a n/a n/a
SP371 K. breviceps L 8.40 189.1 31.5 709.1 SP371 R 9.30 209.2 29.4 661.6 SP378 K. breviceps L 12.8 289.0 40.3 907.1 SP378 R 11.1 250.1 30.3 682.7
GA1214 T. truncatus L n/a n/a n/a n/a GA1214 R n/a n/a n/a n/a GA1248 T. truncatus L n/a n/a 6.04 135.9 GA1248 R n/a n/a 7.08 159.3 GA1289 T. truncatus L 6.36 143.1 12.6 282.4 GA1289 R 6.36 143.1 15.7 352.6 PA680 T. truncatus L 11.7 264.3 n/a n/a PA680 R 12.3 277.6 n/a n/a PA692 T. truncatus L 14.5 327.0 22.6 508.3 PA692 R 14.5 327.0 n/a n/a PO432 T. truncatus L 9.07 204.1 13.6 306.9 PO432 R 11.9 267.2 13.4 301.3
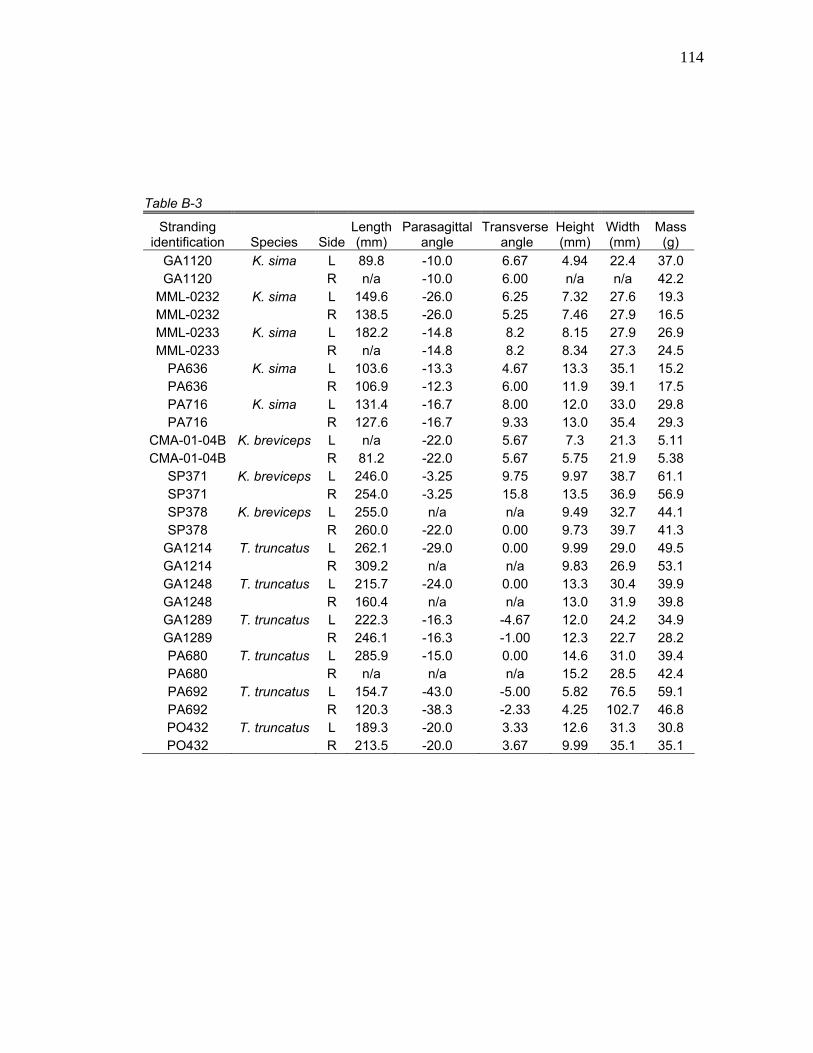
114
Table B-3
Stranding identification Species Side
Length (mm)
Parasagittalangle
Transverse angle
Height (mm)
Width (mm)
Mass (g)
GA1120 K. sima L 89.8 -10.0 6.67 4.94 22.4 37.0 GA1120 R n/a -10.0 6.00 n/a n/a 42.2
MML-0232 K. sima L 149.6 -26.0 6.25 7.32 27.6 19.3 MML-0232 R 138.5 -26.0 5.25 7.46 27.9 16.5 MML-0233 K. sima L 182.2 -14.8 8.2 8.15 27.9 26.9 MML-0233 R n/a -14.8 8.2 8.34 27.3 24.5
PA636 K. sima L 103.6 -13.3 4.67 13.3 35.1 15.2 PA636 R 106.9 -12.3 6.00 11.9 39.1 17.5 PA716 K. sima L 131.4 -16.7 8.00 12.0 33.0 29.8 PA716 R 127.6 -16.7 9.33 13.0 35.4 29.3
CMA-01-04B K. breviceps L n/a -22.0 5.67 7.3 21.3 5.11 CMA-01-04B R 81.2 -22.0 5.67 5.75 21.9 5.38
SP371 K. breviceps L 246.0 -3.25 9.75 9.97 38.7 61.1 SP371 R 254.0 -3.25 15.8 13.5 36.9 56.9 SP378 K. breviceps L 255.0 n/a n/a 9.49 32.7 44.1 SP378 R 260.0 -22.0 0.00 9.73 39.7 41.3
GA1214 T. truncatus L 262.1 -29.0 0.00 9.99 29.0 49.5 GA1214 R 309.2 n/a n/a 9.83 26.9 53.1 GA1248 T. truncatus L 215.7 -24.0 0.00 13.3 30.4 39.9 GA1248 R 160.4 n/a n/a 13.0 31.9 39.8 GA1289 T. truncatus L 222.3 -16.3 -4.67 12.0 24.2 34.9 GA1289 R 246.1 -16.3 -1.00 12.3 22.7 28.2 PA680 T. truncatus L 285.9 -15.0 0.00 14.6 31.0 39.4 PA680 R n/a n/a n/a 15.2 28.5 42.4 PA692 T. truncatus L 154.7 -43.0 -5.00 5.82 76.5 59.1 PA692 R 120.3 -38.3 -2.33 4.25 102.7 46.8 PO432 T. truncatus L 189.3 -20.0 3.33 12.6 31.3 30.8 PO432 R 213.5 -20.0 3.67 9.99 35.1 35.1

115
Table B-4
Stranding identification Species Side
PCSA (cm2)
PMTT (N)
MCSA (cm2)
MMTT (N)
GA1120 K. sima L 3.89 87.5 1.09 24.5 GA1120 R 4.43 99.6 n/a n/a
MML-0232 K. sima L 1.22 27.4 2.27 51.1 MML-0232 R 1.13 25.3 2.31 52.0 MML-0233 K. sima L 1.39 31.3 2.69 60.5 MML-0233 R 1.27 28.6 2.99 67.3
PA636 K. sima L 1.38 31.1 3.71 83.5 PA636 R 1.55 34.8 4.28 96.3 PA716 K. sima L 2.14 48.2 3.21 72.2 PA716 R 2.17 48.8 3.48 78.3
CMA-01-04B K. breviceps L 0.59 13.4 1.21 27.2 CMA-01-04B R 0.62 14.1 1.15 25.9
SP371 K. breviceps L 2.34 52.7 7.10 159.8 SP371 R 2.11 47.6 4.18 94.1 SP378 K. breviceps L 1.63 36.7 6.44 145.0 SP378 R 1.50 33.7 4.04 90.8
GA1214 T. truncatus L 1.78 40.0 n/a n/a GA1214 R 1.62 36.5 n/a n/a GA1248 T. truncatus L 1.74 39.2 3.38 76.1 GA1248 R 2.34 52.6 3.93 88.4 GA1289 T. truncatus L 1.48 33.3 3.64 81.9 GA1289 R 1.08 24.3 4.00 90.0 PA680 T. truncatus L 1.30 29.3 3.23 72.7 PA680 R 1.40 31.5 3.23 72.7 PA692 T. truncatus L 3.60 81.1 4.51 101.4 PA692 R 3.67 82.6 4.49 101.0 PO432 T. truncatus L 1.53 34.5 3.25 73.1 PO432 R 1.55 34.9 2.26 50.9
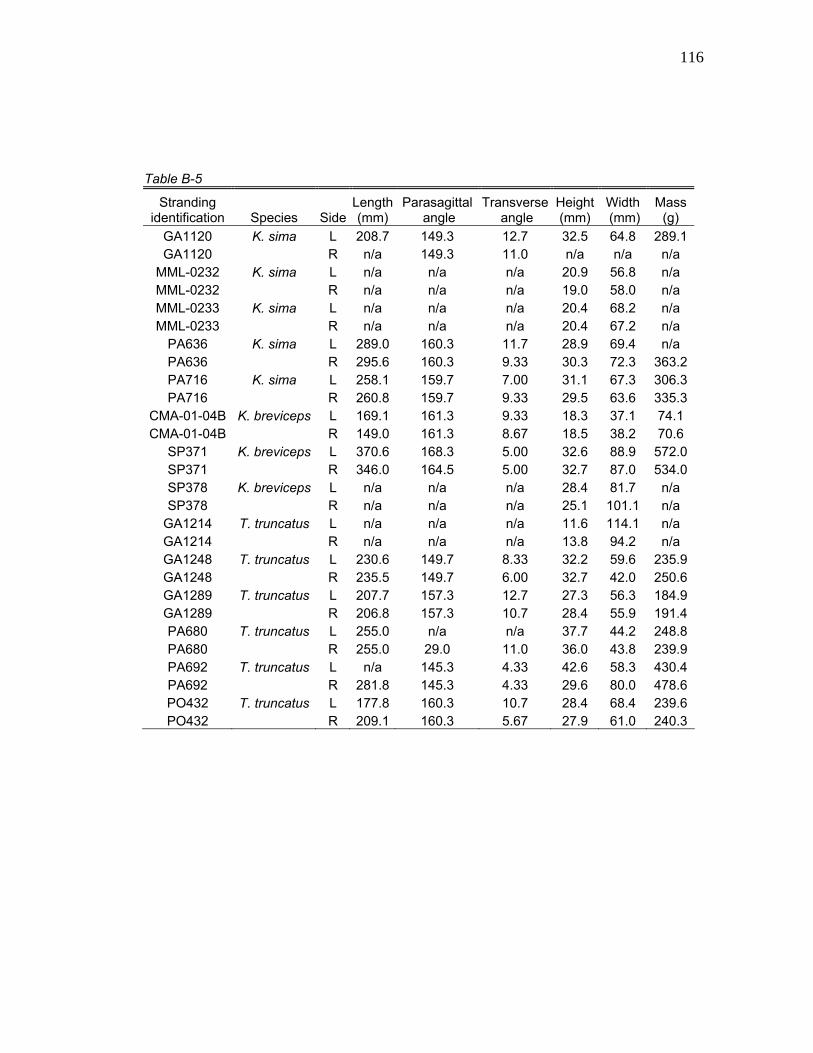
116
Table B-5
Stranding identification Species Side
Length (mm)
Parasagittal angle
Transverse angle
Height (mm)
Width (mm)
Mass (g)
GA1120 K. sima L 208.7 149.3 12.7 32.5 64.8 289.1 GA1120 R n/a 149.3 11.0 n/a n/a n/a
MML-0232 K. sima L n/a n/a n/a 20.9 56.8 n/a MML-0232 R n/a n/a n/a 19.0 58.0 n/a MML-0233 K. sima L n/a n/a n/a 20.4 68.2 n/a MML-0233 R n/a n/a n/a 20.4 67.2 n/a
PA636 K. sima L 289.0 160.3 11.7 28.9 69.4 n/a PA636 R 295.6 160.3 9.33 30.3 72.3 363.2 PA716 K. sima L 258.1 159.7 7.00 31.1 67.3 306.3 PA716 R 260.8 159.7 9.33 29.5 63.6 335.3
CMA-01-04B K. breviceps L 169.1 161.3 9.33 18.3 37.1 74.1 CMA-01-04B R 149.0 161.3 8.67 18.5 38.2 70.6
SP371 K. breviceps L 370.6 168.3 5.00 32.6 88.9 572.0 SP371 R 346.0 164.5 5.00 32.7 87.0 534.0 SP378 K. breviceps L n/a n/a n/a 28.4 81.7 n/a SP378 R n/a n/a n/a 25.1 101.1 n/a
GA1214 T. truncatus L n/a n/a n/a 11.6 114.1 n/a GA1214 R n/a n/a n/a 13.8 94.2 n/a GA1248 T. truncatus L 230.6 149.7 8.33 32.2 59.6 235.9 GA1248 R 235.5 149.7 6.00 32.7 42.0 250.6 GA1289 T. truncatus L 207.7 157.3 12.7 27.3 56.3 184.9 GA1289 R 206.8 157.3 10.7 28.4 55.9 191.4 PA680 T. truncatus L 255.0 n/a n/a 37.7 44.2 248.8 PA680 R 255.0 29.0 11.0 36.0 43.8 239.9 PA692 T. truncatus L n/a 145.3 4.33 42.6 58.3 430.4 PA692 R 281.8 145.3 4.33 29.6 80.0 478.6 PO432 T. truncatus L 177.8 160.3 10.7 28.4 68.4 239.6 PO432 R 209.1 160.3 5.67 27.9 61.0 240.3

117
Table B-6
Stranding identification Species Side
PCSA (cm2)
PMTT (N)
MCSA (cm2)
MMTT (N)
GA1120 K. sima L 13.1 294.1 17.6 395.3 GA1120 R 13.1 294.1 n/a n/a
MML-0232 K. sima L n/a n/a 15.1 340.4 MML-0232 R n/a n/a 14.3 322.0 MML-0233 K. sima L n/a n/a 15.9 357.5 MML-0233 R n/a n/a 18.2 408.4
PA636 K. sima L n/a n/a 19.7 443.7 PA636 R 11.6 260.8 18.8 422.4 PA716 K. sima L 11.2 251.9 17.9 401.6 PA716 R 12.1 272.9 15.1 338.9
CMA-01-04B K. breviceps L 4.13 93.0 6.30 141.8 CMA-01-04B R 4.47 100.6 6.68 150.3
SP371 K. breviceps L 14.6 327.6 28.2 634.1 SP371 R 14.6 327.6 34.0 765.5 SP378 K. breviceps L n/a n/a 32.4 728.8 SP378 R n/a n/a 39.3 885.3
GA1214 T. truncatus L n/a n/a n/a n/a GA1214 R n/a n/a n/a n/a GA1248 T. truncatus L 9.65 217.2 12.2 273.4 GA1248 R 10.0 225.8 13.9 311.9 GA1289 T. truncatus L 8.40 189.0 17.9 402.8 GA1289 R 8.73 196.5 17.7 397.6 PA680 T. truncatus L 9.20 207.1 18.5 415.4 PA680 R 8.88 199.7 16.8 378.2 PA692 T. truncatus L 14.4 324.2 26.8 602.5 PA692 R 16.0 360.5 25.0 562.7 PO432 T. truncatus L 12.7 286.1 15.3 344.7 PO432 R 10.8 244.0 16.1 361.4

118
Table B-7
Stranding identification Species Side
Length (mm)
Parasagittal angle
Transverse angle
Height (mm)
Width (mm)
Mass (g)
GA1120 K. sima L n/a -170.7 -9.67 n/a n/a 8.07 GA1120 R 86.5 -170.7 -8.67 6.22 34.2 9.59
MML-0232 K. sima L 69.0 -175.3 -9.00 4.92 23.8 4.27 MML-0232 R 58.2 -173.8 -15.0 5.33 22.1 3.07 MML-0233 K. sima L 121.3 -174.0 -18.3 4.31 21.8 7.48 MML-0233 R 112.2 -174.3 -11.5 4.53 23.0 7.21
PA636 K. sima L 78.9 -172.7 -12.3 9.68 30.6 9.42 PA636 R 89.7 -173.0 -13.3 6.52 32.1 10.1 PA716 K. sima L 84.4 -158.0 -26.0 5.58 24.6 7.24 PA716 R 86.4 -155.0 -15.0 5.87 28.7 9.30
CMA-01-04B K. breviceps L 66.4 -168.0 -5.00 6.34 15.7 2.80 CMA-01-04B R 68.4 -165.0 -5.67 6.00 19.2 4.34
SP371 K. breviceps L 161.0 -148.8 -10.3 5.37 28.5 21.1 SP371 R 168.9 -161.8 -5.00 6.03 34.8 23.0 SP378 K. breviceps L 111.4 -158.5 -3.33 7.40 29.4 18.4 SP378 R 106.1 -158.5 -4.67 9.20 28.0 19.5
GA1214 T. truncatus L 61.3 -170.0 -6.00 4.63 39.1 8.79 GA1214 R 69.6 -170.0 -11.0 4.41 40.8 10.2 GA1248 T. truncatus L 56.6 n/a n/a 6.51 35.9 6.61 GA1248 R 53.8 -114.0 -54.0 8.32 42.0 9.48 GA1289 T. truncatus L 48.3 -161.0 -3.67 7.13 34.2 6.56 GA1289 R 47.0 -152.0 -6.33 6.64 29.1 5.72 PA680 T. truncatus L 68.6 -158.0 -22.0 3.48 36.7 7.05 PA680 R 68.8 -158.0 -29.0 4.65 36.0 8.84 PA692 T. truncatus L 74.9 -157.3 -10.0 3.94 38.7 9.47 PA692 R 84.7 n/a n/a 4.73 32.9 8.07 PO432 T. truncatus L 63.9 -162.3 -11.3 4.74 37.5 8.39 PO432 R 56.2 -157.0 -12.7 6.06 37.6 9.06
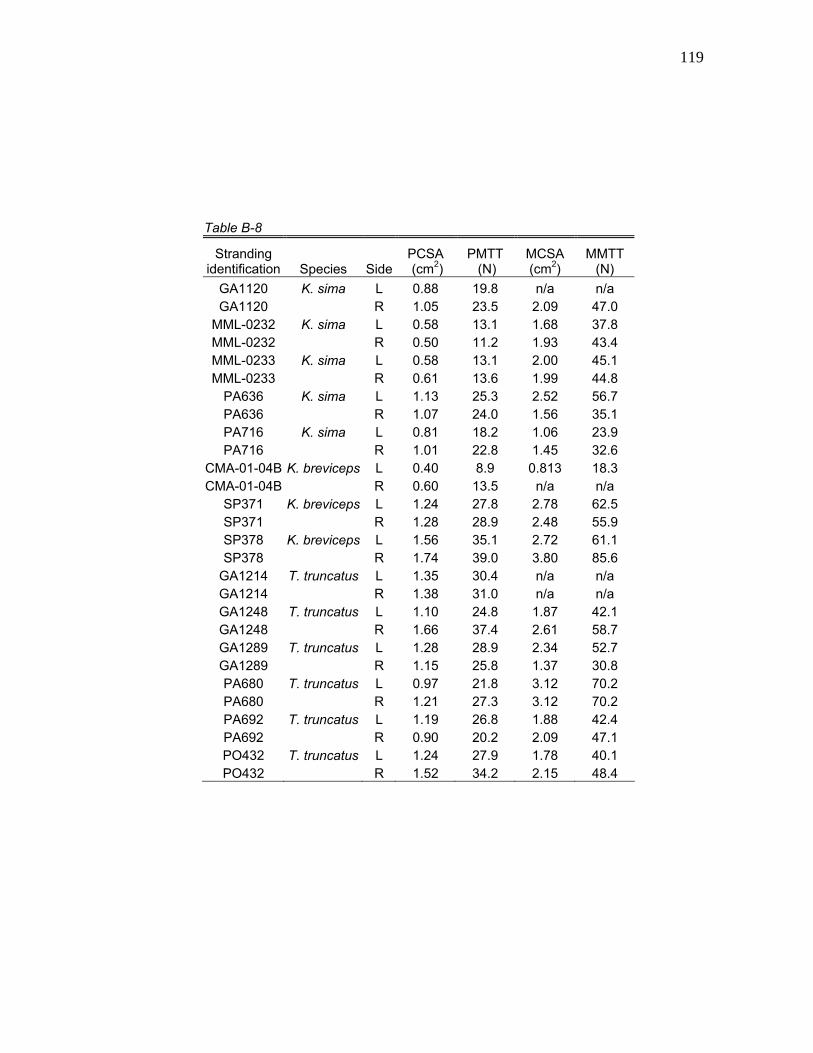
119
Table B-8
Stranding identification Species Side
PCSA (cm2)
PMTT (N)
MCSA (cm2)
MMTT (N)
GA1120 K. sima L 0.88 19.8 n/a n/a GA1120 R 1.05 23.5 2.09 47.0
MML-0232 K. sima L 0.58 13.1 1.68 37.8 MML-0232 R 0.50 11.2 1.93 43.4 MML-0233 K. sima L 0.58 13.1 2.00 45.1 MML-0233 R 0.61 13.6 1.99 44.8
PA636 K. sima L 1.13 25.3 2.52 56.7 PA636 R 1.07 24.0 1.56 35.1 PA716 K. sima L 0.81 18.2 1.06 23.9 PA716 R 1.01 22.8 1.45 32.6
CMA-01-04B K. breviceps L 0.40 8.9 0.813 18.3 CMA-01-04B R 0.60 13.5 n/a n/a
SP371 K. breviceps L 1.24 27.8 2.78 62.5 SP371 R 1.28 28.9 2.48 55.9 SP378 K. breviceps L 1.56 35.1 2.72 61.1 SP378 R 1.74 39.0 3.80 85.6
GA1214 T. truncatus L 1.35 30.4 n/a n/a GA1214 R 1.38 31.0 n/a n/a GA1248 T. truncatus L 1.10 24.8 1.87 42.1 GA1248 R 1.66 37.4 2.61 58.7 GA1289 T. truncatus L 1.28 28.9 2.34 52.7 GA1289 R 1.15 25.8 1.37 30.8 PA680 T. truncatus L 0.97 21.8 3.12 70.2 PA680 R 1.21 27.3 3.12 70.2 PA692 T. truncatus L 1.19 26.8 1.88 42.4 PA692 R 0.90 20.2 2.09 47.1 PO432 T. truncatus L 1.24 27.9 1.78 40.1 PO432 R 1.52 34.2 2.15 48.4

120
Table B-9
Stranding identification Species Side
Length (mm)
Parasagittal angle
Transverse angle
Height (mm)
Width (mm)
Mass (g)
GA1214 T. truncatus L n/a n/a n/a n/a n/a n/a GA1214 R 44.9 -83.0 -37.0 14.7 2.68 1.72 GA1248 T. truncatus L 32.2 -61.3 -47.0 13.8 3.65 1.43 GA1248 R 41.8 -47.3 -37.7 13.4 4.76 1.68 GA1289 T. truncatus L 34.9 -111.3 -110.7 13.5 6.61 1.83 GA1289 R 31.8 -79.7 -82.0 12.2 5.90 1.38 PA680 T. truncatus L 50.6 -68.0 -56.0 7.10 2.80 0.840 PA680 R 59.5 -90.0 -86.0 4.46 3.61 1.28 PA692 T. truncatus L 15.7 -73.7 -54.0 15.7 4.92 2.82 PA692 R 14.5 -74.7 -43.3 14.5 3.64 2.13 PO432 T. truncatus L 35.2 -63.3 -38.3 9.63 4.90 1.15 PO432 R 40.2 -56.3 -34.0 9.64 3.50 0.840
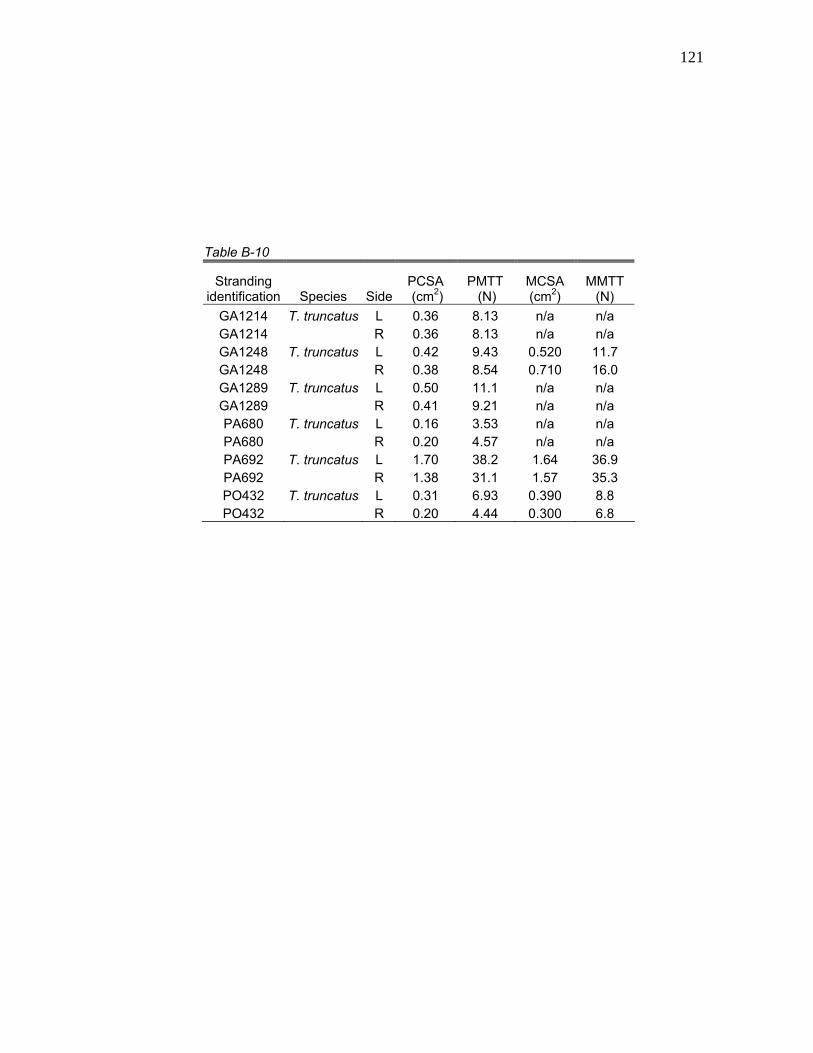
121
Table B-10
Stranding identification Species Side
PCSA (cm2)
PMTT (N)
MCSA (cm2)
MMTT (N)
GA1214 T. truncatus L 0.36 8.13 n/a n/a GA1214 R 0.36 8.13 n/a n/a GA1248 T. truncatus L 0.42 9.43 0.520 11.7 GA1248 R 0.38 8.54 0.710 16.0 GA1289 T. truncatus L 0.50 11.1 n/a n/a GA1289 R 0.41 9.21 n/a n/a PA680 T. truncatus L 0.16 3.53 n/a n/a PA680 R 0.20 4.57 n/a n/a PA692 T. truncatus L 1.70 38.2 1.64 36.9 PA692 R 1.38 31.1 1.57 35.3 PO432 T. truncatus L 0.31 6.93 0.390 8.8 PO432 R 0.20 4.44 0.300 6.8
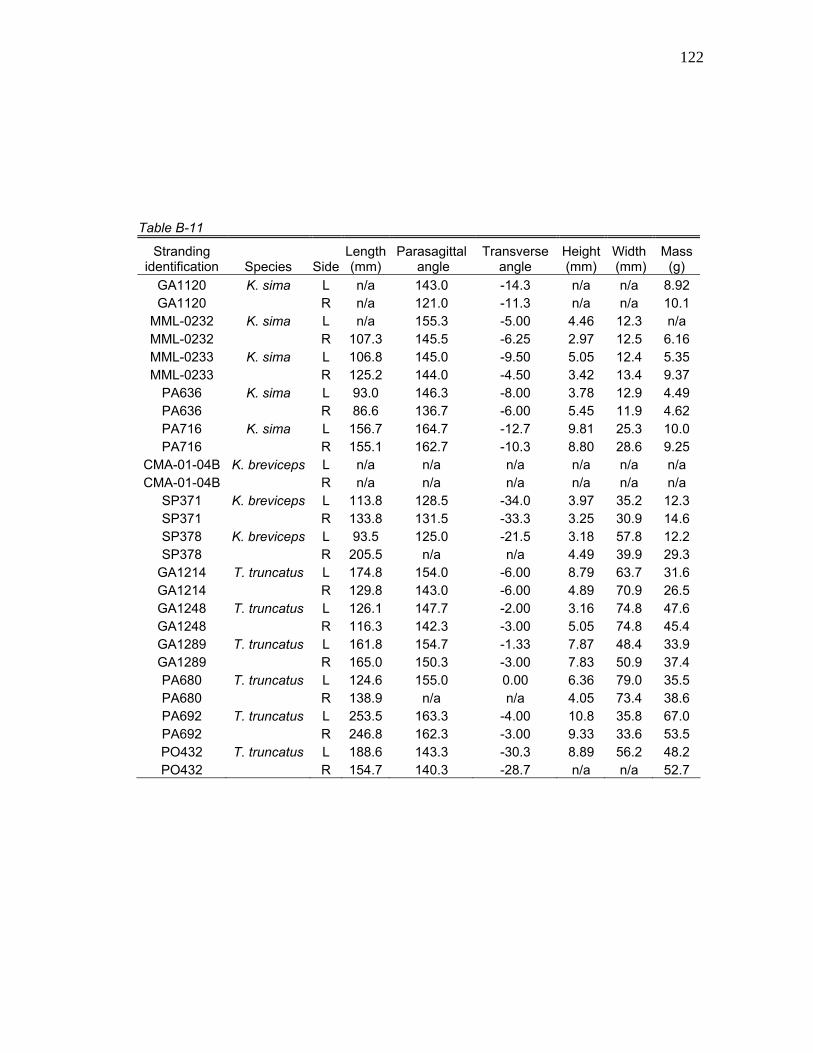
122
Table B-11
Stranding identification Species Side
Length (mm)
Parasagittal angle
Transverse angle
Height (mm)
Width (mm)
Mass (g)
GA1120 K. sima L n/a 143.0 -14.3 n/a n/a 8.92 GA1120 R n/a 121.0 -11.3 n/a n/a 10.1
MML-0232 K. sima L n/a 155.3 -5.00 4.46 12.3 n/a MML-0232 R 107.3 145.5 -6.25 2.97 12.5 6.16 MML-0233 K. sima L 106.8 145.0 -9.50 5.05 12.4 5.35 MML-0233 R 125.2 144.0 -4.50 3.42 13.4 9.37
PA636 K. sima L 93.0 146.3 -8.00 3.78 12.9 4.49 PA636 R 86.6 136.7 -6.00 5.45 11.9 4.62 PA716 K. sima L 156.7 164.7 -12.7 9.81 25.3 10.0 PA716 R 155.1 162.7 -10.3 8.80 28.6 9.25
CMA-01-04B K. breviceps L n/a n/a n/a n/a n/a n/a CMA-01-04B R n/a n/a n/a n/a n/a n/a
SP371 K. breviceps L 113.8 128.5 -34.0 3.97 35.2 12.3 SP371 R 133.8 131.5 -33.3 3.25 30.9 14.6 SP378 K. breviceps L 93.5 125.0 -21.5 3.18 57.8 12.2 SP378 R 205.5 n/a n/a 4.49 39.9 29.3
GA1214 T. truncatus L 174.8 154.0 -6.00 8.79 63.7 31.6 GA1214 R 129.8 143.0 -6.00 4.89 70.9 26.5 GA1248 T. truncatus L 126.1 147.7 -2.00 3.16 74.8 47.6 GA1248 R 116.3 142.3 -3.00 5.05 74.8 45.4 GA1289 T. truncatus L 161.8 154.7 -1.33 7.87 48.4 33.9 GA1289 R 165.0 150.3 -3.00 7.83 50.9 37.4 PA680 T. truncatus L 124.6 155.0 0.00 6.36 79.0 35.5 PA680 R 138.9 n/a n/a 4.05 73.4 38.6 PA692 T. truncatus L 253.5 163.3 -4.00 10.8 35.8 67.0 PA692 R 246.8 162.3 -3.00 9.33 33.6 53.5 PO432 T. truncatus L 188.6 143.3 -30.3 8.89 56.2 48.2 PO432 R 154.7 140.3 -28.7 n/a n/a 52.7

123
Table B-12
Stranding identification Species Side
PCSA (cm2)
PMTT (N)
MCSA (cm2)
MMTT (N)
GA1120 K. sima L n/a n/a n/a n/a GA1120 R n/a n/a n/a n/a
MML-0232 K. sima L 0.54 12.2 1.15 25.8 MML-0232 R 0.54 12.2 0.920 20.7 MML-0233 K. sima L 0.47 10.6 1.06 23.8 MML-0233 R 0.71 15.9 n/a n/a
PA636 K. sima L 0.46 10.3 0.710 16.0 PA636 R 0.50 11.3 n/a n/a PA716 K. sima L 0.60 13.6 0.700 15.8 PA716 R 0.56 12.7 0.810 18.2
CMA-01-04B K. breviceps L n/a n/a n/a n/a CMA-01-04B R n/a n/a n/a n/a
SP371 K. breviceps L 1.02 22.9 2.16 48.6 SP371 R 1.03 23.2 2.51 56.5 SP378 K. breviceps L 1.23 27.6 2.42 54.4 SP378 R 1.34 30.2 3.54 79.7
GA1214 T. truncatus L 1.70 38.3 n/a n/a GA1214 R 1.93 43.3 n/a n/a GA1248 T. truncatus L 3.56 80.1 3.79 85.3 GA1248 R 3.68 82.8 3.68 82.8 GA1289 T. truncatus L 1.98 44.5 0.560 12.6 GA1289 R 2.14 48.1 n/a n/a PA680 T. truncatus L 2.69 60.4 n/a n/a PA680 R 2.62 59.0 n/a n/a PA692 T. truncatus L 2.49 56.1 3.36 75.5 PA692 R 2.05 46.0 3.85 86.6 PO432 T. truncatus L 2.41 54.3 n/a n/a PO432 R 3.21 72.3 5.36 120.6
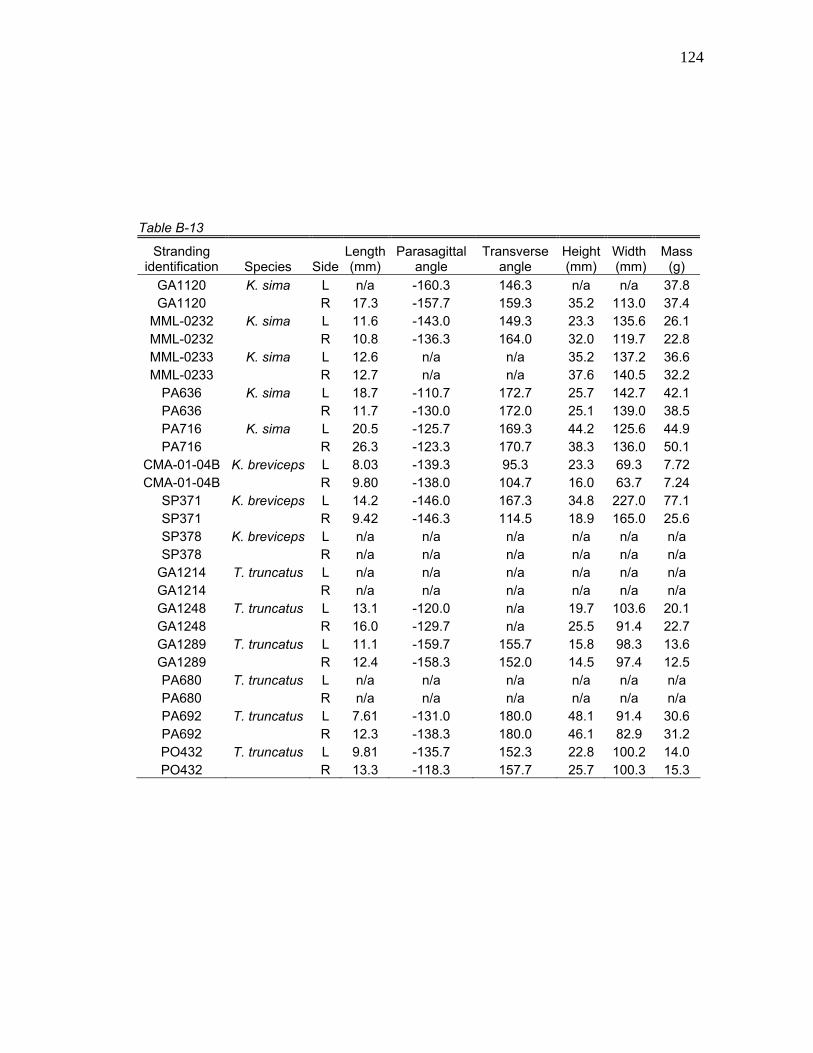
124
Table B-13
Stranding identification Species Side
Length (mm)
Parasagittal angle
Transverse angle
Height (mm)
Width (mm)
Mass (g)
GA1120 K. sima L n/a -160.3 146.3 n/a n/a 37.8 GA1120 R 17.3 -157.7 159.3 35.2 113.0 37.4
MML-0232 K. sima L 11.6 -143.0 149.3 23.3 135.6 26.1 MML-0232 R 10.8 -136.3 164.0 32.0 119.7 22.8 MML-0233 K. sima L 12.6 n/a n/a 35.2 137.2 36.6 MML-0233 R 12.7 n/a n/a 37.6 140.5 32.2
PA636 K. sima L 18.7 -110.7 172.7 25.7 142.7 42.1 PA636 R 11.7 -130.0 172.0 25.1 139.0 38.5 PA716 K. sima L 20.5 -125.7 169.3 44.2 125.6 44.9 PA716 R 26.3 -123.3 170.7 38.3 136.0 50.1
CMA-01-04B K. breviceps L 8.03 -139.3 95.3 23.3 69.3 7.72 CMA-01-04B R 9.80 -138.0 104.7 16.0 63.7 7.24
SP371 K. breviceps L 14.2 -146.0 167.3 34.8 227.0 77.1 SP371 R 9.42 -146.3 114.5 18.9 165.0 25.6 SP378 K. breviceps L n/a n/a n/a n/a n/a n/a SP378 R n/a n/a n/a n/a n/a n/a
GA1214 T. truncatus L n/a n/a n/a n/a n/a n/a GA1214 R n/a n/a n/a n/a n/a n/a GA1248 T. truncatus L 13.1 -120.0 n/a 19.7 103.6 20.1 GA1248 R 16.0 -129.7 n/a 25.5 91.4 22.7 GA1289 T. truncatus L 11.1 -159.7 155.7 15.8 98.3 13.6 GA1289 R 12.4 -158.3 152.0 14.5 97.4 12.5 PA680 T. truncatus L n/a n/a n/a n/a n/a n/a PA680 R n/a n/a n/a n/a n/a n/a PA692 T. truncatus L 7.61 -131.0 180.0 48.1 91.4 30.6 PA692 R 12.3 -138.3 180.0 46.1 82.9 31.2 PO432 T. truncatus L 9.81 -135.7 152.3 22.8 100.2 14.0 PO432 R 13.3 -118.3 157.7 25.7 100.3 15.3
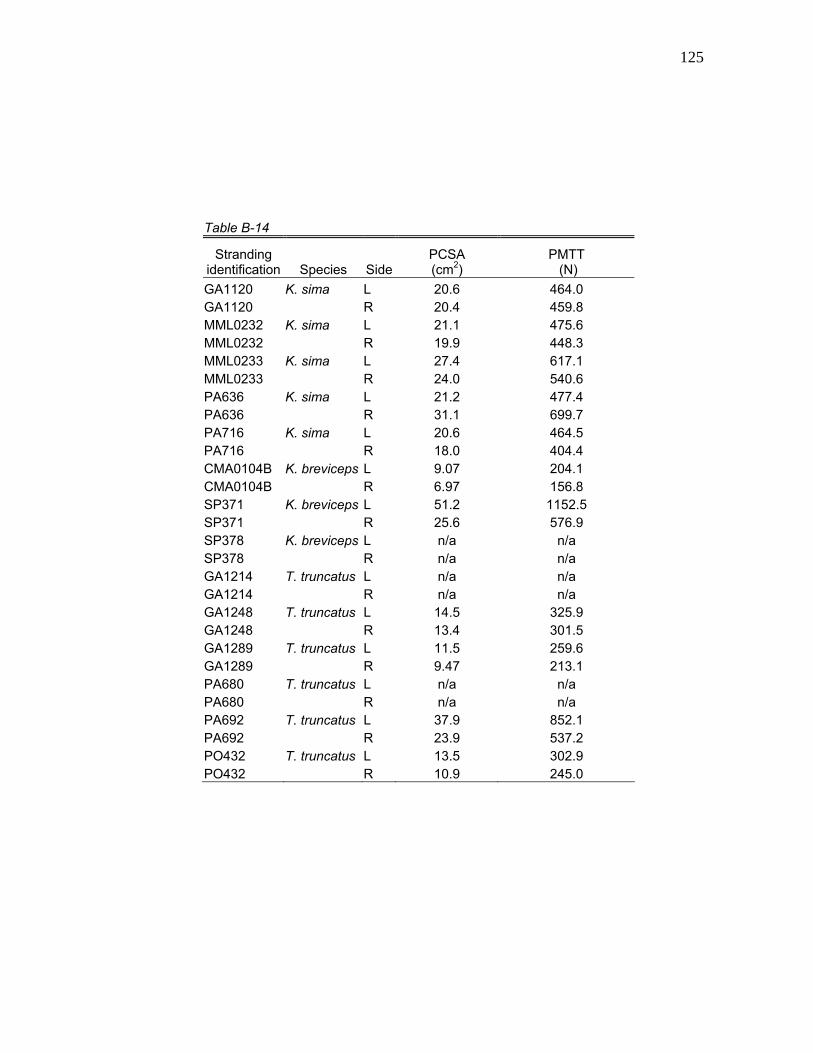
125
Table B-14
Stranding identification Species Side
PCSA (cm2)
PMTT (N)
GA1120 K. sima L 20.6 464.0 GA1120 R 20.4 459.8 MML0232 K. sima L 21.1 475.6 MML0232 R 19.9 448.3 MML0233 K. sima L 27.4 617.1 MML0233 R 24.0 540.6 PA636 K. sima L 21.2 477.4 PA636 R 31.1 699.7 PA716 K. sima L 20.6 464.5 PA716 R 18.0 404.4 CMA0104B K. breviceps L 9.07 204.1 CMA0104B R 6.97 156.8 SP371 K. breviceps L 51.2 1152.5 SP371 R 25.6 576.9 SP378 K. breviceps L n/a n/a SP378 R n/a n/a GA1214 T. truncatus L n/a n/a GA1214 R n/a n/a GA1248 T. truncatus L 14.5 325.9 GA1248 R 13.4 301.5 GA1289 T. truncatus L 11.5 259.6 GA1289 R 9.47 213.1 PA680 T. truncatus L n/a n/a PA680 R n/a n/a PA692 T. truncatus L 37.9 852.1 PA692 R 23.9 537.2 PO432 T. truncatus L 13.5 302.9 PO432 R 10.9 245.0

126
Table B-15
Stranding identification Species Side
Length (mm)
Parasagittal angle
Transverse angle
Height (mm)
Width (mm)
Mass (g)
GA1120 K. sima L n/a -8.67 3.00 n/a n/a 27.3 GA1120 R 140.4 -6.67 3.67 11.9 25.8 32.7
MML-0232 K. sima L 130.0 -13.8 -3.00 7.29 20.5 14.4 MML-0232 R 139.7 -19.8 -3.75 6.50 24.6 12.4 MML-0233 K. sima L 162.0 -7.75 -10.8 7.76 12.1 20.6 MML-0233 R 152.2 -7.75 -4.00 6.60 22.2 21.1
PA636 K. sima L 134.0 -11.3 0.00 8.27 22.1 19.0 PA636 R 131.0 -11.7 n/a 9.87 25.7 19.6 PA716 K. sima L 138.6 -5.33 4.33 16.9 32.6 25.7 PA716 R 126.2 -5.33 9.00 15.6 37.5 27.3
CMA-01-04B K. breviceps L 90.5 -11.0 3.33 10.4 16.8 11.7 CMA-01-04B R 88.3 -11.0 5.33 9.44 19.2 11.4
SP371 K. breviceps L 245.0 -4.75 -4.75 8.75 19.8 42.4 SP371 R 276.0 -9.25 -10 8.00 23.7 59.1 SP378 K. breviceps L 201.0 -5.00 0.00 9.51 29.8 53.3 SP378 R 208.8 -4.33 0.00 9.12 32.7 51.7
GA1214 T. truncatus L n/a -13.0 -14 n/a n/a n/a GA1214 R 265.1 -23.0 -9.00 3.65 29.7 30.3 GA1248 T. truncatus L 140.1 n/a -6.33 10.6 31.3 30.8 GA1248 R 188.0 n/a -6.33 9.34 37.1 49.2 GA1289 T. truncatus L 254.7 -9.33 -4.00 7.44 15.7 21.7 GA1289 R 198.4 -11.7 -6.00 9.61 27.5 34.3 PA680 T. truncatus L 198.4 -22.0 0.00 11.2 23.8 45.9 PA680 R 277.6 -22.0 n/a 8.66 17.4 52.0 PA692 T. truncatus L 188.3 -6.67 0.00 4.63 23.5 29.5 PA692 R 185.9 -6.67 0.00 4.42 23.8 28.0 PO432 T. truncatus L 207.7 -9.00 1.00 7.70 35.5 32.4 PO432 R 177.6 -9.00 n/a 7.15 29.8 23.7

127
Table B-16
Stranding identification Species Side
PCSA (cm2)
PMTT (N)
MCSA (cm2)
MMTT (N)
GA1120 K. sima L 1.34 30.1 n/a n/a GA1120 R 1.41 31.7 2.68 60.3
MML-0232 K. sima L 1.75 39.3 3.83 86.1 MML-0232 R 2.04 45.8 2.47 55.6 MML-0233 K. sima L 1.22 27.4 2.32 52.2 MML-0233 R 1.22 27.5 2.45 55.1
PA636 K. sima L 1.63 36.7 1.81 40.8 PA636 R 2.02 45.5 2.25 50.6 PA716 K. sima L 2.50 56.3 2.48 55.8 PA716 R 2.34 52.6 3.20 72.0
CMA-01-04B K. breviceps L 1.84 41.3 1.57 35.3 CMA-01-04B R 2.20 49.5 1.60 36.0
SP371 K. breviceps L 1.05 23.6 3.42 76.9 SP371 R 0.84 18.9 1.59 35.8 SP378 K. breviceps L 1.20 26.9 3.57 80.3 SP378 R 1.31 29.5 3.71 83.4
GA1214 T. truncatus L n/a n/a n/a n/a GA1214 R 1.08 24.2 n/a n/a GA1248 T. truncatus L 2.07 46.7 3.07 69.1 GA1248 R 2.47 55.6 2.97 66.8 GA1289 T. truncatus L 0.80 18.1 1.56 35.1 GA1289 R 1.63 36.7 1.98 44.6 PA680 T. truncatus L 2.19 49.2 n/a n/a PA680 R 1.77 39.7 n/a n/a PA692 T. truncatus L 1.48 33.3 2.06 46.2 PA692 R 1.42 32.0 1.93 43.4 PO432 T. truncatus L 1.47 33.1 2.04 45.9 PO432 R 1.26 28.3 1.84 41.4
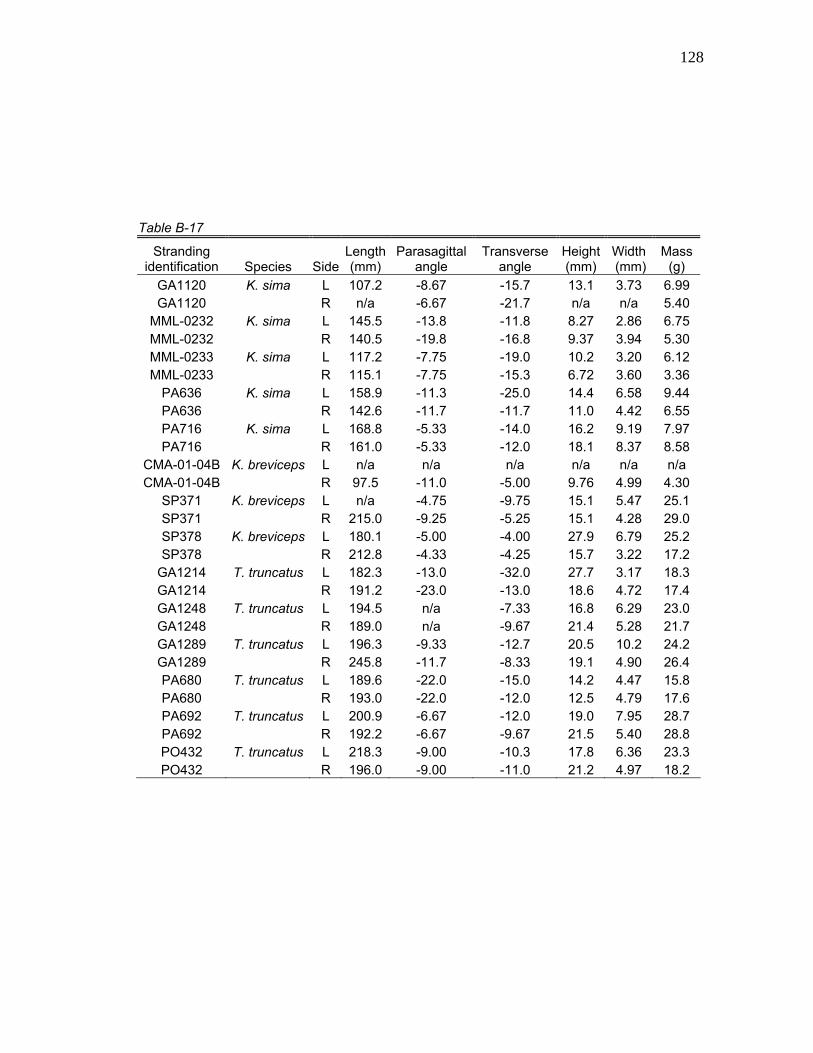
128
Table B-17
Stranding identification Species Side
Length (mm)
Parasagittal angle
Transverse angle
Height (mm)
Width (mm)
Mass (g)
GA1120 K. sima L 107.2 -8.67 -15.7 13.1 3.73 6.99 GA1120 R n/a -6.67 -21.7 n/a n/a 5.40
MML-0232 K. sima L 145.5 -13.8 -11.8 8.27 2.86 6.75 MML-0232 R 140.5 -19.8 -16.8 9.37 3.94 5.30 MML-0233 K. sima L 117.2 -7.75 -19.0 10.2 3.20 6.12 MML-0233 R 115.1 -7.75 -15.3 6.72 3.60 3.36
PA636 K. sima L 158.9 -11.3 -25.0 14.4 6.58 9.44 PA636 R 142.6 -11.7 -11.7 11.0 4.42 6.55 PA716 K. sima L 168.8 -5.33 -14.0 16.2 9.19 7.97 PA716 R 161.0 -5.33 -12.0 18.1 8.37 8.58
CMA-01-04B K. breviceps L n/a n/a n/a n/a n/a n/a CMA-01-04B R 97.5 -11.0 -5.00 9.76 4.99 4.30
SP371 K. breviceps L n/a -4.75 -9.75 15.1 5.47 25.1 SP371 R 215.0 -9.25 -5.25 15.1 4.28 29.0 SP378 K. breviceps L 180.1 -5.00 -4.00 27.9 6.79 25.2 SP378 R 212.8 -4.33 -4.25 15.7 3.22 17.2
GA1214 T. truncatus L 182.3 -13.0 -32.0 27.7 3.17 18.3 GA1214 R 191.2 -23.0 -13.0 18.6 4.72 17.4 GA1248 T. truncatus L 194.5 n/a -7.33 16.8 6.29 23.0 GA1248 R 189.0 n/a -9.67 21.4 5.28 21.7 GA1289 T. truncatus L 196.3 -9.33 -12.7 20.5 10.2 24.2 GA1289 R 245.8 -11.7 -8.33 19.1 4.90 26.4 PA680 T. truncatus L 189.6 -22.0 -15.0 14.2 4.47 15.8 PA680 R 193.0 -22.0 -12.0 12.5 4.79 17.6 PA692 T. truncatus L 200.9 -6.67 -12.0 19.0 7.95 28.7 PA692 R 192.2 -6.67 -9.67 21.5 5.40 28.8 PO432 T. truncatus L 218.3 -9.00 -10.3 17.8 6.36 23.3 PO432 R 196.0 -9.00 -11.0 21.2 4.97 18.2
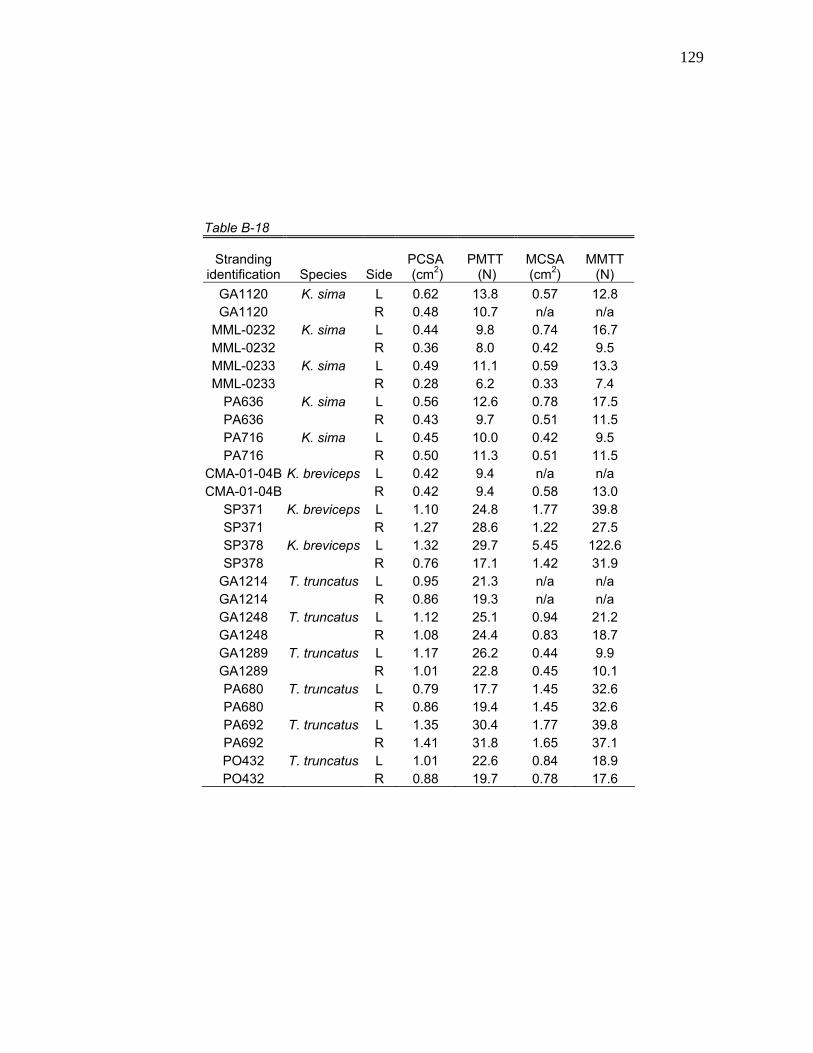
129
Table B-18
Stranding identification Species Side
PCSA (cm2)
PMTT (N)
MCSA (cm2)
MMTT (N)
GA1120 K. sima L 0.62 13.8 0.57 12.8 GA1120 R 0.48 10.7 n/a n/a
MML-0232 K. sima L 0.44 9.8 0.74 16.7 MML-0232 R 0.36 8.0 0.42 9.5 MML-0233 K. sima L 0.49 11.1 0.59 13.3 MML-0233 R 0.28 6.2 0.33 7.4
PA636 K. sima L 0.56 12.6 0.78 17.5 PA636 R 0.43 9.7 0.51 11.5 PA716 K. sima L 0.45 10.0 0.42 9.5 PA716 R 0.50 11.3 0.51 11.5
CMA-01-04B K. breviceps L 0.42 9.4 n/a n/a CMA-01-04B R 0.42 9.4 0.58 13.0
SP371 K. breviceps L 1.10 24.8 1.77 39.8 SP371 R 1.27 28.6 1.22 27.5 SP378 K. breviceps L 1.32 29.7 5.45 122.6 SP378 R 0.76 17.1 1.42 31.9
GA1214 T. truncatus L 0.95 21.3 n/a n/a GA1214 R 0.86 19.3 n/a n/a GA1248 T. truncatus L 1.12 25.1 0.94 21.2 GA1248 R 1.08 24.4 0.83 18.7 GA1289 T. truncatus L 1.17 26.2 0.44 9.9 GA1289 R 1.01 22.8 0.45 10.1 PA680 T. truncatus L 0.79 17.7 1.45 32.6 PA680 R 0.86 19.4 1.45 32.6 PA692 T. truncatus L 1.35 30.4 1.77 39.8 PA692 R 1.41 31.8 1.65 37.1 PO432 T. truncatus L 1.01 22.6 0.84 18.9 PO432 R 0.88 19.7 0.78 17.6
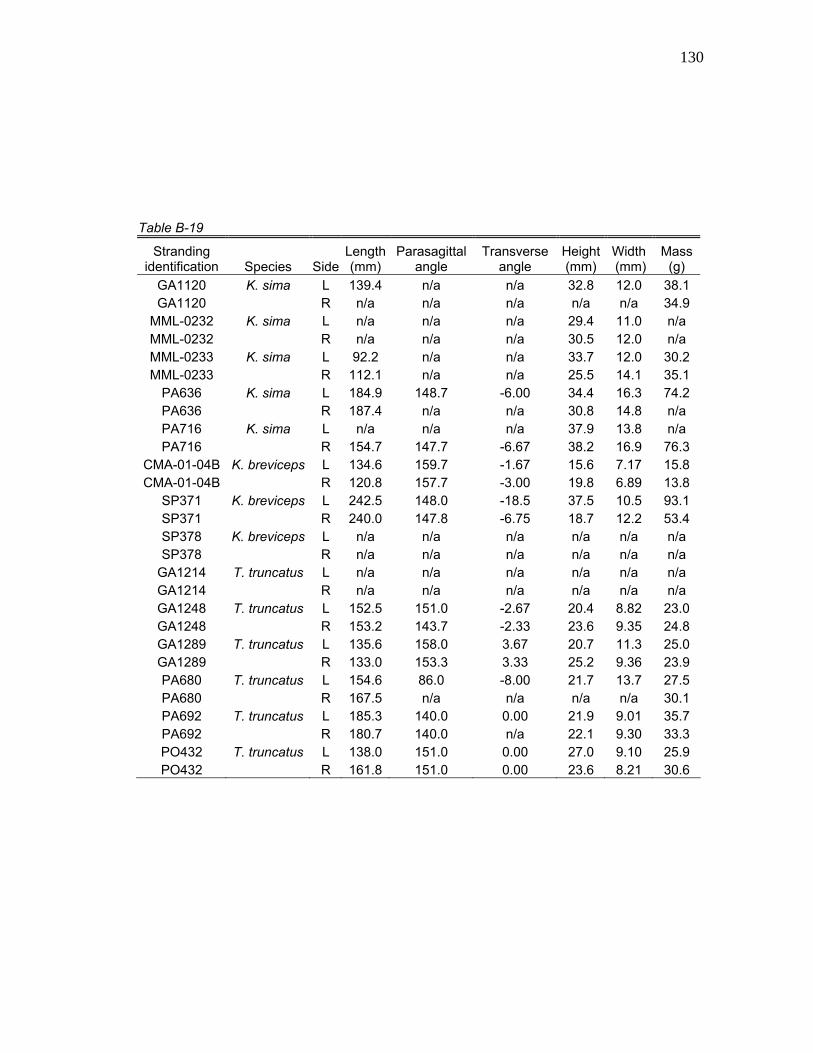
130
Table B-19
Stranding identification Species Side
Length (mm)
Parasagittal angle
Transverse angle
Height (mm)
Width (mm)
Mass (g)
GA1120 K. sima L 139.4 n/a n/a 32.8 12.0 38.1 GA1120 R n/a n/a n/a n/a n/a 34.9
MML-0232 K. sima L n/a n/a n/a 29.4 11.0 n/a MML-0232 R n/a n/a n/a 30.5 12.0 n/a MML-0233 K. sima L 92.2 n/a n/a 33.7 12.0 30.2 MML-0233 R 112.1 n/a n/a 25.5 14.1 35.1
PA636 K. sima L 184.9 148.7 -6.00 34.4 16.3 74.2 PA636 R 187.4 n/a n/a 30.8 14.8 n/a PA716 K. sima L n/a n/a n/a 37.9 13.8 n/a PA716 R 154.7 147.7 -6.67 38.2 16.9 76.3
CMA-01-04B K. breviceps L 134.6 159.7 -1.67 15.6 7.17 15.8 CMA-01-04B R 120.8 157.7 -3.00 19.8 6.89 13.8
SP371 K. breviceps L 242.5 148.0 -18.5 37.5 10.5 93.1 SP371 R 240.0 147.8 -6.75 18.7 12.2 53.4 SP378 K. breviceps L n/a n/a n/a n/a n/a n/a SP378 R n/a n/a n/a n/a n/a n/a
GA1214 T. truncatus L n/a n/a n/a n/a n/a n/a GA1214 R n/a n/a n/a n/a n/a n/a GA1248 T. truncatus L 152.5 151.0 -2.67 20.4 8.82 23.0 GA1248 R 153.2 143.7 -2.33 23.6 9.35 24.8 GA1289 T. truncatus L 135.6 158.0 3.67 20.7 11.3 25.0 GA1289 R 133.0 153.3 3.33 25.2 9.36 23.9 PA680 T. truncatus L 154.6 86.0 -8.00 21.7 13.7 27.5 PA680 R 167.5 n/a n/a n/a n/a 30.1 PA692 T. truncatus L 185.3 140.0 0.00 21.9 9.01 35.7 PA692 R 180.7 140.0 n/a 22.1 9.30 33.3 PO432 T. truncatus L 138.0 151.0 0.00 27.0 9.10 25.9 PO432 R 161.8 151.0 0.00 23.6 8.21 30.6
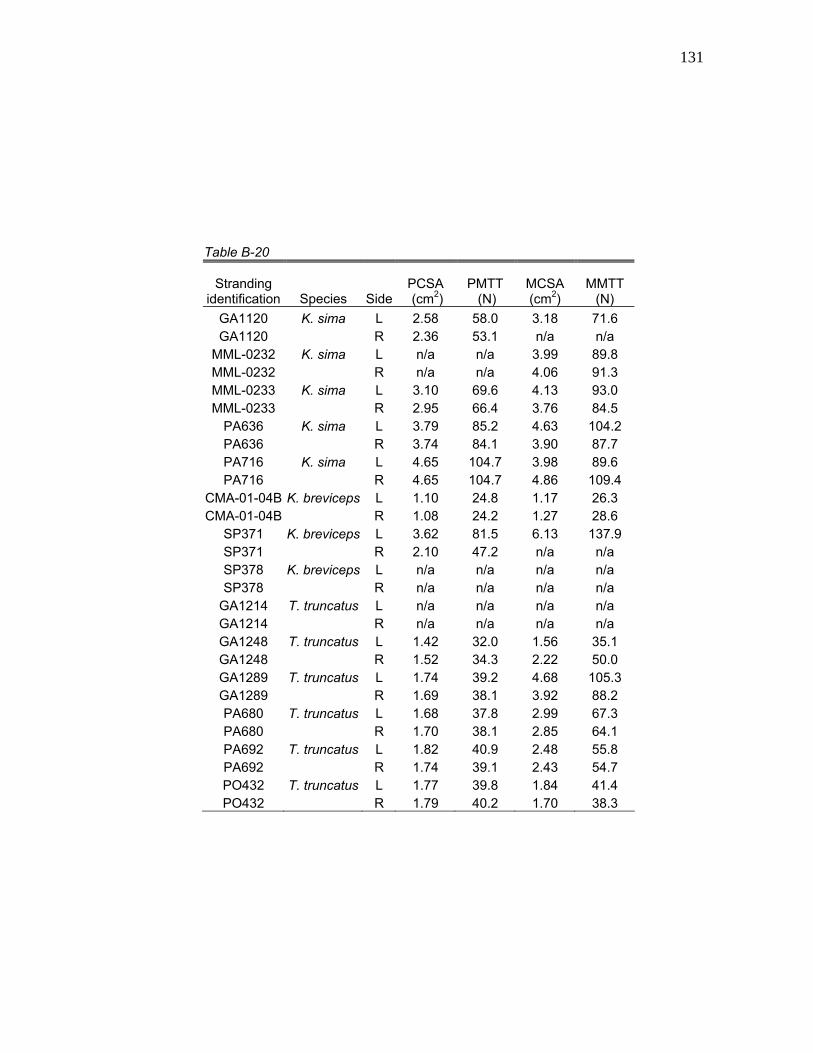
131
Table B-20
Stranding identification Species Side
PCSA (cm2)
PMTT (N)
MCSA (cm2)
MMTT (N)
GA1120 K. sima L 2.58 58.0 3.18 71.6 GA1120 R 2.36 53.1 n/a n/a
MML-0232 K. sima L n/a n/a 3.99 89.8 MML-0232 R n/a n/a 4.06 91.3 MML-0233 K. sima L 3.10 69.6 4.13 93.0 MML-0233 R 2.95 66.4 3.76 84.5
PA636 K. sima L 3.79 85.2 4.63 104.2 PA636 R 3.74 84.1 3.90 87.7 PA716 K. sima L 4.65 104.7 3.98 89.6 PA716 R 4.65 104.7 4.86 109.4
CMA-01-04B K. breviceps L 1.10 24.8 1.17 26.3 CMA-01-04B R 1.08 24.2 1.27 28.6
SP371 K. breviceps L 3.62 81.5 6.13 137.9 SP371 R 2.10 47.2 n/a n/a SP378 K. breviceps L n/a n/a n/a n/a SP378 R n/a n/a n/a n/a
GA1214 T. truncatus L n/a n/a n/a n/a GA1214 R n/a n/a n/a n/a GA1248 T. truncatus L 1.42 32.0 1.56 35.1 GA1248 R 1.52 34.3 2.22 50.0 GA1289 T. truncatus L 1.74 39.2 4.68 105.3 GA1289 R 1.69 38.1 3.92 88.2 PA680 T. truncatus L 1.68 37.8 2.99 67.3 PA680 R 1.70 38.1 2.85 64.1 PA692 T. truncatus L 1.82 40.9 2.48 55.8 PA692 R 1.74 39.1 2.43 54.7 PO432 T. truncatus L 1.77 39.8 1.84 41.4 PO432 R 1.79 40.2 1.70 38.3
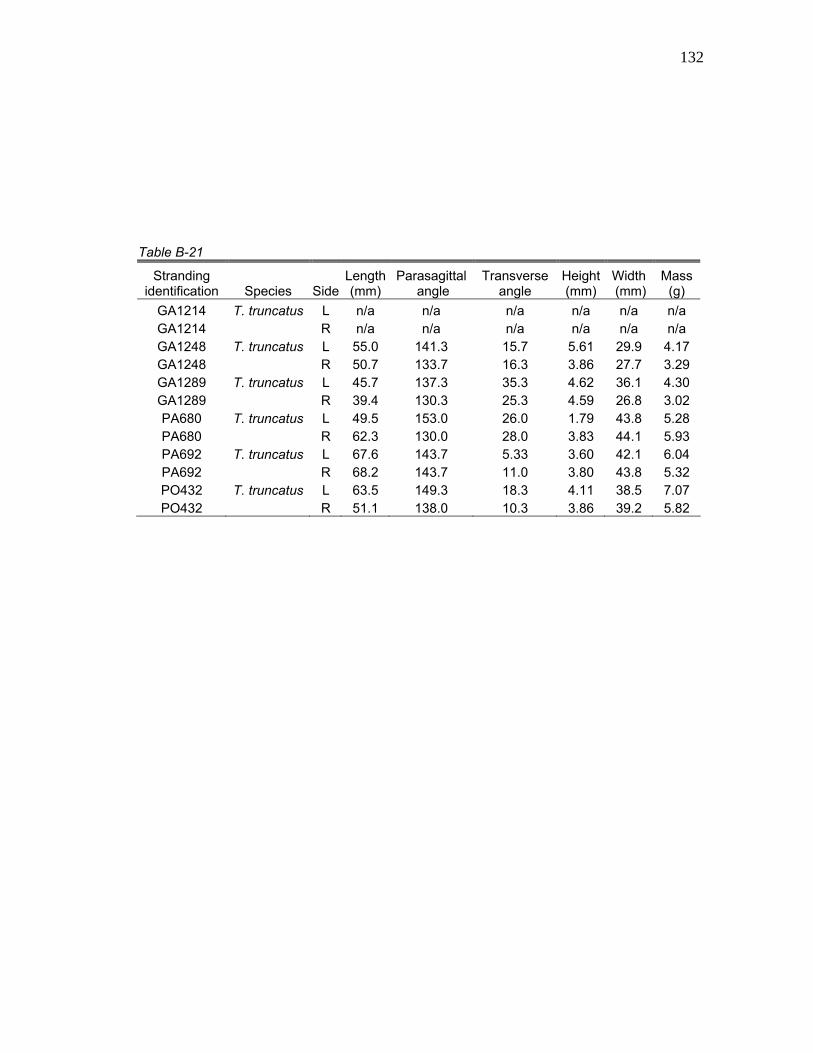
132
Table B-21
Stranding identification Species Side
Length (mm)
Parasagittal angle
Transverse angle
Height (mm)
Width (mm)
Mass (g)
GA1214 T. truncatus L n/a n/a n/a n/a n/a n/a GA1214 R n/a n/a n/a n/a n/a n/a GA1248 T. truncatus L 55.0 141.3 15.7 5.61 29.9 4.17 GA1248 R 50.7 133.7 16.3 3.86 27.7 3.29 GA1289 T. truncatus L 45.7 137.3 35.3 4.62 36.1 4.30 GA1289 R 39.4 130.3 25.3 4.59 26.8 3.02 PA680 T. truncatus L 49.5 153.0 26.0 1.79 43.8 5.28 PA680 R 62.3 130.0 28.0 3.83 44.1 5.93 PA692 T. truncatus L 67.6 143.7 5.33 3.60 42.1 6.04 PA692 R 68.2 143.7 11.0 3.80 43.8 5.32 PO432 T. truncatus L 63.5 149.3 18.3 4.11 38.5 7.07 PO432 R 51.1 138.0 10.3 3.86 39.2 5.82
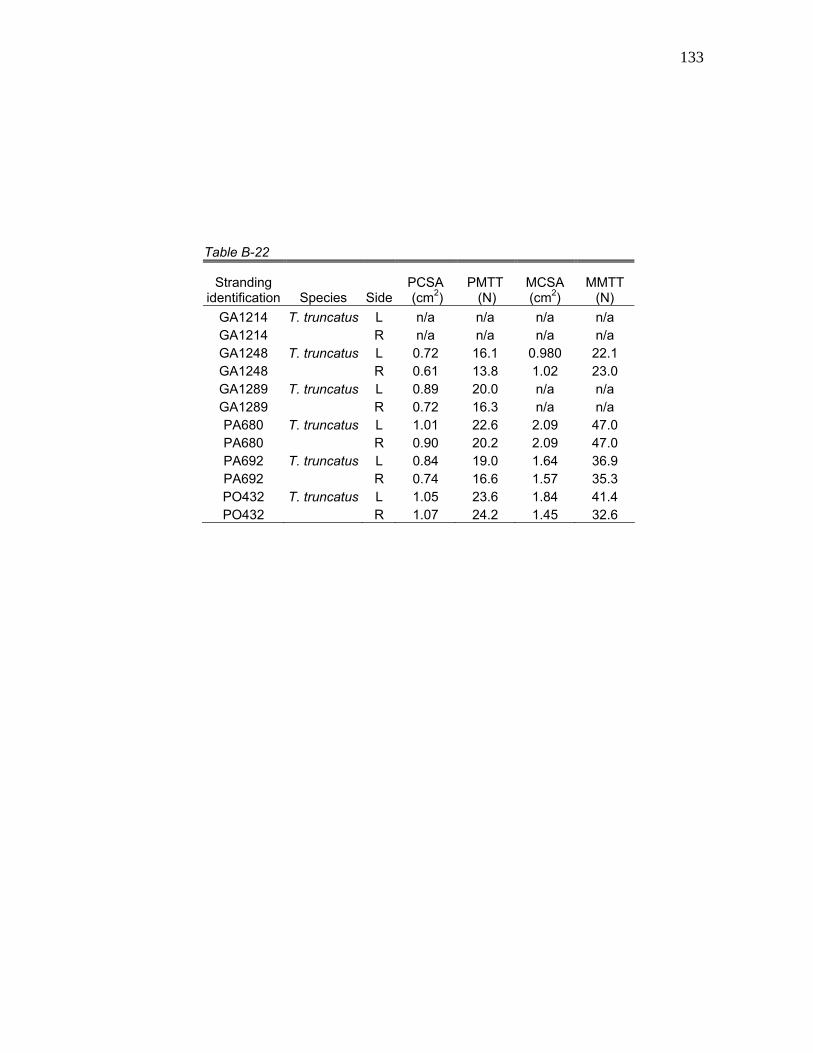
133
Table B-22
Stranding identification Species Side
PCSA (cm2)
PMTT (N)
MCSA (cm2)
MMTT (N)
GA1214 T. truncatus L n/a n/a n/a n/a GA1214 R n/a n/a n/a n/a GA1248 T. truncatus L 0.72 16.1 0.980 22.1 GA1248 R 0.61 13.8 1.02 23.0 GA1289 T. truncatus L 0.89 20.0 n/a n/a GA1289 R 0.72 16.3 n/a n/a PA680 T. truncatus L 1.01 22.6 2.09 47.0 PA680 R 0.90 20.2 2.09 47.0 PA692 T. truncatus L 0.84 19.0 1.64 36.9 PA692 R 0.74 16.6 1.57 35.3 PO432 T. truncatus L 1.05 23.6 1.84 41.4 PO432 R 1.07 24.2 1.45 32.6
134
VITA
Brian Edward Bloodworth was born the son of Dr. and Mrs. K. E. Bloodworth
of Helotes, Texas. After graduating from Junction City High School in Junction
City, Kansas in 1996, he enrolled in the Bachelor of Science program at Texas
A&M University at Galveston majoring in marine biology. During this time, he
became the State Lab Coordinator of the Texas Marine Mammal Stranding
Network. He graduated in 2000 and was employed in a genetics and
biochemistry project at the University of Texas Medical Branch at Galveston
before enrolling in the Wildlife and Fisheries Sciences department of Texas A&M
to pursue a Master’s of Science degree in 2002. He can be contacted in care of
Dr. Christopher D. Marshall, Department of Marine Biology, Texas A&M
University at Galveston, 5007 Ave. U, Galveston, Texas 77551 USA.