behavioral performance and evolution of feeding …
TRANSCRIPT

BEHAVIORAL PERFORMANCE AND EVOLUTION OF FEEDING MODES
IN ODONTOCETES
A Thesis
by
EMILY ALISON KANE
Submitted to the Office of Graduate Studies of Texas A&M University
in partial fulfillment of the requirements for the degree of
MASTER OF SCIENCE
May 2009
Major Subject: Wildlife and Fisheries Sciences

BEHAVIORAL PERFORMANCE AND EVOLUTION OF FEEDING MODES
IN ODONTOCETES
A Thesis
by
EMILY ALISON KANE
Submitted to the Office of Graduate Studies of Texas A&M University
in partial fulfillment of the requirements for the degree of
MASTER OF SCIENCE
Approved by:
Chair of Committee, Christopher D. Marshall Committee Members, Antonietta Quigg Bernd Würsig Head of Department, Thomas Lacher
May 2009
Major Subject: Wildlife and Fisheries Sciences
iii
ABSTRACT
Behavioral Performance and Evolution of Feeding Modes in Odontocetes. (May 2009)
Emily Alison Kane, B. S., Southampton College of Long Island University
Chair of Advisory Committee: Dr. Christopher D. Marshall
Vertebrate evolution has resulted in a diversity of feeding mechanisms.
Cetaceans are secondarily derived tetrapods that have returned to a marine habitat. As a
result, they display feeding modes that have converged with more basal aquatic
vertebrates, but display a diversity of new solutions and adaptations. To begin to
explore the diversity of feeding adaptations among odontocetes, kinematics of feeding
modes and feeding adaptations for belugas (Delphinapterus leucas), Pacific white-sided
dolphins (Lagenorhynchus obliquidens), and long-finned pilot whales (Globicephala
melas) were characterized. In addition, direct measurements of intraoral pressure were
collected to determine maximum suction performance. Characters from these analyses
were combined with data for other odontocetes, and were mapped onto a phylogeny of
Odontoceti to begin to explore where changes in feeding modes took place. Feeding
modes were diverse in belugas, Pacific white-sided dolphins, and pilot whales and
included suction, ram, and a combination of both. In general, four phases were
observed: (I) preparatory, (II) jaw opening, (III) gular depression, and (IV) jaw closing.
Suction was a large component of the prey capture method in belugas and subambient
pressures in excess of 100 kPa were generated. Belugas were also capable of lateral lip
gape occlusion and anterior lip pursing to form a small anterior aperture. Pacific white-
sided dolphins relied on ram to capture prey. However, some degree of pursing and
resultant subambient pressure was observed that was likely used to compensate for high
ram speeds or for prey manipulation and transport to the esophagus. Pilot whales were
more similar to belugas in kinematics, but maintained high approach velocities and did

iv
not generate significant suction pressures; suction and ram were used in combination.
Belugas and pilot whales appeared to employ hyolingual depression as a primary suction
generation mechanism, whereas Pacific white-sided dolphins relied on fast jaw opening.
Ancestral state reconstructions indicated that suction feeding capability evolved
independently at least six times within Odontoceti. These results indicate the diversity
of feeding behaviors in odontocetes and provide directives for future studies on the
diversity of feeding in secondarily aquatic mammals.

v
ACKNOWLEDGEMENTS
I thank my committee chair, Dr. Christopher D. Marshall for his help, support,
and encouragement during the course of this project. He has also fostered my curiosity
and has given me a strong background in functional morphology. I am especially
grateful for the support of my committee members Dr. Antonietta Quigg and Dr. Bernd
Würsig, as well as insight from Dr. Alex Werth.
I am indebted to many people for their gracious help in carrying out this project.
The trainers and staff at Sea World of Texas in San Antonio, including Chuck Cureau,
Mark Boucher, and Chris White as well as the trainers and staff of Sea World of
California in San Diego, including Bill Hoffman, Danielle Anderson, and Kristi Burtis
were instrumental in training and caring for the animals. In addition, they provided
valuable insight into the feeding behavior of the animals. Special thanks also go to
Janelle Case, Kimberly Cooper, Elizabeth Neyland, Kerri Smith, and Andrew Nguyenba
who were gracious enough to volunteer their time to help with data collection and
analysis.
I appreciate the support, encouragement, and integrity of my labmates Janelle
Case, Amanda Moss, Alejandra Salazar-Guzman, and Rachel Neuenhoff. I also thank
those that have worked behind the scenes to make sure that grants are processed,
supplies are ordered, posters are printed, forms are submitted, and who have helped to
ensure my success at TAMUG. These include Stacie Arms, Patsy Witter, Janet
Maxwell, Alice Maffay, and Peggy Rutkowski, among others.
I am also deeply indebted to Dr. Tim Gerrodette and Paula Olson for
encouraging my academic growth at an early stage and pushing me to always challenge
myself. Finally, I thank my parents and friends for encouraging my academic pursuits
and supporting my decisions through my career as a student.

vi
TABLE OF CONTENTS
Page
ABSTRACT .............................................................................................................. iii
ACKNOWLEDGEMENTS ...................................................................................... v
TABLE OF CONTENTS .......................................................................................... vi
LIST OF FIGURES................................................................................................... viii
LIST OF TABLES .................................................................................................... x
1. INTRODUCTION ............................................................................................... 1
1.1 Evolution of odontocete cetaceans ............................................................ 1 1.2 Aquatic feeding modes............................................................................... 4 1.3 Evolution of odontocete feeding modes..................................................... 6 1.4 Objectives................................................................................................... 8 2. MATERIALS AND METHODS ......................................................................... 10
2.1 Study animals and facilities........................................................................ 10 2.2 Kinematic trials and analyses..................................................................... 10 2.3 Pressure generation capability.................................................................... 18 2.4 Statistics ..................................................................................................... 18 2.5 Evolutionary analysis of feeding characters............................................... 20 3. RESULTS............................................................................................................. 22
3.1 Kinematic analyses..................................................................................... 22 3.1.1 Feeding behaviors ....................................................................... 24 3.1.2 Lateral kinematic analyses .......................................................... 33 3.1.3 Frontal kinematic analyses .......................................................... 43 3.2 Intraoral pressure generation...................................................................... 47 3.3 The evolution of suction feeding................................................................ 57 4. DISCUSSION ...................................................................................................... 64
4.1 The use of ram and suction in odontocetes ................................................ 64 4.1.1 Belugas ........................................................................................ 64

vii
Page
4.1.2 Pacific white-sided dolphins ....................................................... 65 4.1.3 Pilot whales ................................................................................. 66 4.2 Comparisons with other vertebrates ........................................................... 68 4.2.1 Comparisons with marine mammal taxa ..................................... 68 4.2.2 Comparisons with more basal vertebrates................................... 71 4.3 Evaluation of the ram-suction index .......................................................... 73 4.4 Evolution of suction feeding in Odontoceti ............................................... 75 4.4.1 Reconstructed ancestral feeding characteristics .......................... 75 4.4.2 Plesiomorphies, apomorphies, and synapomorphies................... 76 5. CONCLUSIONS.................................................................................................. 80
REFERENCES.......................................................................................................... 82
APPENDIX A ........................................................................................................... 91
VITA ......................................................................................................................... 93

viii
LIST OF FIGURES
FIGURE Page
1 Widely Accepted Phylogeny of Extant Odontoceti ................................... 3 2 Lateral Anatomical Landmarks .................................................................. 13 3 Frontal Anatomical Landmarks.................................................................. 17 4 Kinematic Phase Mean (± SEM) Durations ............................................... 23 5 Video Frames from a Representative Beluga Feeding Trial ...................... 25 6 Lateral Kinematic Profile of Selected Variables for a Representative Beluga Feeding Trial ......................................................... 26 7 Video Frames from a Representative Pacific White-Sided Dolphin Feeding Trial ................................................................................ 28 8 Lateral Kinematic Profile of Selected Variables for a Representative Pacific White-Sided Dolphin Feeding Trial ...................... 29
9 Video Frames from a Representative Pilot Whale Feeding Trial .............. 31
10 Lateral Kinematic Profile of Selected Variables for a Representative Pilot Whale Feeding Trial ................................................. 32
11 Mean Values ± SEM of Lateral Kinematic Magnitude Variables ............. 35
12 Mean Values ± SEM of Lateral Kinematic Timing Variables................... 36
13 Canonical Centroid Plot of Lateral Kinematic Variables........................... 38
14 Timeline of Kinematic Events.................................................................... 40
15 Histogram of Ram-Suction Index (RSI) Values ........................................ 44
16 Ram and Suction Distances in Two Dimensional Kinematic Space.......... 45
17 Oral Apertures at Maximum Gape ............................................................. 46

ix
FIGURE Page
18 Mean Values ± SEM of Frontal Kinematic Variables ............................... 49
19 Histogram of Oral Aperture Ratios ............................................................ 50
20 Representative Pressure Traces from Each Species ................................... 53
21 Maximum Performance Values and Mean Timing Values ± SEM for Subambient Pressure Generation Variables.......................................... 55
22 Maximum Performance Values and Mean Timing Values ± SEM for Suprambient Pressure Generation Variables ....................................... 56
23 Reconstruction of Odontocete Feeding Character States ........................... 62
24 The Evolution of Suction Generation Specialization within Odontoceti .................................................................................................. 78

x
LIST OF TABLES
TABLE Page 1 Sex, Age, Length, and Weight of Subjects Used ....................................... 11 2 Definitions and Abbreviations for Kinematic Variables............................ 14 3 Definitions and Abbreviations for Pressure Generation Variables ............ 19
4 Mean Values ± SEM for Lateral Kinematic Variables .............................. 34 5 Pearson Correlation among Lateral Kinematic Variables.......................... 41 6 Mean Values ± SEM for Frontal Kinematic Variables .............................. 48 7 Pearson Correlation among Frontal Kinematic Variables.......................... 51 8 Maximum Pressure Generation Performance and Mean Event Times ± SEM for Pressure Generation Variables ................................................. 54 9 Pearson Correlation among Pressure Generation Variables....................... 58 10 Character Matrix of Gap Coded Character States ...................................... 61 11 The Most Likely Hypothesis of Character States in the Odontocete Common Ancestor...................................................................................... 63 12 Summary of Available Feeding Kinematic and Biomechanical Data for Marine Mammals.................................................................................. 69

1
1. INTRODUCTION
1.1 Evolution of odontocete cetaceans
Approximately 550 million years of vertebrate evolution has resulted in one of
the most derived clades of vertebrate taxa, namely members of the Order Cetacea. The
feeding apparatus of vertebrates has undergone numerous changes throughout a long
history of transitions from aquatic, to terrestrial, and back to aquatic environments.
Approximately 400 million years ago, tetrapods transitioned to terrestrial environments,
and within the last 50 million years, cetaceans have returned to an aquatic environment
(Lipps and Mitchell, 1976; Fordyce and Barnes, 1994; Rice, 1998; Thewissen and
Williams, 2002). The diversity of the vertebrate feeding apparatus ranges from jawless
forms to highly kinetic skulls, specialized hyolingual adaptations for ballistic tongue
projection, and jaws designed for mastication. Mammals that have secondarily adapted
to the aquatic environment include filter feeding baleen whales (Mysticetes), as well as
odontocetes that range in feeding morphology from species with many teeth and long
rostra to species with few teeth and blunt rostra. However, these odontocete adaptations
for capturing prey in an aquatic environment have largely been unexplored.
The ancestors of cetaceans were Suborder Archaeoceti, which currently exhibit a
highly unresolved paraphyletic phylogeny. Archaeocetes were comprised of six families
that ranged in morphology from Pakicetus with almost no aquatic adaptations to the
Dorudon, the first oceanic whales (Fordyce and Barnes, 1994; Roe et al., 1998;
Thewissen and Williams, 2002); the Dorudontines are thought to have given rise to
modern baleen feeding mysticetes, and toothed odontocetes (Uhen, 1998). The
divergence of Archaeocete cetaceans from their terrestrial mammalian ancestors may
have been facilitated by a specialization of the feeding apparatus to fill available feeding
niches (Lipps and Mitchell, 1976; Thewissen, 1998; O'Leary and Uhen, 1999). Despite
the considerable morphological variation among archaeocetes, all possessed heterodont
teeth with shearing facets that distinguished them from their terrestrial ancestors
This thesis follows the style of The Journal of Experimental Biology.

2
(O'Leary and Uhen, 1999). Modern cetaceans emerged as recently as 35 million years
ago (Fordyce and Barnes, 1994; Rice, 1998) with extensive modifications to the
ancestral mammalian body plan (Bryden, 1988). Within the lineage that retained teeth
(Odontoceti), the trend was toward long jaws with numerous, homodont teeth
(Thewissen and Williams, 2002). This morphology is convergent with long snouted ram
feeding aquatic vertebrates such as gars, needlefish, barracuda (Porter and Motta, 2004),
and gharials (Thorbjarnarson, 1990). Some odontocete families retained these ancestral
feeding traits, while others evolved blunt rostra, reduced dentition and a capability to
form a circular oral aperture, traits that are convergent with other suction feeding aquatic
vertebrates (Norris and Møhl, 1983; Werth, 2006).
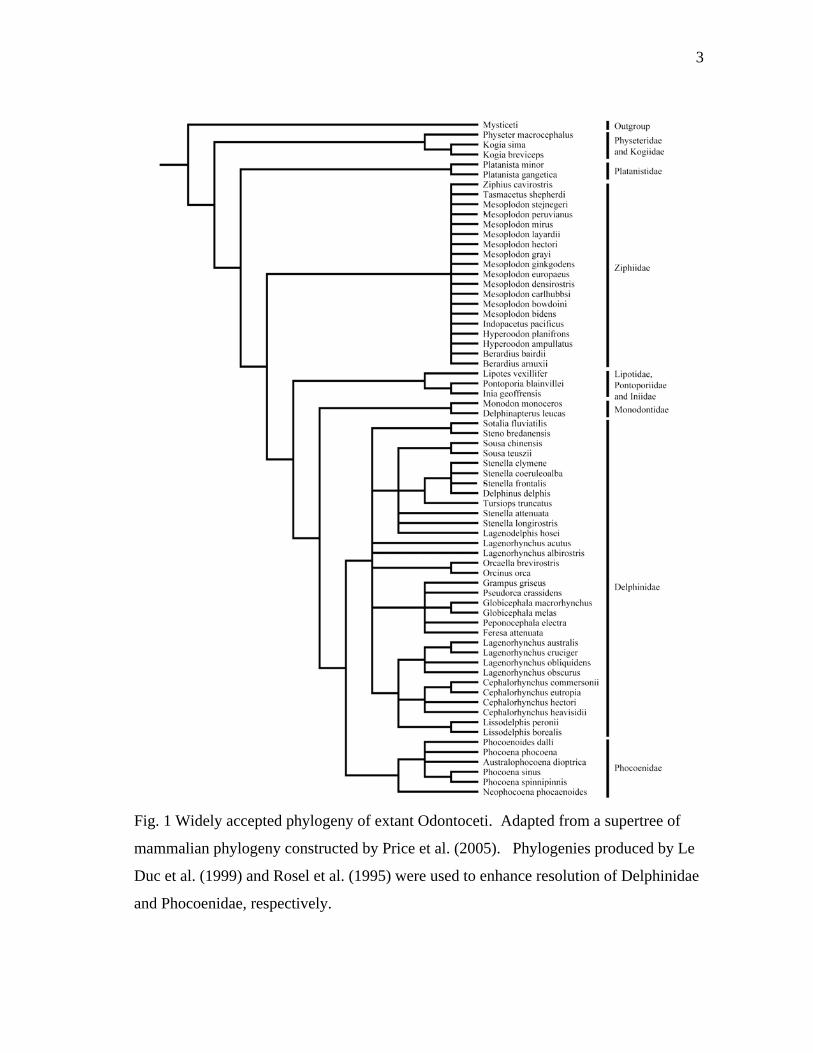
According to the phylogeny presented by Price et al. (2005), there are 67 known
cetacean species belonging to suborder Odontoceti (Fig. 1). Although the phylogenetic
resolution of river dolphins (Families Platanistidae, Pontoporiidae, Iniidae, and
Lipotidae) is poor and described as paraphyletic, river dolphin species typically exhibit
the feeding morphology closest to that of ancestral odontocetes: long, slender snapping
jaws and numerous homodont teeth (Reeves et al., 2002; Werth, 2006). River dolphins
use these long narrow jaws to feed on fish, invertebrates, and turtles (Barros and Clarke,
2002). Superfamily Physeteroidea (sperm whales, pygmy and dwarf sperm whales), and
Families Ziphiidae (beaked whales), Monodontidae (belugas and narwhals), and
Phocoenidae (porpoises), tend to exhibit divergent feeding morphologies and ecologies
from that of the ancestral archaeocetes and basal odontocetes. Physeteroideans and
Ziphiids are deep diving species that specialize on squid prey (Clarke, 1996; Barros and
Clarke, 2002; Marcoux et al., 2007; Santos et al., 2007). Additionally, Physeteroideans,
Ziphiids, Monodontids, and Phocoenids typically have a reduced dentition (Reeves et al.,
2002). However, monodontids possess more blunt rostra than that of the Physeteroidea
or Ziphiidae (Werth, 2006), consume a variety of prey items that include fish, squid, and
benthic invertebrates (Finley and Gibb, 1982; Seaman et al., 1982; Dahl et al., 2000;
Barros and Clarke, 2002; Laidre and Heide-Jorgensen, 2005), and have been observed
using facial muscles to purse their lips. This behavior is thought to enhance suction
3
Fig. 1 Widely accepted phylogeny of extant Odontoceti. Adapted from a supertree of
mammalian phylogeny constructed by Price et al. (2005). Phylogenies produced by Le
Duc et al. (1999) and Rosel et al. (1995) were used to enhance resolution of Delphinidae
and Phocoenidae, respectively.

4
generation (Ray, 1966). The Family Phocoenidae (porpoises) is the sister group to
Delphinidae (dolphins), and generally resembles the monodontids in craniodental
morphology in that rostra are short and blunt and dentition is reduced in porpoises
(Reeves et al., 2002; Werth, 2006). Phocoenids are also similar to monodontids in their
generalist diet, which includes a variety of pelagic and benthic fish, squid, and
invertebrates (Clarke, 1996; Barros and Clarke, 2002). The most derived group of
odontocetes are the Delphinids, which include a diverse array of taxa that range from
teuthophagous pilot whales with shorter, more blunt rostra to piscivorous spinner
dolphins with long pincher-like jaws and rostra (Barros and Clarke, 2002; Reeves et al.,
2002; Werth, 2006). Delphinids represent a continuum of feeding morphologies that
should be reflected in feeding strategies and kinematics that range from ram to suction
feeding.
1.2 Aquatic feeding modes
Four generalized methods of prey capture are recognized in an aquatic
environment: filter feeding, biting, ram feeding, and suction feeding (e.g. Moss, 1972;
Lauder, 1985; Liem, 1993; Norton, 1995; Alfaro et al., 2001; Motta and Wilga, 2001;
Motta et al., 2002). Filter feeding involves the flow of water over a filtering apparatus
that actively or passively traps suspended prey items. North American paddlefish
(Polyodon spathula) are well known filter feeders (Rosen and Hales, 1981). Within
Order Cetacea, Suborder Mysticeti filters small fish and invertebrates from the water
with sieve-like baleen plates. Biting involves cessation of forward motion and forceful
contact of the prey with the jaws, often removing smaller pieces. This mode of prey
capture is exemplified by parrotfish (Scaridae, Bellwood and Choat, 1990) and is evident
in cetaceans that remove smaller pieces from large prey items, such as killer whales
(Orcinus orca) that feed on large marine mammals. However, ram feeding involves
rapid acceleration to overtake the prey, engulfing it entirely. This behavior has been
documented in hammerhead sharks (Sphyrna tiburo, Wilga and Motta, 2000) and some
cetaceans such as bottlenose dolphins (Tursiops truncatus, Bloodworth and Marshall,

5
2005). Suction feeding is characterized by buccal expansion that creates subambient
intraoral pressure to draw water and prey into the mouth. This mode of feeding is the
most widespread among aquatic vertebrates (Lauder, 1985, 1986) and has been
documented in several odontocetes (Heyning and Mead, 1996; Kastelein et al., 1997;
Werth, 2000a; Bloodworth and Marshall, 2005). While these four feeding modes are
distinct, they are not mutually exclusive and are often combined to take advantage of
available resources (Liem, 1993).
Suction feeding generates a flow of water directly in front of the mouth, and the
strongest suction is dependent on the magnitude of the subambient pressure gradient
generated (Wainwright and Day, 2007). This pressure gradient is generated by rapid
buccal cavity expansion and concomitant increase in buccal volume. This sudden
increase in volume creates subambient pressure that draws water and prey into the mouth
(Muller et al., 1982). Flow velocity into the mouth is correlated with the magnitude and
speed of volume change, as well as the surface area of the mouth aperture; large and fast
volume changes, in combination with a small oral aperture result in high rates of fluid
flow (Wainwright and Day, 2007). Stronger subambient buccal pressures result in high
water flow rates. However, fluid velocity and pressure decay exponentially, and are
generally insignificant at distances greater than one mouth diameter (Svanback et al.,
2002; Day et al., 2007). In addition to creating a positive inertia on the prey toward the
predator’s mouth (inertial suction), suction can also be used to compensate for the
pressure wave generated by swimming toward the prey (compensatory suction)
(Summers et al., 1998).
Kinematic studies of feeding that incorporate the use of pressure transducers to
directly measure pressure magnitude have been used to characterize suction and ram
feeding modes in a variety of primarily and secondarily aquatic vertebrates, including
elasmobranchs, teleost fishes, salamanders, turtles, and mammals (for example, Lauder,
1985; Reilly and Lauder, 1990; Bels and Renous, 1992; Ferry-Graham and Lauder,
2001; Wilga et al., 2007; Marshall et al., 2008). Effective inertial suction feeders are
able to generate a subambient pressure gradient at the mouth, and to do so, they typically

6
have a limited gape with rapid gape opening and closing velocities. Whereas sharks and
rays initiate buccal expansion through depression of the floor of the mouth, teleost fishes
use their highly kinetic skulls for lateral expansion, thereby creating generally greater
subambient pressures. Although marine mammals are phylogenetically constrained in
their skull morphology, they have evolved a convergent mechanism to generate
subambient intraoral pressure. Marine mammals use hyolingual musculature to depress
and retract a piston-like tongue to create a rapid and large change in buccal volume; a
greater hyolingual displacement indicates greater suction generation capability (Gordon,
1984; Heyning and Mead, 1996; Werth, 2000b; Marshall et al., 2008). However, the
combination of hyoid shape, tongue shape, and orofacial morphology likely has a large
influence on suction capability (Bloodworth and Marshall, 2007). Several anatomical
studies of the feeding apparatus of odontocetes (e.g. Reidenberg and Laitman, 1994;
Werth, 2006; Bloodworth and Marshall, 2007) have been conducted, and these serve as
functional hypotheses that can be tested using feeding performance studies. However,
since few data exist on the kinematics and suction performance of marine mammals, this
study collects kinematic and biomechanical data for comparison with other marine
mammals and other vertebrates.
1.3 Evolution of odontocete feeding modes
Suction is the most common feeding mode among aquatic vertebrates, and has
been highly selected for due to the high density and viscosity of water (Lauder, 1985).
However, during the transition to a terrestrial environment, suspension and suction
feeding modes became ineffective and were abandoned. Processing of prey items by
tetrapods became more complex and resulted in the evolution of mastication, or
chewing, which is a defining characteristic of class Mammalia (Herring, 1993).
However, when marine mammals such as odontocetes re-invaded the aquatic
environment, mastication was abandoned and many aquatic adaptations, such as suction
feeding, evolved secondarily.

7
The morphology of ancestral odontocetes was similar to that of extant aquatic
ram feeding piscivores, and ram feeding is hypothesized to be the dominant method of
prey capture in the first cetaceans (Werth, 2006). Some modern odontocete families are
thought to have retained these ancestral feeding traits while others display divergent
morphologies, such as blunt rostra, reduced dentition and capability to form a circular
oral aperture. These adaptations likely occurred independently multiple times and
resulted in suction feeding specialists that converge with other suction feeding aquatic
vertebrates (Werth, 2006). While some odontocetes are considered specialists on either
end of the ram-suction feeding spectrum, most are thought to utilize a mixture of both
suction and ram feeding modes. Captive observations of a few cetacean species have
demonstrated that both feeding modes are present in several taxa (Kastelein et al., 1997;
Werth, 2000; Bloodworth and Marshall, 2005). However, behavioral performance
studies on additional taxa will provide much needed comparative data to characterize the
breadth of odontocete feeding behavior and to place odontocete feeding in an
evolutionary context.
Characterizing the phylogeny of structure and function is common in
evolutionary systematics, and is often performed by mapping observed changes in
characters (e.g., morphology or performance) onto an existing phylogenetic tree.
However, many data are continuous and can present difficulties in character mapping.
As a solution, Mickevich and Johnson (1976) used gap coding to code continuous data
into discrete character states, which were then easily mapped onto the phylogeny of
silversides (Menidia spp.). Gap coding numerically orders the data to determine the
difference (gap) between subsequent data points. These gaps are then compared to the
group standard deviation to determine changes in character states. However, some
datasets that are highly variable can fail to generate gaps, which can fail to determine
character states. This leads to an inability to map character states onto a phylogeny
(Riska, 1979). Throughout the past few decades, several alternative methods to gap
coding have been proposed (for reviews, see Thorpe, 1984; Archie, 1985; Harvey and
Pagel, 1991; Westneat, 1995; Garcia-Cruz and Sosa, 2006). Nonetheless, simple gap

8
coding has withstood scrutiny and remains an accepted method for determining
differences in character states among populations (Westneat, 1995), and may prove
useful in the analysis of the evolution of odontocete feeding modes.
The numerous odontocetes in captivity are useful subjects for exploring the
evolution of feeding modes in secondarily aquatic mammals. Belugas (Delphinapterus
leucas), common in captivity, are anecdotally known for their suction capability (Ray,
1966; Brodie, 1989), and are an important group phylogenetically since they belong to a
basal clade within Odontoceti (Monodontidae). In contrast, Pacific white-sided dolphins
(Lagenorhynchus obliquidens) belong to the most derived clade (Delphinidae) and have
been observed to rapidly herd and overtake a variety of fish prey organized as bait balls
(Fiscus and Kajimura, 1980; Heise, 1997; Morton, 2000) in a behavior similar to that of
their southern hemisphere congener (dusky dolphins, Lagenorhynchus obscurus, Würsig
and Würsig, 1980; Vaughn et al., 2008). This behavior indicates the likely use of a ram
feeding mode. Long-finned pilot whales (Globicephala melas), also members of Family
Delphinidae, have been observed to use suction to ingest prey (Brown, 1962; Werth,
2000), a feeding mode indicated by their morphology, diet, and behavior. The
comparison of three species of odontocetes with divergent feeding modes and
phylogenetic distinctions allows for a comparison of suction generation among
odontocetes and, in combination with other odontocetes for which kinematic data are
available, forms a starting point to begin to explore the evolution of suction feeding in
cetaceans.
1.4 Objectives
The primary objective of this study is to characterize and compare the kinematics
and behavioral performance of feeding among presumed suction feeding and ram
feeding odontocetes. The secondary objective of this study is to integrate odontocete
feeding behavior data with data from the literature to begin to explore the evolution of
feeding modes of odontocetes. The specific aims of this study are to:

9
1) Characterize the kinematics of feeding in three species of odontocetes.
A) Define the kinematic profiles of belugas, Pacific white-sided dolphins,
and long-finned pilot whales, and test the hypothesis that presumed
suction feeding species will exhibit reduced gape, increased hyolingual
depression, and adaptations to occlude lateral gape.
B) Calculate ram-suction index (RSI) and test the hypothesis that presumed
ram feeders will tend to have RSI values closer to +1 and presumed
suction feeders, will tend to have RSI values closer to -1.
2) Characterize adaptations for lateral gape occlusion and pursing behavior in
odontocetes, and test the hypothesis that each species in this study will display
various degrees of pursing capability.
3) Measure the in vivo intraoral pressure changes during feeding events in belugas,
Pacific white-sided dolphins, and pilot whales. Determine if species can produce
subambient pressure and test the hypotheses that presumed suction feeding
species will be able to generate greater subambient intraoral pressure than
presumed non-suction feeders.
4) Begin to explore the evolution of feeding modes among odontocetes by
determining where suction capabilities have occurred within odontocete
phylogeny. Kinematic and pressure variables from this study as well as
kinematic variables, pressure variables, and morphological characters from the
literature, will be combined and mapped onto a widely accepted cladogram of
suborder Odontoceti. This will be done to begin to systematically explore the
evolution of suction feeding in Odontoceti and determine where changes in
feeding modes may have taken place.

10
2. MATERIALS AND METHODS
2.1 Study animals and facilities
All subjects used in the study were captive animals held at two Sea World
facilities (Sea World of Texas, San Antonio, TX and Sea World of California, San
Diego, CA). Subjects included seven beluga whales (Delphinapterus leucas Pallas,
1976) and seven Pacific white-sided dolphins (Lagenorhynchus obliquidens Gill, 1865)
housed at Sea World of Texas. Two female long-finned pilot whales (Globicephala
melas Lesson, 1828) housed at Sea World of California were also used. Mean subject
lengths and weights were 332 ± 43.9 cm and 577 ± 153 kg for belugas, 193 ± 27.8 cm
and 108 ± 19.2 kg for Pacific white-sided dolphins, and 450 ± 32.3 cm and 1081 ± 348
kg respectively for pilot whales (Table 1). The use of all subjects was approved by Sea
World, Inc. and the Institutional Animal Care and Use Committee (AUP 2006-237) of
Texas A&M University.
2.2 Kinematic trials and analyses
Feeding kinematic data for presumed suction and non-suction feeding
odontocetes was collected during controlled feeding trials. Herring (Clupea harengus),
capelin (Mallotus villosus), mackerel (Scomber japonicus), and squid (Loligo
opalescens) were presented to the subjects by hand (following Bloodworth and Marshall,
2005). Prey items were distributed according to the daily diet regimen for each
individual; belugas primarily received herring, Pacific white-sided dolphins primarily
received capelin, and pilot whales received herring, mackerel and squid. When cued, the
subject was released from its station to freely capture the prey item via its preferred
feeding mode (Fig. 2). Feeding trials were recorded using a Sony TRV950 video camera
with a 500 ms shutter speed at 30 frames per second. The camera was either fitted into a
handheld Equinox underwater housing (Galesburg, MI, USA) placed in the tank or was
mounted onto a stationary tripod outside of an underwater viewing window. A
calibration square of known dimensions was placed perpendicular to the video camera
and in the plane of the subject before or after each feeding trial.

11
Table 1 Sex (M, male; F, female), age, length and weight of subjects used. Species
abbreviations (in parentheses) and individual codes were used instead of species and
animal names throughout the analysis.
Species Individual Code Sex Age (yrs) Length (cm) Weight (kg) Beluga (DL)
Chrissy 1 F 23 351 571 Luna 2 F 5 284 429 Martha 3 F 23 335 542 Nanuq 4 M 28 396 873 Sikku 5 F 23 335 608 Martina 6 F 23 356 603 Whisper 7 F 6 267 411
Pacific white-sided dolphin
(LO)
Avalon 8 F 6 188 100 Betty 9 F 26 206 118 Catalina 10 F 12 221 127 Dart 11 M 2 152 116 Hailey 12 F 6 180 86 Lorelai 13 F 26 231 129 Munchkin 14 F 5 173 82
Pilot whale (GM)
Bubbles 15 F 46 472 1327 Niner 16 F 27 427 834

12
Lateral kinematic variables were calculated to describe the movement of the jaws
during feeding. Videos of feeding trials were imported into the Peak Motus Motion
Analysis System version 9 (Vikon, Denver, CO, USA). Seven anatomical landmarks
were digitized (Fig. 2) and used for kinematic calculations, including: (1) rostral tip of
upper jaw, (2) most anterior extent of lateral gape occlusion, where the lips were sealed
to form an occluded lateral gape, (3) corner of the mouth, the vertex of the jaw, (4)
rostral mandibular tip, (5) point on the prey item furthest from the subject, (6) center of
the eye of the subject, and (7) rostral border of the externally apparent hyoid. A total of
23 lateral kinematic variables were calculated (Table 2). Feeding events began at the
first frame in which gape angle opening velocity increased from 0 and gape began to
increase, and ended at the last frame in which gape angle closing velocity returned to 0
and gape returned to the original closed position. To characterize the possible pursing
behavior in belugas, and to compare pursing capability among species, five additional
lateral gape occlusion kinematic variables were calculated and are also listed in Table 2.
Criteria for using video footage in kinematic analyses were that: (1) prior to jaw
opening, both the prey item and the subject were visible in the frame and below the
surface of the water, (2) all anatomical landmarks were visible in all frames, (3) the
subject was perpendicular to the camera and any yaw or roll by the subject was less than
15°, (4) the video sequence was in focus, and (5) ingestion was observed. The five
feeding events per subject that best fit these criteria were digitized frame-by-frame and
homologous landmarks were analyzed using Peak Motus. For subjects with fewer than
five sequences (25% of individuals: 2 belugas and 2 pacific white-sided dolphins), all
usable feeding events were analyzed.
Ram-suction index (RSI) is as a quantitative measure of suction performance
among aquatic vertebrates (Norton and Brainerd, 1993). RSI was calculated for each
trial following Norton and Brainerd (1993):
RSI = (Dpredator – Dprey) / (Dpredator + Dprey)
where Dpredator is the net distance traveled by the subject and Dprey is the net distance
traveled by the food item. Anatomical landmarks assigned to the point on the prey

13
Fig. 2 Lateral anatomical landmarks. Schematic depicts experimental setup from the
camera’s perspective, with lateral digitized landmarks and spatial model displayed for
(A) belugas, (B) Pacific white-sided dolphins, and (C) pilot whales. Drawings are scaled
independently. The pressure transducer was threaded through the gill of the fish and
protruded approximately 2 cm from the fish’s mouth. Anatomical landmarks were: (1)
rostral tip of upper jaw, (2) most anterior extent of lateral gape occlusion, where the lips
were occluded to form a pursed lateral gape, (3) corner of the mouth, the vertex of the
jaw, (4) rostral mandibular tip, (5) point on the prey item furthest from the subject, (6)
center of the eye of the subject, and (7) rostral border of the externally apparent hyoid.
In the event that pursing did not occur, landmarks 2 and 3 overlapped (B).

14
Table 2 Definitions and abbreviations for kinematic variables. Lateral variables include
non-pursing variables, pursing variables, and ram-suction index variables which were
measured from lateral perspective videos. Frontal variables were measured from frontal
perspective videos.
Kinematic variable Abbreviation Definition Lateral Kinematic Variables Maximum gape GAPE greatest distance of rostral tips of mandible and
maxilla Time to maximum gape tGAPE elapsed time from the onset of gape opening to
the frame of maximum gape Maximum gape angle GANG greatest angle from maxillary tip through the
actual corner of mouth to the mandibular tip Time to maximum gape angle tGANG elapsed time from the onset of gape opening to
the frame of maximum gape angle Maximum gape angle opening
velocity GAOV greatest angular rate of gape angle opening
Time to maximum gape angle opening velocity
tGAOV elapsed time from the onset of gape opening to the frame of maximum gape angle opening velocity
Maximum gape angle closing velocity
GACV greatest angular rate of gape angle closing
Time to maximum gape angle closing velocity
tGACV elapsed time from the onset of gape opening to the frame of maximum gape angle closing velocity
Maximum subject velocity Vsubj greatest rate of subject movement toward the prey
Time to maximum subject velocity
tVsubj elapsed time from the onset of gape opening to the frame of maximum subject velocity
Maximum prey velocity Vprey greatest rate of prey movement toward the subject
Time to maximum prey velocity tVprey elapsed time from the onset of gape opening to the frame of maximum prey velocity
Time to prey ingestion tING elapsed time from the onset of gape opening to the last frame that prey is visible in the subject's mouth
Time to prey movement tMVT elapsed time from the onset of gape opening to the first frame in which prey movement toward the subjects mouth is visible
Maximum hyolingual depression
GULD change in linear distance between the eye and hyoid from the first frame to the frame of maximal distance between the eye and hyoid
Time to maximum hyolingual depression
tGULD elapsed time from the onset of gape opening to the frame of maximum hyolingual depression
Total duration tDUR elapsed time from the onset of gape opening to the last frame of gape closing

15
Table 2 continued.
Kinematic variable Abbreviation Definition Percent occlusion OCC greatest distance from the vertex of the mouth
to most anterior extent of lateral gape occlusion, divided by the length of the rostrum from the vertex to the rostral tips, x 100; taken at the frame of first visible prey movement toward the subject
Maximum posterior velocity of the pursed corner of the mouth
Vpost greatest linear rate of posterior movement of the pursed corner of the mouth, corrected for subject velocity
Time to maximum posterior velocity of the pursed corner of the mouth
tVpost elapsed time from the onset of gape opening to the frame of maximum posterior velocity of the pursed corner of the mouth
Maximum anterior velocity of the pursed corner of the mouth
Vant greatest linear rate of anterior movement of the pursed corner of the mouth, corrected for subject velocity
Time to maximum anterior velocity of the pursed corner of the mouth
tVant elapsed time from the onset of gape opening to the frame of maximum anterior velocity of the pursed corner of the mouth
Suction distance Dprey net distance traveled by the food item Ram distance Dpredator net distance traveled by the subject RSI RSI Ram-Suction Index value Frontal Kinematic Variables Maximum gape GAPE maximum distance between maxillary and
mandibular rostral tips at the midsagittal plane Time to maximum gape tGAPE elapsed time from the onset of gape opening to
the frame of maximum gape Aperture width WIDTH horizontal distance between right and left
pursed corners of the mouth at the frame of maximum gape
Total duration tDUR elapsed time from the onset of gape opening to the last frame of gape closing

16
farthest from the subject (landmark 5) and the subject’s eye (landmark 6) were used to
extract x and y coordinates of the subject and the prey. Calculations were made at the
onset of the feeding event (see above) and the frame of prey capture, when the subject’s
lips came into contact with the prey. The change in position in the x and y direction of
both subject and prey were used to measure the net distance traveled by both predator
and prey and a RSI value was calculated for the trial. RSI values ranged from pure
suction (-1) to pure ram (+1). The mean RSI was calculated for each species.
To determine whether observed gape and gape angle during feeding
approximated maximum biological capability, digital photographs of an open mouth
behavior were taken using a Minolta Maxxum 5 digital camera (Konica Minolta, Tokyo,
Japan; Konica Minolta AF DT zoom 18-70 mm lens; 2256 x 1496 pixels; saved in TIFF
format). Subjects were photographed with a scale when cued by a trainer to open their
mouth, cued to vocalize, or when fed, all of which resulted in the subject opening its
mouth to its widest possible extent. Mean maximum gape and gape angle were
measured using Image J image analysis software (NIH, Bethesda, MD, USA) for five
photos of each subject, which were then compared to corresponding kinematic data to
determine what percentage of gape and gape angle were used during feeding trials.
To determine the degree of circularity of the oral aperture at the anterior lips,
additional feeding sequences were recorded from the frontal perspective. The frontal
perspective anatomical landmarks were: (1) center of the upper lip at the midsagittal
plane, (2) right corner of the mouth, (3) center of lower lip at the midsagittal plane, and
(4) left corner of the mouth (Fig. 3). Feeding events began with the first frame that the
linear velocity of the upper and lower lips increased from zero, and the mouth began to
open, and ended at the frame in which the linear velocity of the upper and lower lips
returned to zero, and the mouth closed. Four frontal kinematic variables were also
measured and are listed in Table 2. Area and circumference of the oral aperture at
maximum gape were measured using Image J. Gape and width at the frame of
maximum gape were used to calculate the ratio of vertical:horizontal diameter of the oral
aperture (aperture ratio), as a measure of aperture circularity.

17
Fig. 3 Frontal anatomical landmarks. Schematic depicts digitized landmarks and the
corresponding spatial models used in motion analysis for (A) belugas, (B) Pacific white-
sided dolphins, and (C) pilot whales. Drawings are scaled independently. Landmarks
include: (1) center of the upper lip at the midsagittal plane, (2) right corner of the mouth,
(3) center of lower lip at the midsagittal plane, and (4) left corner of the mouth.

18
2.3 Pressure generation capability
The same controlled feeding trials used to collect lateral kinematic data were also
used to measure the subambient and suprambient pressure generated by presumed
suction and ram feeding odontocetes. A pressure transducer (MPC 500 MikroTip
Pressure Catheter, Millar Instruments, Houston, TX, USA), modified to a length of 3 m,
was inserted through the prey item (Fig. 2) so that approximately 2 cm protruded from
the fish’s mouth. The transducer was connected to a control box (TCB 600, Millar
Instruments, Houston, TX, USA) and a portable electrophysiological recording system
(Biopac MP150 System, BIOPAC systems, Inc., Goleta, CA), which continuously
recorded and saved transducer output as volts (v) vs. time (s) at a sampling rate of 500
Hz (AcqKnowledge Software 3.9, BIOPAC systems, Inc., Goleta, CA, USA). To ensure
accurate conversion of volts to kPa of pressure, the transducer was calibrated in the lab.
It was inserted into a sealed flask and subambient pressure was decreased to -80 kPa
with a certified vacuum hand pump. Pressure was released in a controlled manner, and
readings from the transducer at several intervals were recorded. Known pressure
readings from the pump were regressed with corresponding transducer output to obtain a
transducer-specific conversion factor and ensure linearity. Transducer diameter was
minimal and the influence on water flow parameters was negligible. Acqknowledge 3.9
(BIOPAC systems, Inc., Goleta, CA, USA) was also used to analyze the data for
subambient and suprambient pressure spikes. The seven pressure variables measured,
their abbreviations, and definitions, are listed in Table 3.
2.4 Statistics
Statistical tests were performed using JMP 7.0.1 (SAS Institute, Inc., Cary, NC,
USA) to determine differences in kinematic and pressure profiles among species and to
determine correlation among variables. Normality was tested using a Shipiro-Wilks test,
and all lateral and frontal kinematic data were subsequently log-transformed and
standardized for comparison. An interspecific analysis of variance (ANOVA) was used
to test for species differences within each kinematic phase. Differences among

19
Table 3 Definitions and abbreviations for pressure generation variables.
Pressure change variable Abbreviation Definition Maximum subambient pressure Psub change in value from the baseline to the maximum
subambient pressure recorded during the event
Maximum supra-ambient pressure
Psupra change in value from the baseline to the maximum suprambient pressure recorded during the event
Expansive phase duration tEXP elapsed time from the start, when the pressure increases or decreases from the baseline, to the maximum pressure
Rate of expansive phase pressure change
PEXP maximum subambient or suprambient pressure divided by expansive phase duration
Compressive phase duration tCOMP elapsed time from the maximum subambient or suprambient pressure back to the baseline
Rate of compressive phase pressure change
PCOMP maximum subambient or suprambient pressure divided by compressive phase duration
Total duration tDUR elapsed time from the onset of rapid pressure change until the return to baseline

20
kinematic variables across prey types among species and within species were determined
with a multivariate analysis of variance (MANOVA) followed by an intraspecific
ANOVA for each species. An interspecific constrained ordination nested MANOVA
and a canonical centroid plot of least squares means tested for significant differences
among subjects nested within species for kinematic and pressure variables; tests for
lateral kinematics, frontal kinematics, and RSI were performed separately. In all cases,
post hoc tests on least squares means were used to determine in which species
differences occurred. Linear regression (with intercept constrained to zero) was
performed to determine two dimensional RSI isoclines. Differences among kinematic
and biological maximum gape capability were determined using student’s t-tests to
compare gape and gape angle calculated using both measurements. Correlation among
kinematic and pressure generation variables was determined for the transformed lateral
and frontal kinematic data, as well as pressure data, using a Pearson’s r test for
correlation.
2.5 Evolutionary analysis of feeding characters
Species mean data from this study, as well as kinematic data for pygmy and
dwarf sperm whales (Kogia spp.) and bottlenose dolphins (Tursiops truncatus,
Bloodworth and Marshall, 2005) and pressure data for a harbor porpoise (Phocoena
phocoena, Kastelein et al., 1997), were used to conduct a preliminary evolutionary
analysis of feeding in the suborder Odontoceti. Comparative data were available for:
GAPE, tGAPE, GANG, GAOV, Vprey, GULD, tGULD, Dprey, Dpredator, tDUR, RSI,
and Psub. In addition, several comparative morphological characters were analyzed to
increase Odontoceti ancestral state resolution and robustness. These included:
mandibular bluntness index ratios (MBI; Werth, 2006), tongue and hyoid morphometrics
(A. Werth, unpublished data), and maximum total tooth counts (Minasian et al., 1984).
Tongue ratios (width:length) and hyoid ratios (length:width; from the anterior tip of the
basihyal to the posterior tip of the thyrohyal, and from tip of the left to tip of the right
thyrohyal) were used to control for variation due to species size.

21
Mean values for each character were transformed into discrete character states by
simple gap coding (Riska, 1979; Thorpe, 1984; Archie, 1985). The difference between
subsequent ordered means (a gap) was calculated and compared to the pooled among-
species standard deviation times a constant of 1, and integers were assigned to groups of
means falling between gaps. To prevent the exclusion of data from the analysis, if gaps
were not found, the constant was decreased in increments of 0.1 until at least two
discrete character states were coded (Thorpe, 1984). Three discrete character states were
more biologically meaningful for RSI, tooth counts, and MBI. Therefore, these
characters were coded until 3 states were determined.
Discrete character states were mapped onto an accepted odontocete phylogeny
(Fig. 1) using Mesquite 2.5 (Maddison and Maddison, 2008). Ancestral states were
reconstructed using a one parameter Markov k-state maximum likelihood model
(Maddison and Maddison, 2006). The most likely hypothesis of odontocete ancestral
state was determined for each character, and a composite map of state changes was
determined. Equivocal ancestral states were reconstructed subjectively based on the
most common state present in extant taxa. If no most common state was found, the state
present in the most basal clade was assumed to be ancestral. The composite map was
then used to determine in which taxa changes in characters took place, and decipher
which characters were plesiomorphic, apomorphic, and synapomorphic within suborder
Odontoceti as well as within Families of odontocete taxa.

22
3. RESULTS
3.1 Kinematic analyses
Eleven hours of video were recorded to obtain over 1300 feeding trials. Of these,
89 were used for lateral kinematic analyses, 64 were used for RSI calculations, and 49
were used for frontal kinematic analyses. Overall, feeding events of odontocetes in this
study consisted of four phases: (I) preparatory, (II) jaw opening, (III) hyolingual
depression, and (IV) jaw closing. Phase I began at the onset of jaw opening and ended
when gape increased by greater than 0.2 cm/field and the jaws rapidly opened. Phase I
was observed in 32% of all trials and consisted of hyolingual adduction, small gape, and
slow gape angle opening velocity, as well as movement of the subject toward the prey.
Phase II overlapped with phases II and IV. It began when gape increased rapidly and
lasted until maximum gape. Phase III began when hyolingual depression increased by
greater than 0.2 cm/field and lasted until hyolingual depression returned to its original
position, or until the end of the feeding event. The longest duration in all species was
observed for phase III. Phase IV began at maximum gape and concluded when the jaws
closed and gape decreased by less than 0.2 cm/field.
Belugas, Pacific white-sided dolphins, and pilot whales differed in mean phase
durations. Mean durations of phases I, II, III, and IV for belugas were 0.205 ± 0.096 s,
0.214 ± 0.026 s, 0.425 ± 0.052 s, and 0.370 ± 0.053 s, respectively. Pacific white sided
dolphin phase durations were 0.038 ± 0.026 s, 0.102 ± 0.01 s, 0.196 ± 0.013 s, and 0.140
± 0.01, respectively. Pilot whale phase durations were 0.200 ± 0.038 s, 0.282 ± 0.025 s,
0.334 ± 0.024 s, and 0.241 ± 0.02 s, respectively. Duration of phase I was not
significantly different for any species (ANOVA, F=1.30, P=0.29). However, duration of
phase II (ANOVA, F=17.4, P<0.0001), phase III (ANOVA, F=11.4, P<0.0001), and
phase IV (ANOVA, F=11.5, P<0.0001) were significantly different. Phase II and III
durations were longer in belugas and pilot whales, and duration of phase IV was longer
in belugas than either other species (Fig. 4, post hoc tests, P<0.05). Total duration of
feeding events was short in Pacific white-sided dolphins (0.279 ± 0.02 s) and long in
belugas (0.684 ± 0.07) and pilot whales (0.583 ± 0.05 s).

23
A
A
A
0.0
0.1
0.2
0.3
0.4
0.5
0.6M
ean
dura
tion
of p
hase
I (s
)
B
C
A
0.0
0.1
0.2
0.3
0.4
0.5
0.6
Mea
n du
ratio
n of
pha
se II
(s)
A
B
A
0.0
0.2
0.4
0.6
Mea
n du
ratio
n of
pha
se II
I (s)
A
B
B
0.0
0.2
0.4
0.6
Mea
n du
ratio
n of
pha
se IV
(s)
Fig. 4 Kinematic phase mean (± SEM) durations. Different letters indicate significant
differences at P<0.05.
DL LO GM DL LO GM

24
3.1.1 Feeding behaviors
Analysis of 33 beluga feeding trials demonstrated that belugas were able to
capture prey by using suction, ram and a combination of both (combination: Figs. 5 and
6). During suction feeding events, belugas approached the prey at low velocity (mean:
49.2 ± 6.6 cm/s, maximum: 168.4 cm/s). When phase I was observed (31.2% of trials),
it occurred as the subject approached the prey (ram component), and included hyolingual
adduction and slow gape opening. Bubbles expelled from the lateral lip margins
indicated hydraulic jetting, which was supported by suprambient pressure recordings
(see below). Supination of the pectoral flippers (flares) reduced forward velocity to near
zero as subjects approached the prey. At this point, the lips were within one mouth
diameter (mean: 6.3 ± 0.6 cm) from the prey, and the jaws began to open more rapidly
than during Phase I (mean: 119.7 ± 8.1°/s, range: 60.3-234.3°/s). However, unlike other
odontocetes (Bloodworth and Marshall, 2005), the mobile lateral lips occluded lateral
gape (mean: 78.8 ± 2.9%) and the anterior lips were pursed, a behavior that resulted in a
small, circular oral aperture that coincided with maximum gape (see below). Hyolingual
depression overlapped with phase II and appeared to create subambient pressure and a
flow of water into the mouth, which was evidenced by movement of prey into the mouth.
This observation was also supported by direct pressure measurements (see below). Prey
moved into the mouth at a high velocity (suction component, mean: 219.1 ± 18.7 cm/s,
maximum: 555.4 cm/s) after maximum gape and before maximum hyolingual
depression. Rapid opening of the lateral lips was observed after prey capture, and
bubbles were again expelled from the entire length of the lateral lip margin, until the lips
rapidly returned to their resting position and the mouth was closed.
Ram feeding was also employed by belugas (6% of trials) to capture prey. Ram
kinematic events were similar to suction events, except for differences in velocity and
timing. No preparatory phase was observed for these trials. The subject approached the
prey at high velocity (maximum: 140 cm/s), which was maintained throughout the
feeding trial. Gape began to open when the subject was within one mouth diameter from

25
Fig. 5 Video frames from a representative beluga feeding trial. Frames were taken at the start of the sequence, the frame of
first visible prey movement, maximum gape, the last frame that the prey was visible in the mouth, maximum hyolingual
depression, and the end of the feeding trial. Anatomical landmarks are displayed as orange points and elapsed time of each
event is indicated.

26
0
3
6
9
GA
PE (c
m)
-1.5
0
1.5
3
GU
LD (c
m)
0
25
50
75
100
OC
C (%
)
-150
-75
0
75
150
GA
OV
/GA
CV
(deg
/s)
-400
-200
0
200
400
0 20 40 60 80 100Elapsed time (% of total duration)
Vpo
st/V
ant (
deg/
s)
Fig. 6 Lateral kinematic profile of selected variables for a representative beluga feeding
trial (Fig. 5). Elapsed time is scaled to percent of total duration. A gray vertical line
represents maximum gape.

27
the prey (mean: 6.3 ± 0.6 cm) and was more rapid than during suction trials (maximum
GAOV: 234.3°/s, maximum GACV: 293.8°/s). However, occlusion of the lateral lips
and pursing of the anterior lips was also observed in ram feeding trials and indicated a
combined use of suction and ram. Maximum gape occurred as the prey item was
captured, followed by maximum hyolingual depression. The lateral lips opened directly
after maximum gape and the jaws began to close. The prey item was fully ingested
when the lateral lips returned to their resting position. Mean total duration of ram
feeding events (mean: 0.342 ± 0.03 s) was shorter than suction feeding events (mean:
0.684 ± 0.07 s).
Analysis of 31 Pacific white-sided dolphin lateral feeding trials demonstrated
that this species captured prey using ram, and a small degree of suction (Figs. 7 and 8).
Ram feeding was characterized by high approach velocity (mean: 81.5 ± 8.5 cm/s,
maximum: 218.5 cm/s). A preparatory phase occurred in 45% of trials but no hyolingual
adduction was observed. During phase I, the jaws opened slowly and Pacific white-
sided dolphins maneuvered so the prey was oriented head-first for ingestion. After
orientation, the jaws began to open rapidly (mean: 248.4 ± 22.1°/s, maximum: 713.0°/s).
As the jaws opened, Pacific white-sided dolphins slightly pursed their anterior lips, and
prey was observed to move toward the mouth. At this time, lateral gape occlusion was
approximately 50% of total jaw length, and gape was approximately 75% of the
maximum. Rapid jaw and lateral lip movement appeared to create a slight flow of water
into the mouth that resulted in some movement of the prey toward the mouth (mean:
89.3 cm/s). Hyolingual depression was clearly visible in Pacific white-sided dolphins,
and overlapped with phase II as gape opened and prey began to move into the mouth.
An oral aperture at the anterior lips was not as clearly defined for Pacific white-sided
dolphins as that observed in belugas. Maximum gape was followed by maximum
hyolingual depression (mean: 3.4 ± 0.3 cm), maximum prey velocity (range: 9.6-298.0
cm/s), and fully opened lateral lips. High prey velocity was observed in some trials and
indicated that some degree of suction may have been used to ingest prey. Some suction
capability was also confirmed with direct pressure recordings (see below). After prey

28
Fig. 7 Video frames from a representative Pacific white-sided dolphin feeding trial. Frames were taken at the start of the
sequence, the frame of first visible prey movement, maximum gape, the last frame that the prey was visible in the mouth,
maximum hyolingual depression, and the end of the feeding event. Anatomical landmarks are displayed as orange points and
elapsed time of each event is indicated.

29
0
1
2
3
4
GA
PE (c
m)
0
1
2
3
GU
LD (c
m)
0
25
50
75
100
OC
C (%
)
-150
-75
0
75
150
GA
OV
/GA
CV
(deg
/s)
-400
-200
0
200
400
0 20 40 60 80 100Elapsed time (% of total duration)
Vpo
st/V
ant (
deg/
s)
Fig. 8 Lateral kinematic profile of selected variables for a representative Pacific white-
sided dolphin feeding trial (Fig. 7). Elapsed time is scaled to percent of total duration.
A gray vertical line represents maximum gape.

30
moved into the mouth, the jaws closed rapidly (mean: 226.0 ± 26.0°/s, maximum:
690.1°/s) and the hyolingual apparatus returned to its resting position. In some trials, the
hyolingual apparatus was adducted farther during phase IV than its starting position
during phase II. Once the anterior tips of the jaws were within a few centimeters of each
other, water was expelled from the lateral margins of the mouth. The lateral lips did not
return to their resting position until after this time. The entire feeding sequence was
more rapid (mean: 0.279 ± 0.02 s, range: 0.116-0.600 s) than in the other species.
Fifteen lateral kinematic pilot whale trials were analyzed and demonstrated that
pilot whales captured prey with a mixture of ram and suction feeding modes (Figs. 9 and
10). When phase I was observed (16% of trials), hyolingual abduction was followed by
hyolingual adduction. Also during this phase, bubbles were expelled from the lateral lip
margins and gape slowly increased. Hydraulic jetting capability was confirmed with
direct pressure measurements (see below). Pilot whales approached prey at a high
velocity (mean: 85.5 ± 8.5 cm/s, range: 41.8-121.3 cm/s). In some trials, pectoral fin
flares were used to reduce velocity (but not stop) as the prey was approached. The jaws
opened slowly (mean: 107.5 ± 7.6°/s, range: 60.6-162.2°/s) at the onset of phase II and
lateral gape opened synchronously. Hyolingual depression began after jaw opening and
appeared to generate a flow of water that drew the prey toward the mouth. At this time,
the lateral lips occluded lateral gape by more than 50% of the total jaw length (63.6 ±
2.8%, range: 34.2-81.7%). Lateral gape occlusion reached its minimum at maximum
gape and the lateral lips never opened along the entire margin of the jaw. Proximity of
the upper and lower jaws likely contributed to lateral lip occlusion. Anterior lip pursing
and an anterior oral aperture were not observed. Maximum hyolingual depression
(mean: 2.674 ± 0.4 cm) occurred after maximum gape (during phase IV) was concurrent
with rapid prey movement into the mouth (mean: 114.5 ± 23.6 cm/s, maximum: 324.9
cm/s). Some suction generation was indicated by rapid prey velocity and was confirmed
with direct pressure measurements (see below). After maximum gape, water was
expelled from the lateral lip margins as the jaws closed. Duration of feeding events was
relatively slow (mean: 0.583 ± 0.1 s).

31
Fig. 9 Video frames from a representative pilot whale feeding trial. Frames were taken at the start of the sequence, the frame
of first visible prey movement, maximum gape, maximum hyolingual depression, the last frame that the prey was visible in the
mouth, and the end of the feeding event. Anatomical landmarks are displayed as orange points and elapsed time of each event
is indicated.

32
0
3
6
9
12G
APE
(cm
)
-3
-1.5
0
1.5
3
GU
LD (c
m)
50
60
7080
90
100
OC
C (%
)
-150
-75
0
75
150
GA
OV
/GA
CV
(deg
/s)
-150
-75
0
75
150
0 20 40 60 80 100Elapsed time (% of total duration)
Vpo
st/V
ant (
deg/
s)
Fig. 10 Lateral kinematic profile of selected variables for a representative pilot whale
feeding trial (Fig. 9). Elapsed time is scaled to percent of total duration. A gray vertical
line represents maximum gape.

33
3.1.2 Lateral kinematic analyses
At the time of video collection, 10 randomly chosen prey of each prey type were
measured to determine mean prey length (herring: 24.2 ± 2.78 cm, capelin: 14.5 ± 1.16
cm, mackerel: 23.1 ± 0.843 cm, squid: 20.7 ± 2.28 cm). Belugas fed primarily on
herring for 87.9% of trials and on capelin for the rest. Pacific white-sided dolphins fed
on capelin for 90.3% of trials and on herring for the remainder. Pilot whales fed on
herring for 40% of trials, mackerel for 20% of trials, and squid for the remaining 40% of
trials. No significant differences in kinematic variables were found for prey types
among odontocete species (MANOVA, Wilks’ lambda, F=1.19, P=0.19) or within
species (ANOVA, beluga: F=1.77, P=0.19, Pacific white-sided dolphins: F=1.18,
P=0.43, pilot whales: MANOVA, Wilks’ Lambda, F=2.17, P=0.37). However, for
consistency among fish prey types, pilot whale trials that utilized squid prey were
excluded from analyses.
Twenty-three lateral kinematic variables were analyzed from each beluga, Pacific
white-sided dolphin, and pilot whale feeding trial (Table 4). Species differed from each
other in most lateral kinematics (Figs. 11 and 12, MANOVA, Wilks’ Lambda, F=2.18,
P<0.0001). Post hoc tests on least squares means demonstrated that overall, belugas and
pilot whales were more similar in their kinematic profile than Pacific white-sided
dolphins were to either of the two other species (post hoc tests, P<0.05). Maximum
gape, maximum gape angle, maximum hyolingual depression, and maximum posterior
opening velocity of the laterally occluded lips, were not significantly different among
species. Gape angle velocity was greater for Pacific white sided dolphins than either
belugas or pilot whales. Belugas exhibited the greatest maximum anterior closing
velocity of the laterally occluded lips, the greatest prey velocity, and the greatest percent
of lateral gape occlusion at the time of initial prey movement. For these same variables,
pilot whales were not significantly different than either belugas or Pacific white-sided
dolphins. Subject velocity was similar for Pacific white-sided dolphins and pilot whales,
and both species approached prey at significantly higher velocities than belugas. No
species difference in time to maximum gape angle opening velocity or time to maximum

34
Table 4 Mean values ± SEM for lateral kinematic variables.
Variables DL LO GM GAPE (cm) 6.346 ± 0.356 6.451 ± 0.462 8.997 ± 0.56 tGAPE (s) 0.277 ± 0.038 0.140 ± 0.016 0.327 ± 0.046 GANG (°) 16.381 ± 0.811 16.812 ± 1.239 15.878 ± 1.003 tGANG (s) 0.300 ± 0.038 0.139 ± 0.016 0.316 ± 0.039 GAOV (°/s) 119.715 ± 8.079 248.383 ± 22.062 107.473 ± 7.612 tGAOV (s) 0.175 ± 0.039 0.092 ± 0.013 0.212 ± 0.033 GACV (°/s) 115.225 ± 8.863 226.019 ± 26.033 85.868 ± 5.856 tGACV (s) 0.387 ± 0.04 0.179 ± 0.017 0.422 ± 0.046 Vpost (cm/s) 256.481 ± 28.422 175.115 ± 11.903 149.378 ± 21.576 tVpost (s) 0.370 ± 0.045 0.095 ± 0.015 0.220 ± 0.028 Vant (cm/s) 166.270 ± 20.025 92.320 ± 13.288 122.483 ± 14.192 tVant (s) 0.491 ± 0.057 0.248 ± 0.021 0.459 ± 0.051 Vpred (cm/s) 49.164 ± 6.585 81.466 ± 8.507 85.522 ± 5.65 tVpred (s) 0.234 ± 0.049 0.160 ± 0.019 0.241 ± 0.031 Vprey (cm/s) 219.064 ± 18.737 89.295 ± 14.539 114.471 ± 23.59 tVprey (s) 0.339 ± 0.117 0.149 ± 0.021 0.320 ± 0.037 OCC (%) 78.764 ± 2.877 41.103 ± 4.465 63.587 ± 2.787 tMVT (s) 0.254 ± 0.049 0.104 ± 0.014 0.189 ± 0.029 GULD (cm) 2.675 ± 0.240 3.377 ± 0.317 2.674 ± 0.364 tGULD (s) 0.400 ± 0.05 0.186 ± 0.019 0.430 ± 0.056 tING (s) 0.377 ± 0.049 0.189 ± 0.018 0.422 ± 0.057 tDUR (s) 0.684 ± 0.07 0.279 ± 0.02 0.583 ± 0.053

35
A A
A
0
3
6
9
12G
APE
(cm
) A A A
0
5
10
15
20
25
GA
NG
(deg
rees
)
AA
A
0
1
2
3
4
5
GU
LD (c
m)
B
A
B
0
100
200
300
400
GA
OV
(deg
rees
/s)
B
A
B
0
100
200
300
400
GA
CV
(deg
rees
/s)
A
A A
0
100
200
300
400
Vpo
st (c
m/s
)
A
BAB
0
100
200
300
400V
ant (
cm/s
)
BA A
0
100
200
300
Vsu
bjec
t (cm
/s)
A
BAB
0
100
200
300
Vpr
ey (c
m/s
)
A
B
AB
0
25
50
75
100
OC
C (%
)
Fig. 11 Mean values ± SEM of lateral kinematic magnitude variables. Different letters indicate significant differences at the
P<0.05 level.
DL LO GM DL LO GM DL LO GM DL LO GM DL LO GM

36
AB
A
0.00.20.4
0.60.81.0
tGA
PE (s
)
A
B
A
0.00.20.40.60.81.0
tGA
NG
(s)
A
B
A
0.00.20.40.60.81.0
tGU
LD (s
)
AA
A
0.00.20.40.60.81.0
tGA
OV
(s)
A
B
A
0.00.20.4
0.60.81.0
tGA
CV
(s)
A
BAB
0.00.20.40.60.81.0
tVpo
st (s
) A
B
A
0.00.20.40.60.81.0
tVan
t (s)
AA
A
0.00.20.40.60.81.0
tVsu
bjec
t (s)
A
BA
0.00.20.40.60.81.0
tVpr
ey (s
)
A
BAB
0.00.20.40.60.81.0
tMV
T (s
)
A
B
A
0.00.20.4
0.60.81.0
tING
(s)
A
B
A
0.00.20.4
0.60.81.0
tDU
R (s
)
Fig. 12 Mean values ± SEM of lateral kinematic timing variables. Different letters indicate significant differences at the
P<0.05 level.
DL LO GM DL LO GM DL LO GM DL LO GM

37
subject velocity was found. For all remaining timing variables, belugas and pilot whales
were similar, and significantly longer in duration than for Pacific white-sided dolphins.
Pilot whales were not significantly different than belugas or Pacific white-sided dolphins
for time to maximum posterior lateral occlusion velocity and time to initial movement of
prey. Least squares means were also used to construct a canonical centroid plot for
beluga, Pacific white-sided dolphin, and pilot whale feeding kinematics (Fig. 13).
Variables GAOV, GACV, and tVant loaded strongly onto canonical axis one; variables
GAPE, GANG, and tVpost loaded strongly onto canonical axis two. Together, these
axes explained 94.3% of the variance among species. An overlap of more than 50%
indicated that means (represented by centroids) were similar. Species means did not
overlap and indicated a significant difference among all three species. Six out of 7
Pacific white-sided dolphin individuals overlapped (four with each other and two with
each other) and suggested that individuals generally did not vary in lateral kinematics.
Belugas were highly variable (3 out of 7 individuals overlapped by more than 50%) and
suggested that complete feeding repertoire of belugas was not fully captured. Only two
pilot whales were used in this study, and these individuals were also highly variable.
Coordination of kinematic sequence and timing is critical for maximum suction
generation in teleosts (Holzman et al., 2007). Similar coordination was also observed in
all species in this study (Fig. 14). Although the magnitude of kinematic variables
differed substantially, the kinematic sequence was conserved: gape and angular velocity
increased, maximum gape and gape angle occurred simultaneously, prey reached its
maximum velocity toward the subject as hyolingual depression reached its maximum,
prey was ingested, and the gape rapidly closed. A posteriorly directed “wave of buccal
expansion” was observed in all species, beginning as the anterior jaws opened and
progressed posteriorly through hyolingual depression.
Significant correlation was observed in 49.8% of possible combinations of lateral
kinematic variables pooled across belugas, Pacific white-sided dolphins, and pilot
whales (Table 5, Pearson r correlation, P<0.05). For all variables, at least one
correlation was significant. All timing variables were significantly correlated to each

38
-6
-5
-4
-3
-2
-1
0
1
2
3
4
5
6
7
Can
onic
al a
xis 1
Grand
DL
LO
GM
[DL]1
[DL]2
[DL]3[DL]4
[DL]5
[DL]6
[DL]7
[LO]8
[LO]9
[LO]10
[LO]11[LO]12
[LO]13
[LO]14
[GM]15[GM]16
-5 -4 -3 -2 -1 0 1 2 3 4 5 6Canonical axis 2
Fig. 13 Canonical centroid plot of lateral kinematic variables. Canonical scores for each
trial were plotted (belugas: circles, Pacific white-sided dolphins: squares, pilot whales:
triangles). Centroids were also plotted for each species (red) and individual (blue).
Species and individual codes are marked for each centroid and follow Table 1.

39
other. Gape, gape angle, and gape angle velocities were positively correlated to each
other, and faster velocities occurred when feeding events were shorter. Lateral gape
occlusion was greater and hyolingual depression was shorter when subject velocity was
slower. Similarly, prey velocity was greater when lateral occlusion was greater.
Hyolingual depression was positively correlated to gape angle opening velocity and
subject velocity.
In all species, maximum gape and gape angle measured kinematically were
significantly less than maximum gape and gape angle measured from still photos of a
maximum gape behavior (referred to as biological maxima herein, t-tests, P<0.0001).
Maximum biological gape was 17.0 ± 0.59 cm for belugas, 10.5 ± 0.50 cm for Pacific
white-sided dolphins, and 19.3 ± 0.62 cm for pilot whales. Kinematic gape was 37.7%
of maximum biological gape for belugas, 61.2% for Pacific white-sided dolphins, and
46.7% for pilot whales. Similarly, kinematic gape angle was 39.8%, 67.9%, and 47.3%
of biological maximum gape angle for belugas, Pacific white-sided dolphins, and pilot
whales, respectively.
Ram-suction index (RSI) was calculated for lateral trials in which the prey was
not held by a trainer (free-floating), and resulted in a total of 20 trials each for belugas
and Pacific white-sided dolphins, and 24 trials for pilot whales (Fig. 15). Squid-fed
trials were included in pilot whale RSI analysis. All species displayed mean ram
distances (belugas: 8.5 ± 1.5 cm, Pacific white-sided dolphins: 7.0 ± 0.9 cm, pilot
whales: 8.7 ± 1.1 cm) that were greater than suction distances (belugas: 3.9 ± 0.6 cm,
Pacific white-sided dolphins: 2.6 ± 0.3 cm, pilot whales: 4.9 ± 0.5 cm). These distances
resulted in RSI values that were positive overall (belugas: 0.32 ± 0.07 cm, Pacific white-
sided dolphins: 0.43 ± 0.05 cm, pilot whales: 0.26 ± 0.04 cm). Maximum suction
distance for each species (belugas: 8.96, Pacific white-sided dolphins: 6.01, pilot whales:
9.04) was less than one mouth diameter, and the range of ram distances varied (belugas:
0.9-25.6 cm, Pacific white-sided dolphins: 1.8-16.9 cm, pilot whales: 1.8-19.0 cm).

40
Van
t
GA
CV
GU
LDING
Vpo
st
Vpr
eyG
AN
GG
APE
Vsu
bjec
tM
VT
GA
OV
END
STA
RT
Van
t
ING
GU
LD
GA
CV
Vsu
bjec
t
Vpr
eyG
AN
G/G
APE
MV
T
GA
OV
Vpo
st
END
STA
RT
END
Van
tG
ULD
GA
CV
ING
Vpr
ey
GA
NG
/GA
PE
Vsu
bjec
t
GA
OV
Vpo
st
MV
T
STA
RT
0 20 40 60 80 100
Elapsed time (% of total duration)
DL
LO
GM
Fig. 14 Timeline of kinematic events. Abbreviations follow Table 2. Time of maximum gape is colored according to species;
belugas (DL) are blue, Pacific white-sided dolphins (LO) are red, and pilot whales (GM) are green. Markers represent mean
percent of total duration for each kinematic variable within each species.

41
Table 5 Pearson correlation among lateral kinematic variables. Bold indicates significance at the P<0.05 level.
Variable GAPE tGAPE GANG tGANG GAOV tGAOV GACV tGACV Vpost tVpost Vant tVant GAPE 0.118 0.820 0.078 0.313 0.060 0.287 0.001 0.173 -0.041 0.090 0.116 tGAPE 0.118 0.050 0.975 -0.460 0.884 -0.258 0.895 -0.113 0.706 0.082 0.781 GANG 0.820 0.050 0.036 0.535 0.029 0.555 -0.088 0.229 -0.019 0.086 0.088 tGANG 0.078 0.975 0.036 -0.490 0.871 -0.269 0.925 -0.078 0.789 0.153 0.802 GAOV 0.313 -0.460 0.535 -0.490 -0.316 0.837 -0.570 0.026 -0.514 -0.288 -0.444 tGAOV 0.060 0.884 0.029 0.871 -0.316 -0.168 0.801 -0.143 0.638 -0.037 0.650 GACV 0.287 -0.258 0.555 -0.269 0.837 -0.168 -0.385 -0.052 -0.325 -0.093 -0.293 tGACV 0.001 0.895 -0.088 0.925 -0.570 0.801 -0.385 -0.112 0.783 0.198 0.764 Vpost 0.173 -0.113 0.229 -0.078 0.026 -0.143 -0.052 -0.112 0.178 0.180 0.155 tVpost -0.041 0.706 -0.019 0.789 -0.514 0.638 -0.325 0.783 0.178 0.338 0.799 Vant 0.090 0.082 0.086 0.153 -0.288 -0.037 -0.093 0.198 0.180 0.338 0.257 tVant 0.116 0.781 0.088 0.802 -0.444 0.650 -0.293 0.764 0.155 0.799 0.257 Vsubj 0.107 -0.159 -0.077 -0.175 0.168 -0.154 0.040 -0.183 0.056 -0.237 -0.022 -0.138 tVsubj 0.111 0.553 0.114 0.573 -0.080 0.587 0.085 0.528 -0.102 0.410 0.083 0.409 Vprey 0.005 -0.013 0.042 0.038 -0.125 0.025 -0.072 0.036 0.154 0.325 0.275 0.107 tVprey 0.030 0.850 0.013 0.891 -0.434 0.790 -0.256 0.837 -0.069 0.777 0.194 0.783 OCC -0.129 0.223 -0.184 0.268 -0.421 0.231 -0.421 0.334 -0.065 0.441 0.149 0.207 tMVT -0.079 0.818 -0.031 0.865 -0.391 0.806 -0.185 0.757 -0.051 0.762 0.135 0.734 tING 0.112 0.886 0.059 0.913 -0.426 0.781 -0.267 0.870 -0.089 0.757 0.169 0.807 GULD 0.062 0.049 0.149 0.020 0.247 0.010 0.190 -0.052 0.092 -0.036 -0.161 0.058 tGULD 0.013 0.831 -0.047 0.847 -0.473 0.776 -0.308 0.827 -0.100 0.757 0.100 0.801 tDUR 0.034 0.732 0.024 0.799 -0.614 0.594 -0.411 0.787 0.131 0.862 0.388 0.881
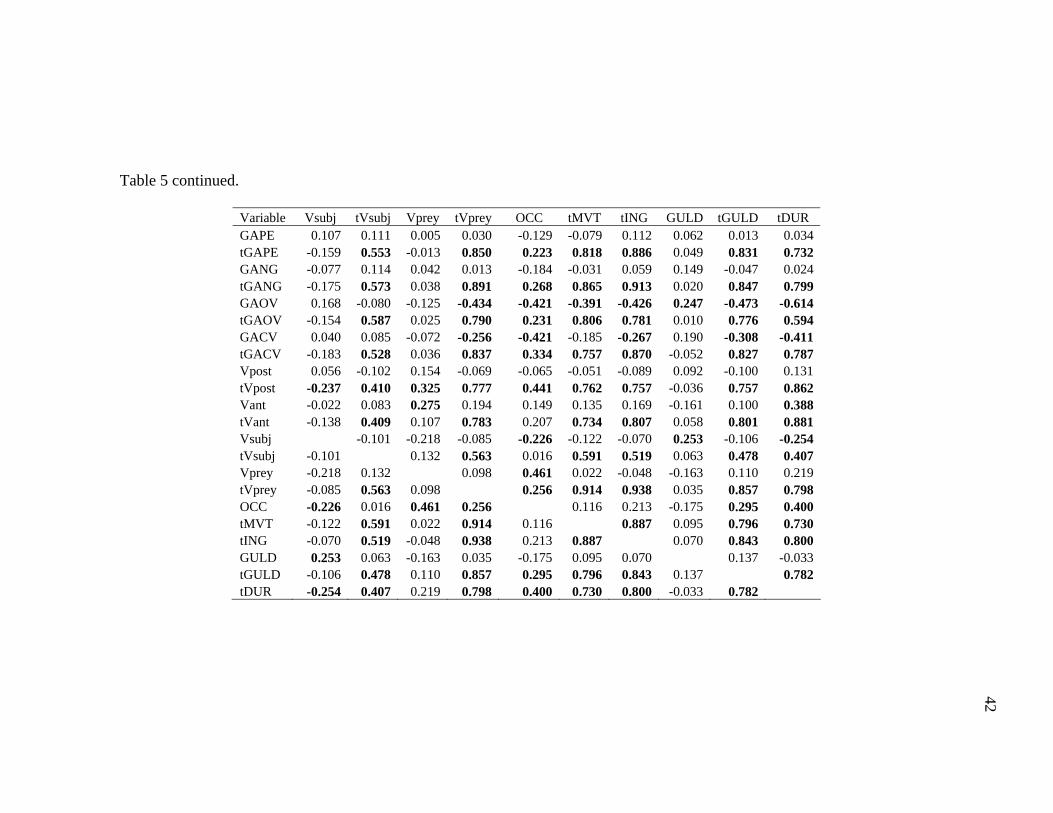
42
Table 5 continued.
Variable Vsubj tVsubj Vprey tVprey OCC tMVT tING GULD tGULD tDUR GAPE 0.107 0.111 0.005 0.030 -0.129 -0.079 0.112 0.062 0.013 0.034 tGAPE -0.159 0.553 -0.013 0.850 0.223 0.818 0.886 0.049 0.831 0.732 GANG -0.077 0.114 0.042 0.013 -0.184 -0.031 0.059 0.149 -0.047 0.024 tGANG -0.175 0.573 0.038 0.891 0.268 0.865 0.913 0.020 0.847 0.799 GAOV 0.168 -0.080 -0.125 -0.434 -0.421 -0.391 -0.426 0.247 -0.473 -0.614 tGAOV -0.154 0.587 0.025 0.790 0.231 0.806 0.781 0.010 0.776 0.594 GACV 0.040 0.085 -0.072 -0.256 -0.421 -0.185 -0.267 0.190 -0.308 -0.411 tGACV -0.183 0.528 0.036 0.837 0.334 0.757 0.870 -0.052 0.827 0.787 Vpost 0.056 -0.102 0.154 -0.069 -0.065 -0.051 -0.089 0.092 -0.100 0.131 tVpost -0.237 0.410 0.325 0.777 0.441 0.762 0.757 -0.036 0.757 0.862 Vant -0.022 0.083 0.275 0.194 0.149 0.135 0.169 -0.161 0.100 0.388 tVant -0.138 0.409 0.107 0.783 0.207 0.734 0.807 0.058 0.801 0.881 Vsubj -0.101 -0.218 -0.085 -0.226 -0.122 -0.070 0.253 -0.106 -0.254 tVsubj -0.101 0.132 0.563 0.016 0.591 0.519 0.063 0.478 0.407 Vprey -0.218 0.132 0.098 0.461 0.022 -0.048 -0.163 0.110 0.219 tVprey -0.085 0.563 0.098 0.256 0.914 0.938 0.035 0.857 0.798 OCC -0.226 0.016 0.461 0.256 0.116 0.213 -0.175 0.295 0.400 tMVT -0.122 0.591 0.022 0.914 0.116 0.887 0.095 0.796 0.730 tING -0.070 0.519 -0.048 0.938 0.213 0.887 0.070 0.843 0.800 GULD 0.253 0.063 -0.163 0.035 -0.175 0.095 0.070 0.137 -0.033 tGULD -0.106 0.478 0.110 0.857 0.295 0.796 0.843 0.137 0.782 tDUR -0.254 0.407 0.219 0.798 0.400 0.730 0.800 -0.033 0.782

43
Significant differences in mean RSI variables were found among species
(MANOVA, Wilks’ Lambda, F=1.7, P=0.013). Pacific white-sided dolphin RSI was
significantly greater than pilot whale RSI, and beluga RSI was not significantly different
from either species (post hoc tests, P<0.05). The greatest mouth diameter was observed
for pilot whales and may have led to greater suction distances and lower RSI values (Fig.
16). Suction distance of belugas was intermediate to pilot whales and Pacific white-
sided dolphins, but was not significantly different. Pacific white-sided dolphin suction
distance was significantly less than pilot whales (post hoc tests, P<0.05). No significant
differences were found for ram distance among all species (post hoc tests, P>0.05).
3.1.3 Frontal kinematic analyses
Four kinematic variables were measured from 49 frontal perspective feeding
events. Additionally, oral aperture ratio, area, and perimeter were calculated from
frames of maximum gape for each trial (Fig. 17). Lateral lip occlusion of gape could be
observed from the frontal perspective due to the extent to which this behavior is
performed in belugas. This occlusion allowed an oral aperture to form and dictated its
size and shape.
A circular anterior oral aperture formed consistently at maximum gape for
belugas, unlike for the other odontocetes (Table 6, Fig. 18). Aperture formation by
Pacific white-sided dolphins and pilot whales differed considerably from belugas
(MANOVA, Wilks’ Lambda, F= 2.28, P<0.0001). Aperture area and perimeter were
greatest for pilot whales, and were not significantly different between Pacific white-
sided dolphins and belugas (post hoc tests, P>0.05). The variables with the greatest
difference among species were aperture width and aperture ratio (post hoc tests, P<0.05).
In belugas, aperture ratio was closest to one and aperture width was the smallest of all
three species; pilot whales exhibited the lowest aperture ratios and the greatest aperture
widths. Mean maximum gape was similar across all species (post hoc tests, P>0.05).
Therefore, variance in aperture shape (ratio, area, and perimeter) was due to differences
in aperture width that reflected differences in pursing ability.

44
0
2
4
6
8
-1
-0.9
-0.8
-0.7
-0.6
-0.5
-0.4
-0.3
-0.2
-0.1 0
0.1
0.2
0.3
0.4
0.5
0.6
0.7
0.8
0.9 1
RSI
Freq
uenc
yDL LO GM
0.319
0.2630.432
Fig. 15 Histogram of Ram-Suction Index (RSI) values. Gray shading indicates 0 RSI;
negative values indicate suction and positive values indicate ram feeding modes.
Arrows and values indicate means and are color coded for species.

45
0
5
10
15
20
0 5 10 15 20
0
5
10
15
20
0 5 10 15 20
Ram
dis
tanc
e (c
m)
0
5
10
15
20
0 5 10 15 20
Suction distance (cm)
Fig. 16 Ram and suction distances in two dimensional kinematic space. A black solid
line indicates the 0 RSI isocline; points above the line represent ram feeding and points
below the line represent suction feeding RSI values calculated for each trial. Mean RSI
was plotted as an isocline (dashed lines) and are color-coded by species (belugas: blue,
Pacific white-sided dolphins: red, pilot whales: green).

46
(A)
(B)
(C)
Fig. 17 Oral apertures at maximum gape. Representative still frames of maximum gape
were extracted from frontal perspective videos for (A) a beluga, (B) a Pacific white-
sided dolphin, and (C) a pilot whale. Points indicate anatomical landmarks used in the
analysis. Belugas exhibited a distinctive circular aperture.

47
Belugas and Pacific white-sided dolphins achieved aperture ratios of one or
greater (circular to tall and narrow), while pilot whales did not (Fig. 19). More than half
(56.3%) of beluga frontal perspective trials resulted in aperture ratios greater or equal to
one. In contrast, Pacific white-sided dolphins achieved ratios of one or greater for only
21.7% of trials. Aperture ratios less than one were more common for Pacific white-
sided dolphins (78.3% of trials), and were more representative of the typical aperture
shape. The narrow range of aperture ratios for pilot whales (0.27 to 0.55) suggests a
stereotyped aperture shape, whereas the wide range observed in belugas (0.63 to 1.77)
indicates a tighter control over aperture shape than the other two species.
For frontal kinematic variables, 47.6% of correlations were significant (Table 7,
Pearson r correlation, P<0.05). Timing variables (time to maximum gape and feeding
event duration) were correlated only with each other (0.68). Aperture area and perimeter
were calculated variables and both increased when oral aperture gape and width
increased; width increased with increased gape. Aperture ratios were greater when
width was smaller and indicates that variation among aperture ratios in belugas, Pacific
white-sided dolphins, and pilot whales is dependent on variation in aperture width.
3.2 Intraoral pressure generation
Maximum subambient (suction) and suprambient (hydraulic jetting) pressure
peaks were analyzed for 368 pressure profiles. Suction profiles occurred more
frequently than those for hydraulic jetting (belugas: 87% of traces, n=186, Pacific white-
sided dolphins: 56% of traces, n=89, pilot whales: 89% of traces, n=93). When
subambient and suprambient pressure were observed within the same feeding trial, both
were analyzed. Some degree of subambient and suprambient pressure generation was
observed in all species (Fig. 20). Belugas generated strong subambient pressure changes
(maximum: -122.0 kPa) with fast expansive and compressive rates (mean PEXP:
18,243.9 kPa/s , mean PCOMP: 9,122.8 kPa/s) and a longer total duration (mean: 0.362
± 0.01 s, Table 8, Fig. 21). Hydraulic jetting in belugas resulted in a similar profile
except that mean duration was shorter (mean: 0.110 ± 0.03 s, Table 8, Fig. 22).

48
Table 6 Mean values ± SEM for frontal kinematic variables.
DL LO GM GAPE (cm) 7.732 ± 0.495 8.275 ± 0.61 8.012 ± 2.28 tGAPE (s) 0.260 ± 0.023 0.169 ± 0.025 0.225 ± 0.155 WIDTH (cm) 7.535 ± 0.395 11.321 ± 0.575 21.313 ± 6.542 tDUR (s) 0.548 ± 0.077 0.392 ± 0.049 0.421 ± 0.205 aperture ratio 1.046 ± 0.072 0.736 ± 0.047 0.385 ± 0.074 aperture area (cm2) 42.150 ± 4.449 57.250 ± 6.46 102.960 ± 50.621 aperture perimeter (cm) 24.187 ± 1.273 31.382 ± 1.754 48.678 ± 13.839

49
A A A
0
3
6
9
12G
APE
(cm
)
A
B
AB
0.0
0.1
0.2
0.3
0.4
tGA
PE (s
)
CB
A
0
10
20
30
WID
TH (c
m)
A
AA
0.0
0.2
0.4
0.6
0.8
tDU
R (s
)
A
B
C
0.0
0.5
1.0
1.5
Ape
rture
ratio
BB
A
0
25
50
75
100
125
150A
pertu
re a
rea
(cm
2 )
BB
A
0
15
30
45
60
75
Ape
rture
per
imet
er (c
m)
Fig. 18 Mean values ± SEM of frontal kinematic variables. Different letters indicate significant differences at the P<0.05
level.
DL LO GM DL LO GM DL LO GM
DL LO GM

50
0
3
6
9
12
0
0.5 1
1.5 2
Pursing ratio
Freq
uenc
y
DL LO GM
1.046
0.736
0.385
Fig. 19 Histogram of oral aperture ratios. Gray shading indicates a ratio of one; values
less than one indicate horizontally elongated and values greater than one indicate
vertically elongated aperture shapes. Arrows and values indicate means and are color
coded for species.

51
Table 7 Pearson correlation among frontal kinematic variables. Bold indicates
significance at the P<0.05 level.
Variable GAPE tGAPE WIDTH tDUR aperture ratio area perimeter GAPE 0.16 0.37 0.21 0.35 0.76 0.607 tGAPE 0.16 0.01 0.68 0.10 0.19 0.0676 WIDTH 0.37 0.01 -0.02 -0.74 0.79 0.9157 tDUR 0.21 0.68 -0.02 0.17 0.17 0.0829 aperture ratio 0.35 0.10 -0.74 0.17 -0.25 -0.4838 area 0.76 0.19 0.79 0.17 -0.25 0.9429 perimeter 0.607 0.0676 0.9157 0.0829 -0.4838 0.9429

52
Pacific white-sided dolphins generated less subambient pressure than belugas
(maximum: -27.1 kPa). Placement of the transducer was confirmed from video, and
indicated that pressure generation resulted from subject feeding behavior and was not a
bow wave. The rate of pressure change was slow (maximum PEXP: 2,569.8 kPa/s,
maximum PCOMP: 4,889.7 kPa/s) and suction events were short (mean: 0.100 ± 0.01 s).
Hydraulic jetting in Pacific white-sided dolphins produced pressure changes of a greater
magnitude than suction (maximum: 100.1 kPa). Pressure change rates were much less
during the expansive phase (maximum PEXP: 5,265.4 kPa/s, maximum PCOMP:
17,601.4 kPa/s) and duration was rapid (mean: 0.073 ± 0.01 s).
Subambient pressure generation was low in pilot whales (maximum: -19.6 kPa)
and was reflected in low rates of pressure change (maximum PEXP: 593.9 kPa/s,
maximum PCOMP: 430.1 kPa/s), as well as a long duration (mean: 0.284 ± 0.02 s).
However, pilot whales generated strong suprambient pressure changes (+120.0 kPa)
despite low rates (maximum PEXP: 1,442.4 kPa/s, maximum PCOMP: 9,797.0 kPa/s)
and a long total duration similar to suction events (mean: 0.202 ± 0.04 s).
A significant species effect was found among subambient pressure generation
timing variables (MANOVA, Wilks’ Lambda, F=6.12, P<0.0001) but not for hydraulic
jetting variables (MANOVA, Wilks’ Lambda, F=0.93, P=0.59). Belugas, Pacific white-
sided dolphins, and pilot whales were all significantly different from each other in
expansive phase duration and total duration (post hoc tests, P<0.05). The longest
duration was observed for belugas and the shortest duration was observed for Pacific
white-sided dolphins. Compressive phase durations were similar between belugas and
pilot whales and were longer than in Pacific white-sided dolphins (post hoc tests,
P<0.05).
All subambient pressure generation variables were significantly correlated to
each other, and 80% of suprambient pressure generation variables were significantly
correlated to each other (Table 9, Pearson r correlation, P<0.05). The strongest
correlations were observed between total duration and expansive and compressive phase
durations for both types of events (suction: 0.81 and 0.92, hydraulic jetting: 0.91 and

53
-100
-80
-60
-40
-20
0
0 50 100
Elapsed time (% total duration)
Suba
mbi
ent p
ress
ure
(kPa
)
-20
-15
-10
-5
0
0 50 100
Elapsed time (% total duration)
Suba
mbi
ent p
ress
ure
(kPa
)
-20
-15
-10
-5
0
0 50 100
Fig. 20 Representative pressure traces from each species. Traces are shown for a beluga (blue), Pacific white-sided dolphin
(red), and pilot whale (green) as kPa vs. time scaled to percent of total duration. Note the scale of each trace.
DL LO GM

54
Table 8 Maximum pressure generation performance and mean event times ± SEM for
pressure generation variables.
Subambient pressure generation DL LO GM Maximum Psub (kPa) -121.961 -27.051 -19.551 Mean tEXP (s) 0.146 ± 0.006 0.046 ± 0.005 0.108 ± 0.009 Maximum PEXP (kPa/s) 18243.9 2569.77 593.892 Mean tCOMP (s) 0.216 ± 0.011 0.054 ± 0.006 0.176 ± 0.011 Maximum PCOMP (kPa/s) 9122.81 4889.66 430.108 Mean tDUR (s) 0.362 ± 0.014 0.100 ± 0.008 0.284 ±0.016 Suprambient pressure generation Maximum Psupra (kPa) 127.846 100.109 120.059 Mean tEXP (s) 0.052 ± 0.015 0.040 ± 0.009 0.1399 ± 0.038 Maximum PEXP (kPa/s) 14617.6 5265.42 1442.37 Mean tCOMP (s) 0.058 ± 0.018 0.034 ± 0.007 0.0624 ±0.016 Maximum PCOMP (kPa/s) 50051.6 17601.4 9797.02 Mean tDUR (s) 0.110 ± 0.029 0.073 ± 0.012 0.2023 ± 0.043

55
-150
-125
-100
-75
-50
-25
0M
ax su
bam
bien
t pre
ssur
e (k
Pa)
0
4000
8000
12000
16000
20000
Max
exp
ansi
ve ra
te (k
Pa/s
)
0
2000
4000
6000
8000
10000
Max
com
pres
sive
rate
(kPa
/s)
A
C
B
0.0
0.1
0.2
0.3
0.4
0.5
Mea
n to
tal d
urat
ion
(s)
A
C
B
0.00
0.05
0.10
0.15
0.20
Mea
n ex
pans
ive
phas
e du
ratio
n (s
)
A
B
A
0.00
0.05
0.10
0.15
0.20
0.25
0.30
Mea
n co
mpr
essi
ve p
hase
dur
atio
n (s
)
Fig. 21 Maximum performance values and mean timing values ± SEM for subambient
pressure generation variables. Different letters indicate significant differences at the
P<0.05 level.
DL LO GM DL LO GM DL LO GM

56
0
50
100
150M
ax su
pram
bien
t pre
ssur
e (k
Pa)
0
4000
8000
12000
16000
Max
exp
ansi
ve ra
te (k
Pa/s
)
0
10000
20000
30000
40000
50000
60000
Max
com
pres
sive
rate
(kPa
/s)
A
A
A
0.00
0.05
0.10
0.15
0.20
0.25
0.30
Mea
n to
tal d
urat
ion
(s)
A
A
A
0.00
0.05
0.10
0.15
0.20
Mea
n ex
pans
ive
phas
e du
ratio
n (s
)
A
A
A
0.00
0.02
0.04
0.06
0.08
0.10
Mea
n co
mpr
essi
ve p
hase
dur
atio
n (s
)
Fig. 22 Maximum performance values and mean timing values ± SEM for suprambient
pressure generation variables. No statistically significant difference among species
timing variable means was observed at the P<0.05 level.
DL LO GM DL LO GM DL LO GM

57
0.80, respectively). Total duration was positively correlated to subambient pressure
(0.20) but not suprambient pressure. The rates of pressure change during the expansive
and compressive phases during both event types were negatively correlated to duration
of the each phase as well as total duration, and indicate that larger rates occurred over a
shorter duration. Both subambient and suprambient pressure were positively correlated
to expansive and compressive phase rates of pressure change. The magnitude of
suprambient pressure generation was not significantly correlated to any timing variables.
3.3 The evolution of suction feeding
Data from kinematic and biomechanical analyses were combined with published
and unpublished data to explore the evolution of suction feeding in Odontoceti.
Kinematic and biomechanical characters were available for fewer than 10% of species
represented by the full phylogeny. For this reason, the phylogeny of Odontoceti (Fig. 1)
was collapsed to condense species and provide a greater resolution of ancestral states.
The genera of Physeter and Kogia were collapsed to their respective Families
(Physeteridae and Kogiidae), as well as the genus Platanista (Platanistidae), beaked
whales (Ziphiidae), belugas and narwhals (Monodontidae), and porpoises (Phocoenidae).
The river dolphin Families of Lipotidae, Pontoporiidae, and Iniidae, were collapsed into
a paraphyletic single branch based on similar available character state data. Family
Delphinidae was divided into six polytomous sister clades of genera, based on Le Duc et
al. (1999), to maintain resolution and are as follows: (1) Sotalia and Steno, (2) Sousa,
Stenella, Delphinus, Tursiops, and Lagenodelphis, (3) Lagenorhynchus acutus and L.
albirostris (paraphyletic), (4) Orcaella and Orcinus, (5) Grampus, Pseudorca,
Globicephala, Peponocephala, and Feresa, and (6) Lagenorhynchus (with the exception
species in clade 3), Cephalorhynchus, and Lissodelphis. Kinematic and biomechanical
data were available for 46% of clades and morphological data were available for up to
100% of clades represented by this family level phylogeny of Odontoceti (Table 10).
Tongue width:length ratios were the only data available for the Mysticete outgroup.

58
Table 9 Pearson correlation among pressure generation variables. Bold indicates
significance at the P<0.05 level.
Subambient variables Psub tEXP PEXP tCOMP PCOMP tDUR
Psub 0.21 0.62 0.16 0.56 0.20 tEXP 0.21 -0.64 0.54 -0.28 0.81 PEXP 0.62 -0.64 -0.31 0.66 -0.49
tCOMP 0.16 0.54 -0.31 -0.70 0.92 PCOMP 0.56 -0.28 0.66 -0.70 -0.60 tDUR 0.20 0.81 -0.49 0.92 -0.60
Suprambient variables Psupra tEXP PEXP tCOMP PCOMP tDUR
Psupra 0.05 0.52 0.00 0.61 0.06 tEXP 0.05 -0.83 0.53 -0.39 0.91 PEXP 0.52 -0.83 -0.46 0.68 -0.75
tCOMP 0.00 0.53 -0.46 -0.79 0.80 PCOMP 0.61 -0.39 0.68 -0.79 -0.60 tDUR 0.06 0.91 -0.75 0.80 -0.60

59
Gap coding of biomechanical and morphological character states resulted in 16
characters with up to three character states (Appendix A) that were mapped onto an
existing phylogenetic tree for Odontoceti. For family-level clades with multiple species
represented, mean character values for the clade were used to code discrete character
states. Gap coding with a criterion of one standard deviation usually coded binary
discrete variables; however, three character states were coded for the following
variables: total duration, RSI, tooth counts, tongue width:length ratios, MBI, and hyoid
size ratios. If gap criteria were not lowered to enhance character state resolution for
some variables, character states changes would not have occurred for total duration and
tooth counts, and could not have been mapped onto the tree. Additionally, MBI and
hyoid size would not have been informative, and only one species would have generated
a gap. Standard deviation among family-level clades was usually high, and indicated a
large variance in character states among families.
Character states from sixteen resulting characters were combined into a single
character matrix (Table 10) that was plotted onto a family level phylogeny of Odontoceti
(Fig. 23). Thirty four character state changes took place at 13 points along odontocete
evolution. Four taxa did not display state changes on their respective terminal branches
(Physeteridae, Delphinidae 3, Delphinidae 6, and Phocoenidae). Kinematics appeared to
be conserved throughout the phylogeny, with few changes present; most state changes
appeared to be morphological. These changes in feeding characters resulted in 7
terminal taxa with suction adaptations (Physeteridae, Kogiidae, Ziphiidae,
Monodontidae, Phocoenidae, Delphinidae 4: Orcaella and Orcinus, and Delphinidae 5:
Grampus, Pseudorca, Globicephala, Peponocephala, and Feresa) and 6 with ram
adaptations (Platanistidae, the paraphyletic river dolphin clade: Lipotidae, Pontoporiidae,
and Iniidae, Delphinidae 1: Sotalia and Steno, Delphinidae 2: Sousa, Stenella,
Delphinus, Tursiops, and Lagenodelphis, Delphinidae 3: Lagenorhynchus acutus and L.
albirostris, and Delphinidae 6: Lagenorhynchus, Cephalorhynchus, and Lissodelphis).
The common delphinid ancestor was likely specialized for ram, and the presence of
suction in clades 4 and 5 represent independent events of suction specialization.

60
Based on available evidence, the ancestral state for Odontoceti (Table 11) was
most likely a ram feeding state. Morphological data were the most complete across the
phylogeny and indicated that the odontocete common ancestor most likely had numerous
teeth, a long narrow rostrum with a narrow tongue, and a medium size hyoid. This
ancestor displayed a medial character state for 67% of characters with three coded states.
The analysis tended to heavily weight characters if they were present in basal clades.
Therefore, the ancestral state among Odontoceti resulted in suction feeding characters
such as a small gape with a short duration, a long suction and short ram distance, and
strong subambient pressure generation.

61
Table 10 Character matrix of gap coded character states. Missing values indicate unavailable data.
Family GAPE tGAPE GANG GAOV Vprey GULD tGULD tDUR Dprey Dpredator RSI Psub Tooth count MBI
Tongue W:L
Hyoid L1:W
Mysticeti 0 Physeteridae 1 2 1 Kogiidae 0 0 1 1 0 0 0 1 1 0 0 0 0 Platanistidae 2 2 Ziphiidae 0 2 2 Lipotidae, Pontoporiidae, Iniidae 2 2 1 Monodontidae 0 0 0 0 1 0 0 1 1 0 1 1 0 1 2 1 Delphinidae 1 2 2 0 Delphinidae 2 1 1 0 0 1 1 2 0 1 2 2 2 1 0 Delphinidae 3 2 2 1 1 Delphinidae 4 0 1 Delphinidae 5 0 0 0 0 0 0 0 1 1 0 1 0 0 1 2 1 Delphinidae 6 0 0 0 1 0 0 0 0 1 0 1 0 2 2 1 Phocoenidae 0 0 0 0 1 1 1 1

62
Fig. 23 Reconstruction of Odontoceti feeding character states. Blue bars indicate
positions where at least one change in state occurred and were determined using
maximum likelihood. Ancestral states (Table 11) are assumed unless otherwise noted.

63
Table 11 The most likely hypothesis of character states in the odontocete common
ancestor. States were determined by maximum likelihood.
Variable State Total duration Medium (0.47-0.68 s) Gape Small (<9 cm) Time to gape Short (<0.327 s) Gape angle Large (>40°) Gape angle velocity Slow (<120°/s) Prey velocity Slow (<115 cm/s) Hyolingual depression Short (<3.4 cm) Time to hyolingual depression Short (<0.43 s) Suction distance Long (>5 cm) Ram distance Short (<25 cm) RSI Suction/ram combination (-0.2<RSI<0.4) Subambient pressure generation Strong (>100 kPa) Tooth counts Medium (30-150 teeth) MBI Long/narrow rostra (MBI<0.57) Tongue W:L Narrow (<0.167) Hyoid L1:W Medium (0.57-0.67)

64
4. DISCUSSION
4.1 The use of ram and suction in odontocetes
4.1.1 Belugas
The results of the kinematic and pressure measurements demonstrate that suction
is of great importance for belugas and suction feeding is likely their primary feeding
mode. When approaching food items, belugas maintained an approach velocity less than
50 cm/s and were able to ingest prey with greater velocity than other odontocete species
in this study (over 500 cm/s). Belugas also exhibited a limited gape and the ability to
purse the anterior lips to create a circular aperture. This pursing behavior also functioned
to occlude lateral gape. The shape and size of the oral aperture is an important
component in vertebrate suction feeding, since it regulates the velocity of water flow into
the mouth, and can determine the magnitude of suction generation (Wainwright and Day,
2007). Oral aperture surface area as small as 19 cm2 and circumference as small as 18
cm provided evidence for high velocity of water flow in belugas. Therefore, it is likely
that restricted gape capability and the ability to form a small, circular aperture contribute
to well-developed suction capability in belugas.
Based on the kinematic data, belugas are able to increase intraoral volume
through hyolingual depression and retraction. Belugas were observed to slightly adduct
the hyoid (and presumably the tongue) just prior to the onset of a feeding event (Phase I).
This behavior is a preparatory phase that likely functions to remove residual water from
the oral cavity and maximize the volume change at the onset of hyolingual displacement.
The observed expulsion of water from the mouth prior to some feeding event supports
this hypothesis. Similar behaviors are reported in actinopterygian fishes (Lauder, 1980),
and have been recently reported in bearded seals, which are also suction specialists
(Marshall et al., 2008). Suction in marine mammals can be generated by rapid depression
of the hyolingual apparatus or rapid opening of the jaws (Bloodworth and Marshall,
2005). Mean gape angle opening velocity of only 120°/s, a magnitude much smaller than
that of ram feeding Pacific white-sided dolphins, indicated that hyolingual depression
likely contributed more to suction generation in belugas than rapid jaw opening.

65
The importance of suction in the feeding mode of belugas was probably
underestimated in this study. The animals used in this study were captive their entire
lives and were habituated to receiving non-evasive prey. For this reason, they probably
did not perform maximally in every feeding trial. In addition, evidence suggests that
belugas frequently consume benthic prey (Finley and Gibb, 1982; Seaman et al., 1982;
Dahl et al., 2000; Barros and Clarke, 2002; Laidre and Heide-Jorgensen, 2005). In
elasmobranchs, benthic feeding enhances suction generation (Nauwelaerts et al., 2008).
Belugas are capable of subambient pressure generation greater than -100 kPa in pelagic
environments. If suction is enhanced during beluga benthic feeding, it is likely that the
importance of benthic foraging in belugas may be greater than previously assumed. It is
also likely that utilizing substrate-enhanced suction generation to capture benthic prey
might be a primary feeding behavior in natural environments, and was not observed in
this study.
4.1.2 Pacific white-sided dolphins
The primary feeding mode of Pacific white-sided dolphins in this study was
definitively ram. Pacific white-sided dolphins approached prey items at up to 220 cm/s
and did not ingest prey from a distance farther than 6 cm. Ram feeding behavior was
characterized by a gape and gape angle that were greater than 60% of their maximum
capabilities, and gape was not as limited as observed in belugas. Anterior lip aperture
ratios of Pacific white-sided dolphins were generally less than one and represented a
horizontally oblong aperture shape. The total mean feeding event lasted less than 0.3 s
and was significantly shorter than for belugas or pilot whales. This greater ram
component reflects the dependence on ram to rapidly capture elusive prey, a result that is
not unusual (Wainwright et al., 2001). However, some indication of suction use was
observed during kinematic feeding trials. In some trials, prey was captured before
maximum gape occurred and Pacific white-sided dolphins did not rely on jaw closure and
occlusion to retain prey. Surprisingly, the lip margins of Pacific white-sided dolphins did
not fully open until after maximum gape. This behavior indicated a limited capability to

66
purse the anterior and lateral lips, which partially occluded lateral gape. Based on known
facial anatomy, this was an unexpected finding. Lateral gape was occluded by only 40%
at the first frame of visible prey movement, and a lesser degree of occlusion persisted
until after maximum gape.
The ability to occlude lateral gape and slightly purse the anterior lips indicated
that Pacific white-sided dolphins may be capable of limited suction capability. This
functional hypothesis was confirmed by the maximum in vivo subambient pressure
measurement of -30 kPa. While this performance measure is not impressive for an
animal this size, it does confirm a limited suction capability. In contrast to belugas, rapid
gape opening may be the primary mechanism by which Pacific white-sided dolphins can
generate suction, as evidenced by rapid gape angle velocities and minimal hyolingual
depression, although some hyolingual contribution may also be present. This suction
capability was most likely used to compensate for rapid approach velocities, to
manipulate the orientation of prey within the mouth, or to transport prey from the jaws to
the esophagus.
4.1.3 Pilot whales
Pilot whales in this study exemplified a mixture of suction and ram feeding modes
that was intermediate to the feeding modes displayed by belugas and Pacific white-sided
dolphins. Pilot whales can use suction to capture prey (Werth, 2000), and in this study,
some adaptations for suction generation were observed. Pilot whales demonstrated a
hyolingual preparatory phase similar to that observed in belugas. During phase I, water
was often expelled at the lip margins, a behavior thought to increase the intraoral volume
change and enhance suction generation. Although approach velocity was similar to
Pacific white-sided dolphins (85 cm/s), pilot whales were also able to slow their velocity
with their pectoral flippers in order to capture prey. Lateral gape occlusion greater than
60% of the total jaw length was observed in every trial for pilot whales, and the
maximum observed gape was 45% of the maximum capability. However, this consistent
capability was likely due to limited gape and not a pursing behavior. Unlike Pacific

67
white-sided dolphins, gape and lateral occlusion opened in synchrony and indicated that
no additional orofacial conformational change occurred. Gape did not open more than
50% of its capability and the lip margins remained in contact for approximately 50% of
their length. It is possible that suction generated by rapid hyolingual depression and
retraction in pilot whales is efficient enough to capture prey without the need for rapid
jaw opening. The pilot whales in this study performed similarly to previously published
pilot whale kinematics (Werth, 2000), and supported the assumption that kinematics
measured in this study represent those of the population.
Although evidence suggested that pilot whales may rely on suction to acquire
prey, other results suggested that ram was also a significant component of the feeding
mode. Like Pacific white-sided dolphins, pilot whales rapidly approached their prey,
which was then drawn into the mouth at over 100 cm/s, half the velocity of prey ingested
by belugas. Movement of predator and prey can define suction and ram feeding modes
(Norton and Brainerd, 1993), and the fast approach velocity of pilot whales indicated that
they relied heavily on ram to capture prey. Pilot whales were unable to create a circular
anterior mouth aperture, despite their ability to occlude lateral gape. Frontal aperture
ratios ranged from 0.2 to 0.5 consistently, and minimum area and circumference were 35
cm2 and 30 cm, respectively. This was the most horizontally oblong oral orifice of all
three species, and pilot whales were the least able to form a small, circular anterior lip
aperture.
Maximum subambient pressure values of pilot whales (-20 kPa) resembled Pacific
white-sided dolphins. However, in retrospect, these results may be misleading. The
individuals of these species, like belugas, were accustomed to receiving non-evasive prey
and may not have performed maximally. Additionally, only two pilot whale individuals
were sampled and may not have fully represented the feeding capabilities of pilot whales.
High magnitude suprambient pressure generation also suggests that maximum
capabilities may have been underestimated. Hydraulic jetting and suction are reciprocal
behaviors of the same biomechanical mechanism that involves the hyolingual apparatus;
where one behavior is observed, the other should also be present at a similar magnitude.

68
Belugas, Pacific white-sided dolphins, and pilot whales achieved suprambient pressure
(hydraulic jetting) values greater than 100 kPa. Therefore, the maximum subambient
intraoral pressure generation capability in pilot whales was likely underestimated.
Behavioral anecdotes and kinematic data (Werth, 2000) suggest that pilot whales do
indeed use suction. Werth noted that food items were pulled into the lateral sides of the
mouth in rehabilitating pilot whales. If pressure measurements had been made at the
lateral sides of the mouth, this study might have measured significantly greater
subambient pressures. Future studies of pilot whale feeding performance should test this
functional hypothesis.
Suction capability demonstrated in pilot whales in this study was likely a result of
hyolingual displacement, and not rapid gape change. Like belugas, pilot whales
exhibited a slow gape angle velocity. However, hyolingual displacement was similar to
Pacific white-sided dolphins. Pilot whales and belugas possess a blunt rostrum (Werth,
2006) that is likely coupled with a short, wide tongue shape and a broad hyoid. This
morphology may contribute more to suction generation than forceful hyolingual
displacement (Bloodworth and Marshall, 2007). Jaw and hyolingual displacements in
pilot whales were low. Therefore, the hyolingual contribution to suction generation may
come from its shape and not necessarily forceful displacement, and this contribution may
be greater than that of jaw displacement in pilot whales.
4.2 Comparisons with other vertebrates
4.2.1 Comparisons with marine mammal taxa
Few kinematic and pressure generation studies have been conducted for marine
mammals, and comparative data are few (Table 12). Morphological and behavioral
evidence supports the use of suction in beaked whales (Ziphiidae, Heyning and Mead,
1996), belugas (Delphinapterus leucas, Ray, 1966), pilot whales (G. melas and G.
macrorhynchus, Brown, 1962; Werth, 2000), and killer whales (Orcinus orca,
Donaldson, 1977). However, among marine mammals direct in vivo physiological data
that demonstrate subambient intraoral pressure generation have only been collected for

69
Table 12 Summary of available feeding kinematic and biomechanical data for marine mammals.
Kinematic variables Belugas1 Pacific white-sided dolphins1
Pilot whales1
Pygmy/dwarf sperm whales2
Bottlenose dolphins2
Pilot whales3
Harbor porpoises4
Bearded seals5
Pacific walrus6
Duration of gape cycle (s) 0.684 0.279 0.583 0.470 0.863 0.860 0.220 0.530 0.482 Max gape (cm) 6.346 6.451 8.997 8.54 12 10.6 4 2.70 --- Time to max gape (s) 0.277 0.140 0.327 0.282 0.564 --- 0.280 0.170 --- Max hyolingual depression (cm)
2.675 3.377 2.674 2.25 4.75 2-6 --- 1.8 ---
Time to max hyolingual depression (s)
0.400 0.186 0.430 0.283 0.623 --- --- 0.300 ---
Max gape angle (°) 16.4 16.8 15.9 40 25 --- --- 24.4 --- Time to max gape angle (s) 0.300 0.139 0.316 --- --- --- --- 0.200 --- Max gape angle opening velocity (°/s)
119.7 248.4 107.5 293 84 --- --- 204.8 ---
Time to max gape angle opening velocity (ms)
0.175 0.092 0.212 --- --- --- --- 0.100 ---
Max gape angle closing velocity (°/s)
115.5 226.0 85.9 223 120 --- --- 289.8 ---
Time to max gape angle closing velocity (ms)
0.387 0.179 0.422 --- --- --- --- 0.080 ---
Ram-suction index 0.04 0.361 0.159 -0.67 +0.94 --- --- --- --- Max subambient pressure (kPa)
-122 -27 -20 --- --- --- ~ -40 -91.2 -118.8
Max supra-ambient pressure (kPa)
+128 +100 +120 --- --- --- --- +54 ---
1This study, 2Bloodworth and Marshall (2005), 3Werth (2000), 4Kastelein et al. (1997), 5Marshall et al. (2008), 6Kastelein et al. (1994)

70
harbor porpoises (Phocoena phocoena, Kastelein et al., 1997), walruses (Odobenus
rosmarus divergens, Kastelein et al., 1994), and bearded seals (Erignathus barbatus,
Marshall et al., 2008). Additionally, feeding kinematics have been quantified for pilot
whales (G. melas, Werth, 2000), pygmy and dwarf sperm whales, common bottlenose
dolphins (Kogia spp. and T. truncatus, Bloodworth and Marshall, 2005), and bearded
seals (E. barbatus, Marshall et al., 2008). These taxa represent both cetacean and
pinniped mammalian radiations, and all are considered suction feeding specialists except
bottlenose dolphins. The unshared ancestry of pinnipeds and cetaceans, and the
presence of suction feeding capability in both lineages, further demonstrates the strong
selection pressures of the aquatic environment, and the convergent evolution of
mechanisms for suction generation.
The results of this study are evidence that a greater diversity in suction
generation mechanisms exist among odontocetes than previously thought. Feeding
kinematics of Kogia spp. were characterized by a large gape angle, fast gape angle
velocities, short hyolingual depression, and a short total duration compared to bottlenose
dolphins. These feeding characteristics indicated that Kogia spp. fed using suction
(Bloodworth and Marshall, 2005). Gape angle was small for bearded seals, and their jaw
opening and total duration of the feeding event were rapid (Marshall et al., 2008)
compared to these two odontocetes. These results support the hypothesis that faster
feeding kinematics are associated with suction feeding. However, in this study, belugas
and Pacific white-sided dolphins did not differ in gape angle or hyolingual displacement.
In addition, belugas exhibited gape angle velocities and a total feeding duration similar
to ram feeding bottlenose dolphins. The discrepancies in kinematic patterns among
suction feeding odontocetes may be due to the suite of varied morphological and
behavior specializations for suction generation in belugas. The pursing behavior of
belugas has never been described for odontocetes in the context of feeding kinematics.
For this reason, lateral occlusion and pursing behaviors of belugas might be as important
as hyolingual depression and fast jaw movements to generate suction, and may
contribute to a broad repertoire of feeding modes in odontocetes.

71
This study measured intraoral pressure change of feeding Monodontids and
Delphinids. Until now, some odontocetes were presumed to generate strong subambient
pressures but none were quantified. Previous work suggested that porpoises could
generate up to -40 kPa of pressure (Kastelein et al., 1997). However the pressure
measured for belugas (-120 kPa) was more than double this quantity. Walrus and
bearded seals are known benthic foragers that are also suction specialists. These species
are capable of generating some of the greatest absolute suction values known among
vertebrates (walrus: -120 kPa, bearded seal: -90 kPa) (Kastelein et al., 1994; Marshall et
al., 2008). Suction generation in belugas resembled that of other suction feeding
pinnipeds, rather than that of other odontocetes, which further reinforces the importance
of suction in belugas. Alternatively, suction generation in Pacific white-sided dolphins
and pilot whales was similar to harbor porpoises, and reflects a greater contribution of
ram to the feeding mode and the possibility of suction use for compensation of ram
speed or intraoral prey manipulation and transport.
4.2.2 Comparisons with more basal vertebrates
Suction generation is tightly associated with the physical properties of the
medium. For this reason, the kinematics of suction feeding are conserved among basal
aquatic vertebrates (Reilly and Lauder, 1990; Lauder and Prendergast, 1992; Wilga and
Motta, 1998; Deban and Wake, 2000; Ferry-Graham et al., 2001; Gibb and Ferry-
Graham, 2005). Furthermore, the coordination of kinematic sequence and timing is
critical for maximum suction generation (Holzman et al., 2007). The kinematic events
of odontocetes in this study were similarly conserved. All aquatic vertebrates, including
mammals, can be characterized as utilizing a posteriorly directed “wave of buccal
expansion” (Gillis and Lauder, 1994; Summers et al., 1998; Wilga and Motta, 1998;
Sanford and Wainwright, 2001; Motta et al., 2002; Carroll and Wainwright, 2003). In
teleosts, the progression of buccal expansion from the anterior jaws to the gills
coordinates maximum flow velocity and maximum gape (Bishop et al., 2008). The same
wave-like buccal expansion was demonstrated for odontocetes and has been observed in

72
suction feeding salamanders (Lauder and Shaffer, 1985) and turtles (Summers et al.,
1998). This pattern may be beneficial as a mechanism for generating a temporary
unidirectional flow during feeding in obligate bidirectional flow suction feeders.
Lateral gape occlusion, as observed in odontocetes in this study, is a common
behavioral adaptation of suction feeders. Lateral gape occlusion has also been reported
for Kogia spp. (Bloodworth and Marshall, 2005), pilot whales (Werth, 2000), and
bearded seals (Marshall et al., 2008). The capability to occlude lateral gape in
odontocetes and other marine mammals is analogous to the lateral gape occlusion via
labial cartilages of elasmobranchs (e.g. Motta and Wilga, 1999), lip membranes in
teleost fishes (e.g. Ferry-Graham et al., 2008), and the labial lobes of aquatic
salamanders (e.g. Deban and Wake, 2000). Lateral gape occlusion also functions to
create a small, circular anterior aperture to increase the flow of water into the mouth
(Wainwright and Day, 2007). In teleost fish, highly kinetic bones and ligaments
protrude the jaws, which effectively occludes lateral gape (Motta, 1984). However,
odontocetes are phylogenetically constrained to an autostylic jaw suspension and cannot
protrude the maxilla and premaxilla. Therefore, the lateral lips of odontocetes are likely
an analogous mechanism for lateral gape occlusion.
Typically, teleost suction feeders generate a flow of water in front of the mouth
that is either high velocity or high volume (Holzman et al., 2008). Bluegill sunfish
(Lepomis macrochirus) are specialized to generate high velocity water flow and strong
subambient pressure during suction events. They have a smaller gape but greater
accuracy than largemouth bass. However, prey size is limited by small gape.
Alternatively, largemouth bass (Micropterus salmoides) exhibit a larger gape, ingest a
larger volume of water at the expense of accuracy and flow velocity, and have a greater
ram component to their feeding mode than bluegill sunfish (Higham et al., 2006a). The
differences in suction generation between bluegill and largemouth bass are primarily due
to differences in water flow speed and gape displacement speed (Holzman et al., 2008).
In this study, suction feeding by belugas is analogous to bluegill suction feeding.
Belugas also exhibited a relatively small gape and high subambient pressure values that
73
indicate a high velocity water flow; water velocity is positively correlated to subambient
pressure generation (Higham et al., 2006b). In teleosts, smaller mouth diameters
generally indicate greater subambient pressure capability (Wainwright and Day, 2007),
which was also true for odontocetes. The capability to restrict gape indicates that
belugas can direct suction force toward the prey for greater accuracy. It is possible that
since beluga gape opening velocity was slow, belugas likely compensate with anterior
lip pursing to create a smaller anterior aperture and increase strike efficiency, as well as
a greater hyolingual displacement that increases flow velocity.
Alternatively, ram feeding by Pacific white-sided dolphins is analogous to
feeding in largemouth bass. Pacific white-sided dolphins typically captured prey with a
greater ram component although some suction was observed. The inability to form a
small, restricted aperture, as well as the weak subambient pressure generated, indicate
that Pacific white-sided dolphins probably displace a greater volume of water at a slower
velocity and are not as accurate. However, odontocetes are constrained to a bidirectional
suction flow, and direct comparisons of intraoral volume change to teleosts with
unidirectional suction flow should be made with caution.
4.3 Evaluation of the ram-suction index
As evidenced by kinematic and pressure generation data, the use of ram and
suction modes was common in belugas, Pacific white-sided dolphins, and pilot whales.
However, these results were not necessarily reflected in RSI values. The RSI calculated
by Norton and Brainerd’s index (Norton and Brainerd, 1993) suggested that all species
relied heavily on ram to capture prey. The greatest mean RSI value was observed for
Pacific white-sided dolphins and was probably the most accurate prediction of primary
feeding mode. Kinematic and pressure analyses confirmed that Pacific white-sided
dolphins relied heavily on ram and generated little suction. However, belugas generated
the strongest suction pressures reported in vertebrates even though RSI values indicated
a large ram component. This result indicates that mean RSI values did not capture the
broad repertoire of feeding behavior in belugas.

74
Mean RSI values may have also been high (ram) due to the fluid dynamics and
constraints of suction feeding. Suction is effective over limited distances (Svanback et
al., 2002; Wainwright and Day, 2007). Therefore, prey movement due to suction is
limited and less variable (Wainwright et al., 2001). Among teleosts, ram distance is
often more variable than suction distance, and ram, often in the form of jaw protrusion,
is used to bring the mouth closer to the prey so that suction can be effective (Norton and
Brainerd, 1993; Ferry-Graham et al., 2001; Wainwright et al., 2001; Holzman et al.,
2008b). For this reason, it is possible that the ram component of beluga feeding events
detected by the RSI was due to the necessity for belugas to reduce the distance between
the prey for suction to be effective; since jaw protrusion is not possible in odontocetes,
predator movement (ram) would be necessary. Kinematic analyses confirmed that the
highest velocity prey movements were observed after belugas slowed forward velocity to
near zero.
The inherent complexities involved in using RSI have long been recognized. In a
study comparing ram and suction distances among seven cichlid species, Wainwright et
al. (2001) determined that species chosen based on presumed differences in ram and
suction capabilities did not differ in suction distance. Additionally, Wainwright et al.
(2001) suggested that strong suction not only draws the prey into the mouth of the
predator, but that it may draw the predator toward the prey in a behavior that would be
captured in RSI as ram distance, although this was unlikely in this study due to the size
of the animals. RSI also obscures the contribution of ram and suction to the feeding
mode (Wainwright et al., 2001). Feeding events with varying ram distances can have the
same RSI as long as suction distance is proportional. Wainwright et al. (2001)
concluded that RSI was not useful for the comparison of suction and ram feeding modes
among species due to its bias toward ram distance and its inability to describe suction
and ram performance.
Beluga kinematic and pressure generation data from this study further support
these shortcomings of RSI analyses. Although significant differences were found among
odontocetes, maximum suction distance for belugas was not as profound as the

75
anticipated result. Belugas were chosen as a study species due to numerous anecdotal
accounts of significant suction generation. In fact, trainers often noted that when they
attempted to induce maximum suction with an increased grip on the prey, belugas could
definitively use suction to remove the fish from the trainer’s hand. Pressure generation
analyses verified the capability for strong suction in belugas. However, ram and suction
distances, and subsequently RSI, were not able to capture this suction component due to
the limited distance across which suction is effective. Furthermore, RSI for belugas was
calculated as a mean of RSI from all feeding trials. In a species with a wide feeding
repertoire, such as belugas, means will likely not capture the full range of feeding
behaviors.
4.4 Evolution of suction feeding in Odontoceti
4.4.1 Reconstructed ancestral feeding characteristics
The preliminary analysis of the evolution of suction feeding characters within
Odontoceti conducted in this study indicated that the common ancestor of odontocetes
was primarily a ram feeder. Six of 16 reconstructed ancestral character states were
associated with a ram feeding mode and included: large gape angle with a slow velocity,
weak hyolingual depression, slow prey velocity, and a long narrow rostrum with a
narrow tongue. These predicted ancestral kinematic and morphological states coincide
with the ram feeding behavior predicted by the archaeocete morphology; archaeocetes
typically possessed 40-44 heterodont shearing teeth (O'Leary and Uhen, 1999;
Thewissen and Williams, 2002), which indicate that the teeth were responsible for prey
capture (ram and biting). However, some degree of subambient intraoral pressure
generation may have been employed during feeding. Changes in feeding ecology
occurred early in the Archaeocete radiation (Gingerich, 1998; Thewissen, 1998), and
evidence suggests that members of Family Dorudontidae, the sister group to modern
mysticetes and odontocetes, were feeding on marine prey exclusively (Thewissen et al.,
1996; Roe et al., 1998; Thewissen and Williams, 2002). Suction is highly selected for in
aquatic feeding vertebrates (Lauder, 1985), and may have been present in the fully

76
aquatic, piscivorous Dorudontidae. However, any subambient pressure that was
generated was likely only used during prey manipulation or transport to the esophagus,
and was not likely used to capture prey (Werth, 2006).
The reconstruction of ancestral feeding states performed in this study supports
the hypothesis of suction-enhanced intraoral transport in an ancestral odontocete. Ten
feeding characters did not fully support a ram feeding mode, and four of these were
intermediate between ram and suction: total duration of the feeding event, ram-suction
index, tooth counts, and hyoid size. The remaining six reconstructed ancestral state
variables supported a suction feeding mode: limited but fast gape, rapid hyolingual
depression, large suction and small ram distance, and strong subambient pressure
generation; although, these characters were not represented well over the phylogeny, and
their predicted ancestral states may not be accurate. However, since several character
states associated with suction were present, the reconstruction supports the hypothesis
that limited subambient pressure generation capability may have been used for prey
manipulation and intraoral transport in Archaeoceti, and might represent the transition
from a ram to a suction prey capture method in some taxa (Werth, 2006). Therefore,
suction generation capability likely evolved by the time of the dorudontines, though it
was not a specialized behavior.
4.4.2 Plesiomorphies, apomorphies, and synapomorphies
Within suborder Odontoceti, characteristics of suction feeding appear to have
evolved in almost every clade, suggesting that while some taxa are suction feeding
specialists (belugas), other ram feeding delphinids (Delphinidae 2: Sousa, Stenella,
Delphinus, Tursiops, and Lagenodelphis genera) may only have a limited use of suction
during feeding. Based on the characters determined for the common ancestor, all
characters used in this analysis underwent some degree of evolutionary change in at least
one lineage, and no character was entirely plesiomorphic (unchanged from the ancestral
condition) within Odontoceti. Similarly, no character was entirely apomorphic (a
derived condition) within Odontoceti. However, this result was due to the method of

77
gap coding that was used; characters that did not code at least two character states were
re-coded until at least two states were determined. Therefore, synapomorphies of
odontocetes could not be determined.
Instead, plesiomorphy, apomorphy, and synapomorphy should be used to
describe character states within familial clades. The ancestral character of relatively
long, narrow rostra is maintained in five of 13 terminal taxa and in these taxa, a long
rostrum is plesiomorphic. Apomorphies, or states different than those in the predicted
ancestor, were observed in every terminal taxa, though the number of apomorphies
within a taxa ranged from one to nine. Delphinidae 5 (Grampus, Pseudorca,
Globicephala, Peponocephala, and Feresa), Kogiidae, and Monodontidae display the
most (3-5) changes from the ancestral state to derived character states associated with
suction feeding capability. The feeding mode changes that have taken place in these
taxa were not identical, and it is likely that specialization for suction generation was
independently derived from a ram feeding ancestor numerous times. In total, at least six
independent events of suction generation specialization were determined from the
analysis (Fig. 24).
Although some extant members of Odontoceti are specialized for suction
generation, the common ancestor of Family Delphinidae was likely more specialized for
ram feeding than the odontocete ancestor. This delphinid ancestor was polydont with a
long narrow rostrum, fast total feeding event duration and a large ram distance. These
kinematic and morphological characters represent shared characters common within
Family Delphinidae that are derived in relation to the odontocete ancestor
(synapomorphic). However, clade 4 (Orcaella and Orcinus) and clade 5 (Grampus,
Pseudorca, Globicephala, Peponocephala, and Feresa) have diverged from the common
Delphinid ancestor to independently specialize for suction (apomorphic). This
relationship among apomorphic feeding specializations is significant in that it occurs
within the most diverse and most recently derived family within Odontoceti. For this
reason, a study of transitions in feeding mode within Delphinidae might provide insight
into the mechanism for the evolution of suction specialists.

78
Fig. 24 The evolution of suction generation specialization within Odontoceti. Blue bars
indicate changes in feeding modes.

79
These analyses suggest that feeding characters within each familial clade are a
composite of both ancestral and derived character states. Such results are not unusual,
and were found for the evolution of extreme jaw protrusion in the sling-jaw wrasse,
Epibulus insidiator (Westneat and Wainwright, 1985), for example. Additionally,
among ray-finned fishes, functionally convergent premaxillary protrusion has
independently evolved several times, although the underlying mechanisms of protrusion
are divergent (Westneat, 2004). The evolution of protrusion is analogous to the
evolution of suction generation in odontocetes, as several clades functionally use some
degree of suction generation to capture prey; however the mechanism underlying suction
generation varies among taxa. This emergent property of functional systems has been
termed “many-to-one mapping” (Wainwright et al., 2005; Alfaro et al., 2006). It appears
that since suction feeding has independently evolved at least six times within
Odontoceti, “many-to-one mapping” of biomechanics contributes to the variation in
suction feeding performance observed in odontocetes.

80
5. CONCLUSIONS
This study combined kinematic and direct pressure generation measurements for
odontocetes, and increased the comparative kinematic data for odontocetes. In addition,
this study provided in vivo pressure data for odontocetes that can be used in comparison
to other suction feeding vertebrates. A new feeding behavior was defined for
odontocetes that included occlusion of the lateral lips and anterior pursing to form a
small circular anterior aperture. This behavior was specialized in belugas and occurred
to a lesser degree in Pacific white-sided dolphins and pilot whales. Additionally, suction
feeding belugas appeared to employ less of their maximum gape capability during
kinematic feeding events. The limited use of maximum gape appears to be an adaptation
for suction feeding where hyolingual displacement is more important than rapid jaw
opening, and was observed to a greater degree in belugas and pilot whales.
In this study, belugas were the most specialized for suction generation, but
employed a wide repertoire of feeding behaviors that also included ram. Belugas were
able to generate strong subambient pressures that were comparable to the strongest
pressures known among vertebrates. Alternatively, Pacific white-sided dolphins relied
on ram to capture prey. Feeding events occurred rapidly and little suction generation
was observed. Some degree of lateral occlusion occurred in Pacific white-sided
dolphins, but to a lesser degree than for belugas. The capability to occlude lateral gape,
as well as direct measurement of suction generation, indicated that suction was likely
compensatory or was utilized to transport or manipulate prey intraorally. Pilot whales
exemplified a mixed use of ram and suction that was intermediate to belugas and Pacific
white-sided dolphins. Although the lateral gape was occluded in all trials, pilot whales
maintained a high approach velocity indicative of ram. Pilot whales were also incapable
of generating strong subambient pressures. The mechanism for suction generation in
odontocetes is an integration of hyolingual displacement, rapid jaw opening, and lateral
gape occlusion. The results from this study help to establish a baseline for the diversity
of feeding behaviors and kinematics in odontocetes, and provide data for comparison
with other primarily and secondarily aquatic vertebrate taxa.

81
This study systematically examined the evolution of feeding modes within
odontocetes. The preliminary analysis of suction feeding evolution indicated that
suction feeding capability evolved independently at least five times within Odontoceti.
Hypotheses of likely feeding mode character states were generated for odontocete taxa
in which kinematic data are sparse. These data are able to provide direction for future
studies on the diversity of feeding in odontocetes. A more detailed comparison of
feeding modes within Family Delphinidae may be able to provide insight into the
mechanism for suction evolution in Odontocetes.

82
REFERENCES
Alfaro, M. E., Collar, D. C. and Wainwright, P. C. (2006). Ubiquity of many-to-one
mapping in functional traits: examples and evolutionary implications. Integrative
and Comparative Biology 46, E2-E2.
Archie, J. W. (1985). Methods for coding variable morphological features for numerical
taxonomic analysis. Systematic Zoology 34, 326-345.
Barros, N. B. and Clarke, M. R. (2002). Diet. In Encyclopedia of Marine Mammals,
(eds. W. F. Perrin B. Würsig and J. G. M. Thewissen), pp. 323-327. New York:
Academic Press.
Bellwood, D. R. and Choat, J. H. (1990). A functional analysis of grazing in
parrotfishes (Family Scaridae) - the ecological implications. Environmental Biology
of Fishes 28, 189–214.
Bishop, K. L., Wainwright, P. C. and Holzman, R. (2008). Anterior-to-posterior wave
of buccal expansion in suction feeding fishes is critical for optimizing fluid flow
velocity profile. Journal of the Royal Society Interface 5, 1309-1316.
Bloodworth, B. E. and Marshall, C. D. (2005). Feeding kinematics of Kogia and
Tursiops (Odontoceti: Cetacea): characterization of suction and ram feeding. Journal
of Experimental Biology 208, 3721–3730.
Bloodworth, B. E. and Marshall, C. D. (2007). A functional comparison of the
hyolingual complex in pygmy and dwarf sperm whales (Kogia breviceps and K.
sima), and bottlenose dolphins (Tursiops truncatus). Journal of Anatomy 211, 78-91.
Brodie, P. F. (1989). The white whale Delphinapterus leucas (Pallis, 1776). In
Handbook of Marine Mammals, vol. 4 (eds. S. H. Ridgeway and R. Harrison), pp.
119–144. San Diego, CA: Academic Press.
Brown, D. H. (1962). Further observations on the pilot whale in captivity. Zoologica 47,
59–64.
Bryden, M. M. (1988). Adaptation to the aquatic environment. In Whales, Dolphins and
Porpoises, (eds. R. J. Harrison M. M. Bryden and T. Pyrzakowski), pp. 110–121.
New York: Facts on File.

83
Carroll, A. M. and Wainwright, P. C. (2003). Functional morphology of prey capture
in the sturgeon, Scaphirhynchus albus. Journal of Morphology 256, 270-284.
Clarke, M. R. (1996). Cephalopods as prey .3. Cetaceans. Philosophical Transactions
of the Royal Society of London Series B-Biological Sciences 351, 1053-1065.
Dahl, T. M., Lydersen, C., Kovacs, K. M., Falk-Petersen, S., Sargent, J., Gjertz, I.
and Gulliksen, B. (2000). Fatty acid composition of the blubber in white whales
(Delphinapterus leucas). Polar Biology 23, 401-409.
Day, S. W., Higham, T. E. and Wainwright, P. C. (2007). Time resolved
measurements of the flow generated by suction feeding fish. Experiments in Fluids
43, 713-724.
Deban, S. M. and Wake, D. B. (2000). Aquatic feeding in salamanders. In Feeding:
Form, Function, and Evolution in Tetrapod Vertebrates, (ed. K. Schwenk), pp. 65-
94. New York: Academic Press.
Donaldson, B. J. (1977). The tongue of the bottlenose dolphin (Tursiops truncatus). In
Functional Anatomy of Marine Mammals, vol. 3 (ed. R. J. Harrison). New York:
Academic Press.
Finley, K. J. and Gibb, E. J. (1982). Summer diet of the narwhal (Monodon
monoceros) in Pond Inlet, northern Baffin Island. Canadian Journal of Zoology-
Revue Canadienne De Zoologie 60, 3353-3363.
Fiscus, C. H. and Kajimura, H. (1980). Food of the Pacific white-sided dolphin,
Lagenorhynchus obliquidens, Dall porpoise, Phocoenoides dalli, and northern fur
seal, Callorhinus ursinus, off California and Washington. Fishery Bulletin 78, 951-
959.
Fordyce, R. E. and Barnes, L. G. (1994). The evolutionary history of whales and
dolphins. Annual Review of Earth and Planetary Sciences 22, 419–455.
Garcia-Cruz, J. and Sosa, V. (2006). Coding quantitative character data for
phylogenetic analysis: A comparison of five methods. Systematic Botany 31, 302-
309.

84
Gillis, G. B. and Lauder, G. V. (1994). Aquatic prey transport and the comparative
kinematics of Ambystoma tigrinum feeding behaviors. Journal of Experimental
Biology 187, 159-179.
Gingerich, P. D. (1998). Paleobiological perspectives on Mesonychia, Archaeoceti, and
the origin of whales. In The Emergence of Whales: Patterns in the Origins of
Cetacea, (ed. J. G. M. Thewissen), pp. 423-449. New York: Plenum Press.
Harvey, P. H. and Pagel, M. D. (1991). The Comparative Method in Evolutionary
Biology. New York: Oxford University Press.
Heise, K. (1997). Diet and feeding behaviour of Pacific white-sided dolphins
(Lagenorhynchus obliquidens) as revealed through the collection of prey fragments
and stomach content analyses. Report of the International Whaling Commission 47,
807-815.
Herring, S. W. (1993). Functional morphology of mammalian mastication. American
Zoologist 33, 289–299.
Heyning, J. E. and Mead, J. G. (1996). Suction feeding beaked whales: morphological
and observational evidence. Contributions in Science, Natural History Museum of
Los Angeles County 464, 1–12.
Higham, T. E., Day, S. W. and Wainwright, P. C. (2006a). Multidimensional analysis
of suction feeding performance in fishes: fluid speed, acceleration, strike accuracy
and the ingested volume of water. Journal of Experimental Biology 209, 2713-2725.
Higham, T. E., Day, S. W. and Wainwright, P. C. (2006b). The pressures of suction
feeding: the relation between buccal pressure and induced fluid speed in centrarchid
fishes. Journal of Experimental Biology 209, 3281-3287.
Holzman, R., Day, S. W. and Wainwright, P. C. (2007). Timing is everything:
coordination of strike kinematics affects the force exerted by suction feeding fish on
attached prey. Journal of Experimental Biology 210, 3328-3336.
Holzman, R., Day, S. W., Mehta, R. S. and Wainwright, P. C. (2008). Integrating the
determinants of suction feeding performance in centrarchid fishes. Journal of
Experimental Biology 211, 3296-3305.

85
Kastelein, R. A., Muller, M. and Terlouw, A. (1994). Oral suction of a Pacific walrus
(Odobenus rosmarus divergens) in air and under water. Zeitschrift Fur
Saugetierkunde 59, 105–115.
Kastelein, R. A., Staal, C., Terlouw, A. and Muller, M. (1997). Pressure change in the
mouth of a feeding harbor porpoise (Phocoena phocoena). In The Biology of the
Harbor Porpoise, (eds. A. J. Read P. R. Wiepkema and P. E. Nachtigall), pp. 279–
291. Woerden, The Netherlands: De Spil Publishers.
Laidre, K. L. and Heide-Jorgensen, M. P. (2005). Winter feeding intensity of
narwhals (Monodon monoceros). Marine Mammal Science 21, 45-57.
Lauder, G. V. (1980). The suction feeding mechanism in sunfishes (Lepomis) - an
experimental analysis. Journal of Experimental Biology 88, 49-&.
Lauder, G. V. (1985). Aquatic feeding in lower vertebrates. In Functional Vertebrate
Morphology, (eds. M. Hildebrand D. M. Bramble K. F. Liem and D. B. Wake), pp.
210–229. Cambridge, MA: Harvard University Press.
Lauder, G. V. and Shaffer, H. B. (1985). Functional morphology of the feeding
mechanism in aquatic Ambystomatid salamanders. Journal of Morphology 185, 297-
326.
Le Duc, R. G., Perrin, W. F. and Dizon, A. E. (1999). Phylogenetic relationships
among the Delphinid cetaceans based on full cytochrome B sequences. Marine
Mammal Science 15, 619-648.
Liem, K. F. (1993). Ecomorphology of the Teleostean skull. In The Skull: Functional
and Evolutionary Mechanisms, vol. 3 (eds. J. Hanken and B. K. Hall), pp. 422–452.
Chicago: University of Chicago Press.
Lipps, J. H. and Mitchell, E. (1976). Trophic model for the adaptive radiations and
extinctions of pelagic marine mammals. Paleobiology 2, 147–155.
Maddison, W. P. and Maddison, D. R. (2006). StochChar: A package of Mesquite
modules for stochastic models of character evolution. Ver. 1.1.
http://mesquiteproject.org.

86
Maddison, W. P. and Maddison, D. R. (2008). Mesquite: A modular system for
evolutionary analysis. Ver. 2.5. http://mesquiteproject.org.
Marshall, C. D., Kovacs, K. and Lydersen, C. (2008). Suction and hydraulic jetting
kinematics of feeding bearded seals (Erignathus barbatus). Journal of Experimental
Biology 211, 699-708.
Mickevich, M. F. and Johnson, M. S. (1976). Congruence between morphological and
allozyme data in evolutionary inference and character evolution. Systematic Zoology
25, 260-270.
Minasian, S. M., Balcomb, K. C. and Foster, L. (1984). The World's Whales. New
York: Smithsonian Books.
Morton, A. (2000). Occurrence, photo-identification and prey of pacific white-sided
dolphins (Lagenorhyncus obliquidens) in the Broughton Archipelago, Canada 1984-
1998. Marine Mammal Science 16, 80-93.
Motta, P. J. (1984). Mechanics and functions of jaw protrusion in teleost fishes - a
review. Copeia 1, 1–18.
Motta, P. J. and Wilga, C. D. (1999). Anatomy of the feeding apparatus of the nurse
shark, Ginglymostoma cirratum. Journal of Morphology 241, 33-60.
Motta, P. J., Hueter, R. E., Tricas, T. C. and Summers, A. P. (2002). Kinematic
analysis of suction feeding in the nurse shark, Ginglymostoma cirratum
(Orectolobiformes, Ginglymostomatidae). Copeia 1, 24–38.
Muller, M., Osse, J. W. M. and Verhagen, J. H. G. (1982). A quantitative
hydrodynamic model of suction feeding in fish. Journal of Theoretical Biology 95,
49–79.
Nauwelaerts, S., Wilga, C. D., Lauder, G. V. and Sanford, C. P. (2008). Fluid
dynamics of feeding behaviour in white-spotted bamboo sharks. Journal of
Experimental Biology 211, 3095-3102.
Norris, K. S. and Møhl, B. (1983). Can odontocetes debilitate prey with sound?
American Naturalist 122, 85–104.

87
Norton, S. F. and Brainerd, E. L. (1993). Convergence in the feeding mechanics of
ecomorphologically similar species in the Centrarchidae and Cichlidae. Journal of
Experimental Biology 176, 11–29.
O'Leary, M. A. and Uhen, M. D. (1999). The time of origin of whales and the role of
behavioral changes in the terrestrial-aquatic transition. Paleobiology 25, 534-556.
Porter, H. T. and Motta, P. J. (2004). A comparison of strike and prey capture
kinematics of three species of piscivorous fishes: Florida gar (Lepisosteus
platyrhincus), redfin needlefish (Strongylura notata), and great barracuda
(Sphyraena barracuda). Marine Biology 145, 989-1000.
Price, S. A., Bininda-Emonds, O. R. P. and Gittleman, A. L. (2005). A complete
phylogeny of the whales, dolphins and even-toed hoofed mammals (Cetartiodactyla).
Biological Reviews 80, 445-473.
Ray, C. (1966). Round table: practical problems. In Whales, Dolphins and Porpoises,
(ed. K. S. Norris), pp. 671. Berkeley: University of California Press.
Reeves, R. R., Stewart, B. S., Clapham, P. J. and Powell, J. A. (2002). The National
Audubon Society's Guide to Marine Mammals of the World. New York: Chanticleer
Press, Inc.
Rice, D. W. (1998). Marine Mammals of the World: Systematics and Distribution.
Lawrence, KS: The Society for Marine Mammology.
Riska, B. (1979). Character variability and evolutionary rate in Menidia. Evolution 33,
1001-1004.
Roe, L. J., Thewissen, J. G. M., Quade, J., O'Neil, J. R., Bajpai, S., Sahni, A. and
Hussain, S. T. (1998). Isotopic approaches to understanding the terrestrial-to-marine
transition of the earliest cetaceans. In The Emergence of Whales: Evolutionary
Patterns in the Origin of Cetacea, (ed. J. G. M. Thewissen), pp. 399-422. New York:
Plenum Press.
Rosel, P. E., Haygood, M. G. and Perrin, W. F. (1995). Phylogenetic relationships
among the true porpoises (Cetacea: Phocoenidae). Molecular Phylogenetics and
Evolution 4, 463-474.

88
Rosen, R. A. and Hales, D. C. (1981). Feeding of paddlefish, Polyodon spathula.
Copeia 2, 441–455.
Sanford, C. P. and Wainwright, P. C. (2001). Suction feeding performance in the
largemouth bass micropterus salmoides: linking buccal cavity kinematics using
sonomicrometry to pressure. American Zoologist 41, 1575-1576.
Seaman, G. A., Lowry, L. F. and Frost, K. J. (1982). Foods of belukha whales
(Delphinapterus leucas) in western Alaska. Cetology 44, 1-19.
Summers, A. P., Darouian, K. F., Richmond, A. M. and Brainerd, E. L. (1998).
Kinematics of aquatic and terrestrial prey capture in Terrapene carolina, with
implications for the evolution of feeding in Cryptodire turtles. Journal of
Experimental Zoology 281, 280-287.
Svanback, R., Wainwright, P. C. and Ferry-Graham, L. A. (2002). Linking cranial
kinematics, buccal pressure, and suction feeding performance in largemouth bass.
Physiological and Biochemical Zoology 75, 532–543.
Thewissen, J. G. M. (1998). Cetacean origins. In The Emergence of Whales:
Evolutionary Patterns in the Origin of Cetacea, (ed. J. G. M. Thewissen), pp. 451-
464. New York: Plenum Press.
Thewissen, J. G. M. and Williams, E. M. (2002). The early radiations of cetacea
(Mammalia): evolutionary pattern and developmental correlations. Annual Review of
Ecology and Systematics 33, 73–90.
Thorbjarnarson, J. B. (1990). Notes on the feeding behavior of the Gharial (Gavialis
gangeticus) under seminatural conditions. Journal of Herpetology 24, 99-100.
Thorpe, R. S. (1984). Coding morphometric characters for constructing distance wagner
networks. Evolution 38, 244-255.
Uhen, M. (1998). Middle to late Eocene basilisaurines and dorudontines. In The
Emergence of Whales: Patterns in the Origins of Cetacea, (ed. J. G. M. Thewissen),
pp. 29-61. New York: Plenum Press.

89
Vaughn, R. L., Würsig, B., Shelton, D. S., Timm, L. L. and Watson, L. A. (2008).
Dusky dolphins influence prey accessibility for seabirds in admiralty bay, New
Zealand. Journal of Mammalogy 89, 1051-1058.
Wainwright, P. C. and Day, S. W. (2007). The forces exerted by aquatic suction
feeders on their prey. Journal of the Royal Society Interface 4, 553-560.
Wainwright, P. C., Alfaro, M. E., Bolnick, D. I. and Hulsey, C. D. (2005). Many-to-
one mapping of form to function: a general principal in organismal design.
Integrative and Comparative Biology 45, 256–262.
Wainwright, P. C., Ferry-Graham, L. A., Waltzek, T. B., Carroll, A. M., Hulsey, C.
D. and Grubich, J. R. (2001). Evaluating the use of ram and suction during prey
capture by cichlid fishes. Journal of Experimental Biology 204, 3039-3051.
Werth, A. J. (2000). A kinematic study of suction feeding and associated behavior in
the long-finned pilot whale, Globicephala melas (Traill). Marine Mammal Science
16, 299–314.
Werth, A. J. (2006). Mandibular and dental variation and the evolution of suction
feeding in Odontoceti. Journal of Mammalogy 87, 579–588.
Westneat, M. W. (1995). Feeding, function, and phylogeny: analysis of historical
biomechanics in Labrid fishes using comparative methods. Systematic Biology 44,
361–383.
Westneat, M. W. (2004). Evolution of levers and linkages in the feeding mechanism of
fishes. Integrative and Comparative Biology 44.
Westneat, M. W. and Wainwright, P. C. (1985). Feeding mechanism of Epibulus
insidiator (Labridae; Teleostei): evolution of a novel functional system. Journal of
Morphology 202, 129–150.
Wilga, C. D. and Motta, P. J. (1998). Feeding mechanism of the Atlantic guitarfish
Rhinobatos lentiginosus: modulation of kinematic and motor activity. Journal of
Experimental Biology 201, 3167-3184.
Wilga, C. D. and Motta, P. J. (2000). Durophagy in sharks: feeding mechanics of the
hammerhead Sphyrna tiburo. Journal of Experimental Biology 203, 2781–2796.

90
Würsig, B. and Würsig, M. (1980). Behavior and ecology of the dusky dolphin,
Lagenorhynchus obscurus, in the south Atlantic. Fishery Bulletin 77, 871-890.

91
APPENDIX A
Table of gap coded characters. Each species that was used for the respective variable is
listed, along with species means. The bold value in this column is group standard
deviation. Coded character states are also listed, along with the constant (bold) used to
calculate significant gaps.
Variable SD Gap
criteria Variable SD Gap
criteria Species Mean Code Species Mean Code duration of event 0.244 0.70 gape angle opening velocity 93.683 1.00 Phocoena phocoena 0.22 0 T. truncatus 84.00 0
Lagenorhynchus obliquidens 0.28 0 G. melas 107.47 0
Kogia spp. 0.47 1 D. leucas 119.72 0 Globicephala melas 0.58 1 L. obliquidens 248.38 1 Delphinapterus leucas 0.68 1 Kogia spp. 293.00 1 Tursiops truncatus 0.86 2 velocity of prey 75.195 1.00 max gape 2.755 1.00 Kogia spp. 41.00 0 P. phocoena 4.00 0 L. obliquidens 89.30 0 D. leucas 6.35 0 G. melas 114.47 0 L. obliquidens 6.45 0 D. leucas 219.06 1 Kogia spp. 8.54 0 G. melas 9.00 0 hyolingual depression 0.984 1.00 T. truncatus 12.00 1 Kogia spp. 2.25 0 G. melas 2.67 0 time to max gape 0.139 1.00 D. leucas 2.68 0 L. obliquidens 0.14 0 L. obliquidens 3.38 0 D. leucas 0.28 0 T. truncatus 4.75 1 P. phocoena 0.28 0
Kogia spp. 0.28 0 time to hyolingual depression 0.165 1.00
G. melas 0.33 0 L. obliquidens 0.19 0 T. truncatus 0.56 1 Kogia spp. 0.28 0 D. leucas 0.40 0 max gape angle 10.316 1.00 G. melas 0.43 0 G. melas 15.88 0 T. truncatus 0.62 1 D. leucas 16.38 0 L. obliquidens 16.81 0 suction distance 4.689 1.00 T. truncatus 25.00 0 T. truncatus -2.45 0 Kogia spp. 40.00 1 Kogia spp. 5.19 1 L. obliquidens 6.01 1 G. melas 9.04 1 D. leucas 8.96 1

92
Variable SD Gap
criteria Variable SD Gap
criteria Species Mean Code Species Mean Code ram distance 16.267 1.00 Tongue width:length 0.100 1.00 Kogia spp. 1.16 0 Mysticeti 0.17 0 L. obliquidens 16.85 0 Phocoenidae 0.31 1 G. melas 18.99 0 Physeteridae 0.35 1 D. leucas 25.60 0 Delphinidae 3 0.35 1 T. truncatus 46.00 1 Delphinidae 2 0.37 1 Delphinidae 5 0.48 2 RSI 0.577 0.80 Monodontidae 0.51 2 Kogia spp. -0.66 0 G. melas 0.26 1 MBI 0.170 0.50 D. leucas 0.32 1 Kogiidae 0.92 0 L. obliquidens 0.43 1 Delphinidae 5 0.72 1 T. truncatus 0.94 2 Monodontidae 0.69 1 Delphinidae 4 0.68 1 subambient pressure 48.030 1.00 Phocoenidae 0.67 4 G. melas -19.55 0 Physeteridae 0.57 2 L. obliquidens -27.05 0 Delphinidae 3 0.52 2 P. phocoena -33.00 0 Delphinidae 6 0.48 2 D. leucas -121.96 1 Ziphiidae 0.46 2 Delphinidae 2 0.43 2 total tooth counts 54.742 0.400 Delphinidae 1 0.42
Ziphiidae 8 0 Lipotidae, Pontoporiidae, Iniidae 0.38 2
Monodontidae 21 0 Platanistidae 0.32 2 Kogiidae 32 0 Delphinidae 5 48 0 Hyoid L1:W 0.085 0.60 Delphinidae 4 55 0 Delphinidae 2 0.50 0 Physeteridae 82 1 Delphinidae 1 0.52 0 Phocoenidae 84 1 Delphinidae 6 0.57 1 Delphinidae 1 124 2 Delphinidae 3 0.59 1 Delphinidae 3 124 2 Delphinidae 5 0.62 1
Delphinidae 6 137 2 Lipotidae, Pontoporiidae, Iniidae 0.65 1
Platanistidae 148 2 Phocoenidae 0.66 1
Lipotidae, Pontoporiidae, Iniidae 155 2 Monodontidae 0.67 1
Delphinidae 2 167 2 Ziphiidae 0.78 2

93
VITA
Name: Emily Alison Kane
Address: 6157 Franconia Station Lane, Alexandria, VA 22310 Email Address: [email protected] Education: B.S., Marine Science, concentration in Biology, Southampton
College of Long Island University, 2006 M.S., Wildlife and Fisheries Sciences, Texas A&M University, 2009