comparative pm 2010 tw
DESCRIPTION
VMM Vergelijking fijn stofTRANSCRIPT
Comparative PM Measurements
in Flanders (Belgium)
2010 campaign

DOCUMENT DESCRIPTION Title Comparative PM Measurements in Flanders (Belgium) - 2010 campaign Authors Flemish Environment Agency, Section Air Content This report describes the results of PM10 and PM2.5 comparison tests between four types of automated monitors and the gravimetric reference method, carried out at different sites in Flanders during 2010. Way of referring VMM (2011), Comparative PM10 and PM2.5 Measurements in Flanders, 2010 campaign. Publisher Philippe D’Hondt, Head of Air, Environment and Communication Department Flemish Environment Agency Questions regarding this report: VMM-info A. Van De Maelestraat 96 9320 Erembodegem Belgium Tel: +32 (0)53 72 64 45; fax: +32 (0)53 71 10 78 e-mail: [email protected] Depot number D/2011/6871/022
2

Comparative PM Measurements in Flanders (Belgium) - 2010 campaign
Summary The current European reference methods for measuring PM in ambient air (EN12341 for PM10 and EN14907 for PM2.5) are based on a 24-hour collection followed by gravimetric analysis. The monitoring networks are however required to use continuous automated monitors to provide real-time information. These monitors use different operation principles than the reference method. Therefore the networks have to demonstrate that the automated instruments can produce results that are comparable with the reference method. This process is called Demonstration of Equivalence and mainly consists of executing comparative measurements between the reference method and the automated monitors. The advised (but strictly speaking not mandatory) procedure for this can be found in the European Commission’s ‘Guide to the demonstration of equivalence of ambient air monitoring methods’ . In addition to this document there is an Excel file that automatically calculates certain calibration and uncertainty parameters. In 2010 VMM made more than 3000 comparisons between 24h reference values and 24h values of automated PM monitors. Four types of automated monitors were evaluated: ESM, TEOM, FDMS and BAM. Eight different locations were used:
Antwerpen-Berendrecht (AB02) Antwerpen-Borgerhout, urban background station (R801) Antwerpen-Borgerhout, street side station (R802) Antwerpen-Luchtbal (M802) Gent (R701) Houtem (N029) Mechelen (ML01) Retie (RT01)
The reference samplers were equipped with the same filters as in the previous comparison study: Pall Tissuquartz 2500 QAT-UP for PM10 and Pall Teflo 2 µm membrane filters for PM2.5. New in this study was that a flow correction - based on multiple and traceable flow measurements in the field - was carried out to lower the uncertainty. The deviations from the nominal flow before the correction varied between -1% and +5%
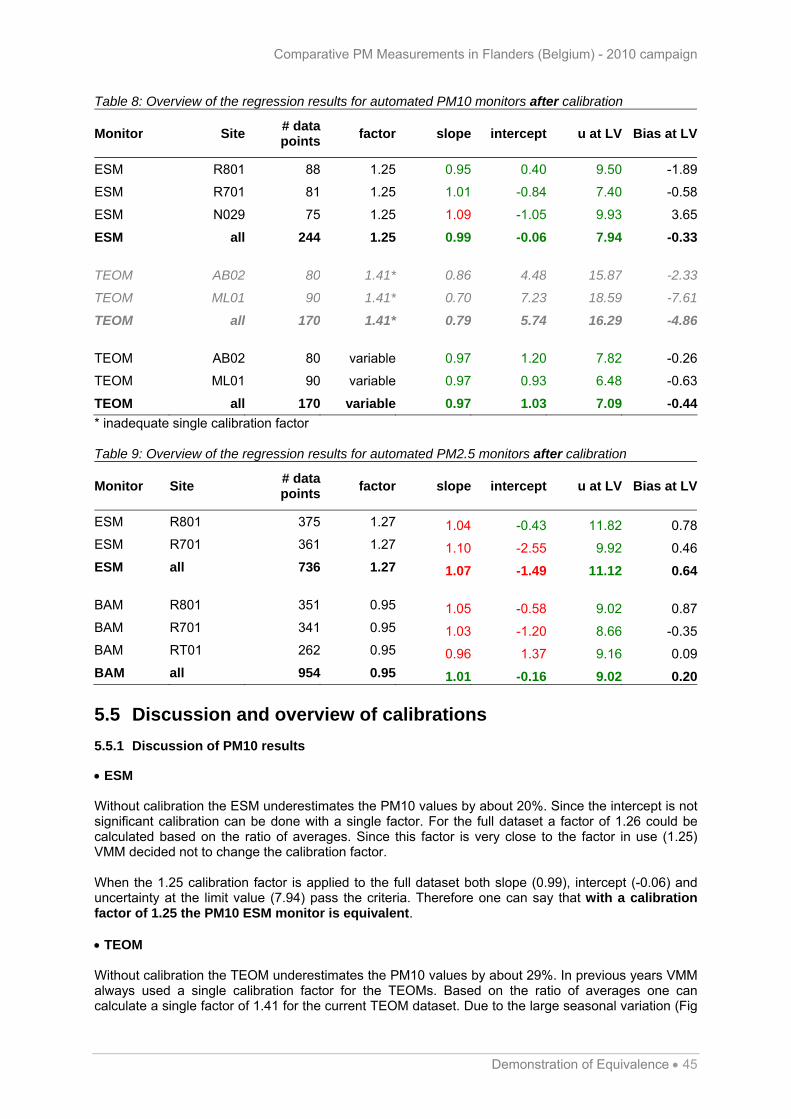
Field blanks are slightly lower than in the previous study, with a median of 55 µg for quartz filters (PM10) and 34 µg for teflon filters (PM2.5). As in many European networks, a significant fraction of the field blanks is higher than the ‘to investigate’ limit in the standard: 43% of quartz field blanks (PM10) are higher than 60 µg and 40% of teflon field blanks (PM2.5) are higher than 40 µg. A full year comparison in Retie shows no significant difference between the quartz and teflon reference filters when sampling PM2.5. For the ESM monitor the calculated calibration factors are 1.26 for PM10 and 1.28 for PM2.5. These are very close to existing factors 1.25 and 1.27. Because the new dataset is also equivalent with the existing factors VMM decides not to change the factors in use.
For the FDMS monitor 2 out of the 8 investigated monitors overestimated the PM concentrations due to problems with the dryer. After exclusion of these datasets the PM10 and PM2.5 FDMS monitors do not require calibration to be equivalent. Therefore the FDMS monitors will continue to be operated without calibration.
For the TEOM monitor (only used for PM10) a variable calibration is required to obtain equivalence. Similar to techniques that are applied in the United Kingdom and France the TEOM data will now be corrected based on the differences in concentration between a set of FDMS and a set of TEOM instruments. All data from 1 Jan 2009 onward is recalculated using this new approach. For the BAM monitor (only used for PM2.5) equivalence can be obtained by using a calibration factor of 0.95.
Summary 3

Comparative PM Measurements in Flanders (Belgium) - 2010 campaign
Samenvatting De huidige Europese referentiemethoden voor het meten van PM in buitenlucht (EN12341 voor PM10 en EN14907 voor PM2,5) is gebaseerd op een 24-uurs monsterneming en gravimetrische analyse. Toch dienen de netwerken continue automatische monitoren te gebruiken om real-time gegevens te kunnen aanbieden aan het publiek. Deze monitoren zijn gebaseerd op andere meetprincipes dan de referentiemethode. Daarom moeten de netwerken aantonen dat deze toestellen resultaten kunnen geven die vergelijkbaar zijn met die van de referentiemethode. Dit proces staat bekend als het aantonen van equivalentie (Demonstration of Equivalence) en bestaat voornamelijk uit het uitvoeren van vergelijkende oefeningen tussen de referentiemethode en de automatische monitoren. De aanbevolen, maar strikt genomen niet verplichte, procedure staat beschreven in het document ‘Guide to the demonstration of equivalence of ambient air monitoring methods’. Bij dit document hoort tevens een Excel bestand voor het automatisch berekenen van kalibratiefuncties en onzekerheden. In 2010 vergeleek VMM meer dan 3000 dagwaarden van referentiesamplers met de dagwaarden van automatische PM monitoren. Het onderzoek omvatte vier types monitoren: ESM, TEOM, FDMS en BAM. Het vond plaats op acht verschillende meetplaatsen:
Antwerpen-Berendrecht (AB02) Antwerpen-Borgerhout, stedelijke achtergrond (R801) Antwerpen-Borgerhout, verkeersstation (R802) Antwerpen-Luchtbal (M802) Gent (R701) Houtem (N029) Mechelen (ML01) Retie (RT01)
In de referentiesamplers gebruikte VMM dezelfde filters als bij de vorige vergelijkende studie: Pall Tissuquartz 2500 QAT-UP voor PM10 en Pall Teflo 2 µm membraan filters voor PM2,5. Nieuw was wel dat er een debietcorrectie - op basis van meerdere, traceerbare debietmetingen in het veld - werd uitgevoerd om de onzekerheid op de metingen te verlagen. De afwijkingen van het debiet vóór de correctie lagen tussen -1% en +5%. De veldblanco’s zijn iets lager dan in de vorige studie, met een mediaan van 55 µg voor kwartsfilters (PM10) en 34 µg voor teflon filters (PM2,5). Zoals bij vele Europese netwerken is een aanzienlijk deel van de veldblanco’s hoger dan de ‘te onderzoeken’ limiet in de norm: 43% van de kwarts blanco’s (PM10) is hoger dan 60 µg en 40% van de teflon veldblanco’s (PM2,5) is hoger dan 40 µg. Een vergelijking gedurende een volledig jaar toont aan dat er geen significant verschil is tussen de kwarts en teflon filters bij de bemonstering van PM2,5. Voor de ESM monitor geven de berekeningen kalibratiefactoren van 1,26 voor PM10 en 1,28 voor PM2,5. Deze liggen zeer dicht bij de huidige factoren 1,25 en 1,27. Omdat de nieuwe dataset ook equivalent is met deze huidige factoren beslist VMM de huidige factoren niet te wijzigen. Voor de FDMS monitor bleken 2 van de 8 onderzochte monitoren de PM concentraties te overschatten door problemen met de droger. Na het buiten beschouwing laten van deze twee datasets blijkt dat de FDMS monitoren geen kalibratie nodig hebben om equivalent te zijn. VMM zal dus de FDMS monitoren blijven gebruiken zonder kalibratie. Voor de TEOM monitor (enkel in gebruik voor PM10) is er een variabele correctie nodig om equivalentie aan te tonen. Net als in het Verenigd Koninkrijk en Frankrijk zal VMM de TEOM metingen voortaan corrigeren op basis van de verschillen in concentratie tussen een set FDMS monitoren en een set TEOM monitoren. VMM herberekent ook alle TEOM waarden vanaf 1 januari 2009 met deze nieuwe aanpak. Voor de BAM monitor (enkel in gebruik voor PM2.5) blijkt equivalentie mogelijk met een kalibratiefactor van 0,95.
4 Samenvatting

Comparative PM Measurements in Flanders (Belgium) - 2010 campaign
TABLE OF CONTENT Summary ................................................................................................................... 3 Samenvatting ............................................................................................................ 4 1 .......................................................................................................... 9 Introduction
1.1 ............................................................................................................................... 9 Measuring PM1.2 ....................................................................................................... 9 Demonstration of equivalence1.3 ................................................................................................. 9 Issues with the reference method1.4 .............................................................................................. 9 Previous VMM Comparison studies
2 .............................................................................................11 Experimental setup2.1 .................................................................................................................................. 11 Introduction2.2 ............................................................................................................................. 11 Sampling sites
2.2.1 ........................................................................................ 11 Antwerpen-Berendrecht (AB02)2.2.2 ............................................... 12 Antwerpen-Borgerhout, urban background station (R801)2.2.3 ........................................................... 12 Antwerpen-Borgerhout, street side station (R802)2.2.4 .............................................................................................. 13 Antwerpen-Luchtbal (M802)2.2.5 ...................................................................................................................... 13 Gent (R701)2.2.6 .................................................................................................................. 14 Houtem (N029)2.2.7 .............................................................................................................. 14 Mechelen (ML01)2.2.8 ...................................................................................................................... 15 Retie (RT01)
2.3 .................................................................................................................................. 15 Instruments2.3.1 ............................................................................................................. 15 Leckel SEQ 47/502.3.2 .................................................................................................................. 16 ESM FH 62 I-R2.3.3 ................................................................................................................... 17 TEOM 1400ab2.3.4 ............................................................................................... 17 Series 8500 FDMS System2.3.5 ......................................................................................................................... 18 BAM 1020
2.4 .................................................................................................. 18 Weighing and handling of filters2.5 ............................................................................................................................. 19 Data treatment
2.5.1 .......................................................................................... 19 Validation and Quality Control2.5.2 .................................................................................................................. 19 Outlier removal2.5.3 .............................................................................. 20 Calibration factor/equation calculation
2.6 ..................................................................................................................... 21 Campaign overview2.6.1 ........................................................................................................... 21 Time & instruments2.6.2 ........................................................................................................... 22 Meteorological data
3 .....................................................................23 The gravimetric reference method3.1 .................................................................................................................................. 23 Introduction3.2 .................................................................................................... 23 History of filter choice at VMM3.3 ................................................................................................................................. 24 Field blanks3.4 ................................................................................................. 25 PM2.5 filter comparison in Retie
4 ............................................................26 Comparisons with automated monitors4.1 .................................................................................................................................. 26 Introduction4.2 ............................................................................................... 26 Concentrations during campaigns4.3 ............................................................................................................................ 27 Daily ratio plots
4.3.1 ................................................................................................................................. 27 PM104.3.2 ................................................................................................................................ 28 PM2.5
4.4 ......................................................................................... 29 Automated vs. reference scatter plots4.4.1 ........................................................................................................................ 30 PM10 ESM4.4.2 ..................................................................................................................... 32 PM10 TEOM4.4.3 ...................................................................................................................... 33 PM10 FDMS4.4.4 ....................................................................................................................... 36 PM2.5 ESM4.4.5 ..................................................................................................................... 38 PM2.5 FDMS4.4.6 ....................................................................................................................... 40 PM2.5 BAM
5 ...........................................................................42 Demonstration of equivalence5.1 .................................................................................................................................. 42 Introduction5.2 .................................................................................................................. 42 Suitability of datasets5.3 ...................................................................................................... 42 Between sampler uncertainty
5.3.1 ................................................................................................... 42 Reference method (RM)5.3.2 ................................................................................................. 42 Automated monitors (AM)
5.4 .................................................................. 43 Automated vs Reference method regression results
5

Comparative PM Measurements in Flanders (Belgium) - 2010 campaign
6
5.5 ..................................................................................... 45 Discussion and overview of calibrations5.5.1 ............................................................................................... 45 Discussion of PM10 results5.5.2 .............................................................................................. 47 Discussion of PM2.5 results
5.6 ............................................................................................................. 48 Equivalence conclusions
Comparative PM Measurements in Flanders (Belgium) - 2010 campaign
FIGURES Fig 1: The monitoring site AB02 in Antwerpen-Berendrecht ................................................................. 11 Fig 2: The monitoring site R801 in Antwerpen-Borgerhout ................................................................... 12 Fig 3: The monitoring site R802 in Antwerpen-Borgerhout ................................................................... 12 Fig 4: The monitoring site AB02 in Antwerpen-Luchtbal ....................................................................... 13 Fig 5: The monitoring site R701 in Gent................................................................................................ 13 Fig 6: The monitoring site N029 in Houtem........................................................................................... 14 Fig 7: The monitoring site ML01 in Mechelen ....................................................................................... 14 Fig 8: The monitoring site RT01 in Retie............................................................................................... 15 Fig 9: The Leckel SEQ 47/50 reference sampler .................................................................................. 16 Fig 10: The ESM FH 62 I-R monitor...................................................................................................... 16 Fig 11: The TEOM Series 1400ab monitor............................................................................................ 17 Fig 12: The Series 8500 FDMS System monitor................................................................................... 17 Fig 13: The BAM 1020 monitor ............................................................................................................. 18 Fig 14: Weighing cupboard ................................................................................................................... 19 Fig 15: Meteorological data, Gent-Tolhuiskaai (M701) ......................................................................... 22 Fig 16: Histogram of quartz and teflon field blanks ............................................................................... 24 Fig 17: Scatter plot for the two PM2.5 samplers in Retie ...................................................................... 25 Fig 18: Average PM10 reference concentrations for all involved stations ............................................ 26 Fig 19: Average PM2.5 reference concentrations for all involved stations ........................................... 26 Fig 20: Daily ratios between reference and ESM monitors for PM10 ................................................... 27 Fig 21: Daily ratios between reference and TEOM monitors for PM10................................................. 27 Fig 22: Daily ratios between reference and FDMS monitors for PM10................................................. 28 Fig 23: Daily ratios between reference and ESM monitors for PM2.5 .................................................. 28 Fig 24: Daily ratios between reference and FDMS monitors for PM2.5................................................ 29 Fig 25: Daily ratios between reference and BAM monitors for PM2.5 .................................................. 29 Fig 26: ESM vs reference method for PM10 at R801 ........................................................................... 30 Fig 27: ESM vs reference method for PM10 at R701 ........................................................................... 30 Fig 28: ESM vs reference method for PM10 at N029 ........................................................................... 31 Fig 29: ESM vs reference method for PM10 (full dataset) .................................................................... 31 Fig 30: TEOM vs reference method for PM10 at AB02......................................................................... 32 Fig 31: TEOM vs reference method for PM10 at ML01 ........................................................................ 32 Fig 32: TEOM vs reference method for PM10 (full dataset).................................................................. 33 Fig 33: FDMS vs reference method for PM10 at ML01......................................................................... 33 Fig 34: FDMS vs reference method for PM10 at M802......................................................................... 34 Fig 35: FDMS vs reference method for PM10 at R701 ......................................................................... 34 Fig 36: FDMS vs reference method for PM10 at R802 ......................................................................... 35 Fig 37: FDMS vs reference method for PM10 at RT01......................................................................... 35 Fig 38: FDMS vs reference method for PM10 (full dataset without M802) ........................................... 36 Fig 39: ESM vs reference method for PM2.5 at R801 .......................................................................... 36 Fig 40: ESM vs reference method for PM2.5 at R701 .......................................................................... 37 Fig 41: ESM vs reference method for PM2.5 (full dataset) ................................................................... 37 Fig 42: FDMS vs reference method for PM2.5 at R801 ........................................................................ 38 Fig 43: FDMS vs reference method for PM2.5 at R701 ........................................................................ 38 Fig 44: FDMS vs reference method for PM2.5 at RT01........................................................................ 39 Fig 45: FDMS vs reference method for PM2.5 (full dataset without RT01) .......................................... 39 Fig 46: BAM vs reference method for PM2.5 at R801 .......................................................................... 40 Fig 47: BAM vs reference method for PM2.5 at R701 .......................................................................... 40 Fig 48: BAM vs reference method for PM2.5 at RT01 .......................................................................... 41 Fig 49: BAM vs reference method for PM2.5 (full dataset) ................................................................... 41 Fig 50: TEOM after the new calibration vs reference method for PM10 (full dataset) ......................... 46
7

Comparative PM Measurements in Flanders (Belgium) - 2010 campaign
TABLES Table 1: Campaign overview................................................................................................................. 21 Table 2: Basic statistics for the meteorological data of the campaign .................................................. 22 Table 3: Statistical parameters regarding quartz and teflon field blanks .............................................. 24 Table 4: Statistical parameters regarding the quartz and teflon PM2.5 datasets in Retie .................... 25 Table 5: Overview of calibration approaches for the different monitors................................................ 43 Table 6: Overview of the regression results for automated PM10 monitors before calibration............ 44 Table 7: Overview of the regression results for automated PM2.5 monitors before calibration........... 44 Table 8: Overview of the regression results for automated PM10 monitors after calibration............... 45 Table 9: Overview of the regression results for automated PM2.5 monitors after calibration.............. 45
8

Comparative PM Measurements in Flanders (Belgium) - 2010 campaign
Introduction 9
1 Introduction
1.1 Measuring PM
Considering the health issues of particulate matter (PM), the importance of accurate and reliable PM data can hardly be overestimated. The fact that PM is not defined by a chemical formula and that therefore PM is specified solely by a reference method (in Europe: EN12341 for PM10 and EN14907 for PM2.5) creates a real challenge not often encountered with other pollutants. The reference methods require PM to be collected on a filter during 24 hours. Based on the mass difference of the filter and the sampled volume the PM concentration can be calculated. The major drawback of this approach is that it only provides 24-hour values and this with a certain delay because filters have to be collected from the field and weighed under controlled conditions in the lab. As the EU also requires the Member States to inform the public with real-time information on PM levels the use of continuous automated PM monitors is unavoidable. Unfortunately the automated monitors use different operation principles than the reference methods.
1.2 Demonstration of equivalence
For the results of the automated methods (called ‘candidate methods’) to be accepted, the Member States have to demonstrate that these results are ‘equivalent’ to those of the reference method. The advised (but strictly speaking not mandatory) procedure for this can be found in the ‘Guide to the demonstration of equivalence of ambient air monitoring methods’1. The most important point in this document is the aspect of (a minimum number of) field comparisons between the candidate method and the reference method. In addition to this document there is a European Excel file that automatically calculates certain calibration and uncertainty parameters. At a European ‘equivalence’ workshop in Italy2 (May 2007) several issues were discussed and a number of suggestions where done to update the current document, some of which were taken into account in the latest edition.
1.3 Issues with the reference method
Apart from the problems with the equivalence procedure there is a second, and possibly even more important problem, namely the uncertainty ‘within’ the current European reference method. Recent studies (e.g. by VMM in 2007)3 have demonstrated that the uncertainty of several aspects of the reference method EN12341 has been underestimated. Currently experts believe the two most important issues contributing to the uncertainty are the influence of the filter type and brand and the effect of filter conditioning before weighing.
1.4 Previous VMM Comparison studies
A first VMM comparison study4 was carried out in 2001 and 2002. Two general calibration factors were calculated: 1.37 (for ESM FH 62 I-N and ESM FH 62 I-R at 40 °C) and 1.47 (for TEOM at 40 °C). Cellulose nitrate (CN) was used as reference filter (in those days a previous short comparison campaign had shown no significant difference between CN and a quartz type filter). In 2003 and 2004 a second study5 was done. For the ESM FH 62 I-R (now with dynamic heating) a factor of 1.39 was calculated, while the TEOM (now at 50 °C) gave a factor of 1.49. Both were calculated versus a reference method which still used cellulose nitrate filters. Taking into account the
1http://ec.europa.eu/environment/air/quality/legislation/pdf/equivalence.pdf 2Demonstration of Equivalence of Ambient Air Monitoring Methods, 2-4 May 2007, JRC-IES, Ispra Italy 3 VMM (2007), Comparative PM10 Measurements in Flanders, Period 2005-2006 4 VMM (2003). Vergelijkende PM10-metingen, periode 2001-2002, Vlaamse Milieumaatschappij, February 2003 5 VMM (2005). Vergelijkende PM10-metingen, periode 2004, Vlaamse Milieumaatschappij, April 2005
Comparative PM Measurements in Flanders (Belgium) - 2010 campaign
10 Introduction
uncertainty and variation on the factors and the small difference with those of the first study VMM decided to keep using the factors 1.37 and 1.47. A third study in 2005-2006 used quartz fiber filters for the reference method and different types and brands of filters were compared. For certain campaigns the differences between different brands of quartz filters were as high as 29%. Continuous automated monitors were compared with two variations of the reference method (one with Machery-Nagel filters and one with Whatman filters). The range of calibration factors for ESM and TEOM more or less covered the factors in use (1.37 and 1.47 respectively). Because of this and the fact that the PM10 reference method was (and still is) being updated by CEN VMM again decided not to update its factors. When taking into account the expanded uncertainty at the limit value criterion (< 25%) only TEOM-FDMS managed to pass without applying a calibration factor. ESM passed after applying a calibration factor and TEOM only passed after applying a calibration factor for the MN dataset. The fourth intercomparison was linked to the PM10 chemical characterization project6 that was carried out from September 2006 until September 2007 at six locations in Flanders. Every sixth day simultaneous sampling was carried out at all the sites. At each location two PM10 Leckels were placed: one with quartz filters (Whatman QM-A) and one with teflon filters (Pall Teflo). It turned out that overall the mass on the Whatman QM-A filters (which were pre-fired) was 8% higher than on the teflon filters. Again the range of the calibration factors for ESM and TEOM covered the factors in use, so no change was made to the existing procedure. For the PM2.5 ESM monitor a first factor of 1.46 was calculated. For FDMS calibration was not needed. In 2008-2009 a fifth intercomparison campaign7 was again linked to a PM10 chemical characterization project. A total of over 2300 comparisons were done at 10 locations with sampling every 6th day. For this campaign VMM switched to Pall Tissuquartz 2500 QAT-UP filters for PM10 and Pall Teflo 2 µm membrane filters for PM2.5. This change of filter was made based on different types of information that indicated that there were issues with the Whatman QM-A filters (e.g. irreversible uptake of water). Pall Teflo was chosen for PM2.5 because this type of filter hardly suffers from the ‘water uptake’ artifact. The Pall quartz fiber filter was chosen because the current reference method only allows quartz fiber filters for PM10 and because the sometimes very high concentrations of PM10 can cause the teflon filters to clog. The comparison resulted in an adaption of the calibration factors for ESM. The factor was lowered from 1.37 to 1.25 for PM10 and from 1.46 to 1.27 for PM2.5. For FDMS calibration was again not needed, although some instruments that were located in mobile trailers had to be left out from the test because of issues with temperature control. Although the fifth campaign did not include any TEOM samplers VMM decided that keeping its old PM10 factor of 1.47 would create a disparity within the Flemish network. So based on the reduction for the ESM a ‘best possible estimate’ of 1.35 for the PM10 TEOM monitor was calculated.
6 VMM (2008), Chemkar PM10: Chemische karakterisatie van fijn stof in Vlaanderen, 2006-2007 7 VMM (2010), Comparative PM10 and PM2.5 Measurements in Flanders, Period 2008-2009

Comparative PM Measurements in Flanders (Belgium) - 2010 campaign
2 Experimental setup
2.1 Introduction
Eight sites were used for the 2010 PM comparison exercises:
Antwerpen-Berendrecht AB02 (suburban / industrial) Antwerpen-Borgerhout R801 (urban background) Antwerpen-Borgerhout R802 (street side) Antwerpen-Luchtbal M802 (street side / suburban / industrial) Gent R701 (urban background) Houtem N029 (rural) Mechelen ML01 (suburban) Retie RT01 (rural)
2.2 Sampling sites
2.2.1 Antwerpen-Berendrecht (AB02)
The monitoring site AB02 in the village of Berendrecht (population 6 000) is in a suburban area. The village borders the port of Antwerp in the S and W and is 15km NW of the Antwerp city centre (population 500 000). The site is 30m to the E of a local road and 1 km N of the Antwerp Bulk Terminal (mainly transshipment of coal and ores). The highway A12 passes 1.7km to the E.
Fig 1: The monitoring site AB02 in Antwerpen-Berendrecht
Experimental setup 11
Comparative PM Measurements in Flanders (Belgium) - 2010 campaign
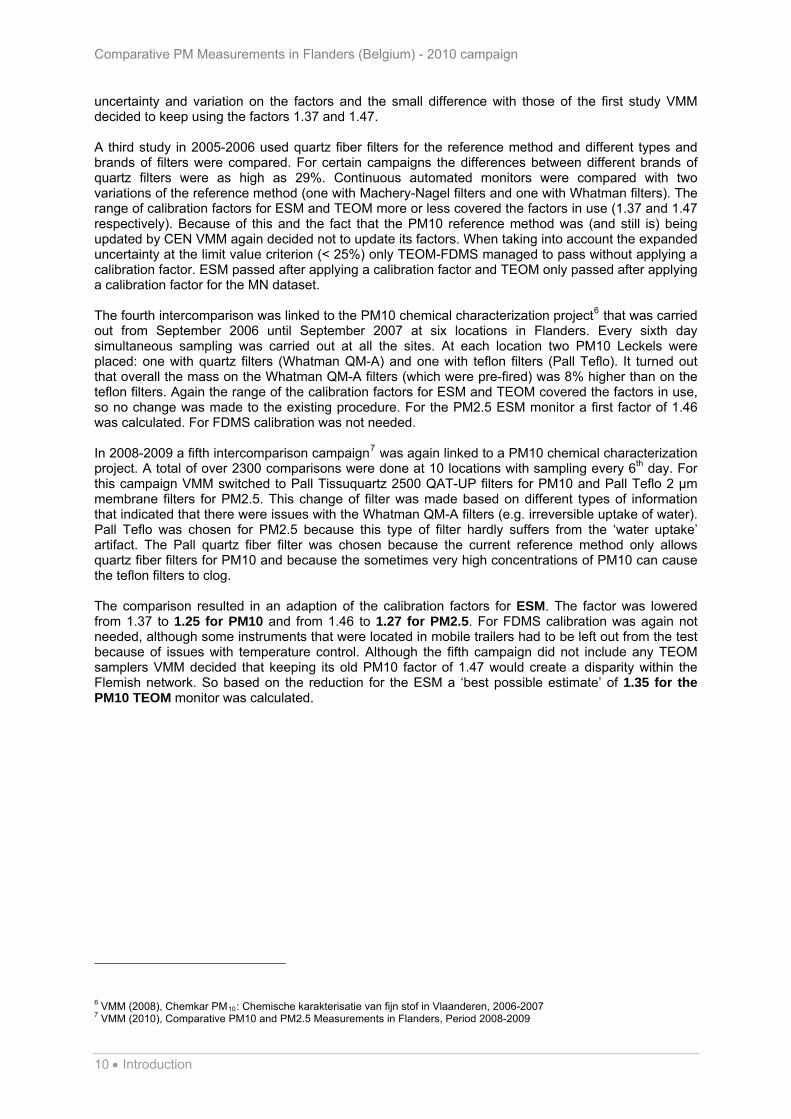
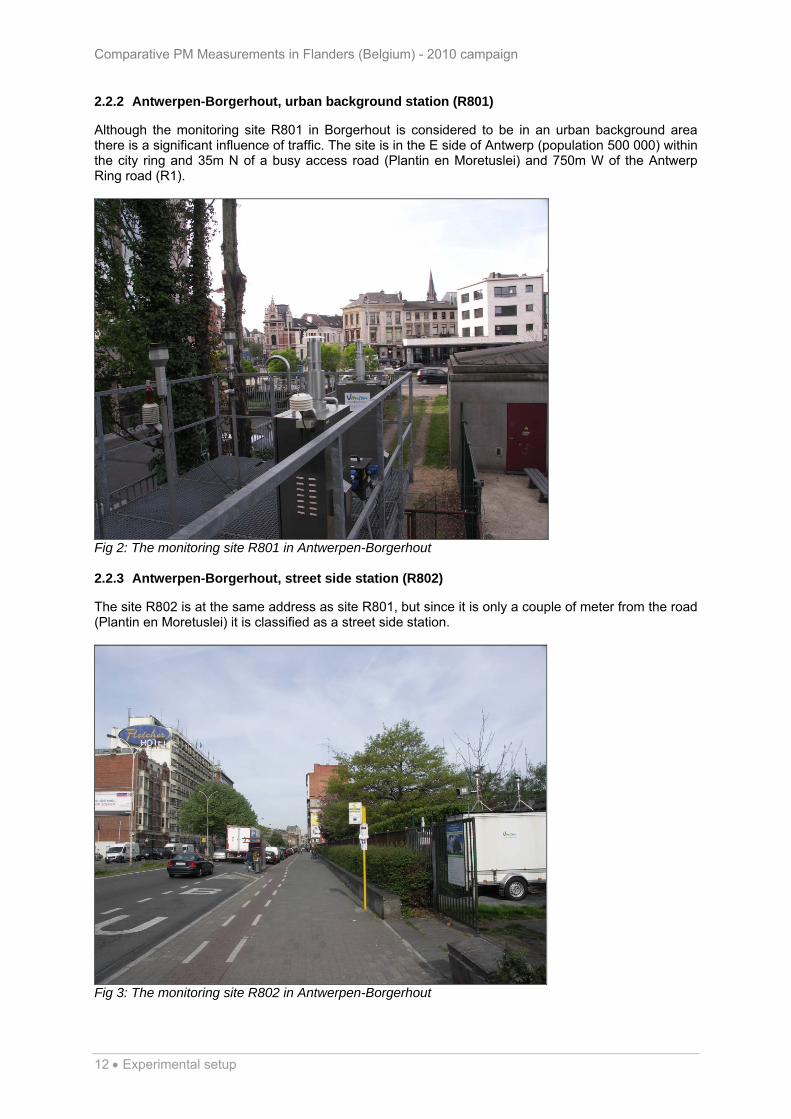
2.2.2 Antwerpen-Borgerhout, urban background station (R801)
Although the monitoring site R801 in Borgerhout is considered to be in an urban background area there is a significant influence of traffic. The site is in the E side of Antwerp (population 500 000) within the city ring and 35m N of a busy access road (Plantin en Moretuslei) and 750m W of the Antwerp Ring road (R1).
Fig 2: The monitoring site R801 in Antwerpen-Borgerhout 2.2.3 Antwerpen-Borgerhout, street side station (R802)
The site R802 is at the same address as site R801, but since it is only a couple of meter from the road (Plantin en Moretuslei) it is classified as a street side station.
Fig 3: The monitoring site R802 in Antwerpen-Borgerhout
12 Experimental setup

Comparative PM Measurements in Flanders (Belgium) - 2010 campaign
2.2.4 Antwerpen-Luchtbal (M802)
The site M802 is in a suburban area about 5 km N of the city centre of Antwerp at the eastern border of the port of Antwerp. The site is influenced by traffic from all directions: a local access road 25m to the S, the busy N180 (Noorderlaan) 300m to the W, the highway E19 (=R1) 400m to the E and the A12 highway 300m to the N. There is also a bulk transshipment site 300m to the E.
Fig 4: The monitoring site AB02 in Antwerpen-Luchtbal 2.2.5 Gent (R701)
The site R701 in Gent (population 240 000) is an urban background site in the Baudelo park on the NE side of the inner city. About 700m to the E there is a transshipment site and a busy roundabout (‘Dampoort’).
Fig 5: The monitoring site R701 in Gent
Experimental setup 13
Comparative PM Measurements in Flanders (Belgium) - 2010 campaign
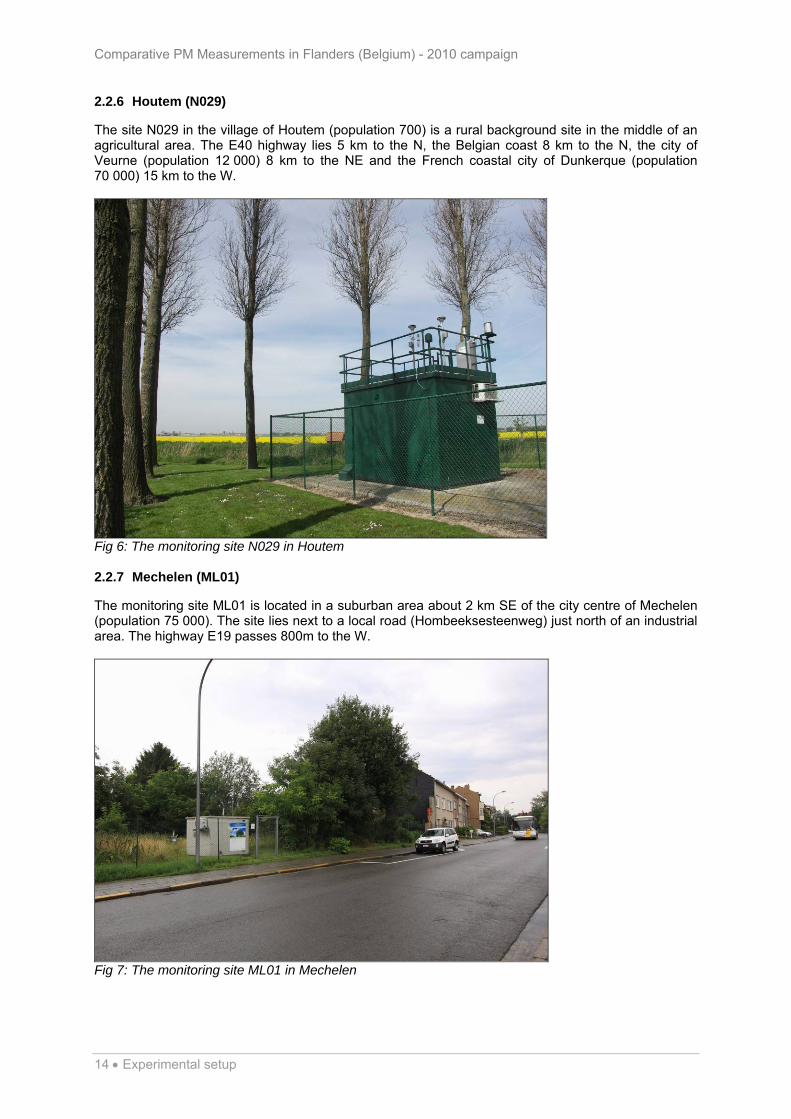
2.2.6 Houtem (N029)
The site N029 in the village of Houtem (population 700) is a rural background site in the middle of an agricultural area. The E40 highway lies 5 km to the N, the Belgian coast 8 km to the N, the city of Veurne (population 12 000) 8 km to the NE and the French coastal city of Dunkerque (population 70 000) 15 km to the W.
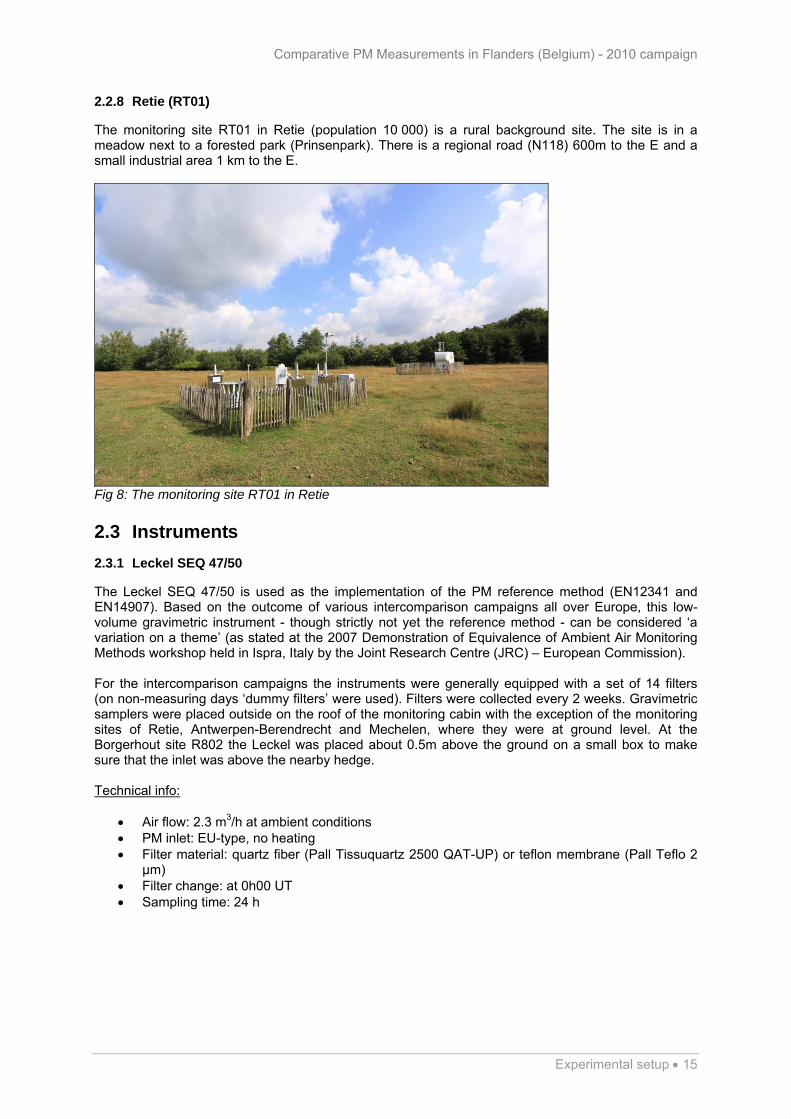
Fig 6: The monitoring site N029 in Houtem 2.2.7 Mechelen (ML01)
The monitoring site ML01 is located in a suburban area about 2 km SE of the city centre of Mechelen (population 75 000). The site lies next to a local road (Hombeeksesteenweg) just north of an industrial area. The highway E19 passes 800m to the W.
Fig 7: The monitoring site ML01 in Mechelen
14 Experimental setup
Comparative PM Measurements in Flanders (Belgium) - 2010 campaign
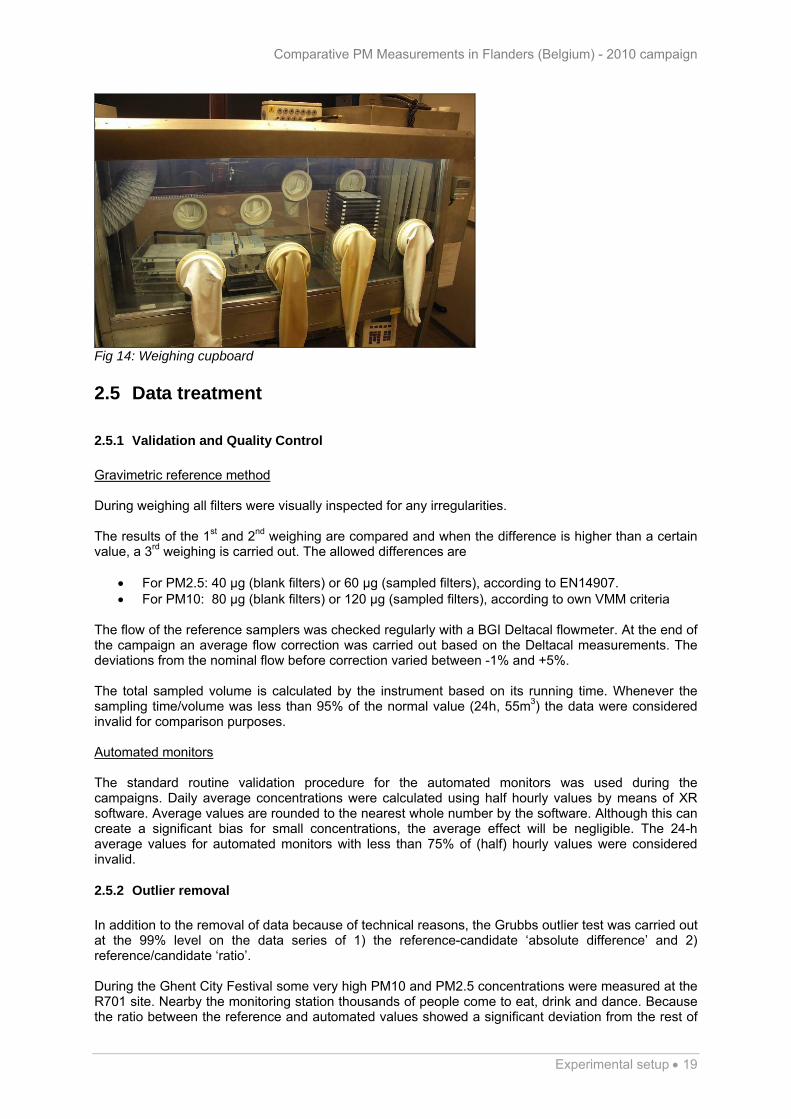
2.2.8 Retie (RT01)
The monitoring site RT01 in Retie (population 10 000) is a rural background site. The site is in a meadow next to a forested park (Prinsenpark). There is a regional road (N118) 600m to the E and a small industrial area 1 km to the E.
Fig 8: The monitoring site RT01 in Retie
2.3 Instruments
2.3.1 Leckel SEQ 47/50
The Leckel SEQ 47/50 is used as the implementation of the PM reference method (EN12341 and EN14907). Based on the outcome of various intercomparison campaigns all over Europe, this low-volume gravimetric instrument - though strictly not yet the reference method - can be considered ‘a variation on a theme’ (as stated at the 2007 Demonstration of Equivalence of Ambient Air Monitoring Methods workshop held in Ispra, Italy by the Joint Research Centre (JRC) – European Commission). For the intercomparison campaigns the instruments were generally equipped with a set of 14 filters (on non-measuring days ‘dummy filters’ were used). Filters were collected every 2 weeks. Gravimetric samplers were placed outside on the roof of the monitoring cabin with the exception of the monitoring sites of Retie, Antwerpen-Berendrecht and Mechelen, where they were at ground level. At the Borgerhout site R802 the Leckel was placed about 0.5m above the ground on a small box to make sure that the inlet was above the nearby hedge. Technical info:
Air flow: 2.3 m3/h at ambient conditions PM inlet: EU-type, no heating Filter material: quartz fiber (Pall Tissuquartz 2500 QAT-UP) or teflon membrane (Pall Teflo 2
µm) Filter change: at 0h00 UT Sampling time: 24 h
Experimental setup 15

Comparative PM Measurements in Flanders (Belgium) - 2010 campaign
Fig 9: The Leckel SEQ 47/50 reference sampler 2.3.2 ESM FH 62 I-R
For general PM10 monitoring the Flemish Environment Agency uses the ESM FH 62 I-R monitor (also known as “FAG” monitor). This instrument uses the technique of β-attenuation (the attenuation of β-rays by a filter is directly related to the amount of mass on the filter). To avoid condensation of water on the filter the inlet is heated. This process not only leads to the loss of water, but also of certain semi-volatile compounds such as ammonium nitrate. Technical info:
Air flow: 1 m3/h at ambient conditions Inlet: US-type, dynamic heating, slightly above ambient temperature, for PM2.5 a sharp cut
cyclone is placed between the PM10-head and the monitor Filter material: glass fibre Beta source: 85Kr
Fig 10: The ESM FH 62 I-R monitor
16 Experimental setup

Comparative PM Measurements in Flanders (Belgium) - 2010 campaign
2.3.3 TEOM 1400ab
The TEOM (Tapered Element Oscillating Microbalance) Series 1400ab instrument is used in the Specific Studies network in Flanders. In this instrument dust is collected on an oscillating filter. A change in mass on the filter induces a change in frequency which allows calculation of the mass increase. Because of its better time resolution this instrument is more suited for monitoring at (industrial) hotspot sites than the β-attenuation monitors. Even more than the ESM, this instrument suffers from loss of material due to the inlet heating. Technical info:
Air flow through sampling head: 1 m3/h at ambient conditions Air flow through filter: 0.18 m3/h at ambient conditions Inlet: US-type, heated to 50 °C Filter material: teflon coated glass fibre (Pallflex TX40)
Fig 11: The TEOM Series 1400ab monitor 2.3.4 Series 8500 FDMS System
The FDMS (Filter Dynamics Measurement System) consists of a TEOM 1400ab system with an add-on unit that allows correction for the loss of mass due to volatilization. The instrument works in two cycles of each six minutes. During one cycle the ‘base’ PM10 is recorded, more or less comparable to the Series 1400ab TEOM. During the next cycle the air is sent over a zero-filter (at 4 °C) prior to passing through the sampling filter and the mass decrease on the sampling filter (= ‘volatized’ PM) is recorded. The combination of the results of both cycles allows for the calculation of total PM10. Technical info:
Air flow through sampling head: 1 m3/h at ambient conditions Air flow through filter: 0.18 m3/h at ambient conditions Inlet: US type, heating: 30 °C + Nafion® dryer, for PM2.5 a sharp cut cyclone is placed
between the PM10-head and the monitor Filter material: teflon coated glass fiber (Pallflex TX40)
Fig 12: The Series 8500 FDMS System monitor
Experimental setup 17

Comparative PM Measurements in Flanders (Belgium) - 2010 campaign
2.3.5 BAM 1020
Three PM2.5 BAM 1020 monitors were operated as a test in this campaign. Like the ESM monitor this instrument also uses the technique of β-attenuation. To avoid condensation of water on the filter the monitor uses an active smart heater module which minimizes the loss of water and semi-volatile compounds. Technical info:
Air flow: 1 m3/h at ambient conditions Inlet: US-type, with active smart heating, for PM2.5 a sharp cut cyclone is placed between the
PM10-head and the monitor Filter material: glass fiber Beta source: 14C
Fig 13: The BAM 1020 monitor
2.4 Weighing and handling of filters
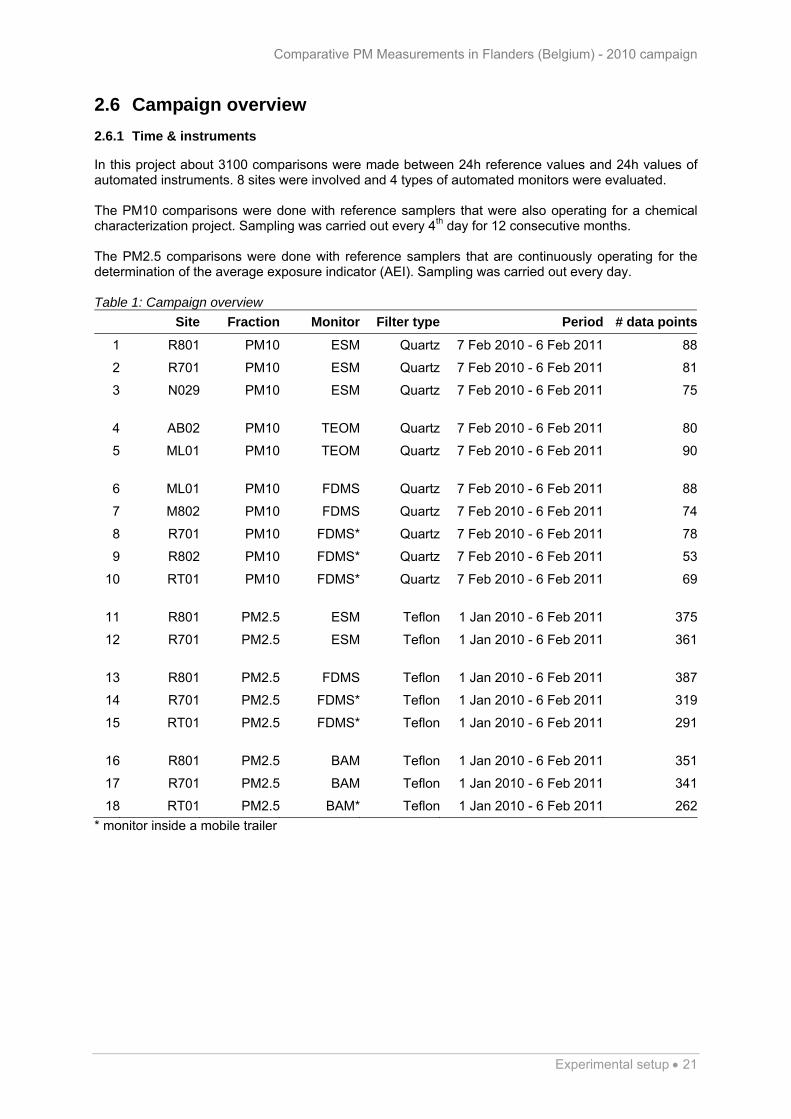
For both the PM10 and PM2.5 filters, the more stringent weighing criteria of the PM2.5 reference method (EN14907) were used. This implies that filters are weighed twice before sampling and twice afterwards. Blank filters are placed for at least 48 h in a (custom made) climate controlled weighing cupboard (inside a temperature controlled room) prior to the first weighing, at least 12 h later a second weighing is carried out. The same procedure is used for sampled filters, except that the second weighing is done at least 24 h after the first weighing of the loaded filter. Filters are collected every two weeks. Transport from the field to the lab is done in the Leckel sampling canisters which are placed inside special cases. Transport time (from Leckel to controlled conditions) generally ranges from 30 minutes to approximately 5 hours. Upon arrival in the lab the filters are taken out of the filter rings and placed immediately in the climate controlled weighing cupboard. Technical info:
Balance: Sartorius M5P (resolution 1 µg) Weighing cupboard temperature: 20 ± 1 °C Weighing cupboard humidity: 50 ± 2%
18 Experimental setup
Comparative PM Measurements in Flanders (Belgium) - 2010 campaign
Fig 14: Weighing cupboard
2.5 Data treatment
2.5.1 Validation and Quality Control
Gravimetric reference method During weighing all filters were visually inspected for any irregularities. The results of the 1st and 2nd weighing are compared and when the difference is higher than a certain value, a 3rd weighing is carried out. The allowed differences are
For PM2.5: 40 µg (blank filters) or 60 µg (sampled filters), according to EN14907. For PM10: 80 µg (blank filters) or 120 µg (sampled filters), according to own VMM criteria
The flow of the reference samplers was checked regularly with a BGI Deltacal flowmeter. At the end of the campaign an average flow correction was carried out based on the Deltacal measurements. The deviations from the nominal flow before correction varied between -1% and +5%. The total sampled volume is calculated by the instrument based on its running time. Whenever the sampling time/volume was less than 95% of the normal value (24h, 55m3) the data were considered invalid for comparison purposes. Automated monitors The standard routine validation procedure for the automated monitors was used during the campaigns. Daily average concentrations were calculated using half hourly values by means of XR software. Average values are rounded to the nearest whole number by the software. Although this can create a significant bias for small concentrations, the average effect will be negligible. The 24-h average values for automated monitors with less than 75% of (half) hourly values were considered invalid.
2.5.2 Outlier removal
In addition to the removal of data because of technical reasons, the Grubbs outlier test was carried out at the 99% level on the data series of 1) the reference-candidate ‘absolute difference’ and 2) reference/candidate ‘ratio’. During the Ghent City Festival some very high PM10 and PM2.5 concentrations were measured at the R701 site. Nearby the monitoring station thousands of people come to eat, drink and dance. Because the ratio between the reference and automated values showed a significant deviation from the rest of
Experimental setup 19

Comparative PM Measurements in Flanders (Belgium) - 2010 campaign
20 Experimental setup
the year for both ESM, FDMS and BAM monitor, this part of the dataset was not used for the equivalence demonstration. Further chemical analysis also showed a very high content of (semi-volatile) organic material which confirmed the idea that the composition of the PM was ‘unusual’.
2.5.3 Calibration factor/equation calculation
Various methods can be used to describe the relationship between two PM monitors. In this work two different techniques that treat the data in a symmetrical way were applied. Orthogonal regression (OR) This is the technique suggested by the ‘Demonstration of equivalence of ambient air monitoring methods’ document8. In ordinary linear regression, the goal is to minimize the sum of the squared vertical distances between the data points and the corresponding points on the fitted line. In orthogonal regression (also referred to as total least squares) the goal is to minimize the orthogonal (perpendicular) distances from the data points to the fitted line (y= bx + a). Because of that, orthogonal regression is a technique that leads to a symmetrical9 treatment of both variables. This is preferable because the experimental errors in the PM reference method are in the same order of magnitude as the errors in the candidate method.
Sxy
SxySxxSyySxxSyyb
2
)(4 22
)).((
)(
)(2
2
yyxxSxy
yySyy
xxSxx
ii
i
i
xbya For the application of this method the EU Excel spreadsheet was used10. Ratio of averages A very simple, but effective way of calculating a calibration factor is taking the ratio of the overall averages of both methods. This is a symmetrical approach for which data points in the higher concentration range have somewhat more weight than those in the lower range. Calculating the calibration factor like this also gives ‘per definition’ the best results for calculating the annual average value.
i
i
y
xfactor
8 http://ec.europa.eu/environment/air/quality/legislation/pdf/equivalence.pdf 9 A symmetrical approach leads to the same results when the datasets are exchanged 10 http://ec.europa.eu/environment/air/pdf/test_equivalencev31004.xls
Comparative PM Measurements in Flanders (Belgium) - 2010 campaign
2.6 Campaign overview
2.6.1 Time & instruments
In this project about 3100 comparisons were made between 24h reference values and 24h values of automated instruments. 8 sites were involved and 4 types of automated monitors were evaluated. The PM10 comparisons were done with reference samplers that were also operating for a chemical characterization project. Sampling was carried out every 4th day for 12 consecutive months. The PM2.5 comparisons were done with reference samplers that are continuously operating for the determination of the average exposure indicator (AEI). Sampling was carried out every day. Table 1: Campaign overview
Site Fraction Monitor Filter type Period # data points
1 R801 PM10 ESM Quartz 7 Feb 2010 - 6 Feb 2011 88
2 R701 PM10 ESM Quartz 7 Feb 2010 - 6 Feb 2011 81
3 N029 PM10 ESM Quartz 7 Feb 2010 - 6 Feb 2011 75
4 AB02 PM10 TEOM Quartz 7 Feb 2010 - 6 Feb 2011 80
5 ML01 PM10 TEOM Quartz 7 Feb 2010 - 6 Feb 2011 90
6 ML01 PM10 FDMS Quartz 7 Feb 2010 - 6 Feb 2011 88
7 M802 PM10 FDMS Quartz 7 Feb 2010 - 6 Feb 2011 74
8 R701 PM10 FDMS* Quartz 7 Feb 2010 - 6 Feb 2011 78
9 R802 PM10 FDMS* Quartz 7 Feb 2010 - 6 Feb 2011 53
10 RT01 PM10 FDMS* Quartz 7 Feb 2010 - 6 Feb 2011 69
11 R801 PM2.5 ESM Teflon 1 Jan 2010 - 6 Feb 2011 375
12 R701 PM2.5 ESM Teflon 1 Jan 2010 - 6 Feb 2011 361
13 R801 PM2.5 FDMS Teflon 1 Jan 2010 - 6 Feb 2011 387
14 R701 PM2.5 FDMS* Teflon 1 Jan 2010 - 6 Feb 2011 319
15 RT01 PM2.5 FDMS* Teflon 1 Jan 2010 - 6 Feb 2011 291
16 R801 PM2.5 BAM Teflon 1 Jan 2010 - 6 Feb 2011 351
17 R701 PM2.5 BAM Teflon 1 Jan 2010 - 6 Feb 2011 341
18 RT01 PM2.5 BAM* Teflon 1 Jan 2010 - 6 Feb 2011 262
* monitor inside a mobile trailer
Experimental setup 21

Comparative PM Measurements in Flanders (Belgium) - 2010 campaign
22 Experimental setup
2.6.2 Meteorological data
The weather during 2010 can be considered quite normal regarding air quality. The daily values and some statistics of the VMM meteo station M701 (Gent-Tolhuiskaai), which has a rather central location in Flanders, are presented in Fig 15 and Table 2.
-10
-5
0
5
10
15
20
25
30
35
01
/01
/10
01
/02
/10
01
/03
/10
01
/04
/10
01
/05
/10
01
/06
/10
01
/07
/10
01
/08
/10
01
/09
/10
01
/10
/10
01
/11
/10
01
/12
/10
01
/01
/11
01
/02
/11
mm
- °
C -
m/s
0
10
20
30
40
50
60
70
80
90
100
% R
H
precip.
T
wspeed
RH
Fig 15: Meteorological data, Gent-Tolhuiskaai (M701) Table 2: Basic statistics for the meteorological data of the campaign
Parameter Mean daily value
Relative humidity 82%
Precipitation 1.9 mm
Temperature 10.1 °C
Wind speed 3.7 m/s
Air pressure 1014mbar
Wind direction* 204°
* median value

Comparative PM Measurements in Flanders (Belgium) - 2010 campaign
The gravimetric reference method 23
3 The gravimetric reference method
3.1 Introduction
The words ‘reference method’ suggests that this method results in very stable results with a low uncertainty. However, in recent years more and more research has shown that the uncertainty within the reference method is probably a lot higher than it was thought to be. There can be high differences in results between different type and brands of reference filters11. Different filters and operating procedures can also result in differences in field blank12. With this information in mind, this chapter gives information about the history of filter choice at VMM, reports the field blank results for the two types of filters in use and compares the results of an extensive parallel measurement with two types of filters.
3.2 History of filter choice at VMM
Before 2005 Up to 2005 cellulose nitrate filters were used for gravimetric sampling (and heavy metal determination). This was because:
At the time the tested cellulose filters had shown to have better blank values for heavy metals than the tested quartz fiber filters.
No significant difference in PM mass capture between cellulose filters and quartz fiber filters had been observed during a short comparison campaign. Therefore they were thought to be equivalent to quartz filters.
Cellulose filters were (and still are) less fragile. Additional information regarding artifacts on cellulose filters and the availability of quartz fiber filters with low metal content led to new tests on quartz fiber filters. Based on metal blank levels and price Macherey-Nagel QF10 filters were chosen as reference filters in 2005. 2005-2006 During the PM10 comparison campaign 2005-2006 different type of filters (quartz fiber, teflon, cellulose nitrate) were tested and also different brands of quartz fiber filter (Machery-Nagel, Whatman, Pall, Schleiger & Schuell). This study clearly showed that different filters can lead to significant differences in sampled PM mass. For one campaign the difference between different brands of quartz filters was as high as 29%. 2006-2007 For the 2006-2007 comparison study Whatman QM-A was chosen for gravimetric sampling because EN12341 (PM10) only allows quartz as reference filter and because at the time other European networks (like RIVM-The Netherlands) and JRC-Ispra also used this type of filter. For PM10 gravimetric sampling was also done on teflon filters (Pall Teflo), these filters were used for elemental analysis within the chemical characterization project. Since 2008 Since the 2008-2009 comparisons VMM uses Pall Tissuquartz 2500 QAT-UP filters for the PM10 reference method and Pall Teflo Membrane 2 µm filters for PM2.5. The chance for PM10 was made because VMM and other institutions had reported issues with the Whatman QM-A filters (e.g. irreversible uptake of water). Another reason was that the networks in the USA and the majority of 11 VMM (2007), Comparative PM10 Measurements in Flanders, Period 2005-2006 12 Internal documents of CEN TC264 WG15
Comparative PM Measurements in Flanders (Belgium) - 2010 campaign
scientific institutions preferred the Pall filters. On top of that one could also argue whether the Whatman QM-A filter, which contains 5% borosilicate as binder can be considered a true quartz fiber filter. The change to Pall Teflo for PM2.5 was made because EN14907 allows the use of teflon filters and it is known that this material shows significantly lower artifacts due to water uptake. The only drawback of this type of filter it that the back pressure can become too high when the filter load is very high. In this case the reference sampler fails to sample for the full 24 hours. In this 13 month campaign this happened about 10 days for most of the PM2.5 samplers.
3.3 Field blanks
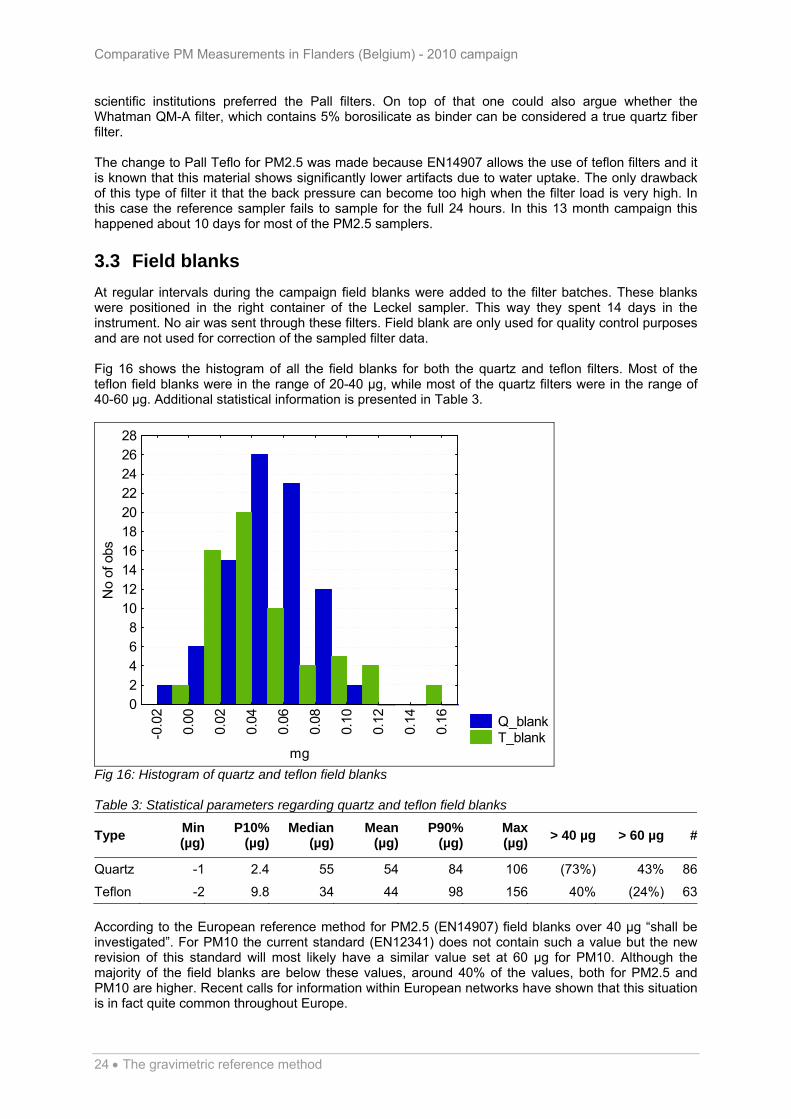
At regular intervals during the campaign field blanks were added to the filter batches. These blanks were positioned in the right container of the Leckel sampler. This way they spent 14 days in the instrument. No air was sent through these filters. Field blank are only used for quality control purposes and are not used for correction of the sampled filter data. Fig 16 shows the histogram of all the field blanks for both the quartz and teflon filters. Most of the teflon field blanks were in the range of 20-40 µg, while most of the quartz filters were in the range of 40-60 µg. Additional statistical information is presented in Table 3.
Q_blank T_blank-0
.02
0.00
0.02
0.04
0.06
0.08
0.10
0.12
0.14
0.16
mg
02468
10121416182022242628
No
of o
bs
Fig 16: Histogram of quartz and teflon field blanks Table 3: Statistical parameters regarding quartz and teflon field blanks
Type Min (µg)
P10% (µg)
Median(µg)
Mean (µg)
P90% (µg)
Max (µg)
> 40 µg > 60 µg #
Quartz -1 2.4 55 54 84 106 (73%) 43% 86
Teflon -2 9.8 34 44 98 156 40% (24%) 63
According to the European reference method for PM2.5 (EN14907) field blanks over 40 µg “shall be investigated”. For PM10 the current standard (EN12341) does not contain such a value but the new revision of this standard will most likely have a similar value set at 60 µg for PM10. Although the majority of the field blanks are below these values, around 40% of the values, both for PM2.5 and PM10 are higher. Recent calls for information within European networks have shown that this situation is in fact quite common throughout Europe.
24 The gravimetric reference method

Comparative PM Measurements in Flanders (Belgium) - 2010 campaign
The gravimetric reference method 25
To lower the field blanks some networks (e.g. in the Netherlands) pre-condition the filters for several weeks close to 100% RH. Although this effectively lowers the field blanks it sometimes results in negative values, indicating that filters actually lose mass in the field and most likely underestimate the real PM concentrations.
3.4 PM2.5 filter comparison in Retie
In Retie two PM2.5 reference samplers were operated in parallel. One was equipped with the usual Pall Teflo filters and one had the Pall Tissuquartz filters that are being used for PM10. Fig 17 and Table 4 show that there was no significant difference, a very good correlation (r2 0.98) and hardly any deviation from the 1:1 ratio (dotted line). Although the two setups were not identical one could still calculate the in between sampler uncertainty. With a value of 1.34 µg/m3 it would even meet the criterion for two identical reference sampler setups.
0
20
40
60
80
100
120
0 20 40 60 80 100 1
Teflon (µg/m3)
Qu
art
z (µ
g/m
3)
20
r2=0.98
Fig 17: Scatter plot for the two PM2.5 samplers in Retie Table 4: Statistical parameters regarding the quartz and teflon PM2.5 datasets in Retie
Value
# of data points 385
Average on quartz 17.479 µg/m3
Average on teflon 17.491 µg/m3
Absolute difference Q-T -0.012 µg/m3
Relative difference Q/T -0.07%
In between sampler u 1.34 µg/m3
In the previous study two similar comparisons were carried out. One gave a difference of 0.7% and the other a difference of 4.9%. The fact that the two setups compare better in this study is most likely due to the flow correction that was applied to all datasets in this work. As reported in 2.5.1 this correction could go up to 5%. Possibly the difference observed in the previous studies was merely an artifact of the deviations in flow of the reference samplers.

Comparative PM Measurements in Flanders (Belgium) - 2010 campaign
4 Comparisons with automated monitors
4.1 Introduction
This chapter contains the basic comparison data such as the concentrations during the campaign, the daily ratios between reference and automated samplers and the scatter plots.
4.2 Concentrations during campaigns
Fig 18 and Fig 19 show the average valid ‘reference’ concentrations for all the involved measurement sites. The overall average was 27.2 µg/m3 for PM10 and 18.9 µg/m3 for PM2.5.
0
10
20
30
40
50
60
70
80
90
100
01 jan10
01 feb10
01 mrt10
01 apr10
01 mei10
01 jun10
01 jul10
01 aug10
01 sep10
01 okt10
01 nov10
01 dec10
01 jan11
01 feb11
µg/m
3
PM10
Fig 18: Average PM10 reference concentrations for all involved stations
0
10
20
30
40
50
60
70
80
90
100
01 jan10
01 feb10
01 mrt10
01 apr10
01 mei10
01 jun10
01 jul10
01 aug10
01 sep10
01 okt10
01 nov10
01 dec10
01 jan11
01 feb11
µg/
m3
PM2.5
Fig 19: Average PM2.5 reference concentrations for all involved stations
26 Comparisons with automated monitors
Comparative PM Measurements in Flanders (Belgium) - 2010 campaign
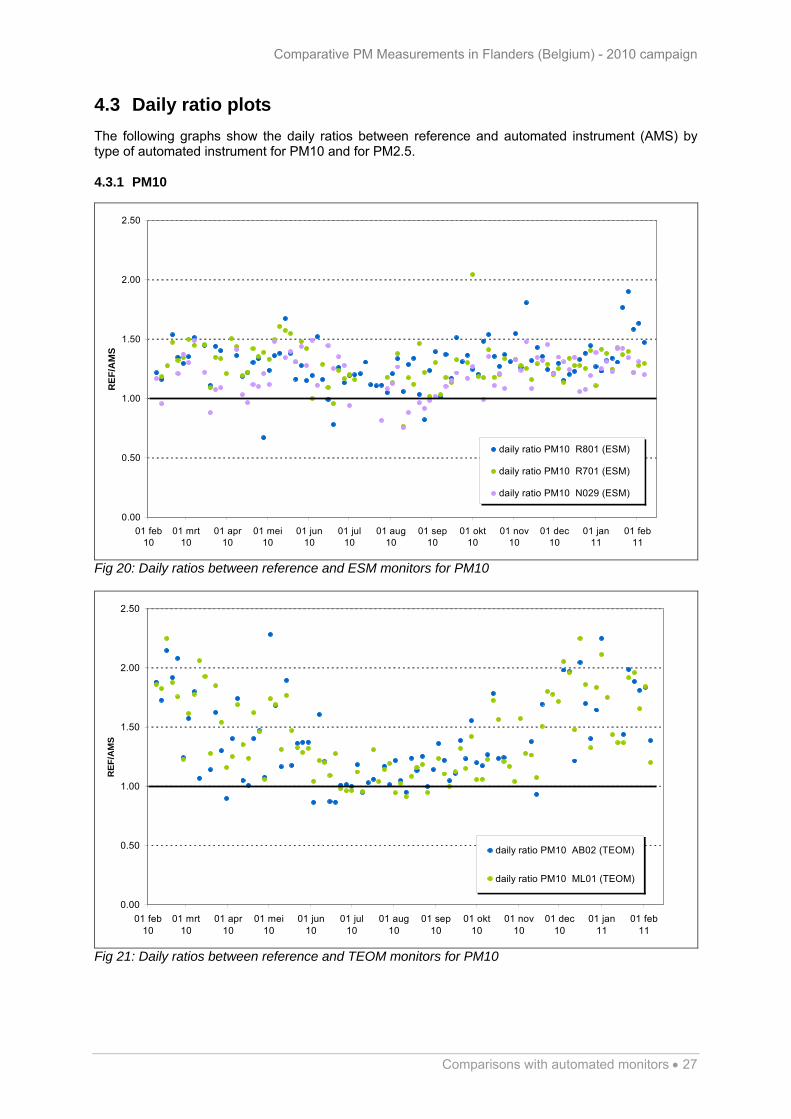
4.3 Daily ratio plots
The following graphs show the daily ratios between reference and automated instrument (AMS) by type of automated instrument for PM10 and for PM2.5. 4.3.1 PM10
0.00
0.50
1.00
1.50
2.00
2.50
01 feb10
01 mrt10
01 apr10
01 mei10
01 jun10
01 jul10
01 aug10
01 sep10
01 okt10
01 nov10
01 dec10
01 jan11
01 feb11
RE
F/A
MS
daily ratio PM10 R801 (ESM)
daily ratio PM10 R701 (ESM)
daily ratio PM10 N029 (ESM)
Fig 20: Daily ratios between reference and ESM monitors for PM10
0.00
0.50
1.00
1.50
2.00
2.50
01 feb10
01 mrt10
01 apr10
01 mei10
01 jun10
01 jul10
01 aug10
01 sep10
01 okt10
01 nov10
01 dec10
01 jan11
01 feb11
RE
F/A
MS
daily ratio PM10 AB02 (TEOM)
daily ratio PM10 ML01 (TEOM)
Fig 21: Daily ratios between reference and TEOM monitors for PM10
Comparisons with automated monitors 27
Comparative PM Measurements in Flanders (Belgium) - 2010 campaign
0.00
0.50
1.00
1.50
2.00
2.50
01 feb10
01 mrt10
01 apr10
01 mei10
01 jun10
01 jul10
01 aug10
01 sep10
01 okt10
01 nov10
01 dec10
01 jan11
01 feb11
RE
F/A
MS
daily ratio PM10 ML01 (FDMS)
daily ratio PM10 M802 (FDMS)
daily ratio PM10 R701 (FDMS)
daily ratio PM10 R802 (FDMS)
daily ratio PM10 RT01 (FDMS)
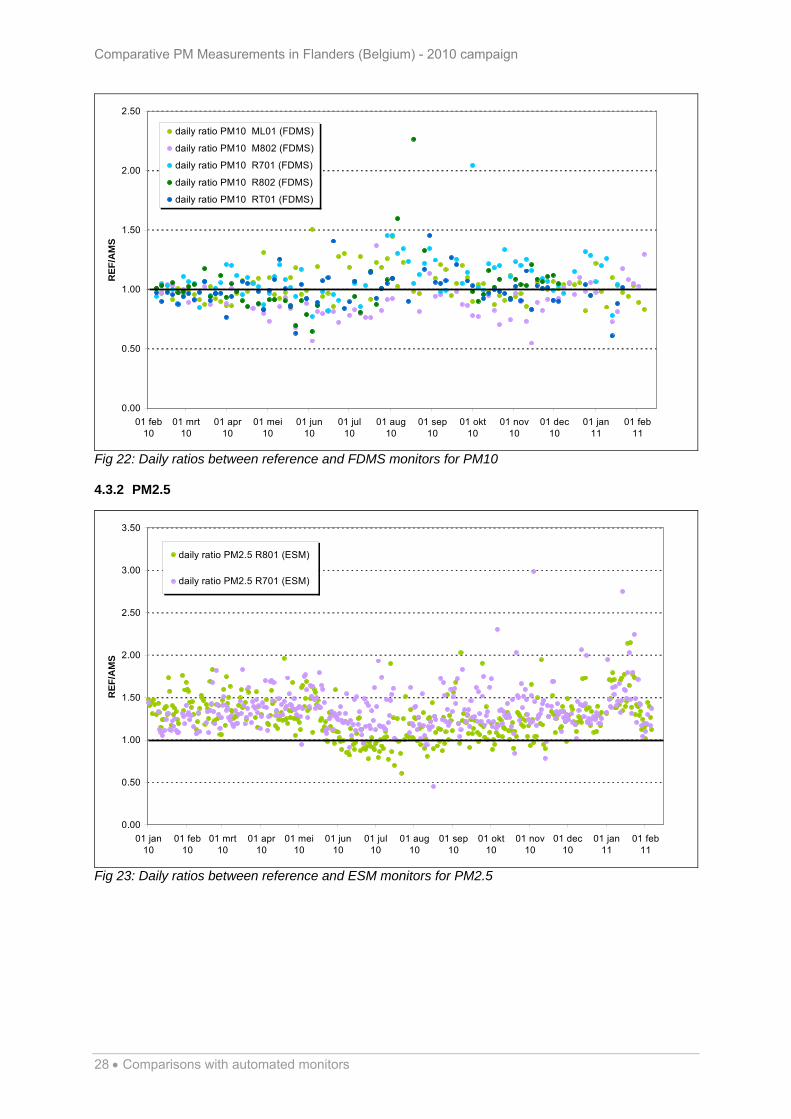
Fig 22: Daily ratios between reference and FDMS monitors for PM10 4.3.2 PM2.5
0.00
0.50
1.00
1.50
2.00
2.50
3.00
3.50
01 jan10
01 feb10
01 mrt10
01 apr10
01 mei10
01 jun10
01 jul10
01 aug10
01 sep10
01 okt10
01 nov10
01 dec10
01 jan11
01 feb11
RE
F/A
MS
daily ratio PM2.5 R801 (ESM)
daily ratio PM2.5 R701 (ESM)
Fig 23: Daily ratios between reference and ESM monitors for PM2.5
28 Comparisons with automated monitors
Comparative PM Measurements in Flanders (Belgium) - 2010 campaign
0.00
0.50
1.00
1.50
2.00
2.50
3.00
3.50
01 jan10
01 feb10
01 mrt10
01 apr10
01 mei10
01 jun10
01 jul10
01 aug10
01 sep10
01 okt10
01 nov10
01 dec10
01 jan11
01 feb11
RE
F/A
MS
daily ratio PM2.5 R801 (FDMS)
daily ratio PM2.5 R701 (FDMS)
daily ratio PM2.5 RT01 (FDMS)
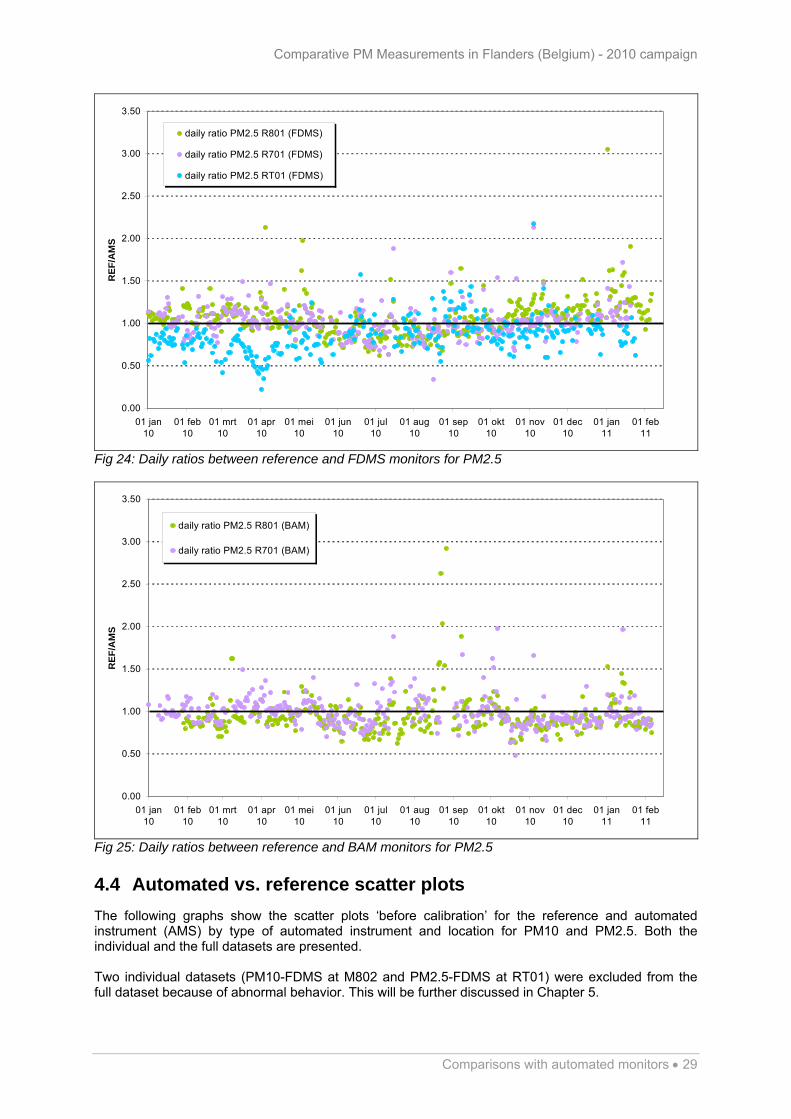
Fig 24: Daily ratios between reference and FDMS monitors for PM2.5
0.00
0.50
1.00
1.50
2.00
2.50
3.00
3.50
01 jan10
01 feb10
01 mrt10
01 apr10
01 mei10
01 jun10
01 jul10
01 aug10
01 sep10
01 okt10
01 nov10
01 dec10
01 jan11
01 feb11
RE
F/A
MS
daily ratio PM2.5 R801 (BAM)
daily ratio PM2.5 R701 (BAM)
Fig 25: Daily ratios between reference and BAM monitors for PM2.5
4.4 Automated vs. reference scatter plots
The following graphs show the scatter plots ‘before calibration’ for the reference and automated instrument (AMS) by type of automated instrument and location for PM10 and PM2.5. Both the individual and the full datasets are presented. Two individual datasets (PM10-FDMS at M802 and PM2.5-FDMS at RT01) were excluded from the full dataset because of abnormal behavior. This will be further discussed in Chapter 5.
Comparisons with automated monitors 29
Comparative PM Measurements in Flanders (Belgium) - 2010 campaign
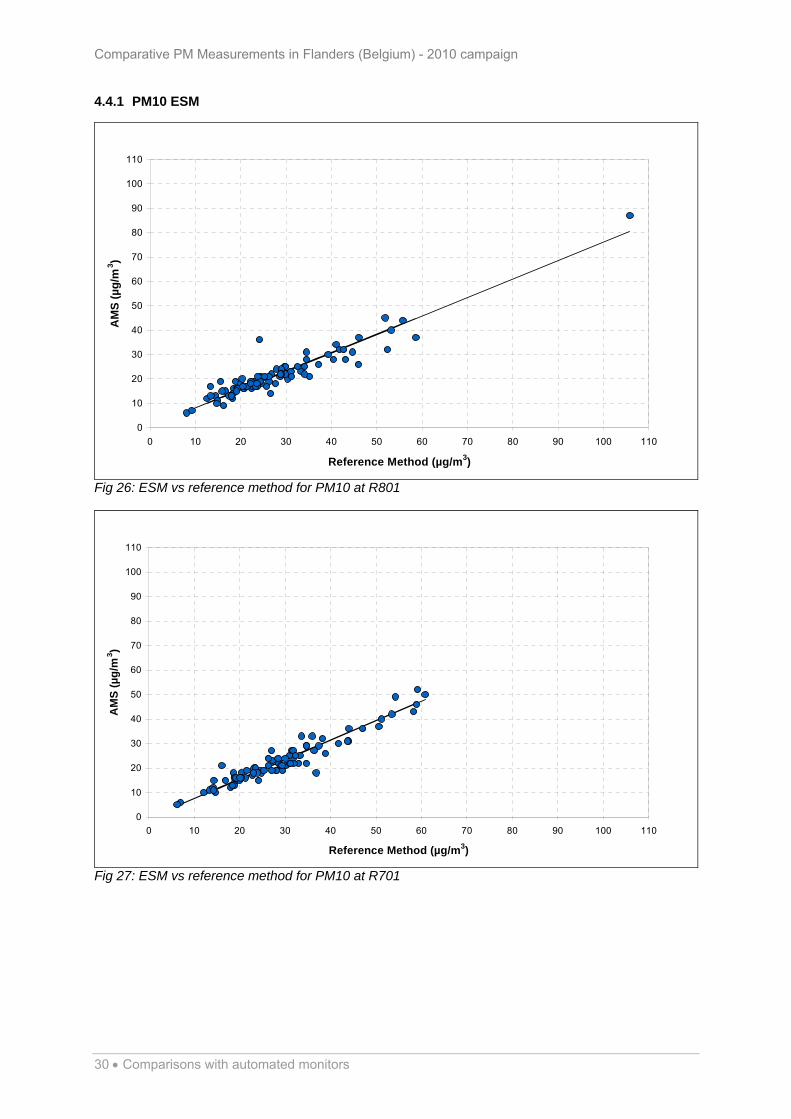
4.4.1 PM10 ESM
0
10
20
30
40
50
60
70
80
90
100
110
0 10 20 30 40 50 60 70 80 90 100 110
Reference Method (µg/m3)
AM
S (
µg
/m3)
Fig 26: ESM vs reference method for PM10 at R801
0
10
20
30
40
50
60
70
80
90
100
110
0 10 20 30 40 50 60 70 80 90 100 110
Reference Method (µg/m3)
AM
S (
µg
/m3)
Fig 27: ESM vs reference method for PM10 at R701
30 Comparisons with automated monitors
Comparative PM Measurements in Flanders (Belgium) - 2010 campaign
0
10
20
30
40
50
60
70
80
90
100
110
0 10 20 30 40 50 60 70 80 90 100 110
Reference Method (µg/m3)
AM
S (
µg
/m3)
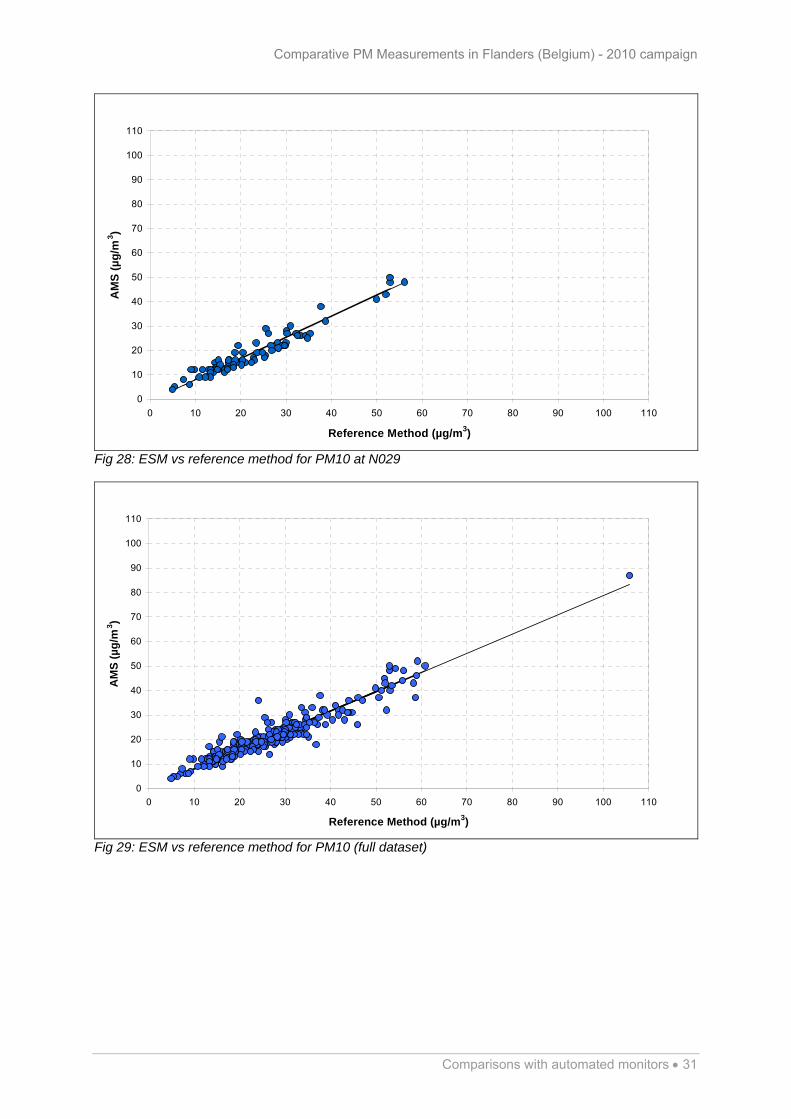
Fig 28: ESM vs reference method for PM10 at N029
0
10
20
30
40
50
60
70
80
90
100
110
0 10 20 30 40 50 60 70 80 90 100 110
Reference Method (µg/m3)
AM
S (
µg
/m3)
Fig 29: ESM vs reference method for PM10 (full dataset)
Comparisons with automated monitors 31
Comparative PM Measurements in Flanders (Belgium) - 2010 campaign
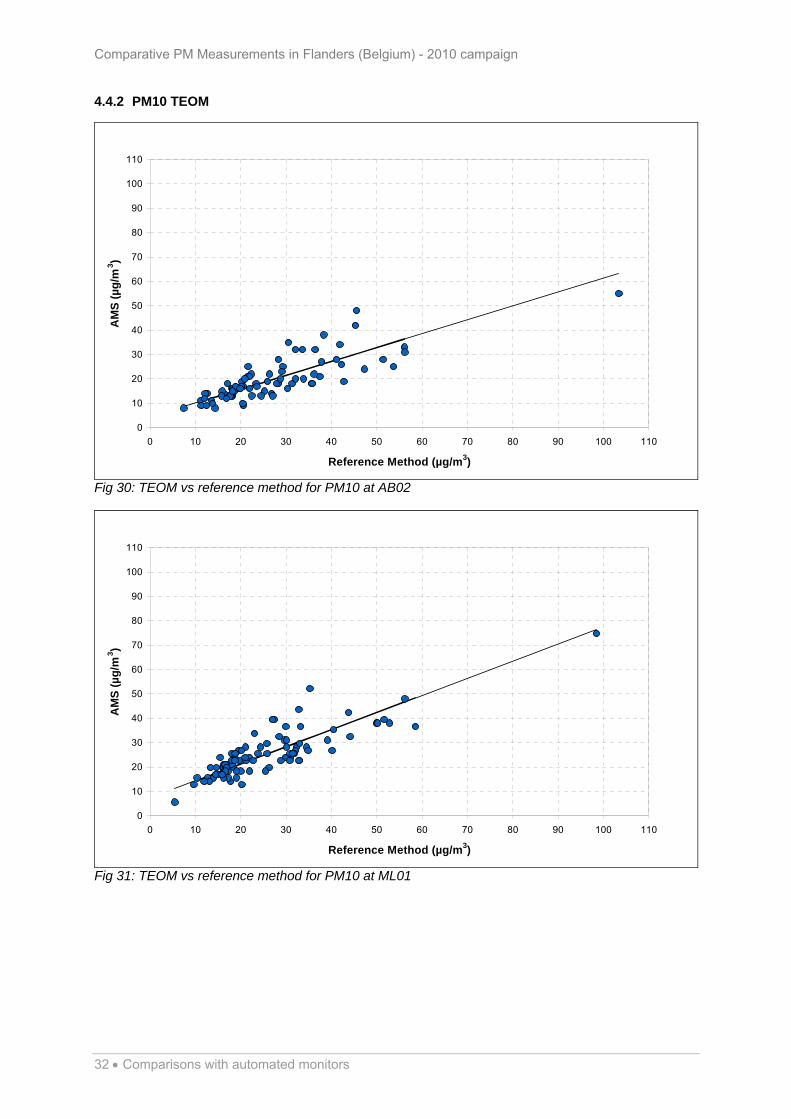
4.4.2 PM10 TEOM
0
10
20
30
40
50
60
70
80
90
100
110
0 10 20 30 40 50 60 70 80 90 100 110
Reference Method (µg/m3)
AM
S (
µg
/m3)
Fig 30: TEOM vs reference method for PM10 at AB02
0
10
20
30
40
50
60
70
80
90
100
110
0 10 20 30 40 50 60 70 80 90 100 110
Reference Method (µg/m3)
AM
S (
µg
/m3)
Fig 31: TEOM vs reference method for PM10 at ML01
32 Comparisons with automated monitors

Comparative PM Measurements in Flanders (Belgium) - 2010 campaign
0
10
20
30
40
50
60
70
80
90
100
110
0 10 20 30 40 50 60 70 80 90 100 110
Reference Method (µg/m3)
AM
S (
µg
/m3)
Fig 32: TEOM vs reference method for PM10 (full dataset) 4.4.3 PM10 FDMS
0
10
20
30
40
50
60
70
80
90
100
110
0 10 20 30 40 50 60 70 80 90 100 110
Reference Method (µg/m3)
AM
S (
µg
/m3)
Fig 33: FDMS vs reference method for PM10 at ML01
Comparisons with automated monitors 33

Comparative PM Measurements in Flanders (Belgium) - 2010 campaign
0
10
20
30
40
50
60
70
80
90
100
110
0 10 20 30 40 50 60 70 80 90 100 110
Reference Method (µg/m3)
AM
S (
µg
/m3)
Fig 34: FDMS vs reference method for PM10 at M802
0
10
20
30
40
50
60
70
80
90
100
110
0 10 20 30 40 50 60 70 80 90 100 110
Reference Method (µg/m3)
AM
S (
µg
/m3)
Fig 35: FDMS vs reference method for PM10 at R701
34 Comparisons with automated monitors
Comparative PM Measurements in Flanders (Belgium) - 2010 campaign
0
10
20
30
40
50
60
70
80
90
100
110
0 10 20 30 40 50 60 70 80 90 100 110
Reference Method (µg/m3)
AM
S (
µg
/m3)
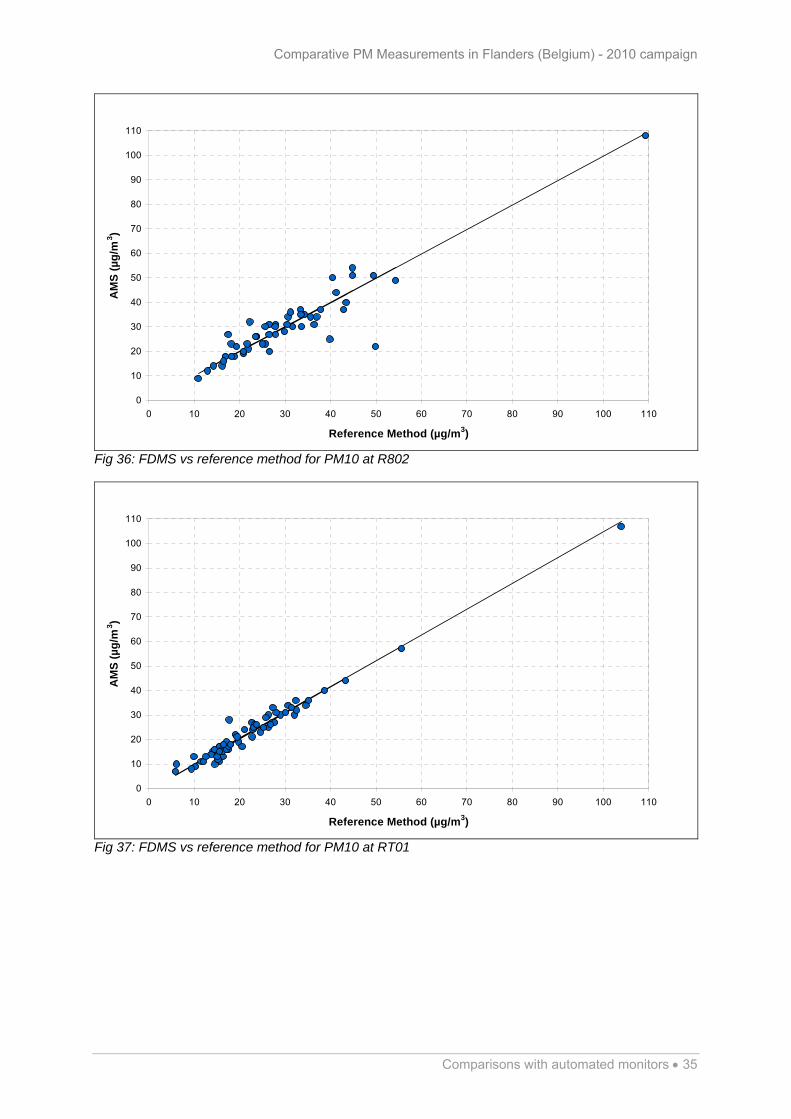
Fig 36: FDMS vs reference method for PM10 at R802
0
10
20
30
40
50
60
70
80
90
100
110
0 10 20 30 40 50 60 70 80 90 100 110
Reference Method (µg/m3)
AM
S (
µg
/m3)
Fig 37: FDMS vs reference method for PM10 at RT01
Comparisons with automated monitors 35

Comparative PM Measurements in Flanders (Belgium) - 2010 campaign
0
10
20
30
40
50
60
70
80
90
100
110
0 10 20 30 40 50 60 70 80 90 100 110
Reference Method (µg/m3)
AM
S (
µg
/m3)
Fig 38: FDMS vs reference method for PM10 (full dataset without M802) 4.4.4 PM2.5 ESM
0
10
20
30
40
50
60
70
80
90
100
110
0 10 20 30 40 50 60 70 80 90 100 110
Reference Method (µg/m3)
AM
S (
µg
/m3)
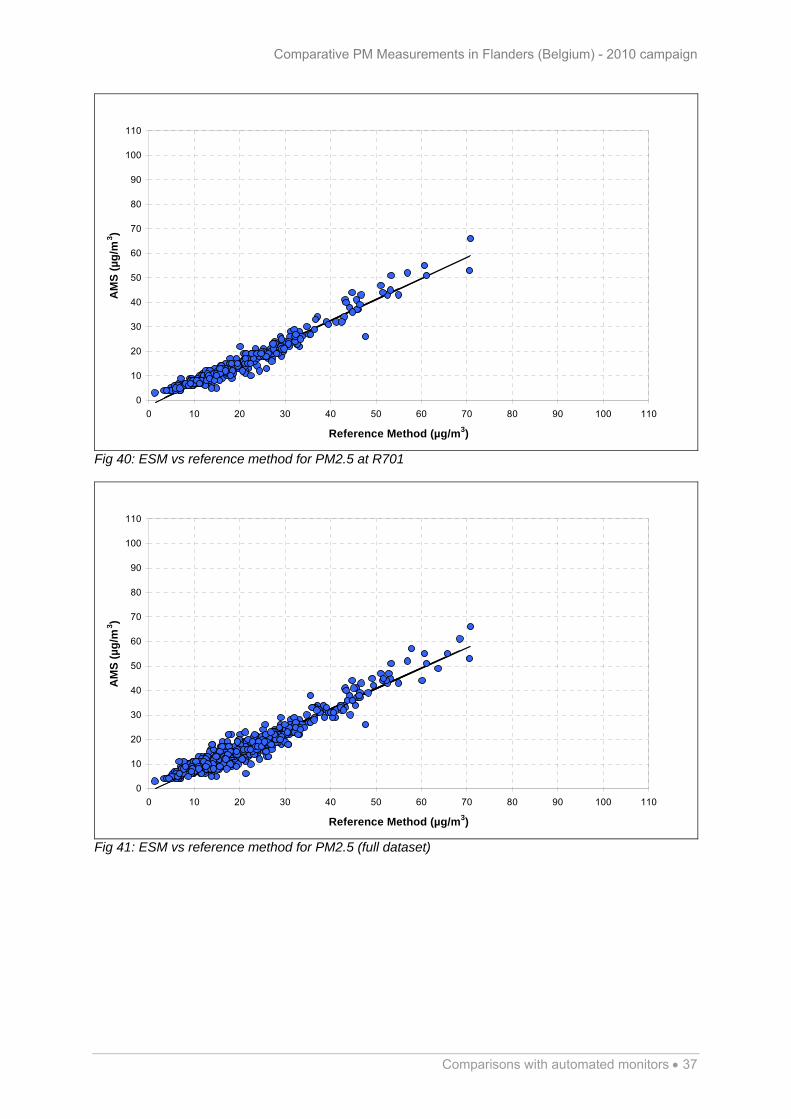
Fig 39: ESM vs reference method for PM2.5 at R801
36 Comparisons with automated monitors
Comparative PM Measurements in Flanders (Belgium) - 2010 campaign
0
10
20
30
40
50
60
70
80
90
100
110
0 10 20 30 40 50 60 70 80 90 100 110
Reference Method (µg/m3)
AM
S (
µg
/m3)
Fig 40: ESM vs reference method for PM2.5 at R701
0
10
20
30
40
50
60
70
80
90
100
110
0 10 20 30 40 50 60 70 80 90 100 110
Reference Method (µg/m3)
AM
S (
µg
/m3)
Fig 41: ESM vs reference method for PM2.5 (full dataset)
Comparisons with automated monitors 37

Comparative PM Measurements in Flanders (Belgium) - 2010 campaign
4.4.5 PM2.5 FDMS
0
10
20
30
40
50
60
70
80
90
100
110
0 10 20 30 40 50 60 70 80 90 100 110
Reference Method (µg/m3)
AM
S (
µg
/m3)
Fig 42: FDMS vs reference method for PM2.5 at R801
0
10
20
30
40
50
60
70
80
90
100
110
0 10 20 30 40 50 60 70 80 90 100 110
Reference Method (µg/m3)
AM
S (
µg
/m3)
Fig 43: FDMS vs reference method for PM2.5 at R701
38 Comparisons with automated monitors
Comparative PM Measurements in Flanders (Belgium) - 2010 campaign
0
10
20
30
40
50
60
70
80
90
100
110
0 10 20 30 40 50 60 70 80 90 100 110
Reference Method (µg/m3)
AM
S (
µg
/m3)
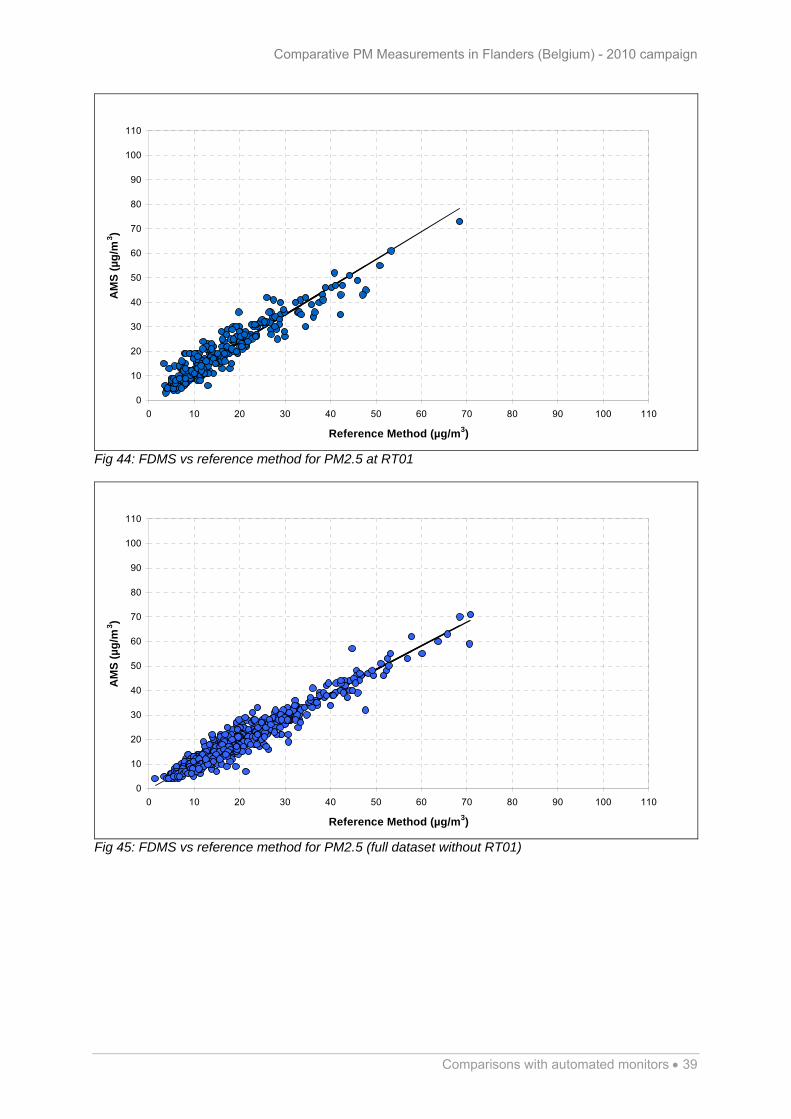
Fig 44: FDMS vs reference method for PM2.5 at RT01
0
10
20
30
40
50
60
70
80
90
100
110
0 10 20 30 40 50 60 70 80 90 100 110
Reference Method (µg/m3)
AM
S (
µg
/m3)
Fig 45: FDMS vs reference method for PM2.5 (full dataset without RT01)
Comparisons with automated monitors 39

Comparative PM Measurements in Flanders (Belgium) - 2010 campaign
4.4.6 PM2.5 BAM
0
10
20
30
40
50
60
70
80
90
100
110
0 10 20 30 40 50 60 70 80 90 100 110
Reference Method (µg/m3)
AM
S (
µg
/m3)
Fig 46: BAM vs reference method for PM2.5 at R801
0
10
20
30
40
50
60
70
80
90
100
110
0 10 20 30 40 50 60 70 80 90 100 110
Reference Method (µg/m3)
AM
S (
µg
/m3)
Fig 47: BAM vs reference method for PM2.5 at R701
40 Comparisons with automated monitors
Comparative PM Measurements in Flanders (Belgium) - 2010 campaign
Comparisons with automated monitors 41
0
10
20
30
40
50
60
70
80
90
100
110
0 10 20 30 40 50 60 70 80 90 100 110
Reference Method (µg/m3)
AM
S (
µg
/m3)
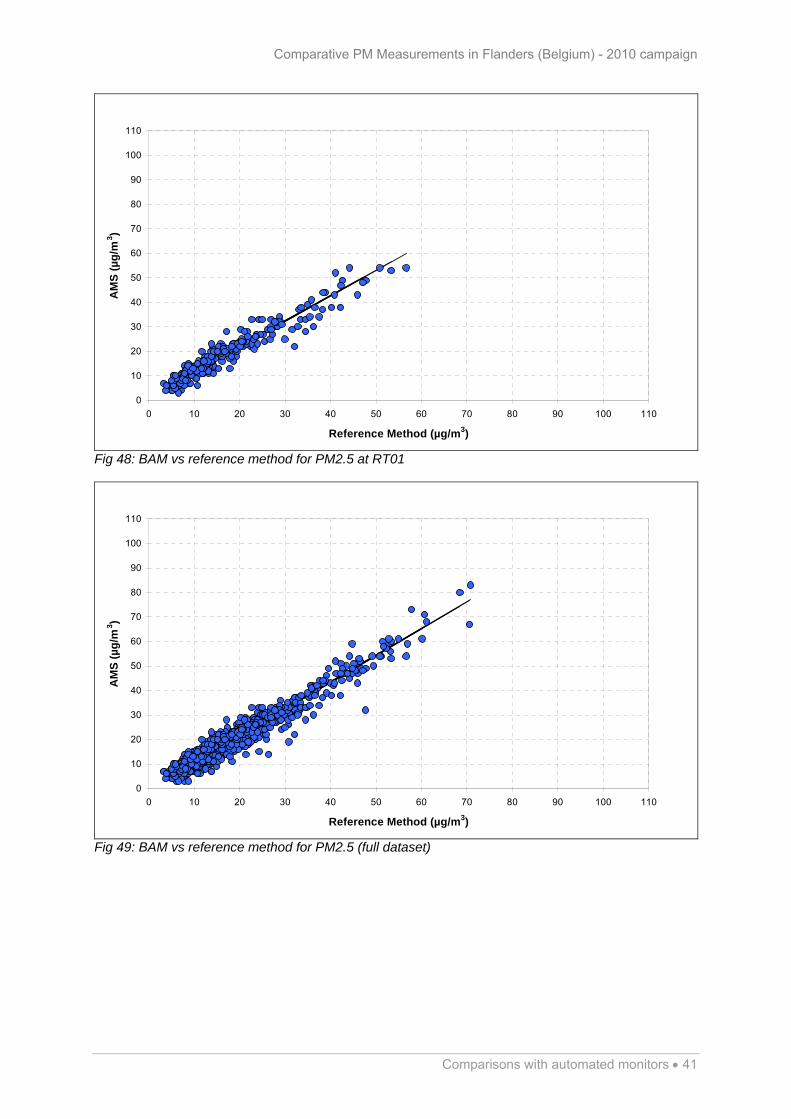
Fig 48: BAM vs reference method for PM2.5 at RT01
0
10
20
30
40
50
60
70
80
90
100
110
0 10 20 30 40 50 60 70 80 90 100 110
Reference Method (µg/m3)
AM
S (
µg
/m3)
Fig 49: BAM vs reference method for PM2.5 (full dataset)

Comparative PM Measurements in Flanders (Belgium) - 2010 campaign
42 Demonstration of Equivalence
5 Demonstration of equivalence
5.1 Introduction
This chapter contains the demonstration of equivalence for the automated instruments based upon the most recent GUIDE TO THE DEMONSTRATION OF EQUIVALENCE OF AMBIENT AIR MONITORING METHODS13. The most important criteria for automated PM monitors in this equivalence document are:
between sampler uncertainty of the Reference Method < 2 µg/m3 between sampler uncertainty of the Candidate Method < 3 µg/m3 a minimum of 4 comparisons of at least 40 measurements at a minimum of 2 sites14 slope and intercept should not be significantly different from 1 and 0. expanded uncertainty of the candidate method at the limit value (LV) < 25%
When these criteria are not met, one may apply a ‘calibration’ factor or equation to correct the dataset. When the dataset then meets the criteria the method can be used as an equivalent method, providing that the same calibration factor or equation is used in the network. Note: For PM10 the ‘daily’ limit value of 50 µg/m3 shall be used to check the expanded uncertainty. For PM2.5 a daily limit value does not exist, but a ‘tentative’ value of 30 µg/m3 was recently introduced solely for the purpose of equivalence demonstration.
5.2 Suitability of datasets
The full dataset shall contain at least 160 data pairs at different climatic seasons at a minimum of two sites. Table 1 shows that this criterion is met for all types of monitors. A second criterion states that 20% of the full dataset should be greater than 25 µg/m3 for PM10 and 15 µg/m3 for PM2.5. For both fractions this is met, even for the individual datasets. For PM10 the amount of days above 25 µg/m3 varied between 32 and 60%. For PM2.5 the amount of days above 15 µg/m3 varied between 44 and 59%.
5.3 Between sampler uncertainty
5.3.1 Reference method (RM)
In 2005 an intercomparison test with two Leckel instruments gave a between sampler uncertainty of 0.46 µg/m³. Although a different type of filter (quartz; Machery-Nagel QF10) was used at that time, we assume that the uncertainty value is still valid and that the criterion for the reference method (< 2 µg/m3) is met. 5.3.2 Automated monitors (AM)
In 2004 an intercomparison test with two ESM and two TEOM monitors gave a between sampler uncertainty of 1.44 µg/m3 for ESM and 0.60 µg/m3 for TEOM, so the criterion for these candidate method (< 3 µg/m3) is met. In 2008 a between sampler uncertainty of 0.85 µg/m3 was found for the FDMS monitor. For the BAM monitor VMM has not yet carried out between sampler uncertainty experiments. But since these instruments have been featured in foreign equivalence studies we refer to those for this aspect in the equivalence demonstration.
13 http://ec.europa.eu/environment/air/quality/legislation/pdf/equivalence.pdf 14 According to the guide the comparisons may be organized in a way that measurements are performed over a longer period e.g. one year, in this case that dataset counts as 2 datasets

Comparative PM Measurements in Flanders (Belgium) - 2010 campaign
Demonstration of Equivalence 43
5.4 Automated vs Reference method regression results
The second part of the equivalence demonstration focuses on the relation between the reference and the automated monitor and the expanded uncertainty of the automated monitor at the limit value. The ‘expanded’ uncertainty should be lower than 25% at the appropriate limit value, which implies that the uncertainty should be lower than 12.5% (a coverage factor k=2 can be used to calculate the ‘expanded’ uncertainty in view of the large number of experimental values). In addition, when a symmetrical regression technique (orthogonal regression) is applied the relation between the AM and the RM can be expressed as y = ax + b. According to the guide, the following criteria for acceptance of the calibration function also apply:
the slope b is insignificantly different from 1 the intercept a is insignificantly different from 0
In practice, a lot of networks ignore this criterion because it is often considered not practical when the deviation for slope or intercept are small but significant. In a recent draft15 of the equivalence procedure for PM a significant slope and/or intercept are accepted if the slope is between 0.98 and 1.02 and if the intercept is between -1 and +1 µg/m3. Presumably these values are still open for discussion. On the next page Table 6 (PM10) and Table 7 (PM2.5) give an overview of the regression parameters that were calculated with the Excel datasheet that is available from the EU. When slope, intercept and uncertainty at the limit value meet the equivalence criteria the values are marked green, if not they are marked red. The table also contains the ratio of the average values of both datasets. This value gives a quick indication of the difference between the two methods and is also the best value to calculate the calibration factor in case the intercept is not significant or not too large. The last column shows the bias at the limit value. The more this values differs from zero, the larger the over- or underestimation of the number of exceedance days will be. As an estimate one can use calculations from a previous VMM study16 that indicate that every µg/m3 deviation at the limit value results in a difference of 3 to 4 exceedance days per year per site. Taking into account the current results and the existing calibration factors VMM decided to exclude two individual campaigns from the full datasets. Afterwards some new decisions for calibration were made (Table 5). The justification for the exclusions and calibration choices is given in 5.5. With the selected calibrations a new regression analysis was done for the monitors that required calibration. Those results are presented in Table 8 (PM10) and Table 9 (PM2.5). Table 8 also contains the results for the inadequate single factor calibration for TEOM. Table 5: Overview of calibration approaches for the different monitors
Monitor Fraction Calibration
ESM PM10 X 1.25
TEOM PM10 + daily value based on FDMS
FDMS PM10 No calibration
ESM PM2.5 X 1.27
FDMS PM2.5 No calibration
BAM PM2.5 X 0.95
15 Internal document of CEN TC264 WG15 16VMM(2009), Chemkar PM10: Chemische karakterisatie van fijn stof in Vlaanderen, 2006-2007 http://www.vmm.be/publicaties/2009/CK_PM10_TW.pdf
Comparative PM Measurements in Flanders (Belgium) - 2010 campaign
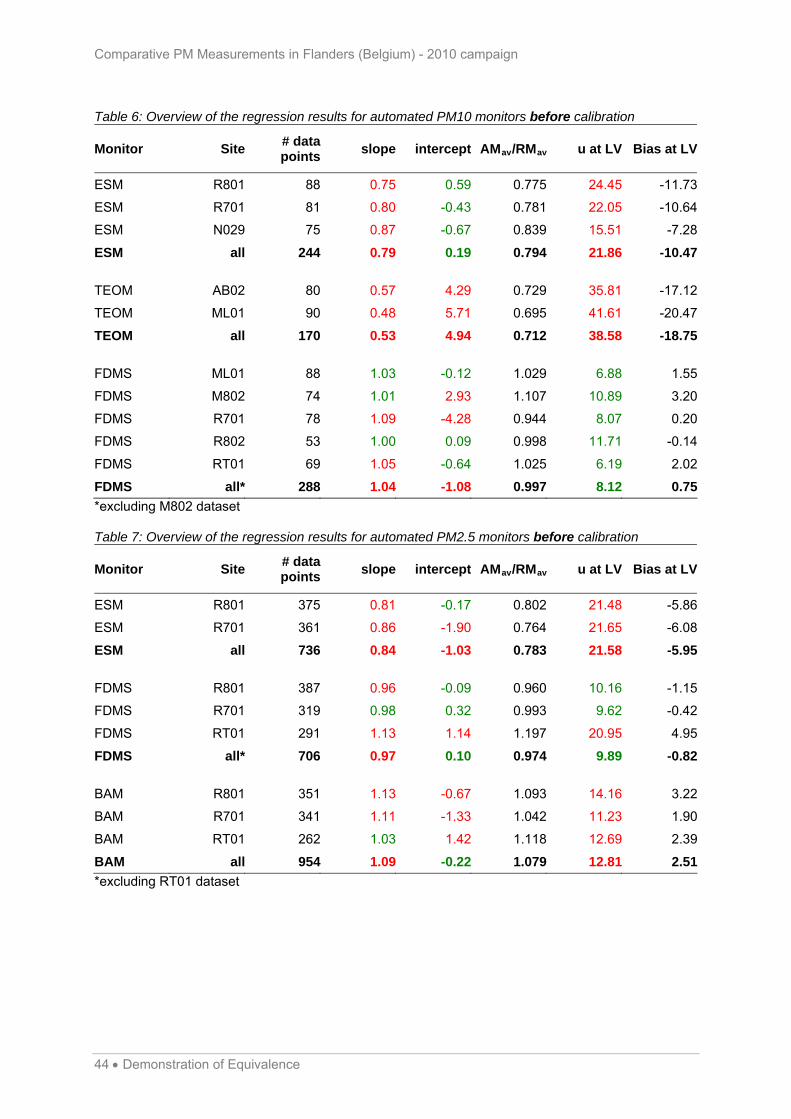
Table 6: Overview of the regression results for automated PM10 monitors before calibration
Monitor Site# data points
slope intercept AMav/RMav u at LV Bias at LV
ESM R801 88 0.75 0.59 0.775 24.45 -11.73
ESM R701 81 0.80 -0.43 0.781 22.05 -10.64
ESM N029 75 0.87 -0.67 0.839 15.51 -7.28
ESM all 244 0.79 0.19 0.794 21.86 -10.47
TEOM AB02 80 0.57 4.29 0.729 35.81 -17.12
TEOM ML01 90 0.48 5.71 0.695 41.61 -20.47
TEOM all 170 0.53 4.94 0.712 38.58 -18.75
FDMS ML01 88 1.03 -0.12 1.029 6.88 1.55
FDMS M802 74 1.01 2.93 1.107 10.89 3.20
FDMS R701 78 1.09 -4.28 0.944 8.07 0.20
FDMS R802 53 1.00 0.09 0.998 11.71 -0.14
FDMS RT01 69 1.05 -0.64 1.025 6.19 2.02
FDMS all* 288 1.04 -1.08 0.997 8.12 0.75
*excluding M802 dataset Table 7: Overview of the regression results for automated PM2.5 monitors before calibration
Monitor Site# data points
slope intercept AMav/RMav u at LV Bias at LV
ESM R801 375 0.81 -0.17 0.802 21.48 -5.86
ESM R701 361 0.86 -1.90 0.764 21.65 -6.08
ESM all 736 0.84 -1.03 0.783 21.58 -5.95
FDMS R801 387 0.96 -0.09 0.960 10.16 -1.15
FDMS R701 319 0.98 0.32 0.993 9.62 -0.42
FDMS RT01 291 1.13 1.14 1.197 20.95 4.95
FDMS all* 706 0.97 0.10 0.974 9.89 -0.82
BAM R801 351 1.13 -0.67 1.093 14.16 3.22
BAM R701 341 1.11 -1.33 1.042 11.23 1.90
BAM RT01 262 1.03 1.42 1.118 12.69 2.39
BAM all 954 1.09 -0.22 1.079 12.81 2.51
*excluding RT01 dataset
44 Demonstration of Equivalence
Comparative PM Measurements in Flanders (Belgium) - 2010 campaign
Table 8: Overview of the regression results for automated PM10 monitors after calibration
Monitor Site# data points
factor slope intercept u at LV Bias at LV
ESM R801 88 1.25 0.95 0.40 9.50 -1.89
ESM R701 81 1.25 1.01 -0.84 7.40 -0.58
ESM N029 75 1.25 1.09 -1.05 9.93 3.65
ESM all 244 1.25 0.99 -0.06 7.94 -0.33
TEOM AB02 80 1.41* 0.86 4.48 15.87 -2.33
TEOM ML01 90 1.41* 0.70 7.23 18.59 -7.61
TEOM all 170 1.41* 0.79 5.74 16.29 -4.86
TEOM AB02 80 variable 0.97 1.20 7.82 -0.26
TEOM ML01 90 variable 0.97 0.93 6.48 -0.63
TEOM all 170 variable 0.97 1.03 7.09 -0.44
* inadequate single calibration factor Table 9: Overview of the regression results for automated PM2.5 monitors after calibration
Monitor Site # data points
factor slope intercept u at LV Bias at LV
ESM R801 375 1.27 1.04 -0.43 11.82 0.78
ESM R701 361 1.27 1.10 -2.55 9.92 0.46
ESM all 736 1.27 1.07 -1.49 11.12 0.64
BAM R801 351 0.95 1.05 -0.58 9.02 0.87
BAM R701 341 0.95 1.03 -1.20 8.66 -0.35
BAM RT01 262 0.95 0.96 1.37 9.16 0.09
BAM all 954 0.95 1.01 -0.16 9.02 0.20
5.5 Discussion and overview of calibrations
5.5.1 Discussion of PM10 results
ESM Without calibration the ESM underestimates the PM10 values by about 20%. Since the intercept is not significant calibration can be done with a single factor. For the full dataset a factor of 1.26 could be calculated based on the ratio of averages. Since this factor is very close to the factor in use (1.25) VMM decided not to change the calibration factor. When the 1.25 calibration factor is applied to the full dataset both slope (0.99), intercept (-0.06) and uncertainty at the limit value (7.94) pass the criteria. Therefore one can say that with a calibration factor of 1.25 the PM10 ESM monitor is equivalent. TEOM Without calibration the TEOM underestimates the PM10 values by about 29%. In previous years VMM always used a single calibration factor for the TEOMs. Based on the ratio of averages one can calculate a single factor of 1.41 for the current TEOM dataset. Due to the large seasonal variation (Fig
Demonstration of Equivalence 45

Comparative PM Measurements in Flanders (Belgium) - 2010 campaign
46 Demonstration of Equivalence
21) and high scatter (Fig 32) a linear calibration cannot be applied. A correction with a factor of 1.41 would for example still give an uncertainty of 16.3 (see Table 8) and even with a slope and intercept calibration the uncertainty would be too high. Therefore VMM decided to apply a calibration method involving FDMS monitors. The new calibration method is similar to the TEOM corrections in France and the UK. For this new approach the lost volatile fraction of the TEOM is calculated every half hour from the average difference in absolute concentration between 2 FDMS monitors (SZ02 and ML01) and 3 TEOM monitors (AL01, AB01 and AB02). This ‘lost fraction’ is than added to all the TEOM data in the Flemish network17. Fig 50 shows that this new calibration manages to correct the high scatter and the slope that was observed in Fig 32.
0
10
20
30
40
50
60
70
80
90
100
110
0 10 20 30 40 50 60 70 80 90 100 110
Reference Method (µg/m3)
AM
S (
µg
/m3)
Fig 50: TEOM after the new calibration vs reference method for PM10 (full dataset) With this new calibration approach the full dataset passes the criteria for slope (0.97), intercept (1.03) and uncertainty at the limit value (7.09). Therefore one can say that with the new variable calibration the PM10 TEOM monitor is equivalent. VMM decided to recalculate all TEOM data since 1 Jan 2009. FDMS When comparing the 5 FDMS datasets the results from site M802 (Antwerpen-Luchtbal) appeared to deviate from the rest. The M802 monitor overestimated the PM10 values by about 11% compared to the reference method. After a thorough analysis of all instrumental parameters it was discovered that the instrument’s dryer had not been working properly for a significant part of the campaign. Since the instrument had continuously been working within all operational margins this issue had not been noticed earlier. Following this event, VMM decided to exclude this local dataset from the full FDMS dataset and to elaborate the data validation procedure for the FDMS. Note: to avoid loosing a large portion of the routine dataset for the M802 VMM decided to replace the volatile fraction data with that from nearby FDMS monitors. This approach is justified since the local differences in volatile fraction are generally very small.
17 In the cases that the calculated difference is negative, the TEOM data are not corrected

Comparative PM Measurements in Flanders (Belgium) - 2010 campaign
Demonstration of Equivalence 47
With the M802 dataset excluded the FDMS gave an almost perfect approximation of the average reference value. It turned out to underestimate the PM10 values by only 0.3%. Also the uncertainty at the limit (8.12) value was well within the criteria. Slope (1.04) and intercept (-1.08) were significant but deemed low enough. One could also note that for the individual datasets slope and/or intercept are not always significant. This suggests that the significance of slope and intercept for the full dataset is probably a statistical coincidence. It also demonstrates that the current criteria are indeed too stringent and that a tolerance upon slope, intercept and probably also ratio of averages should be added to the equivalence procedure. As a conclusion VMM decided to use the FDMS data without correction taking into account:
- the almost perfect approximation of the overall average; - the low uncertainty; - the fact that -to our knowledge- no network uses a correction on FDMS data.
When ignoring the (too stringent?) criteria for slope and intercept one can say that the PM10 FDMS monitor is equivalent without the need for calibration. 5.5.2 Discussion of PM2.5 results
ESM Without calibration the ESM underestimates the PM2.5 values by about 22%. Although the intercept was significant (-1.03) it was deemed small enough to apply a calibration with a single factor. For the full dataset a factor of 1.28 could be calculated based on the ratio of averages. Since this factor is very close to the factor in use (1.27) VMM decided not to change the calibration factor. When the 1.27 calibration factor is applied to the full dataset the limit value (11.12) passes the criterion. The slope (1.07) and intercept (-1.49) are however significant. When ignoring the (too stringent?) criteria for slope and intercept one can say that with a calibration factor of 1.27 the PM2.5 ESM monitor is equivalent. FDMS When comparing the 3 FDMS datasets the results from site RT01 (Retie) appeared to deviate from the rest. The RT01 monitor (which was installed in a small mobile trailer) overestimated the PM10 values by about 20% compared to the reference method. Again problems with the dryer were thought to be the responsible. Like in the case of the PM10 FDMS monitor at M802 VMM also decided to exclude this local dataset from the full FDMS dataset. With the RT01 dataset excluded the FDMS meet the criterion for the uncertainty at the limit value (9.89). Although the slope (0.97) was significant the deviation was deemed small enough. The intercept (0.10) was not significant. When ignoring the (too stringent?) criteria for the slope one can say that the PM2.5 FDMS monitor is equivalent without the need for calibration. BAM Without calibration the BAM overestimates the PM2.5 values by about 8%18. Since the intercept is not significant calibration can be done with a single factor. For the full dataset a factor of 0.95 could be calculated based on the ratio of averages. When the 0.95 calibration factor is applied to the full dataset both slope (1.01), intercept (-0.16) and uncertainty at the limit value (9.02) pass the criteria. Therefore one can say that with a calibration factor of 0.95 the PM2.5 BAM monitor is equivalent. 18 Although an overestimation by a beta-absorption monitors appears strange, similar findings have been reported in the Netherlands for PM10 BAM monitors.

Comparative PM Measurements in Flanders (Belgium) - 2010 campaign
48 Demonstration of Equivalence
5.6 Equivalence conclusions
For the ESM monitor the calculated calibration factors (1.26 for PM10 and 1.28 for PM2.5) were very close to the existing factors 1.25 and 1.27. Because the new dataset turned out to be equivalent with the existing factors VMM decided not to change the factors in use.
For the FDMS monitor 2 out of the 8 investigated monitors overestimated the PM
concentrations due to problems with the dryer. After exclusion of these datasets the PM10 and PM2.5 FDMS monitors do not require calibration to be equivalent. Therefore the FDMS monitors will continue to be operated without calibration.
For the TEOM monitor (only used for PM10) a variable calibration was required to obtain
equivalence. Similar to techniques that are applied in the UK and France the TEOM data will now be corrected based on the daily differences in absolute concentration between a set of FDMS and a set of TEOM instruments. All data from 1 Jan 2009 onward is recalculated using this new approach.
For the BAM monitor (only used for PM2.5) a calibration factor of 0.95 was used to obtain
equivalence.