comparative study of indian eqity derivatives market with...
TRANSCRIPT

207
CHAPTER 5
COMPARATIVE STUDY OF INDIAN EQITY DERIVATIVES
MARKET WITH GLOBAL MARKETS: EMERGING TRENDS
Index :
5.1 Introduction 208
5.2 Global Market Capitalization 210
5.3 Global Share Trading Turnover 212
5.4 Global Comparison for Number of Trades and Average Value of
Trades in Equity Shares
213
5.5 Global Comparison of Derivatives Market in 2011 215
5.6 Comparison of Exchange-wise Global Volume & Turnover of
Equity Derivatives
219
5.6.1 Single Stock Options 220
5.6.2 Single Stock Futures 221
5.6.3 Stock Index Options 222
5.6.4 Stock Index Futures 225
5.7 Special Focus on Index Options and Futures Cross-Listings 226
5.8 OTC Equity Derivatives Clearing 227
5.9 Growth of Indian Derivatives Market compared to Global
Markets (2001-2011)
228
5.9.1 Comparison of Stock Index Options in India with
Global Counterparts
231
5.9.2 Comparison of Stock Index Futures in India with
Global Counterparts
235
5.9.3 Comparison of Single Stock Options in India with
Global Counterparts
239
5.9.4 Comparison of Single Stock Futures in India with
Global Counterparts
243

208
CHAPTER 5
COMPARATIVE STUDY OF INDIAN EQITY DERIVATIVES
MARKET WITH GLOBAL MARKETS: EMERGING TRENDS
5.1 Introduction:
As seen earlier, the global equity derivatives market has been in
existence for almost half a century now whereas the Indian Equity derivatives
market has been in existence since just a little more than a decade. Many
prominent individuals have taken the note of the fast growing Indian
derivatives market.
John C. Hull in his book, “Options, Futures and Other Derivatives”, has
quoted that “it is not surprising that derivatives markets are growing fast in
many developing countries. Mainly, China and India are the two countries
whose economies are expected to play dominant roles in the 21st century.
China’s population in 2007 is estimated to be about 1.3 billion, while that of
India is about 1.1 billion (By contrast, the population of the United States is
only about 0.3 billion). World’s population is about 6.6 billion, so China and
India between them account for about 36% of the world’s population. India is
also expected to overtake China as the world’s most populous nation by 2030.
There can be little doubt that China and India will have a huge impact on the
development of derivatives markets throughout the world in the years to come.
The other countries will also be important players. For example, Brazil the firth
most populous country in the world, has been very successful in developing its
derivatives markets.”1
It is not surprising that the equity derivatives market in India grew at
much faster pace. As per data available on the global Equity Stock Exchanges
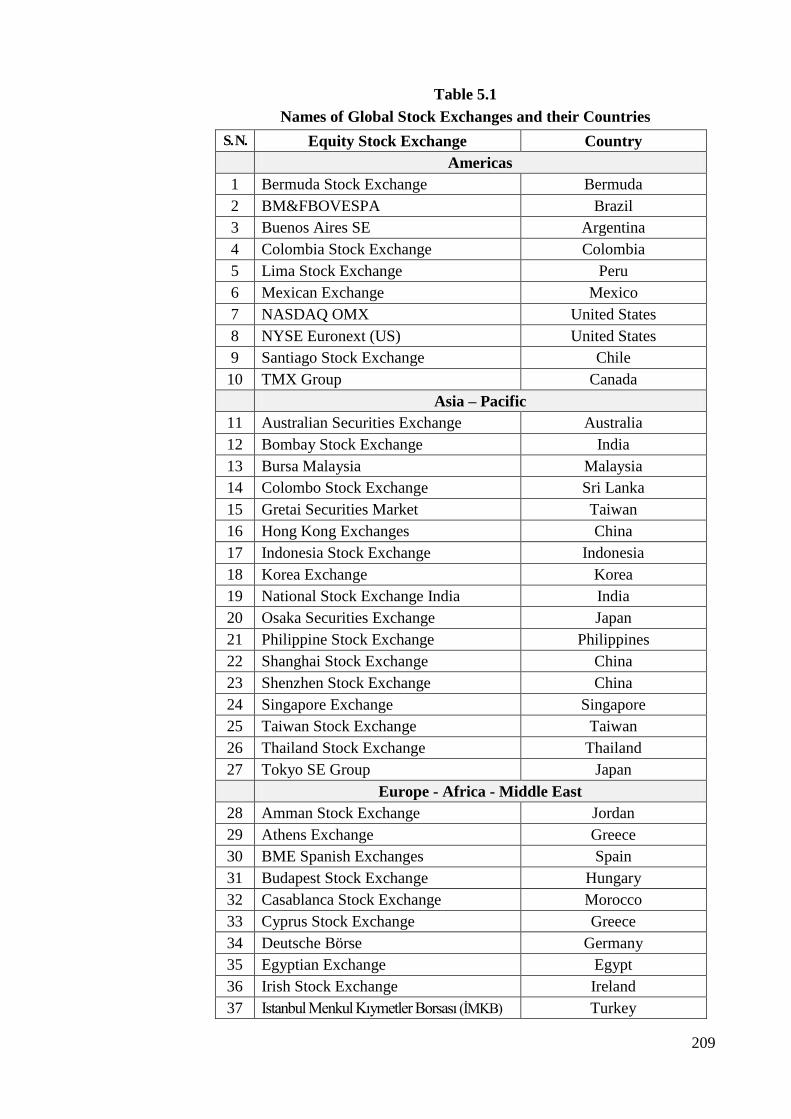
with World Federation of Exchanges and compiled from various exchange
websites, the significant Equity Stock Exchanges are categorized into three
time zones viz. Americas, Asia Pacific and EAME (Europe, Africa and Middle
East) for the purpose of various analysis and data mining. These significant
global stock exchanges are listed below under these various time zones as at the
end of 2011:
209
Table 5.1
Names of Global Stock Exchanges and their Countries
S. N. Equity Stock Exchange Country
Americas
1 Bermuda Stock Exchange Bermuda
2 BM&FBOVESPA Brazil
3 Buenos Aires SE Argentina
4 Colombia Stock Exchange Colombia
5 Lima Stock Exchange Peru
6 Mexican Exchange Mexico
7 NASDAQ OMX United States
8 NYSE Euronext (US) United States
9 Santiago Stock Exchange Chile
10 TMX Group Canada
Asia – Pacific
11 Australian Securities Exchange Australia
12 Bombay Stock Exchange India
13 Bursa Malaysia Malaysia
14 Colombo Stock Exchange Sri Lanka
15 Gretai Securities Market Taiwan
16 Hong Kong Exchanges China
17 Indonesia Stock Exchange Indonesia
18 Korea Exchange Korea
19 National Stock Exchange India India
20 Osaka Securities Exchange Japan
21 Philippine Stock Exchange Philippines
22 Shanghai Stock Exchange China
23 Shenzhen Stock Exchange China
24 Singapore Exchange Singapore
25 Taiwan Stock Exchange Taiwan
26 Thailand Stock Exchange Thailand
27 Tokyo SE Group Japan
Europe - Africa - Middle East
28 Amman Stock Exchange Jordan
29 Athens Exchange Greece
30 BME Spanish Exchanges Spain
31 Budapest Stock Exchange Hungary
32 Casablanca Stock Exchange Morocco
33 Cyprus Stock Exchange Greece
34 Deutsche Börse Germany
35 Egyptian Exchange Egypt
36 Irish Stock Exchange Ireland
37 Istanbul Menkul Kıymetler Borsası (İMKB) Turkey

210
38 Johannesburg Stock Exchange South Africa
39 Ljubljana Stock Exchange Slovenia
40 London SE Group U.K.
41 Luxembourg Stock Exchange Luxembourg
42 Malta Stock Exchange Malta
43 Mauritius Stock Exchange Mauritius
44 MICEX Russia
45 NASDAQ OMX Nordic Exchange Denmark, Sweden,
Finland and Iceland
46 NYSE Euronext (Europe) United States
47 Oslo Børs Norway
48 RTS Stock Exchange Russia
49 Saudi Stock Market – Tadawul Saudi Arabia
50 SIX Swiss Exchange Switzerland
51 Tel Aviv Stock Exchange Israel
52 Warsaw Stock Exchange Poland
53 Wiener Börse Austria
Source: Compiled from World Federation of Exchanges (WFE) and respective exchange
websites
The above table covers only the major Stock Exchanges worldwide
which are members of World Federation of Exchanges. Many of these stock
exchanges also offer equity derivatives on their exchange platform or through
their associate/group exchanges. The above details of the exchanges and their
countries is given since subsequently in the chapter the data is divided based on
the three time zones, viz. Americas, Asia Pacific and EAME (Europe, Africa
and Middle East), for the purpose of various analysis and data mining.
5.2 Global Market Capitalization:
The World Federation of Exchanges (WFE) is a trade association of
publicly regulated stock, futures and options exchanges across the globe. Also,
International Options Market Association (IOMA) was founded as an
association of options markets and clearing houses around the world. It
includes most of the major exchanges trading options on equities, equity
indexes, debt instruments, currencies and commodities. Since its affiliation
with WFE in 2002, IOMA has widened its scope to include futures and
commodity trading. The data collected here is from these two associations and
the analysis is carried out on the same. WFE had also carried out a review of 10
years for the period from 2000-2009. The output of the review is captured
below in the chart below:
211
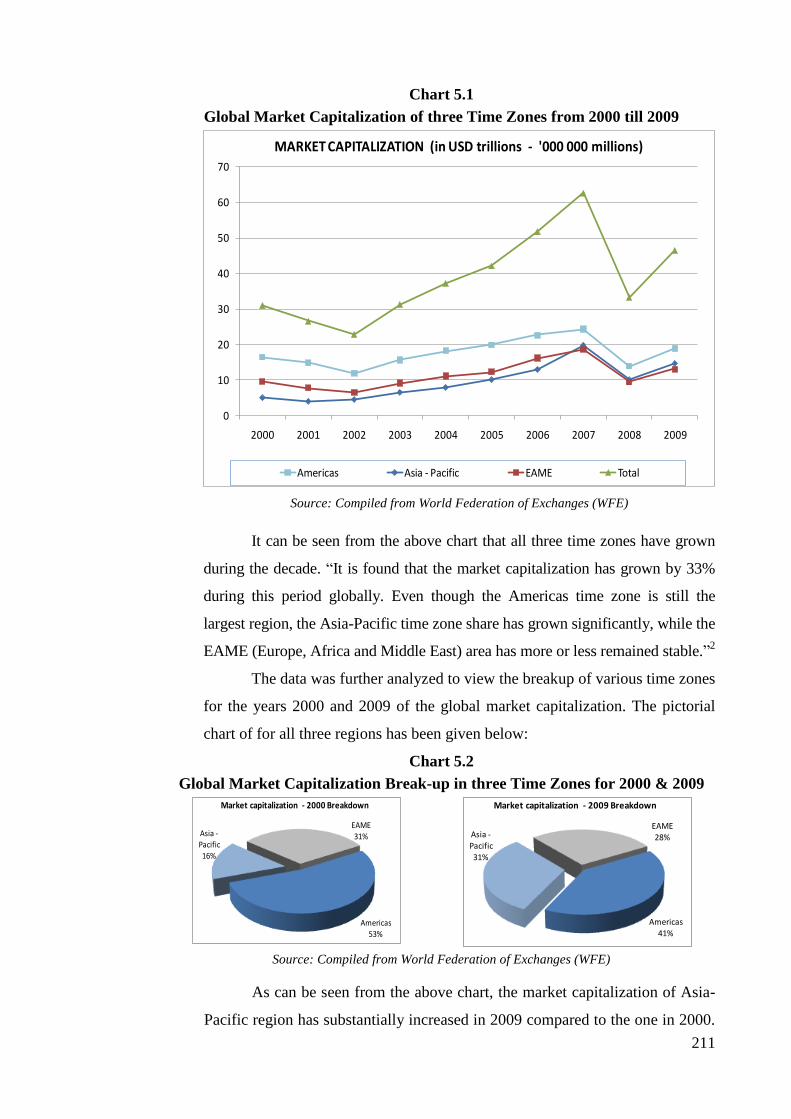
Chart 5.1
Global Market Capitalization of three Time Zones from 2000 till 2009
Source: Compiled from World Federation of Exchanges (WFE)
It can be seen from the above chart that all three time zones have grown
during the decade. “It is found that the market capitalization has grown by 33%
during this period globally. Even though the Americas time zone is still the
largest region, the Asia-Pacific time zone share has grown significantly, while the
EAME (Europe, Africa and Middle East) area has more or less remained stable.”2
The data was further analyzed to view the breakup of various time zones
for the years 2000 and 2009 of the global market capitalization. The pictorial
chart of for all three regions has been given below:
Chart 5.2
Global Market Capitalization Break-up in three Time Zones for 2000 & 2009
Source: Compiled from World Federation of Exchanges (WFE)
As can be seen from the above chart, the market capitalization of Asia-
Pacific region has substantially increased in 2009 compared to the one in 2000.
0
10
20
30
40
50
60
70
2000 2001 2002 2003 2004 2005 2006 2007 2008 2009
MARKET CAPITALIZATION (in USD trillions - '000 000 millions)
Americas Asia - Pacific EAME Total
Americas
53%
Asia -Pacific16%
EAME
31%
Market capitalization - 2000 Breakdown
Americas41%
Asia -Pacific31%
EAME
28%
Market capitalization - 2009 Breakdown
212
The Asia-Pacific market capitalization in 2000 accounted for only 16% of total
global market capitalization and was the lowest amongst all the three time
zones whereas in 2009 the market capitalization of Asia-Pacific region stood at
31% of total global market capitalization and stood second in the time zones
even overtaking the EAME region.
5.3 Global Share Trading Turnover:
A review was made of the equity share trading turnover across the
global exchanges for the period from 2000 till 2009 for the three time zones.
The value of share trading turnover was considered in terms of USD trillions.
The comparison of the three time zones for share trading value for the period
mentioned above has been brought out below in the chart form:
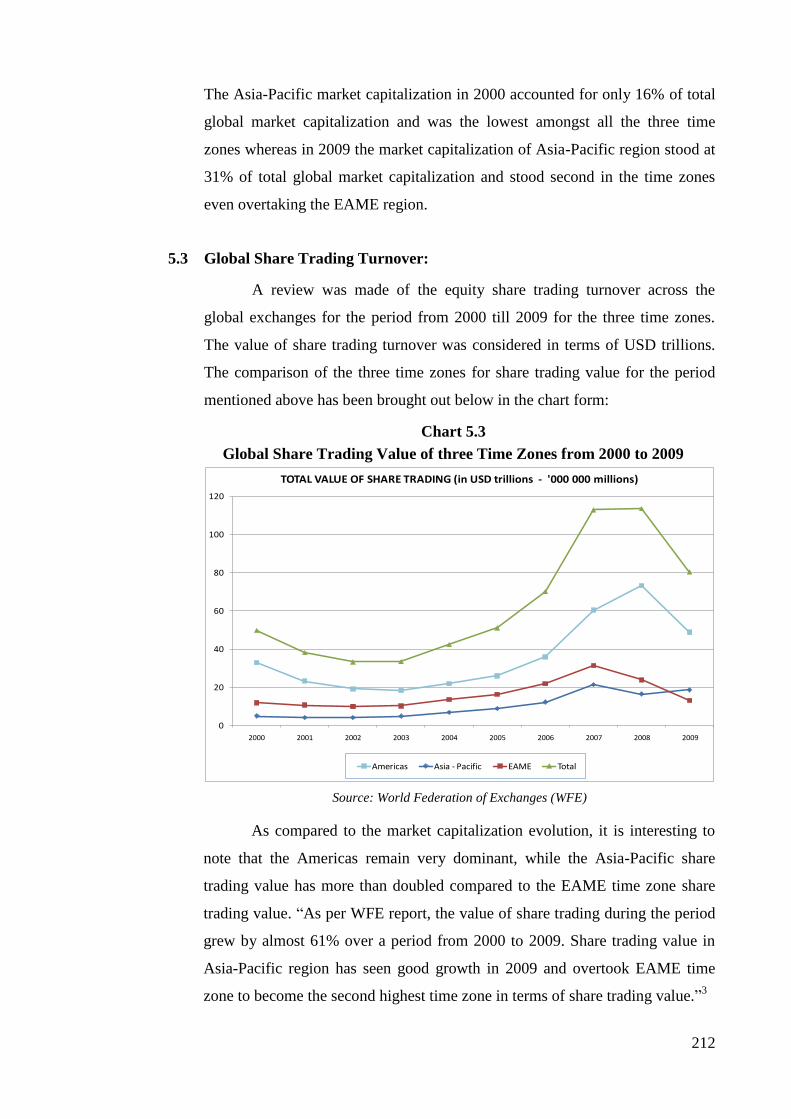
Chart 5.3
Global Share Trading Value of three Time Zones from 2000 to 2009
Source: World Federation of Exchanges (WFE)
As compared to the market capitalization evolution, it is interesting to
note that the Americas remain very dominant, while the Asia-Pacific share
trading value has more than doubled compared to the EAME time zone share
trading value. “As per WFE report, the value of share trading during the period
grew by almost 61% over a period from 2000 to 2009. Share trading value in
Asia-Pacific region has seen good growth in 2009 and overtook EAME time
zone to become the second highest time zone in terms of share trading value.”3
0
20
40
60
80
100
120
2000 2001 2002 2003 2004 2005 2006 2007 2008 2009
TOTAL VALUE OF SHARE TRADING (in USD trillions - '000 000 millions)
Americas Asia - Pacific EAME Total

213
The share trading value was analysed in terms of percentage of share
trading value contributed by each time zone during the years 2000 and 2009 to
understand the way these time zones have fared in these years. The pictorial
chart of the break-up of share trading value for 2000 and 2009 for all three
regions has been given below:
Chart 5.4
Global Share Trading Value Break-up in three Time Zones for 2000 and 2009
Source: Compiled from World Federation of Exchanges (WFE)
As can be seen from the above chart, Americas were dominant in terms
of share trading value in 2000 accounting for almost 66% of the global share
trading value which came down only marginally in 2009 to 61%. The share
trading value of EAME time zone has been skidding. Share trading value of
EAME time zone was 24% of the total global share trading value in 2000 which
skidded to 16% in 2000. It was interesting to note that Asia-Pacific time zone
which accounted for merely 10% of the total global share trading value in 2000
has grown significantly to 23% in 2009 which is almost more than doubled its
market share but also overtook EAME region in terms of share trading value.
5.4 Global Comparison for Number of Trades and Average Value of Trades in
Equity Shares:
The data was further analysed for the number of trades taken place
during the oeriod from 2000 to 2009 globally. This was important to study
since the value of currency denominations in each country has different value
in terms of USD and the trade value if seen in aggregate will have different
outcome due to this. However, number trades taken place during this period
helps in evaluating further the level of activity that has taken place in all these
three regions during the period from 2000 till 2009. The chart representation
has been brought out below for the number of trades in equity shares recorded
during the period from 2000 till 2009 plotted for all the three time zones below:
Americas66%
Asia -
Pacific10%
EAME24%
Value of share trading - 2000 Breakdown
Americas61%
Asia -
Pacific23%
EAME16%
Value of share trading - 2009 Breakdown
214
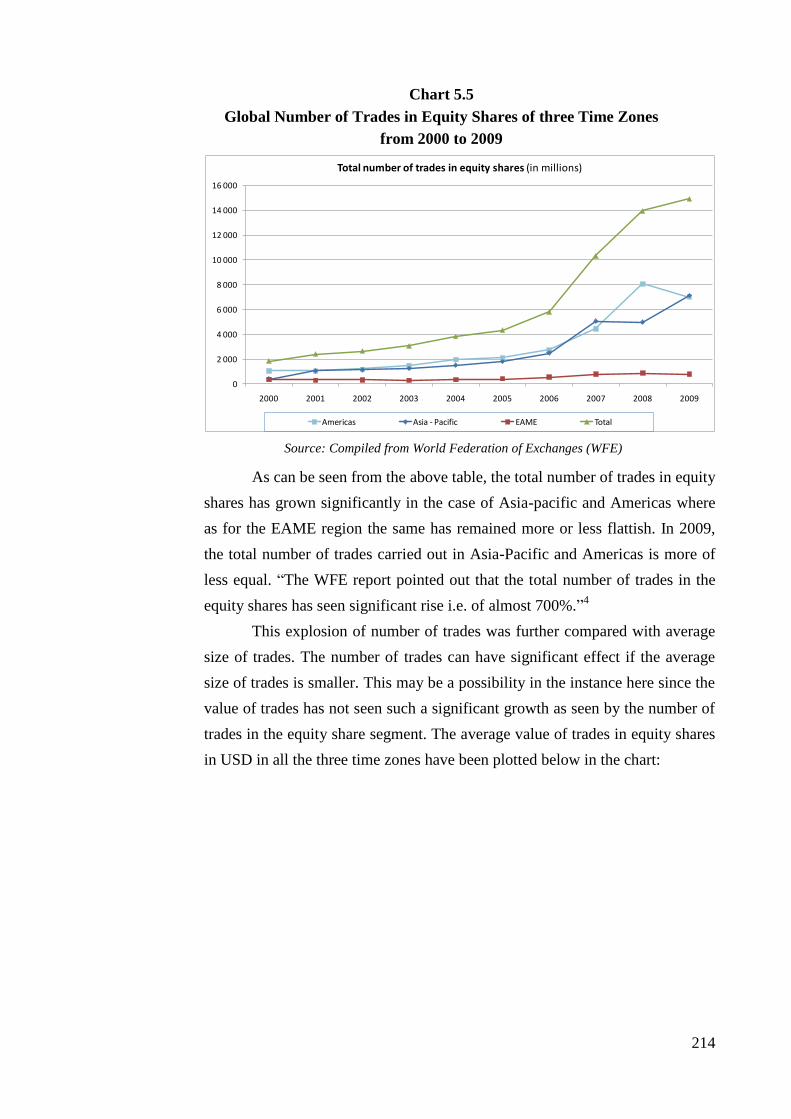
Chart 5.5
Global Number of Trades in Equity Shares of three Time Zones
from 2000 to 2009
Source: Compiled from World Federation of Exchanges (WFE)
As can be seen from the above table, the total number of trades in equity
shares has grown significantly in the case of Asia-pacific and Americas where
as for the EAME region the same has remained more or less flattish. In 2009,
the total number of trades carried out in Asia-Pacific and Americas is more of
less equal. “The WFE report pointed out that the total number of trades in the
equity shares has seen significant rise i.e. of almost 700%.”4
This explosion of number of trades was further compared with average
size of trades. The number of trades can have significant effect if the average
size of trades is smaller. This may be a possibility in the instance here since the
value of trades has not seen such a significant growth as seen by the number of
trades in the equity share segment. The average value of trades in equity shares
in USD in all the three time zones have been plotted below in the chart:
0
2 000
4 000
6 000
8 000
10 000
12 000
14 000
16 000
2000 2001 2002 2003 2004 2005 2006 2007 2008 2009
Total number of trades in equity shares (in millions)
Americas Asia - Pacific EAME Total
215
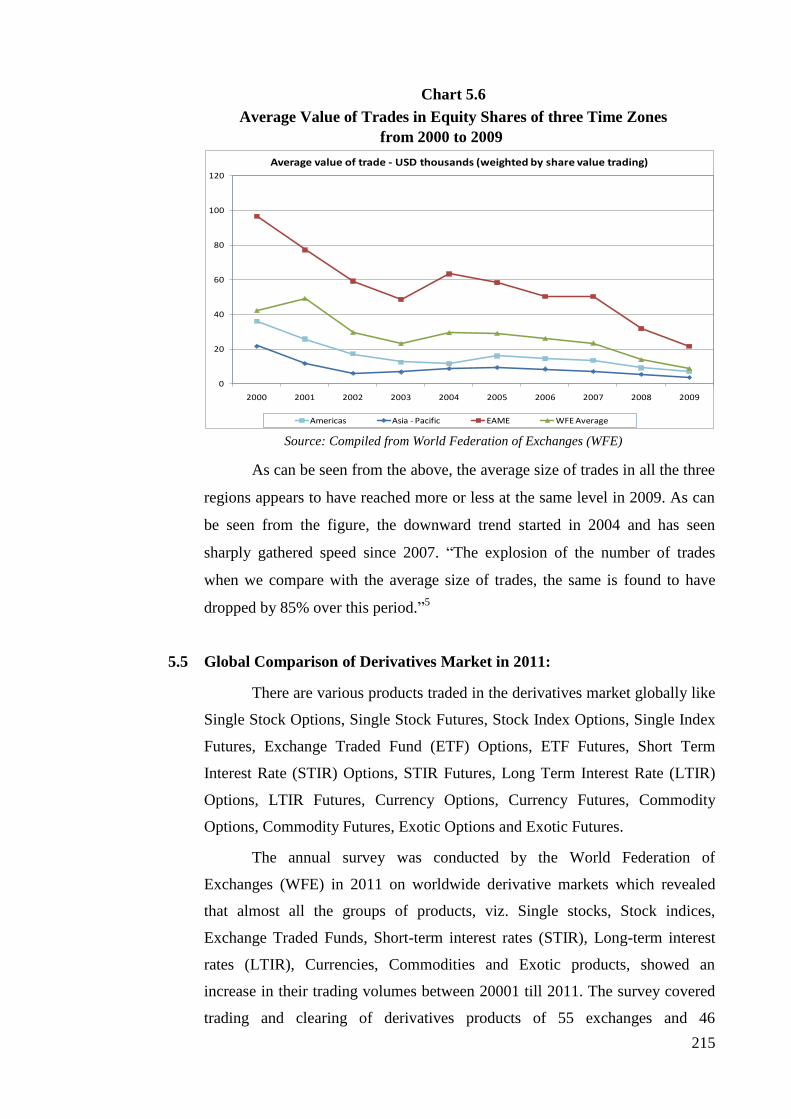
Chart 5.6
Average Value of Trades in Equity Shares of three Time Zones
from 2000 to 2009
Source: Compiled from World Federation of Exchanges (WFE)
As can be seen from the above, the average size of trades in all the three
regions appears to have reached more or less at the same level in 2009. As can
be seen from the figure, the downward trend started in 2004 and has seen
sharply gathered speed since 2007. “The explosion of the number of trades
when we compare with the average size of trades, the same is found to have
dropped by 85% over this period.”5
5.5 Global Comparison of Derivatives Market in 2011:
There are various products traded in the derivatives market globally like
Single Stock Options, Single Stock Futures, Stock Index Options, Single Index
Futures, Exchange Traded Fund (ETF) Options, ETF Futures, Short Term
Interest Rate (STIR) Options, STIR Futures, Long Term Interest Rate (LTIR)
Options, LTIR Futures, Currency Options, Currency Futures, Commodity
Options, Commodity Futures, Exotic Options and Exotic Futures.
The annual survey was conducted by the World Federation of
Exchanges (WFE) in 2011 on worldwide derivative markets which revealed
that almost all the groups of products, viz. Single stocks, Stock indices,
Exchange Traded Funds, Short-term interest rates (STIR), Long-term interest
rates (LTIR), Currencies, Commodities and Exotic products, showed an
increase in their trading volumes between 20001 till 2011. The survey covered
trading and clearing of derivatives products of 55 exchanges and 46
0
20
40
60
80
100
120
2000 2001 2002 2003 2004 2005 2006 2007 2008 2009
Average value of trade - USD thousands (weighted by share value trading)
Americas Asia - Pacific EAME WFE Average

216
clearinghouses. The data with regard to number of exchange traded derivatives
traded worldwide was also analysed for the equity, interest rate, currency and
commodity derivatives for the period from 2001 till 2011. The data is presented
in the table below:
Table 5.2
Number of ETD traded worldwide (Billions of contracts traded)
2001 2002 2003 2004 2005 2006 2007 2008 2009 2010 2011
Equity NA NA NA 6.1 6.9 7.7 10.9 11.6 12.1 13.8 15.7
Interest Rate NA NA NA 2.2 2.5 3.2 3.9 3.2 2.5 3.2 3.5
Currency NA NA NA 0.1 0.2 0.3 0.5 0.6 1 2.5 3.1
Commodity NA NA NA 0.6 0.7 1 1.3 1.2 2.3 2.9 2.8
Source: Compiled from World Federation of Exchanges (WFE)
As can be seen from the above table, the number of exchange traded
contracts (ETD) traded globally has seen constant rise in all types of exchange
traded derivatives. Currency derivatives even though had meager volume till
2009, has showing the good comparable volume subsequently. The number of
exchange traded derivative contracts in the equity derivatives has also
consistently grown during the period from 2001 to 2011. The data from the
above table is plotted in the chart below:
Chart 5.7
Number of ETD traded worldwide (Billions of contracts traded)
Source: Compiled from World Federation of Exchanges (WFE)
On seeing the number of equity derivatives contracts traded worldwide,
it clearly stands tall amongst all the other exchange traded derivatives
worldwide. Further, the number of equity derivatives traded are constantly
growing year on year.

217
There were 25 billion Exchange Traded Derivatives (ETD) contracts
(13 billion options and 12 billion futures) traded on exchanges worldwide in
2011. While the growth rate remains significantly high (+12%), it is lower than
the one observed in 2010 (+26%) after several years of pause in the increase.
Between 2006 and 2011, the number of traded contracts has more than doubled.
In 2011, the American region and EAME region experienced the same growth
rate (+13%) and the growth in the Asia Pacific region was lower in 2011
(+10%). There were more options contracts traded compared to futures
contracts in 2011.
Since 2004 till 2011, the number of traded contracts experienced a
compounded annual growth rate of 15.7% per year. As a comparison, the value
of share trading on cash markets grew by 8.5% per year over the same period.
The percentage break-up of trades taken place in the various regions worldwide,
based on the number of contracts traded in the exchange traded derivatives
contracts in the year 2011, and the percentage breakup of types of products,
mainly futures and options, traded are given in the following diagram:
Chart 5.8
Break-up of Global Volume of Derivatives in three Time Zones and
Break-up of Derivatives Products for 2011
Source: Compiled from World Federation of Exchanges (WFE)
As can be seen from the above diagram, in 2011 the Americas
accounted for 39% of the contracts, Asia Pacific region accounted for 40% of
the contracts and EAME region accounted only for 21% of the contracts when
compared on the basis of number of contracts traded in the exchange traded
derivatives. Further, it was observed that globally the Futures contracts account
for 12.3 billion contracts and Options contracts account for 13 billion contracts.

218
The break-up of Options and Futures contracts in Equity, Interest Rate,
Commodity, Currency and Other Derivatives during 2010 and 2011 is given in
the table below:
Table 5.3
Number of ETD traded worldwide (millions of contracts)
Single Stock Options 2011 2010 Growth rate
Single Stock Options 4 145 3 947 5.0%
Single Stock Futures 1 290 1 234 4.5%
Stock Index Options 5 711 5 019 13.8%
Stock Index Futures 2 641 2 328 13.4%
ETF Options 1 875 1 247 50.3%
TOTAL EQUITY 15 662 13 776 13.7%
STIR Options 492 498 -1.2%
STIR Futures 1 422 1 304 9.1%
LTIR Options 168 150 11.8%
LTIR Futures 1 381 1 228 12.5%
TOTAL Interest Rate 3 463 3 180 8.9%
Commodity Options 172 149 15.1%
Commodity Futures 2 580 2 777 -7.1%
TOTAL Commodity 2 751 2 926 -6.0%
Currency Options 289 56 415.6%
Currency Futures 2 854 2 470 15.6%
TOTAL Currency 3 143 2 526 24.4%
Other derivatives 191 127 50.1%
GRAND TOTAL 25 210 22 535 11.9%
Source: Compiled from World Federation of Exchanges (WFE)
As can be seen from the above table, the equity derivatives have seen
the 13.7% growth in equity derivatives in 2011 over 2010 which was driven by
index and ETF derivatives. Similarly, the interest rate derivatives grew by
almost 8.9% in 2011 over 2010. The currency derivatives witnessed the highest
growth rate of 24.4% in 2011 over 2010 and also overtook the commodity
derivatives market in terms of number of traded contracts. The commodity
derivatives were the only derivatives contracts which saw decrease of 6% in
number of contracts traded in 2011 compared to 2010.
Hence, globally the equity derivatives are the most preferred investment
products amongst all the exchanges traded derivatives.
219
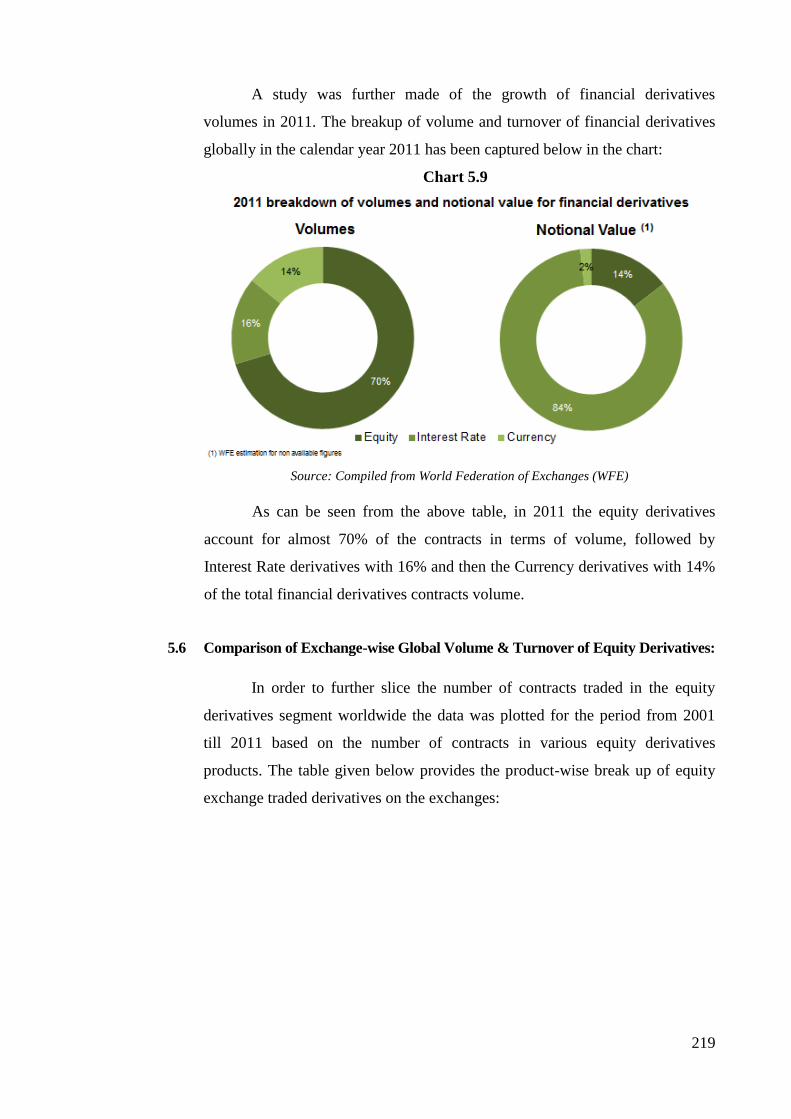
A study was further made of the growth of financial derivatives
volumes in 2011. The breakup of volume and turnover of financial derivatives
globally in the calendar year 2011 has been captured below in the chart:
Chart 5.9
Source: Compiled from World Federation of Exchanges (WFE)
As can be seen from the above table, in 2011 the equity derivatives
account for almost 70% of the contracts in terms of volume, followed by
Interest Rate derivatives with 16% and then the Currency derivatives with 14%
of the total financial derivatives contracts volume.
5.6 Comparison of Exchange-wise Global Volume & Turnover of Equity Derivatives:
In order to further slice the number of contracts traded in the equity
derivatives segment worldwide the data was plotted for the period from 2001
till 2011 based on the number of contracts in various equity derivatives
products. The table given below provides the product-wise break up of equity
exchange traded derivatives on the exchanges:

220
Table 5.4
Number of Equity Exchange Traded Derivatives Traded Worldwide
(billion of contracts)
Year Single
Stock
Options
Single
Stock
Futures
Stock
Index
Options
Stock
Index
Futures
ETF
Options
2001 NA NA NA NA 0
2002 NA NA NA NA 0
2003 NA NA NA NA 0
2004 2.1 0.1 3.1 0.8 0
2005 2.5 0.1 3.3 0.9 0
2006 2.8 0.3 3.5 1.2 0
2007 3.9 0.8 4.1 1.8 0.4
2008 3.3 1.1 4.1 2.3 .9
2009 3.6 1.1 4.2 2.2 1.1
2010 3.9 1.2 5.0 2.3 1.2
2011 4.1 1.3 5.7 2.6 1.9
Source: Compiled from World Federation of Exchanges (WFE)
NA – Not Applicable or Not Available
As can be seen from the above table, the Stock Index Options are the
most popular investment products amongst the equity derivatives products
globally followed by single stock options.
Among equity derivatives, ETF options experienced the highest growth
rate in 2011 with volumes increasing by more than 50%. The ETF options
market remains mainly a US market. This reflects the uneven development of
the underlying market of ETFs which first appeared at the beginning of the
1990’s in the US, and only ten years later in Europe. The Americas region is
still largely dominating ETFs trading (87% of the total value traded). A further
analysis was made of these various products, viz. Single Stock Options, Single
Stock Futures, Stock Index Options and Stock Index Futures, to understand the
growth in these products and also to understand the contribution made by the
Indian Stock Exchanges in the growth.
5.6.1 Single Stock Options:
In 2011, the number of single stock options traded grew by 5%
over 2010 volume (against 10% in 2010 over 2009). The United States
dominate this market with 58% of the traded volumes. The details of top
10 exchanges by number of single stock options contracts traded in 2011
are given below:

221
Table 5.5
Top 10 Exchanges by Number of Single Stock Options Contracts traded in 2011
Sr.
No. Exchange
Millions of
contracts
traded %
change
Notional
Value (bn
USD) %
change
2011 2010 2011 2010
1 BM&FBOVESPA 838 802 4% 1651 1 730 -5%
2 NASDAQ OMX (US markets) 697 640 9% NA NA -
3 NYSE Euronext (US markets) 634 592 7% NA NA -
4 Chicago Board Options Exchange 516 573 -10% 3 124 2 700 16%
5 International Securities Exchange (ISE) 431 470 -8% NA NA -
6 Eurex (1) 275 309 -11% 1 006 881 14%
7 Australian Securities Exchange (2) 189 15 -1% NA NA -
8 NYSE Liffe (European markets) (1) 151 175 -14% 532 587 -9%
9 Boston Options Exchange (TMX Group) 92 68 35% NA NA -
10 Hong Kong Exchanges and Clearing 73 21% 61 191 162 17%
Others 248 242 3% NA NA -
Total 4 145 3 947 1.6%(3) NA NA -
Source: Compiled from World Federation of Exchanges (WFE)
(1) Including OTC business registered on the Exchange. Most contracts size changed in the course
of 2011.
(2) Including Low Exercise Price Options. Growth rate calculated with rebased volumes before the
contracts size changing.
(3) Excluding ASX and Eurex volumes due to size changing of the contracts
NB: Dividend trades are included for US exchanges
As can be seen from the above table, in the year 2011 the
Americas have the dominant share in terms of number of contracts traded
in the single stock options. There is also no Indian exchange figuring in
the top 10 exchanges offering the stock options in the year 2011. In the
single stock options, as seen earlier the number of contracts traded on the
Indian Exchanges is very small compared to global volumes and hence no
exchange is figuring in the top ten global list.
5.6.2 Single Stock Futures
As per data available on Single stock futures, it increased at the
same pace of growth that of single stock options (+6%), driven by RTS
that grew by 57% and became the largest exchange in the world for its
trading volumes. In Europe, OTC trades registered on Eurex, NYSE Liffe
(Europe) and Nasdaq OMX Nordic were accounting for 98% of the traded
volumes on those three Exchanges, and 31% of the total traded volumes
worldwide in 2011. In Asia, National Stock Exchange and the Korea
Exchange were the main contributors. The details of top 10 exchanges by
number of single stock futures contracts traded in 2011 are given below:
222
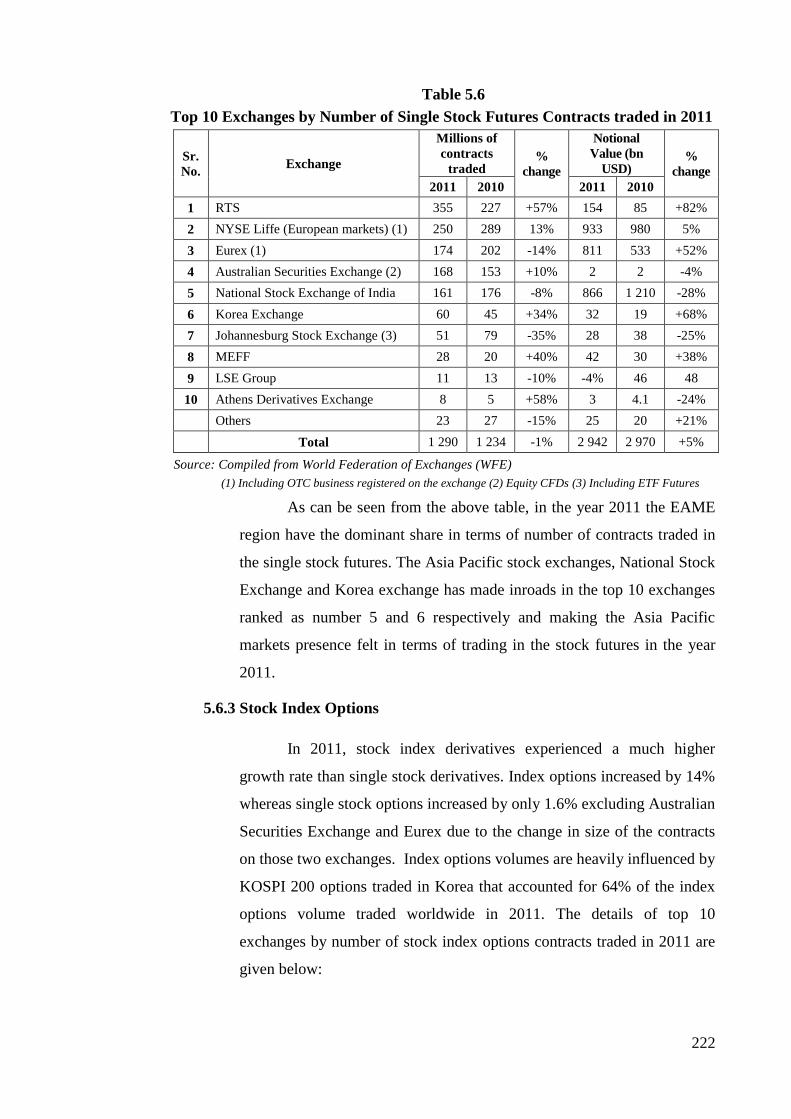
Table 5.6
Top 10 Exchanges by Number of Single Stock Futures Contracts traded in 2011
Sr.
No. Exchange
Millions of
contracts
traded %
change
Notional
Value (bn
USD) %
change
2011 2010 2011 2010
1 RTS 355 227 +57% 154 85 +82%
2 NYSE Liffe (European markets) (1) 250 289 13% 933 980 5%
3 Eurex (1) 174 202 -14% 811 533 +52%
4 Australian Securities Exchange (2) 168 153 +10% 2 2 -4%
5 National Stock Exchange of India 161 176 -8% 866 1 210 -28%
6 Korea Exchange 60 45 +34% 32 19 +68%
7 Johannesburg Stock Exchange (3) 51 79 -35% 28 38 -25%
8 MEFF 28 20 +40% 42 30 +38%
9 LSE Group 11 13 -10% -4% 46 48
10 Athens Derivatives Exchange 8 5 +58% 3 4.1 -24%
Others 23 27 -15% 25 20 +21%
Total 1 290 1 234 -1% 2 942 2 970 +5%
Source: Compiled from World Federation of Exchanges (WFE)
(1) Including OTC business registered on the exchange (2) Equity CFDs (3) Including ETF Futures
As can be seen from the above table, in the year 2011 the EAME
region have the dominant share in terms of number of contracts traded in
the single stock futures. The Asia Pacific stock exchanges, National Stock
Exchange and Korea exchange has made inroads in the top 10 exchanges
ranked as number 5 and 6 respectively and making the Asia Pacific
markets presence felt in terms of trading in the stock futures in the year
2011.
5.6.3 Stock Index Options
In 2011, stock index derivatives experienced a much higher
growth rate than single stock derivatives. Index options increased by 14%
whereas single stock options increased by only 1.6% excluding Australian
Securities Exchange and Eurex due to the change in size of the contracts
on those two exchanges. Index options volumes are heavily influenced by
KOSPI 200 options traded in Korea that accounted for 64% of the index
options volume traded worldwide in 2011. The details of top 10
exchanges by number of stock index options contracts traded in 2011 are
given below:
223
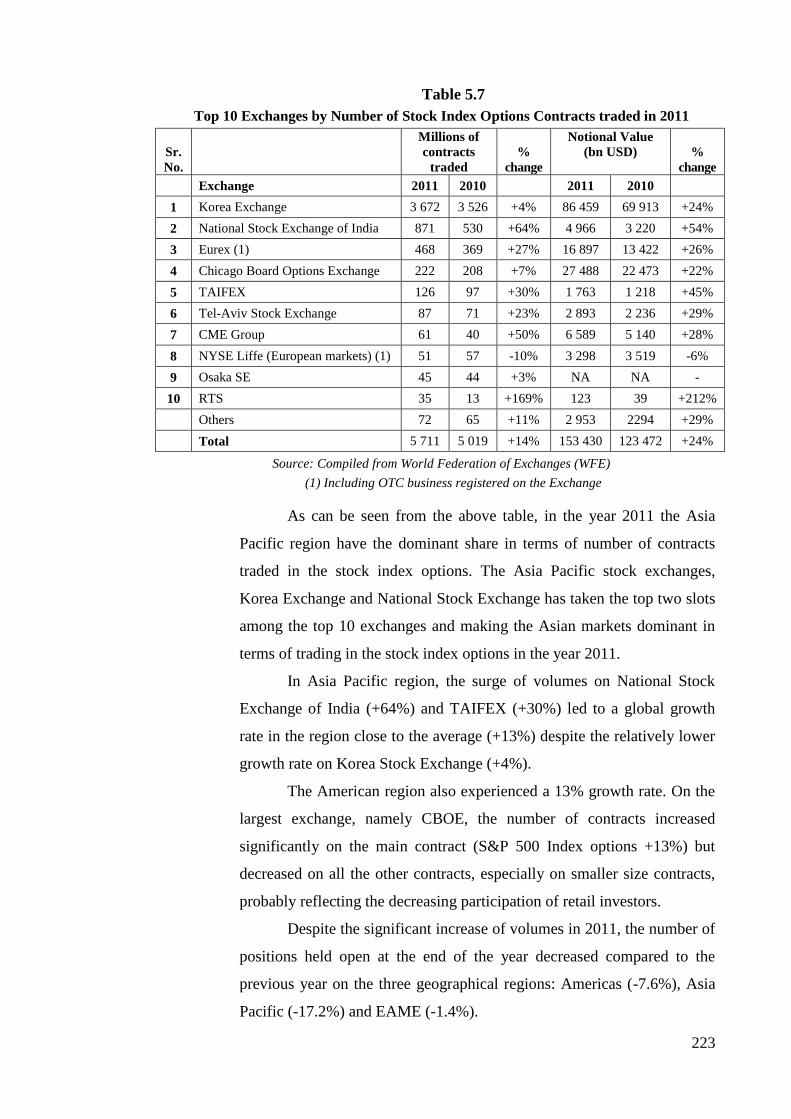
Table 5.7
Top 10 Exchanges by Number of Stock Index Options Contracts traded in 2011
Sr.
No.
Millions of
contracts
traded
%
change
Notional Value
(bn USD) %
change
Exchange 2011 2010 2011 2010
1 Korea Exchange 3 672 3 526 +4% 86 459 69 913 +24%
2 National Stock Exchange of India 871 530 +64% 4 966 3 220 +54%
3 Eurex (1) 468 369 +27% 16 897 13 422 +26%
4 Chicago Board Options Exchange 222 208 +7% 27 488 22 473 +22%
5 TAIFEX 126 97 +30% 1 763 1 218 +45%
6 Tel-Aviv Stock Exchange 87 71 +23% 2 893 2 236 +29%
7 CME Group 61 40 +50% 6 589 5 140 +28%
8 NYSE Liffe (European markets) (1) 51 57 -10% 3 298 3 519 -6%
9 Osaka SE 45 44 +3% NA NA -
10 RTS 35 13 +169% 123 39 +212%
Others 72 65 +11% 2 953 2294 +29%
Total 5 711 5 019 +14% 153 430 123 472 +24%
Source: Compiled from World Federation of Exchanges (WFE)
(1) Including OTC business registered on the Exchange
As can be seen from the above table, in the year 2011 the Asia
Pacific region have the dominant share in terms of number of contracts
traded in the stock index options. The Asia Pacific stock exchanges,
Korea Exchange and National Stock Exchange has taken the top two slots
among the top 10 exchanges and making the Asian markets dominant in
terms of trading in the stock index options in the year 2011.
In Asia Pacific region, the surge of volumes on National Stock
Exchange of India (+64%) and TAIFEX (+30%) led to a global growth
rate in the region close to the average (+13%) despite the relatively lower
growth rate on Korea Stock Exchange (+4%).
The American region also experienced a 13% growth rate. On the
largest exchange, namely CBOE, the number of contracts increased
significantly on the main contract (S&P 500 Index options +13%) but
decreased on all the other contracts, especially on smaller size contracts,
probably reflecting the decreasing participation of retail investors.
Despite the significant increase of volumes in 2011, the number of
positions held open at the end of the year decreased compared to the
previous year on the three geographical regions: Americas (-7.6%), Asia
Pacific (-17.2%) and EAME (-1.4%).
224
It is worth noting that in the Asia Pacific region, the ratio Monthly
Volumes/End of Month Open Interest, which is a way to measure short-
term volumes relative to longer-term fundamentally driven volumes, is
much higher than in the Americas and the EAME regions. In 2011, the
average ratio was equal to 36.5 in Asia Pacific region (76.1 for Korea
Exchange, 34 for National Stock Exchange of India and 10 for TAIFEX),
compared to 1.4 in Americas and 0.8 in EAME region.
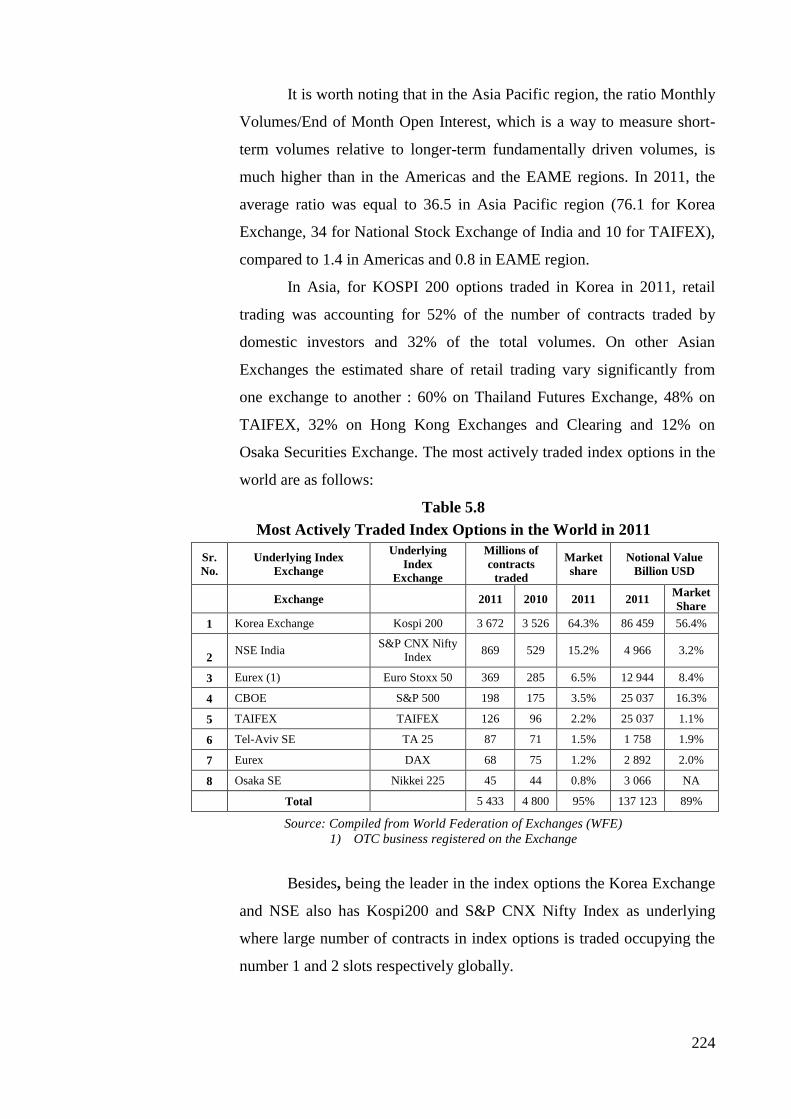
In Asia, for KOSPI 200 options traded in Korea in 2011, retail
trading was accounting for 52% of the number of contracts traded by
domestic investors and 32% of the total volumes. On other Asian
Exchanges the estimated share of retail trading vary significantly from
one exchange to another : 60% on Thailand Futures Exchange, 48% on
TAIFEX, 32% on Hong Kong Exchanges and Clearing and 12% on
Osaka Securities Exchange. The most actively traded index options in the
world are as follows:
Table 5.8
Most Actively Traded Index Options in the World in 2011
Sr.
No.
Underlying Index
Exchange
Underlying
Index
Exchange
Millions of
contracts
traded
Market
share
Notional Value
Billion USD
Exchange 2011 2010 2011 2011
Market
Share
1 Korea Exchange Kospi 200 3 672 3 526 64.3% 86 459 56.4%
2 NSE India
S&P CNX Nifty
Index 869 529 15.2% 4 966 3.2%
3 Eurex (1) Euro Stoxx 50 369 285 6.5% 12 944 8.4%
4 CBOE S&P 500 198 175 3.5% 25 037 16.3%
5 TAIFEX TAIFEX 126 96 2.2% 25 037 1.1%
6 Tel-Aviv SE TA 25 87 71 1.5% 1 758 1.9%
7 Eurex DAX 68 75 1.2% 2 892 2.0%
8 Osaka SE Nikkei 225 45 44 0.8% 3 066 NA
Total 5 433 4 800 95% 137 123 89%
Source: Compiled from World Federation of Exchanges (WFE)
1) OTC business registered on the Exchange
Besides, being the leader in the index options the Korea Exchange
and NSE also has Kospi200 and S&P CNX Nifty Index as underlying
where large number of contracts in index options is traded occupying the
number 1 and 2 slots respectively globally.
225
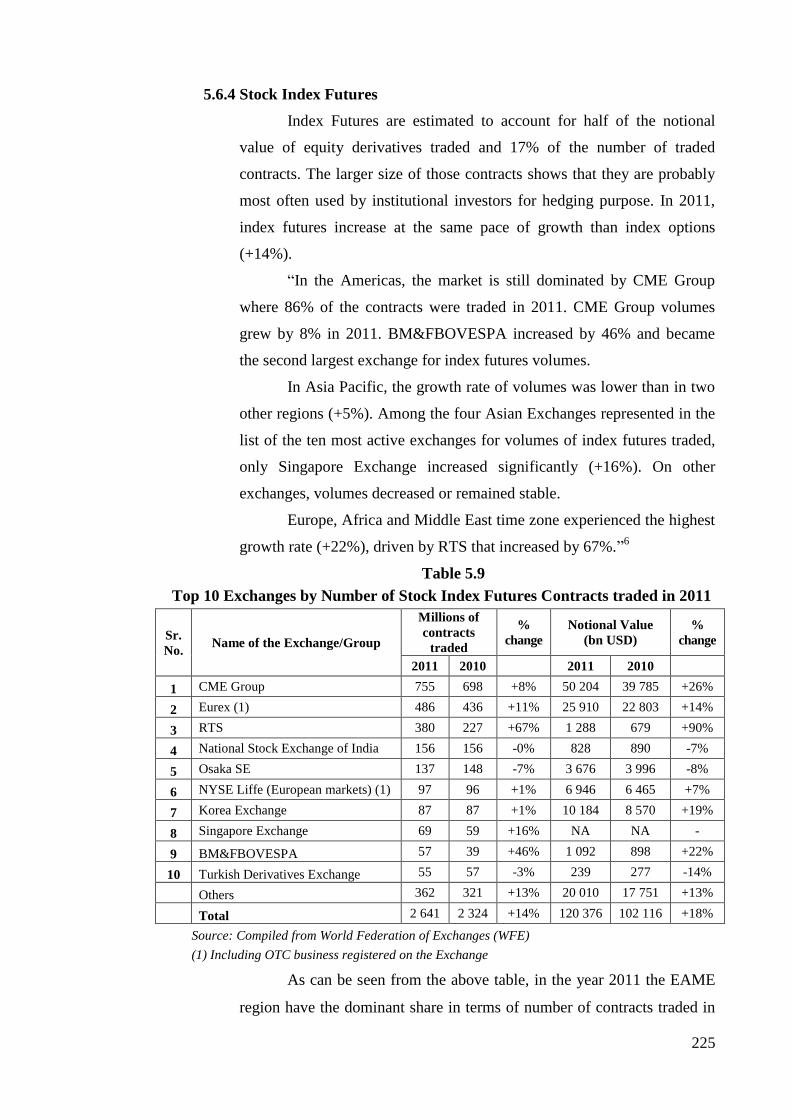
5.6.4 Stock Index Futures
Index Futures are estimated to account for half of the notional
value of equity derivatives traded and 17% of the number of traded
contracts. The larger size of those contracts shows that they are probably
most often used by institutional investors for hedging purpose. In 2011,
index futures increase at the same pace of growth than index options
(+14%).
“In the Americas, the market is still dominated by CME Group
where 86% of the contracts were traded in 2011. CME Group volumes
grew by 8% in 2011. BM&FBOVESPA increased by 46% and became
the second largest exchange for index futures volumes.
In Asia Pacific, the growth rate of volumes was lower than in two
other regions (+5%). Among the four Asian Exchanges represented in the
list of the ten most active exchanges for volumes of index futures traded,
only Singapore Exchange increased significantly (+16%). On other
exchanges, volumes decreased or remained stable.
Europe, Africa and Middle East time zone experienced the highest
growth rate (+22%), driven by RTS that increased by 67%.”6
Table 5.9
Top 10 Exchanges by Number of Stock Index Futures Contracts traded in 2011
Sr.
No. Name of the Exchange/Group
Millions of
contracts
traded
%
change
Notional Value
(bn USD)
%
change
2011 2010
2011 2010
1 CME Group 755 698 +8% 50 204 39 785 +26%
2 Eurex (1) 486 436 +11% 25 910 22 803 +14%
3 RTS 380 227 +67% 1 288 679 +90%
4 National Stock Exchange of India 156 156 -0% 828 890 -7%
5 Osaka SE 137 148 -7% 3 676 3 996 -8%
6 NYSE Liffe (European markets) (1) 97 96 +1% 6 946 6 465 +7%
7 Korea Exchange 87 87 +1% 10 184 8 570 +19%
8 Singapore Exchange 69 59 +16% NA NA -
9 BM&FBOVESPA 57 39 +46% 1 092 898 +22%
10 Turkish Derivatives Exchange 55 57 -3% 239 277 -14%
Others 362 321 +13% 20 010 17 751 +13%
Total 2 641 2 324 +14% 120 376 102 116 +18%
Source: Compiled from World Federation of Exchanges (WFE)
(1) Including OTC business registered on the Exchange
As can be seen from the above table, in the year 2011 the EAME
region have the dominant share in terms of number of contracts traded in

226
the stock index futures. The Asia Pacific stock exchanges, National Stock
Exchange and Korea exchange has made inroads in the top 10 exchanges
ranked as number 4 and 7 respectively and making the Asia Pacific
markets presence felt in terms of trading in the stock index futures in the
year 2011.
The most actively traded index futures in the world are as follows:
Table 5.10
Most Actively Traded Index Futures in the World in 2011
Sr.
No.
Underlying
Index Exchange Underlying Index
Millions of
contracts
traded
Market
share in
2011 2011 2010
1 CME Group E-MINI S&P 500 620 555 23.5%
2 Eurex (1) Euro Stoxx 50 409 372 15.5%
3 RTS RTS Index 378 225 14.3%
4 NSE India S&P CNX Nifty Index 123 128 4.7%
5 Osaka SE Nikkei 225 Mini 118 125 4.5%
6 Korea Exchange Kospi 200 87 86 3.3%
7 CME Group E-MINI Nasdaq 100 75 80 2.8%
8 Eurex (1) Euro Stoxx 50 68 75 2.6%
Total 1 878 1 647 71%
Source: Compiled from World Federation of Exchanges (WFE)
(1) Including OTC business registered on the Exchange
Besides being there in the top 10 in the index futures, NSE and
Korea Exchange also has S&P CNX Nifty Index and Kospi200 as
underlying where large number of contracts in index futures are traded
occupying the number 4 and 6 slots respectively globally.
5.7 Special Focus on Index Options and Futures Cross-Listings:
Since 2010 several exchanges have started offering trading services
allowing domestic investors to trade foreign stock index options and futures.
“In 2010, Eurex started offering KOSPI 200 index options. In 2011 there were
already 17 millions of traded contracts and during the first quarter of 2012 8.3
millions of contracts traded (16 times the volumes of the first quarter 2011).”7
In October 2011, Honk Kong Exchanges and Clearing, BM&FBOVESPA,
National Stock Exchange of India, Bombay Stock Exchange, Johannesburg
Stock Exchange Micex and RTS decided under an alliance agreement to cross-
list each other’s stock index options and futures contracts.

227
“In August 2011, CME Group and MexDer announced the launch of
their north-to-south order routing agreement, giving customers in the U.S.
access to MexDer's benchmark derivatives contracts, including Mexican Stock
Exchange Index Futures, Bond Futures and MXN Peso / US Dollar Futures
Contracts. The first phase of CME Group’s strategic partnership with MexDer
went live April 4, 2011 and gave Mexican investors access to CME Group’s
benchmark derivatives contracts including interest rates, foreign currencies,
equity indexes, energy, metals and agricultural commodities.
In June 2011, CME Group and Osaka Securities Exchange also
announced a strategic partnership consisting for Osaka Securities Exchange to
launch futures based on Dow Jones Industrial Average and for CME Group to
launch E-micro futures on the Nikkei 225 Average. In March 2012, CME
Group, BM&FBOVESPA, and S&P Indices announced an agreement for cross-
listing of global benchmark equity index, commodity and energy futures.”8
This trend of cross listing is also gathering momentum and at this stage
it is too early to make any comment on whether they would attract significant
volumes in those indexes.
5.8 OTC Equity Derivatives Clearing
Equity derivatives clearing services for over-the-counter trading are
only significant in EAME geographical region. In Europe, four exchanges offer
clearing services for OTC equity derivatives: Eurex, LSE Group, Nasdaq OMX
Nordic and NYSE Liffe. The only other exchange outside Europe providing
this type of services is BM&FBOVESPA.
Table 5.11
Number of equity derivatives contracts centrally cleared in EAME region
(million contracts)
2011 2010 Growth rate
Total number of equity derivatives cleared 3 262 2 936 11.1%
of which OTC trades (1) 1 007 1 021 -1.4%
of which on-exchange trades 2 255 1 914 17.8%
Source: Compiled from World Federation of Exchanges (WFE)
As can be seen from the above table in the EAME region, OTC trades
accounted for 32% of the traded volumes in 2011 and decreased by 1.4%
whereas total equity derivatives traded increased by 11%. As mentioned earlier,

228
there has been hardly any trading observed on the OTC in other parts of the
world. There is also no OTC trading that takes place in India.
5.9 Growth of Indian Derivatives Market compared to Global Markets (2001-2011):
The international derivative market data was available from the World
Federation of Stock Exchanges (WFE). According to the World Federation of
Stock Exchanges, the Asia Pacific markets are playing a significant role in the
world equity derivative market. Asia Pacific markets are the leaders in the stock
index options in the total turnover. Among the Asia Pacific, NSE has a
whopping share in the Stock Index Options turnover. A comparison was carried
out to see the change in the trend since 2001 to 2011 in the trading pattern
across various regions which were divided in three regions viz. the first was
Americas, the second was Europe, Africa and Middle East and the third was
Asia Pacific. The table showing the comparison of number of contracts across
these regions is given below:
Table: 5.12
Trends in World Derivative Markets in terms of number of contracts
(Contracts in Numbers)
2001 2011
Stock Options Single Stock Futures Stock Options Single Stock
Futures
No. of
Contracts
% of
total
No. of
Contracts
% of
total
No. of
Contracts
% of
total
No. of
Contracts
% of
total
1 2 3 4 5 6 7 8 9
Americas 709,966,175 60.12% 467,571,693,947 100.00% 3,275,369,714 79.02% 3,696,191 0.29%
Europe,
Africa,
Middle East
453,509,114 38.40% 14,571,086 0.00% 571,940,951 13.80% 891,953,063 69.17%
Asia Pacific 17,516,094 1.48% 546,110 0.00% 297,491,793 7.18% 393,884,960 30.54%
Stock Index
Options
Stock Index Futures Stock Index
Options
Stock Index
Futures
No. of
Contracts
% of
total
No. of
Contracts
% of
total
No. of
Contracts
% of
total
No. of
Contracts
% of
total
1 2 3 4 5 6 7 8 9
Americas 86,153,631 7.38% 113,663,335 34.13% 301,217,872 5.27% 880,726,069 33.34%
Europe,
Africa,
Middle East
249,393,645 21.36% 149,079,781 44.77% 667,095,196 11.68% 1,119,338,331 42.38%
Asia Pacific 831,948,639 71.26% 70,245,918 21.10% 4,742,951,695 83.05% 641,287,865 24.28%
Source: Compiled from Compiled from World Federation of Exchanges (WFE) Web site
As can be seen from the above table, there has been growth seen in the
market share of Asia Pacific across all the products i.e. Stock Options, Single
Stock Futures, Stock Index Options and Stock Index Futures in terms of

229
number of contracts traded on the exchanges. The substantial growth has been
seen in the Single Stock Futures in which from NIL volume the Asia Pacific
has been able to achieve market share of 30% of the global volume. Further, an
attempt was made to compare turnover observed in various products in 2011
across these three regions with the one in 2001. The data tabulated as available
is given below:
Table: 5.13
Trends in World Derivative Markets in terms of Turnover
(Turnover in USD Millions)
2001 2011
Stock Options Single Stock
Futures
Stock Options Single Stock
Futures
Notional
Turnover
% of total Notional
Turnover
% of
total
Notional
Turnover
% of
total
No. of
Contracts
% of
total
1 2 3 4 5 6 7 8 9
Americas NA NA NA NA 4,873,107 69.77% 100 0.00%
Europe,
Africa, Middle
East
NA NA NA NA 1,731,127 24.79% 2,033,445 69.12%
Asia Pacific NA NA NA NA 379,985 5.44% 908,192 30.87%
Stock Index Options Stock Index
Futures
Stock Index
Options
Stock Index
Futures
Notional
Turnover
% of total Notional
Turnover
% of
total
Notional
Turnover
% of
total
No. of
Contracts
% of
total
1 2 3 4 5 6 7 8 9
Americas NA NA NA NA 34,312,615 22.36% 51,963,048 43.17%
Europe,
Africa, Middle
East
NA NA NA NA 23,664,180 15.42% 37,316,347 31.00%
Asia Pacific NA NA NA NA 95,453,219 62.21% 31,096,221 25.83%
Source: Compiled from World Federation of Exchange
NA: Not Available
If we look at the global data, the Exchanges in Asia grew especially
rapidly in 2010, with growth rates of 42.8 percent, accounting for 39.8 percent
of the global volume, compared to 32.2 percent for North America and 19.8
percent for Europe. Most of the increase in volume came from exchanges in
China, India, and Korea. In India, the growth story was driven mainly by
financial contracts, foreign exchange contracts in particular. In 2010, the dollar-
rupee contract traded on the MCX-SX had a volume of 821.3 million contracts,
making it the second most actively traded contract across all derivatives
exchanges in the world. One of the most interesting stories in the Asia-Pacific
region is the growth of equity index futures and options. These products are
traded all across the regions, with some being relatively new to the market and
others being very well-established. “The newest of the group is the CSI 300
stock index futures, which began trading in April on the China Financial
230
Futures Exchange in Shanghai, and the Kospi 200 index options is the region’s
most actively traded equity index contract. For many years, the Kospi option
was responsible for most of the trading volume of the Korea Exchange, which
is no longer the case. The total number of futures and options contracts traded
on the 70 exchanges worldwide tracked by the Futures Industry Association
went up from 17.7 billion in 2009 to 22.3 billion in 2010, a growth of about
25.9 percent.”10
In the global markets, the NSE was ranked nowhere in the Top 20
markets in the world in the equity derivatives segment in the year 2001. The
scenario in the global markets has improved substantially over a period of time.
NSE’s ranking since then in terms of traded volumes in equity derivatives taken
together has also improved worldwide from being ranked 15th
in 2006 to 8th
position in 2008 to 7th
in 2009 and 5th
in 2010. In 2010, the National Stock
Exchange stood at 9th
rank in terms of market capitalization with market
capitalization of USD 1597 billion. In terms of the number of single stock
futures contracts traded in 2010, the NSE held the 2nd
position. It was also
ranked 2nd
in terms of the number of stock index options contracts traded and 3rd
in terms of the number of stock index futures contracts traded in 2010 globally.
Today, in the calendar year 2011, National Stock Exchange, MCX-SX
and United Stock Exchange of India feature in the top-30 derivatives
exchanges, ranked by the number of contracts traded and/or cleared, at
positions 5th
, 9th
and 13th
respectively. Nifty Index Options have been ranked
the world’s 2nd
most traded option in calendar year 2011 as per Futures Industry
Association while Nifty Index Futures is ranked 12th
. As per the Annual
Volume Statistics published by the Futures Industry Association in 2011,
National Stock Exchange (NSE) has seen an increase of 36 percent in the
number of contracts traded in the equity derivatives segment as compared 2010
and is ranked 5th
worldwide.
These rankings are based on the data available with World Federation of
Exchanges (WFE). In 2011, the Indian exchanges were not part of the top 10 as
their market capitalization fell dramatically (-38% in USD terms). “This trend
has been reinforced by foreign exchange variation, since their market
capitalization only fell by 26% in rupees.”9 In terms of the number of single
stock futures contracts traded in 2011, the NSE held the third position. It was
231
second in terms of the number of contracts traded in the stock index options
contracts and third in terms of the number of stock index futures contracts
traded in 2011. These rankings are based on the World Federation of
Exchanges (WFE) Market Highlights 2011.
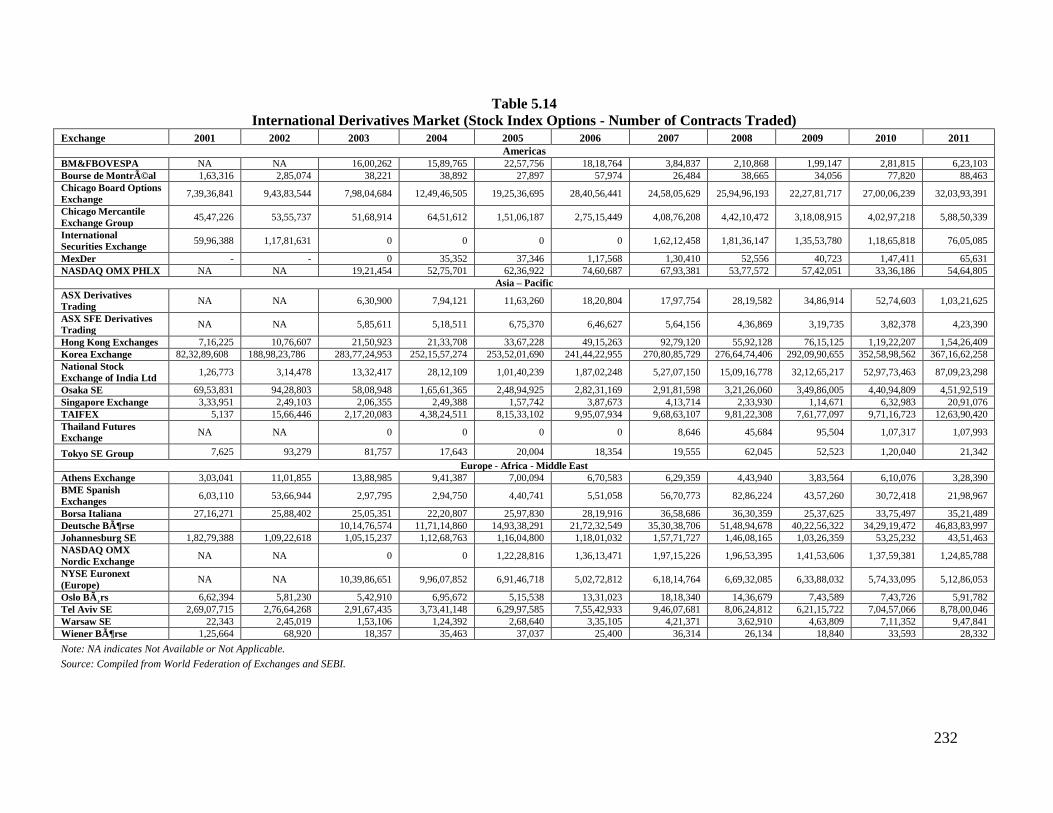
5.9.1 Comparison of Stock Index Options in India with Global
Counterparts:
The analysis was carried out of number of contracts traded on
various exchanges globally in the stock index options for a period from
2001 to 2011. For this purpose, the stock exchanges from various regions
across all three time zones were taken into consideration. The analysis of
the Stock Index Options show that the number of contracts traded in the
Stock Index Options on NSE has grown multifold as compared to the
growth observed in the other countries. The data with regard to number of
contracts traded on various exchanges globally in the stock index options
for a period from 2001 to 2011 has been plotted in the table given below:
232
Table 5.14
International Derivatives Market (Stock Index Options - Number of Contracts Traded)
Exchange 2001 2002 2003 2004 2005 2006 2007 2008 2009 2010 2011
Americas
BM&FBOVESPA NA NA 16,00,262 15,89,765 22,57,756 18,18,764 3,84,837 2,10,868 1,99,147 2,81,815 6,23,103
Bourse de Montréal 1,63,316 2,85,074 38,221 38,892 27,897 57,974 26,484 38,665 34,056 77,820 88,463
Chicago Board Options
Exchange 7,39,36,841 9,43,83,544 7,98,04,684 12,49,46,505 19,25,36,695 28,40,56,441 24,58,05,629 25,94,96,193 22,27,81,717 27,00,06,239 32,03,93,391
Chicago Mercantile
Exchange Group 45,47,226 53,55,737 51,68,914 64,51,612 1,51,06,187 2,75,15,449 4,08,76,208 4,42,10,472 3,18,08,915 4,02,97,218 5,88,50,339
International
Securities Exchange 59,96,388 1,17,81,631 0 0 0 0 1,62,12,458 1,81,36,147 1,35,53,780 1,18,65,818 76,05,085
MexDer - - 0 35,352 37,346 1,17,568 1,30,410 52,556 40,723 1,47,411 65,631
NASDAQ OMX PHLX NA NA 19,21,454 52,75,701 62,36,922 74,60,687 67,93,381 53,77,572 57,42,051 33,36,186 54,64,805
Asia – Pacific
ASX Derivatives
Trading NA NA 6,30,900 7,94,121 11,63,260 18,20,804 17,97,754 28,19,582 34,86,914 52,74,603 1,03,21,625
ASX SFE Derivatives
Trading NA NA 5,85,611 5,18,511 6,75,370 6,46,627 5,64,156 4,36,869 3,19,735 3,82,378 4,23,390
Hong Kong Exchanges 7,16,225 10,76,607 21,50,923 21,33,708 33,67,228 49,15,263 92,79,120 55,92,128 76,15,125 1,19,22,207 1,54,26,409
Korea Exchange 82,32,89,608 188,98,23,786 283,77,24,953 252,15,57,274 253,52,01,690 241,44,22,955 270,80,85,729 276,64,74,406 292,09,90,655 352,58,98,562 367,16,62,258
National Stock
Exchange of India Ltd 1,26,773 3,14,478 13,32,417 28,12,109 1,01,40,239 1,87,02,248 5,27,07,150 15,09,16,778 32,12,65,217 52,97,73,463 87,09,23,298
Osaka SE 69,53,831 94,28,803 58,08,948 1,65,61,365 2,48,94,925 2,82,31,169 2,91,81,598 3,21,26,060 3,49,86,005 4,40,94,809 4,51,92,519
Singapore Exchange 3,33,951 2,49,103 2,06,355 2,49,388 1,57,742 3,87,673 4,13,714 2,33,930 1,14,671 6,32,983 20,91,076
TAIFEX 5,137 15,66,446 2,17,20,083 4,38,24,511 8,15,33,102 9,95,07,934 9,68,63,107 9,81,22,308 7,61,77,097 9,71,16,723 12,63,90,420
Thailand Futures
Exchange NA NA 0 0 0 0 8,646 45,684 95,504 1,07,317 1,07,993
Tokyo SE Group 7,625 93,279 81,757 17,643 20,004 18,354 19,555 62,045 52,523 1,20,040 21,342
Europe - Africa - Middle East
Athens Exchange 3,03,041 11,01,855 13,88,985 9,41,387 7,00,094 6,70,583 6,29,359 4,43,940 3,83,564 6,10,076 3,28,390
BME Spanish
Exchanges 6,03,110 53,66,944 2,97,795 2,94,750 4,40,741 5,51,058 56,70,773 82,86,224 43,57,260 30,72,418 21,98,967
Borsa Italiana 27,16,271 25,88,402 25,05,351 22,20,807 25,97,830 28,19,916 36,58,686 36,30,359 25,37,625 33,75,497 35,21,489
Deutsche Börse 10,14,76,574 11,71,14,860 14,93,38,291 21,72,32,549 35,30,38,706 51,48,94,678 40,22,56,322 34,29,19,472 46,83,83,997
Johannesburg SE 1,82,79,388 1,09,22,618 1,05,15,237 1,12,68,763 1,16,04,800 1,18,01,032 1,57,71,727 1,46,08,165 1,03,26,359 53,25,232 43,51,463
NASDAQ OMX
Nordic Exchange NA NA 0 0 1,22,28,816 1,36,13,471 1,97,15,226 1,96,53,395 1,41,53,606 1,37,59,381 1,24,85,788
NYSE Euronext
(Europe) NA NA 10,39,86,651 9,96,07,852 6,91,46,718 5,02,72,812 6,18,14,764 6,69,32,085 6,33,88,032 5,74,33,095 5,12,86,053
Oslo Børs 6,62,394 5,81,230 5,42,910 6,95,672 5,15,538 13,31,023 18,18,340 14,36,679 7,43,589 7,43,726 5,91,782
Tel Aviv SE 2,69,07,715 2,76,64,268 2,91,67,435 3,73,41,148 6,29,97,585 7,55,42,933 9,46,07,681 8,06,24,812 6,21,15,722 7,04,57,066 8,78,00,046
Warsaw SE 22,343 2,45,019 1,53,106 1,24,392 2,68,640 3,35,105 4,21,371 3,62,910 4,63,809 7,11,352 9,47,841
Wiener Börse 1,25,664 68,920 18,357 35,463 37,037 25,400 36,314 26,134 18,840 33,593 28,332
Note: NA indicates Not Available or Not Applicable.
Source: Compiled from World Federation of Exchanges and SEBI.
233
It may be seen from the above table that National Stock Exchange,
a leading stock Exchange in India in the equity derivatives market which
controls almost more than 97.50% of the total market volume in India, has
seen tremendous growth compared to other Stock Exchanges globally. In
terms of number of Stock Index Options contracts traded on the
exchanges, the sane has grown exponentially from 1,26,773 contracts in
2001 to record 87,09,23,298 number of contracts in the year 2011 which
is almost 6870 times of the number of Stock Index Options contracts
recorded in 2001. The Exchange was also ranked 2nd
globally in the year
2011 in terms of number of Stock Index Options contracts traded on the
exchange. This is very significant achievement for any bourse to attain
considering the equity trading on the exchange is just an over a decade old
phenomenon.
An analysis was also carried out of the notional value of contracts
traded of Stock Index Options globally in terms of USD. The data
analysis with regard to notional value of contracts traded on various
exchanges globally in the stock index options for a period from 2001-
2011 has been presented in the table given below:

234
Table 5.15
International Derivatives Market (Stock Index Options - Notional Value of Contracts Traded) US$ million
Exchange 2001 2002 2003 2004 2005 2006 2007 2008 2009 2010 2011
Americas
BM&FBOVESPA NA NA 8,332 12,553 25,183 35,862 1,03,797 70,710 52,913 1,08,181 2,19,388
Bourse de Montréal NA 729 997 141 2,594 3,480 1,956 2,787 1,859 5,341 6,903
Chicago Board Options Exchange NA 39,60,392 48,97,434 76,24,273 1,15,41,513 1,77,91,735 2,69,15,279 2,51,00,333 1,66,35,779 2,24,72,509 NA
Chicago Mercantile Exchange Group NA 12,82,283 12,16,648 16,95,485 32,80,868 60,18,751 90,01,358 72,53,579 35,90,422 49,05,564 64,12,012
International Securities Exchange NA 37,099 NA NA NA NA NA NA NA NA NA
MexDer NA - NA 144 460 2,109 3,374 1,282 686 3,791 1,904
NASDAQ OMX PHLX NA NA 1,955 2,397 2,773 4,164 3,755 40,404 51,863 3,814 3,738
Asia – Pacific
ASX Derivatives Trading NA NA 0 0 0 0 95,123 1,19,155 1,16,030 2,23,060 4,82,241
ASX SFE Derivatives Trading NA NA 25,703 30,432 49,967 55,396 72,476 47,419 26,351 40,298 49,348
Hong Kong Exchanges NA 71,895 1,38,046 1,88,689 2,95,235 4,91,387 12,68,277 6,12,479 7,92,898 14,23,999 17,79,690
Korea Exchange NA 6,471 2,07,63,160 2,39,67,028 3,45,40,417 4,43,22,087 6,33,96,927 4,43,07,987 4,13,53,875 6,99,26,884 8,69,27,139
National Stock Exchange of India Ltd NA 1,383 6,109 22,887 58,789 1,44,166 3,25,891 6,21,924 14,39,921 32,86,629 43,87,327
Osaka SE NA 7,96,831 7,627 NA NA NA NA NA NA NA NA
Singapore Exchange NA - 5,814 11,920 9,142 25,957 29,280 NA NA NA NA
TAIFEX NA 24,425 2,01,147 14,367 20,917 21,545 26,625 22,05,145 7,19,326 12,21,192 16,86,917
Thailand Futures Exchange NA NA 0 0 0 0 1 6 7 8 NA
Tokyo SE Group NA - 7,384 1,788 2,102 2,352 2,644 7,682 5,118 12,926 NA
Europe - Africa - Middle East
Athens Exchange NA 2,583 7,305 7,774 7,785 9,671 11,968 6,334 3,112 3,432 1,364
BME Spanish Exchanges NA 41,089 22,953 30,409 54,147 88,049 1,17,517 1,42,056 61,091 40,925 29,542
Borsa Italiana NA 1,83,868 1,75,117 1,90,321 2,59,612 3,31,662 5,07,531 3,90,866 1,84,641 2,34,925 2,11,194
Deutsche Börse NA NA 23,77,610 36,50,586 52,64,975 96,08,949 1,98,39,867 2,44,41,302 1,39,17,962 1,24,12,042 1,69,43,305
Johannesburg SE NA 8,990 6,013 7,517 7,708 13,915 13,904 20,568 8,515 5,538 4,657
NASDAQ OMX Nordic Exchange NA NA 0 0 1,46,164 1,86,061 3,49,990 2,66,377 1,52,171 1,95,937 1,97,426
NYSE Euronext (Europe) NA NA 17,90,310 25,84,927 27,92,418 38,79,974 58,53,768 53,62,817 36,60,033 31,48,453 33,08,289
Oslo Børs NA 13 44 0 0 1,802 2,383 1,858 489 505 531
Tel Aviv SE NA 2,38,294 2,65,147 4,44,399 9,60,701 14,28,106 25,31,284 21,99,320 14,13,253 22,04,583 29,05,830
Warsaw SE NA 8 7 605 1,876 3,225 5,256 3,550 2,786 5,631 8,244
Wiener Börse NA 1,352 454 1,660 2,565 2,406 4,166 2,826 1,077 734 19
Note: NA indicates Not Available or Not Applicable Source: Compiled from World Federation of Exchanges and SEBI.
235
As can be seen from the above table, the notional value of
contracts traded in the Stock Index Options has been continuously
growing till 2007 which fell down marginally in 2008. Notional value of
contracts traded in the Stock Index Options had fallen by almost 25% in
2009 over 2008. However, since then the notional value of contracts
traded globally has been on the rise.
In 2011, even though NSE had large number of contracts traded in
the Stock Index Options globally, has only contributed 3.48% in terms of
value to the total notional value of contracts traded in the Stock Index
Options. However, if we compare the performance of NSE over 2002 in
2011, it is observed that NSE which had meager contribution of 0.02% in
2002 to the total notional value of contracts traded in the Stock Index
Options has improved to 3.48% in 2011.
5.9.2 Comparison of Stock Index Futures in India with Global Counterparts:
The analysis was carried out of number of contracts traded on
various exchanges globally in the stock index futures for a period from
2001 to 2011. For this purpose, the stock exchanges from various regions
across all three time zones were taken into consideration. The analysis of
the Stock Index Futures show that the number of contracts traded in the
Stock Index Futures on NSE has grown multifold as compared to the
growth observed in the other countries. The data with regard to number of
contracts traded on various exchanges globally in the stock index futures
for a period from 2001 to 2011 has been presented in the table given
below:

236
Table 5.16
International Derivatives Market (Stock Index Futures - Number of Contracts Traded)
Exchange 2001 2002 2003 2004 2005 2006 2007 2008 2009 2010 2011
Americas
BM&FBOVESPA 77,89,427 67,59,469 60,65,361 1,68,27,755 2,65,50,491 3,01,55,068 2,87,25,462 1,80,39,345 2,16,50,138
Bourse de Montréal 11,74,328 14,58,942 16,81,994 19,06,038 22,37,955 30,64,695 38,85,872 45,75,352 41,57,917 40,70,604 37,37,048
CBOE Futures
Exchange - - 0 620 33,730 47,01,96,436 63,35,82,528 11,61,397 11,55,969 44,02,616 1,20,44,512
Chicago Mercantile
Exchange Group 10,21,65,253 21,21,77,526 28,10,35,970 30,60,58,671 37,97,48,159 47,01,80,198 64,15,51,177 88,24,32,628 70,30,72,175 69,51,47,655 73,58,45,814
MexDer 34,478 49,243 2,19,434 3,48,835 4,10,565 6,20,557 9,51,955 10,85,663 11,30,528 13,21,686 12,31,048
Asia – Pacific
ASX SFE Derivatives
Trading 42,88,848 46,22,139 56,04,726 65,41,632 84,12,807 1,01,74,823 94,13,157 99,36,165 1,19,69,393
Bursa Malaysia
Derivatives 2,87,528 2,33,863 3,31,216 10,88,419 11,11,575 16,28,043 31,57,341 29,20,728 19,97,975 19,94,907 24,82,314
Hong Kong Exchanges 51,73,709 59,19,028 81,05,877 1,17,42,376 1,33,93,886 1,97,47,246 3,23,39,682 4,44,36,944 4,32,01,921 4,27,53,763 5,02,29,356
Korea Exchange 3,15,02,000 4,28,68,164 6,22,04,783 5,56,08,856 4,36,13,540 4,66,96,151 4,70,66,930 6,64,36,912 8,31,17,062 8,67,62,976 8,72,74,461
National Stock
Exchange of India 7,40,956 16,41,779 90,47,026 2,33,54,782 4,73,75,214 7,02,86,258 13,87,94,235 20,23,90,223 19,57,59,414 15,63,51,505 15,57,13,851
Osaka SE 1,04,78,441 1,11,34,738 54,92,488 2,45,83,283 1,80,70,352 3,16,61,331 7,92,91,064 13,10,28,334 13,01,07,633 14,55,65,512 13,71,99,290
Singapore Exchange 90,15,837 1,02,09,261 86,09,973 1,64,28,731 2,17,35,080 3,12,00,243 4,03,64,696 6,02,12,079 5,21,40,365 5,92,30,325 6,88,31,646
TAIFEX 43,46,253 63,77,808 99,53,118 1,35,34,066 1,01,05,095 1,39,30,545 1,67,51,244 3,17,84,280 4,14,26,429 4,17,28,751 5,37,95,012
Thailand Futures
Exchange 0 0 0 0 12,28,238 20,99,098 25,22,465 24,71,302 43,16,430
Tokyo SE Group 50,92,652 72,73,395 95,00,102 1,03,06,359 1,27,86,102 1,49,07,723 1,65,78,731 2,90,88,823 1,62,87,710 1,59,00,256 1,46,93,059
Europe - Africa - Middle East
Athens Exchange 18,39,807 24,29,532 28,86,150 29,22,919 25,12,957 26,34,145 27,36,718 28,32,157 23,71,733 29,65,284 24,84,813
BME Spanish
Exchanges 43,42,938 46,22,108 36,83,246 44,74,114 50,50,616 65,68,657 1,13,00,997 1,05,75,717 85,85,281 98,60,262 83,80,865
Borsa Italiana 60,35,207 70,11,175 68,34,482 48,16,955 48,75,301 56,97,622 67,37,435 78,23,666 63,24,536 80,13,626 93,36,603
Budapest SE 12,36,405 3,09,056 3,23,609 0 5,29,563 18,79,064 39,50,953 36,03,367 26,70,898 36,35,407 18,81,620
Deutsche Börse 14,28,15,053 16,17,00,235 18,44,94,565 27,01,34,951 40,05,38,510 51,17,48,879 39,52,43,697 40,77,72,104 48,63,25,501
Johannesburg SE 1,05,18,672 80,26,118 86,77,916 94,44,204 1,06,63,761 1,55,23,825 1,90,02,289 1,93,16,211 1,67,37,684 1,66,21,801 1,72,72,109
MICEX
0 0 0 0 0 0 3,96,289 62,37,229 20,16,291
NASDAQ OMX
Nordic Exchange 1,49,06,505 1,33,31,795 1,45,67,900 1,64,60,920 2,02,07,997 2,43,74,769 3,16,00,899 3,93,04,636 3,36,94,286 3,24,24,236 3,74,62,177
NYSE Euronext
(Europe) 5,66,89,805 5,27,32,215 5,60,92,515 7,21,35,006 9,18,13,789 10,60,99,614 9,28,67,375 9,42,68,808 9,72,23,103
Oslo Børs 5,21,314 6,89,904 7,61,376 6,77,513 5,62,591 24,29,235 46,68,881 89,45,538 89,20,753 80,16,450 55,01,921
Tel Aviv SE 70,255 - 10,838 8,304 13,460 32,474 19,802 29,600 43,467 21,599 31,596
Warsaw SE 36,79,972 30,77,836 38,93,547 35,17,782 51,67,111 62,57,203 93,55,799 1,17,69,730 1,27,96,597 1,35,14,631 1,36,71,721
Wiener Börse 4,36,019 1,69,939 37,893 78,558 1,04,677 1,54,521 1,43,068 2,38,851 2,67,064 3,31,234 3,42,162
Note: NA indicates Not Available or Not Applicable.
Source: Compiled from World Federation of Exchanges and SEBI.
237
It may be seen from the above table that National Stock Exchange
has seen tremendous growth compared to other Stock Exchanges globally
in terms of number of Stock Index futures contracts traded. In terms of
number of Stock Index Futures contracts traded on the exchange, the
same has grown exponentially from 7,40,956 contracts in 2001 to record
15,57,13,851 number of contracts in the year 2011 which is almost 210
times of the number of Stock Index Futures contracts recorded in 2001.
The Exchange was also ranked 4th
globally in the year 2011 in terms of
number of contracts traded on the exchange. This is very significant
achievement for any bourse to attain considering the equity trading on the
exchange is just an over a decade old phenomenon.
An analysis was also carried out of the notional value of contracts
traded of Stock Index Futures globally in terms of USD. The data analysis
with regard to notional value of contracts traded on various exchanges
globally in the stock index futures for a period from 2001-2011 has been
presented in the table given below:
238
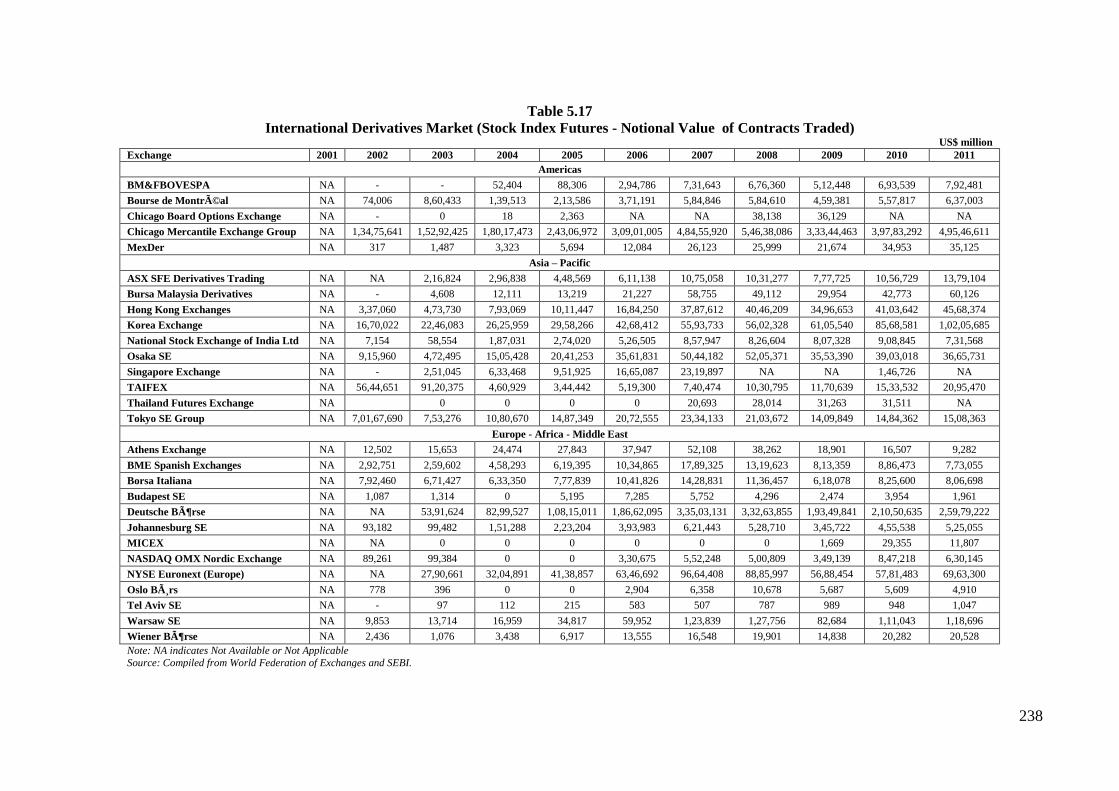
Table 5.17
International Derivatives Market (Stock Index Futures - Notional Value of Contracts Traded) US$ million
Exchange 2001 2002 2003 2004 2005 2006 2007 2008 2009 2010 2011
Americas
BM&FBOVESPA NA - - 52,404 88,306 2,94,786 7,31,643 6,76,360 5,12,448 6,93,539 7,92,481
Bourse de Montréal NA 74,006 8,60,433 1,39,513 2,13,586 3,71,191 5,84,846 5,84,610 4,59,381 5,57,817 6,37,003
Chicago Board Options Exchange NA - 0 18 2,363 NA NA 38,138 36,129 NA NA
Chicago Mercantile Exchange Group NA 1,34,75,641 1,52,92,425 1,80,17,473 2,43,06,972 3,09,01,005 4,84,55,920 5,46,38,086 3,33,44,463 3,97,83,292 4,95,46,611
MexDer NA 317 1,487 3,323 5,694 12,084 26,123 25,999 21,674 34,953 35,125
Asia – Pacific
ASX SFE Derivatives Trading NA NA 2,16,824 2,96,838 4,48,569 6,11,138 10,75,058 10,31,277 7,77,725 10,56,729 13,79,104
Bursa Malaysia Derivatives NA - 4,608 12,111 13,219 21,227 58,755 49,112 29,954 42,773 60,126
Hong Kong Exchanges NA 3,37,060 4,73,730 7,93,069 10,11,447 16,84,250 37,87,612 40,46,209 34,96,653 41,03,642 45,68,374
Korea Exchange NA 16,70,022 22,46,083 26,25,959 29,58,266 42,68,412 55,93,733 56,02,328 61,05,540 85,68,581 1,02,05,685
National Stock Exchange of India Ltd NA 7,154 58,554 1,87,031 2,74,020 5,26,505 8,57,947 8,26,604 8,07,328 9,08,845 7,31,568
Osaka SE NA 9,15,960 4,72,495 15,05,428 20,41,253 35,61,831 50,44,182 52,05,371 35,53,390 39,03,018 36,65,731
Singapore Exchange NA - 2,51,045 6,33,468 9,51,925 16,65,087 23,19,897 NA NA 1,46,726 NA
TAIFEX NA 56,44,651 91,20,375 4,60,929 3,44,442 5,19,300 7,40,474 10,30,795 11,70,639 15,33,532 20,95,470
Thailand Futures Exchange NA
0 0 0 0 20,693 28,014 31,263 31,511 NA
Tokyo SE Group NA 7,01,67,690 7,53,276 10,80,670 14,87,349 20,72,555 23,34,133 21,03,672 14,09,849 14,84,362 15,08,363
Europe - Africa - Middle East
Athens Exchange NA 12,502 15,653 24,474 27,843 37,947 52,108 38,262 18,901 16,507 9,282
BME Spanish Exchanges NA 2,92,751 2,59,602 4,58,293 6,19,395 10,34,865 17,89,325 13,19,623 8,13,359 8,86,473 7,73,055
Borsa Italiana NA 7,92,460 6,71,427 6,33,350 7,77,839 10,41,826 14,28,831 11,36,457 6,18,078 8,25,600 8,06,698
Budapest SE NA 1,087 1,314 0 5,195 7,285 5,752 4,296 2,474 3,954 1,961
Deutsche Börse NA NA 53,91,624 82,99,527 1,08,15,011 1,86,62,095 3,35,03,131 3,32,63,855 1,93,49,841 2,10,50,635 2,59,79,222
Johannesburg SE NA 93,182 99,482 1,51,288 2,23,204 3,93,983 6,21,443 5,28,710 3,45,722 4,55,538 5,25,055
MICEX NA NA 0 0 0 0 0 0 1,669 29,355 11,807
NASDAQ OMX Nordic Exchange NA 89,261 99,384 0 0 3,30,675 5,52,248 5,00,809 3,49,139 8,47,218 6,30,145
NYSE Euronext (Europe) NA NA 27,90,661 32,04,891 41,38,857 63,46,692 96,64,408 88,85,997 56,88,454 57,81,483 69,63,300
Oslo Børs NA 778 396 0 0 2,904 6,358 10,678 5,687 5,609 4,910
Tel Aviv SE NA - 97 112 215 583 507 787 989 948 1,047
Warsaw SE NA 9,853 13,714 16,959 34,817 59,952 1,23,839 1,27,756 82,684 1,11,043 1,18,696
Wiener Börse NA 2,436 1,076 3,438 6,917 13,555 16,548 19,901 14,838 20,282 20,528
Note: NA indicates Not Available or Not Applicable
Source: Compiled from World Federation of Exchanges and SEBI.
239
As can be seen from the above table, the notional value of
contracts traded in the Stock Index Futures has seen significant fall in
2003 over the notional value in 2002 by almost 58% and then further
marginal fall in 2004. Since, 2005 the notional value of contracts traded in
the Stock Index Futures was continuously growing till 2008 which then
fell down by almost 35% in 2009. However, since then the notional value
of contracts traded in the Stock Index Futures globally has been
continuously growing.
In 2011, even though NSE had good number of contracts traded in
the Stock Index Futures globally, has only contributed 0.66% in terms of
value to the total global notional value of contracts traded in the Stock
Index Futures. However, if we compare the performance of NSE over
2002 in 2011, it is observed that NSE which had meager contribution of
0.01% in 2002 to the total notional value of contracts traded in the Stock
Index Futures has improved to 0.66% in 2011.
5.9.3 Comparison of Single Stock Options in India with Global
Counterparts:
The analysis was carried out of number of contracts traded on
various exchanges globally in the single stock options for a period from
2001 to 2011. For this purpose, the stock exchanges from various regions
across all three time zones were taken into consideration. The analysis of
the Single Stock Options show that the number of contracts traded in the
Single Stock Options on NSE has grown multifold as compared to the
growth observed in the other countries. The data with regard to number of
contracts traded on various exchanges globally in the single stock options
for a period from 2001 to 2011 has been plotted in the table given below:

240
Table 5.18
International Derivatives Market (Stock Options - Number of Contracts Traded)
Exchange 2001 2002 2003 2004 2005 2006 2007 2008 2009 2010 2011
Americas
BM&FBOVESPA NA NA 17,58,89,767 23,37,59,749 26,63,62,704 28,56,99,806 36,73,05,446 35,00,63,629 54,67,90,413 80,22,29,293 83,83,25,494
Bourse de Montréal NA NA 65,92,639 85,90,035 1,00,32,237 1,22,60,403 1,34,22,456 1,56,50,651 1,72,91,023 1,96,65,934 2,57,64,126
Buenos Aires SE NA 63,85,047 4,05,24,942 9,46,86,640 9,23,86,767 4,92,35,173 5,23,88,712 2,51,65,308 2,51,32,711 4,29,93,383 4,21,86,092
Chicago Board Options
Exchange 23,26,93,569 17,31,89,719 17,30,33,965 18,65,62,316 27,56,46,980 39,06,57,577 69,86,56,170 93,38,55,344 91,19,76,695 57,28,54,979 51,61,37,672
International Securities
Exchange 5,93,59,357 14,06,17,648 22,09,88,837 36,07,69,161 44,23,87,776 58,37,49,099 80,65,56,539 98,95,25,443 94,66,93,771 47,06,80,991 45,39,83,701
MexDer NA NA 0 4,290 1,35,931 4,48,120 78 5,85,037 3,45,718 6,18,790 4,46,549
NASDAQ OMX PHLX NA NA 10,34,12,423 12,78,98,363 15,62,22,382 26,53,70,910 39,91,46,840 53,79,54,692 42,62,45,722 54,90,82,761 70,09,91,781
Asia – Pacific
ASX Derivatives
Trading 1,30,52,757 1,59,94,638 1,59,88,740 1,91,64,951 2,15,47,322 2,11,85,136 2,22,26,578 1,70,43,125 1,44,65,066 1,54,55,208 10,88,60,114
Hong Kong Exchanges 40,02,655 37,24,760 42,20,638 56,11,832 87,22,393 1,81,27,353 4,59,82,968 5,46,92,865 4,74,39,896 6,06,56,402 7,33,09,376
Korea Exchange NA NA 8,159 NA NA 1,245 103 21 982 11,602 NA
National Stock
Exchange of India 5,53,304 27,75,524 56,07,990 48,74,958 52,24,485 52,19,827 90,48,495 1,10,67,082 1,40,66,778 2,83,63,426 3,31,72,963
Osaka SE 38,077 21,415 10,240 14,81,415 12,06,987 7,53,937 4,44,149 5,34,954 4,08,752 5,42,427 12,18,762
TAIFEX NA 0 1,98,265 4,10,026 10,18,917 10,89,158 12,99,858 8,72,880 82,40,390 70,272 1,30,558
Tokyo SE Group 3,92,151 3,04,267 2,96,574 1,74,482 2,01,798 1,90,876 1,45,449 88,256 6,62,813 8,34,820 5,96,045
Europe - Africa - Middle East
Athens Exchange NA 0 14,703 27,463 21,729 17,194 1,06,893 1,82,757 67,590 1,05,359 64,238
BME Spanish
Exchanges NA NA 1,13,78,992 82,00,314 1,09,15,197 1,25,88,027 1,35,93,486 1,83,15,249 3,55,27,914 3,76,07,374 2,94,14,590
Borsa Italiana 83,29,533 75,87,199 79,24,078 95,00,498 1,24,39,716 1,60,56,751 2,03,64,847 2,00,56,426 2,04,62,240 2,00,81,028 2,37,70,068
Deutsche Börse NA NA 19,01,83,764 21,16,61,359 25,59,18,793 27,25,43,052 32,20,52,853 34,93,31,404 30,45,53,303 28,33,39,061 27,53,13,232
Johannesburg SE NA NA 68,77,254 68,29,460 28,01,262 57,51,835 1,43,03,446 1,95,91,351 1,56,70,396 1,23,58,594 1,02,10,533
NASDAQ OMX Nordic
Exchange NA NA NA NA 5,71,13,786 6,45,45,443 5,96,53,719 4,27,64,705 2,87,71,003 3,27,21,486 2,98,36,598
NYSE Euronext
(Europe) NA NA 24,46,82,220 30,29,66,312 24,31,66,204 15,55,52,010 18,61,52,718 18,41,05,407 17,08,70,365 19,47,14,042 15,05,62,241
Oslo Børs 23,46,339 17,13,221 20,79,405 29,21,189 33,25,368 57,81,666 48,43,980 39,76,223 25,49,140 35,04,368 38,43,259
Tel Aviv SE NA NA NA NA NA NA NA NA 2,67,614 9,77,947 8,17,532
Wiener Börse 12,39,969 10,90,225 11,54,246 20,77,320 8,16,032 10,53,298 10,36,975 8,48,021 4,74,697 4,69,216 5,60,419
Note: NA indicates Not Available or Not Applicable
Source: Compiled from World Federation of Exchanges and SEBI.
241
It may be seen from the above table that National Stock Exchange has
seen tremendous growth compare to other Stock Exchanges globally in the
number of contracts traded in the stock options.
In terms of number of Stock Options contracts traded on the exchange,
the same has grown considerably from 5,53,304 contracts in 2001 to record
3,31,72,963 number of contracts in the year 2011 which is almost 60 times of the
number of Stock Options contracts recorded in 2001. The Exchange even though
has seen good growth over a period of a decade, the exchange has not found place
in the top 10 exchanges globally in terms of number of stock options contracts
traded.
An analysis was also carried out of the notional value of contracts traded
of Single Stock Options globally in terms of USD. The data analysis with regard
to notional value of contracts traded on various exchanges globally in the single
stock options for a period from 2001-2011 has been presented in the table given
below:

242
Table 5.19
International Derivatives Market (Stock Options - Notional Value of Contracts Traded) US$ million
Exchange 2001 2002 2003 2004 2005 2006 2007 2008 2009 2010 2011
Americas
BM&FBOVESPA NA NA 1,95,305 3,15,117 3,83,331 5,16,234 10,64,212 8,94,314 9,67,655 17,28,620 16,55,129
Bourse de Montréal NA NA 1,79,867 31,513 47,422 74,387 1,01,022 1,02,487 5,870 1,35,192 1,96,363
Buenos Aires SE NA NA NA NA NA NA NA NA NA NA NA
Chicago Board Options Exchange NA 3,88,984 3,91,489 5,60,792 12,64,511 19,60,297 49,24,223 27,17,661 21,87,581 27,00,334 NA
International Securities Exchange NA 3,15,287 4,99,987 7,99,706 NA NA NA NA NA NA NA
MexDer NA NA NA NA 19 75 0 162 70 155 97
NASDAQ OMX PHLX NA NA 26,732 31,560 49,318 89,732 1,62,984 2,25,858 1,54,620 NA NA
Asia – Pacific
ASX Derivatives Trading NA NA NA NA NA NA 4,06,280 2,62,795 1,95,896 2,92,597 3,87,577
Hong Kong Exchanges NA 10,771 11,564 19,220 41,434 78,625 2,25,316 1,81,848 1,25,799 1,62,421 1,90,653
Korea Exchange NA NA 1 NA NA 40 0 0 NA 1 NA
National Stock Exchange of India Ltd NA 16,107 29,272 40,334 39,432 45,446 88,496 45,937 91,666 2,11,029 1,65,462
Osaka SE NA NA 4 NA NA NA NA NA NA NA NA
TAIFEX NA 0 4,094 57 80 32 19 10,753 14,719 147 241
Tokyo SE Group NA NA 18 36 34 NA NA NA NA NA NA
Europe - Africa - Middle East
Athens Exchange NA 0 13 44 58 53 416 680 142 156 77
BME Spanish Exchanges NA 13,356 14,502 13,686 20,750 29,003 37,135 33,367 60,737 61,031 46,139
Borsa Italiana NA 36,332 35,183 45,743 45,743 45,743 45,743 1,12,613 71,873 76,464 69,608
Deutsche Börse NA NA 4,33,318 5,83,699 7,54,052 9,68,794 16,04,417 15,49,711 7,97,965 8,04,689 10,10,518
Johannesburg SE NA NA 225 210 162 305 766 1,368 985 543 405
NASDAQ OMX Nordic Exchange NA NA NA NA 57,179 69,498 73,949 47,908 4,29,283 54,808 54,650
NYSE Euronext (Europe) NA NA 2,54,879 3,63,944 6,23,427 6,02,576 9,69,996 7,71,460 4,85,483 5,25,024 5,33,825
Oslo Børs NA 22 NA NA NA 14,240 8,284 5,595 1,652 2,535 3,506
Tel Aviv SE NA NA NA NA NA NA NA NA 826 4,445 3,950
Wiener Börse NA 3,617 3,066 6,991 4,620 5,411 6,010 4,011 1,262 1,391 1,312
Note: NA indicates Not Available or Not Applicable
Source: Compiled from World Federation of Exchanges and SEBI.
243
As can be seen from the above table, the notional value of
contracts traded in the Stock Options has seen significant gain since 2002
till 2007 of whopping more than 1200%. In 2008, the notional value of
contracts traded in the Stock Options fell by almost 28% over 2007 and
then further marginally fell in 2008. Since, 2009 the notional value of
contracts traded in the Stock options has been continuously growing.
In 2011, NSE did not have very encouraging number of contracts
traded in the Stock Options globally, however it contributed 3.72% in
terms of value to the total global notional value of contracts traded in the
Stock Options. If we compare the performance of NSE over 2002 in 2011,
it is observed that NSE which had contribution of 2.05% in 2002 to the
total notional value of contracts traded in the Stock Options has improved
marginally to 3.72% in 2011.
5.9.4 Comparison of Single Stock Futures in India with Global
Counterparts:
The analysis was carried out of number of contracts traded on
various exchanges globally in the single stock futures for a period from
2001 to 2011. For this purpose, the stock exchanges from various regions
across all three time zones were taken into consideration. The analysis of
the Single Stock Futures show that the number of contracts traded in the
Single Stock Futures on NSE has grown multifold as compared to the
growth observed in the other countries. The data with regard to number of
contracts traded on various exchanges globally in the single stock futures
for a period from 2001 to 2011 has been plotted in the table given below:

244
Table 5.20
International Derivatives Market (Stock Futures - Number of Contracts Traded)
Exchange 2001 2002 2003 2004 2005 2006 2007 2008 2009 2010 2011
Americas
One Chicago - - - - - 77,86,365 78,86,323 40,12,281 26,23,688 47,58,640
MexDer NA - 0 12,591 19,400 3,000 2 2,000 0 12,044 56,869
Asia – Pacific
ASX Derivatives
Trading 0 0 0 0 0 0 7,06,656 9,71,261 7,77,732 5,43,676 34,60,934
Hong Kong
Exchanges 7,756 21,056 18,654 17,274 13,069 1,02,010 3,51,514 2,58,692 2,71,766 2,39,259 4,44,014
Korea Exchange 0 0 0 0 0 0 0 1,15,52,111 3,69,70,994 4,47,11,133 5,99,66,166
National Stock
Exchange of India 4,35,701 85,87,332 1,92,86,017 4,40,51,780 6,88,55,275 10,04,30,505 17,93,24,970 22,57,77,205 16,10,53,345 17,56,74,069 16,08,78,260
TAIFEX 0 0 0 0 0 0 0 0 0 7,24,375 24,71,605
Europe - Africa - Middle East
Athens Exchange 14,068 2,02,730 4,77,464 9,17,778 14,24,516 24,76,487 30,96,557 37,13,266 50,37,065 47,01,785 75,53,643
BME Spanish
Exchanges 87,66,165 1,26,45,186 1,24,92,618 1,20,54,799 1,88,09,689 2,11,20,621 2,12,94,315 4,62,37,747 4,45,86,779 1,96,84,108 2,75,78,789
Borsa Italiana NA 59,853 4,68,083 17,34,256 59,57,674 70,31,974 63,63,954 44,17,700 1,09,56,303 1,27,13,330 97,25,791
Budapest SE 8,79,049 4,52,638 5,53,738 0 7,40,396 9,19,424 15,29,195 11,63,279 11,05,553 10,33,190 8,06,061
Deutsche Börse 0 0 0 0 77,802 3,55,89,089 5,24,54,783 13,02,10,348 11,67,71,129 15,07,48,431 17,42,88,806
Johannesburg SE 8,11,516 22,24,042 45,85,919 89,22,123 2,44,86,773 6,96,63,332 26,50,40,263 43,12,21,851 8,88,66,925 7,87,56,323 4,79,43,645
MICEX 0 0 0 0 0 0 0 0 9,54,685 1,26,34,797 73,96,107
NASDAQ OMX
Nordic Exchange 0 0 0 0 56,58,355 84,59,167 90,13,489 1,58,36,947 67,18,337 24,59,997 40,11,568
NYSE Euronext
(Europe) 70,04,235 1,34,91,781 1,21,58,093 2,95,15,726 7,58,90,097 12,44,68,809 18,10,44,957 29,12,72,890 25,04,41,783
Oslo Børs 0 0 10 0 0 30,88,078 26,32,749 17,64,449 11,72,473 14,66,739 16,50,097
Warsaw SE 60,557 92,097 89,139 87,888 1,72,828 1,12,824 1,14,021 3,31,646 4,65,757 3,75,496 7,37,742
Wiener Börse - - 0 7,862 23,748 12,371 8,760 6,981 6,053 4,895 4,430
Note: NA indicates Not Available or Not Applicable Source: Compiled from World Federation of Exchanges and SEBI.
245
Hence, as we see from the above table, the comparison of the
trading in terms of number of contracts traded across the globe in the
Stock Futures reveals that National Stock Exchange has seen tremendous
growth compared to other Stock Exchanges globally in the number of
contracts traded in the Stock Futures. The National Stock Exchange was
nowhere the top 10 exchanges globally in the year 2001 in terms of
number of contracts traded on the exchange in the Stock Futures. It can be
seen from the above table that the total contracts traded were recorded as
4,35,701 in 2001 and has grown exponentially to record 16,08,78,260
number of contracts in the year 2011 which is almost 369 times of the
number of contracts recorded in 2001. The Exchange was also ranked 5th
globally in the year 2011 in terms of number of stock futures contracts
traded on the exchange. This is very significant achievement for any
bourse to attain considering the equity trading on the exchange is just an
over a decade old phenomenon. The details of the global trading in the
stock futures are tabulated below for the period from 2001 till 2011.
An analysis was also carried out of the notional value of contracts
traded of Single Stock Futures globally in terms of USD. The data
analysis with regard to notional value of contracts traded on various
exchanges globally in the single stock futures for a period from 2001-
2011 has been presented in the table given below:
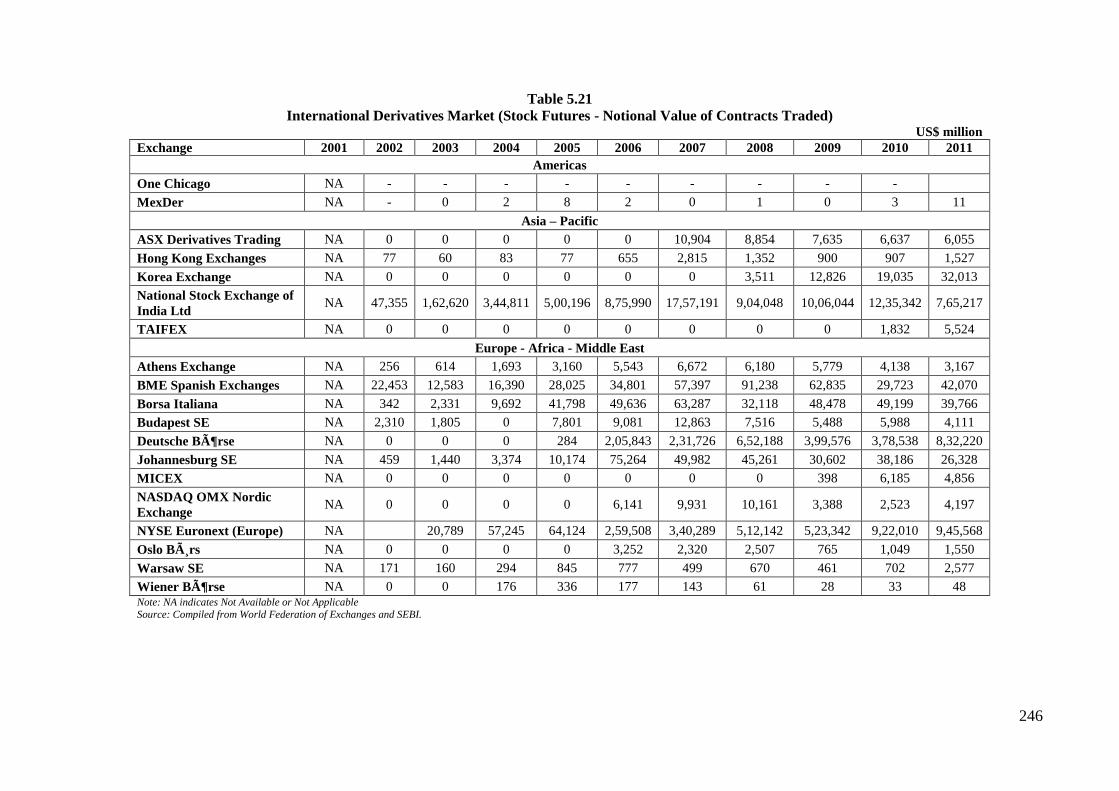
246
Table 5.21
International Derivatives Market (Stock Futures - Notional Value of Contracts Traded) US$ million
Exchange 2001 2002 2003 2004 2005 2006 2007 2008 2009 2010 2011
Americas
One Chicago NA - - - - - - - - -
MexDer NA - 0 2 8 2 0 1 0 3 11
Asia – Pacific
ASX Derivatives Trading NA 0 0 0 0 0 10,904 8,854 7,635 6,637 6,055
Hong Kong Exchanges NA 77 60 83 77 655 2,815 1,352 900 907 1,527
Korea Exchange NA 0 0 0 0 0 0 3,511 12,826 19,035 32,013
National Stock Exchange of
India Ltd NA 47,355 1,62,620 3,44,811 5,00,196 8,75,990 17,57,191 9,04,048 10,06,044 12,35,342 7,65,217
TAIFEX NA 0 0 0 0 0 0 0 0 1,832 5,524
Europe - Africa - Middle East
Athens Exchange NA 256 614 1,693 3,160 5,543 6,672 6,180 5,779 4,138 3,167
BME Spanish Exchanges NA 22,453 12,583 16,390 28,025 34,801 57,397 91,238 62,835 29,723 42,070
Borsa Italiana NA 342 2,331 9,692 41,798 49,636 63,287 32,118 48,478 49,199 39,766
Budapest SE NA 2,310 1,805 0 7,801 9,081 12,863 7,516 5,488 5,988 4,111
Deutsche Börse NA 0 0 0 284 2,05,843 2,31,726 6,52,188 3,99,576 3,78,538 8,32,220
Johannesburg SE NA 459 1,440 3,374 10,174 75,264 49,982 45,261 30,602 38,186 26,328
MICEX NA 0 0 0 0 0 0 0 398 6,185 4,856
NASDAQ OMX Nordic
Exchange NA 0 0 0 0 6,141 9,931 10,161 3,388 2,523 4,197
NYSE Euronext (Europe) NA
20,789 57,245 64,124 2,59,508 3,40,289 5,12,142 5,23,342 9,22,010 9,45,568
Oslo Børs NA 0 0 0 0 3,252 2,320 2,507 765 1,049 1,550
Warsaw SE NA 171 160 294 845 777 499 670 461 702 2,577
Wiener Börse NA 0 0 176 336 177 143 61 28 33 48 Note: NA indicates Not Available or Not Applicable
Source: Compiled from World Federation of Exchanges and SEBI.

247
As can be seen from the above table, the notional value of
contracts traded in the Stock Futures has seen significant growth during
the period from 2002 till 2011 of almost more than 3650%. Barring two
years, viz. 2008 and 2009, the Stock Futures notional value of contracts
has been only continuously growing.
In 2011, NSE had good number of contracts traded in the Stock
Index Futures globally and also has contributed almost 27.71% in terms
of value to the total global notional value of contracts traded in the Stock
Index Futures as per WFE data. However, if we compare the performance
of NSE over 2002 in 2011, it is observed that NSE’s market share has
fallen significantly which had contribution of 64.50% in 2002 to the total
notional value of contracts traded in the Stock Index Futures of 27.71% in
2011.
To sum up, Indian equity derivatives markets have grown in last
decade in leaps and bounds. It is now going globetrotting with the stock
indexes getting listed on other exchanges and also attracting the foreign
investments in India by providing them another tool in the form of equity
derivatives to hedge their positions and provide the much required
liquidity to support their investments and exits with the market which can
facilitate the same at the much lesser cost and impact than the actual
underlying equity cash market. Even though the Indian stock exchanges,
especially NSE, has been featuring in the top 10 exchanges globally in
terms of Stock Index Options, Stock Index Futures and Single Stock
Futures, the Exchanges are still to make inroads in the top 10 exchanges
in terms of trading in Single Stock Options in terms of number of
contracts traded globally.
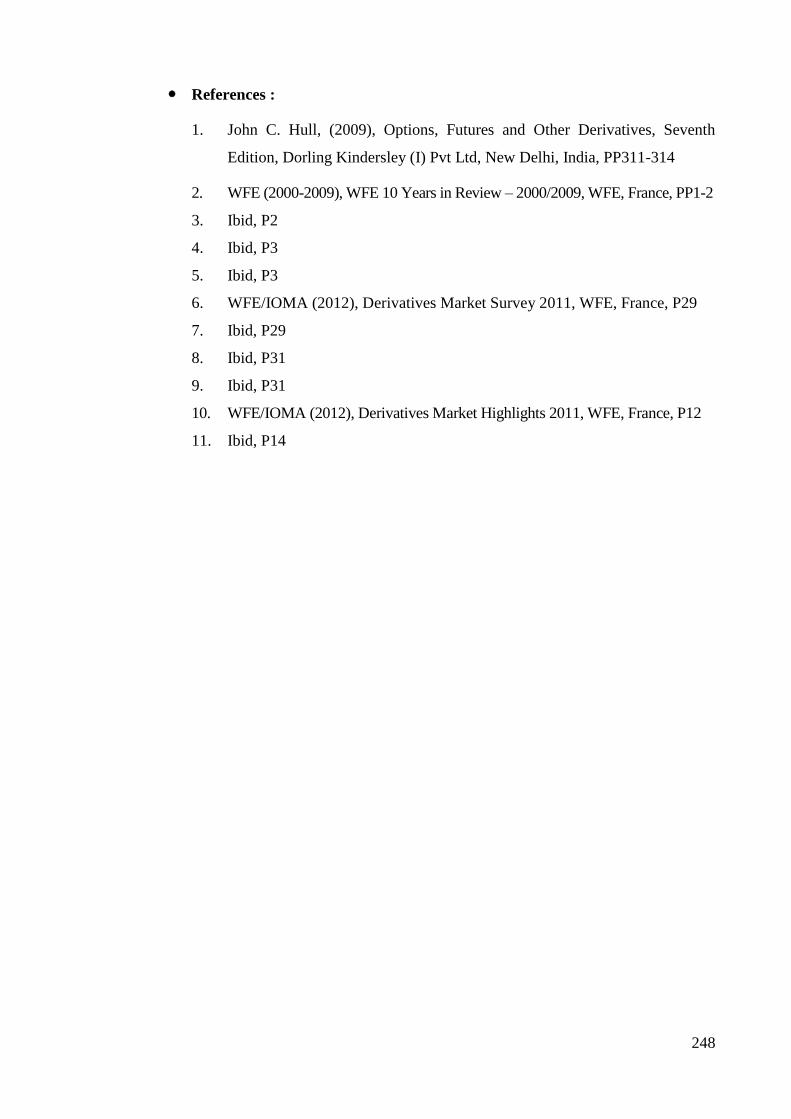
248
References :
1. John C. Hull, (2009), Options, Futures and Other Derivatives, Seventh
Edition, Dorling Kindersley (I) Pvt Ltd, New Delhi, India, PP311-314
2. WFE (2000-2009), WFE 10 Years in Review – 2000/2009, WFE, France, PP1-2
3. Ibid, P2
4. Ibid, P3
5. Ibid, P3
6. WFE/IOMA (2012), Derivatives Market Survey 2011, WFE, France, P29
7. Ibid, P29
8. Ibid, P31
9. Ibid, P31
10. WFE/IOMA (2012), Derivatives Market Highlights 2011, WFE, France, P12
11. Ibid, P14