comparing image processing pipelines for brain mri data
TRANSCRIPT

Comparing image processing pipelines for brain MRI data and examining default mode
and executive control network white matter correlates of executive function in multiple
sclerosis
by
Salina Sultana Pirzada
A Thesis submitted to the Faculty of Graduate Studies of
The University of Manitoba
In partial fulfillment of the requirements of the degree of
MASTER OF SCIENCE
Department of Physiology and Pathophysiology
Max Rady College of Medicine
Rady Faculty of Health Sciences
University of Manitoba
Winnipeg, MB
Copyright ã 2019 by Salina Sultana Pirzada

ii
Abstract
Background: Multiple Sclerosis is a neurodegenerative disease characterized by demyelinated
lesions and axonal loss in white matter regions of the brain. Spatially normalizing brain MRI
data to a template is commonly performed to better facilitate comparisons between individuals or
groups. Due to the presence of MS-related brain pathologies, spatial normalization methods can
be compromised. This study therefore systematically compared five commonly used spatial
normalizations for brain MRI including linear (affine), nonlinear MRIStudio (LDDMM), FSL
(FNIRT), ANTs (SyN) and SPM (CAT12) algorithms to evaluate their performance in the
presence of MS-related pathologies. After identifying an optimal spatial normalization method,
this study then used pre-existing knowledge on the relationships between cognitive performance
and resting-state functional connectivity in distributed large-scale brain networks to look at
cognition, executive function and white matter structural connectivity. This would build on the
previous findings in this study by using the optimal method to acquire FA and MD maps to use
in conjunction with recently released functionally-defined white matter atlases to investigate
relationships between executive function and microstructure throughout the default mode
network and executive control network white matter.
Methods: Using a cohort of 20 participants with MS from an ongoing cohort study and 1 healthy
control participant, we lesion-filled each participant’s T1-weighted brain image to the Montreal
Neurological Institute template using 5 normalization approaches for a real and simulated lesion
dataset (total of 400 spatial normalizations). Inter-subject variability was quantified using both
mutual information and coefficient of variation and normalization lesion volumes were evaluated
using paired sample t-tests. Using SPM CAT12, we used diffusion tensor imaging metrics, FA
and MD from 103 participants to extract values from DMN and ECN regions via the UManitoba-
iii
Functionally-Defined Human White Matter Atlases. Executive function was assessed using the
Delis-Kaplan Executive Function System Color-word Interference Test. One-tailed Spearman
correlations assessed relations between DMN and ECN white matter microstructure and
individual differences in executive function correcting for age, sex and WTAR scores.
Results: SPM CAT12 with lesion filling is the most robust method for spatially normalizing MS
brain imaging data, as demonstrated in Coefficient of Variation maps, that make clear that SPM
CAT12 resulted in the lowest average COV value (SPM: 9.6 and 21.4 for FSL). Using SPM
CAT12, this study found executive function scores to be significantly correlated with individual
differences in white matter MD measurements obtained from both the DMN (rho = 0.194; 96%
CI = 0.0031 to 0.0347; p = 0.027) and the ECN (rho= 0.192; 95% = 0.029 to 0.345; p= 0.029),
but not those obtained from global white matter (rho = 0.106; 95% CI = -0.059 to 0.0266; p =
0.147) after correcting for age, sex and WTAR.
Conclusion: Together, this thesis worked to: 1) compare spatial normalization methods on brain
MRI data in the presence of MS lesions using real and simulated data to identify an optimal
approach for comparing quantitative structural imaging metrics across participants, and 2) use
this robust spatial normalization method to investigate the relationships between EF and
microstructure throughout the DMN and ECN WM using recently released functionally-defined
WM atlases. Together, these findings have expanded our understanding of best-practices in MRI
data analysis and the variability in cognitive functioning among persons with MS.

iv
Acknowledgements I would like to thank many people who were integral in helping me achieve this degree.
Dr. Chase Figley: I am deeply indebted to you for the time and trust you put in me. You
were not only my P.I., but my mentor, role model and friend. At pivotal moments during this
journey, you shared with me your wisdom - for which I am forever grateful. Your ability to teach
complex concepts in an enjoyable, friendly and exciting way is what made me discover my
passion for neuroscience, and specifically neuroimaging. I was very fortunate to have trained
under you, and will carry forward everything you have taught me. Your generosity, kindness and
encouragement will stay with me forever – as this end is only the beginning of a new chapter.
Dr. Md Nasir Uddin: thank you for teaching me a lot of what I know about MR imaging.
From teaching me the basics of MRI physics till more advanced topics as time went by; your
continued patience and encouragement is something I am truly grateful for.
Teresa Figley: thank you for always helping me stay grounded and balanced when major
deadlines approached. Your constant reminder to reflect on what research really is, and why I am
pursuing it, helped shape me into a balanced neuroscientist.
My committee members – Dr. Kornelsen and Dr. Marrie: Thank you for guiding,
advising and always encouraging me to be my best self throughout my journey. Without your
continuous support and mentorship, I would not have achieved this degree.
To my neuroimaging pal Tiffany: You were the most supportive friend I could have
asked for, and someone that I have made some of my most cherished memories in graduate
school with. Thanks for being such a great friend and for cheering me on in every endeavor.

v
To my dearest husband Shan Pirzada; words fail to express my gratitude for your love
and support on this journey. You are my rock – my greatest motivation and strength. I thank and
love you with every nerve in my body, and cannot wait to see what adventures our life together
has in store for us. Thank you for your love, inspiration, encouragement and limitless motivation.
I would like to thank my parents, Masood and Alia Khan: thank you for giving me strong
roots that kept me grounded and strong wings that allowed me to soar at will. Thank you for
every sacrifice you made in life for the betterment of our family. I am forever indebted to you for
the love and support you have shown me, and hope to continue to make you proud.
Thank you to my siblings – Sophia and Zeshan. The bond I share with you remains
among my greatest achievements. You both have been there for me through thick and thin, and I
cannot thank you enough. You are my role models and I hope to be half the person you both are.
Thank you to my new parents – Kokeb and Munir Pirzada. The unconditional love and
support I have received since the day I moved to Winnipeg cannot be put into words. You both
are nothing short of my parents, and I love you both with all my heart.
To my new siblings, Yelman, Tamana, Hasan, Hafsa and Iman – despite being miles
apart at times, we continue to be there for one another and support each other’s dreams and
ambitions, and I thank you for that. I am grateful for the closeness we share, as I truly believe a
strong family unit is the foundation to true happiness and success.

vi
Contributions of Authors on Manuscript
Drs. Chase Figley and Md Nasir Uddin as a part of the CCOMS Study helped acquire this data at
the National Research Council of Canada in Winnipeg, Manitoba. Drs. Chase Figley, Jennifer
Kornelsen and Dr. Ruth Ann Marrie contributed to the revision of the submitted manuscript.
Salina S. Pirzada preprocessed and analyzed the data, wrote the manuscript, and created the
tables and figures (figures with the assistance of Teresa Figley and Dr. Md Nasir Uddin).
The Investigators of the Comorbidity, Cognition and Multiple Sclerosis (CCOMS) Study Group
include:
Ruth Ann Marrie, MD, PhD (University of Manitoba, Principal Investigator);
John D. Fisk, PhD (Dalhousie University, Co-Principal Investigator);
James Bolton, MD (University of Manitoba, Co-Investigator);
Chase R. Figley, PhD (University of Manitoba, Co-Investigator);
Lesley Graff, PhD (University of Manitoba, Co-Investigator);
Jennifer Kornelsen, PhD (University of Manitoba, Co-Investigator);
James J. Marriott, MD (University of Manitoba, Co-Investigator);
Erin Mazerolle, PhD (University of Calgary, Co-Investigator);
Ronak Patel, PhD (University of Manitoba, Co-Investigator);
Teresa D. Figley, MSc (University of Manitoba, Research Coordinator);
Carl A. Helmick, BCS (Dalhousie University, MRI Data Analyst);
Md Nasir Uddin, PhD (University of Manitoba, MRI Physicist and Data Analyst);
Charles N. Bernstein, MD (University of Manitoba, Collaborator)

vii
Table of Contents
ABSTRACT...........................................................................................................................................................................IIACKNOWLEDGEMENTS.................................................................................................................................................IVCONTRIBUTIONSOFAUTHORSONMANUSCRIPT.................................................................................................VITABLEOFCONTENTS....................................................................................................................................................VIILISTOFFIGURES..............................................................................................................................................................IXLISTOFTABLES.................................................................................................................................................................XLISTOFABBREVIATIONS...............................................................................................................................................XI
INTRODUCTION...................................................................................................................................11.1 ETIOLOGYANDPREVALENCEOFMS..................................................................................................................................21.2 PHYSIOLOGYANDPATHOPHYSIOLOGYOFMS...................................................................................................................51.2.1 AxonalInjuryandLoss................................................................................................................................................................5
1.3 CLINICALPRESENTATIONOFMS.......................................................................................................................................61.3.1 TypesofMS.......................................................................................................................................................................................81.3.2 TheCognitiveReserveHypothesis.........................................................................................................................................9
1.4 MSDIAGNOSIS:IMAGINGANDCLINICALASSESSMENTS..................................................................................................91.4.1 Imaging:MagneticResonanceImaging(MRI)...............................................................................................................91.4.2 DiffusionTensorImaging.......................................................................................................................................................121.4.2.1 ApplicationofDTIMeasurementswithMS.............................................................................................................14
1.5 CLINICALASSESSMENTS....................................................................................................................................................141.5.1 Cognition.........................................................................................................................................................................................161.5.2 ExecutiveFunction.....................................................................................................................................................................18
HYPOTHESESANDOBJECTIVES....................................................................................................212.1 PROBLEMSTATEMENT......................................................................................................................................................222.2 RATIONALE.........................................................................................................................................................................222.3 AIMS....................................................................................................................................................................................232.4 HYPOTHESES......................................................................................................................................................................24
COMPARINGSPATIALNORMALIZATIONALGORITHMSFORBRAINMRIDATAWITHMULTIPLESCLEROSISPATHOLOGIES.......................................................................................................................253.1 ABSTRACT..........................................................................................................................................................................263.2 INTRODUCTION..................................................................................................................................................................283.3 MATERIALSANDMETHODS..............................................................................................................................................303.3.1 DataAcquisition..........................................................................................................................................................................303.3.2 ImageProcessing........................................................................................................................................................................303.3.2.1 SkullStripping....................................................................................................................................................................313.3.2.2 LesionFilling.......................................................................................................................................................................313.3.2.3 SpatialNormalization......................................................................................................................................................32
3.4 METHODOLOGICALCOMPARISONS...................................................................................................................................343.4.1 ValidationandLesion-SpecificAnalysesUsingSimulatedBrainLesionData............................................363.4.2 VisualizingDifferencesattheSingle-SubjectLevel...................................................................................................37
3.5 RESULTS.............................................................................................................................................................................373.5.1 NormalizationAccuracy.........................................................................................................................................................383.5.2 NormalizedLesionVolumes..................................................................................................................................................433.5.3 Single-SubjectAnalyses............................................................................................................................................................45
3.6 DISCUSSION........................................................................................................................................................................45

viii
3.7 STUDYLIMITATIONS..........................................................................................................................................................473.8 CONCLUSIONS.....................................................................................................................................................................493.9 ACKNOWLEDGEMENTS......................................................................................................................................................493.10 FIGURECAPTIONS..............................................................................................................................................................50
NETWORK-BASEDMEASURESOFWHITEMATTERMICROSTRUCTUREREFLECTINDIVIDUALDIFFERENCESINEXECUTIVEFUNCTIONAMONGPERSONSWITHMS.....................................524.1 ABSTRACT..........................................................................................................................................................................534.2 INTRODUCTION:.................................................................................................................................................................554.3 METHODS...........................................................................................................................................................................574.3.1 StudyParticipants......................................................................................................................................................................574.3.2 Clinicalassessments...................................................................................................................................................................584.3.2.1 ExecutiveFunctionSystem(DKEFS)Color-WordInterferenceTest(CWIT).............................................584.3.2.2 WechslerTestofAdultReading(WTAR).................................................................................................................59
4.4 FUNCTIONALLY-DEFINEDWHITEMATTERATLASES....................................................................................................604.5 MAGNETICRESONANCEIMAGING(MRI)........................................................................................................................604.5.1 DataAcquisition..........................................................................................................................................................................604.5.2 T1wAnatomicalScans.............................................................................................................................................................604.5.3 FluidAttenuatedInversionRecovery(FLAIR)Scans................................................................................................614.5.4 HighAngularResolutionDiffusionImaging(HARDI)Scans................................................................................614.5.5 DataProcessing...........................................................................................................................................................................624.5.6 RegionofInterestAnalyses....................................................................................................................................................62
4.6 QUALITYASSURANCEANDOUTLIERREJECTION............................................................................................................634.7 STATISTICALANALYSES....................................................................................................................................................634.8 POST-HOCANALYSIS.........................................................................................................................................................644.9 RESULTS.............................................................................................................................................................................644.10 DISCUSSION........................................................................................................................................................................704.11 STUDYLIMITATIONS..........................................................................................................................................................754.12 CONCLUSIONS.....................................................................................................................................................................764.13 ACKNOWLEDGMENTS........................................................................................................................................................774.14 FIGURECAPTIONS..............................................................................................................................................................78
SUMMARY...........................................................................................................................................805.1 DISCUSSION........................................................................................................................................................................815.2 FUTUREDIRECTIONS.........................................................................................................................................................825.3 CONCLUSIONS.....................................................................................................................................................................84
REFERENCES:...................................................................................................................................................................85

ix
List of Figures
Chapter 3 Figures:
Figure 3.1: Comprehensive image-processing pipeline for warping the T1w MRI images and
lesion masks from each participant to the Montreal Neurological Institute (MNI) brain template.
Figure 3.2: T1w images (without lesion-filling), along with the corresponding spatially
normalized images using the 5 normalization algorithms for three randomly-selected MS
participants chosen to highlight how heterogeneous white matter pathology.
Figure 3.3a-d: Box-Whisker plots of the mutual information (MI) between normalized images
before and after lesion-filling.
Figure 3.4a-b: Between-participant coefficient of variation (COV) maps based on each
normalization approach before and after lesion-filling: a) participant data and b) simulated data.
Figure 3.5a-d: Box-Whisker plots of lesion volumes based on each normalization approach
before and after lesion-filling: a) participant data and b) simulated data.
Figure S1: ROI volume estimates of two deep GM structures (caudate and thalamus) and two
deep WM structures (genu and splenium of the corpus callosum) based on each normalization
approach for a single MS participant.
Chapter 4 Figures:
Figure 4.1: Straight correlations indicating a positive correlation between DKEFS 4 and MD
values in both the DMN and ECN after correcting for age, sex and WTAR scores.

x
List of Tables
Chapter 4 Tables:
Table 4.1: Participant characteristics.
Table 4.2: Results obtained from performing One-tailed Spearman Correlations after partialling
out the effects of age, sex and WTAR scores. These results indicate significant partial
correlations between executive function and MD values in the DMN and ECN.
Table 4.3 a-c: Conventional Spearman Correlations (Two-Tailed) to determine whether any pair
of continuous variables were correlated. These results suggest statistically significant
relationships between MD values and the two covariates – DKEFS 4 and Age in both networks.
Table 4.4 a-c: Mann-Whitney Tests (Two-Tailed) to determine whether any of the continuous
variables showed categorical sex differences. As shown, there were no statistically significant
effects overall and therefore a lack of a sex effect generally.

xi
List of Abbreviations
MRI: Magnetic Resonance Imaging MS: Multiple Sclerosis 3D: Three-dimensional T1w: T1-weighted T2w: T2-weighted FLAIR: Fluid Attenuated Inversion Recovery T2-FLAIR: T2-Weighted Fluid Attenuated Inversion Recovery MPRAGE: Magnetization prepared rapid acquisition gradient echo HARDI: High Angular Resolution Diffusion Imaging TR: Repetition Time TE: Echo Time TI: Inversion Time BW: Band Width ESP: Echo Spacing TA: Acquisition Time FOV: Field of View MB-EPI: Multi-Band Echo Planar Imaging AT: Anterior-Posterior PA: Posterior-Anterior ACID: Artifact Correction in Diffusion MRI HySCo: Hyperelastic Susceptibility Artifact Correction COVIPER: Correction for Vibrations in Diffusion Imaging using Phase-Encoding Reversal

xii
DTI: Diffusion tensor imaging FA: Fractional Anisotropy MD: Mean Diffusivity MWI: Myelin Water Imaging Q-TIPS: Quantitative Tract Integrity Profiles MTI: Magnetization transfer imaging VBM: Voxel-based morphometry WM: White matter NAWM: Normal appearing white matter ROI: Region of Interest GM: Grey Matter M: Net Magnetization Vector DARTEL: Diffeomorphic Anatomical Registration Through Exponentiated Lie Algebra BET: Brain Extraction Tool LST: Lesion Segmentation Toolbox LGA: lesion growth algorithm DIS: Dissemination in Space DIT: Dissemination in Time Non-LF: Non-lesion-filled LF: Lesion-filled CSF: Cerebrospinal Fluid NMI: Normalized Mutual Information MNI: Montreal Neurological Institute

xiii
MRIStudio (LDDMM): (Large deformation diffeomorphic metric mapping) FSL (FLIRT): (Linear Image Registration Tool) FSL (FNIRT): (Nonlinear Image Registration Tool) ANTs (SyN): Advanced Normalization Tools (Symmetric Normalization algorithm) SPM (CAT12): Statistical Parametric Mapping (Computational Anatomy Toolbox) SC: Structural Connectivity FC: Functional Connectivity JHU: Johns Hopkins University HLA: Human Leukocyte Antigen CTLA: Cytoxic T Lymphocyte Antigen ICAM: Intracellular Adhesion Molecule MSFC: Multiple Sclerosis Functional Composite EDSS: Expanded Disability Status Scale DKEFS: Delis-Kaplan Executive Function System DMN: Default Mode Network dDMN: Dorsal Default Mode Network vDMN: Ventral Default Mode Network ECN: Executive Control Network 1ECN: Left Executive Control Network rECN: Right Executive Control Network DKEFS CWIT: Delis-Kaplan Executive Function System Color-Word Interference Test DKEFS TMT: Delis-Kaplan Executive Function System Trail Making Test CN: Color Naming

xiv
WR: Word Reading EF: Executive Function WTAR: Wechsler Test of Adult Reading CVLT II: California Verbal Learning Test PASAT: Paced Auditory Serial Addition Test MET: Multiple Errands Test WCST: Wisconsin Card Sorting Test B-REB: Biomedical Research Ethics Board COV: Coefficient of variation DSC: Dice similarity coefficient MI: Mutual information CCOMS: Comorbidity, Cognition and Multiple Sclerosis HSCF: The Winnipeg Health Sciences Centre Foundation NSERC: Natural Sciences and Engineering Research Council of Canada

Introduction

2
1.1 Etiology and Prevalence of MS
Multiple sclerosis (MS) is a chronic neurodegenerative disease of the central nervous
system (CNS)1. It is the most common disabling neurological disease in young adults, with a
typical onset between 20 to 40 years of age, affecting twice as many females as males2,3. In terms
of prevalence, currently MS affects over 2.5 million people worldwide with roughly 290 cases
per 100,000 Canadians, with the prairie provinces – particularly Manitoba having amongst the
highest rates of MS in the world3,4. Although there is no known cause for MS, the disease itself
has a complex etiology, with both genetic and environmental components contributing to the
onset of the disease, with the risks being associated with exposure to environmental factors in
genetically susceptible individuals3. In fact, studies suggest that Caucasians are the most
affected, with a much lower prevalence among Japanese, Chinese, American Indians and
individuals of African descent3. Because of this, many studies have suggested that environmental
conditions in regions with higher latitudes in both hemispheres may foster environmental
conditions optimal for developing MS.
Much of the literature regarding prevalence, is tied to migration and MS. These migration
studies reported that individuals growing up in high-prevalence areas remain at a higher risk for
developing MS, even after moving to a low-risk region. Interestingly however, migration from a
low-risk to a high-risk region during childhood seems to increase the risk of developing MS1.
Considerable evidence has also led to the popular belief that these high-risk areas which happen
to be situated in higher latitude regions worldwide, generate a lower duration and intensity of
sunlight, creating environments that trigger low vitamin D levels - which is considered by some
to be an environmental risk factor for MS. In fact, one record-linkage study found skin cancer
mortality rates to be 50% less among MS patients, potentially supporting the correlation between

3
reduced sunlight exposure and MS5. This then begs the question of what the effects of other
environmental risk factors have on those who are genetically susceptible? One such study looked
at the association between sun exposure in childhood and MS risk among 81 monozygotic twins,
and found that twins with MS systematically reported lower levels of sun exposure, therefore
supporting the possibility that reduced early sun exposure prompts the onset of MS6.
Moreover, one putative factor with a strong biologic plausibility is obesity, as it has been
shown to increase the risk of developing MS. In fact, some studies have found obesity, coupled
with an early age of sexual maturity to be associated with the onset of MS - with the pediatric
population of MS in particular being affected the most. One study in particular comprised of
1571 cases and 3371 controls reported a two-fold increase in the risk for MS patients with a BMI
exceeding 27 kg/m2. This pattern of association was the same for both men and women7.
Interestingly, in relation to age, high body mass index during adolescence or early adulthood has
in fact been associated with an increased risk of developing MS later in life. Some studies have
also suggested that obesity and comorbid cardiovascular diseases are associated with increased
MS susceptibility and worse disease progression8. In fact, one study reported that lifestyle-based
behavior linked to higher cardiovascular disease was associated with greater central brain
atrophy over a 5-year period in MS patients9. Another risk factor that influences the disease
course of MS is cigarette smoking. This risk factor has been supported extensively in literature,
such that one of many studies found smoking less than 5 cigarettes per day for many years
implied a two-fold increase risk for developing MS. This same study also found that unlike many
other risk factors such as vitamin D deficiency, the Epstein-Barr virus (EBV) infection and
obesity to list a few, all of which seem to influence risk during a specific time point in one’s life
- in particular during adolescence or early adulthood, smoking was not influenced by age, but by

4
both the duration and intensity of smoking10. Other studies with a focus on diet, associated their
findings with the gut microbiome, whereby there has been evidence that suggests that the gut
microbiota influences the course of MS, such that MS patients exhibit gut dysbiosis. The existing
literature on the gut microbiome is often derived from experimental evidence using
encephalomyelitis (EAE) mouse models of MS, where it has been reported that people with MS
have an altered microbiome, increased intestinal permeability and changes in bile acid
metabolism compared to healthy controls. Together, this alters peripheral and CNS immune
homeostasis11. Epidemiological evidence has also been presented in the literature regarding
exposure to the EBV –an established risk factor for MS, that essentially activates human
endogenous retroviruses12. Interestingly, one recent study reported maternal EBV IgV antibody
levels to be associated with risk of MS in the offspring13. That said, this study, among many
others supports the role of EBV as a risk factor for MS.
Several studies suggest that the risk of developing MS is primarily established in the first
decade of one’s life, from which the authors inferred that environmental factors act early in life
in genetically susceptible individuals, which together triggers the onset of the disease3. This is
supported by the fact that 10% of MS patients experience their initial demyelinating event during
childhood or adolescence14. Therefore, the prevailing view is that these environmental risk
factors alone do not contribute to MS, but the time in which individuals who are genetically
susceptible are exposed, is what prompts the onset of the disease3.
To quantify genetic risk factors of MS, six twin surveys were conducted in which more
than 2000 MS twins were studied. The findings of these surveys suggested that there was a
genetic susceptibility with a concordance rate of 25-30% and index of heritability of 0.25-0.76
found in monozygotic twins, ultimately alluding to the idea that there is a much higher

5
monozygotic than dizygotic twin concordance rate15. Apart from twins however, another study
found that about 20% of MS patients had at least one relative who had been affected with MS16.
Although the precise mode of inheritance remains unclear, the disease is understood to neither be
Mendelian nor mitochondrial17. Furthermore, to date, >200 independent loci across the genome
have been associated with MS risk18. In fact, of the many genes, the human leukocyte antigen
(HLA) classes I and II on chromosome 6, T cell receptor b, cytotoxic T lymphocyte antigen
(CTLA)-4, intercellular adhesion molecule (ICAM)-1, and SH2D2A are a few among many to
be linked to the onset of MS16. Interestingly, many of the risk alleles for MS are shared by
several other autoimmune disorders including type 1 diabetes mellitus, rheumatoid arthritis,
systemic lupus erythematosus and Crohn’s disease, which lends further support to the
autoimmune component of MS being an inherited risk18. Nonetheless, despite the identification
of >200 independent loci across the genome, these seem to only represent a small fraction of the
total phenotypic variability in MS, therefore suggesting that it is environmental factors coupled
with genetic factors that increases the risks of developing MS18. That said, since there is not one
specific gene nor one specific environmental factor causing MS; to date, the disease is believed
to be multifactorial in nature, involving a combination of both environmental and genetic
components.
1.2 Physiology and Pathophysiology of MS
1.2.1 Axonal Injury and Loss
The pathological hallmark of MS are white matter (WM) plaques. These plaques are
circumscribed areas of demyelination17. Although for many years, MS was considered to be
exclusively a WM disorder, mounting evidence now suggests that there is also cortical gray
matter (GM) degeneration as well as damage to normal appearing WM (NAWM)19,20. Though

6
the concept of cortical and deep GM lesions in particular, were first introduced in the very early
literature of MS pathology by Charcot in 1868, it only gained widespread interest in the last three
decades, ultimately leading to the classification of MS as a neurodegenerative disease21,22. The
idea of MS being a neurodegenerative disease, is based on the extent of axonal loss and
neurodegeneration that triggers irreversible disability in the beginning stages of MS. Although
demyelination is the hallmark pathology of MS, irreversible axonal loss – thought to be a
consequence of demyelination has also been observed. Axonal injury became a topic of popular
interest, largely due to the irreversible effects it has23. Based on this evidence, one study found
that although the relapsing-remitting functional impairments were caused by inflammation and
demyelination, the accumulation of an irreversible neurological deficit was caused by axonal
destruction and loss23. Although demyelination can in part, be repaired through endogenous
remyelination, there has been no evidence to date of axon regeneration. That said - even
remyelination is not always successful. Though in the earlier phases of MS it could in part be,
the extent to which repair can take place is limited by oligodendrocyte survival within plaques,
oligodendrocyte precursor cells, not having enough cytokines, growth factors and of course
limitations of the underlying demyelination process of MS itself17. Conversely, irreversible
axonal loss is believed to contribute to the continually worsening neurological deficits that take
place in primary and secondary progressive forms of the disease, during which clinical
progression corresponds to brain atrophy24. In fact, one study found axonal injury to be
independent of demyelination25.
1.3 Clinical Presentation of MS
As discussed earlier in this thesis, disease activity in MS is strongly correlated with the
formation of new lesions. These lesions seem to form in various locations throughout the CNS,
7
rendering the clinical course of MS to follow diverse patterns over time. This precise
heterogeneity, as seen in both physical and cognitive outcomes is indicative of the distribution of
demyelination within the CNS, and is what results in a diverse range of neurological symptoms
attributed to a patient’s WM lesions – disseminated in time and space3,26,27. A patient typically
initially presents with clinically isolated syndrome (CIS) as a first event that may indicate MS.
CIS is characterized by either focal or multifocal regions in the CNS, commonly found in the
optic nerve, brainstem or spinal cord. This is typically a patient’s first episode of inflammation20.
These CIS patients often present with reversible episodes of neurological deficits that last for
days to weeks1,28. From there, some CIS patients may or may not ultimately lead to a diagnosis
of MS. Typically, those who do begin to develop some neurological deficits, which therefore
increase their chances of getting diagnosed with relapsing-remitting MS (RRMS), at which point
they will continue to have relapses, with partial or complete recovery. Most of these individuals
will ultimately transition to a secondary progressive course in which there is gradual
accumulation of disability independent of relapses1. Characteristically, patients with MS who
present with a more chronic disease progression who go on to develop MS, often begin to
present with multifocal lesions within the CNS as seen on MR images, particularly in the
periventricular WM, brainstem, cerebellum and spinal cord WM - all of which support a
diagnosis for MS29. These multifocal lesions then trigger symptoms such as motor weakness,
optic neuritis, discoordination, diplopia, numbness, fatigue, depression, reduction in information
processing speed and executive functions, and long-term memory deficits to list a few30. Taken
together, focal WM lesions, WM atrophy and widespread changes in the microstructure of
NAWM are the hallmark pathologies of MS31. Based on these symptoms, it is clear MS has a
substantial impact on one’s daily functioning.

8
1.3.1 Types of MS
The heterogeneous nature of MS, manifested through both physical and cognitive
deficits, then created the need to generate a classification system, where the disease could be
categorized into three ‘types’ of MS, namely RRMS, primary-progressive MS (PPMS), and
secondary-progressive MS (SPMS) – designed to standardize, facilitate communication, enhance
prognostication, and limit heterogeneity in clinical trial populations32. The most common form of
MS, and the type that most patients typically present with in the earlier course of the disease is
RRMS, which affects about 85% of patients17. About 10-15% of patients with RRMS experience
a relatively mild disease course, and can remain clinically stable for many decades28. However,
the remainder of those patients typically experience sensory symptoms, Lhermitte’s sign (axial
or limb paresthesia with neck flexion), limb weakness, gait ataxia, brain stem symptoms fatigue
and optic neuritis to list a few – all of which are a result of the demyelination in the CNS17. This
form of MS is characterized by acute attacks of new or recurrent neurological signs followed by
either a complete or partial recovery. RRMS is also separated by periods of stability with no
clinical disease activity. Moreover, roughly 10-15% of patients experience PPMS, which is
characterized by a gradual progression of neurological disability. The term ‘relapse’ is
considered to be the clinical expression of acute focal or multifocal inflammatory demyelination,
disseminated within the CNS33. Typically, it is quite common for RRMS patients to gradually
evolve into SPMS, in which neurological disability accumulates progressively between or
without additional relapses3,17 Irrespective of the MS type, the two main clinical phenomena of
MS are relapses and progression33. Likewise, to further build on the idea that every MS patient
experiences MS differently, and that not every patient fits into these three types of MS, many
studies have sought to understand the mechanisms contributing to MS, to uncover what is
causing these individual differences and why some individuals with MS seem to live a relatively

9
normal life, despite having MS - while others become entirely debilitated. This discrepancy
between disease burden and cognitive outcome, where some patients have better preserved
cognition than others continues to remain a challenge in the field22.
1.3.2 The Cognitive Reserve Hypothesis
One study investigated how learning and memory impairments being two prevalent
deficits in MS, seem to be weakly associated with MS disease and severity/brain atrophy34. From
this, the cognitive reserve hypothesis was born. This hypothesis states that both genetic factors
(measured through means of maximum lifetime brain growth and quantified by intracranial
volume), and environmental factors (measured through various life experiences and quantified
through intellect, education, vocabulary and occupational activities) together, contribute to a
‘reserve’ against disease-related cognitive decline. Together, from this, several studies inferred
that higher lifetime intellectual enrichment lessens the negative impact of MS disease severity
(i.e. brain atrophy) on learning and memory and ultimately explains why there is a disconnect
between brain disease and cognitive status in neurologic populations like that of MS - which
could explain why some people are not as affected by their MS as others. Several other studies
did in fact support this hypothesis35,36,37. Together, this could pave the way for potential
preventative measures used for those more susceptible to developing MS34,36,37,38. Thus, with no
known cause or cure, this debilitating disease renders it difficult for individuals to function in all
aspects of their lives, making MS a life altering disease - and fairly unpredictable in nature.
1.4 MS Diagnosis: Imaging and Clinical Assessments
1.4.1 Imaging: Magnetic Resonance Imaging (MRI)
Over the past few decades, with the advent and widespread availability of Magnetic
Resonance Imaging (MRI) systems, brain imaging has gained an increasing role in both MS
10
diagnosis and research39. This is largely in part due to MRI being a powerful noninvasive
imaging modality that uses strong magnetic fields to produce images of biological tissue.
Fundamentally, diagnosing MS is largely based on the demonstration of the dissemination of
demyelinating lesions to various regions across the CNS (dissemination in space (DIS)) and over
time (dissemination in time (DIT)).
WM disorders such as that of MS have historically used MRI as a primary diagnostic
tool. However, MRI methods have come a long way since the 1980s. Historically, imaging
biomarkers have struggled to predict specific symptoms and their severity. In fact, a concept
known as the ‘clinicoradiological paradox’ refers to the weak correlation of MRI lesion load with
clinical disability, describing its reduced value as a prognostic marker for clinical
impairments30,40,41. This notion has now unsurprisingly proved to be a paradox, owing to MRIs
sensitivity to MS-related abnormalities, non-invasiveness, reproducibility and repeatability42,43.
This association between clinical findings and the radiological extent of involvement has now
led to MRIs prominent role in diagnosing MS, and is now a powerful diagnostic tool for
detecting and measuring lesions, assessing brain atrophy and evaluating WM and GM MS
pathology20,41.
Despite the widespread use of the MRI as a powerful diagnostic tool, its use remains
limited when trying to decipher some of the neural mechanisms underlying cognition in diseases
like MS. Studies that have used conventional MRI have found it challenging to investigate
something as complex as cognitive impairment in MS on just the basis of T2 lesional disease
burden. Therefore, although conventional MRI has effectively proven to quantify structural brain
damage, WM and GM pathology outside of damaged tissue, in areas known as NAWM and
NAGM it becomes challenging to quantify, and therefore requires more advanced quantitative
11
neuroimaging techniques. Because of this, the use of more advanced quantitative MRI
techniques is now becoming increasingly common, as they allow for the visualization of
widespread abnormalities in the CNS - beyond WM focal lesions, which ultimately broadens our
understanding of the neurodegenerative disease process44. These quantitative measures which are
highly sensitive in detecting MS plaques, provide quantitative assessments of inflammatory
activity and lesion load, which is essential in times when MS-related abnormalities go undetected
with conventional MRI - which is often the reason why modest correlations are reported between
MRI-visible WM lesions and neurological deficits33,44. Some of these advanced quantitative MRI
methods include diffusion tensor imaging (DTI)45, magnetization transfer imaging (MTI)46 and
myelin water imaging (MWI)47 to list a few, which have allowed us to look at the
microstructural, metabolic and functional changes in MS patients – moving closer toward
understanding the variables giving rise to the complex manifestation of diseases like MS44. DTI
imaging in particular, which will be discussed in more detail later in this thesis, has advanced the
field of brain imaging with the ability to obtain reliable in vivo estimates of brain damage,
suggesting that MS is not limited to lesions visible on T2-weighted images as seen by
conventional MRI, but instead has demonstrated that several brain regions that may appear
‘normal’ (i.e. NAWM) on conventional MRI, are in fact driving some of these cognitive deficits.
In fact, in addition to NAWM merely driving some of these cognitive deficits, several DTI
studies have reported damage in specific WM tracts to be associated with EF decline, as
supported by poor performance on the Paced Auditory Serial Addition Test (PASAT), The
Multiple Errands Test (MET) and the Trail Making Test (TMT) and Color Word Interference
Test (CWIT) from the DKEFS Test20. Together, this suggests a clear association between DTI
and NAWM in MS, and therefore suggests that conventional MRI is not sufficient in

12
understanding more complex cognitive deficits in persons with MS. Similarly, among many, one
such study reported increased MD in NAWM over a 15-month period in persons with MS -
independent of lesion load and brain volume. These findings were then further supported by
other findings that reported that changes in NAGM occur over time, independent of whole brain
and GM volumes48,49. Taken together, it is evident through the extent of damage in NAWM and
NAGM, that there seems to be damage beyond what conventional MRI methods can detect. This
then created the need to investigate brain damage beyond what is seen by conventional MRI,
therefore paving the way for MS studies to then employ more advanced quantitative MRI
methods as mentioned above, in hopes to work toward better understanding anatomical
connectivity patterns to enhance our understanding of the relationships between MRI findings
and specific cognitive deficits and the corresponding brain networks that are affected50.
However, despite how far we have come by employing more advanced quantitative imaging
methods in studying MS, these studies are often predicated on precise one-to-one spatial
mappings between the brain images of different individuals. This is often done through warping
each participant’s brain to that of a commonly used brain template which enables researchers to
conduct region of interest analyses and group-wise comparisons. However, with MS studies in
particular, the presence of MS lesions and other MS-related brain pathologies seem to affect the
accuracy of automated warping methods - also known as spatial normalization. Chapter 3 of this
thesis, will therefore work to address this gap.
1.4.2 Diffusion Tensor Imaging
One powerful quantitative MRI method that revolutionized the visualization of WM
structures by exploiting the properties of water diffusion is DTI imaging. This method originally
introduced in 1994 by Basser et al., measures the displacement of water molecules on a micro

13
scale, ultimately providing information about the WM fibers that pass within a pixel45,51. Since
water molecules in the human body undergo a random Brownian motion - typically influenced
by partially permeable barriers and structures, DTI then works to quantify the relative diffusivity
of water in a voxel into directional components, which is in turn affected by the magnitude and
directionality of diffusion51,52. The restriction of water molecule movement depends on the
direction in which the diffusion is measured. This property is known as anisotropy and results in
greater diffusion along axons in comparison to the transversal measurement. DTI also provides
brain maps of the magnitude of diffusion - reflected by the mean diffusivity (MD), and the
degree of anisotropy as mentioned above - termed fractional anisotropy (FA)53. These two scalar
maps are used to quantify diffusion properties. MD values reflect the average rate of molecular
diffusion, such that higher values of MD correspond to higher diffusivity and vice versa.
Conversely, FA can be computed for each voxel expressing the preference of water diffusion in
an isotropic or anisotropic manner. The term isotopic can be understood as there being no
restrictions on diffusion, such that molecules will diffuse equally in all directions, and
anisotropic is a process whereby there are no restrictions on diffusion, where diffusion may
occur along one axis. For instance, in WM, anisotropy is high, meaning the water molecules
diffuse fastest along the length of the fiber and the slowest perpendicular to them/across the
width of the fiber. Moreover, FA values are relative measures that can range between values of
0-1. Values closer to 1, indicate that nearly all the water molecules in the voxel are diffusing
along the same preferred axis (anisotropic diffusion), whereas values closer to 0, indicate that the
water molecules are equally likely to diffuse in any direction (isotropic diffusion). One of the
advantages of using DTI is that it is rotationally invariant, meaning it can measure the principle

14
diffusivities regardless of the position of the fibers in space. Therefore, it can extract both the
magnitude of the diffusivities and also their 3D alignment45.
1.4.2.1 Application of DTI Measurements with MS
In relation to MS, previous DTI studies have shown that as WM tracts undergo
demyelination or axonal loss, their microstructure is disrupted, which in turn alters the diffusion
of water. Previous studies have also shown that higher MD values with lower FA values in acute
plaques are likely indicative of edema, demyelination, axonal loss and an overall increase in
barrier permiability40. Thus, since MS is a demyelinating disease, DTI plays a pivotal role, as the
myelin within the WM is believed to be one of the main drivers of the DTI signal. That said,
although it is clear that there is a significant amount of potential for DTI studies to enhance our
understanding of MS, the complex manifestation of the disease renders it difficult to do so to its
full potential. Despite the commonality of most MS patients experiencing chronic progression,
the complexity of MS results in a diverse range of neurological symptoms experienced by
patients – leading to unique MS experiences all around27. This in turn creates a need for
uncovering the variables giving rise to these individual differences in cognition, and particular
executive function. Therefore, to advance our understanding of this variability, Chapter 4 will
highlight some of the underlying factors contributing to these individual differences seen in
cognitive performance using DTI measures.
1.5 Clinical Assessments
With the ability of advanced quantitative MRI methods to detect disease-related
abnormalities and specifically its proven sensitivity to detect demyelinating lesions, we are able
to use reliable imaging modalities in conjunction with a variety of clinical assessments, which
together enhance diagnosis and leads to many new avenues that work to reduce disease activity,

15
and in part progression1. Likewise, a criterion from the 1980s known as the Poser Criteria was
typically used as diagnostic criteria. To fit this criteria, a patient needed to present evidence of at
least two relapses - in line with typical MS symptoms and have evidence of some sort of
involvement of WM in more than one region of the CNS54. Since then however, this model has
been replaced by the McDonald criteria, which itself has been revised in May of 2017. This
system requires patients to have lesions that affect at least two distinct sites in the CNS with two
episodes of neurological symptoms separated in time, for which there is no better reason for their
clinical presentation55. Unlike the Poser criteria, the revised McDonald Criteria allows for a more
rapid diagnosis and improved specificity and sensitivity. Ultimately this revised criteria allows
for a simpler diagnostic process with fewer MRI examinations39.
As the field of MS advances, efforts have been made to gage a more holistic picture of
MS. To do so, various rating scales have been used in conjunction with MRI methods. Some of
which include the Expanded Disability Status Scale (EDSS) and the Multiple Sclerosis
Functional Composite (MSFC). In fact, of the two, Kalkers et al., investigated the relationship
between the new MSFC and MRI lesion load as a biological disease marker and found that the
MSFC correlated better with both T2 hypointense and T1 hypointense lesion load than the
EDSS56. Other studies have worked to further prove the strong association between cognitive
function and MRI measures, such as Edwards et al., who found a clear relationship between
cerebral atrophy and cognitive performance by suggesting an association between MRI volume
estimations and cognitive deficits by correlating WM volumes with global Cognitive Index
Scores (CIS)57.

16
1.5.1 Cognition
Cognitive impairment affects 40-70% of individuals with MS - rendering it to be a major
cause of disability. To understand cognition in MS, it is integral to first understand some of the
domain-specific cognitive processes that influence neurocognitive domains such as attention, EF
and memory to list a few. This is largely because cognitive deficits in MS are domain-specific, as
opposed to contributing to global cognitive decline. Interestingly, these domain-specific deficits
in MS, result in considerable variability in the frequency and pattern of impairment among MS
patients58.
According to the DSM-5 approach, some of the primary neurocognitive domains include
complex attention, EF, language, perceptual-motor function, learning and memory and social
cognition. Clinically, attentional behavior refers to the ability to choose a task on which to attend
(selective attention), in order to utilize mental resources focused on a specific task, despite being
surrounded by distractions (focused attention), to ultimately sustain attention on a specific task
over long periods of time (sustained attention). Attention deficits in MS have been observed in
up to 25% of patients59. Moreover, speed of information processing refers to the ability to
maintain and manipulate information for a short period of time, and to the speed in which one
can then process that information. This key deficit is seen in about 20-30% of MS patients60.
Interestingly, several studies on MS have grouped together deficits in attention and speed of
information processing, and have found associations between attention and speed of information
processing and GM atrophy of strategic brain structures directly (such as the thalamus and
cerebellum) or indirectly through control of visual functions such as in the putamen and occipital
cortex involved in cognitive function61. EF impairment in contrast, is seen in up to 25% of
patients and can be observed through tasks involving planning, problem solving, executing task
strategies, decision-making, inhibition and flexibility to list a few62. Broadly, EF refers to

17
maintaining higher-level control over behavior and higher level reasoning60. Several studies have
suggested that MS patients consistently demonstrate impaired EF in comparison to controls due
to their impaired problem solving strategies and concept formation59. In fact, two studies
reported that MS patients performed poorly on two tasks of EF - both the Wisconsin Card
Sorting Test (WCST) and the Sorting Test from the DKEFS, which were shown to be correlated
with increased lesion load and atrophy, as assessed by MRI63,64. Moreover, perceptual-motor
function can be assessed through visual perception, visuoconstructional reasoning and
perceptual-motor coordination. Deficits have also been reported in verbal abilities, which can be
observed through speech comprehension. One instance in which deficits in impaired
comprehension of language can be observed, is through a patient’s difficulty in responding to a
set of questions or given instructions. This however can also be a result of deficits in other
domains such as attention and executive functioning65. Language can be assessed through object
naming, word finding, fluency, grammar and syntax and receptive language. Learning and
memory however can be observed through free recall, cued recall, recognition memory, long-
term memory and implicit learning. The California Verbal Learning Test II (CVLT) II is a
neuropsychological test often administered on MS participants to assess episodic verbal learning
and memory. This test asks MS participants to remember a word list, whereby the administrator
can then observe how they choose to recall those words through strategy or conceptual
inference65,66. Memory and learning disturbances in MS appear to be quite frequent, with
impaired memory seen in 40-65% of patients67. Memory impairments can be separated into
different domains including episodic memory (personally experienced events), working memory
(inability to retain information due to difficulties in concentration or attention) and semantic
memory (word meaning and general knowledge)68. Most patients however typically present with

18
impairments in their short-term and working memory67. Several studies have also reported
fatigue as a symptom commonly experienced among patients, in which it could be inferred that
perhaps fatigue is one of many factors contributing to poor cognitive performance59. Taken
together, cognitive dysfunction in MS is a result of a series of domain-specific disconnections.
The disruption of the WM tracts appears to lead to reduced functional connectivity between
cortico-cortical and cortico-subcortical cognitive processing regions, that together result in
impairments in specific cognitive domains69.
1.5.2 Executive Function
Roughly 17-25% of MS patients have difficulties in higher order executive functions62.
Anatomically, EF relies primarily on the integrity of the prefrontal cortex and its connections
with other cortical and subcortical systems. Diagnosing impairments in this domain however can
be understood as engaging in purposive, self-serving behavior, and often leads to a patient’s
inability to set goals, think conceptually, verbal fluency, make plans and organize. Therefore, a
patient’s impaired control over their thoughts, behaviors and emotions affects not their ability to
maintain daily functioning, but to also sustain independent living.
Historically neuropsychological tests assessed several interrelated domains and regions of
the brain. One domain-specific test known as the Delis-Kaplan Executive Function System
(DKEFS) test has systematically been suggested to be the most robust test for measuring EF
decline, such that it assesses a much wider range of independent executive abilities, over
previous EF tests in MS. Among many studies, one large-scale New Zealand study conducted a
comprehensive assessment of EF, general cognitive ability and memory by performing all
subtests of the DKEFS using 95 MS participants. This study not only suggested that MS
participants perform more poorly on tests of EF, but their findings also suggested that the

19
DKEFS allowed for a much more comprehensive assessment of EF than previous methods.
Taken together, this study’s findings supported the robustness of DKEFS when assessing EF
dysfunction70. These findings were lent further support by another study that found scores from
the DKEFS sorting test to be significantly lower than healthy controls, whereby MS patient
scores were a result of fewer sorts, a smaller description score and more redundant sorts63. In
addition to these studies done on adult onset of MS, one study that used DKEFS in a pediatric
MS cohort, also found DKEFS to be more robust in assessing EF, than previous tests such as the
Stroop Test or the Tower of London Test71. Taken together, DKEFS, unlike many other
neuropsychological tests, assesses EF exclusively, as opposed to other tests that assess a
compound of various cognitive functions such as processing speed and working memory,
rendering it difficult to isolate the effects of EF on a given test59. Interestingly, in addition to MS,
other patient populations like Parkinson’s disease, Schizophrenia and Schizoaffective disorder all
seem to use DKEFS when assessing EF72,73. That said, despite the identification of a robust
method of measuring EF decline, there still remains gaps in understanding the complexity of EF
dysfunction in MS, largely due to inconsistent findings and incomparable studies in the
literature. Because of this, Chapter 4 of this thesis will work to further address EF dysfunction in
MS.
Understanding the mechanisms underlying cognitive impairment in MS have been
moderately explored in the literature, through means of better understanding the structural and
functional connectivity patterns that underlie these domain-specific impairments. In fact, a meta-
analysis performed on data from 495 patients across 12 different studies, seven of which focused
on DTI imaging studies, found impaired cognition to be significantly associated with lower FA
in the callosal genu, thalamus, right posterior cingulum and fornix crus. The findings from this

20
meta-analysis provide insight into how widespread WM damage is. In line with the literature,
this study’s findings of lower FA relating to cognition, support the importance of understanding
the functional and structural connections in the MS brain74,75. Taken together, both advanced
quantitative MRI methods coupled with robust neurocognitive assessments are now used in
conjunction with one another to enhance our understanding of cognitive impairment in MS.
Chapter 4 of this thesis will therefore work to investigate the correlations between brain
structure, EF and cognition, to uncover the associations between MRI findings and EF decline.

21
Hypotheses and Objectives

22
2.1 Problem Statement
The purpose of this thesis is to contribute to the understanding of how brain
microstructure, as defined by DTI-based fractional anisotropy (FA) and mean diffusivity (MD)
relates to individual differences in cognitive impairment in MS. This will be done by employing
a network based approach, as high-level control processes have been suggested to rely on the
integrity of, and dynamic interactions between core neurocognitive networks76. The functional
interactions between these brain networks has provided insight into the associations between
structural and functional connectivity changes to that of clinical deficits and overall cognitive
performance. This however has been made possible through the use of anatomically-defined
WM atlases and WM probability maps of the brain77. This thesis will therefore employ a network
based approach to highlight how WM microstructure within two functionally-defined brain
networks, namely the DMN – a highly activated brain network during resting state and
deactivated during execution of working memory and attention cognitive tasks78 and the ECN – a
network involved in executive functions such as control processes and working memory79 as
well as lesioned and NAWM, correlate with individual differences in EF decline. This will
ultimately improve our understanding of the underlying causes of MS-related cognitive decline,
by establishing neural correlates underlying individual differences in cognitive performance in
MS.
2.2 Rationale
Despite the fact that 40-70% of MS patients suffer from cognitive impairments,
individual risk factors for cognitive disability remain largely unknown, and there are currently no
reliable prognostic markers to identify patients who are likely to develop cognitive deficits,
rendering it difficult to manage disease-related cognitive decline before it progressively worsens.

23
One barrier however, in overcoming this gap in the field is that several of the spatial
normalization algorithms and brain templates that have been developed so far, have only been
done on studies using neurologically healthy individuals. No previous studies have
systematically compared normalization methods to evaluate their performance in the presence of
MS-related pathologies. Therefore, in the absence of established ‘best’-practice’ guidelines for
spatially normalizing brain imaging data in the presence of MS pathologies, it became imminent
to determine a processing pipeline that would enable the most reliable comparisons between
individuals or groups in MS neuroimaging studies. Therefore, once a robust method is identified
that can yield more accurate voxel-wise and ROI-based comparisons between MS individuals or
groups, all MS studies can then adopt a uniform image processing pipeline to allow for more
accurate comparisons between studies and facilitate future meta-analyses. Establishing a data
processing pipeline that can enable the most reliable comparisons between individuals or groups
in MS neuroimaging studies, will then lay the foundation to explore different WM pathways and
possible regions that correlate to various cognitive deficiencies, allowing us to draw inferences
on cognitive performance and WM microstructure using our new functionally defined WM
Atlases. Taken together, this approach will highlight how individual differences relate to
cognitive performance, and ultimately establish how microstructure correlates to cognition in
MS. By uncovering correlations between microstructure and cognition, we can shed light on the
underlying causes of MS-related cognitive decline, and specifically that of EF decline.
2.3 Aims
This study will aim to first identify the most robust method to yield accurate voxel-wise
and ROI-based comparisons between MS individuals or groups by establishing a uniform image
processing pipeline. This pipeline will then be used to define 111 participant’s executive function

24
as the contrast between the most executive sub-component of the DKEFS Color-Word
Interference Test (i.e. inhibition/switching tasks) vs. the two baseline measures (i.e. Condition 1:
combined color naming and Condition 2: word reading tasks). This work will ultimately expand
our understanding of how individual differences in brain microstructure, as defined by DTI-
based fractional anisotropy relate to cognitive performance.
2.4 Hypotheses
The following thesis will test the following two hypotheses: 1) that nonlinear warping
methods in conjunction with lesion-filling will outperform conventional linear (affine)
normalization 2) that there will be a positive correlation between individual differences in
executive function and WM microstructure within the DMN and ECN, where participants with
higher executive function will have lower MD values and higher FA values.

25
Comparing spatial normalization algorithms for brain MRI data with multiple sclerosis pathologies
Running Title: Spatial normalization in the presence of MS brain pathologies Abstract Word Count: 292 Manuscript Word Count: 4,202 (excluding the Abstract, Table/Figure Captions and References) Number of Primary Tables and Figures: 0 Tables; 5 Figures Number of Supplementary Materials: 1 Supplementary Figure and 1 Supplementary Table Keywords: Brain; Lesion; Multiple Sclerosis; MRI; Spatial Normalization; Warping; MRIStudio; FSL; ANTs; SPM.

26
3.1 Abstract
Background: Spatially normalizing brain MRI data to a template is commonly performed to
facilitate comparisons between individuals or groups. However, the presence of multiple
sclerosis (MS) lesions and other MS-related brain pathologies may compromise the performance
of automated spatial normalization procedures. We therefore aimed to systematically compare
five commonly used spatial normalization methods for brain MRI – including linear (affine), and
nonlinear MRIStudio (LDDMM), FSL (FNIRT), ANTs (SyN), and SPM (CAT12) algorithms –
to evaluate their performance in the presence of MS-related pathologies.
Methods: 3 Tesla MRI images (T1-weighted and T2-FLAIR) were obtained for 20 participants
with MS from an ongoing cohort study (used to assess a real dataset) and 1 healthy control
participant (used to create a simulated lesion dataset). Both raw and lesion-filled versions of each
participant’s T1-weighted brain images were warped to the Montreal Neurological Institute
template using all five normalization approaches for the real dataset, and the same procedure was
then repeated using the simulated lesion dataset (i.e., total of 400 spatial normalizations). As an
additional quality-assurance check, the resulting deformations were also applied to the
corresponding lesion masks to evaluate how each processing pipeline handled focal white matter
lesions. For each normalization approach, inter-subject variability (across normalized T1-
weighted images) was quantified using both mutual information (MI) and coefficient of variation
(COV), and the corresponding normalized lesion volumes were evaluated using paired-sample t-
tests.
Results: All four nonlinear warping methods outperformed conventional linear normalization,
with SPM (CAT12) yielding the highest MI values, lowest COV values, and proportionately-
scaled lesion volumes. Although lesion-filling improved spatial normalization accuracy for each

27
of the methods tested, these effects were small compared to differences between normalization
algorithms.
Conclusions: SPM (CAT12) warping combined with lesion-filling is recommended for use in
future MS brain imaging studies requiring spatial normalization.

28
3.2 Introduction
Multiple Sclerosis (MS) is a neurodegenerative disorder of the central nervous system
characterized by focal lesions and atrophy in both white matter (WM) and grey matter (GM)
regions80. Several quantitative MRI methods such as diffusion tensor imaging (DTI)81,
magnetization transfer imaging (MTI)46, and myelin water imaging (MWI)47 have been widely
adopted to study MS and other WM disorders82,83. Such studies are often predicated on precise
one-to-one spatial mappings between the brain images of different individuals. This is typically
achieved by warping each participant’s brain image to a common template, which then facilitates
voxel-wise or region of interest (ROI)-based comparisons between individuals or groups84.
However, among participants with MS, widespread brain pathologies (e.g., focal WM and GM
lesions, distributed WM and GM atrophy, altered normal appearing white matter signals, etc.)
are likely to affect the accuracy of automated spatial normalization methods.
Several spatial normalization algorithms and brain templates have been developed for
studies of neurologically healthy individuals85, but no previous studies have systematically
compared normalization methods to evaluate their performance in the presence of MS-related
pathologies. Generally, these approaches aim to minimize differences between each participant’s
data and a template image, such as Talairach and Tournoux or Montreal Neurological Institute
(MNI) templates86, using linear and/or nonlinear spatial transformations87,88. Linear
transformations apply the same translation, rotation, and scaling parameters to all voxels within
an image. Although they are robust to local pathologies, they do not accurately match individual
brain structures, particularly in WM and other sub-cortical regions that are of particular interest
in MS89. Conversely, nonlinear transformations apply different scaling parameters to each voxel.
This allows more localized region-specific deformations, but the high-dimensional nature of
these algorithms renders them prone to over-fitting during the template matching process, which

29
can reduce or eliminate abnormal but potentially salient features in the images (e.g., erroneously
increasing or decreasing sizes of focal brain lesions)84,89,90.
To minimize these types of erroneous spatial deformations, brain lesions in clinical populations
are often identified and either discounted (aka, ‘de-weighted’) during spatial normalization or
lesion-filled (aka, ‘in-painted’) by intensity-correcting them based on signals from neighboring,
normal-appearing tissue before spatial normalization91. Lesion-filling has been shown to improve
anatomical correspondence, as well as WM and GM volume measurements among participants
with MS92,93.
Although studies comparing different image processing pipelines and spatial
normalization methods have revealed performance differences in Alzheimer’s disease, mild
cognitive impairment, drug-resistant epilepsy, and stroke84,94, no such comparisons have been
reported for MS. Therefore, in the absence of established ‘best-practice’ guidelines for spatially
normalizing brain imaging data in the presence of MS pathologies84,89, we aimed to: 1) use MS
brain imaging data to systematically evaluate the performance of five commonly-used spatial
normalization approaches in four popular neuroimaging software packages including MRIStudio,
FSL, ANTs and SPM, before and after lesion-filling; 2) create a simulated lesion dataset to
compare how each normalization approach was specifically affected by focal lesions rather than
global differences in brain volumes and GM/WM signal intensities; and 3) determine a data
processing pipeline that would enable the most reliable comparisons between individuals or
groups in MS neuroimaging studies.

30
3.3 Materials and Methods
3.3.1 Data Acquisition
The current study used de-identified MRI images from 20 randomly selected participants
with MS [16 female; range 22-66 years] and one randomly selected neurologically healthy
control participant enrolled in the ongoing Comorbidity, Cognition and Multiple Sclerosis
(CCOMS) Study95. The study was approved by our institutional Research Ethics Board and
written informed consent was obtained from all participants. All participants with MS (19
relapsing remitting; 1 secondary progressive) were diagnosed by neurologists delivering
specialized MS care using the revised McDonald criteria96. MS participants all had Expanded
Disability Status Scale (EDSS) scores between 1.0-6.5 [mean±SD = 2.88±1.45], and disease
durations between 1-23 years [mean±SD = 12.05±7.41 years]97.
All brain imaging data were acquired using a Siemens Tim Trio 3T MRI system with a
32-channel head coil (Siemens Healthcare, Erlangen, Germany). Each MRI examination
included a whole-brain T1-weighted (T1w) MPRAGE (Repetition Time [TR] = 1900 ms; Echo
Time [TE] = 3.46 ms; Inversion Time [TI] = 900 ms; Flip Angle = 9°; Matrix Size = 256 ´ 256;
Number of Slices = 176, Field Of View [FOV] = 250 ´ 250 mm2; Voxel Size = 0.98 ´ 0.98 ´
0.98 mm3; Acquisition Time [TA] = 4:26 min) and a whole-brain T2-weighted fluid-attenuated
inversion recovery (T2-FLAIR) sequence (TR = 9000 ms; TE = 100 ms; TI = 2499.2 ms; Flip
Angle = 130°; Matrix Size = 256 ´ 256; Number of Slices = 32; FOV = 240 ´ 240 mm2; Voxel
Size = 0.94 ´ 0.94 ´ 4.00 mm3; TA = 5.06 min).
3.3.2 Image Processing
We chose to compare four software packages that are well established, freely available,
and widely used throughout the neuroimaging research community in order to ensure that our

31
findings could be replicated and would be of value in future MS neuroimaging studies. The
following software packages were included: MRIStudio version 1.9 (https://www.mristudio.org/,
Johns Hopkins University), FSL version 5.0.10 (https://fsl.fmrib.ox.ac.uk/fsl/fslwiki/, University
of Oxford), ANTs version 2.1.0 (http://picsl.upenn.edu/software/ants/, University of
Pennsylvania), and SPM12 version 7219 (http://www.fil.ion.ucl.ac.uk/spm/software/spm12/,
Wellcome Trust Centre for Neuroimaging) with the Computational Anatomy Toolbox for
SPM12 (CAT12 version R1148; http://www.neuro.uni-jena.de/cat/, University of Jena). All
image analyses were performed on a Macintosh computer (OSX 10.13.6 High Sierra operating
system).
3.3.2.1 Skull Stripping
Each participant’s raw T1w MRI image in subject space was ‘skull-stripped’ using FSL’s
automated brain extraction tool (BET) with a fractional intensity threshold of 0.45 to separate
brain from non-brain tissue98. This brain extraction step has previously been shown to improve
subsequent normalization of structural MRI data in both healthy and clinical populations99.
3.3.2.2 Lesion Filling
Automated lesion segmentation was performed using the Lesion Segmentation Toolbox
(LST) for SPM12 (http://www.statistical-modelling.de/lst.html, Technical University München).
The T1w and FLAIR images were linearly co-registered before applying the lesion growth
algorithm (LGA) using the T1w and FLAIR signal intensities and a kappa threshold of 0.2100.
The binary lesion masks and normal appearing white matter (NAWM) masks from the LST were
then used to create lesion-filled T1w images via the FSL ‘lesion_filling’ command93.1
1 The combination of SPM and FSL was intentionally employed here to avoid all of the image processing being performed within any single software package (which could potentially bias the subsequent normalization results in favor of that package).

32
3.3.2.3 Spatial Normalization
Each of the 40 skull-stripped T1w images (i.e., 20 before lesion-filling and 20 after
lesion-filling) were spatially normalized to 1.0 ´ 1.0 ´ 1.0 mm3 T1w MNI templates using each
of the following five spatial normalization approaches (Figure 3.1). Each software package’s
included T1w MNI template and default parameters were used, unless otherwise noted.
1. Linear (Affine): Linear spatial normalization was achieved by applying a 12-parameter
affine (AIRLinear) transformation using the DiffeoMap Toolbox in MRIStudio101.
2. MRIStudio (LDDMM): After an initial linear (affine) normalization within the DiffeoMap
Toolbox (described above), nonlinear warping using the large deformation diffeomorphic metric
mapping (LDDMM) algorithm102 was implemented with cascading alpha values (i.e., 0.01,
0.005, 0.002) to allow increasingly elastic deformations, as previously described77.
3. FSL (FNIRT): After an initial linear (affine) normalization using FSL’s Linear Image
Registration Tool (FLIRT)103,104, nonlinear spatial normalization was performed using FSL’s
Nonlinear Image Registration Tool (FNIRT)105.
4. ANTS (SyN): Nonlinear spatial normalization was performed using the Advanced
Normalization Tools (ANTs) Symmetric Normalization (SyN) algorithm106, which combines
linear and nonlinear bidirectional mappings.
5. SPM (CAT12): Nonlinear spatial normalization was performed using the CAT12 Toolbox
107 within SPM12, initially using low-dimensional nonlinear warping, followed by a two-stage
nonlinear normalization approach based on Geodesic Shooting algorithms88,108.

33
Figure 3.1: Image processing pipeline
Figure 3.1: Comprehensive image-processing pipeline for warping the T1w MRI images and lesion masks from each participant to the Montreal Neurological Institute (MNI) brain template. Spatial normalizations were performed using five commonly used algorithms, both before and after lesion-filling the T1w images. Note: Axial brain images are displayed in neurological convention (left=left); NAWM: normal appearing white matter, LST: lesion segmentation toolbox, LGA: lesion growth algorithm, Non-LF: non lesion-filled, LF: lesion-filled.

34
Although some of these software packages are able to generate normalized T1w images
directly, such images may have been subjected to additional, interim processing steps such as
smoothing, interpolation or global intensity scaling. Therefore, rather than using direct outputs
from any of the software packages, the resulting deformation fields from each algorithm (after
combining the linear and nonlinear deformations, if applicable) were applied to each
participant’s original T1w image. This was done either before or after lesion-filling, but without
any additional processing steps, and was also done to the corresponding LST-segmented lesion
masks. The aim was to yield the most direct comparison between the algorithms themselves, and
to limit other potential differences between the image processing pipelines and software
packages.
3.4 Methodological Comparisons
We used three measures to assess spatial normalization accuracy, before and after lesion-
filling with each normalization algorithm, including: 1) mutual information (MI) between
normalized images; 2) coefficient of variation (COV) between normalized images; and 3)
volume of spatially-normalized lesion masks. Comparing the similarity of warped images using
MI and COV values reflects how well each normalization procedure worked in terms of making
all participants’ images look the same; however, tracking the lesion volume is also important to
ensure that successful spatial normalization was not achieved by, or at the expense of,
inappropriately shrinking or expanding focal lesions.
To measure the similarity between spatially normalized T1w images that were generated
using each approach, we first calculated MI, I(X;Y), for all combinations of image pairs within
each group ( !"!!!(!"&!)!
= 190) using the freely-available Fast Mutual Information of Two Images
or Signals Toolbox in Matlab (https://www.mathworks.com/matlabcentral/fileexchange/13289-
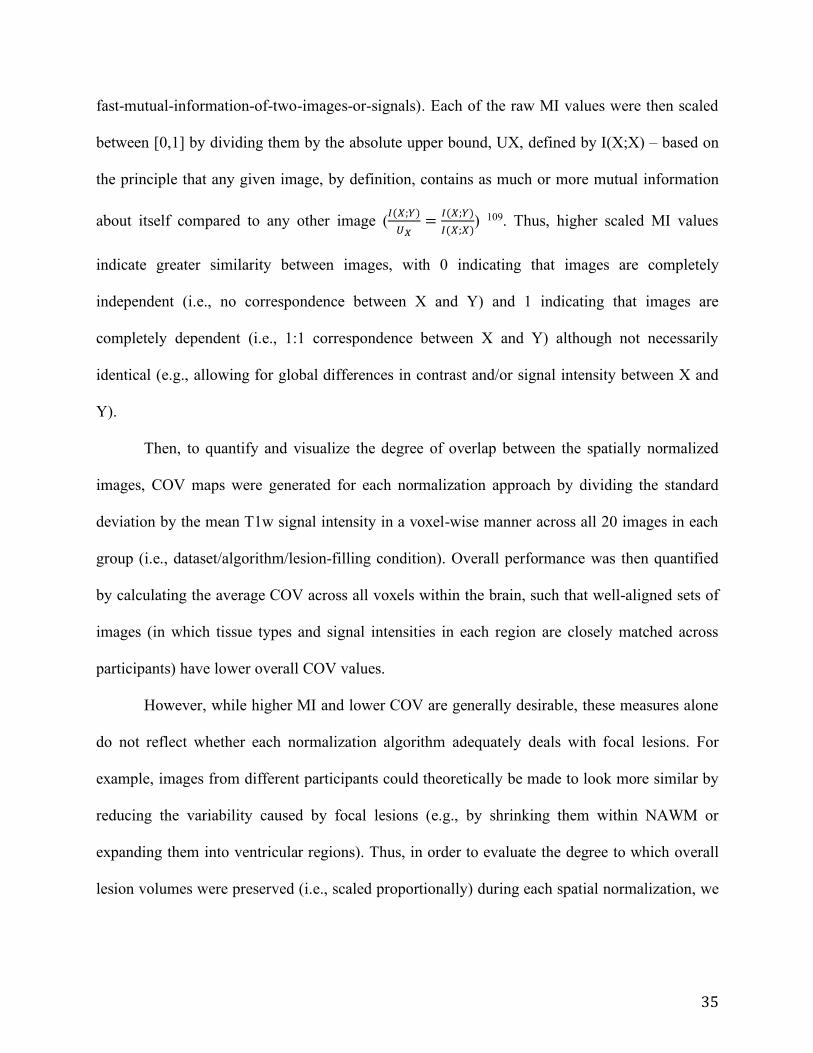
35
fast-mutual-information-of-two-images-or-signals). Each of the raw MI values were then scaled
between [0,1] by dividing them by the absolute upper bound, UX, defined by I(X;X) – based on
the principle that any given image, by definition, contains as much or more mutual information
about itself compared to any other image (,(-;/)01
= ,(-;/),(-;-)
) 109. Thus, higher scaled MI values
indicate greater similarity between images, with 0 indicating that images are completely
independent (i.e., no correspondence between X and Y) and 1 indicating that images are
completely dependent (i.e., 1:1 correspondence between X and Y) although not necessarily
identical (e.g., allowing for global differences in contrast and/or signal intensity between X and
Y).
Then, to quantify and visualize the degree of overlap between the spatially normalized
images, COV maps were generated for each normalization approach by dividing the standard
deviation by the mean T1w signal intensity in a voxel-wise manner across all 20 images in each
group (i.e., dataset/algorithm/lesion-filling condition). Overall performance was then quantified
by calculating the average COV across all voxels within the brain, such that well-aligned sets of
images (in which tissue types and signal intensities in each region are closely matched across
participants) have lower overall COV values.
However, while higher MI and lower COV are generally desirable, these measures alone
do not reflect whether each normalization algorithm adequately deals with focal lesions. For
example, images from different participants could theoretically be made to look more similar by
reducing the variability caused by focal lesions (e.g., by shrinking them within NAWM or
expanding them into ventricular regions). Thus, in order to evaluate the degree to which overall
lesion volumes were preserved (i.e., scaled proportionally) during each spatial normalization, we

36
calculated the 3D volume of each warped lesion mask, and performed comparisons between
methods using two-tailed paired t-tests.
All statistical analyses were performed using MATLAB (version 2015a, The MathWorks
Inc., Natick, MA, USA) and MedCalc 17.2 (MedCalc Software, Mariakerke, Belgium).
3.4.1 Validation and Lesion-Specific Analyses Using Simulated Brain Lesion Data
In addition to analyzing brain images of the 20 participants with MS, a simulated brain
lesion dataset was generated for cross-validation and to examine the performance of each spatial
normalization algorithm in the presence of focal WM lesions alone. Instead of using each
participant’s raw brain images, which include inter-subject differences in GM, WM, and
cerebrospinal fluid (CSF) volumes, NAWM intensities, as well as focal lesion locations and
volumes, the simulated dataset was generated by transposing WM lesions from each participant
with MS onto a reference T1w image from one randomly selected neurologically healthy study
participant. An in-house MATLAB code, along with the healthy participant’s WM mask, was
used to ensure that the imposed lesions were within the brain parenchyma and primarily
restricted to WM regions – thereby producing a set of 20 images differing only in lesion location,
volume, and intensity, while controlling for volume and signal intensity throughout GM, CSF
and NAWM regions. Each of these images then underwent the same five spatial normalization
approaches, before and after lesion-filling as described previously for the MS participant data,
and the resulting deformation fields were then applied to the original reference T1w image
without any lesions. Applying each of the resulting deformations to the same control image in
this simulated dataset thereby provides a ‘ground truth’, where all of the warped images should
have the same geometric properties and image intensities (i.e., MI should be 1 and COV should
be 0) except for differences that result from spatial normalization of the images in the presence
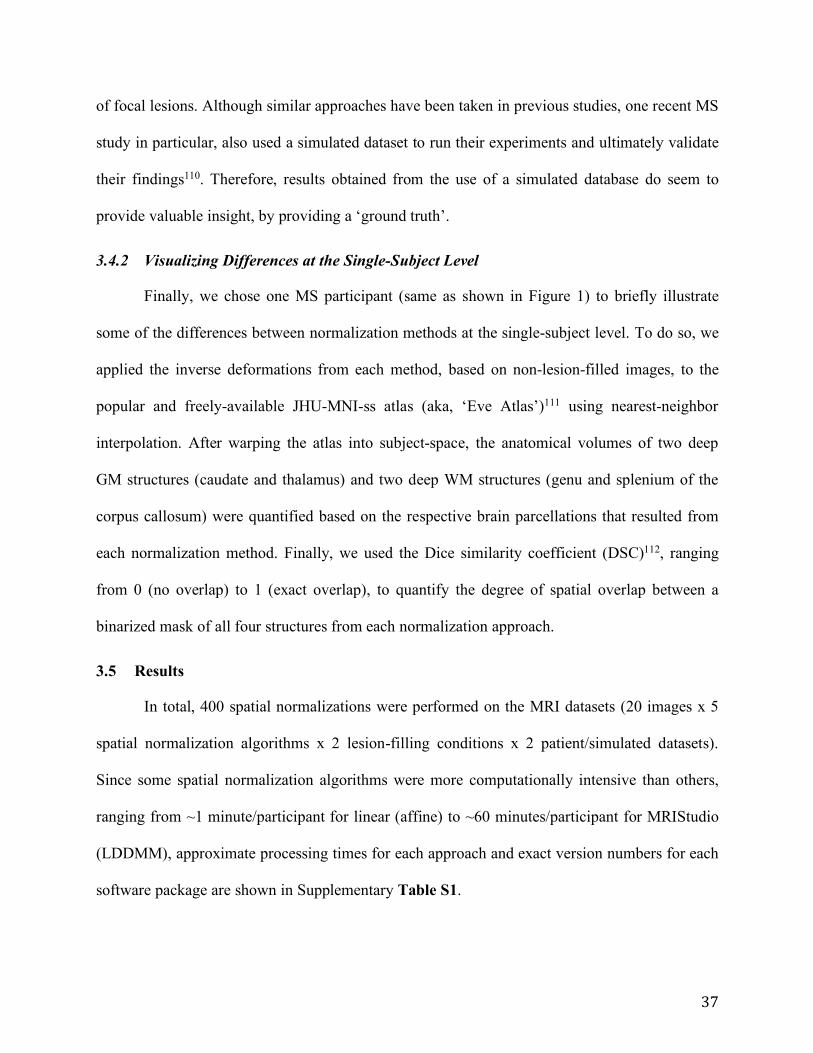
37
of focal lesions. Although similar approaches have been taken in previous studies, one recent MS
study in particular, also used a simulated dataset to run their experiments and ultimately validate
their findings110. Therefore, results obtained from the use of a simulated database do seem to
provide valuable insight, by providing a ‘ground truth’.
3.4.2 Visualizing Differences at the Single-Subject Level
Finally, we chose one MS participant (same as shown in Figure 1) to briefly illustrate
some of the differences between normalization methods at the single-subject level. To do so, we
applied the inverse deformations from each method, based on non-lesion-filled images, to the
popular and freely-available JHU-MNI-ss atlas (aka, ‘Eve Atlas’)111 using nearest-neighbor
interpolation. After warping the atlas into subject-space, the anatomical volumes of two deep
GM structures (caudate and thalamus) and two deep WM structures (genu and splenium of the
corpus callosum) were quantified based on the respective brain parcellations that resulted from
each normalization method. Finally, we used the Dice similarity coefficient (DSC)112, ranging
from 0 (no overlap) to 1 (exact overlap), to quantify the degree of spatial overlap between a
binarized mask of all four structures from each normalization approach.
3.5 Results
In total, 400 spatial normalizations were performed on the MRI datasets (20 images x 5
spatial normalization algorithms x 2 lesion-filling conditions x 2 patient/simulated datasets).
Since some spatial normalization algorithms were more computationally intensive than others,
ranging from ~1 minute/participant for linear (affine) to ~60 minutes/participant for MRIStudio
(LDDMM), approximate processing times for each approach and exact version numbers for each
software package are shown in Supplementary Table S1.
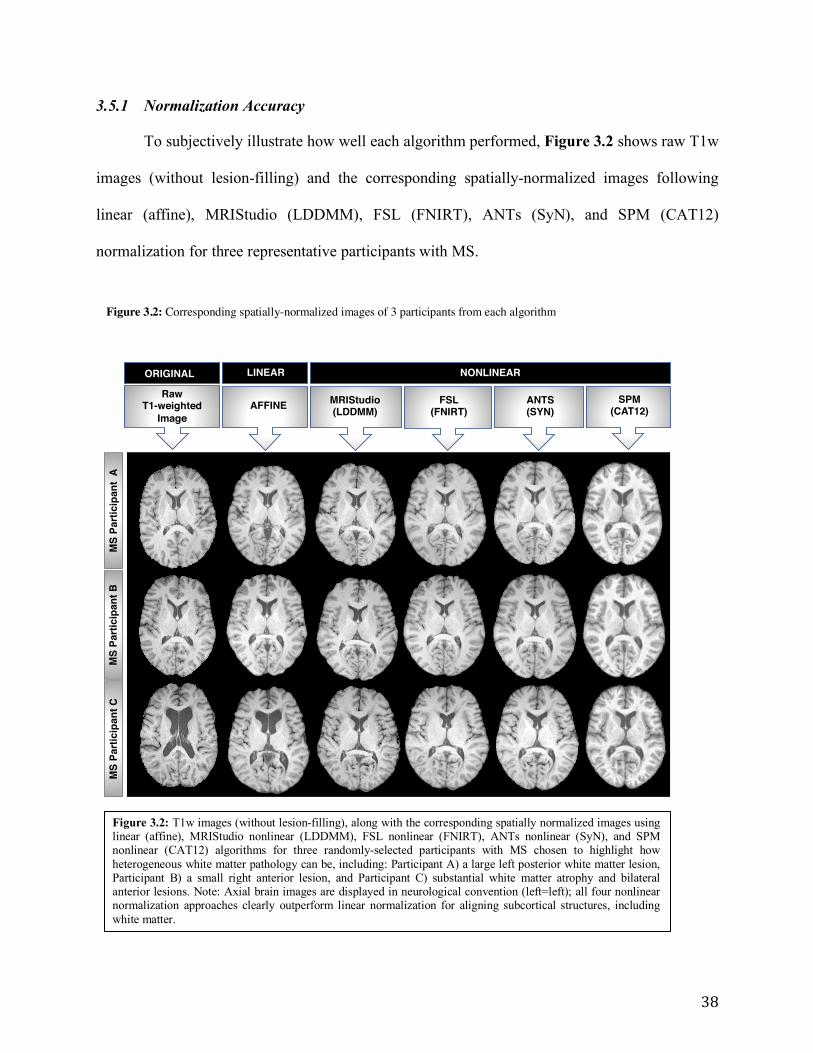
38
3.5.1 Normalization Accuracy
To subjectively illustrate how well each algorithm performed, Figure 3.2 shows raw T1w
images (without lesion-filling) and the corresponding spatially-normalized images following
linear (affine), MRIStudio (LDDMM), FSL (FNIRT), ANTs (SyN), and SPM (CAT12)
normalization for three representative participants with MS.
LINEAR
MS
Parti
cipa
nt A
M
S Pa
rtici
pant
B
MS
Parti
cipa
nt C
NONLINEAR
RawT1-weighted
ImageAFFINE MRIStudio
(LDDMM)FSL
(FNIRT)SPM
(CAT12) ANTS (SYN)
ORIGINAL LINEAR
Figure 3.2: Corresponding spatially-normalized images of 3 participants from each algorithm
Figure 3.2: T1w images (without lesion-filling), along with the corresponding spatially normalized images using linear (affine), MRIStudio nonlinear (LDDMM), FSL nonlinear (FNIRT), ANTs nonlinear (SyN), and SPM nonlinear (CAT12) algorithms for three randomly-selected participants with MS chosen to highlight how heterogeneous white matter pathology can be, including: Participant A) a large left posterior white matter lesion, Participant B) a small right anterior lesion, and Participant C) substantial white matter atrophy and bilateral anterior lesions. Note: Axial brain images are displayed in neurological convention (left=left); all four nonlinear normalization approaches clearly outperform linear normalization for aligning subcortical structures, including white matter.
39
The MI analysis (Figure 3.3a-d) revealed that nonlinear spatial normalization methods
consistently outperformed simple linear (affine) normalization in terms of their ability to produce
significantly more consistent spatially normalized images across our sample of participants with
MS (Figure 3.3a and Figure 3.3b). However, among the nonlinear approaches, SPM (CAT12)
yielded the greatest inter-subject correspondence (highest MI values) for both the MS participant
dataset (Figure 3.3a and Figure 3.3b) and the simulated lesion dataset (Figure 3.3c and Figure
3d), whereas FSL (FNIRT) yielded the lowest inter-subject correspondence (lowest MI values).
Linear (affine) and MRIStudio (LDDMM) both showed a statistically significant dependence in
terms of whether images were lesion-filled or not (Figure 3.3a), but these effects were small
compared to the differences between the five normalization algorithms for the MS participant
dataset. Nonetheless, all five normalization approaches did show significantly higher MI scores
as a result of lesion-filling in the simulated lesion dataset (Figure 3.3c).

40
0.25
0.30
0.35
0.40
0.45
0.50Participant Data
p < 0.001
p < 0.001
p = 0.38 p = 0.90
p = 0.22
a)
b)
d)
0.5
0.6
0.7
0.8
0.9
1.0
Simulated Data
p < 0.001
p < 0.001
p < 0.001
p < 0.001p < 0.001
c)
Linear(affine)
MRIStudio(LDDMM)
FSL(FNIRT)
ANTs(SyN)
SPM(CAT12)
Mut
ual I
nfor
mat
ion
Anal
ysis
Mut
ual I
nfor
mat
ion
Anal
ysis
Linear(affine)
MRIStudio(LDDMM)
FSL(FNIRT)
ANTs(SyN)
SPM(CAT12)
MRIStudio (LDDMM) p = 2.00 x 10-221
FSL (FNIRT) p = 5.73 x 10-258 p = 1.88 x 10⁻¹²
ANTs (SyN) p = 7.41 x 10-211 p = 3.92 x 10-67 p = 6.21 x 10-88
SPM (CAT12) p = 3.04 x 10-215 p = 2.24 x 10-82 p = 3.89 x 10-112 p = 8.19 x 10⁻²¹
Linear (affine) MRIStudio (LDDMM) FSL (FNIRT) ANTs (SyN)
MRIStudio (LDDMM) p = 1.55 x 10-116
FSL (FNIRT) p = 9.85 x 10-120 p = 0.04
ANTs (SyN) p = 7.84 x 10⁻²⁷ p = 9.43 x 10-36 p = 1.54 x 10-44
SPM (CAT12) p = 9.23x 10-09 p = 1.96 x 10-144 p = 1.22 x 10-153 p = 1.48 x 10-69
Linear (affine) MRIStudio (LDDMM) FSL (FNIRT) ANTs (SyN)
Figure 3.3 a-d: Box-Whisker plots of mutual information (MI) values from each normalization method
Figure 3.3a-d: Box-Whisker plots of mutual information (MI) values based on images from each normalization approach before and after lesion-filling: a) participant data, c) simulated data with p-values indicating within-algorithm differences before vs. after lesion-filling. Corresponding p-values of between-algorithm differences are presented in (b, d). Note: green boxes = non lesion-filled data; blue boxes = lesion-filled data, shaded cells in 2b and 2d indicate p-values £ 0.05 (Bonferroni corrected).

41
Figure 3.4 shows the COV maps and whole-brain COV values for the MS participant
and simulated lesion datasets, which highlights inter-subject differences for each spatial
normalization pipeline. For the MS participant data (Figure 3.4a), and consistent with the MI
results, the average COVs for all nonlinear normalization methods were lower than linear
normalization. This was particularly evident in periventricular regions, highlighting how
ventricular size and shape differences between participants are not well accounted for by simple
linear scaling. Among the nonlinear normalization approaches, the SPM (CAT12) algorithm
produced the lowest average COV (Figure 3.4a), reflecting the least anatomical variability
between spatially-normalized participant images. Lesion-filling improved normalization
accuracy for all five approaches but these improvements within each algorithm were small in
comparison to the relatively large COV differences between algorithms. Conversely, for the
simulated lesion dataset (Figure 3.4b), linear (affine) normalization showed the least variability
between normalized images. Similar to the results obtained in the MS participant data and the
results based on MI values, the SPM (CAT12) algorithm produced the best results in terms of
lowest COV values among the nonlinear normalization approaches. Lesion-filling again
improved normalization accuracy for all five approaches, and these improvements were larger
than those observed in the MS participant dataset.

42
a) P
artic
ipan
t Dat
aNo
n Le
sion
-Fill
edLe
sion
-Fill
edMRIStudio LDDMM FSL FNIRT ANTS SYN SPM CAT12Linear
29.9
29.2
21.025.1 9.725.7
20.5 9.621.423.4
0.9
0.2
1.92.4 1.63.1
0.8 0.61.21.7
b) S
imul
ated
Dat
aNo
n Le
sion
-Fill
edLe
sion
-Fill
ed
Figure 3.4 a-b: Coefficient of Variation maps for each spatial normalization method
Figure 3.4 a-b: Between-participant coefficient of variation (COV) maps based on each normalization approach before and after lesion-filling: a) participant data and b) simulated data. Whole-brain average COV values are shown for each approach, where higher COV values indicate greater between-participant variability.

43
3.5.2 Normalized Lesion Volumes
Figure 3.5 shows the lesion volumes before and after spatial normalization with each
method. Given that the MNI brain template is slightly larger than most typical adult brains,
lesion volumes increased as a result of spatial normalization to this template with all five
methods, both with and without lesion-filling. Based on the MS participant data (Figure 3.5a),
average lesion volumes were increased by ~35% for linear (affine), ~60% for MRIStudio
(LDDMM), ~100% for FSL (FNIRT), and ~40% for ANT (SyN) and SPM12 (CAT12). Based
on paired-sample t-tests, FSL (FNIRT) (p=0.001) and ANTs (SyN) (p=0.003) were the only
normalization approaches to show within-method differences due to lesion-filling. Conversely,
significant differences were found for all between-method comparisons (Figure 3.5b) except
linear (affine) vs. ANTs (SyN) (p=0.06) and SPM (CAT12) vs. ANTs (SyN) (p=0.28), indicating
that lesion volumes were influenced more by the spatial normalization approach than lesion-
filling.
Within the simulated lesion dataset, lesion volumes also increased as a result of spatial
normalization and in this case, all approaches showed significant within-method differences due
to lesion-filling (Figure 3.5c). Paired-sample t-tests also revealed significant differences between
all spatial normalization approaches (Figure 3.5d) except linear (affine) vs. ANTs (SyN)
(p=0.31), linear (affine) vs. MRIStudio (LDDMM) (p=0.67), and MRIStudio (LDDMM) vs.
ANTs (SyN) (p=0.57).

44
0
1
2
3
4
5
6x104
x104
Lesi
on V
olum
e (m
m3 )
Participant Data
p = 0.21
p = 0.23
p = 0.001
p = 0.003
p = 0.80
a)
b)
d)
0
1
2
3
4
5
Lesi
on V
olum
e (m
m3 )
Simulated Data
p = 0.02p = 0.02
p < 0.001
p < 0.001p = 0.02
c)
LesionVolume
Linear(affine)
MRIStudio(LDDMM)
FSL(FNIRT)
ANTs(SyN)
SPM(CAT12)
LesionVolume
Linear(affine)
MRIStudio(LDDMM)
FSL(FNIRT)
ANTs(SyN)
SPM(CAT12)
MRIStudio (LDDMM) p = 7.5 x 10⁻⁵ FSL (FNIRT) p = 1.17 x 10⁻⁷ p = 4.22 x 10⁻⁷ ANTs (SyN) p = 0.06 p = 7.13 x 10⁻⁴ p = 9.09 x 10⁻¹¹
SPM (CAT12) p = 4.51 x 10⁻³ p = 7.13 x 10⁻⁵ p = 3.14 x 10⁻⁸ p = 0.28 Linear (affine) MRIStudio (LDDMM) FSL (FNIRT) ANTs (SyN)
MRIStudio (LDDMM) p = 0.67 FSL (FNIRT) p = 8.71 x 10⁻¹² p = 2.25 x 10⁻¹¹ ANTs (SyN) p = 0.31 p = 0.57 p = 2.18 x 10⁻⁷
SPM (CAT12) p = 3.90 x 10⁻⁷ p = 7.43 x 10⁻⁵ p = 1.07 x 10⁻¹¹ p = 0.01 Linear (affine) MRIStudio (LDDMM) FSL (FNIRT) ANTs (SyN)
Figure 3.5 a-d: Lesion volumes for each normalization method after lesion-filling
Figure 3.5 a-d: Box-Whisker plots of lesion volumes based on each normalization approach before and after lesion-filling: a) participant data, c) simulated data with p-values indicating within-algorithm differences before vs. after lesion-filling. Corresponding p-values of between-algorithm differences are presented in (b, d). Note: green boxes = non lesion-filled data; blue boxes = lesion-filled data, shaded cells in 4b and 4d indicate p-values £ 0.05 (Bonferroni corrected).

45
3.5.3 Single-Subject Analyses
In our single-subject example using one representative participant with MS, inverse
deformations of the JHU-MNI-ss (Eve) Atlas based on each normalization method produced
different estimated volumes of the caudate, thalamus, genu and splenium (Supplementary
Figure 1a). Moreover, the corresponding masks of these regions had subjectively poor spatial
overlap (Supplementary Figure 1b), which was supported quantitatively by modest DSC
values, which ranged between 0.50-0.76 (Supplementary Figure 1c).
3.6 Discussion
We systematically compared five of the most commonly used and freely available spatial
normalization methods, before and after lesion-filling in the presence of MS pathologies and
found that nonlinear warping methods systematically outperformed conventional linear
normalization in terms of their ability to consistently warp MS participant images to a common
template. In particular, SPM12 (CAT12), closely followed by ANTs (SyN), yielded the most
consistent results, with the highest MI and lowest COV values among the five approaches
examined. Lesion-filling lead to small but reproducible improvements.
These findings are similar to those of Klein et al. who also found SPM and ANTs to be
the highest-ranking nonlinear normalization methods in comparisons based on brain imaging
data from neurologically healthy volunteers85. However, ours was the first study to
systematically compare spatial normalization methods in a MS cohort and to evaluate the effects
of MS pathologies, including focal lesions, differences in NAWM and GM volumes and signal
intensities, using actual MS participant data. Since the goal of this study was to compare the
spatial normalization algorithms themselves, we controlled for differences in preprocessing and
postprocessing as much as possible. Moreover, we employed a simulated lesion dataset that
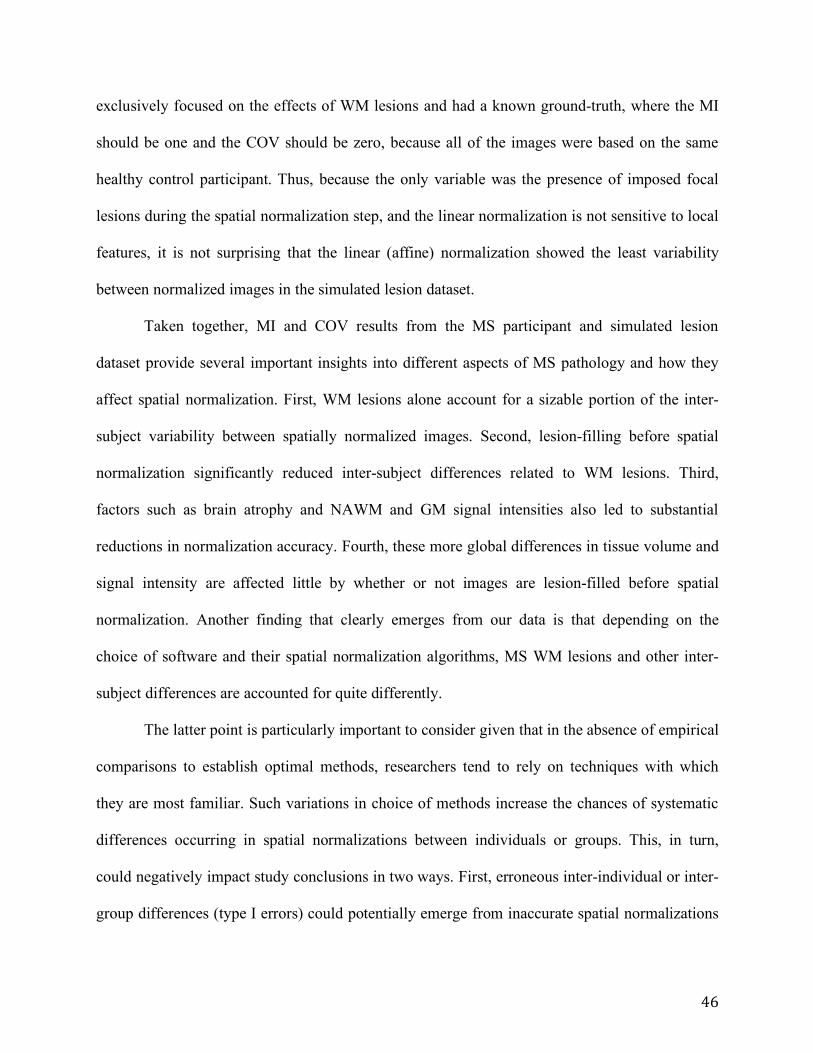
46
exclusively focused on the effects of WM lesions and had a known ground-truth, where the MI
should be one and the COV should be zero, because all of the images were based on the same
healthy control participant. Thus, because the only variable was the presence of imposed focal
lesions during the spatial normalization step, and the linear normalization is not sensitive to local
features, it is not surprising that the linear (affine) normalization showed the least variability
between normalized images in the simulated lesion dataset.
Taken together, MI and COV results from the MS participant and simulated lesion
dataset provide several important insights into different aspects of MS pathology and how they
affect spatial normalization. First, WM lesions alone account for a sizable portion of the inter-
subject variability between spatially normalized images. Second, lesion-filling before spatial
normalization significantly reduced inter-subject differences related to WM lesions. Third,
factors such as brain atrophy and NAWM and GM signal intensities also led to substantial
reductions in normalization accuracy. Fourth, these more global differences in tissue volume and
signal intensity are affected little by whether or not images are lesion-filled before spatial
normalization. Another finding that clearly emerges from our data is that depending on the
choice of software and their spatial normalization algorithms, MS WM lesions and other inter-
subject differences are accounted for quite differently.
The latter point is particularly important to consider given that in the absence of empirical
comparisons to establish optimal methods, researchers tend to rely on techniques with which
they are most familiar. Such variations in choice of methods increase the chances of systematic
differences occurring in spatial normalizations between individuals or groups. This, in turn,
could negatively impact study conclusions in two ways. First, erroneous inter-individual or inter-
group differences (type I errors) could potentially emerge from inaccurate spatial normalizations

47
due to invalid comparisons between different structures or tissue types. Second, sensitivity to
true inter-individual or inter-group differences could be obscured (type II errors) due to
inconsistently localized effects. Because spatial normalization represents a critical early step in
the analysis pipeline, measures should be taken to ensure it is performed optimally.
Although we found that different spatial normalization approaches had significantly
different effects on lesion volumes, these differences were small, and our findings confirmed that
none of the methods evaluated in our tests severely mishandled focal WM lesions (e.g., by
systematically shrinking their volume to zero) even when lesion-filling was not performed. This
served as an important quality assurance check within the current study, and also provided an
important verification for both previous and future studies of MS and other WM disorders.
Finally, the results of our single subject example highlight how different spatial
normalization methods can produce very different volume estimates for individual brain
structures. Moreover, the maps of spatial overlap, and the DSC calculations show that the shapes
(3D locations) of the atlas-based brain parcellations are also quite different, falling below
previously established thresholds of DSC > 0.7 for ‘good’ agreement between the resulting
segmentations113. Therefore, in addition to affecting deformation-based volumetric estimates, the
choice of spatial normalization algorithm will substantially affect neuroimaging-based
comparisons between individuals and groups.
3.7 Study Limitations
This study has some notable limitations. First, we investigated only five of the available
spatial normalization approaches for brain MRI data. These particular approaches were chosen
because an exhaustive comparison between all available methods was not feasible, and these five
are among the most common spatial normalization approaches used in contemporary

48
neuroimaging studies. Moreover, all five algorithms are included in software packages that are
freely available. However, it is possible that another existing method would have out-performed
the algorithms currently tested. Second, and also for feasibility-related reasons, each spatial
normalization approach was only tested using the default parameters within its respective
software package (unless otherwise noted), although some of the methods have several
modifiable parameters. The rationale for this was that the developers of each algorithm set the
default parameters based on internal testing and optimization; and because most researchers use
these default settings, this likely provided the most common real-world set-up for each software
package. Nonetheless, future studies could conduct further testing with different internal
parameters (e.g., spatial resolution, smoothing, etc.) to further refine spatial normalization
accuracy and overall pipeline performance. Third, only one lesion-filling approach was tested.
Given that the primary focus of the study was on spatial normalization algorithms, a detailed
comparison between different lesion-filling approaches was beyond the scope of the current
study. Our testing showed relatively modest differences depending on whether images were
lesion-filled or not compared to the larger differences based on which software package and
normalization algorithm was used. Nonetheless, our results may have differed somewhat if we
had used other lesion-filling approaches and this could be examined in future work focused on
that topic. Fourth, because multiple software packages were used and each one comes with its
own MNI template that includes different image dimensions and spatial resolutions, we first
resampled each template to 1.0 mm cubic resolution when necessary in order to eliminate this as
a variable between methods. However, for FSL (FNIRT) and SPM (CAT12), we also re-ran all
of the spatial normalizations using their default templates (2.0 mm and 1.5 mm cubic resolutions,
49
respectively), and neither the resulting COV maps nor the resulting lesion volumes differed
substantively from the results obtained from the higher resolution normalizations.
3.8 Conclusions
Our findings indicate that nonlinear warping methods systematically outperformed linear
(affine) spatial normalizations and that the SPM (CAT12) algorithm proved to be the most robust
among the methods tested, particularly when using lesion-filled images. We therefore suggest
that future MS brain imaging studies use SPM (CAT12) and lesion-filling for optimal spatial
normalizations. This should yield more accurate voxel-wise and ROI-based comparisons
between MS individuals or groups within each study, and the adoption of a uniform image
processing pipeline will allow for more accurate comparisons between studies and facilitate
future meta-analyses.
3.9 Acknowledgements
This work was supported by the Waugh Family Foundation Multiple Sclerosis Society of
Canada operating grant (EGID-2639), The Canadian Institutes of Health Research (THC-
135234), The Winnipeg Health Sciences Centre Foundation (HSCF), The Natural Sciences and
Engineering Research Council of Canada (NSERC), and the Brain Canada Foundation. RAM
also receives support through a Manitoba Research Chair, as well as a Waugh Family Multiple
Sclerosis Research Chair.

50
3.10 Figure Captions
Figure 3.1: Comprehensive image-processing pipeline for warping the T1w MRI images and
lesion masks from each participant to the Montreal Neurological Institute (MNI) brain template.
Spatial normalizations were performed using five commonly used algorithms, both before and
after lesion-filling the T1w images. Note: Axial brain images are displayed in neurological
convention (left=left); NAWM: normal appearing white matter, LST: lesion segmentation
toolbox, LGA: lesion growth algorithm, Non-LF: non lesion-filled, LF: lesion-filled.
Figure 3.2: T1w images (without lesion-filling), along with the corresponding spatially
normalized images using linear (affine), MRIStudio nonlinear (LDDMM), FSL nonlinear
(FNIRT), ANTs nonlinear (SyN), and SPM nonlinear (CAT12) algorithms for three randomly-
selected participants with MS chosen to highlight how heterogeneous white matter pathology can
be, including: Participant A) a large left posterior white matter lesion, Participant B) a small
right anterior lesion, and Participant C) substantial white matter atrophy and bilateral anterior
lesions. Note: Axial brain images are displayed in neurological convention (left=left); all four
nonlinear normalization approaches clearly outperform linear normalization for aligning
subcortical structures, including white matter.
Figure 3.3: Box-Whisker plots of mutual information (MI) values based on images from each
normalization approach before and after lesion-filling: a) participant data, c) simulated data
with p-values indicating within-algorithm differences before vs. after lesion-filling.
Corresponding p-values of between-algorithm differences are presented in (b, d). Note: green
boxes = non lesion-filled data; blue boxes = lesion-filled data, shaded cells in 2b and 2d indicate
p-values £ 0.05 (Bonferroni corrected).

51
Figure 3.4: Between-participant coefficient of variation (COV) maps based on each
normalization approach before and after lesion-filling: a) participant data and b) simulated
data. Whole-brain average COV values are shown for each approach, where higher COV values
indicate greater between-participant variability.
Figure 3.5: Box-Whisker plots of lesion volumes based on each normalization approach before
and after lesion-filling: a) participant data, c) simulated data with p-values indicating within-
algorithm differences before vs. after lesion-filling. Corresponding p-values of between-
algorithm differences are presented in (b, d). Note: green boxes = non lesion-filled data; blue
boxes = lesion-filled data, shaded cells in 4b and 4d indicate p-values £ 0.05 (Bonferroni
corrected).
Figure S1: ROI volume estimates of two deep GM structures (caudate and thalamus) and two
deep WM structures (genu and splenium of the corpus callosum) based on each normalization
approach for a single participant with MS (a), along with subject-space masks of the four
regions overlaid for the two most similar normalization approaches (b) and dice similarity
coefficient (DSC) values of spatial overlap between all methods.
Table S1: Spatial normalization processing times for each participant.

52
Network-based measures of white matter microstructure reflect individual differences in executive function among persons with MS
Running Title: Network-based MRI measures of executive function in MS Abstract Word Count: 410 Manuscript Word Count: 5431 (excluding the Abstract, Table/Figure Captions and References) Number of Primary Tables and Figures: 5 Tables; 1 Figure Number of Supplementary Materials: 0 Supplementary Figures and 0 Supplementary Tables Keywords: Multiple Sclerosis; MRI; WM; GM; NAWM; DTI; MD; FA; Structural; Functional; Connectivity; Executive Function; DMN; ECN; DKEFS; CWIT;

53
4.1 Abstract
Background: Prior studies in MS have shown relationships between cognitive performance and
resting-state functional connectivity in distributed, large-scale brain networks – specifically the
executive control and default mode networks (ECN and DMN). The DMN is a highly consistent
cognition-related cortical network involving several brain regions which supports the default-
mode activity of the human brain. However, relationships between cognition, particularly
executive function (EF), and white matter structural connectivity underlying these networks
remain poorly understood.
Objectives: We aimed to use recently released functionally-defined white matter atlases to
investigate relationships between EF and tissue microstructure throughout ECN and DMN white
matter in an MS cohort. Our priori hypothesis was that white matter microstructure in these
networks would be positively correlated with EF.
Methods: We obtained 3 Tesla high angular resolution diffusion imaging (HARDI), cognitive
test scores and baseline demographic data from 103 MS participants enrolled in the Comorbidity,
Cognition and Multiple Sclerosis (CCOMS) Study. White matter integrity was assessed using
HARDI-based mean diffusivity (MD) and fractional anisotropy (FA) values extracted from ECN
and DMN regions via the UManitoba-JHU Functionally-Defined Human White Matter Atlases.
EF was assessed using the Delis-Kaplan Executive Function System Color-Word Interference
Test (DKEFS CWIT). One-tailed Spearman partial correlations were performed between ECN
and DMN white matter microstructural metrics vs. EF; correcting for age, sex, and premorbid
cognitive ability using the Wechsler Test of Adult Reading (WTAR). Post-hoc tests were then
performed, using MD values from each participant’s global white matter mask, to determine
whether (and to what extent) the network-based white matter analyses were more predictive of
EF.

54
Results: EF scores were significantly correlated with individual differences in white matter MD
measurements obtained from both the ECN (rho = 0.192; 95% CI = 0.029 to 0.345; p = 0.029)
and DMN (rho = 0.194; 95% CI = 0.031 to 0.347; p = 0.027), but not those obtained from global
white matter (rho = 0.106; 95% CI = -0.059 to 0.266; p = 0.147) after correcting for age, sex and
WTAR. None of the FA values (extracted from either the DMN or ECN) yielded statistically
significant correlations with EF after correcting for age, sex and WTAR.
Conclusions: Within our MS cohort, reduced executive functioning was associated with
increased MD (decreased microstructure) throughout ECN and DMN white matter networks, but
not with global white matter MD measures. These findings indicate that network-based analytic
approaches are valuable for studying how participant-specific measures of white matter damage
correspond to symptomatic variability among persons with MS.

55
4.2 Introduction:
Multiple sclerosis (MS) is a chronic inflammatory disease, characterized by multifocal,
demyelinated white matter (WM) lesions, and diffuse WM damage throughout normal appearing
WM (NAWM)17,114. The widespread and variable spatial distribution of these lesions throughout
the central nervous system (CNS) results in a range of commonly experienced clinical
symptoms; some of which include motor, sensory, visual and cognitive deficits115. Cognitive
deficits in particular affect about 40-70% of MS patients, with about 15-20% having deficits in
higher order executive functions (EF) - rendering it difficult to perform normal daily activities
and maintain social functioning116,117,118. This is largely due to EF impairments affecting
planning, reasoning, problem solving, decision making, multitasking, working memory, and
inhibition to list a few – all of which are essential for normal daily functioning. As a result,
deficits in EF are among the most frequently reported and the most disabling119,120. This has been
supported extensively in the literature, whereby numerous studies have found MS patients to
have systematically lower EF performance than healthy controls. In addition, some brain
imaging studies have found general MRI measures, such as WM hyperintensity volume, to be
associated with cognitive impairment, and in particular lower EF and episodic memory121; while
other studies have reported associations between EF and more localized MRI measures in
frontal subcortical WM tracts involving anterior thalamic radiation74. Nonetheless, while it is
generally agreed that structural damage in MS is linked to cognitive performance, reliable
associations between MRI measures and specific types and severities of clinical deficits have
remained elusive. In fact, the relatively weak correlations between traditional MRI markers (e.g.,
number of lesions and lesion volume) and the severity of specific clinical deficits like EF – not to
mention limited prognostic value for future decline – at the individual level has been dubbed the
clinic radiological paradox30,40,41,122.

56
That said, it is not to say that progress has not been made in identifying potential
structural MRI correlates of cognition and EF in MS. One study looking at cognitive function
(broadly defined) found significant MRI differences between MS patients with and without
cognitive impairment123. Another recent study has even reported associations between structure
and longitudinal cognitive decline, but was only able to achieve this by relying on complex,
multivariate statistical models that combined several MRI measures, including regional brain
volumes and microstructural measures124. Other studies using graph theoretical approaches have
also successfully identified structural MRI changes associated with cognitive performance in
MS115. However, no studies to date have identified a clear neural correlate of EF dysfunction in
MS using a single structural MRI measure.
Extensive work has however been done over the past decade using functional MRI
(fMRI), which has revealed that the human brain is organized into large-scale functional
networks that subserve different mental processes, and that many of these networks appear to be
altered by MS125. Some studies have found strong associations between network-based
functional connectivity in the default mode network (DMN) and executive control network
(ECN) and specific markers of cognitive performance and EF125. There has also been evidence of
altered functional connectivity in deep GM regions and within-network coherence decreases in
MS126. Evidence has also been presented with altered resting-state fMRI connectivity patterns
compared to healthy controls in the visual network (VN), sensorimotor network (SMN) and
DMN127. Interestingly, functionally-defined WM atlases have recently been created and made
freely-available for many of these same networks, including the DMN and ECN– allowing
network-based structural MRI measures to be easily quantified and investigated77,128.

57
Therefore, the goal of the present study was to use a large and representative MS cohort
to investigate the relationships between EF and WM microstructure using a network-based
approach in the DMN and the ECN. We anticipate that this network-based approach will be
sensitive to individual differences in EF and in turn, lead to the identification of a single
structural MRI correlate of EF impairment in MS. In particular, we hypothesize that there will be
a positive association between EF impairment and structural connectivity in the DMN and ECN
networks, whereby participants with higher EF will have lower MD values and higher FA values,
such that lower microstructural integrity will be associated with poorer cognitive performance.
4.3 Methods
4.3.1 Study Participants
This study protocol has been approved by The University of Manitoba Health Research
Ethics Board (HREB). Prior to enrollment, written consent was provided by all 111 participants
involved in this study. Participants with definite MS were recruited through the Winnipeg Health
Sciences Centre MS Clinic and had been previously diagnosed by a neurologist based on the
revised McDonald criteria39. Of the 111 participants recruited, 93 of them had relapsing
remitting MS (RRMS), 12 had secondary progressive MS (SPMS), and 6 had primary
progressive MS (PPMS). Study inclusion criteria required all participants to be 18 years or older,
provide written informed consent, have adequate knowledge of the English language to complete
the study protocol, have adequate sensorimotor function to complete the cognitive tests, have no
comorbid brain tumors or neurodegenerative diseases, and a stable course of disease (i.e., with
no relapses) and disease modifying therapies (DMTs) for a minimum of 30 days prior to study
enrollment. Study exclusion criteria included contraindications to MRI, such as pacemakers,

58
metallic implants, pregnancy and claustrophobia. Participant characteristics can be found in
Table 4.1.
4.3.2 Clinical assessments
Neuropsychological testing was performed according to standardized instructions by
research coordinators and under the supervision of a single clinical neuropsychologist at the
Health Sciences Centre in Winnipeg, Manitoba. Although a wide range of neuropsychological
tests were administered as a part of the broader Comorbidity, Cognition and Multiple Sclerosis
(CCOMS) study protocol, for the purposes of this study, EF was assessed using the Delis-Kaplan
Executive Function System (DKEFS) Color-Word Interference Test (CWIT) and participant pre-
morbid IQ was estimated using the Wechsler Test of Adult Reading (WTAR).
4.3.2.1 Executive Function System (DKEFS) Color-Word Interference Test (CWIT)
The DKEFS battery is made up of nine tests, which include the Trail Making, Verbal
Fluency, Design Fluency, CWIT, Card Sorting, 20 Questions, Word Context, Tower Test and
Proverbs70. All nine tests provide 20 primary scores. The DKEFS battery as whole uses
standardized versions of several currently used tests to assess a range of executive functions in
adults and children aged 8-89 years old70. Many of the tests, that have been expanded on from
established executive functioning tasks are now more sensitive to subtle changes in cognitive
functioning. Though the DKEFS has been deemed to be a robust measure of EF in MS, it has
also been well suited in assessing EF impairment in other clinical patient populations such as
Parkinson’s disease129, unilateral brain damage130, Korsakoff syndrome131 and schizophrenia73 to
list a few.
The present study used scores obtained from the DKEFS CWIT. This test in particular
has been designed around the classic Stroop test, which works to measure the ability to inhibit a

59
dominant and automatic response to provide a more intentional response - ultimately assessing
verbal inhibition. However, the CWIT’s inhibition/switching trial is unique to the DKEFS
version of the Stroop task, and was added to also assess higher order abilities of set switching.
The CWIT test works such that, for half of the items in the inhibition/switching task, participants
are instructed to name the color of the ink the words are printed in. A rule change is instituted for
the other half of the items that requires participants to instead read the actual word, therefore
requiring participants to switch back and forth between the automatic response and the
intentional response while keeping track of the rule changes. Scores are given based on the total
completion time for a fixed number of trials, so that (all else being equal) higher scores indicate
lower EF132. However, to control for individual differences in basic information processing speed
and focus more exclusively on the higher-level inhibition and switching components, each
participant’s EF was defined in this study as the contrast between the CWIT inhibition/switching
task vs. the average of the baseline color naming (Condition 1: where participants name the
colors of ink swatches as quickly as possible) and word reading (Condition 2: where participants
read color names printed in black and white as quickly as possible) tasks133.
4.3.2.2 Wechsler Test of Adult Reading (WTAR)
The Wechsler Test of Adult Reading (WTAR) is a neuropsychological test that relies on
mental abilities that are thought to remain largely unaffected following many types of
neurological damage, and is often used to estimate pre-morbid Wechsler Adult Intelligence Scale
IQ and Wechsler Memory Scale index scores. The format of this test requires participants to read
50 words out loud that are presented to them on a card. Their scores from their test are then
converted into estimates of pre-morbid IQ/memory, which can then be corrected for (along with
other factors such as age and sex) in subsequent statistical analyses.

60
4.4 Functionally-Defined White Matter Atlases
Although several studies have looked at fMRI vs. cognition relationships in large scale
functional networks, the present study worked to overcome gaps in the literature by investigating
structural connectivity vs. EF relationships in these same networks. To do so, this study made
use of the recently released functionally-defined probabilistic WM atlases
(https://www.nitrc.org/search/?type_of_search=group&q=UManitoba-JHU+Functionally-
Defined+Human+White+Matter+Atlas), to measure WM signals in regions that are thought to
underlie specific networks associated with cognitive and executive domains: namely the dorsal
and ventral default mode networks (dDMN, vDMN), and the left and right executive control
networks (lENC, rENC)77. For the purposes of this study, these will be used to conduct
subsequent region of interest (ROI) MRI analyses (described below) to examine the relationships
between structural connectivity and cognition within specific networks pertaining to EF in MS.
4.5 Magnetic Resonance Imaging (MRI)
4.5.1 Data Acquisition
Brain imaging data used in this study were acquired using a 3T Siemens TIM Trio MRI
system (software version VB17a) equipped with a Siemens TQ-Engine gradient set and a
Siemens 32-channel receive-only head coil (Siemens Healthcare, Erlangen, Germany). For each
participant, their MRI session included a T1-weighted (T1w), T2-weighted fluid attenuated
inversion recovery (T2-FLAIR), and high angular resolution diffusion imaging (HARDI)
sequences.
4.5.2 T1w Anatomical Scans
Whole-brain T1w images were acquired using a 3D magnetization prepared rapid
acquisition gradient-echo (MPRAGE) sequence with the following parameters: repetition time

61
[TR] = 1900 ms, echo time [TE] = 3.46 ms, inversion time [TI] = 900 ms, flip angle = 9˚,
GRAPPA = 2, matrix size = 256 × 256, Field of View [FOV] = 250 × 250 mm2, number of
slices = 176, slice thickness = 0.98 mm, band width [BW] = 170 Hz/Px, echo spacing [ESP] =
8.4 ms, reconstructed spatial resolution = 1.0 × 1.0 × 1.0 mm3, acquisition time [TA] = 4.26
min.
4.5.3 Fluid Attenuated Inversion Recovery (FLAIR) Scans
T2-weighted (T2w) images with water suppression were acquired with an axial 2D Fluid
Attenuated Inversion Recovery (FLAIR) turbo spin-echo sequence with the following
parameters: TR = 9000 ms, TE = 100 ms, TI = 2499 ms, flip angle = 90˚, refocusing angle =
130˚, matrix size = 256 × 256, FOV = 240 × 240 mm2, number of slices = 32, slice thickness =
4.00 mm, BW = 287 Hz/Px, ESP = 7.17 ms, turbo factor = 16, BW= 287 Hz/Px, number of
averages = 1, spatial resolution = 0.94 × 0.94 × 4.00 mm3, TA = 5.06 min.
4.5.4 High Angular Resolution Diffusion Imaging (HARDI) Scans
Fifty non-collinear diffusion-encoded (b=1500 s/mm2) and five uniformly-interleaved
reference (b=0 s/mm2) images were acquired with an optimized q-space sampling
scheme134;http://www.emmanuelcaruyer.com/q-space-sampling.php) and the Human
Connectome Project multi-band echo planar imaging (MB-EPI) “cmrr_mbep2d_diff” sequence
developed at the Center for Magnetic Resonance Research135,136; Release R016 for VB17A,
University of Minnesota, (https://www.cmrr.umn.edu/multiband). The following were imaging
parameters for this spin-echo MB-EPI sequence: TR = 3284 ms, TE = 89.4 ms, flip angle = 90°,
refocusing angle = 177°, matrix size = 106 × 102, FOV = 212 × 204 mm2, number of slices =
80, slice thickness = 2.00 mm, MB factor = 4, number of averages = 1, BW = 1814 Hz/Px, ESP
= 0.69 ms, phase partial Fourier = 6/8, spatial resolution = 2.00 × 2.00 × 2.00 mm3, TA = 6:34

62
min. However, this sequence was acquired twice, with opposite phase encoding directions – i.e.,
anterior-posterior (AP) and then posterior-anterior (PA) – for a total of 100 diffusion-weighted
images (b=1500 s/mm2), 10 reference images (b=0 s/mm2), and an overall TA = 13:08 min.
4.5.5 Data Processing
In terms of HARDI data processing, all diffusion-weighted data were preprocessed using
the Artifact Correction In Diffusion MRI (ACID) Toolbox in SPM12 (version
63cc617;http://www.diffusiontools.com), which included both simultaneous motion and eddy
current correction. This was based on whole-brain affine registrations137. EPI distortion
correction was based on the oppositely phase-encoded (blip-up/blip-down) diffusion images and
the Hyperelastic Susceptibility artifact Correction (HySCo) algorithm138. Whole-brain FA and
MD maps were generated using the Fit Diffusion Tensor module and the robust weighted least-
squares fitting algorithm to automatically down-weight potential remaining outliers in the
diffusion signal139. These maps were first coregistered to the MPRAGE image, and later had the
overall deformation field using the CAT12 Toolbox applied to them, as shown to be optimal in
Chapter 3.
4.5.6 Region of Interest Analyses
A region of interest (ROI) analysis was performed to better understand the relationships
between structural connectivity and cognition within specific networks pertaining to EF in MS.
To do so, we first spatially normalized each participant’s MD and FA maps to the MNI template
using SPM CAT12 – the optimal method for spatial normalization in the presence of MS lesions,
as identified in Chapter 3. For each participant, we used ROIEditor within MRIStudio to extract
MD and FA values from the dDMN, vDMN, lECN, and rECN regions included in the
UManitoba-JHU Functionally-Defined Human WM Atlas, and then calculated the average DMN

63
and ECN values (by taking the average between the dDMN and vDMN sub-networks and the
average between the lENC and rECN sub-networks, respectively).
4.6 Quality Assurance and Outlier Rejection
Prior to performing any statistical tests, we first subjected our data to a number of quality
assurance checks. Of the 111 participants, 7 were excluded from this study due to diffusion
acquisition errors and therefore corrupted images. One additional participant was further
excluded due to an outlier in the neuropsychological data. To do so we searched the remaining
DKEFS CWIT scores for outliers in MATLAB using the built-in ‘rmoutliers’ function with
default values to remove any participants with a CWIT inhibition/switching contrast greater than
3 standard deviations from the mean. This resulted in the removal of one additional participant,
bringing the number of remaining participants to 103.
4.7 Statistical Analyses
The primary measures of interest in this study were each participant’s EF score (defined
as the contrast between the DKEFS inhibition/switching task vs. the average of the baseline color
naming and word reading tasks), MD values from the DMN and ECN, FA values from the DMN
and ECN; and covariates to be used as regressors which included each participant’s age, sex and
WTAR score. Two-tailed conventional Spearman correlations were first performed to
characterize the dataset and determine the extent to which each of the continuous variables were
correlated; and because sex is a discrete variable, two-tailed Mann-Whitney U-Tests were
performed to assess whether any of the continuous variables showed any categorical sex
differences.
Then, because we had a priori directional hypotheses regarding the MD vs. EF and FA
vs. EF relationships, we conducted one-tailed Spearman partial correlations in MATLAB using

64
the built in ‘partialcorr’ function to assess relations between the DMN and ECN WM
microstructural measures and individual differences in EF, correcting for age, sex and WTAR
scores.
4.8 Post-Hoc Analysis
Following the initial DMN and ECN analyses, post-hoc tests were then performed to
evaluate whether, and to what extent, the use of this network-based WM approach yielded
greater sensitivity to differences in EF than would have been found using a more global MRI
measure of WM microstructure. We therefore went back and extracted MD values from the
subject-specific global WM masks that were created during the earlier SPM CAT12 spatial
normalization. After using ROIEditor in MRIStudio to extract the MD values from each
participant’s unique WM mask, we then performed one-tailed Spearman partial correlations
between these values and EF, correcting for age, sex and WTAR scores. This was therefore
analogous in every way to our previous analysis, except that MD values were based on global
WM, rather than the network-based ECN and DMN WM segmentations.
We then compared the resulting correlations based on this global post-hoc approach with
the correlations based on our initial network-based approach using the Meng test of dependent
correlations with overlapping variables140. This was done using version 1.1-3 of the freely-
available CoCor software package141 which is available as either a toolbox for the R programing
language (https://cran.r-project.org/web/packages/cocor/) or as an interactive web plug-in
(http://comparingcorrelations.org/).
4.9 Results
Table 4.1 depicts participant characteristics. Figure 4.1 depicts the raw DKEFS 4
contrast vs. the raw MD and FA values in each network. These correlations seen in the scatter

65
plots in Figure 4.1, as expected indicate a positive correlation between DKEFS 4 scores and MD
values within both the DMN and ECN.

66
Moreover, values for the one-tailed Spearman partial correlations and the adjusted
correlation and its 95% CI can be found in Table 4.2 The one-tailed Spearman partial
correlations suggested that in the DMN, when we contrasted DKEFS 4 vs. MD, we found Pc =
0.0270. Similarly, in the ECN, for DKEFS vs. MD, Pc = 0.0270. Similar trends in contrast, were
not found for FA. We first looked at the DMN, where we compared DKEFS vs. FA and found Pc
=0.2294. Similarly, in the ECN, for DKEFS vs. FA, Pc =0.5077.

67
Conventional direct two-tailed Spearman Correlations, can be seen in Table 4.3a-c.
When looking at specific networks like the DMN, for MD vs. DKEFS, p=0.0026 and for MD vs.
Age, p=0.0017, we found both to be statistically significant. Similarly, when looking at the ECN,
similar associations were found with MD. For MD vs. DKEFS, p=0.0019 and for MD vs. Age,
p=4.70E-04. However, in both the DMN and ECN networks, MD vs. WTAR did not yield
statistically significant correlations.

68
Using a two-tailed Mann-Whitney U-Test, as seen in Table 4.4a-c we compared the
independent variable of Sex vs. DKEFS, p=0.83, Sex vs. Age, p=0.26, and Sex vs. WTAR,
p=0.86 – all of which were network independent, and found there to be no significant effects

69
overall and therefore a lack of a Sex effect generally. We then wanted to investigate whether the
results would be the same when comparing Sex to FA and MD within the DMN and ECN. Based
on this, we found that within the DMN, Sex vs. FA, p=0.98 and Sex vs. MD, p=0.77, was
aligned with previous findings – lacking an overall sex effect. Similarly, when investigating the
effects of Sex in the ECN, we found similar results; such that Sex vs. FA, p=0.94 and Sex vs.
MD, p=0.40 which ultimately also proved to have no statistically significant results. Taken
together, the two tailed Mann-Whitney U-Tests indicated that there was a lack of a sex effect.
70
4.10 Discussion
This study used a large and representative MS cohort to investigate whether relationships
could be identified between EF impairment and microstructure in two functionally defined WM
brain networks, namely the DMN and the ECN. As expected, EF scores were significantly
correlated with individual differences in WM MD measurements obtained from both networks.
The use of recently released functionally-defined WM atlases to investigate this relationship,
appeared to be more sensitive to individual differences in EF impairment than corresponding
global WM measures. Overall, our findings indicated that these network-based measures
represented more straightforward and easily-interpretable structural MRI correlates of EF in MS
compared to previous structural MRI studies.
The findings presented in this study on the association between structural connectivity
and EF dysfunction suggest a clear association between cognitive impairment (EF impairment in
particular) and WM microstructure in the DMN and ECN networks - which also happens to be
aligned with much of the functional connectivity literature. For instance, several fMRI studies
have investigated the role of the DMN and presented evidence of altered DMN functional
connectivity in MS125,142, although not necessarily in early CIS143. Further evidence has also been
presented by Bonavita et al., who reported a complex reorganization pattern of the DMN, in
relation to cognitive dysfunction144. Neuroimaging studies have also supported an association
between both DMN and ECN functional connectivity and changes in cognitive status of MS
patients145. In fact, one study by Roosendaal et al. reported that patients with CIS compared to
HCs, showed significantly higher synchronization in the ECN which supports the hypothesis of
increased resting state networks functional connectivity changes being a possible compensatory
mechanism for widespread brain tissue damage caused by MS143.

71
In some studies combining fMRI and DTI, DMN functional connectivity has also been
shown to differ between MS and healthy controls, as well as between cognitively impaired and
cognitively preserved MS participants; and where functional connectivity in the MS group
appeared to correlate with diffusion imaging measures in the corpus callosum and the cingulum
WM146. Similarly, a study by Hawellek et al., reported that the DMN exhibited increased
functional connectivity that was correlated with cognitive ability among MS participants, despite
the presence of large and widespread reductions in DTI-based measures throughout the central
WM125. These studies therefore also tend to support the hypothesis that increased resting state
activity and functional connectivity might be a compensatory mechanism for widespread WM
damage147. However, fMRI studies of MS have tended to investigate cognitive impairment (more
broadly defined), rather than focusing in on EF impairment, and even those combining fMRI and
diffusion imaging have unfortunately not applied similar network-based analytic approaches to
investigate the microstructure of the DMN or other large-scale brain networks.
Previous studies examining associations between specific cognitive domains and
structural connectivity, have done so using DTI as a measure of WM integrity in MS. These
studies have, however, used different study populations, cognitive testing batteries, and other
experimental approaches, which has led to discrepancies and inconsistent findings in the
literature. For instance, one study reported an association between reduced FA and impaired
performance on a task of planning and organization50. One year later, another study then reported
contrasting results, since their study failed to find any significant relationships between FA and
behavioral performance using a sorting task69.
More recently, however, there has been more agreement in the literature whereby DTI
studies have now begun to report overlapping findings of disrupted structural integrity in various

72
WM tracts in MS, including the optic radiation, the corpus callosum and the corticospinal tract.
However, many of those studies used relatively weaker associations, whereby they correlated FA
changes to EDSS scores using a VBM approach148. One study that looked at specific functional
brain works, similar to this current study was by Shu et al., whereby they used DTI tractography
and a sample size of 39, and reported reduced network efficiency in the WM structural networks
in MS using graph theoretical measures. Through correlating topological efficiencies with EDSS
scores and disease durations, they found pronounced changes in the sensorimotor, visual, DMN
and language areas. Despite these findings, in contrast to the present study, that study lacked a
clear one-to-one correlation, as they investigated a series of cognitive deficits throughout various
networks, rendering it difficult to isolate the effects of EF. Therefore, in contrast to that study,
the present study’s findings of decreased microstructural integrity (as measured by MD) within
both networks being associated with poorer EF performance, which was measured through
Condition 4 of the DKEKS CWIT – the most cognitively demanding tasks, allowed us to isolate
the effects of EF dysfunction. Together, our large sample size, network-based approach and use
of a robust neuropsychological measure to assess EF overcame many of the gaps in the literature.
That said, although many of the aforementioned studies had small sample sizes, used 1.5T MRIs,
and did not investigate DTI relationships between WM integrity and structural integrity and EF
function in MS, one study by Llufriu et al., reported associations between structural networks
and FA in attention and EF, assessed with the Paced Auditory Serial Addition Test (PASAT) and
Symbol Digit Modality Test (SDMT) – of which attention, auditory, working memory,
information processing speed and visual attention could be examined. Their findings were in line
with the aforementioned studies in MS, whereby structural brain network is less efficient due to
widespread impairment of WM connections and GM structures117. In fact, one recent study

73
published in 2019 found widespread reduction in the structural integrity of the brain network in
MS, even in the absence of cognitive decline149. Based on these aforementioned studies, it is
clear that little is known about the relationship between EF and microstructure throughout the
DMN and ECN WM.
Although anatomically-defined WM atlases have been used in many previous studies of
MS, ours was the first to use functionally-defined WM atlases to relate structural MRI changes
within specific brain networks to a particular clinical deficit. Based on this, to our knowledge,
this is the first study to use this set of functionally-defined probabilistic WM atlases to uncover
an association between EF impairment and microstructure throughout the DMN and ECN WM.
Moreover, one recent study published in 2019, investigated the associations of DMN and CBL-
DMN structural connectivity with processing speed in 68 MS patients and 22 HCs, as assessed
by the SDMT and mean FA as the weighting factor. Interestingly, this study also employed a
network-based approach, which was moderately analogous to this current study’s approach to
cater to the highly subject-specific cognitive deficits in MS - specifically processing speed. Their
network approach, motivated by describing decline of a specific cognitive domain (i.e.
processing speed), led to significant findings of the role of the cerebellum structural connectivity
to the DMN in information processing speed decline150. Their findings however, unlike the
present study were based on graph theoretical measures as opposed to performing a straight one-
to-one correlation. Nonetheless, their findings, similar to the present study support the notion that
MS-related structural alteration affects network functioning, which in turn lends further support
to the rationale of the present study. Although their focus was processing speed, and not EF, it is
clear that a regionally defined approach can potentially yield more sensitive results.

74
One study by Genova et al. examined the relationship between EF and DTI-based
measures of WM integrity in MS by exploring the association between processing speed and FA.
Although there were some similarities between this study and ours, including the use of DKEFS,
the two studies are in fact quite different in several important ways. First, Genova et al. used both
the DKEFS Trail Making Test (TMT) and the CWIT reporting that performance on both EF
tasks (albeit more so for the TMT than the CWIT) were highly dependent on processing speed74.
However, their sample size was fairly small, including only 25 MS participants and 15 HC’s, and
the groups were not matched for age, which may be relevant given that Denney et al. reported
that age is significantly related to each measure of processing speed151 and DTI measures
(including those in our study) correlate with age. It is also worth noting that the TMT includes a
motor component, so it is possible that the larger effect observed in that test could be due to
confounded motor deficits. Furthermore, the analysis of their brain imaging data was largely
exploratory in nature (i.e., based on a data-driven approach to identify which WM regions
exhibited significant correlations between FA and EF). In contrast, our study employed a sample
size of 103 MS participants, and the brain imaging data analysis was purely hypothesis driven
and based on examining relationships between structural measures throughout two a priori
functionally-defined WM networks.
As mentioned previously, our study also focused on establishing a neural correlate of EF
impairment in particular, something that has been particularly elusive, rather than cognition in
general. Therefore, our approach was more focused compared to studies like Yu et al., where
they assessed cognitive impairment using the SDMT, Rey Auditory Verbal Learning Test
(RAVLT) and PASAT. Their findings, based on 37 MS participants and 20 HC’s, suggested that
lower FA coupled with higher MD values were significantly correlated with each of the three

75
cognitive scores in various brain regions identified via group differences compared to HC’s, with
the strongest associations found with the SDMT – which assesses processing speed and visual
working memory152. However, while their follow-up analysis to correlate individual differences
among MS participants – as opposed to the majority of studies focusing solely on group
differences – is conceptually similar to the approach taken in our study and a handful of others,
including Tovar-Moll et al., who correlated MD in the thalami of 13 RRMS and 11 SPMS
patients with EDSS and PASAT scores153, ours is the first study to employ functionally-defined
WM atlases to perform such correlations. Furthermore, these studies employed numerous
neuropsychological measures to assess a wide range of cognitive domains including visual
working memory and processing speed to list a few154, rather than a single test that was
specifically chosen to evaluate individual differences in EF dysfunction.
4.11 Study Limitations
Our work is not without limitations. Seeing as how this is a cross-sectional study, the
associations presented were not able to grasp EF dysfunction at multiple time points to be able to
determine causation. Therefore, future work should involve performing a longitudinal study on
the associations of EF dysfunction and microstructure to establish a true cause and effect
relationship by observing EF dysfunction over time. By doing so, we can work toward
potentially drawing predictive conclusions. Moreover, our sample of MS participants may have
influenced our results. The effect of this limitation is that some participants may have had more
lesions and in turn greater EF dysfunction than the other participants. Future studies can then
work to use a more representative sample using participants with comparable cognitive abilities.
Another limitation is the use of diffusion based metrics. The effect of this limitation is that, the
present study could not explore myelin specifically and in turn the way it had affected the results

76
and our interpretation of these results. Therefore, future studies may want to employ MWI
techniques to investigate whether it is microstructure driving these EF effects, or if it is myelin
specifically. Another limitation is that the present study only looked at two networks, namely the
DMN and ECN. To overcome this, future studies can then further explore whether structural
connectivity in other functionally-defined brain networks – e.g., the salience network (SN),
which is closely associated with both the DMN and ECN– leads to similar associations as
presented in this study. Moreover, in the present study, we only found an association with one
measure (MD), and not with FA which would have been more in line with some of the functional
connectivity work that had been done. Another limitation is that the focus of the present study
was EF dysfunction and for that reason a single robust test used to assess EF (DKEFS) was
employed. Therefore disability in all cognitive domains were not assessed and further studies
may want to use a network-based approach to investigate other cognitive domains in other
networks. Furthermore, much of the literature correlated processing speed to that of EF decline,
so perhaps taking that into account could have perhaps led to a more extensive assessment of EF.
4.12 Conclusions
Taken together, this study suggests a strong cross sectional association between a single
MRI metric related to EF in MS. Specifically, we found that EF impairment was strongly
correlated with individual differences in MD values within the DMN and ECN networks. In
addition to identifying a possible neural correlate of EF in MS, these promising results
potentially pave the way for future longitudinal studies to employ similar network-based analytic
approaches to better understand how cognitive processes depend on structural integrity within
specific WM pathways, and to determine if these methods could be helpful in predicting future
cognitive decline among persons with MS.

77
4.13 Acknowledgments
This work was supported by the Waugh Family Foundation Multiple Sclerosis Society of
Canada operating grant (EGID-2639), The Canadian Institutes of Health Research (THC-
135234), The Winnipeg Health Sciences Centre Foundation (HSCF), The Natural Sciences and
Engineering Research Council of Canada (NSERC), and the Brain Canada Foundation. RAM
also received support through a Manitoba Research Chair, as well as a Waugh Family Multiple
Sclerosis Research Chair.

78
4.14 Figure Captions
Figure 4.1: Straight correlations were performed as seen in the scatter plots, which indicate a
positive correlation between DKEFS 4 scores and MD values in both the DMN and ECN. The
red points seen on each scatter plot represent an outlier for which a formal outlier rejection was
performed. Note: DKEFS 4 = Delis Kaplan Executive Function System Condition 4, MD =
Mean Diffusivity, FA = Fractional Anisotropy, DMN = Default Mode Network and ECN =
Executive Control Network.
Table 4.1: Participant Characteristics. Note: SD = standard deviation, DKEFS 4 = Delis
Kaplan Executive Function System Condition 4, DKEFS 1 and 2 = Delis Kaplan Executive
Function System Conditions 1 and 2, EDSS: The Expanded Disability Status Scale and WTAR =
Wechsler Test of Adult Reading.
Table 4.2: Results obtained from performing One-tailed Spearman Partial Correlations, after
partialling out the effects of age, sex and WTAR scores. As shown, there were significant partial
correlations between executive function and MD values in both the ECN and DMN, but no
statistically significant partial correlations between executive function and FA in either network.
Note: Rhoval = rho-value, 95% CI = 95% confidence interval, Pval = p-value, DKEFS 4 =
Delis Kaplan Executive Function System Condition 4, MD = Mean Diffusivity, FA = Fractional
Anisotropy, DMN = Default Mode Network and ECN = Executive Control Network.
Table 4.3: Conventional Spearman Correlations (Two-Tailed) were performed after correcting
for age, sex and WTAR scores to determine whether any pair of continuous variables were
correlated. These results suggest statistically significant relationships between MD values and
the two covariates – DKEFS 4 and Age in both networks. In the DMN and ECN networks, MD

79
vs. WTAR did not yield statistically significant correlations. Note: Rhoval = rho value, Pval = p-
value, DKEFS 4 = Delis Kaplan Executive Function System Condition 4, MD = Mean
Diffusivity, FA = Fractional Anisotropy, DMN = Default Mode Network, ECN = Executive
Control Network and WTAR = Wechsler Test of Adult Reading.
Table 4.4: Mann-Whitney Tests (Two-Tailed) were performed to determine whether any of the
continuous variables showed a categorical sex difference. These results indicate that there were
no significant effects overall and therefore a lack of a sex effect generally. Note: Rhoval = rho
value, Pval = p-value, DKEFS 4 = Delis Kaplan Executive Function System Condition 4, MD =
Mean Diffusivity, FA = Fractional Anisotropy, DMN = Default Mode Network, ECN =
Executive Control Network and WTAR = Wechsler Test of Adult Reading.

80
Summary

81
5.1 Discussion
To briefly recap, the purpose of this thesis was to: 1) compare spatial normalization
methods on brain MRI data in the presence of MS lesions using real and simulated data to
identify an optimal approach for comparing quantitative structural imaging metrics across
participants, and 2) use this robust spatial normalization method to investigate the relationships
between EF and microstructure throughout the DMN and ECN WM using recently released
functionally-defined WM atlases. Together, these two objectives worked to expand our
understanding of best-practices in MRI data analysis and the variability in cognitive functioning
among persons with MS.
The rationale for investigating the first objective in this thesis was to overcome the
absence of an established ‘best’ practice guideline for spatially normalizing brain imaging data in
the presence of MS pathologies. Although studies on spatial normalization algorithms and brain
templates have been developed for neurologically healthy adults, no studies have compared
spatial normalization methods in the presence of MS-related pathologies 155. In a similar vein,
several studies in the past also worked to compare different image processing pipelines and
spatial normalization methods on diseases like Alzheimer’s disease, mild cognitive impairment
(MCI), drug-resistant epilepsy and stroke156,157. Together, this then highlighted the need for
identifying an algorithm for MS. Therefore, these findings overcome this gap, by being the first
study to compare the performance of five commonly and freely-available spatial normalization
approaches to ultimately identify the most robust method for spatially normalizing brain imaging
data in the presence of MS lesions. Specifically, this study identified SPM CAT12 as the most
robust algorithm for spatially normalizing MS data among the methods tested, particularly when
using lesion-filled images. Therefore, my findings suggest that future MS imaging studies
(including my subsequent study on structural imaging correlates of EF) should use SPM CAT12

82
and lesion-filling for optimal spatial normalizations. Taken together, these findings will now
enable MS researchers to follow a uniform image processing pipeline for more accurate
comparisons.
The rationale for the second objective in this thesis stemmed from existing knowledge
about relationships between cognitive performance and resting-state functional connectivity in
distributed, large-scale brain networks. Although there is a growing body of literature about
functional brain connectivity in MS, no prior study had looked at the relationships between
cognition, EF and WM structural connectivity within the ECN or DMN – despite the fact that the
WM degeneration is the hallmark of MS pathology. For this reason, the second objective of this
thesis worked to build on the first objective, by using SPM CAT12 to generate our FA and MD
maps, and to then use these imaging metrics in conjunction with recently released functionally-
defined WM atlases to investigate the relationships between cognition, EF and microstructure
throughout the DMN and ECN WM. Our findings from this study did in fact show EF to be
correlated with individual differences in WM MD measurements obtained from both the DMN
and ECN. The implications of these findings are potentially very important, and suggest that
network-based imaging measures should be used in future studies combining MRI and cognitive
assessments among MS patients (including longitudinal studies of cognitive decline).
5.2 Future Directions
Future work can be done on the findings presented in this study by perhaps using
quantitative tract integrity profiles (Q-TIPS) – a novel toolbox created in our lab to estimate
further the microstructural integrity and the trajectories of WM pathways. Since Q-TIPS is a
toolbox that works to perform tract-based analysis by extracting quantitative MRI data along
WM tracts, we could potentially build on the current network-based approach by examining

83
changes throughout the entire ECN and DMN to ultimately determine whether individual
differences in EF can be ascribed to specific WM pathways. It would also be interesting to
examine whether structural connectivity in other functionally-defined brain networks – e.g., the
salience network (SN), which is closely associated with both the ECN and DMN– using the same
functionally defined WM atlases used in this thesis. Based on the significant relationships
identified in our study (i.e., between EF in both ECN and DMN structural connectivity), it would
be interesting to find SN connectivity related to differences in cognitive deficits in MS.
Moreover, this work could also be looked at in sub-networks, such as right vs. left ECN for
instance or right vs. left in the DMN – since both the DMN and ECN seemed to correlate
positively with DKEFS condition 4 scores. In doing so, as opposed to using DTI imaging
metrics, it might be interesting to explore another quantitate MRI imaging measures such as
myelin water imaging (MWI) which has been shown to be more a more specific measure of
myelin.
Moreover, although this study chose to use condition 4 of the DKEFS CWIT that is
thought to measure both task inhibition and switching, future studies could potentially examine
sub-domains of EF (e.g., based on condition 3 of the DKEFTS CWIT to investigate task
inhibition exclusively, or to perform a contrast between condition 4 and condition 3 of the
DKEFS to investigate the switching component, exclusively). It would also be valuable to look
at other non DKEFS measures of cognitive function such as cognitive fatigue, which is a major
issue itself. Since this thesis did find the network-based approach to be more sensitive than
simply using global WM or NAWM values using condition 4, it would be interested to use these
findings in the context of looking exclusively at condition 3’s inhibition or switching component.

84
It would also be valuable to conduct some longitudinal studies looking at cognition, EF
and structural connectivity patterns to see whether the biomarker identified in this study could
have value in predicting future cognitive decline. More broadly, it would be interesting to use
this biomarker for disease diagnosis and the monitoring of the progression of the disease and the
treatment effects. Moreover, since we based these findings on a mixed sample of MS
participants, it would also be interesting to hone in on one type of MS longitudinally. Taken
together, it would be valuable to look into perhaps different ROIs, different MRI measures and
different cognitive measures.
5.3 Conclusions
Over the last few decades, with the advent and widespread availability of Magnetic
Resonance Imaging (MRI) systems, brain imaging has gained an increasing role in both MS
diagnosis and research39. Because of this, the use of more advanced quantitative methods such as
DTI has revolutionized the visualization of WM structures by exploiting the properties of water
diffusion45,51. These advanced quantitative neuroimaging techniques coupled with robust
neuropsychological assessments, together, have paved the way for better understanding the
structural and functional connectivity patterns in the brain. This thesis leveraged the existing
knowledge in the field regarding functionally defined brain networks and the WM architecture of
those networks, to support the relationship between EF and microstructure throughout the DMN
and ECN WM. This thesis has showed that within this MS cohort, EF appeared to be influenced
by individual differences in integrity of underlying WM throughout the DMN and ECN. These
findings suggest that examination of microstructural integrity of functionally-defined WM fiber
tracts can improve our understanding of the variability in cognitive functioning among persons
with MS.

85
REFERENCES: 1. Winsen, L. M. L. Van, Polman, C. H., Dijkstra, C. D., Tilders, F. J. H. & Uitdehaag, B. M.
J. Multiple Sclerosis. Nat. Rev. 391, 4–7 (2010).
2. Visaria, J., Thomas, N., Gu, T., Singer, J. & Tan, H. Understanding the Patient’s Journey
in the Diagnosis and Treatment of Multiple Sclerosis in Clinical Practice. Clin. Ther. 40,
926–939 (2018).
3. Milo, R. & Kahana, E. Multiple sclerosis: Geoepidemiology, genetics and the
environment. Autoimmun. Rev. 9, A387–A394 (2010).
4. Beck, C. a, Metz, L. M., Svenson, L. W. & Patten, S. B. Regional variation of multiple
sclerosis prevalence in Canada. Mult. Scler. J. 11, 516–519 (2005).
5. Golacre MJ, Seagroatt V, Yeates D, A. E. Linkage Study Design.Pdf. Epidemiol.
Community Heal. 58, 142–144 (2004).
6. T, I., WJ, G., W, C. & TM, M. Childhood sun exposure influences risk of multiple
sclerosis in monozygotic twins. Neurology 69, 381-- 388 8p (2007).
7. Hedström, A. K., Olsson, T. & Alfredsson, L. High body mass index before age 20 is
associated with increased risk for multiple sclerosis in both men and women. Mult. Scler.
J. 18, 1334–1336 (2012).
8. Jakimovski, D., Guan, Y., Ramanathan, M. & Weinstock-guttman, B. Lifestyle-based
modifiable risk factors in multiple sclerosis : review of experimental and clinical findings.
9, 149–172 (2019).
9. Jakimovski, D. et al. Dietary and lifestyle factors in multiple sclerosis progression: results
from a 5-year longitudinal MRI study. J. Neurol. 266, 866–875 (2019).
10. Hedström, A. K., Hillert, J., Olsson, T. & Alfredsson, L. Smoking and multiple sclerosis

86
susceptibility. Eur. J. Epidemiol. 28, 867–874 (2013).
11. Camara-Lemarroy, C. R., Metz, L. M. & Yong, V. W. Focus on the gut-brain axis:
Multiple sclerosis, the intestinal barrier and the microbiome. World Journal of
Gastroenterology 24, 4217–4223 (2018).
12. Segal, B. M., Cohen, J. A. & Antel, J. Americas Committee for Treatment and Research in
Multiple Sclerosis Forum 2017: Environmental factors, genetics, and epigenetics in MS
susceptibility and clinical course. Multiple Sclerosis 24, 4–5 (2018).
13. Munger, K. L. et al. Epstein–barr virus and multiple sclerosis risk in the finnish maternity
cohort. Ann. Neurol. 86, 436–442 (2019).
14. Yeshokumar, A., Narula, S. & Banwell, B. Pediatric multiple sclerosis. Nevrol. Zhurnal
22, 64–71 (2017).
15. Hawkes, C. H. & Macgregor, A. J. Twin studies and the heritability of MS: A conclusion.
Mult. Scler. 15, 661–667 (2009).
16. Dyment, A. D., Sadnovich, D. & Ebers, C. G. Genetics of Multiple Sclerosis. in Multiple
Sclerosis Immunology 6, 197–228 (Springer New York, 2013).
17. Wingerchuk, D. M., Lucchinetti, C. F. & Noseworthy, J. H. Multiple sclerosis: Current
pathophysiological concepts. Lab. Investig. 81, 263–281 (2001).
18. Pröbstel, A. & Baranzini, S. E. The Role of the Gut Microbiome in Multiple Sclerosis
Risk and Progression : Towards Characterization of the “ MS Microbiome ”. 126–134
(2018).
19. Jure, L. et al. Individual voxel-based analysis of brain magnetization transfer maps shows
great variability of gray matter injury in the first stage of multiple sclerosis. J. Magn.
Reson. Imaging 32, 424–428 (2010).

87
20. Roman, C. A. F. & Arnett, P. A. Structural brain indices and executive functioning in
multiple sclerosis: A review. J. Clin. Exp. Neuropsychol. 38, 261–274 (2016).
21. Charcot, J.-M. (1825-1893). Histologie de la sclérose en plaques, leçon faite à l’hospice de
la Salpêtrière par M. Charcot et recueillie par M. Bourneville. Gaz Hop 41, 554–5 557–8
(1869).
22. Rocca, M. A. et al. Clinical and imaging assessment of cognitive dysfunction in multiple
sclerosis. Lancet Neurol. 14, 302–317 (2015).
23. Lassmann, H., Brück, W. & Lucchinetti, C. Heterogeneity of multiple sclerosis
pathogenesis: Implications for diagnosis and therapy. Trends Mol. Med. 7, 115–121
(2001).
24. Losseff, N. A. et al. Spinal cord atrophy and disability in multiple sclerosis. A new
reproducible and sensitive MRI method with potential to monitor disease progression.
Brain 119, 701–708 (1996).
25. Bitsch, A. Acute axonal injury in multiple sclerosis: Correlation with demyelination and
inflammation. Brain 123, 1174–1183 (2002).
26. Rovira, A., Auger, C. & Alonso, J. Magnetic resonance monitoring of lesion evolution in
multiple sclerosis. Ther. Adv. Neurol. Disord. 6, 298–310 (2013).
27. Goverover, Y., Chiaravalloti, N. & Deluca, J. The influence of executive functions and
memory on self-generation benefit in persons with multiple sclerosis. J. Clin. Exp.
Neuropsychol. 35, 775–783 (2013).
28. Gold, R. & Wolinsky, J. S. Pathophysiology of multiple sclerosis and the place of
teriflunomide. Acta Neurol. Scand. 124, 75–84 (2011).
29. Filippi, M. & Rocca, M. A. MRI evidence for multiple sclerosis as a diffuse disease of the

88
central nervous system. J. Neurol. 252, v16–v24 (2005).
30. Mollison, D. et al. The clinico-radiological paradox of cognitive function and MRI burden
of white matter lesions in people with multiple sclerosis: A systematic review and meta-
analysis. PLoS One 12, e0177727 (2017).
31. Polman, C. H. Diagnostic criteria for multiple sclerosis: 2005 Revisions to the ‘McDonald
criteria’. J. Neurol. 58, 840–846 (2005).
32. Lublin, F. D. et al. Defining the clinical course of multiple sclerosis. Neurology 83, 278–
286 (2014).
33. Mortazavi, D., Kouzani, A. Z. & Soltanian-Zadeh, H. Segmentation of multiple sclerosis
lesions in MR images: a review. Neuroradiology 54, 299–320 (2012).
34. Sumowski, J. F. et al. Brain reserve and cognitive reserve in multiple sclerosis What you ’
ve got and how you use it. Neurology 80, 2186–93 (2013).
35. Sumowski, J. F., Wylie, G. R., Deluca, J. & Chiaravalloti, N. efficiency in multiple
sclerosis : functional magnetic resonance imaging evidence for cognitive reserve. J.
Neurol. 133, 362–374 (2010).
36. Pinter, D. et al. Higher education moderates the effect of T2 lesion load and third ventricle
width on cognition in multiple sclerosis. PLoS One 9, 6–10 (2014).
37. Amato, M. P. et al. Cognitive reserve and cortical atrophy in multiple sclerosis A
longitudinal study. 1728–1733 (2013).
38. Sumowski, J. F., Wylie, G. R., Chiaravalloti, N. & Deluca, J. Intellectual enrichment
lessens the effect of brain atrophy on learning and memory in multiple sclerosis.
Neurology 74, 1942–1945 (2010).
39. Polman, C. H. et al. Diagnostic criteria for multiple sclerosis: 2010 Revisions to the

89
McDonald criteria. Ann. Neurol. 69, 292–302 (2011).
40. Zapata-Arriaza, E. & Díaz-Sánchez, M. Clinico-radiological dissociation in multiple
sclerosis: Future prospects. World J. Neurosci. 03, 147–153 (2013).
41. Barkhof, F. The clinico-radiological paradox in multiple sclerosis revisited. Curr. Opin.
Neurol. 15, 239–245 (2002).
42. Filippi, M. et al. Association between pathological and MRI findings in multiple sclerosis.
Lancet Neurol. 11, 349–360 (2012).
43. Valverde, S. et al. Quantifying brain tissue volume in multiple sclerosis with automated
lesion segmentation and filling. NeuroImage Clin. 9, 640–647 (2015).
44. Filippi, M. MRI measures of neurodegeneration in multiple sclerosis: implications for
disability, disease monitoring, and treatment. J. Neurol. 262, 1–6 (2015).
45. Assaf, Y. & Pasternak, O. Diffusion Tensor Imaging (DTI)-based White Matter Mapping
in Brain Research: A Review. J. Mol. Neurosci. 34, 51–61 (2008).
46. Horsfield, M. A. Magnetization Transfer Imaging in Multiple Sclerosis. J. Neuroimaging
15, 58S-67S (2005).
47. Prasloski, T. et al. Rapid whole cerebrum myelin water imaging using a 3D GRASE
sequence. Neuroimage 63, 533–539 (2012).
48. Rovaris, M. et al. Diffusion MRI in multiple sclerosis. Neurology 65, 1526–1532 (2005).
49. Oreja-Guevara, C. et al. Progressive Gray Matter Damage in Patients With Relapsing-
Remitting Multiple Sclerosis. Arch. Neurol. 62, 578 (2005).
50. Roca, M. et al. Cognitive deficits in multiple sclerosis correlate with changes in fronto-
subcortical tracts. Multiple Sclerosis 14, 364–369 (2008).
51. Basser, P. J., Mattiello, J. & LeBihan, D. MR diffusion tensor spectroscopy and imaging.

90
Biophys. J. 66, 259–267 (1994).
52. Horn, A. & Blankenburg, F. Toward a standardized structural–functional group
connectome in MNI space. Neuroimage 124, 310–322 (2016).
53. Filippi, M., Rovaris, M. & Rocca, M. A. Imaging primary progressive multiple sclerosis:
the contribution of structural, metabolic, and functional MRI techniques. Mult. Scler. J.
10, S36–S45 (2004).
54. Murray, T. J. Diagnosis and treatment of multiple sclerosis.
55. Thompson, A. J. et al. Diagnosis of multiple sclerosis: 2017 revisions of the McDonald
criteria. Lancet Neurol. 17, 162–173 (2018).
56. Kalkers, N. F. et al. Concurrent validity of the MS Functional Composite using MRI as a
biological disease marker. Neurology 56, 215–219 (2001).
57. Sgm, E., Liu, C. & Ld, B. Edwards(2001)Cognitive correlates of supratentorial atrophy on
MRI in multiple sclerosis.pdf. 214–223 (2001).
58. Chiaravalloti, N. D. & DeLuca, J. Cognitive impairment in multiple sclerosis. Lancet
Neurol. 7, 1139–1151 (2008).
59. Winkelmann, A., Engel, C., Apel, A. & Zettl, U. K. Cognitive impairment in multiple
sclerosis. J. Neurol. 254, II35–II42 (2007).
60. Guimarães, J. & Sá, M. J. Cognitive dysfunction in Multiple Sclerosis. Front. Neurol.
MAY, 1–8 (2012).
61. Bisecco, A. et al. Attention and processing speed performance in multiple sclerosis is
mostly related to thalamic volume. Brain Imaging Behav. 12, 20–28 (2018).
62. Heesen, C. et al. Correlates of cognitive dysfunction in multiple sclerosis. Brain. Behav.
Immun. 24, 1148–1155 (2010).

91
63. Parmenter, B. A. et al. Validity of the Wisconsin Card Sorting and Delis – Kaplan
Executive Function System ( DKEFS ) Sorting Tests in multiple sclerosis. J. Clin. Exp.
neurpsychology 29, 215–223 (2007).
64. Arnett, P. A. et al. Relationship between frontal lobe lesions and Wisconsin card sorting
test performance in patients with multiple sclerosis. Neurology 44, 420–425 (1994).
65. Green, J. Evaluation of General Intellectual Function, Atttention, Executive Function,
Verbal Abilities, and Visuospatial and Visuoconstructive abilities. (Academic Press,
2000).
66. Mike, A. et al. Identification and Clinical Impact of Multiple Sclerosis Cortical Lesions as
Assessed by Routine 3T MR Imaging. 515–521 (2011). doi:10.3174/ajnr.A2340
67. Rao, S. M. et al. Memory Dysfunction in Multiple Sclerosis: Its Relation to Working
Memory, Semantic Encoding, and Implicit Learning. Neuropsychology 7, 364–374
(1993).
68. Kipps, C. M. & Hodges, J. R. Cognitive assessment for clinicians. Neurol. Pract. 76,
(2005).
69. Dineen, R. A. et al. Disconnection as a mechanism for cognitive dysfunction in multiple
sclerosis. Brain 132, 239–249 (2009).
70. Drew, M., Tippett, L. J., Starkey, N. J. & Isler, R. B. Executive dysfunction and cognitive
impairment in a large community-based sample with Multiple Sclerosis from New
Zealand: A descriptive study. Arch. Clin. Neuropsychol. 23, 1–19 (2008).
71. Wuerfel, E. et al. Cognitive deficits including executive functioning in relation to clinical
parameters in paediatric MS patients. PLoS One 13, 1–15 (2018).
72. Beatty, W. W. & Monson, N. Problem Solving in Parkinson’s Disease: Comparison of

92
Performance on the Wisconsin and California Card Sorting Tests. J. Geriatr. Psychiatry
Neurol. 3, 163–171 (1990).
73. Beatty, W. W., Jocic, Z., Monson, N. & Katzung, V. M. Problem Solving by
Schizophrenic and Schizoaffective Patients on the Wisconsin and California Card Sorting
Tests. Neuropsychology 8, 49–54 (1994).
74. Genova, H. M., Deluca, J., Chiaravalloti, N. & Wylie, G. The relationship between
executive functioning, processing speed, and white matter integrity in multiple sclerosis.
J. Clin. Exp. Neuropsychol. 35, 631–641 (2013).
75. Welton, T., Kent, D., Constantinescu, C. S., Auer, D. P. & Dineen, R. A. Functionally
relevant white matter degradation in multiple sclerosis: A tract-based spatial meta-
analysis. Radiology 275, 89–96 (2015).
76. Uddin, L. Q., Supekar, K. S., Ryali, S. & Menon, V. Dynamic Reconfiguration of
Structural and Functional Connectivity Across Core Neurocognitive Brain Networks with
Development. J. Neurosci. 31, 18578–18589 (2011).
77. Figley, T. D. T. D., Bhullar, N., Courtney, S. M. S. M. & Figley, C. R. C. R. Probabilistic
atlases of default mode, executive control and salience network white matter tracts: an
fMRI-guided diffusion tensor imaging and tractography study. Front. Hum. Neurosci. 9,
1–20 (2015).
78. Buckner, R. L., Andrews-Hanna, J. R. & Schacter, D. L. The brain’s default network:
Anatomy, function, and relevance to disease. Ann. N. Y. Acad. Sci. 1124, 1–38 (2008).
79. Seeley, W. W. et al. Dissociable intrinsic connectivity networks for salience processing
and executive control. J. Neurosci. 27, 2349–2356 (2007).
80. Filippi, M. et al. Association between pathological and MRI findings in multiple sclerosis.
93
Lancet Neurol. 11, 349–360 (2012).
81. Assaf, Y. & Pasternak, O. Diffusion Tensor Imaging (DTI)-based White Matter Mapping
in Brain Research: A Review. J. Mol. Neurosci. 34, 51–61 (2008).
82. Y. Ge. Multiple Sclerosis: The Role of MR Imaging. AJNR 27, 1165–1176 (2006).
83. Uddin, M. N., Figley, T. D., Marrie, R. A. & Figley, C. R. Can T 1 w/T 2 w ratio be used
as a myelin-specific measure in subcortical structures? Comparisons between FSE-based
T 1 w/T 2 w ratios, GRASE-based T 1 w/T 2 w ratios and multi-echo GRASE-based
myelin water fractions. NMR Biomed. 31, 1–11 (2018).
84. Ripollés, P. et al. Analysis of automated methods for spatial normalization of lesioned
brains. Neuroimage 60, 1296–1306 (2012).
85. Klein, A. et al. Evaluation of 14 nonlinear deformation algorithms applied to human brain
MRI registration. Neuroimage 46, 786–802 (2009).
86. Maziotta, J. C., Toga, A. W., Evans, A., Fox, P. & Lancaster, J. A probabilistic atlas of the
human brain: theory and rationale for its development. Neuroimage 2, 89–101 (1995).
87. Ashburner, J. & Friston, K. J. Nonlinear Spatial Normalization Using Basis Functions.
Hum. Brain Mapp. 266, 254–266 (1999).
88. Ashburner, J. A fast diffeomorphic image registration algorithm. Neuroimage 38, 95–113
(2007).
89. Crinion, J. et al. Spatial normalization of lesioned brains: Performance evaluation and
impact on fMRI analyses. Neuroimage 37, 866–875 (2007).
90. Brett, M., Leff, A. P., Rorden, C. & Ashburner, J. Spatial Normalization of Brain Images
with Focal Lesions Using Cost Function Masking. Neuroimage 14, 486–500 (2001).
91. Valverde, S., Oliver, A. & Lladó, X. A white matter lesion-filling approach to improve

94
brain tissue volume measurements. NeuroImage Clin. 6, 86–92 (2014).
92. Popescu, V. et al. Accurate GM atrophy quantification in MS using lesion-filling with co-
registered 2D lesion masks. NeuroImage Clin. 4, 366–373 (2014).
93. Battaglini, M., Jenkinson, M. & De Stefano, N. Evaluating and reducing the impact of
white matter lesions on brain volume measurements. Hum. Brain Mapp. 33, 2062–2071
(2012).
94. Martino, M. E. et al. Comparison of different methods of spatial normalization of FDG-
PET brain images in the voxel-wise analysis of MCI patients and controls. Ann. Nucl.
Med. 27, 600–609 (2013).
95. Marrie, R. A. et al. Diabetes and anxiety adversely affect cognition in multiple sclerosis.
Mult. Scler. Relat. Disord. (2019). doi:10.1016/j.msard.2018.10.018
96. Polman, C. H., Montalban, X. & Polman, C. H. Diagnostic criteria for multiple sclerosis:
2010 revisions to the McDonald criteria. J. Neurol. 259, S8 (2012).
97. Kurtzke, J. F. Rating neurologic impairment in multiple sclerosis: an expanded disability
status scale (EDSS). Neurology 33, 1444–52 (1983).
98. Smith, S. M. Fast robust automated brain extraction. Hum. Brain Mapp. 17, 143–155
(2002).
99. Acosta-Cabronero, J., Williams, G. B., Pereira, J. M. S., Pengas, G. & Nestor, P. J. The
impact of skull-stripping and radio-frequency bias correction on grey-matter segmentation
for voxel-based morphometry. Neuroimage 39, 1654–1665 (2008).
100. Schmidt, P. et al. An automated tool for detection of FLAIR-hyperintense white-matter
lesions in Multiple Sclerosis. Neuroimage 59, 3774–3783 (2012).
101. Mori, S. et al. Stereotaxic white matter atlas based on diffusion tensor imaging in an

95
ICBM template. Neuroimage 40, 570–582 (2008).
102. Beg, M. F., Miller, M. I., Trou, A. & Younes, L. Computing Large Deformation Metric
Mappings via Geodesic Flows of Diffeomorphisms. Int. J. Comput. Vis. 61, 139–157
(2005).
103. Jenkinson, M. & Smith, S. A global optimisation method for robust affine registration of
brain images. Med. Image Anal. 5, 143–156 (2001).
104. Jenkinson, M., Bannister, P., Brady, M. & Smith, S. Improved Optimization for the
Robust and Accurate Linear Registration and Motion Correction of Brain Images.
Neuroimage 17, 825–841 (2002).
105. Andersson, J. L. R., Jenkinson, M., Smith, S. & Andersson, J. FNIRT — FMRIB’ non-
linear image registration tool. Oxford Centre for Functional Magnetic Resonance
imaging of the Brain, Department of Clinical Neurology, Oxford University, Oxford, UK
(2007).
106. Avants, Brian B. Tustiscon, Nick. Song, G. Advanced Normalization Tools (ANTS).
(2011).
107. Gaser, Christian, D. R. CAT - A computational anatomy toolbox for the analysis of
structural MRI data. 336–348 (2016).
108. Ashburner, J. & Friston, K. J. Diffeomorphic registration using geodesic shooting and
Gauss–Newton optimisation. Neuroimage 55, 954–967 (2011).
109. Kvålseth, T. On Normalized Mutual Information: Measure Derivations and Properties.
Entropy 19, 631 (2017).
110. González-Villà, S., Oliver, A., Huo, Y., Lladó, X. & Landman, B. A. Brain structure
segmentation in the presence of multiple sclerosis lesions. NeuroImage Clin. 22, 101709

96
(2019).
111. Oishi, K. et al. Atlas-based whole brain white matter analysis using large deformation
diffeomorphic metric mapping: Application to normal elderly and Alzheimer’s disease
participants. Neuroimage 46, 486–499 (2009).
112. Dice, L. Measures of the amount of ecological association between species. Ecology 26,
297–302 (1945).
113. Zou, K. H. et al. Statistical Validation of Image Segmentation Quality Based on a Spatial
Overlap Index 1 : Scientific Reports. Acad Radiol 11, 178–189 (2004).
114. Kutzelnigg, A. et al. Cortical demyelination and diffuse white matter injury in multiple
sclerosis. Brain 128, 2705–2712 (2005).
115. Shu, N. et al. Diffusion tensor tractography reveals disrupted topological efficiency in
white matter structural networks in multiple sclerosis. Cereb. Cortex 21, 2565–2577
(2011).
116. Trenova, A. G. et al. Cognitive Impairment in Multiple Sclerosis. Folia Med. (Plovdiv).
58, (2016).
117. Llufriu, S. et al. Structural networks involved in attention and executive functions in
multiple sclerosis. NeuroImage Clin. 13, 288–296 (2017).
118. Drew, M. A., Starkey, N. J. & Isler, R. B. Examining the link between information
processing speed and executive functioning in multiple sclerosis. Arch. Clin.
Neuropsychol. 24, 47–58 (2009).
119. Mattioli, F., Stampatori, C., Bellomi, F., Scarpazza, C. & Galli, P. Assessing executive
function with the D-KEFS sorting test : normative data for a sample of the Italian adult
population. 1895–1902 (2014). doi:10.1007/s10072-014-1857-7

97
120. Jefferson, A. L., Paul, R. H., Ozonoff, A. & Cohen, R. A. Evaluating elements of
executive functioning as predictors of instrumental activities of daily living (IADLs).
Arch. Clin. Neuropsychol. 21, 311–320 (2006).
121. Smith, E. E. et al. Correlations between MRI white matter lesion location and executive
function and episodic memory. Neurology 76, 1492–1499 (2011).
122. Davis, F. A. The clinico-radiological paradox in multiple sclerosis: novel implications of
lesion size. Mult. Scler. J. 20, 515–516 (2014).
123. Artemiadis, A., Anagnostouli, M., Zalonis, I., Chairopoulos, K. & Triantafyllou, N.
Structural MRI correlates of cognitive function in multiple sclerosis. Mult. Scler. Relat.
Disord. 21, 1–8 (2018).
124. Eijlers, A. J. C. et al. Predicting cognitive decline in multiple sclerosis: A 5-year follow-
up study. Brain 141, 2605–2618 (2018).
125. Hawellek, D. J., Hipp, J. F., Lewis, C. M., Corbetta, M. & Engel, A. K. Increased
functional connectivity indicates the severity of cognitive impairment in multiple
sclerosis. Proc. Natl. Acad. Sci. U. S. A. 108, 19066–19071 (2011).
126. Tahedl, M., Levine, S. M., Greenlee, M. W., Weissert, R. & Schwarzbach, J. V.
Functional connectivity in multiple sclerosis: Recent findings and future directions. Front.
Neurol. 9, 1–18 (2018).
127. Eshaghi, A. et al. Classification algorithms with multi-modal data fusion could accurately
distinguish neuromyelitis optica from multiple sclerosis. NeuroImage Clin. 7, 306–314
(2015).
128. Figley, C. R., Asem, J. S. A., Levenbaum, E. L. & Courtney, S. M. Effects of Body Mass
Index and Body Fat Percent on Default Mode , Executive Control , and Salience Network

98
Structure and Function. 10, 1–23 (2016).
129. Dimitrov, M., Grafman, J., Soares, A. H. R. & Clark, K. Concept formation and concept
shifting in frontal lesion and Parkinson’s disease patients assessed with the California card
sorting test. Neuropsychology 13, 135–143 (1999).
130. Crouch, J. A., Greve, K. W. & Brooks, J. The California Card Sorting Test may dissociate
verbal and non-verbal concept formation abilities. Br. J. Clin. Psychol. 35, 431–434
(1996).
131. Delis, D. C., Squire, L. R., Bihrle, A. & Massman, P. Componential analysis of problem-
solving ability: Performance of patients with frontal lobe damage and amnesic patients on
a new sorting test. Neuropsychologia 30, 683–697 (1992).
132. Berg, J. L., Swan, N. M., Banks, S. J. & Miller, J. B. Atypical performance patterns on
Delis–Kaplan Executive Functioning System Color–Word Interference Test: Cognitive
switching and learning ability in older adults. J. Clin. Exp. Neuropsychol. 38, 745–751
(2016).
133. Till, C. et al. Magnetic resonance imaging predictors of executive functioning in patients
with pediatric-onset multiple sclerosis. Arch. Clin. Neuropsychol. 27, 495–509 (2012).
134. Caruyer, E., Aganj, I., Lenglet, C., Sapiro, G. & Deriche, R. Motion detection in diffusion
MRI via online ODF estimation. Int. J. Biomed. Imaging 2013, (2013).
135. Sotiropoulos, S. N. et al. Advances in diffusion MRI acquisition and processing in the
Human Connectome Project. Neuroimage 80, 125–143 (2013).
136. Uǧurbil, K. et al. Pushing spatial and temporal resolution for functional and diffusion MRI
in the Human Connectome Project. Neuroimage 80, 80–104 (2013).
137. Mohammadi, S., Möller, H. E., Kugel, H., Müller, D. K. & Deppe, M. Correcting eddy

99
current and motion effects by affine whole-brain registrations: Evaluation of three-
dimensional distortions and comparison with slicewise correction. Magn. Reson. Med. 64,
1047–1056 (2010).
138. Ruthotto, L. et al. Diffeomorphic susceptibility artifact correction of diffusion-weighted
magnetic resonance images. Phys. Med. Biol. 57, 5715–5731 (2012).
139. Mohammadi, S., Freund, P., Feiweier, T., Curt, A. & Weiskopf, N. The impact of post-
processing on spinal cord diffusion tensor imaging. Neuroimage 70, 377–385 (2013).
140. Meng, X.-L., Rosenthal, R. & Rubrin, D. Comparing Correlated Correlation Coefficients.
Quant. methods Psychol. 111, 172–175 (1992).
141. Diedenhofen, B. & Musch, J. Cocor: A comprehensive solution for the statistical
comparison of correlations. PLoS One 10, 1–12 (2015).
142. Cruz-Gómez, Á. J., Ventura-Campos, N., Belenguer, A., Ávila, C. & Forn, C. The link
between resting-state functional connectivity and cognition in MS patients. Mult. Scler. J.
20, 338–348 (2014).
143. Roosendaal, S. D. et al. Resting state networks change in clinically isolated syndrome.
Brain 133, 1612–1621 (2010).
144. Bonavita, S. et al. Distributed changes in default-mode resting-state connectivity in
multiple sclerosis. Mult. Scler. J. 17, 411–422 (2011).
145. Sacco, R., Bonavita, S., Esposito, F., Tedeschi, G. & Gallo, A. The Contribution of
Resting State Networks to the Study of Cortical Reorganization in MS. Mult. Scler. Int.
2013, 1–7 (2013).
146. Rocca, M. A. et al. Default-mode network dysfunction and cognitive impairment in
progressive MS. Neurology 74, 1252–1259 (2010).

100
147. Daselaar, S. M. et al. Less wiring, more firing: Low-performing older adults compensate
for impaired white matter with greater neural activity. Cereb. Cortex 25, 983–990 (2015).
148. Bodini, B. et al. Exploring the relationship between white matter and gray matter damage
in early primary progressive multiple sclerosis: An in vivo study with TBSS and VBM.
Hum. Brain Mapp. 30, 2852–2861 (2009).
149. Solana, E. et al. Modified connectivity of vulnerable brain nodes in multiple sclerosis ,
their impact on cognition and their discriminative value. Sci. Rep. 9, 1–8 (2019).
150. Savini, G. et al. Default mode network structural integrity and cerebellar connectivity
predict information processing speed deficit in multiple sclerosis. Front. Cell. Neurosci.
13, 1–15 (2019).
151. Denney, D. R. & Lynch, S. G. The impact of multiple sclerosis on patients’ performance
on the Stroop Test: Processing speed versus interference. J. Int. Neuropsychol. Soc. 15,
451–458 (2009).
152. Yu, H. J. et al. Multiple white matter tract abnormalities underlie cognitive impairment in
RRMS. Neuroimage 59, 3713–3722 (2012).
153. Tovar-Moll, F. et al. Thalamic involvement and its impact on clinical disability in patients
with multiple sclerosis: A diffusion tensor imaging study at 3T. Am. J. Neuroradiol. 30,
1380–1386 (2009).
154. Benedict, Ralph HB, Bruce, Jared, G Dwyer Michael, Weinstock-Guttman, Bianca, Tjoa,
Chris, Tavazza, Eleonora, Munschauer, Frederick E, Zivadinov, R. Diffusion-weighted
imaging predicts cognitive impairment in multiple sclerosis.pdf. Mult. Scler. 13, 722–730
(2007).
155. Klein, A. et al. Evaluation of 14 nonlinear deformation algorithms applied to human brain

101
MRI registration. Neuroimage 46, 786–802 (2009).
156. Ripollés, P. et al. Analysis of automated methods for spatial normalization of lesioned
brains. Neuroimage 60, 1296–1306 (2012).
157. Martino, M. E. et al. Comparison of different methods of spatial normalization of FDG-
PET brain images in the voxel-wise analysis of MCI patients and controls. Ann. Nucl.
Med. 27, 600–609 (2013).