comparing income aggregates: how do the cps and … do the cps and acs match the national income and...
TRANSCRIPT

1
Comparing Income Aggregates :
How do the CPS and ACS Match the National Income and Product Accounts, 2007-2012
Jonathan L. Rothbaum U.S. Census Bureau
January 14, 2015
SEHSD Working Paper 2015-01
This paper reports the results of research and analysis undertaken by U.S. Census Bureau staff. It has undergone more limited review than official publications and was released to inform
interested parties of ongoing research and to encourage discussion of work in progress. Any views expressed are those of the author and not necessarily those of the U.S. Census Bureau.
CORRESPONDENCE TO:
Jonathan L. Rothbaum Income Statistics Branch
U.S. Census Bureau 4600 Silver Hill Road
Washington, DC 301-763-9681

2
Abstract In this paper, I compare the income aggregates from the Bureau of Economic Analysis’ National Income and Product Accounts to the
corresponding aggregates from two U.S. Census Bureau Surveys: 1) the Current Population Survey Annual Social and Economic Supplement and 2) the American Community Survey. This can help researchers and Census staff understand how survey respondents may be under- or
misreporting various types of income.
1 Introduction
This paper compares income aggregates from Census survey data to administrative
benchmarks from the Bureau of Economic Analysis’ (BEA) National Income and Product
Accounts (NIPA). This is an update of work done by Coder and Scoon-Rogers (1996) and
Roemer (2000) which compared NIPA aggregates to the Current Population Survey Annual
Social and Economic Supplement (CPS ASEC) and the Survey of Income and Program
Participation (SIPP).
There are many reasons why survey responses may deviate from administrative data.
Respondents may be reluctant to reveal their incomes in surveys, misclassify income, or over- or
under-report income. There has been a considerable literature on measurement error in survey
data, both theoretical and empirical. The empirical work often focuses on comparing survey data
to administrative data that represents the “truth” from which any deviation in the survey is
measurement error. For a survey of comparisons between survey and administrative data, see
Moore, Stinson, and Welniak Jr. (2000). Since then considerable research has been done on the
topic. To name just a few, Hokayem et al. (2012) study non-response bias and poverty
estimates; Kim and Tamborini (2012) analyze measurement error in survey data; Celik et al.
(2012) study differences in earnings volatility in survey and administrative data. Groen (2012)
and Abowd and Stinson (2013) caution that comparing survey data to an administrative

3
benchmark ignores the fact that measurement error exists in all data sets, including
administrative ones. In this context, for example, the benchmark NIPA data contains an estimate
of self-employment income that includes an adjustment to the administrative tax data for
misreporting. This adjustment accounts for over 40% of the self-employment income aggregate
(Ledbetter 2007; Internal Revenue Service 2012). This study also relates to work comparing
CPS ASEC and NIPA income at the BEA by Katz (2012) and McCully (2013).
This paper contributes to the literature by studying how the CPS ASEC and ACS survey
estimates differ from the NIPA aggregates, which are based on administrative data, survey data,
and imputations. This paper has three main aims. The first is to update work done by Coder and
Scoon-Rogers (1996) and Roemer (2000) and therefore to facilitate comparisons between the
results of these studies. In this way, changes over time in relationship between CPS ASEC and
NIPA benchmarks will be apparent. The second is to understand how possible income
misreporting affects aggregates in the ACS as well. Because the ACS is a newer survey, less
work has been done to understand how ACS income reporting relates to administrative and other
data benchmarks. A third goal is to explore some possible reasons that Census survey
aggregates have changed relative to the NIPA benchmarks over time.
The rest of the paper is structured as follows. The next section discusses the data sources.
The third section explains the adjustments made to facilitate comparison between the differing
concepts of income measured in the Census surveys and the NIPA. In the fourth section, I
discuss the results, how they differ from those in Coder and Scoon-Rogers and Roemer’s
previous studies, as well as explore of some possible explanations. The final section concludes.

4
2 Data Sources
2.1 Current Population Survey Annual Social and Economic Supplement (CPS ASEC)
The basic CPS is a household survey given to approximately 54,000 households each
month that provides information on the labor force and employment in the United States. The
CPS ASEC is a more comprehensive supplemental survey designed to gather information about
family and household characteristics, income, and program participation, among other things. It
is given to all March CPS households as well as 4,500 additional Hispanic households from the
November CPS and one-quarter of the February and April CPS households. In each household,
all individuals 15 and over are surveyed. In addition, to improve data on children’s health
insurance coverage, the March CPS sample was increased in 2002 by over 34,000 households in
states with high sampling error for the uninsured. In all, each year’s CPS ASEC includes
approximately 100,000 households covering over 200,000 individual interviews (Roemer 2000;
US Census Bureau 2013).1 The CPS ASEC asks respondents about their income in the previous
calendar year, so that individuals interviewed in the March 2013 supplement are asked about
income from January to December in 2012. This corresponds to the time period analyzed in the
NIPA aggregates. The CPS ASEC asks about income from over 50 sources. In this paper, I
divide that income into 17 categories (shown in Table 1). These categories roughly correspond
to income divisions reported in the NIPA tables and allow comparisons to the results in the prior
studies on NIPA and Census survey data.2
1 The inclusion of the February and April CPS households in the CPS-ASEC began in 2002. The results from Coder
and Scoon-Rogers and Roemer use data from 1984 and 1990-1996 and include a sample of 50,000-60,000 households. 2 Data are subject to error arising from a variety of sources. For further information, see
http://www.census.gov/prod/techdoc/cps/cpsmar13.pdf.
5
2.2 American Community Survey (ACS)
The ACS is a large-scale survey, which recently replaced the long form questionnaire
from the decennial census. It was fully implemented in 2005 with an annual sample size of
nearly 3 million households. The sample was increased in June 2011 so that in 2012
approximately 3.5 million households were surveyed. The ACS is conducted on a rolling basis
and 1/12 of the annual sample is surveyed each month.3 Because the ACS survey requests less
detailed information about income sources than the CPS ASEC, ACS income results are divided
into eight categories. Table 2 shows the income categories from the ACS and their relationship
to the 17 CPS ASEC aggregates in Table 1.4 Another difference between the ACS and the CPS
ASEC is that the ACS asks about income during the previous 12 months, not the previous
calendar year. For example, ACS respondents surveyed on March 21, 2013 are asked to
categorize their income from March 21, 2012 to March 21, 2013 not January 1 to December 31,
2012 as for all 2013 CPS ASEC respondents.5 If ACS respondents accurately answer according
to the specified timeframe, for a given year’s ACS, an average of only six months of income
would have been earned during the same calendar year with the other six months earned in the
previous calendar year.6 For simplicity, in this paper I treat all income responses for a given
year’s ACS as having been earned in that year. However, in the results I discuss how this
3 Prior to 2011, ACS questionnaires were mailed to 242,000 households per month (3 million annually). In June
2011, that increased to 295,000 month (3.5 million households in 2012). The census ACS website has more information on the number of households selected for the survey and the number of respondents (US Census Bureau 2012b). 4 The correspondence between ACS and CPS-ASEC categories may not be perfect. For example, the ACS asks
respondents about retirement income and other income. It is possible for example that some respondents classify worker’s compensation payments, which is a separate income category in the CPS-ASEC, as retirement income and
other respondents classify it as other income. 5 The exact wording in the ACS for the income section is “give your best estimate of the TOTAL AMOUNT during
the PAST 12 MONTHS. (NOTE: The ‘past 12 months’ is the period from today's date one year ago up through today.).” 6 Each individual’s income is inflation adjusted by the CPIU-RS to a single reference period of January through
December of the interview year based on the month the individual is surveyed (US Census Bureau 2008).

6
assumption may have impacted the ACS aggregates relative to the corresponding CPS ASEC
aggregates.
While for the CPS ASEC I subdivide income into four categories (earning, property
income, transfers, and pensions), the broader categories in the ACS only permit me to divide
income into three categories by combining the transfers and pensions categories. This is because
some transfer and pension income falls under into “other” income in the ACS.
2.3 National Income and Product Accounts (NIPA)
The NIPA are a series of tables produced by the BEA to summarize economic activity in
the United States in a given year. The NIPA tables include aggregates such as gross domestic
product and personal income. The tables provide information about the size of the output of the
U.S. economy as well as its composition and use. The tables track the income and expenditures
of the business, household, and government sectors of the economy.
However, the concept of personal income measured in the NIPA differs from the income
concept in Census surveys like the ACS and CPS ASEC. Census surveys measure “money
income,” which is the cash regularly available to households. The NIPA tables measure
“personal income,” which is the aggregate value of compensation including cash and non-cash
benefits. For example, wages in the NIPA include in-kind benefits such as food and lodging
provided to workers whereas CPS ASEC and ACS wages do not. I discuss the differences and
adjustments needed to harmonize the personal and money income measures in these data sources
in more detail in section 3.
The BEA uses a variety of data sources for the NIPA income aggregates, including
survey data (especially economic censuses of businesses, establishments, and regional and local
governments) and administrative data, such as Internal Revenue Service tax returns,

7
unemployment insurance program records, Social Security Administration data, etc. While the
CPS is one source of data for monthly and quarterly NIPA estimates, it is generally used to
extrapolate from earlier NIPA data points until the tables are revised when additional
information is available from the economic censuses and administrative sources.7 Because the
BEA estimates of personal income come in large part from administrative data sources, I
consider these estimates the benchmark for comparison of CPS ASEC and ACS income
estimates.
3 Data Adjustments
Before I can compare the income aggregates from the CPS ASEC and ACS to the NIPA,
I must make a number of adjustments. First, the CPS ASEC and ACS sampling universes do not
include all households and institutions that are in the household sector in the NIPA. For
example, the NIPA household sector includes nonprofit institutions serving households. These
institutions are not included in the Census surveys. Second, the concept of money income as
measured by the CPS ASEC and ACS is not the same as personal income in the NIPA. As a
result, the NIPA personal income aggregates must be adjusted to make them comparable to
Census money income.
3.1 Sample Universe Differences
There are a number of differences between the sample universe in the CPS ASEC and the
NIPA and between the ACS and the NIPA. Each subsection below discusses an adjustment
made to the NIPA to account for the sampling differences between the NIPA and one or both of
the Census surveys. For simplicity, I follow Roemer in assuming a steady state of movements
7 For more information about the NIPA and the data sources, see the NIPA handbook (Bureau of Economic Analysis
2012).

8
into and out of survey eligibility. This assumption implies that the same number of people with
the same incomes transition into and out of the sampling frame (for example, by leaving and
entering prisons) so that no adjustments are necessary. The one exception to this is for
decedents, who once dead cannot return to answer the CPS or ACS. It is likely that any bias
resulting from violations of this assumption will be very small as a share of any income
aggregate.
3.1.1 Nonprofit Institutions and Fiduciaries (CPS ASEC and ACS)
The household sector in the NIPA includes households and nonprofit institutions that
primarily serve households, private non-insured welfare funds, and private trust funds. However,
only households are sampled as a part of the CPS or ACS. Property income earned by other
institutions must therefore be subtracted from the NIPA personal income aggregates to reflect the
absence of this income in the Census surveys. In addition, income received or retained by
fiduciaries acting on behalf of households would likely not be reported in Census survey
responses and is subtracted from the NIPA aggregates where appropriate.
3.1.2 Decedents (CPS ASEC and ACS)
The NIPA income estimates capture all income earned in a given year. Since they
depend on administrative not survey data, this includes individuals who earned income in the
United States for any portion of the year. However, survey data only includes those individuals
who earned money during the year and are still available at the time of the survey. The income
of individuals who die before the interview date will therefore not be included in the CPS ASEC
or ACS but will be in the NIPA.
To adjust for this, I estimate the income of decedents using a simple model. I assume
that the probability of death during the year is based only on an individual’s age, race, and

9
gender and is not conditional on any of the income categories. While this assumption is not
likely to hold in practice,8 it gives a rough estimate of the aggregate income not included in the
CPS ASEC and ACS due to deaths. I use the most recently available U.S. Department of Health
and Human Services Life Tables (Arias 2012) which contain survival probability by age, race,
and gender as of 2008. I calculated a decedent weight for each person as the share of income lost
due to death of similar individuals. Based on their monthly survival probability, I assume a
“share” of each individual died each month after earning income for the year of up to the
midpoint of the month in which they died. Using these individual decedent shares and inverse
probability weights of the annual survival probability, I calculated the aggregate decedent
adjustment in each income category. The CPS ASEC requires an additional adjustment because
the interview occurs several months after the survey’s income year (in March for most
respondents). I calculate this additional adjustment using the probability of death between
January 1 and an average interview date of mid-March. The total decedent adjustment is then
subtracted from the NIPA aggregate for each income category.
3.1.3 Institutionalized (CPS ASEC)
The CPS surveys only the non-institutional population and therefore excludes individuals
whose income is present in the NIPA who live in prisons, long-term care facilities, nursing
homes, etc. This also includes employees who reside in group quarters on the grounds of
institutions. To adjust the NIPA sample universe to match the CPS ASEC, I use the income
aggregates for the institutional and non-institutional populations each year from the ACS.
Because income in the ACS is broken down into fewer categories than in the CPS ASEC (see
8 For example, after holding race, gender, and age fixed, individuals who are ill may earn lower wages and be more
likely to die than healthy individuals. Also, individuals who receive certain transfers such as unemployment or
worker’s compensation may also be more likely to die than others.

10
Table 2), where multiple CPS ASEC categories map to a single ACS category, I use the ratio of
incomes in the broader ACS category for each of the CPS ASEC subcategories to calculate the
institutional income adjustment. When there exists a one-to-one mapping, I use the aggregate
income for the institutional population as the benchmark adjustment.
3.1.4 Military on Post in the United States without Families (CPS ASEC)
The CPS surveys households with active duty military on post only if they reside with
their families. The same adjustment procedure as for the institutionalized population is used in
this case. Using the ACS, I define the excluded military individuals as those that live in military
group quarters with ten or more total residents and adjust the NIPA benchmarks accordingly.
3.1.5 Overseas (CPS ASEC and ACS)
The CPS ASEC and ACS obtain proxy interviews for households with members who are
temporarily abroad, but neither survey includes individuals living overseas that do not have a
regular residence in the United States. However, some income in the NIPA tables is earned by
non-U.S. residents. While the NIPA explicitly exclude transfers made as a part of federal
government programs to overseas residents (Social Security, Supplemental Security Income,
employee pensions, etc.) which therefore require no overseas adjustment, the BEA does not have
the data necessary to do so for state and local programs. As did Roemer, I assume that state and
local transfer payments (such as unemployment compensation) to overseas residents are
approximately zero. In order to account for the local and state government pensions earned by
individuals living overseas, I assume that the ratio of these payments is the same as the
equivalent ratio for Social Security payments. For each year, to calculate this ratio I use data
from the Annual Statistical Supplements to the Social Security Bulletin (Social Security

11
Administration 2009; 2010; 2011; 2012; 2013). The bulletin includes the total amount of Social
Security benefits paid overseas as well as by category: retirement, survivors, and disability.
The NIPA tables also include wage and property income (government retirement
investment plans) earned by federal workers stationed abroad. The Regional Quarterly Reports
in the BEA’s Survey of Current Business (Lenze 2010; Lenze 2012) contain these values, which
I subtract from the NIPA as a part of the benchmarking process. For the CPS ASEC, the
property income earned by federal workers overseas is distributed proportionally between the
three property income categories, as it is not available for each category separately.
3.2 Personal and Money Income
There are many definitions of income in the literature. These definitions differ along a
number of possible dimensions. For example, should income include only sources that are
recurrent or should unexpected or one-time sources of income also be counted? Should income
only include sources that directly affect current well-being or should it include sources of future
well-being such as pensions, employee contributions to retirement plans, etc. that may indirectly
affect current well-being? The Census money income approach includes only recurrent sources
of income and only those that directly affect current well-being. The BEA personal income
approach includes both recurrent and one-time sources and the value of resource flows that affect
future well-being.9
Personal income in the NIPA is income and compensation received by individuals from
participation in production. Personal income includes wage and salary disbursements, employer
contributions to employee pension and insurance funds, proprietors’ income, property income
9 See Ruser, Pilot, and Nelson (2004) for a more thorough discussion of personal and money income.

12
(personal interest, dividend and rental income), and transfer payments to individuals (minus
individual contributions to social insurance).
CPS ASEC and ACS money income is defined as the total pre-tax income earned by
individuals, excluding certain lump sum payments and capital gains. It is intended to capture the
regularly-received income that people can spend on their current well-being. It includes income
received as wages and salaries, self-employment income, property income (dividends, interest
and rent), government transfer payments (social security, unemployment and worker’s
compensation, public assistance), retirement income (private and government), interpersonal
transfers (alimony, child support, etc.), and other recurrent income.
Money income does not include a number of types of compensation or transfers that are
included in BEA personal income. These items include employer contributions to retirement or
pension plans, non-earnings lump sum payments,10
in-kind income and transfer payments such as
employee-provided food, Medicare, Medicaid, and food stamps, and the imputed income value
of compensation or services such as the rental value of owner-occupied housing. Money income
does include various items not in personal income, including interpersonal transfers such as child
support and alimony. Neither income concept includes income earned from the sale of assets or
capital gains.
3.3 Adjustments by Income Category
In the rest of this section, I describe the primary adjustments made to harmonize the two
income concepts. This includes adjustments to convert NIPA personal income into a comparable
money income benchmark. Adjustments are also made so that the NIPA income concepts better
match the questions and likely interpretations of respondents to Census surveys. For example,
10 Monetary earnings bonuses that are lump sum are included in money income as wages and salary.
13
when conducting surveys on money income, there is some uncertainty as to how individuals
classify income. An individual may fail to report income from a source not directly asked about
or may fail to classify correctly income such as interest and dividends paid on retirement
accounts or interest on US savings bonds. In this report, for comparability I follow the informed
assumptions made by Roemer about the specific adjustments made to the NIPA benchmarks. All
of the adjustments are delineated in Table 3 (personal to money income), Table 4 (CPS ASEC-
specific adjustments), and Table 5 (ACS-specific adjustments) so readers can evaluate the impact
of these assumptions and calculate alternative benchmarks as they see fit.
3.3.1 Earnings
Earnings include wages and salaries and self-employment income. The NIPA wages and
salary earnings include in-kind payment such as food and lodging that must be subtracted to
match CPS ASEC and ACS money income.
The CPS ASEC data on self-employment income is based on net business profit. This
does not include items in the NIPA, such as inventory valuation adjustment, capital consumption
adjustment, income paid to fiduciaries, the gain to those who default on loans, the value of labor
in home construction or improvement, income to utility cooperatives (such as telephone and
electrical cooperatives). These items must be removed from the NIPA self-employment income
benchmark. In the earlier report, Roemer used data provided by the BEA from NIPA
reconciliation tables used to compare NIPA results to IRS aggregate gross income calculations.
Unfortunately, those tables are no longer constructed as part of the NIPA process. As a result,
the income paid to fiduciaries is no longer available from the BEA. I estimate these values by
multiplying the average ratio of income to fiduciaries in each categories from 1990-1996 by the
NIPA income aggregate in each year analyzed.
14
NIPA farm self-employment income also includes categories for the value of non-
monetary aspects of agricultural businesses, such as the value of food produced and consumed
on farms, the rental value of farm dwellings, and the change in value of farm inventories. NIPA
also includes a valuation adjustment for Commodity Credit Corporation loans to reflect the
implicit subsidy in their terms. Each of these items must be subtracted from farm self-
employment income in the NIPA as they are not included in the CPS ASEC or ACS. In addition,
CPS ASEC and ACS respondents are likely to include patronage dividends paid out in cash from
farm cooperatives.11
Because this income is not included in farm self-employment income in the
NIPA, it is added to the benchmark.
3.3.2 Property Income
Property income includes interest, dividend, and rent and royalty income. There are a
number of differences between NIPA property income and Census survey property income.
First, the NIPA include the imputed interest value of financial services, such as the value of free
checking accounts and interest on life insurance. The implicit interest value of these services is
not included in money income. NIPA also includes the value of unredeemed interest on U.S.
savings bonds, which by virtue of being unredeemed is not likely to be included in the CPS or
ACS survey results. As this data was calculated as a part of the aforementioned discontinued
reconciliation tables, it is no longer available from the BEA. In order to estimate the value of
unredeemed interest on savings bonds, I calculate the value of unredeemed bonds as a share of
the value of all outstanding bonds. I then multiply this share by the total bond interest paid by
the federal government to get the estimate of unredeemed interest payments.12
11 However, farm cooperative dividends paid out in reduced prices are unlikely to be included as income.
12 The unredeemed bond data is available from the TreasuryDirect website at http://www.treasurydirect.gov/.
15
The NIPA also contains interest on some types of retirement plans (IRA and Keogh), and
tax-exempt interest in their calculation of interest income. For comparability, I follow Roemer in
excluding these sources of income from the CPS ASEC and ACS benchmark. This was done
because by focusing on regularly-received cash income, survey respondents are unlikely to
report much interest on tax-exempt or tax-deferred retirement accounts. Again as the data is no
longer available from the BEA, I estimated this by using data on the total value of IRA deposits
in interest bearing assets such as money market funds and bond funds. Using asset data from the
2012 Statistical Abstract (US Census Bureau 2012a), interest rate data from the Federal Reserve,
and fund fee data from the Investment Company Institute (ICI), a trade association of investment
and mutual fund companies, I multiplied the value of IRA assets by the relevant interest rate
minus fees to get the estimate of IRA interest earned.13
The CPS ASEC questionnaire explicitly includes earnings from non-money-market
mutual funds as dividends. However, mutual funds include assets that yield interest (bonds) and
dividends (stocks), which are reported separately in their respective categories in the NIPA.
Therefore, I follow Roemer in adjusting the NIPA by including the interest earned by mutual
funds in the dividend category in the CPS ASEC, as respondents likely would have reported it.
This adjustment was made as with the IRA interest earned using 2012 Statistical Abstract data on
mutual fund assets. For the ACS, no adjustment is necessary because interest and dividends are
aggregated in the property income category.
For comparability, I also follow Roemer in excluding S corporation earnings (small
business corporations) from dividends. He did so on the grounds that while the income is
technically a dividend, it is not likely to be treated as such by survey respondents. However, he
13 I used the following rates for a) money market funds: 90 day financial commercial paper rate and b) bond funds:
5-year T-bill.

16
also does not add this income into self-employment income, citing the same low probability of
inclusion in this category as well. The data used for this adjustment comes from the IRS
Statistics of Income Tax Stats reports (Internal Revenue Service 2013).
For rent and royalty income, the NIPA includes the imputed rental value of owner-
occupied housing. However, the CPS ASEC and ACS focus on money income available to
households and therefore do not include the foregone rent that owners do not pay for living in
their own houses. NIPA also adjusts rental income for capital consumption, which the Census
surveys do not.
3.3.3 Transfers
The benchmark adjustments to transfers are much simpler than for earnings and property
income. For each transfer, lump-sum payments must be excluded, as they are not recurrent
income and therefore should not be included in Census surveys. The Social Security lump-sum
death benefit data is available in the 2012 Annual Statistical Supplement to the Social Security
Bulletin (Social Security Administration 2013). Railroad retirement lump-sum benefits include
death benefit payments and residual payments and are available in the Financial, Actuarial &
Statistical Annual Railroad Retirement Act & Railroad Unemployment Insurance Act Data
(United States Railroad Retirement Board 2013). Workers compensation lump-sum benefit data
is available from the National Academy of Social Insurance Workers’ Compensation: Benefits,
Coverage, and Costs report (Sengupta, Baldwin, and Reno 2013).14
Lump-sum adjustments to
veteran’s benefits come from the U.S. Department of Veterans Affairs’ Annual Benefit Report
(US Department of Veterans Affairs 2012). Black lung payments are not included in the
14 The worker’s compensation lump-sum payments primarily includes payments for medical care. However,
because states generally report on lump-sum payments and medical payments as one category, I have included them
under the broader category of noncash and lump-sum payments.
17
worker’s compensation aggregate in the NIPA tables, but are included in the worker’s
compensation category in the two Census surveys and must therefore be added to the benchmark.
3.3.4 Pension
As with some transfers, lump-sum payments must also be removed from government
pension payments. Federal retirement lump-sum payment data was provided upon request by the
U.S. Office of Personnel Management (OPM). The lump-sum payment adjustment for state and
local government pensions was calculated based on the ratio of lump-sum to total payments in
governments that paid positive lump sums in the Census Bureau’s Annual Survey of Public
Pensions. For private pensions, I follow Roemer in including only payments from defined-
benefit pension plans.
4 Results
In this section, I discuss the results of the comparison between the Census surveys and
the NIPA benchmarks. I focus especially on how the relationship between income aggregates
from different surveys have changed over time, whether during the period analyzed in this report
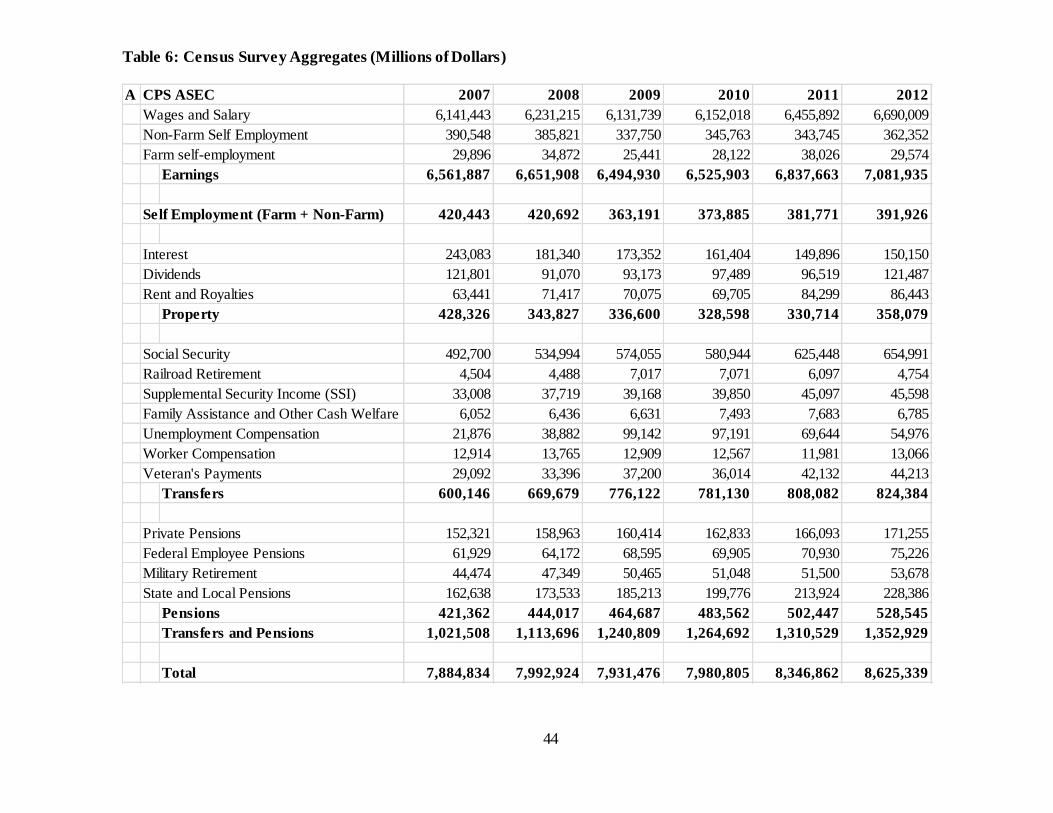
or between the earlier reports and this one. Table 6 shows the complete income aggregates for
the Census surveys, Table 7 shows the ratio of Census survey income to NIPA income for each
category, and Table 8 summarizes the adjusted benchmarks from the NIPA. Table 7 includes
results from the CPS ASEC and ACS from 2007-2012 as well as the CPS ASEC results from the
previous work by Roemer and Coder and Scoon-Rogers from 1984 and 1990-1996.
4.1 Earnings
The aggregate CPS ASEC wages and salary income remained relatively stable
throughout the period analyzed at between 96.2-99.0% of the adjusted NIPA benchmark.
Although this is generally in tandem with the results from the previous work, it is below the ratio

18
Roemer found from 1993-1996. He found that after a survey change in 1994 which increased
the upper limit on reported income and moved to computerized questionnaires, the CPS ASEC
wage and salary aggregate was closer to or actually exceeded the NIPA aggregate (income years
1993-1996). It is not clear why, but from 2007-2012, the CPS to NIPA comparison is more in
line with the results from 1984 and 1990-1992. Nevertheless, the aggregate wage and salary
estimates from the CPS ASEC in recent years have been consistently between1-3% below the
appropriate NIPA benchmark.
The wage and salary aggregates from the ACS are further below the NIPA and fluctuate
more than the comparable CPS ASEC estimates. This could be for a number of reasons. First, I
have made a strong assumption to simplify this analysis by assigning all respondent income to
the ACS survey year, even if a large portion was earned in the previous year. However, the
unemployment rate increased rapidly during 2008 and 2009.15
Therefore, ACS respondents early
in the year reporting income from the previous 12 months (or even the previous calendar year if
using tax information to answer the survey) did so from a lower unemployment/higher income
period, which I have assigned to the later higher unemployment/lower income period. In this
way, I may be overestimating wages and salary in both years, thus decreasing the gap between
the ACS and the NIPA artificially. In more stable years for employment and income, the ACS
results in a larger underreporting of wages and salary than the CPS ASEC. Second, while the
CPS reporting period and survey dates are scheduled to allow respondents to consult their tax
information when answering surveys, the ACS does neither. Therefore, ACS respondents may
be more likely to provide inaccurate estimates of their income than CPS ASEC respondents. For
15 According to the Bureau of Labor Statistics, in 2008 the unemployment rate increased from 5.0% in January to
7.3% in December, and in 2009 it increased from 7.8% in January to 9.9% in December. In none of the other years
analyzed did it change by more than 0.6%.

19
example, an ACS respondent may multiply their recent take-home pay by the number of pay
periods worked to arrive at an estimate of wages, and this estimate would underestimate their
pre-tax wage earnings. The CPS ASEC respondent on the other hand may have consulted their
tax return, which contains the pre-tax earnings.
Both the CPS ASEC and ACS respondents severely underreport self-employment
income. Total self-employment income (farm plus non-farm) in the CPS ASEC declined from
44.0% of the benchmark in 2007 to 31.7% in 2012. This decline holds over time in the ACS as
well, from 50.5% to 33.8% between 2007 and 2012. Between 2007 and 2012 this divergence
occurred because the current dollar value of self-employment income declined by 6.8% in the
CPS ASEC and 13.4% in the ACS while at the same time increasing by 29% in the NIPA
benchmark.
This appears to be a continuation of the trend observed by Roemer, where self-
employment income declined from 68.5% of the benchmark in 1990 to 52.6% in 1996. Roemer
also found this divergence for the Survey of Income and Program Participation (SIPP) measures
of self-employment income and the NIPA. Roemer posited that the NIPA might be overstating
self-employment income due to the use of a misreporting adjustment factor in the NIPA, which
was unchanged over the entire period.
This adjustment in the NIPA is included to account for the misreporting of self-
employment income on IRS tax returns. The adjustment is based on IRS estimates of income
underreporting using data from random audits (Internal Revenue Service 2012). Table 7
includes the ratio of Census survey self-employment income to the NIPA after removing the
misreporting adjustment. In 2007, over 91% of gap between the CPS ASEC and NIPA
benchmark (51.2% of a gap of 56.0%) is explained by the misreporting adjustment. However,
20
by 2012, only 40% of the gap can be explained by the misreporting adjustment. The ACS
includes more self-employment income than the NIPA benchmark minus the misreporting
adjustment in 2007. However, by 2012, the ACS is only 63.3% of the NIPA without the
adjustment.
The IRS has updated their misreporting adjustment based on random audits multiple
times between 1990 and 2012. The continuation of the declining trend of CPS ASEC self-
employment income relative to the NIPA benchmark over a more than 20-year period suggests
that there is a more fundamental change in how self-employment income is earned and/or
reported that is responsible for the decline.
4.2 Property Income
Property income is also underreported in Census surveys. The CPS ASEC interest
income fluctuates from as low as 53.7% of the benchmark in 2008 to 74.9% in 2010. For
dividends the fluctuations are even more extreme, going from as low as 27.2% in 2008 to
101.6% in 2010. Income from rent and royalties is also only 25.1% to 29.9% of the benchmark
in the CPS ASEC. The results from the ACS are aggregated into one category and generally
capture a higher share (average of 55.6%) of the benchmark than the aggregate from the CPS
ASEC (average of 49.7%). In large part, the wide ranges observed are a result of the large
swings in property income in the NIPA tables during the recession, which are not matched in
magnitude in the Census surveys.
As compared to the periods analyzed by Roemer and Coder and Scoon-Rogers, there is
no clear change in the share of interest and dividend income captured relative to the NIPA tables.
However, the share of rent and royalty income has declined considerably. Again, the start of this

21
decline was visible in the earlier reports as 95.4% of rent and royalty income was captured by the
CPS ASEC in 1984 but only 58.6% in 1996.
4.3 Transfers (CPS ASEC)
The share of transfer income captured by Census survey aggregates differs considerably
depending on the category. The CPS ASEC generally includes about 90% of the Social Security
income in the NIPA, while the corresponding figure for the ACS is around 80%. CPS ASEC
Supplemental Security Income (SSI) is 81-92% of the benchmark. In the ACS, SSI income
fluctuates from 83% to 123% of the benchmark. It is not clear why, but it is possible that some
individuals are misreporting Social Security income as SSI income in the ACS. Since SSI is a
much smaller program than Social Security, this could be causing large fluctuations in the SSI
aggregate. The CPS ASEC Social Security and SSI numbers generally match those from the
previous reports.
Both the CPS ASEC and ACS aggregates for family assistance and other cash welfare are
below 35% of the NIPA benchmark. This is a large decline from the earlier reports where family
assistance and other cash welfare was never below 67% of the benchmark.16
In the NIPA, the
current dollar value of the two welfare categories has nearly doubled since 1996. However, the
aggregate in the CPS ASEC has declined by half over the same period. The ACS values for
these categories are not statistically different from the CPS ASEC aggregates.
CPS ASEC aggregates for unemployment compensation and veteran’s payments are
generally between 65% and 80% of the NIPA benchmarks with relatively large fluctuations.
This matches the results from previous studies. The worker’s compensation in the CPS ASEC is
also far below the NIPA benchmark, at 23-29%.
16 One possibility is that non-cash assistance is now a larger share of family assistance than prior to welfare reform
and therefore the CPS ASEC and ACS measures of cash assistance would be a smaller share of the NIPA aggregate.

22
While the CPS ASEC imperfectly captures some sources of transfer income when
compared to the NIPA benchmarks, it is important to highlight that when aggregated, the CPS
ASEC contains about 80% of transfer income in each survey year. This is because the transfer
income categories the CPS ASEC best captures in aggregate are also the largest sources of
transfer income, Social Security, SSI, unemployment compensation, and veteran’s payments.
However, in 1984, and 1990-1996, the CPS ASEC covered 83.6% to 89.5% of transfer income,
so the CPS ASEC no longer captures as large a share of transfer income as it did in the previous
period.
4.4 Pensions (CPS ASEC)
The CPS ASEC aggregate for private pensions is over 92% of the benchmark from 2007-
2012, which is not statistically different from the results from 1990-1996. This is much higher
than the share of any of the public pensions relative to the benchmark. For federal employee
pensions, the range is 63.9-72.7%; for military retirement, it is 53.0-61.0%; and for state and
local pensions, it is 50.3-56.8%. These figures are all below the average values reported by
Roemer from 1990-1996. However, the decline in CPS ASEC coverage of military retirement
and state and local pensions relative to the benchmark was already apparent in the earlier data.
For military retirement, in 1990 the CPS ASEC captured 85.6% of the benchmark, but by 1996
the figure was only 58.2% with a declining trend in the intervening years. For state and local
government pensions, the data showed a steady decline from 78.7% of the benchmark in 1990 to
57.3% in 1996. In neither of these cases is the CPS ASEC share of the benchmark in 1996 very
different from the maximum achieved between 2007 and 2012.

23
4.5 Transfers and Pensions (ACS)
I have already briefly discussed the ACS benchmarks that map directly into income
categories in the CPS ASEC, including Social Security, SSI, family assistance and other cash
welfare. The ACS includes a category for retirement income, which I compare to the aggregate
NIPA benchmarks for private defined-benefit pension income, federal pensions, military
retirement, and state and local government pensions. The ACS retirement income aggregate is
89.6-93.0% of the NIPA benchmark. This is greater than the CPS ASEC pension aggregate,
which is approximately 70% of the NIPA benchmark. It is not clear why the ACS captures a
higher percentage of the benchmark income, but it is perhaps due to the fact that individuals are
more likely to report lump-sum retirement benefits (such as lump-sum transfers from defined
contribution plans) in their answer to the more general ACS retirement question than the more
specific CPS ASEC ones.
The ACS also includes a category for other income that likely captures some retirement
and government transfer income as well as private interpersonal transfers (alimony, child
support, etc. that are excluded from the NIPA). Therefore, I report the ACS income relative to
the NIPA benchmark with and without the other income category and relevant NIPA items that
may be reported there. With other income included, the ACS transfer and pension income is
84.7 to 88.2% of the benchmark. Without other income, the ACS aggregate ranges from 82.0 to
85.7% of the benchmark.
4.6 Total Income
Despite changes in the relationship between Census survey income and NIPA benchmark
aggregates, Census surveys captured a relatively stable amount of total income over the period
analyzed. Total income in the CPS ASEC varied from 83.0% to 86.3% of the NIPA total

24
benchmark. The ACS totals are between 84.2% and 87.5% (or 83.8% and 87.7% excluding
other income), which are not statistically different from the CPS ASEC. This is because both the
CPS ASEC and ACS capture a large share of wage and salary income, which comprises about
two thirds of total NIPA income in each year.
5 Conclusion
Several important conclusions can be drawn from this analysis. First, aggregate CPS
ASEC wage and salary income continues to be within about 4% of the NIPA benchmark. The
ACS wage and salary aggregates is less accurate, possibly because the CPS ASEC survey takes
place during tax filing season or because the reporting period in the ACS does not match the
calendar year as in the NIPA and CPS ASEC.
Second, several income aggregates in the Census surveys declined over the period
analyzed or have declined considerably since the 1990-1996 analysis. These include self-
employment income, rent and royalties, veteran’s payments, and family assistance and other cash
welfare. For the two categories experiencing the largest change, CPS ASEC self-employment
income relative to the NIPA aggregate has declined from 68.5% in 1990 to 31.7% in 2012, and
family assistance and other cash welfare declined from approximately 78.4% of the NIPA
aggregate in 1984 and 74.4% in 1990 to 17.1% in 2012.
Third, comparing the CPS ASEC and ACS shows that the two surveys generally capture
larger shares of the NIPA aggregate in the same income categories, including wages and salary,
social security, SSI, and pension and retirement income. The ACS captures a slightly smaller
share of earnings relative to the NIPA than the CPS ASEC. Both surveys also do not capture a
large share of self-employment earnings and family assistance and other cash welfare.
Otherwise, many of the categories of income where the CPS ASEC is well below the NIPA

25
benchmark (such as worker’s compensation, railroad retirement, federal, military, and state and
local pensions) are not asked for separately in the ACS. The CPS ASEC appears to capture a
slightly greater percentage of the NIPA benchmark for transfer and pension income than the
ACS17
. However, the ACS captures a larger share of the benchmark property income than the
CPS ASEC. Research using ACS household records linked to administrative data could help
shed more light on why the CPS ASEC and ACS aggregates differ relative to the NIPA
benchmarks.
17 The difference is statistically significant in all years but 2007.

26
Tables
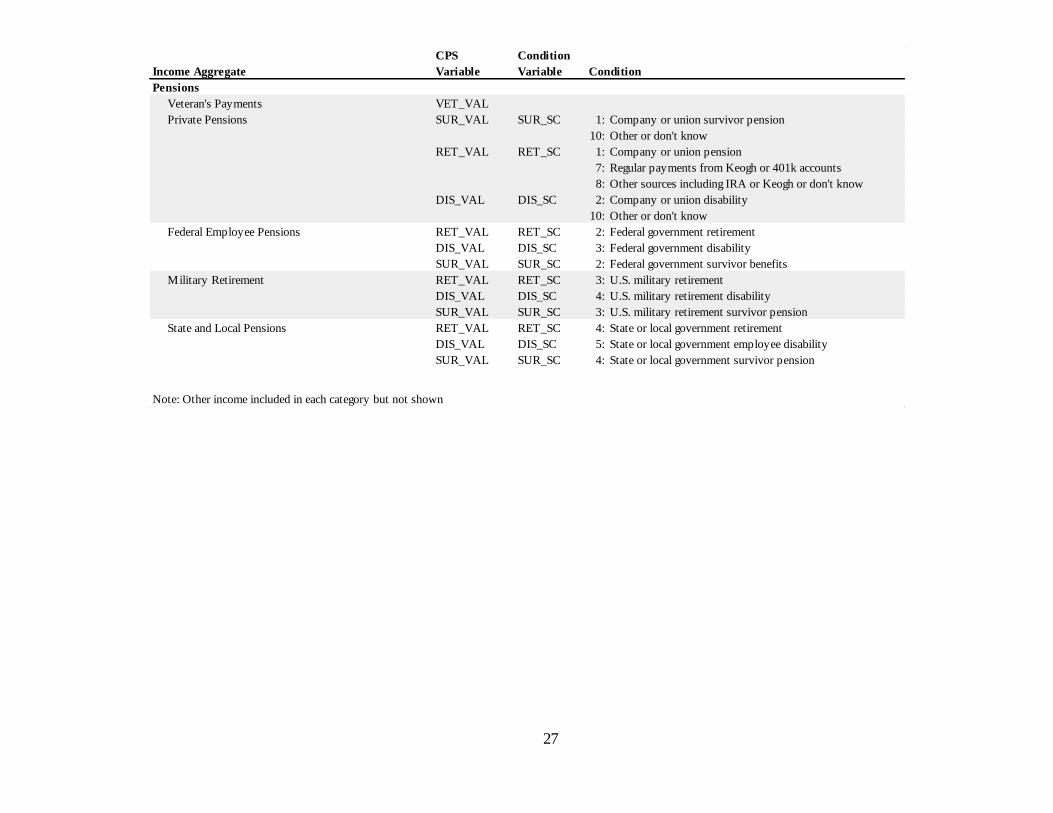
Table 1: CPS Variables and Income Aggregates for NIPA Comparisons
Income Aggregate
CPS
Variable
Condition
Variable Condition
Earnings
Wages and Salary WS_VAL
ERN_VAL ERN_SRCE 1: Wage and Salary
Self Employment
Non-Farm Self Employment ERN_VAL ERN_SRCE 2: Self Employment
SE_VAL
Farm Self Employment ERN_VAL ERN_SRCE 3: Farm Self Employment
FRM_VAL
Property Income
Interest INT_VAL
Dividends DIV_VAL
Rent and Royalties RNT_VAL
Estates and Trusts
(included in Rent and Royalties)
Survivor Income SUR_VAL SUR_SC 8: Regular payments from estates or trusts
Transfers
Social Security SS_VAL
Railroad Retirement
Survivor Income SUR_VAL SUR_SC 5: Railroad retirement survivor pension
Disability Income DIS_VAL DIS_SC 6: Railroad retirement disability
Retirement Income RET_VAL RET_SC 5: Railroad retirement
Supplemental Security Income SSI_VAL
Family Assistance and Other Cash Welfare PAW_VAL
Unemployment Compensation UC_VAL
Worker's Compensation WC_VAL
DIS_VAL DIS_SC 1: Worker's compensation disability
8: Black lung miner's disability
SUR_VAL SUR_SC 6: Worker's compensation survivor benefits
7: Black lung survivor benefits
27
Income Aggregate
CPS
Variable
Condition
Variable Condition
Pensions
Veteran's Payments VET_VAL
Private Pensions SUR_VAL SUR_SC 1: Company or union survivor pension
10: Other or don't know
RET_VAL RET_SC 1: Company or union pension
7: Regular payments from Keogh or 401k accounts
8: Other sources including IRA or Keogh or don't know
DIS_VAL DIS_SC 2: Company or union disability
10: Other or don't know
Federal Employee Pensions RET_VAL RET_SC 2: Federal government retirement
DIS_VAL DIS_SC 3: Federal government disability
SUR_VAL SUR_SC 2: Federal government survivor benefits
Military Retirement RET_VAL RET_SC 3: U.S. military retirement
DIS_VAL DIS_SC 4: U.S. military retirement disability
SUR_VAL SUR_SC 3: U.S. military retirement survivor pension
State and Local Pensions RET_VAL RET_SC 4: State or local government retirement
DIS_VAL DIS_SC 5: State or local government employee disability
SUR_VAL SUR_SC 4: State or local government survivor pension
Note: Other income included in each category but not shown

28
Table 2: Income Aggregates by Census Data Source
ACS CPS ASEC
1. Earnings 1. Earnings
Wages and Salary Wages and Salary
Self Employment Non-Farm Self Employment
Farm Self Employment
2. Property Income 2. Property Income
Property Income Interest
Dividends
Royalties
3. Transfers and Pensions 3. Transfers
Social Security Social Security
Railroad Retirement
Supplemental Security Income Supplemental Security Income
Family Assistance and Other Cash Welfare Family Assistance and Other Cash Welfare
4. Pensions
Retirement Private Pensions
Federal Employee Pensions
Military Retirement
State and Local pensions
Other (Both Transfers and Pensions) Unemployment Compensation
Worker Compensation
Veteran's Payments
Note: The specific variables used in the CPS ASEC for each income category are shown in Table 1. No
corresponding appendix table exists for the ACS because the ACS variables map directly to the income categories in this table.
29
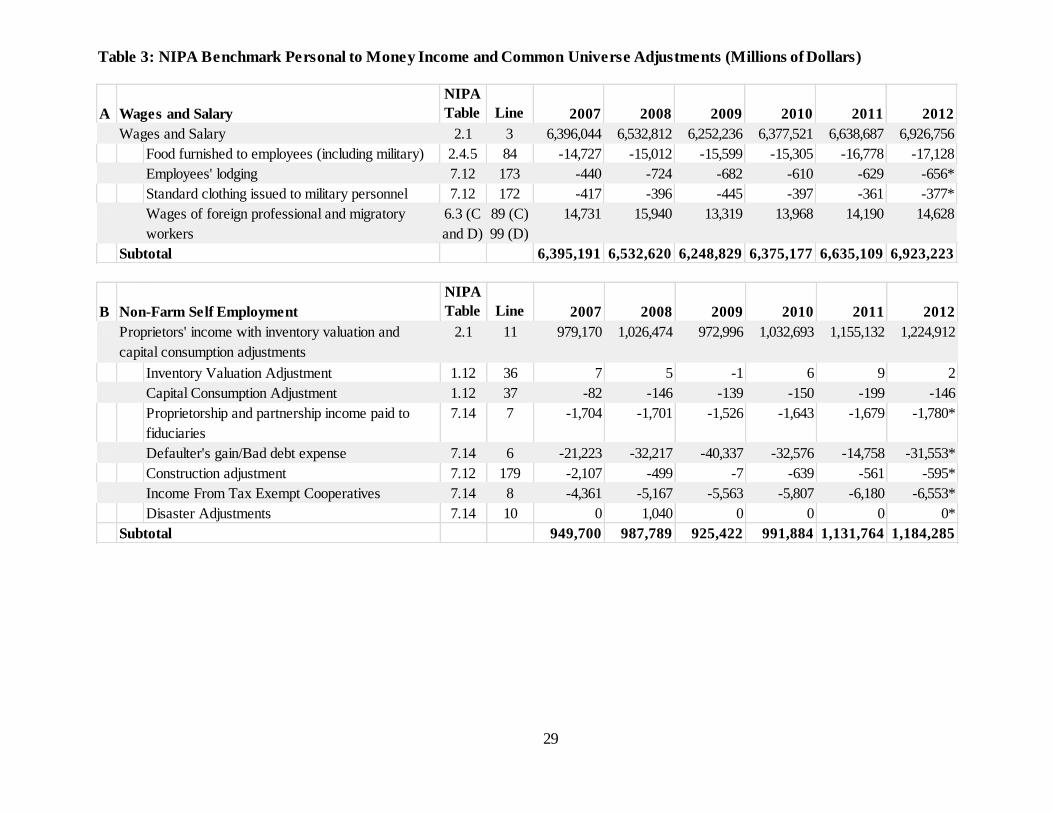
Table 3: NIPA Benchmark Personal to Money Income and Common Universe Adjustments (Millions of Dollars)
A Wages and Salary
NIPA
Table Line 2007 2008 2009 2010 2011 2012
A 2.1 3 6,396,044 6,532,812 6,252,236 6,377,521 6,638,687 6,926,756
A Food furnished to employees (including military) 2.4.5 84 -14,727 -15,012 -15,599 -15,305 -16,778 -17,128
A Employees' lodging 7.12 173 -440 -724 -682 -610 -629 -656*
Standard clothing issued to military personnel 7.12 172 -417 -396 -445 -397 -361 -377*
A Wages of foreign professional and migratory
workers
6.3 (C
and D)
89 (C)
99 (D)
14,731 15,940 13,319 13,968 14,190 14,628
A Subtotal 6,395,191 6,532,620 6,248,829 6,375,177 6,635,109 6,923,223
Wages and Salary
B Non-Farm Self Employment
NIPA
Table Line 2007 2008 2009 2010 2011 2012
B 2.1 11 979,170 1,026,474 972,996 1,032,693 1,155,132 1,224,912
B Inventory Valuation Adjustment 1.12 36 7 5 -1 6 9 2
B Capital Consumption Adjustment 1.12 37 -82 -146 -139 -150 -199 -146
B Proprietorship and partnership income paid to
fiduciaries
7.14 7 -1,704 -1,701 -1,526 -1,643 -1,679 -1,780*
B Defaulter's gain/Bad debt expense 7.14 6 -21,223 -32,217 -40,337 -32,576 -14,758 -31,553*
B Construction adjustment 7.12 179 -2,107 -499 -7 -639 -561 -595*
B Income From Tax Exempt Cooperatives 7.14 8 -4,361 -5,167 -5,563 -5,807 -6,180 -6,553*
B Disaster Adjustments 7.14 10 0 1,040 0 0 0 0*
B Subtotal 949,700 987,789 925,422 991,884 1,131,764 1,184,285
Proprietors' income with inventory valuation and
capital consumption adjustments

30
C Farm self-employment income
NIPA
Table Line 2007 2008 2009 2010 2011 2012
C 2.1 10 38,103 46,991 35,462 45,998 72,553 75,361
C Capital consumption adjustment 1.12 33 -6,135 -6,513 -6,360 -5,847 -5,935 -5,936
C Rental value of farm dwellings 2.4.5 53 -20,567 -20,526 -20,713 -21,225 -22,444 -24,090
C Food produced and consumed on farms 2.4.5 29 -403 -420 -394 -395 -373 -551
C Change in farm inventories 7.3.5 29 706 -1,607 1,602 7,323 6,359 11,742
C Monetary interest received by corporations 7.15 4 -518 -372 -288 -237 -195 -203*
C Valuation adjustment, Commodity Credit
Corporation loans
7.15 5 -332 -2,889 -312 770 -381 -396*
C Patronage dividends received from cooperatives 7.15 9 733 381 380 370 370 384*
C Subtotal 11,587 15,045 9,377 26,757 49,954 56,312
Proprietors' income with inventory valuation and
capital consumption adjustments
D Interest
NIPA
Table Line 2007 2008 2009 2010 2011 2012
D Personal Interest Income 2.1 14 1,350,133 1,361,616 1,263,933 1,195,027 1,204,063 1,211,632
D Interest received by nonprofits 2.9 50 -33,248 -32,608 -31,071 -29,508 -32,424 -32,628*
D Interest received by fiduciaries *1 -18,659 -18,818 -17,468 -16,515 -16,640 -16,745
D Imputed interest income 7.11 66 -697,889 -737,837 -754,283 -758,413 -771,440 -781,549
D Unredeemed interest on US savings bonds *2 -742 -698 -521 -485 -479 -349
D IRA-Keogh *3 -49,097 -37,693 -23,755 -20,724 -20,880* -21,012*
D Tax-exempt interest *4 -79,351 -79,822 -73,574 -75,163 -72,995 -72,398*
D Interest on assets of mutual funds (to dividends) *5 -107,161 -106,090 -84,277 -69,581 -70,107* -70,547*
D Subtotal 363,986 348,050 278,985 224,639 219,097 216,405

31
E Dividends
NIPA
Table Line 2007 2008 2009 2010 2011 2012
E Personal dividend income 2.1 15 816,515 805,439 547,850 544,616 680,538 746,909
E Dividends received by nonprofits 2.9 51 -23,858 -17,822 -15,173 -17,383 -20,327 -22,309*
E Dividends received by fiduciaries *1 -26,632 -26,271 -17,869 -17,764 -22,197 -24,362
E IRA-Keogh *6 -104,149 -104,707 -70,548 -68,765 -87,290* -95,803*
E Small business corporation income *7 -400,730 -360,626 -330,512 -358,420 -447,872* -491,552*
E Interest on assets of mutual funds *5 107,161 106,090 84,277 69,581 70,107 70,547
E Imputed dividends received by persons 7.10 13 -62,517 -61,177 -53,455 -51,419 -51,296 -54,128
E Subtotal 305,790 340,926 144,569 100,446 121,662 129,301
F Rent and Royalties
NIPA
Table Line 2007 2008 2009 2010 2011 2012
F Rental income with capital consumption adjustment 2.1 12 189,410 262,106 333,700 402,755 484,382 541,156
F Rental income received by fiduciaries *1 -3,826 -5,295 -6,741 -8,136 -9,785 -10,932
F Rental income received by nonprofits 7.9 14 -5,602 -6,157 -7,308 -7,995 -9,351 -10,270
F Imputed rent of owner-occupied dwellings 7.12 139 -68,081 -130,040 -189,452 -236,153 -283,861 -302,453*
Rental Subsidy 7.12 136 -7,940 -3,588 -1,982 -1,512 -965 -1,078*
F Capital consumption adjustment 6.13D 17 110,220 127,269 127,432 126,373 138,160 132,691
F Subtotal 214,181 244,295 255,649 275,332 318,580 349,113
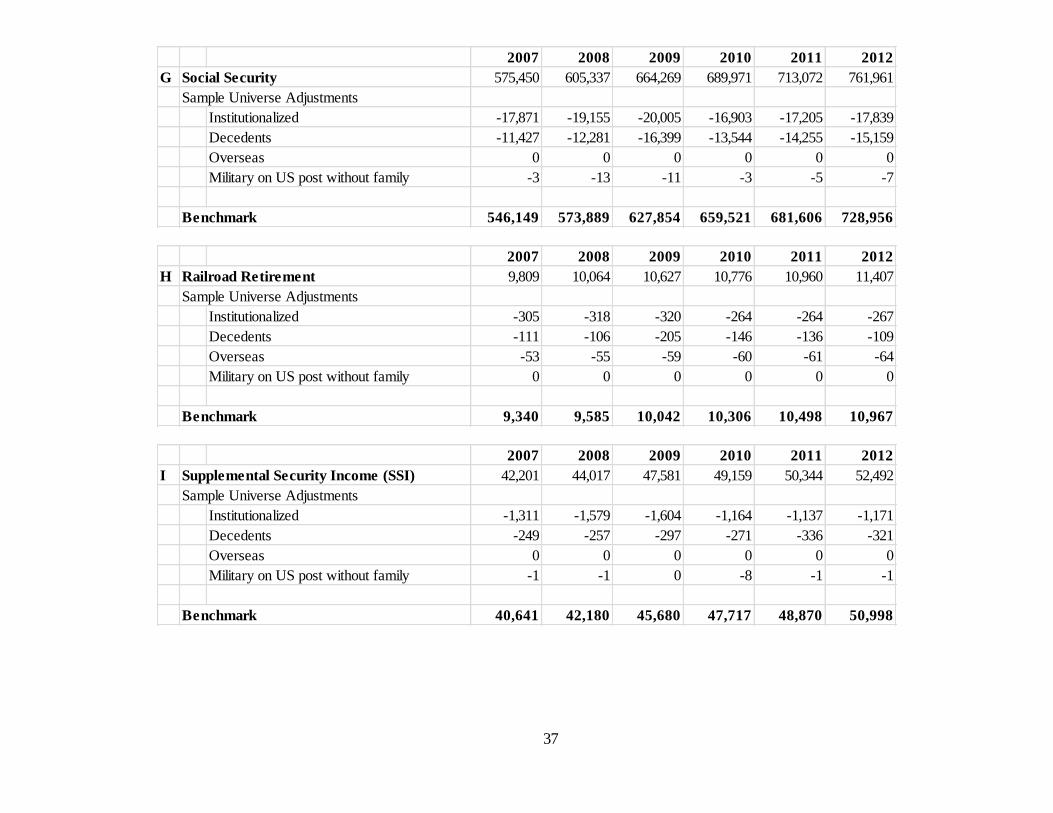
G Social Security
NIPA
Table Line 2007 2008 2009 2010 2011 2012
G Social Security 3.12 5 575,653 605,542 664,470 690,174 713,276 762,165
G Lump sum payments *8 -203 -205 -201 -203 -204 -204
G Subtotal 575,450 605,337 664,269 689,971 713,072 761,961
H Railroad Retirement
NIPA
Table Line 2007 2008 2009 2010 2011 2012
H Railroad Retirement 3.12 12 9,813 10,068 10,630 10,779 10,963 11,410
H Lump sum payments *9 -4 -4 -3 -3 -3 -3
H Subtotal 9,809 10,064 10,627 10,776 10,960 11,407

32
I Supplemental Security Income (SSI)
NIPA
Table Line 2007 2008 2009 2010 2011 2012
I Federal Supplemental Security Income (SSI) 3.12 23 36,879 38,650 42,623 44,600 45,853 48,217
I State Supplemental Security Income 3.12 36 5,322 5,367 4,958 4,559 4,491 4,275
I Subtotal 42,201 44,017 47,581 49,159 50,344 52,492
J Family Assistance and Other Cash Welfare
NIPA
Table Line 2007 2008 2009 2010 2011 2012
J Family Assistance 3.12 35 18,406 19,126 21,264 22,421 20,800 20,112
J General Assistance 3.12 37 14,316 16,334 16,731 18,247 19,040 20,345
J Subtotal 32,722 35,460 37,995 40,668 39,840 40,457
K Unemployment Compensation
NIPA
Table Line 2007 2008 2009 2010 2011 2012
K Unemployment insurance 3.12 7 32,739 51,147 131,210 138,854 107,559 84,156
L Worker Compensation
NIPA
Table Line 2007 2008 2009 2010 2011 2012
L Federal 7.8 22 2,439 2,506 2,592 2,728 2,906 2,731
L State and Local 7.8 30 15,130 13,987 12,634 11,851 11,751 11,538
L Private 7.8 24 65,345 63,159 57,854 57,534 59,860 64,329
L Noncash and lump-sum payments *10 -26,627 -29,012 -28,706 -28,600 -29,900 -31,538*
L Black lung payments 3.12 22 566 522 480 444 405 366
L Subtotal 56,853 51,162 44,854 43,957 45,022 47,426
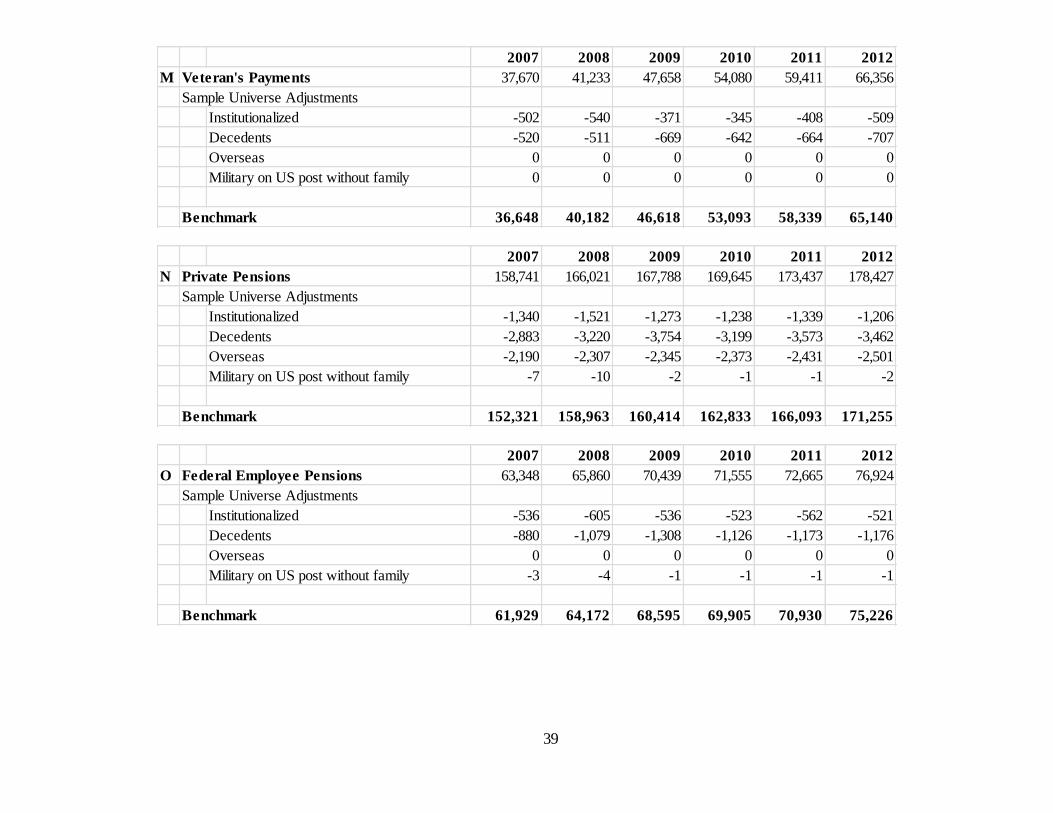
M Veteran's Payments
NIPA
Table Line 2007 2008 2009 2010 2011 2012
M Veteran's Payments 3.12 17 40,138 43,464 49,980 56,431 61,753 68,698
M Lump sum payments *11 -2,468 -2,231 -2,322 -2,351 -2,342 -2,342
M Subtotal 37,670 41,233 47,658 54,080 59,411 66,356
N Private Pensions
NIPA
Table Line 2007 2008 2009 2010 2011 2012
N Private pension plans 7.21 20 158,741 166,021 167,788 169,645 173,437 178,427

33
O Federal Employee Pensions
NIPA
Table Line 2007 2008 2009 2010 2011 2012
O Federal civilian pension plans 7.22 34 63,532 66,025 70,622 71,686 72,814 77,138
O Lump sum payments *12 -184 -165 -183 -131 -149 -214
O Subtotal 63,348 65,860 70,439 71,555 72,665 76,924
P Military Retirement
NIPA
Table Line 2007 2008 2009 2010 2011 2012
Federal military pensions 7.22 35 45,237 48,242 51,460 51,950 52,399 54,570
Q State and Local Pensions
NIPA
Table Line 2007 2008 2009 2010 2011 2012
Q State and local employee retirement 7.23 25 173,536 185,469 197,818 213,115 228,379 243,289
Q Lump sum payments *13 -5,306 -5,671 -6,048 -6,516 -6,982 -7,438
Q Subtotal 168,230 179,798 191,770 206,599 221,397 235,851
Source: US Bureau of Economic Analysis National Income and Product Account Tables unless otherwise specified in the table footnotes.

34
Table 3 Footnotes:
* Data not yet available for this year. Estimated based on data from previous years.
*1 Estimated from ratio of income received by fiduciaries to total income from 1990-1996 in Roemer (2000).
*2 Calculated by multiplying the share of the value total bonds to the value of total debt by the total interest payments made in a given year.
*3 Calculated by multiplying the dollar value of assets in the US Census 2012 Statistical Abstract of a) deposits and money market accounts and b)
bonds by a representative interest rate minus average fees for bond and money market mutual funds. The interest rates used were a) the annual 90
day financial commerical paper rate for deposit and money market holdings and b) the annual 5-year T-bill rate for bonds from the Federal Reserve
historical data. The fee data is from Investment Company Institute.
*4 IRS Individual Income Tax Returns Publication 1304, Table A.
*5 Calculated based on the assets in money market mutual funds and bonds from the U.S. Census 2012 Statistical Abstract. The interest rates and fee
data used are the same as for the IRA-Keogh above.
*6 Calculated based on ratio of IRA equity to total equity holdings in the U.S. Census 2012 Statistical Abstract.
*7 IRS S corporation statistics.
*8 2012 Annual Statistical Supplement to the Social Security Bulletin, Table 4.A5.
*9 U.S. Railroad Retirement Board, Annual Railroad Retirement Act & Railroad Unemployment Insurance Act Data Statistical Tables, data through
fiscal year 2012.
*10 National Academy of Social Insurance reports on Workers' Compensation: Benefits, Coverage, and Costs.
*11 U.S. Department of Veteran's Affairs Annual Benefits Report, 2011.
*12 Data provided upon request by OPM.
*13 Author's calculation from the Annual Survey of Public Pensions.

35
Table 4: CPS ASEC Specific Benchmark Universe Adjustments (Millions of Dollars)
2007 2008 2009 2010 2011 2012
A Wages and Salary 6,395,191 6,532,620 6,248,829 6,375,177 6,635,109 6,923,223
Sample Universe Adjustments
Institutionalized -11,169 -10,980 -9,726 -9,281 -9,164 -9,056
Decedents -19,680 -20,137 -20,646 -21,051 -22,808 -24,699
Overseas -14,400 -15,000 -16,100 -17,000 -17,400 -18,155
Military on US post without family -8,299 -8,536 -7,092 -7,289 -7,509 -7,324
Benchmark 6,341,642 6,477,968 6,195,266 6,320,555 6,578,228 6,863,988
2007 2008 2009 2010 2011 2012
B Non-Farm Self Employment 947,996 986,088 923,896 990,241 1,130,085 1,182,272
Sample Universe Adjustments
Institutionalized -3,026 -2,678 -2,433 -2,927 -2,260 -2,814
Decedents -1,939 -1,967 -1,870 -1,799 -1,952 -2,017
Overseas 0 0 0 0 0 0
Military on US post without family -122 -47 -184 -55 -46 -63
Benchmark 942,909 981,396 919,409 985,460 1,125,827 1,177,377
2007 2008 2009 2010 2011 2012
C Farm self-employment income 11,587 15,045 9,377 26,757 49,954 56,312
Sample Universe Adjustments
Institutionalized -118 -123 -89 -130 -142 -173
Decedents -203 -286 -174 -233 -478 -229
Overseas 0 0 0 0 0 0
Military on US post without family -5 -2 -7 -2 -3 -4
Benchmark 11,261 14,635 9,107 26,391 49,331 55,906

36
2007 2008 2009 2010 2011 2012
D Interest 363,986 348,050 278,985 224,639 219,097 216,405
Sample Universe Adjustments
Institutionalized -6,365 -7,565 -4,849 -6,022 -5,692 -6,047
Decedents -2,954 -2,296 -2,606 -2,188 -2,007 -2,060
Overseas -630 -561 -412 -502 -661 -665
Military on US post without family -123 -145 -347 -428 -287 -146
Benchmark 353,915 337,483 270,771 215,499 210,450 207,486
2007 2008 2009 2010 2011 2012
E Dividends 305,790 340,926 144,569 100,446 121,662 129,301
Sample Universe Adjustments
Institutionalized -3,849 -4,475 -2,102 -2,744 -3,217 -3,728
Decedents -1,313 -1,163 -1,192 -1,295 -1,343 -1,583
Overseas -381 -332 -179 -229 -373 -410
Military on US post without family -74 -86 -150 -195 -162 -90
Benchmark 300,172 334,870 140,946 95,983 116,566 123,491
2007 2008 2009 2010 2011 2012
F Rent and Royalties 214,181 244,295 255,649 275,332 318,580 349,113
Sample Universe Adjustments
Institutionalized -893 -1,456 -1,280 -2,030 -2,290 -2,701
Decedents -745 -933 -1,044 -918 -1,044 -1,131
Overseas -88 -108 -109 -169 -266 -297
Military on US post without family -17 -28 -92 -144 -116 -65
Benchmark 212,437 241,770 253,124 272,071 314,865 344,919
37
2007 2008 2009 2010 2011 2012
G Social Security 575,450 605,337 664,269 689,971 713,072 761,961
Sample Universe Adjustments
Institutionalized -17,871 -19,155 -20,005 -16,903 -17,205 -17,839
Decedents -11,427 -12,281 -16,399 -13,544 -14,255 -15,159
Overseas 0 0 0 0 0 0
Military on US post without family -3 -13 -11 -3 -5 -7
Benchmark 546,149 573,889 627,854 659,521 681,606 728,956
2007 2008 2009 2010 2011 2012
H Railroad Retirement 9,809 10,064 10,627 10,776 10,960 11,407
Sample Universe Adjustments
Institutionalized -305 -318 -320 -264 -264 -267
Decedents -111 -106 -205 -146 -136 -109
Overseas -53 -55 -59 -60 -61 -64
Military on US post without family 0 0 0 0 0 0
Benchmark 9,340 9,585 10,042 10,306 10,498 10,967
2007 2008 2009 2010 2011 2012
I Supplemental Security Income (SSI) 42,201 44,017 47,581 49,159 50,344 52,492
Sample Universe Adjustments
Institutionalized -1,311 -1,579 -1,604 -1,164 -1,137 -1,171
Decedents -249 -257 -297 -271 -336 -321
Overseas 0 0 0 0 0 0
Military on US post without family -1 -1 0 -8 -1 -1
Benchmark 40,641 42,180 45,680 47,717 48,870 50,998

38
2007 2008 2009 2010 2011 2012
J Family Assistance and Other Cash Welfare 32,722 35,460 37,995 40,668 39,840 40,457
Sample Universe Adjustments
Institutionalized -4,083 -3,300 -1,479 -1,115 -845 -861
Decedents -15 -13 -17 -15 -15 -17
Overseas 0 0 0 0 0 0
Military on US post without family -11 -6 -1 -8 -9 -1
Benchmark 28,613 32,141 36,498 39,530 38,972 39,578
2007 2008 2009 2010 2011 2012
K Unemployment Compensation 32,739 51,147 131,210 138,854 107,559 84,156
Sample Universe Adjustments
Institutionalized -409 -635 -975 -850 -710 -623
Decedents -71 -133 -328 -344 -248 -210
Overseas 0 0 0 0 0 0
Military on US post without family -15 -19 -92 -81 -38 -19
Benchmark 32,243 50,360 129,816 137,579 106,563 83,304
2007 2008 2009 2010 2011 2012
L Worker Compensation 56,853 51,162 44,854 43,957 45,022 47,426
Sample Universe Adjustments
Institutionalized -681 -1,030 -592 -447 -476 -552
Decedents -70 -96 -105 -71 -87 -83
Overseas 0 0 0 0 0 0
Military on US post without family 0 0 0 0 0 0
Benchmark 56,102 50,036 44,158 43,439 44,458 46,792
39
2007 2008 2009 2010 2011 2012
M Veteran's Payments 37,670 41,233 47,658 54,080 59,411 66,356
Sample Universe Adjustments
Institutionalized -502 -540 -371 -345 -408 -509
Decedents -520 -511 -669 -642 -664 -707
Overseas 0 0 0 0 0 0
Military on US post without family 0 0 0 0 0 0
Benchmark 36,648 40,182 46,618 53,093 58,339 65,140
2007 2008 2009 2010 2011 2012
N Private Pensions 158,741 166,021 167,788 169,645 173,437 178,427
Sample Universe Adjustments
Institutionalized -1,340 -1,521 -1,273 -1,238 -1,339 -1,206
Decedents -2,883 -3,220 -3,754 -3,199 -3,573 -3,462
Overseas -2,190 -2,307 -2,345 -2,373 -2,431 -2,501
Military on US post without family -7 -10 -2 -1 -1 -2
Benchmark 152,321 158,963 160,414 162,833 166,093 171,255
2007 2008 2009 2010 2011 2012
O Federal Employee Pensions 63,348 65,860 70,439 71,555 72,665 76,924
Sample Universe Adjustments
Institutionalized -536 -605 -536 -523 -562 -521
Decedents -880 -1,079 -1,308 -1,126 -1,173 -1,176
Overseas 0 0 0 0 0 0
Military on US post without family -3 -4 -1 -1 -1 -1
Benchmark 61,929 64,172 68,595 69,905 70,930 75,226

40
2007 2008 2009 2010 2011 2012
P Military Retirement 45,237 48,242 51,460 51,950 52,399 54,570
Sample Universe Adjustments
Institutionalized -382 -442 -390 -379 -404 -369
Decedents -381 -451 -605 -523 -494 -524
Overseas 0 0 0 0 0 0
Military on US post without family 0 0 0 0 0 0
Benchmark 44,474 47,349 50,465 51,048 51,500 53,678
2007 2008 2009 2010 2011 2012
Q State and Local Pensions 168,230 179,798 191,770 206,599 221,397 235,851
Sample Universe Adjustments
Institutionalized -1,465 -1,699 -1,500 -1,556 -1,763 -1,645
Decedents -1,399 -1,634 -1,904 -1,855 -2,040 -1,910
Overseas -2,729 -2,933 -3,152 -3,413 -3,670 -3,909
Military on US post without family 0 0 0 0 0 0
Benchmark 162,638 173,533 185,213 199,776 213,924 228,386
Source: Current Population Survey Annual Social and Economic Supplement and American Community Survey and author calculations discussed in text

41
Table 5: ACS Specific Benchmark Universe Adjustments (Millions of Dollars)
A Wages and Salary 2007 2008 2009 2010 2011 2012
A Wages and Salary 6,395,191 6,532,620 6,248,829 6,375,177 6,635,109 6,923,223
A
A Sample Universe Adjustments
A Decedents -13,080 -13,945 -13,895 -13,987 -14,562 -15,499
A Overseas -14,400 -15,000 -16,100 -17,000 -17,400 -18,155
A
A Benchmark 6,367,711 6,503,675 6,218,834 6,344,190 6,603,147 6,889,569
B Self Employment 2007 2008 2009 2010 2011 2012
B Non-Farm Self Employment Income 947,996 986,088 923,896 990,241 1,130,085 1,182,272
B Farm Self-Employment Income 11,587 15,045 9,377 26,757 49,954 56,312
B
B Sample Universe Adjustments
B Decedents -1,670 -1,660 -1,578 -1,495 -1,566 -1,666
B Overseas 0 0 0 0 0 0
B
B Benchmark 957,912 999,473 931,696 1,015,503 1,178,472 1,236,918
C Property 2007 2008 2009 2010 2011 2012
C Interest 363,986 348,050 278,985 224,639 219,097 216,405
C Dividends 305,790 340,926 144,569 100,446 121,662 129,301
C Rent and Royalties 214,181 244,295 255,649 275,332 318,580 349,113
C
C Sample Universe Adjustments
C Decedents -6,107 -6,802 -6,133 -5,667 -5,904 -6,180
C Overseas -1,100 -1,000 -700 -900 -1,300 -1,372
C
C Benchmark 876,750 925,469 672,370 593,849 652,135 687,268

42
D Social Security 2007 2008 2009 2010 2011 2012
D Social Security 575,450 605,337 664,269 689,971 713,072 761,961
D
D Sample Universe Adjustments
D Decedents -9,800 -10,434 -11,117 -11,807 -12,263 -12,821
D Overseas 0 0 0 0 0 0
D
D Benchmark 565,650 594,903 653,152 678,164 700,809 749,140
E Supplemental Security Income 2007 2008 2009 2010 2011 2012
E Supplemental Security Income 42,201 44,017 47,581 49,159 50,344 52,492
E
E Sample Universe Adjustments
E Decedents -367 -357 -360 -477 -505 -524
E Overseas 0 0 0 0 0 0
E
E Benchmark 41,834 43,660 47,221 48,682 49,839 51,968
F Family Assistance and Other Cash Welfare 2007 2008 2009 2010 2011 2012
F Family Assistance and Other Cash Welfare 32,722 35,460 37,995 40,668 39,840 40,457
F
F Sample Universe Adjustments
F Decedents -100 -85 -62 -64 -62 -61
F Overseas 0 0 0 0 0 0
F
F Benchmark 32,622 35,375 37,933 40,604 39,778 40,396
43
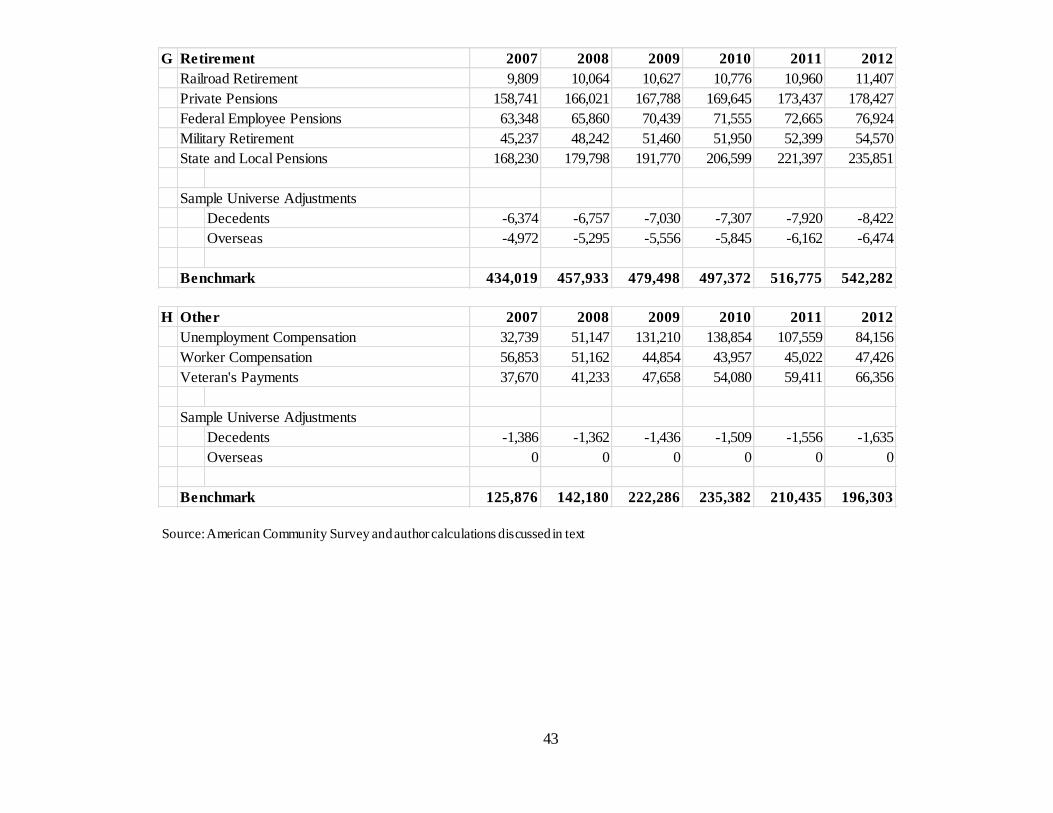
G Retirement 2007 2008 2009 2010 2011 2012
G Railroad Retirement 9,809 10,064 10,627 10,776 10,960 11,407
G Private Pensions 158,741 166,021 167,788 169,645 173,437 178,427
G Federal Employee Pensions 63,348 65,860 70,439 71,555 72,665 76,924
G Military Retirement 45,237 48,242 51,460 51,950 52,399 54,570
G State and Local Pensions 168,230 179,798 191,770 206,599 221,397 235,851
G
G Sample Universe Adjustments
G Decedents -6,374 -6,757 -7,030 -7,307 -7,920 -8,422
G Overseas -4,972 -5,295 -5,556 -5,845 -6,162 -6,474
G
G Benchmark 434,019 457,933 479,498 497,372 516,775 542,282
H Other 2007 2008 2009 2010 2011 2012
H Unemployment Compensation 32,739 51,147 131,210 138,854 107,559 84,156
H Worker Compensation 56,853 51,162 44,854 43,957 45,022 47,426
H Veteran's Payments 37,670 41,233 47,658 54,080 59,411 66,356
H
H Sample Universe Adjustments
H Decedents -1,386 -1,362 -1,436 -1,509 -1,556 -1,635
H Overseas 0 0 0 0 0 0
H
H Benchmark 125,876 142,180 222,286 235,382 210,435 196,303
Source: American Community Survey and author calculations discussed in text
44
Table 6: Census Survey Aggregates (Millions of Dollars)
A CPS ASEC 2007 2008 2009 2010 2011 2012
Wages and Salary 6,141,443 6,231,215 6,131,739 6,152,018 6,455,892 6,690,009
Non-Farm Self Employment 390,548 385,821 337,750 345,763 343,745 362,352
Farm self-employment 29,896 34,872 25,441 28,122 38,026 29,574
Earnings 6,561,887 6,651,908 6,494,930 6,525,903 6,837,663 7,081,935
Self Employment (Farm + Non-Farm) 420,443 420,692 363,191 373,885 381,771 391,926
Interest 243,083 181,340 173,352 161,404 149,896 150,150
Dividends 121,801 91,070 93,173 97,489 96,519 121,487
Rent and Royalties 63,441 71,417 70,075 69,705 84,299 86,443
Property 428,326 343,827 336,600 328,598 330,714 358,079
Social Security 492,700 534,994 574,055 580,944 625,448 654,991
Railroad Retirement 4,504 4,488 7,017 7,071 6,097 4,754
Supplemental Security Income (SSI) 33,008 37,719 39,168 39,850 45,097 45,598
Family Assistance and Other Cash Welfare 6,052 6,436 6,631 7,493 7,683 6,785
Unemployment Compensation 21,876 38,882 99,142 97,191 69,644 54,976
Worker Compensation 12,914 13,765 12,909 12,567 11,981 13,066
Veteran's Payments 29,092 33,396 37,200 36,014 42,132 44,213
Transfers 600,146 669,679 776,122 781,130 808,082 824,384
Private Pensions 152,321 158,963 160,414 162,833 166,093 171,255
Federal Employee Pensions 61,929 64,172 68,595 69,905 70,930 75,226
Military Retirement 44,474 47,349 50,465 51,048 51,500 53,678
State and Local Pensions 162,638 173,533 185,213 199,776 213,924 228,386
Pensions 421,362 444,017 464,687 483,562 502,447 528,545
Transfers and Pensions 1,021,508 1,113,696 1,240,809 1,264,692 1,310,529 1,352,929
Total 7,884,834 7,992,924 7,931,476 7,980,805 8,346,862 8,625,339

45
B ACS 2007 2008 2009 2010 2011 2012
Wages and Salary 5,940,000 6,190,000 6,100,000 5,970,000 6,090,000 6,330,000
Self Employment 483,557 467,297 429,334 397,043 403,440 418,530
Earnings 6,423,557 6,657,297 6,529,334 6,367,043 6,493,440 6,748,530
Property 436,367 463,559 398,952 364,981 368,571 387,099
Social Security 458,599 480,828 517,259 553,426 575,979 603,536
Supplemental Security Income 40,833 36,251 38,584 58,244 61,314 64,091
Family Assistance and Other Cash Welfare 9,648 10,205 12,024 14,107 13,800 13,595
Retirement 403,448 416,373 431,183 445,653 469,451 491,392
Other 145,377 149,754 180,411 199,174 189,071 179,850
Transfers and Pensions 1,057,904 1,093,411 1,179,462 1,270,604 1,309,615 1,352,464
Total 7,917,828 8,214,267 8,107,748 8,002,628 8,171,626 8,488,093
Source: Current Population Survey Annual Social and Economic Supplement and American Community Survey

46
Table 7: Census Survey Aggregates Relative to NIPA Benchmark
A CPS ASEC 2007 2008 2009 2010 2011 2012
Wages and Salary 96.8 96.2 99.0 97.3 98.1 97.5
Non-Farm Self Employment 41.3 39.2 36.7 35.0 30.5 30.7
Farm self-employment 265.5 238.3 279.3 106.6 77.1 52.9
Earnings 89.9 89.0 91.2 89.0 88.2 87.4
Self Employment (Farm + Non-Farm) 44.0 42.2 39.1 36.9 32.4 31.7
Self Employment
Relative to NIPA minus misreporting adj. 95.2 74.5 74.9 70.5 56.0 59.6
Interest 68.7 53.7 64.0 74.9 71.2 72.4
Dividends 40.6 27.2 66.1 101.6 82.8 98.4
Rent and Royalties 29.9 29.5 27.7 25.6 26.8 25.1
Property 49.4 37.6 50.6 56.3 51.5 53.0
Social Security 90.2 93.2 91.4 88.1 91.8 89.9
Railroad Retirement 48.2 46.8 69.9 68.6 58.1 43.3
Supplemental Security Income (SSI) 81.2 89.4 85.7 83.5 92.3 89.4
Family Assistance and Other Cash Welfare 21.2 20.0 18.2 19.0 19.7 17.1
Unemployment Compensation 67.8 77.2 76.4 70.6 65.4 66.0
Worker Compensation 23.0 27.5 29.2 28.9 26.9 27.9
Veteran's Payments 79.4 83.1 79.8 67.8 72.2 67.9
Transfers 80.0 83.9 82.5 78.8 81.7 80.4
Private Pensions 92.2 96.7 92.2 94.4 103.5 94.8
Federal Employee Pensions 63.9 72.6 64.6 72.0 72.7 71.7
Military Retirement 53.0 61.0 56.1 54.3 54.2 55.3
State and Local Pensions 55.9 56.6 55.8 56.8 55.6 50.3
Pensions 69.9 73.8 69.7 71.4 73.7 68.3
Transfers and Pensions 87.2 89.6 88.3 85.8 87.9 87.0
Total 84.5 83.0 86.3 85.0 84.4 83.5

47
B ACS 2007 2008 2009 2010 2011 2012
Wages and Salary 93.3 95.2 98.1 94.1 92.2 91.9
Self Employment 50.5 46.8 46.1 39.1 34.2 33.8
Self Employment
Relative to NIPA minus misreporting adj. 108.6 82.2 88.0 74.3 58.9 63.3
Earnings 87.7 88.7 91.3 86.5 83.4 83.0
Property 49.8 50.1 59.3 61.5 56.5 56.3
Social Security 81.1 80.8 79.2 81.6 82.2 80.6
Supplemental Security Income 97.6 83.0 81.7 119.6 123.0 123.3
Family Assistance and Other Cash Welfare 29.6 28.8 31.7 34.7 34.7 33.7
Retirement 93.0 90.9 89.9 89.6 90.8 90.6
Other 115.5 105.3 81.2 84.6 89.8 91.6
Transfers and Pensions 88.2 85.8 81.9 84.7 86.3 85.6
Total 84.2 84.7 87.5 84.7 82.1 81.7
Transfers and Pensions
(Excluding Other)
85.0 83.4 82.0 84.7 85.7 84.7
Total (Excluding Other) 83.8 84.4 87.7 84.7 81.9 81.5

48
C CPS ASEC (Prior Research) 1984 1990 1991 1992 1993 1994 1995 1996
Wages and Salary 97.3 95.9 96.4 95.6 99.7 101.9 101.4 101.9
Self Employment 70.2 68.5 65.3 58.6 58.9 54.8 48.5 52.6
Earnings 94.7 93.0 93.0 91.3 94.8 96.4 95.1 96.1
Interest 56.7 67.1 68.3 67.6 79.7 72.3 83.9 83.8
Dividends 51.8 40.9 45.7 49.2 54.3 54.6 62.6 59.4
Rent and Royalties 95.4 85.0 74.1 69.8 65.2 64.8 58.7 58.6
Property 58.1 62.8 63.3 63.2 69.8 65.7 72.9 70.9
Social Security and Railroad Retirement 91.2 90.6 88.6 87.1 87.8 92.3 92.0 91.7
Supplemental Security Income (SSI) 84.8 78.9 84.6 75.5 84.2 78.0 77.1 84.2
Family Assistance 78.4 74.4 74.4 72.2 76.4 73.1 70.5 67.7
Other Cash Welfare 120.0 85.6 77.5 81.6 101.3 105.2 95.8 80.5
Unemployment Compensation 74.8 79.9 82.5 72.8 77.6 90.0 91.3 81.6
Worker Compensation 48.2 89.5 89.1 82.5 77.0 77.7 69.3 62.7
Veteran's Payments 59.7 73.9 82.9 77.7 85.5 84.7 94.9 89.6
Transfers 84.9 87.6 86.8 83.6 85.6 89.5 89.2 88.3
Private Pensions 57.2 98.3 96.3 96.4 98.8 102.7 93.9 93.1
Federal Employee Pensions 84.7 82.7 82.6 84.5 82.7 80.9 77.9 80.8
Military Retirement 98.1 85.6 84.6 74.3 71.7 76.4 70.6 58.2
State and Local Pensions 71.7 78.7 68.5 64.2 66.7 59.6 59.0 57.3
Pensions 69.5 88.9 85.5 83.1 83.6 83.1 78.2 76.6
Total 88.3 89.3 89.4 88.0 91.7 92.9 92.2 92.6
Source: US Bureau of Economic Analysis National Income and Product Account Tables, Current Population Survey Annual Social and Economic Supplement, American Community Survey, 1984 data from Coder and Scoon-Rogers (1996), and 1990-1996 data from Roemer (2000).

49
Table 8: NIPA Adjusted Benchmark Summary (Millions of Dollars)
A CPS-ASEC 2007 2008 2009 2010 2011 2012
Wages and Salary 6,341,642 6,477,968 6,195,266 6,320,555 6,578,228 6,863,988
Non-Farm Self Employment 942,909 981,396 919,409 985,460 1,125,827 1,177,377
Farm self-employment 11,261 14,635 9,107 26,391 49,331 55,906
Earnings 7,295,813 7,473,998 7,123,782 7,332,406 7,753,386 8,097,271
Self Employment (Farm + Non-Farm) 954,171 996,031 928,516 1,011,851 1,175,159 1,233,283
NIPA Misreporting Adjustment 514,562 431,517 443,884 481,833 494,334 575,893*
Self Employment - Misreporting Adj 441,716 565,013 484,639 530,657 681,386 657,984
Interest 353,915 337,483 270,771 215,499 210,450 207,486
Dividends 300,172 334,870 140,946 95,983 116,566 123,491
Rent and Royalties 212,437 241,770 253,124 272,071 314,865 344,919
Property 866,525 914,123 664,841 583,552 641,881 675,896
Social Security 546,149 573,889 627,854 659,521 681,606 728,956
Railroad Retirement 9,340 9,585 10,042 10,306 10,498 10,967
Supplemental Security Income (SSI) 40,641 42,180 45,680 47,717 48,870 50,998
Family Assistance and Other Cash Welfare 28,613 32,141 36,498 39,530 38,972 39,578
Unemployment Compensation 32,243 50,360 129,816 137,579 106,563 83,304
Worker Compensation 56,102 50,036 44,158 43,439 44,458 46,792
Veteran's Payments 36,648 40,182 46,618 53,093 58,339 65,140
Transfers 749,736 798,372 940,666 991,185 989,306 1,025,735
Private Pensions 152,321 158,963 160,414 162,833 166,093 171,255
Federal Employee Pensions 61,929 64,172 68,595 69,905 70,930 75,226
Military Retirement 44,474 47,349 50,465 51,048 51,500 53,678
State and Local Pensions 162,638 173,533 185,213 199,776 213,924 228,386
Pensions 421,362 444,017 464,687 483,562 502,447 528,545
Transfers and Pensions 1,171,098 1,242,389 1,405,353 1,474,747 1,491,753 1,554,280
Total 9,333,436 9,630,510 9,193,976 9,390,705 9,887,020 10,327,447

50
B ACS 2007 2008 2009 2010 2011 2012
Wages and Salary 6,367,711 6,503,675 6,218,834 6,344,190 6,603,147 6,889,569
Self Employment 957,912 999,473 931,696 1,015,503 1,178,472 1,236,918
Earnings 7,325,623 7,503,147 7,150,529 7,359,694 7,781,619 8,126,487
NIPA Misreporting Adjustment 514,562 431,517 443,884 481,833 494,334 575,893*
Self Employment - Misreporting Adj 445,457 568,455 487,819 534,309 684,699 661,619
Property 876,750 925,469 672,370 593,849 652,135 687,268
Social Security 565,650 594,903 653,152 678,164 700,809 749,140
Supplemental Security Income 41,834 43,660 47,221 48,682 49,839 51,968
Family Assistance and Other Cash Welfare 32,622 35,375 37,933 40,604 39,778 40,396
Retirement 434,019 457,933 479,498 497,372 516,775 542,282
Other 125,876 142,180 222,286 235,382 210,435 196,303
Transfers and Pensions 1,200,001 1,274,050 1,440,089 1,500,204 1,517,637 1,580,090
Total 9,402,374 9,702,667 9,262,988 9,453,747 9,951,391 10,393,844
Source: US Bureau of Economic Analysis National Income and Product Account Tables

51
References
Abowd, John M., and Martha H. Stinson. 2013. “Estimating Measurement Error in Annual Job
Earnings: A Comparison of Survey and Administrative Data.” Review of Economics and Statistics.
Arias, Elizabeth. 2012. “United States Life Tables , 2008.” National Vital Statistics Reports 61 (3).
Bureau of Economic Analysis. 2012. “Concepts and Methods of the U.S. National Income and Product Accounts.”
Celik, Sule, Chinhui Juhn, Kristin McCue, and Jesse Thompson. 2012. “Recent Trends in Earnings Volatility: Evidence from Survey and Administrative Data.” The B.E. Journal
of Economic Analysis & Policy 12 (2).
Coder, John, and Lydia Scoon-Rogers. 1996. “Evaluating the Quality of Income Data Collected in the Annual Supplement to the March Current Population Survey and the Survey of Income and Program Participation.”
Groen, Jeffrey A. 2012. “Sources of Error in Survey and Administrative Data: The Importance of Reporting Procedures.” Journal of Official Statistics 28 (2): 173–198.
Hokayem, Charles, U S Census Bureau, James P Ziliak, and Christopher Bollinger. 2012. “The Role of CPS Non-Response on Trends in Poverty and Inequality.”
Internal Revenue Service. 2012. “Tax Year 2006 Tax Gap Estimate - Summary of Estimation Methods.”
———. 2013. “Statistics of Income Tax Stats - S Corporation Statistics.” http://www.irs.gov/uac/SOI-Tax-Stats-S-Corporation-Statistics.
Katz, Arnold J. “Explaining Long-term Differences Between Census and BEA Measures of Household Income.” 2012. Bureau of Economic Analysis Working Paper No. 0082.
Kim, C., and C. R. Tamborini. 2012. “Response Error in Earnings: An Analysis of the Survey of Income and Program Participation Matched With Administrative Data.” Sociological
Methods & Research.
Ledbetter, Mark. 2007. “Comparison of BEA Estimates of Personal Income and IRS Estimates of Adjusted Gross Income.” Survey of Current Business 87 (11): 35-41.
Lenze, David G. 2010. “Regional Quarterly Report.” Survey of Current Business 90 (10): 97–
106.
———. 2012. “Regional Quarterly Report.” Survey of Current Business 92 (10): 94–106.

52
McCully, Clinton P. "Integration of Micro and Macro Data on Consumer Income and Expenditures." Measuring Economic Sustainability and Progress. 2013.
Moore, Jeffrey C., Linda L. Stinson, and Edward J. Welniak Jr. 2000. “Income Measurement
Error in Surveys: A Review”: 1–34.
Roemer, Marc I. 2000. “Assessing the Quality of the March Current Population Survey and the Survey of Income and Program Participation Income Estimates, 1990-1996.”
Ruser, John, Adrienne Pilot, and Charles T. Nelson. 2004. “Alternative Measures of Household
Income: BEA Personal Income, CPS Money Income, and Beyond.”
Sengupta, Ishita, Marjorie Baldwin, and Virginia Reno. 2013. “Workers’ Compensation: Benefits, Coverage, and Costs, 2011”. Washington, DC.
Social Security Administration. 2009. “Annual Statistical Supplement to the Social Security
Bulletin, 2008.”
———. 2010. “Annual Statistical Supplement to the Social Security Bulletin, 2009.”
———. 2011. “Annual Statistical Supplement to the Social Security Bulletin, 2010.”
———. 2012. “Annual Statistical Supplement to the Social Security Bulletin, 2011.”
———. 2013. “Annual Statistical Supplement to the Social Security Bulletin, 2012.”
United States Railroad Retirement Board. 2013. “Financial, Actuarial & Statistical: Annual Railroad Retirement Act & Railroad Unemployment Insurance Act Data.” http://www.rrb.gov/act/Statistical_Tables.asp.
US Census Bureau. (2008). "A compass for understanding and using American Community Survey data: What general data users need to know."
———. 2012a. “2012 Statistical Abstract.” http://www.census.gov/compendia/statab/.
———. 2012b. “American Community Survey Accuracy of the Data (2012).”
———. 2013. “Technical Documentation for the March 2013: Annual Social and Economic (ASEC) Supplement.”
US Department of Veterans Affairs. 2012. “Annual Benefits Report: Fiscal Year 2012.”