comparing the real gross domestic product (gdp) of...
TRANSCRIPT
COMPARING THE REAL GROSS DOMESTIC PRODUCT (GDP) OF GEORGIA AND ARMENIA
EXECUTIVE SUMMARY The comparison of prices and real expenditures between Georgia and Armenia was carried out principally to enable Georgia to be incorporated into the 2011 round of the International Comparison Program (ICP) which is being coordinated by the World Bank to cover nearly 200 economies. This report deals only with the results of the bilateral comparison between Georgia and Armenia. This is interesting in its own right as they are countries of a similar size and with close economic links.
With Georgia = 100, real per capita GDP in Armenia was 105.3 in 2011 compared with 114.3 in 2005. Armenia is still richer than Georgian in terms of per capita GDP but the gap is narrowing. With Georgia = 100, the price level for GDP in Armenia was 98.9 in 2011 compared with 95.7 in 2005. The GDP price level in Georgia is still higher than in Armenia but the gap has almost disappeared. Between 2005 and 2011 the two countries became more similar as regards both real per capita GDP and overall price levels.
Other key findings:
In 2011, Armenians bought nearly twice the volume of food in shops as the Georgians: Georgians apparently make up the difference by eating more meals in restaurants.
The same appears to be true regarding beverages. For example, in 2011 Armenians bought 83 per cent more non-alcoholic beverages in shops than the Georgians but Georgians drink more such beverages in bars and restaurants.
In 2011, Georgians consumed 80 per cent more tobacco per capita than Armenians even though the average price of tobacco products was 12 per cent higher in Georgia.
In 2011, compared with Armenians Georgians consumed significantly more health services, household furnishings, equipment and maintenance, and spent more on the operation of transport equipment, and on machinery and equipment for industry. Compared with Georgians, Armenians purchased significantly more clothing, footwear, transport equipment, communications services and construction.
For most consumer goods and services price levels were similar in the two countries in 2011. The main exceptions are bakery and dairy products, alcohol, tobacco, accommodation, education and transport services which were all over 10 per cent more expensive in Georgia: oils and fats for cooking, fruit and vegetables, transport equipment, and communications services were all over 10 per cent more expensive in Armenia.
The price levels for investment goods were higher in Armenia than in Georgia both in 2005 and 2011. The average prices of machinery and equipment were nearly 20 per cent higher in Armenia in 2011 (4 percent higher in 2005): the price level index for building and construction was about 5 per cent higher in Armenia in 2011 (11 per cent higher in 2005).
This project required close collaboration between the two countries in the collection of prices for over 1200 items, in their verification to ensure that like was being compared with like, and in calculating Purchasing Power Parities and Real Expenditures. The successful completion of the project is a proof of the excellent professional cooperation between statisticians in ARMSTAT and GEOSTAT.
2
ACKNOWLEDGEMENTS The comparison of prices and real expenditures was a joint project carried out by the national statistical agencies of Armenia and Georgia - ARMSTAT and GEOSTAT – together with the ICP Global Office hosted at the World Bank
The following professional staff were involved in ARMSTAT:
Mr. Gagik Gevorgyan – Member of State Council on Statistics;
Mr. Gurgen Martirosyan - Head of Price Statistics and International Comparisons Division;
Ms. Mariam Yeritsyan - Principal Specialist, Price Statistics and International Comparisons Division;
Ms. Gayane Petrosyan - Principal Specialist, Price Statistics and International Comparisons Division;
Ms. Karine Avetisyan – Leading Specialist, Price Statistics and International Comparisons Division;
Ms. Lusya Khachatryan - Head of National Accounts and Macroeconomic Indicators Division;
Ms. Nadejda Astratsaturova - Principal Specialist, National Accounts and Macroeconomic Indicators Division.
The following professional staff were involved in GEOSTAT:
Mr. Tengiz Tsekvava – Deputy Executive Director;
Mr. Levan Karsaulidze – Head of Price Statistics Division;
Mr. Levan Gogoberishvili – Head of National Accounts Division
Ms. Tsitsino Lobjanidze – Chief Specialist, Price Statistics Division;
Ms. Nana Tsiklauri – Chief Specialist, Price Statistics Division;
Ms. Maia Chelidze – Senior Specialist, Price Statistics Division;
Ms. Nona Tsiklauri – Senior Specialist, Price Statistics Division;
Mr. Gela Darjania – Contract Employee, Price Statistics Division;
Mr. Giorgi Melikovi – Senior Specialist, Price Statistics Division;
Ms. Khatuna Aptsiauri – Senior Specialist, Price Statistics Division;
Ms. Megi Gogoberishvili – Contract Employee, Price Statistics Division;
Ms. Maka Kalandarishvili – Chief Specialist, National Accounts Division.
The ICP Global Office ensured that funding was provided by the World Bank and other donors to cover the participation costs of Armenian and Georgian staff in the nine consultations that were held in Tbilisi and Yerevan from 2010 to 2013. The ICP Global Office also provided three advisors to assist in the comparison: Derek Blades and David Roberts, international statistical consultants, and Sergey Sergeev, Senior Economist and Statistician in Statistics Austria.
The results of this comparison have been incorporated into the 2011 round of the International Comparison Program (ICP) which was coordinated by the ICP Global Office hosted at the World Bank.
This joint project has provided both countries with the opportunity to learn from each other and to adopt better international practices in the areas of price statistics and national accounts. It is an example of the excellent professional relations that exists between statisticians in the two countries.
Our thanks and congratulations to all concerned for the successful completion of this project.
President of ARMSTAT ICP 2011 Global Manager Executive Director of GEOSTAT
Stepan Mnatsakanyan Michel Mouyelo-Katoula Meri Daushvili
3
TABLE OF CONTENTS EXECUTIVE SUMMARY ............................................................................................................................ 1
ACKNOWLEDGEMENTS ........................................................................................................................... 2
COMPARING THE REAL GDP OF GEORGIA AND ARMENIA .................................................................... 4
Introduction ......................................................................................................................................... 4
How the real expenditure comparisons were made ........................................................................... 4
Comparing price levels in Georgia and Armenia ................................................................................. 5
Four problem areas ............................................................................................................................. 6
Rents for dwellings .......................................................................................................................... 6
Building and construction ............................................................................................................... 7
Government services ....................................................................................................................... 7
Reference PPPs ................................................................................................................................ 7
Reliability of the results ....................................................................................................................... 8
Results ................................................................................................................................................. 9
TABLE 1: MAIN RESULTS BY PRODUCT GROUPS: 2011 ................................................................. 12
TABLE 2: FINAL CONSUMPTION EXPENDITURE : 2011 ................................................................. 13
TABLE 3: GOODS AND SERVICES: 2011 .......................................................................................... 13
TABLE 4: MAIN RESULTS BY PRODUCT GROUPS: 2005 ................................................................. 14
TECHNICAL ANNEX ................................................................................................................................ 15
4
COMPARING THE REAL GDP OF GEORGIA AND ARMENIA
Introduction In 2011 the statistical offices of Georgia and Armenia collected the prices of a large common set of goods and services. The purpose was to estimate the price levels in each country so that the Gross Domestic Products (GDP) and the main expenditure components of the two countries could be compared on a real basis. A “real basis” means that the comparison is made between the volumes of goods and services being consumed in each country. In the same way that we have to eliminate price changes from one year to the next when we measure the real growth of a single country’s GDP, so we must eliminate price differences between countries when we want to make a real comparison of their GDP at a single point in time.
This joint project between GEOSTAT and ARMSTAT is part of the International Comparison Program (ICP) which is being organized by the World Bank1 to make global comparisons for nearly 200 countries for the year 2011. The report on the ICP 2011 was published in the first half of 2014 and shows the relative sizes of total and per capita real GDP for Georgia and Armenia in the world as a whole. This report deals only with the bilateral comparison between Georgia and Armenia. It shows the relative sizes of real GDP in each country, both total GDP and on a per capita basis. As well as GDP as a whole, this report also compares the relative sizes of the main expenditure components of GDP, namely: household consumption expenditure, government consumption expenditure, and gross fixed capital formation (or “investment”) and some important product groups within those expenditure components. In addition to these real GDP figures, this report also shows the relative price levels of various goods and services in the two countries.
The report on the 2011 ICP gives results for Georgia and Armenia in international dollars but the relative sizes of the two countries’ GDP and expenditure components are exactly the same as shown in this report.
How the real expenditure comparisons were made2 When we calculate a price index such as the Consumer Price Index we first calculate the price changes from one period to another by dividing the present price of each item selected for the index by its price in an earlier period. These price changes are then averaged to obtain the overall index using weights that represent the relative importance of each item. The Consumer Price Index is a “temporal” index: it measures price changes over time. When we calculate a “spatial” price index to compare price differences between countries, we proceed in exactly the same way. We divide the prices of different kinds of meat in Georgia with the prices of the same items in Armenia – each in their own currencies, Lari and Dram respectively. The price-relatives of the different kinds of meat are used to obtain the average price relative – or “Purchasing Power Parity” (PPP) - for the product group - Meat. Next, the PPPs for meat and other kinds of food are averaged using the shares of expenditures on meat and the other food items in GDP to get the PPP for Food. Subsequently, the PPP for food is averaged, again using expenditure weights that reflect their importance in GDP, with the PPPs for all other types of expenditures to get the overall PPP – or “inter-country price index” - for GDP. As the expenditure shares are different in Georgia and Armenia, we use each country’s expenditure shares as the weights and average two results.
Table A shows how PPPs are used to “deflate” nominal expenditures as reported by each country in their own currency to obtain real expenditures, which are the main objective of the comparison.
1 The World Bank funded consultants to advise on this bilateral comparison, but the data collection and verification and the
calculations were carried out by statisticians from GEOSTAT and ARMSTAT. For more information on the ICP 2011 see http://siteresources.worldbank.org/ICPEXT/Resources/ICP_2011.html 2 A Technical Annex gives more details of the calculation of Purchasing Power Parities for this comparison.
5
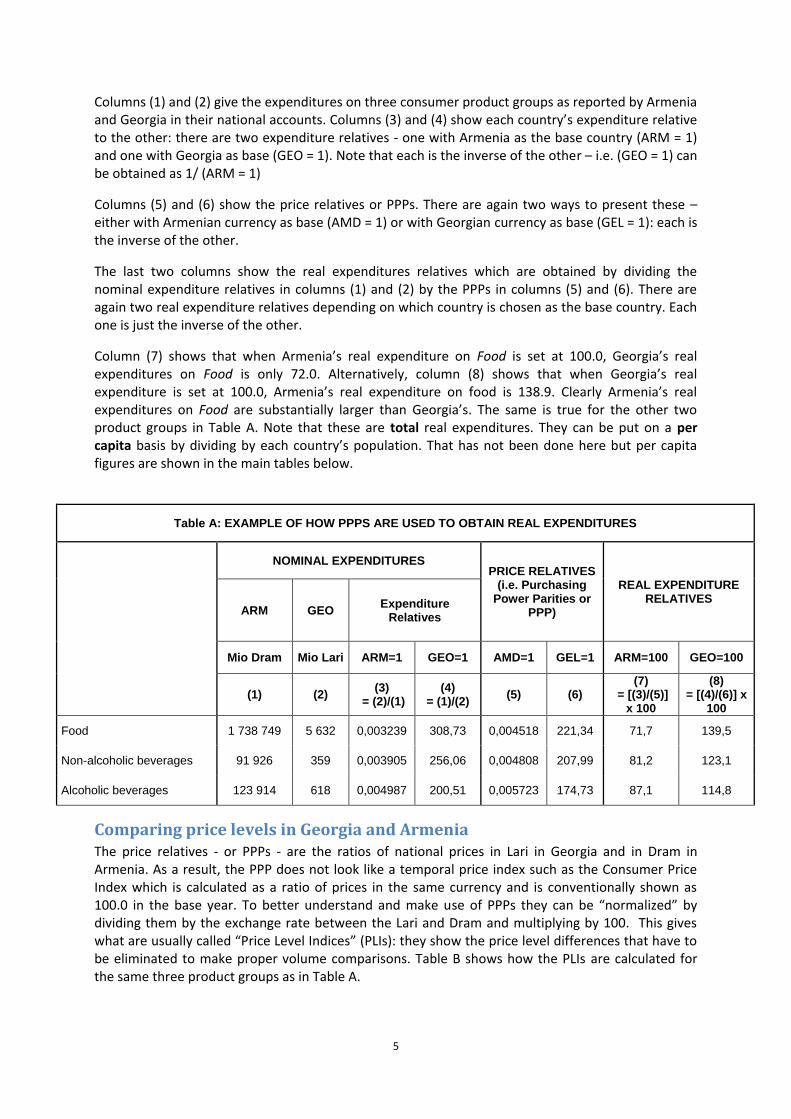
Columns (1) and (2) give the expenditures on three consumer product groups as reported by Armenia and Georgia in their national accounts. Columns (3) and (4) show each country’s expenditure relative to the other: there are two expenditure relatives - one with Armenia as the base country (ARM = 1) and one with Georgia as base (GEO = 1). Note that each is the inverse of the other – i.e. (GEO = 1) can be obtained as 1/ (ARM = 1)
Columns (5) and (6) show the price relatives or PPPs. There are again two ways to present these – either with Armenian currency as base (AMD = 1) or with Georgian currency as base (GEL = 1): each is the inverse of the other.
The last two columns show the real expenditures relatives which are obtained by dividing the nominal expenditure relatives in columns (1) and (2) by the PPPs in columns (5) and (6). There are again two real expenditure relatives depending on which country is chosen as the base country. Each one is just the inverse of the other.
Column (7) shows that when Armenia’s real expenditure on Food is set at 100.0, Georgia’s real expenditures on Food is only 72.0. Alternatively, column (8) shows that when Georgia’s real expenditure is set at 100.0, Armenia’s real expenditure on food is 138.9. Clearly Armenia’s real expenditures on Food are substantially larger than Georgia’s. The same is true for the other two product groups in Table A. Note that these are total real expenditures. They can be put on a per capita basis by dividing by each country’s population. That has not been done here but per capita figures are shown in the main tables below.
Table A: EXAMPLE OF HOW PPPS ARE USED TO OBTAIN REAL EXPENDITURES
NOMINAL EXPENDITURES PRICE RELATIVES
(i.e. Purchasing Power Parities or
PPP)
REAL EXPENDITURE RELATIVES
ARM GEO Expenditure
Relatives
Mio Dram Mio Lari ARM=1 GEO=1 AMD=1 GEL=1 ARM=100 GEO=100
(1) (2) (3)
= (2)/(1) (4)
= (1)/(2) (5) (6)
(7) = [(3)/(5)]
x 100
(8) = [(4)/(6)] x
100
Food 1 738 749 5 632 0,003239 308,73 0,004518 221,34 71,7 139,5
Non-alcoholic beverages 91 926 359 0,003905 256,06 0,004808 207,99 81,2 123,1
Alcoholic beverages 123 914 618 0,004987 200,51 0,005723 174,73 87,1 114,8
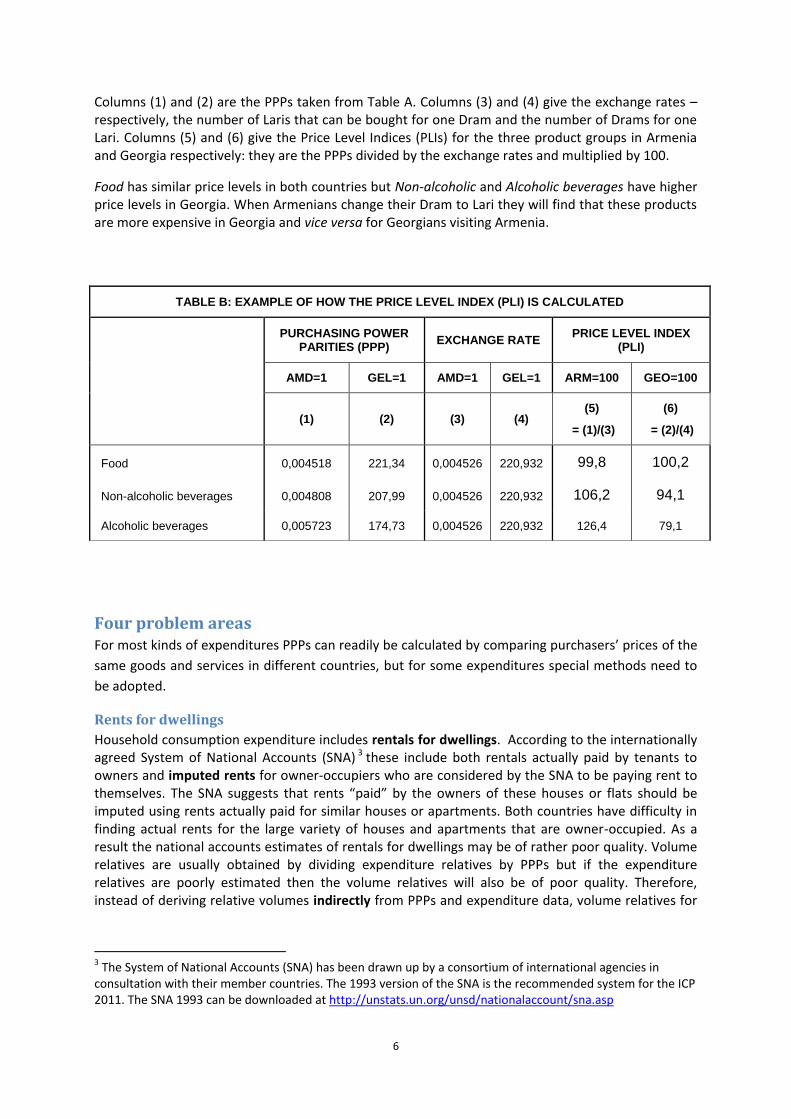
Comparing price levels in Georgia and Armenia The price relatives - or PPPs - are the ratios of national prices in Lari in Georgia and in Dram in Armenia. As a result, the PPP does not look like a temporal price index such as the Consumer Price Index which is calculated as a ratio of prices in the same currency and is conventionally shown as 100.0 in the base year. To better understand and make use of PPPs they can be “normalized” by dividing them by the exchange rate between the Lari and Dram and multiplying by 100. This gives what are usually called “Price Level Indices” (PLIs): they show the price level differences that have to be eliminated to make proper volume comparisons. Table B shows how the PLIs are calculated for the same three product groups as in Table A.
6
Columns (1) and (2) are the PPPs taken from Table A. Columns (3) and (4) give the exchange rates – respectively, the number of Laris that can be bought for one Dram and the number of Drams for one Lari. Columns (5) and (6) give the Price Level Indices (PLIs) for the three product groups in Armenia and Georgia respectively: they are the PPPs divided by the exchange rates and multiplied by 100.
Food has similar price levels in both countries but Non-alcoholic and Alcoholic beverages have higher price levels in Georgia. When Armenians change their Dram to Lari they will find that these products are more expensive in Georgia and vice versa for Georgians visiting Armenia.
Four problem areas For most kinds of expenditures PPPs can readily be calculated by comparing purchasers’ prices of the
same goods and services in different countries, but for some expenditures special methods need to
be adopted.
Rents for dwellings
Household consumption expenditure includes rentals for dwellings. According to the internationally agreed System of National Accounts (SNA) 3 these include both rentals actually paid by tenants to owners and imputed rents for owner-occupiers who are considered by the SNA to be paying rent to themselves. The SNA suggests that rents “paid” by the owners of these houses or flats should be imputed using rents actually paid for similar houses or apartments. Both countries have difficulty in finding actual rents for the large variety of houses and apartments that are owner-occupied. As a result the national accounts estimates of rentals for dwellings may be of rather poor quality. Volume relatives are usually obtained by dividing expenditure relatives by PPPs but if the expenditure relatives are poorly estimated then the volume relatives will also be of poor quality. Therefore, instead of deriving relative volumes indirectly from PPPs and expenditure data, volume relatives for
3 The System of National Accounts (SNA) has been drawn up by a consortium of international agencies in consultation with their member countries. The 1993 version of the SNA is the recommended system for the ICP 2011. The SNA 1993 can be downloaded at http://unstats.un.org/unsd/nationalaccount/sna.asp
TABLE B: EXAMPLE OF HOW THE PRICE LEVEL INDEX (PLI) IS CALCULATED
PURCHASING POWER PARITIES (PPP)
EXCHANGE RATE PRICE LEVEL INDEX
(PLI)
AMD=1 GEL=1 AMD=1 GEL=1 ARM=100 GEO=100
(1) (2) (3) (4) (5)
= (1)/(3)
(6)
= (2)/(4)
Food 0,004518 221,34 0,004526 220,932 99,8 100,2
Non-alcoholic beverages 0,004808 207,99 0,004526 220,932 106,2 94,1
Alcoholic beverages 0,005723 174,73 0,004526 220,932 126,4 79,1
7
rentals for dwellings have been estimated directly by comparing the volumes of “dwelling services” consumed in the two countries.
The volume relatives have been calculated as follow:
- The floor-space of dwellings in square metres is taken as a quantity indicator of the dwelling services in the two countries;
- A quality indicator was calculated as the average of the percentages of dwellings in each country that have electricity, that have piped water, and that have an inside toilet;
- Each country’s total floor space is multiplied by the quality indicator to obtain a “quality-adjusted” indicator of the volume of dwelling services;
- The volume relatives are obtained as each country’s quality-adjusted quantity indicator divided by the other’s.
Building and construction
Gross fixed capital formation (GFCF) is one of the expenditure components of GDP for which prices had to be collected. GFCF includes building and construction and this causes a special problem because no two buildings or construction projects are exactly the same. This means it is not possible to compare the purchasers’ price of the same buildings, bridges, roads and so on in the two countries. Instead of comparing prices of actual buildings and construction projects, prices of inputs were collected i.e. prices of building materials, labour and hire of equipment. Technical coefficients were then used to combine these input prices in order to estimate the purchasers’ prices of a representative range of standard buildings and construction projects such as an apartment block, a kilometer of highway, a primary school, a supermarket, a factory building, and so on. The price comparison between Georgia and Armenia was based on the estimated costs of these various standard buildings and construction projects. These standard buildings and construction projects are “imaginary” as none were actually constructed in either country in 2011. However they are representative of the different sorts of structures that were actually put in place.
Government services
Government presents another problem. Government expenditure on providing services like defense, law and order, health, education, tax collection, and so on, is one of the components of the GDP. But none of these government services are sold so that there are no prices that can be compared between the two countries. Instead of comparing prices, therefore, the comparison has to be based on the costs of providing government services. Wages and salaries are the major cost and the comparison of government services between Georgia and Armenia was mainly determined by differences between the two countries in the wages and salaries of a range of government occupations – police officers, teachers, tax collectors, statisticians and the like.
Reference PPPs
The ICP Classification for GDP contains 183 detailed product groups. Prices have not been collected for some of these groups either because they account for a very small share of GDP or because prices are not available. Product groups for which no prices were collected have been assigned reference PPPs. Reference PPPs are either those that have been calculated for a product group whose price relatives are thought to be similar to those of the group for which no prices have been collected, or they are “neutral” PPPs meaning that they will have very little impact on the major expenditure aggregate to which the product group belongs. For example, the average PPP for all product groups for which prices have been collected under the major aggregate GFCF is used as a reference PPP for product groups under GFCF for which no prices have been collected. For this comparison between Georgia and Armenia, reference PPPs have been used for 41 product groups.
8
The reference PPPs and the solutions and decisions adopted for the other three problems have been agreed with the ICP Global office and similar methods are being used by the other countries participating in the 2011 ICP.
Reliability of the results The reliability of the PPPs and the real GDP estimates shown below depends on:
The accuracy and comparability of the GDP estimates in each country;
The accuracy of the detailed expenditure weights; and
The accuracy and comparability of the price data.
Both GEOSTAT and ARMSTAT have been compiling GDP estimates for more than two decades and have continued to improve the coverage and reliability of their estimates as new information becomes available and as better methods of compilation are adopted. Both countries follow the 1993 System of National Accounts (SNA) so their GDP estimates are compiled following the same definitions and rules.
For this comparison GEOSTAT and ARMSTAT were required to break down their total GDP into 183 detailed product groups. This is more detail than either country shows in their regular GDP estimates and some of these expenditure weights may be rather approximate at least for items that only account for small shares of total GDP. For the larger, more important, groups the weights are much more accurate. Note that this is not the first time that GEOSTAT and ARMSTAT have had to break GDP down in this amount of detail. Both countries have been participating in international comparisons for more than twenty years and so were able to build on past experience in estimating expenditures for the 183 product groups.
Both countries collected prices from a representative selection of outlets - supermarkets, convenience stores, covered markets, open markets, small shops, and kiosks. In Georgia, prices were collected only in Tbilisi and were converted to national average Georgia prices using adjustment factors taken from GEOSTAT’s Consumer Price Index which covers the four largest cities after Tbilisi. In Armenia, prices were collected in the 3 largest cities (Yerevan, Gyumri, Vanadzor) and averaged to obtain national Armenian prices.
Care was taken to ensure that “like was compared with like”. Each item to be priced was carefully defined to ensure strict comparability between the items whose prices were being collected in the two countries. Both countries used the Structured Product Descriptions developed by the ICP Global Office. For food items, for example, the quantity, type of packaging, and quality features were all specified to ensure that the items being priced were as comparable as possible. In many cases brands-names were used to ensure even better comparability - for example McDonald’s cheeseburger, Nescafe instant coffee, Coca Cola Lite, Uncle Ben’s rice, and Marlboro cigarettes.
It is obviously not feasible to collect the price of every single item available in each country so the prices used in these calculations were collected for only a selection of all the goods and services that can be found in Georgia and Armenia. The overall reliability of the price comparisons depends, therefore, on the extent to which the prices of this small selection reflect the prices of the items that were not selected. Care was taken to identify items that are most commonly purchased in each country and most of the prices collected were for goods and services judged to be important in each country.
All statistics are subject to error, but the World Bank advisors have concluded that the estimates given here are based on statistics that have been carefully collected and verified and that the overall reliability is high. They also consider that the PPPs and real expenditure shown here are as reliable as
9
those of many of the countries participating in the Eurostat-OECD PPP Programme which has been running for many years and so has achieved good standards of accuracy.4
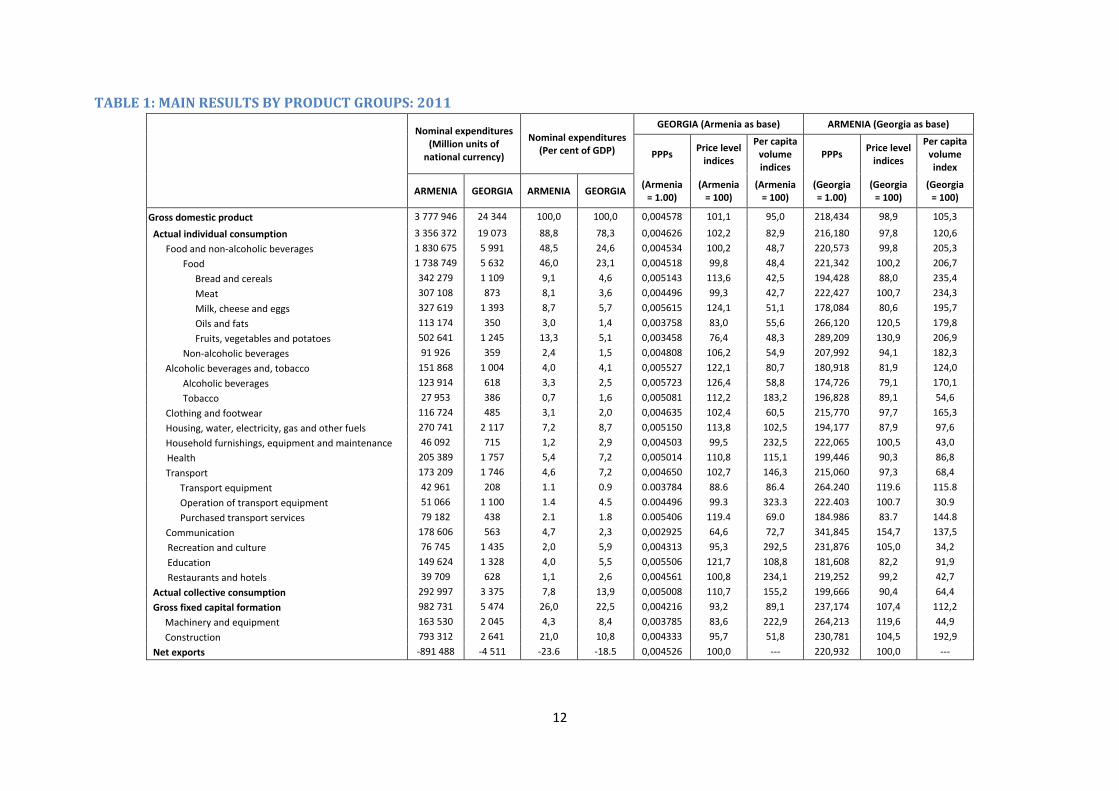
Results Tables 1 to 3 give the results of the bilateral comparison between Georgia and Armenia for 2011. Table 4 gives comparable results from the 2005 round of the ICP as some readers will be interested to see how relative price levels and real expenditures have changed since then. Georgia participated in the ICP 2005 as a member of the CIS regional group and this means that the Georgia-Armenia comparison for 2005 is based on a multilateral rather than a bilateral comparison. In a multilateral comparison each country’s results are influenced to some extent by the data supplied by all the other countries in the group. Strictly speaking, therefore, a two-country comparison taken from a multilateral comparison is not fully comparable with a bilateral comparison restricted to the two countries concerned. If a bilateral comparison between Georgia and Armenia had been made in 2005 the results would not be exactly the same as those given in Table 4, but in practice the differences would usually be small.
Table 1 refers to actual individual consumption of households rather than to final consumption expenditure. Actual consumption of households consists of what households spend directly on goods and services plus the value of the services they receive on an individual basis from government – mainly education, health and recreation and cultural services.
Looking first at the per capita volume indices in Table 1:
Georgia’s real expenditure on Food is less than half of that in Armenia. Here Food means raw or prepared food bought in shops and Georgians make up for their lower Food expenditures by consuming more restaurant meals. Georgian real expenditures on Hotels and restaurants (mainly expenditure on restaurants in Georgia’s case) is twice as high as in Armenia.
Armenian real expenditure on Beverages (both alcoholic and non-alcoholic) is substantially higher than in Georgia. For example, with Georgia = 100, Armenia’s per capita volume index for Non- alcoholic beverages is 182.3. As in the case of Food, Georgians consume more Beverages of all kinds in restaurants and bars than the Armenians.
Georgians consume about 80 per cent more Tobacco than Armenians: with Armenia = 100, the per capita volume index for Georgia is 183.2. This is despite the 12 per cent higher prices of tobacco products in Georgia.
Georgians consume substantially more Household furnishings, equipment and maintenance services, Transport, and Recreation and culture than Armenians, while Armenians consume more Clothing and footwear and Communications services than the Georgians.
Georgian consumption of both Health and Education services is higher than in Armenia: with Armenia = 100, Georgia’s per capita volume indices are 115.1 and 108.8 respectively.
In general, price levels are rather similar in the two countries and the PLIs in Table 1 are mostly within 10 per cent of each other. The main exceptions are:
As regards consumer goods and services, Armenian price levels are more than 10 per cent lower than in Georgia for Bread and cereals, Milk, cheese and eggs, Alcoholic beverages, Tobacco, Housing, electricity and fuels, Transport services and Education. In Georgia, price levels are more than 10 per cent lower than in Armenia for Oils and fats, Fruit and vegetables, Transport equipment and Communications services. The price level difference for
4 The Eurostat-OECD PPP Programme covers all member states of the European Union, EU candidate countries, and the United States, Canada, Mexico, Chile, Japan, Korea, Australia, New Zealand, Russia, and Israel. For full details see Eurostat-OECD Methodological Manual on Purchasing Power Parities, 2012 edition, Eurostat and OECD, Luxembourg 2012.
10
Communications was particularly marked: the price level in Armenia was over 50% higher than in Georgia.
The price levels for investment goods were higher in Armenia than in Georgia. The average prices of machinery and equipment were nearly 20 per cent higher in Armenia and the price level index for building and construction was about 5 per cent higher in Armenia.
The price level of Actual collective consumption is just over 10 per cent higher in Georgia. This consists of government expenditure on general public services, defence, public order and safety, economic affairs, environment protection, and housing and community amenities. The price level is higher in Georgia because government employees in these activities are paid more than their Armenian counterparts.
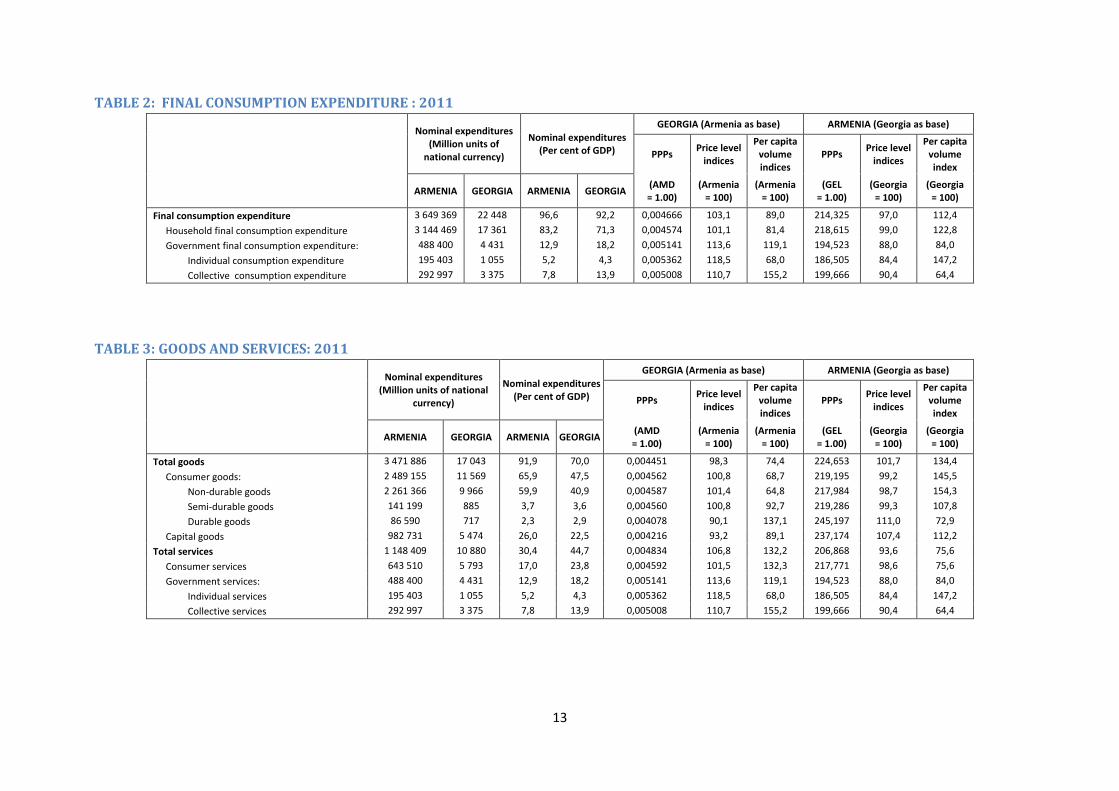
As noted above, Table 1 shows Actual Individual consumption by households. This consists of what households spend directly plus the value of the services – mainly health and education - supplied to them on an individual basis by the government. Table 2 shows Final consumption expenditures by households and government – that is what households and governments spend directly. The per capita volume indices for households’ final consumption expenditures show that Armenian households spent about 23 per cent more than Georgian households. Government Individual consumption expenditure is also higher in Armenia than in Georgia: with Georgia = 100 the per capita volume index for Armenia was 147.2. Another way of putting it is that Georgian households spend less money on goods and services than Armenian households and they also get fewer individual services such as government health, education, recreational and cultural services.
Table 3 compares expenditures in the two countries on goods as opposed to services. Armenians consume about one third more goods than the Georgians. The difference is particularly large for Non-durable goods (e.g. food) and rather smaller for Semi-durable goods (e.g. clothing, footwear). On the other hand, Georgians consume more Durable goods (e.g. motor cars, refrigerators) and they also consume about one third more consumer services than Armenians (e.g. restaurants, recreation, and transport). Georgians, however, consume substantially fewer Individual services of government (e.g. cultural services and education): with Armenia = 100 per capita consumption of individual government services was only 68 in Georgia. As regards price levels, in Armenia Durable goods are about 10 per cent more expensive and Capital goods (e.g. machinery, equipment, and buildings) are about 7 per cent more expensive. Total services are more expensive in Georgia by around 7 per cent on average, but this is due to the higher price level for Government services. Consumer services (e.g. transport, communications, and personal services) have about the same price level in both countries.
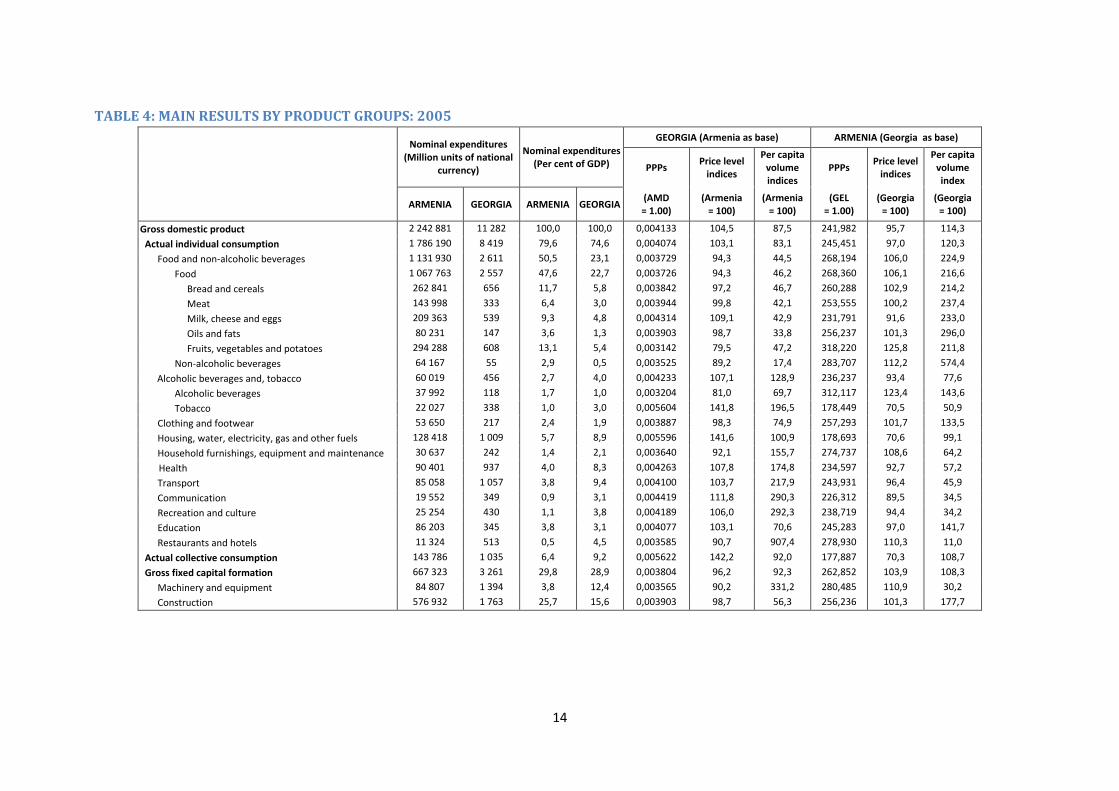
Table 4 shows the main results for 20055 and these can be compared with the corresponding figures for 2011 in Table 1. Some key findings:
In terms of total GDP Georgia is catching up with Armenia. With Georgia = 100, the per capita volume index for Armenia was 114.3 in 2005 indicting that real GDP per head in Armenia was about 14 per cent above that in Georgia. By 2011, however, Armenia’s per capita volume index, with Georgia again = 100, had fallen to 105.3 meaning that by 2011 per capita GDP in Armenia was only about 5 per cent higher than Georgia’s.
Price levels are also converging; with Armenia = 100, Georgia’s GDP price level index in 2005 was 104.5 – 4.5 per cent higher than in Armenia, but by 2011 the GDP price level had fallen 101.1 – just 1.1 per cent above the overall price level in Armenia.
Relative to Armenians, Georgians increased their consumption of Milk, cheese and eggs, Oils and fats, Non-alcoholic beverages, Household furnishings, equipment and maintenance, and Education but, compared to Armenians, they consumed less Health, Transport and
5 Armenian national accounts data and population figures submitted by ARMSTAT for the 2005 round of ICP were later revised and the figures in Table 4 reflect these revisions. As a result the figures in Table 4 differ from the official 2005 results.

11
Communications services. There was also a big change for Hotels and restaurants: in 2005, per capita consumption in Georgia was nine times higher than in Armenia but by 2011 Georgia’s per capita volume index was only twice as high as Armenia’s. The likely explanation is that more Armenians are using these services and more tourists visited Armenia in 2011.
Relative to Georgia, between 2005 and2011 price levels in Armenia fell for Milk, cheese and eggs, Non-alcoholic beverages, Alcoholic beverages, Education, and Restaurants and hotels. However, between 2005 and 2011, price levels in Armenia rose compared to Georgia, for Oils and fats, Tobacco, Communications, and Housing, water, electricity, gas and other fuels.
12
TABLE 1: MAIN RESULTS BY PRODUCT GROUPS: 2011
Nominal expenditures (Million units of
national currency)
Nominal expenditures (Per cent of GDP)
GEORGIA (Armenia as base) ARMENIA (Georgia as base)
PPPs Price level
indices
Per capita volume indices
PPPs Price level
indices
Per capita volume index
ARMENIA GEORGIA ARMENIA GEORGIA (Armenia
= 1.00) (Armenia
= 100) (Armenia
= 100) (Georgia = 1.00)
(Georgia = 100)
(Georgia = 100)
Gross domestic product 3 777 946 24 344 100,0 100,0 0,004578 101,1 95,0 218,434 98,9 105,3
Actual individual consumption 3 356 372 19 073 88,8 78,3 0,004626 102,2 82,9 216,180 97,8 120,6
Food and non-alcoholic beverages 1 830 675 5 991 48,5 24,6 0,004534 100,2 48,7 220,573 99,8 205,3
Food 1 738 749 5 632 46,0 23,1 0,004518 99,8 48,4 221,342 100,2 206,7
Bread and cereals 342 279 1 109 9,1 4,6 0,005143 113,6 42,5 194,428 88,0 235,4
Meat 307 108 873 8,1 3,6 0,004496 99,3 42,7 222,427 100,7 234,3
Milk, cheese and eggs 327 619 1 393 8,7 5,7 0,005615 124,1 51,1 178,084 80,6 195,7
Oils and fats 113 174 350 3,0 1,4 0,003758 83,0 55,6 266,120 120,5 179,8
Fruits, vegetables and potatoes 502 641 1 245 13,3 5,1 0,003458 76,4 48,3 289,209 130,9 206,9
Non-alcoholic beverages 91 926 359 2,4 1,5 0,004808 106,2 54,9 207,992 94,1 182,3
Alcoholic beverages and, tobacco 151 868 1 004 4,0 4,1 0,005527 122,1 80,7 180,918 81,9 124,0
Alcoholic beverages 123 914 618 3,3 2,5 0,005723 126,4 58,8 174,726 79,1 170,1
Tobacco 27 953 386 0,7 1,6 0,005081 112,2 183,2 196,828 89,1 54,6
Clothing and footwear 116 724 485 3,1 2,0 0,004635 102,4 60,5 215,770 97,7 165,3
Housing, water, electricity, gas and other fuels 270 741 2 117 7,2 8,7 0,005150 113,8 102,5 194,177 87,9 97,6
Household furnishings, equipment and maintenance 46 092 715 1,2 2,9 0,004503 99,5 232,5 222,065 100,5 43,0
Health 205 389 1 757 5,4 7,2 0,005014 110,8 115,1 199,446 90,3 86,8
Transport 173 209 1 746 4,6 7,2 0,004650 102,7 146,3 215,060 97,3 68,4
Transport equipment 42 961 208 1.1 0.9 0.003784 88.6 86.4 264.240 119.6 115.8
Operation of transport equipment 51 066 1 100 1.4 4.5 0.004496 99.3 323.3 222.403 100.7 30.9
Purchased transport services 79 182 438 2.1 1.8 0.005406 119.4 69.0 184.986 83.7 144.8
Communication 178 606 563 4,7 2,3 0,002925 64,6 72,7 341,845 154,7 137,5
Recreation and culture 76 745 1 435 2,0 5,9 0,004313 95,3 292,5 231,876 105,0 34,2
Education 149 624 1 328 4,0 5,5 0,005506 121,7 108,8 181,608 82,2 91,9
Restaurants and hotels 39 709 628 1,1 2,6 0,004561 100,8 234,1 219,252 99,2 42,7
Actual collective consumption 292 997 3 375 7,8 13,9 0,005008 110,7 155,2 199,666 90,4 64,4
Gross fixed capital formation 982 731 5 474 26,0 22,5 0,004216 93,2 89,1 237,174 107,4 112,2
Machinery and equipment 163 530 2 045 4,3 8,4 0,003785 83,6 222,9 264,213 119,6 44,9
Construction 793 312 2 641 21,0 10,8 0,004333 95,7 51,8 230,781 104,5 192,9
Net exports -891 488 -4 511 -23.6 -18.5 0,004526 100,0 --- 220,932 100,0 ---
13
TABLE 2: FINAL CONSUMPTION EXPENDITURE : 2011
Nominal expenditures (Million units of
national currency)
Nominal expenditures (Per cent of GDP)
GEORGIA (Armenia as base) ARMENIA (Georgia as base)
PPPs Price level
indices
Per capita volume indices
PPPs Price level
indices
Per capita volume index
ARMENIA GEORGIA ARMENIA GEORGIA (AMD = 1.00)
(Armenia = 100)
(Armenia = 100)
(GEL = 1.00)
(Georgia = 100)
(Georgia = 100)
Final consumption expenditure 3 649 369 22 448 96,6 92,2 0,004666 103,1 89,0 214,325 97,0 112,4
Household final consumption expenditure 3 144 469 17 361 83,2 71,3 0,004574 101,1 81,4 218,615 99,0 122,8
Government final consumption expenditure: 488 400 4 431 12,9 18,2 0,005141 113,6 119,1 194,523 88,0 84,0
Individual consumption expenditure 195 403 1 055 5,2 4,3 0,005362 118,5 68,0 186,505 84,4 147,2
Collective consumption expenditure 292 997 3 375 7,8 13,9 0,005008 110,7 155,2 199,666 90,4 64,4
TABLE 3: GOODS AND SERVICES: 2011
Nominal expenditures (Million units of national
currency)
Nominal expenditures (Per cent of GDP)
GEORGIA (Armenia as base) ARMENIA (Georgia as base)
PPPs Price level
indices
Per capita volume indices
PPPs Price level
indices
Per capita volume index
ARMENIA GEORGIA ARMENIA GEORGIA (AMD = 1.00)
(Armenia = 100)
(Armenia = 100)
(GEL = 1.00)
(Georgia = 100)
(Georgia = 100)
Total goods 3 471 886 17 043 91,9 70,0 0,004451 98,3 74,4 224,653 101,7 134,4
Consumer goods: 2 489 155 11 569 65,9 47,5 0,004562 100,8 68,7 219,195 99,2 145,5
Non-durable goods 2 261 366 9 966 59,9 40,9 0,004587 101,4 64,8 217,984 98,7 154,3
Semi-durable goods 141 199 885 3,7 3,6 0,004560 100,8 92,7 219,286 99,3 107,8
Durable goods 86 590 717 2,3 2,9 0,004078 90,1 137,1 245,197 111,0 72,9
Capital goods 982 731 5 474 26,0 22,5 0,004216 93,2 89,1 237,174 107,4 112,2
Total services 1 148 409 10 880 30,4 44,7 0,004834 106,8 132,2 206,868 93,6 75,6
Consumer services 643 510 5 793 17,0 23,8 0,004592 101,5 132,3 217,771 98,6 75,6
Government services: 488 400 4 431 12,9 18,2 0,005141 113,6 119,1 194,523 88,0 84,0
Individual services 195 403 1 055 5,2 4,3 0,005362 118,5 68,0 186,505 84,4 147,2
Collective services 292 997 3 375 7,8 13,9 0,005008 110,7 155,2 199,666 90,4 64,4
14
TABLE 4: MAIN RESULTS BY PRODUCT GROUPS: 2005
Nominal expenditures (Million units of national
currency)
Nominal expenditures (Per cent of GDP)
GEORGIA (Armenia as base) ARMENIA (Georgia as base)
PPPs Price level
indices
Per capita volume indices
PPPs Price level
indices
Per capita volume index
ARMENIA GEORGIA ARMENIA GEORGIA (AMD = 1.00)
(Armenia = 100)
(Armenia = 100)
(GEL = 1.00)
(Georgia = 100)
(Georgia = 100)
Gross domestic product 2 242 881 11 282 100,0 100,0 0,004133 104,5 87,5 241,982 95,7 114,3
Actual individual consumption 1 786 190 8 419 79,6 74,6 0,004074 103,1 83,1 245,451 97,0 120,3
Food and non-alcoholic beverages 1 131 930 2 611 50,5 23,1 0,003729 94,3 44,5 268,194 106,0 224,9
Food 1 067 763 2 557 47,6 22,7 0,003726 94,3 46,2 268,360 106,1 216,6
Bread and cereals 262 841 656 11,7 5,8 0,003842 97,2 46,7 260,288 102,9 214,2
Meat 143 998 333 6,4 3,0 0,003944 99,8 42,1 253,555 100,2 237,4
Milk, cheese and eggs 209 363 539 9,3 4,8 0,004314 109,1 42,9 231,791 91,6 233,0
Oils and fats 80 231 147 3,6 1,3 0,003903 98,7 33,8 256,237 101,3 296,0
Fruits, vegetables and potatoes 294 288 608 13,1 5,4 0,003142 79,5 47,2 318,220 125,8 211,8
Non-alcoholic beverages 64 167 55 2,9 0,5 0,003525 89,2 17,4 283,707 112,2 574,4
Alcoholic beverages and, tobacco 60 019 456 2,7 4,0 0,004233 107,1 128,9 236,237 93,4 77,6
Alcoholic beverages 37 992 118 1,7 1,0 0,003204 81,0 69,7 312,117 123,4 143,6
Tobacco 22 027 338 1,0 3,0 0,005604 141,8 196,5 178,449 70,5 50,9
Clothing and footwear 53 650 217 2,4 1,9 0,003887 98,3 74,9 257,293 101,7 133,5
Housing, water, electricity, gas and other fuels 128 418 1 009 5,7 8,9 0,005596 141,6 100,9 178,693 70,6 99,1
Household furnishings, equipment and maintenance 30 637 242 1,4 2,1 0,003640 92,1 155,7 274,737 108,6 64,2
Health 90 401 937 4,0 8,3 0,004263 107,8 174,8 234,597 92,7 57,2
Transport 85 058 1 057 3,8 9,4 0,004100 103,7 217,9 243,931 96,4 45,9
Communication 19 552 349 0,9 3,1 0,004419 111,8 290,3 226,312 89,5 34,5
Recreation and culture 25 254 430 1,1 3,8 0,004189 106,0 292,3 238,719 94,4 34,2
Education 86 203 345 3,8 3,1 0,004077 103,1 70,6 245,283 97,0 141,7
Restaurants and hotels 11 324 513 0,5 4,5 0,003585 90,7 907,4 278,930 110,3 11,0
Actual collective consumption 143 786 1 035 6,4 9,2 0,005622 142,2 92,0 177,887 70,3 108,7
Gross fixed capital formation 667 323 3 261 29,8 28,9 0,003804 96,2 92,3 262,852 103,9 108,3
Machinery and equipment 84 807 1 394 3,8 12,4 0,003565 90,2 331,2 280,485 110,9 30,2
Construction 576 932 1 763 25,7 15,6 0,003903 98,7 56,3 256,236 101,3 177,7
15
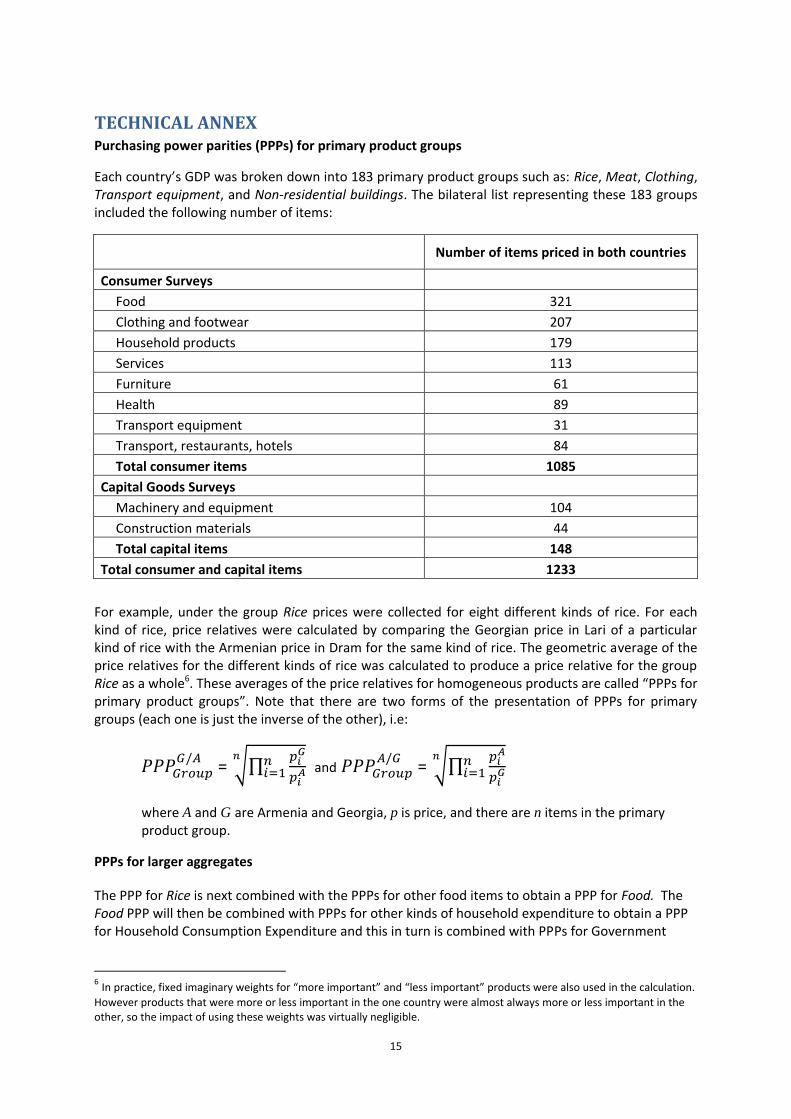
TECHNICAL ANNEX Purchasing power parities (PPPs) for primary product groups
Each country’s GDP was broken down into 183 primary product groups such as: Rice, Meat, Clothing, Transport equipment, and Non-residential buildings. The bilateral list representing these 183 groups included the following number of items:
Number of items priced in both countries
Consumer Surveys Food 321
Clothing and footwear 207
Household products 179
Services 113
Furniture 61
Health 89
Transport equipment 31
Transport, restaurants, hotels 84
Total consumer items 1085
Capital Goods Surveys Machinery and equipment 104
Construction materials 44
Total capital items 148
Total consumer and capital items 1233
For example, under the group Rice prices were collected for eight different kinds of rice. For each kind of rice, price relatives were calculated by comparing the Georgian price in Lari of a particular kind of rice with the Armenian price in Dram for the same kind of rice. The geometric average of the price relatives for the different kinds of rice was calculated to produce a price relative for the group Rice as a whole6. These averages of the price relatives for homogeneous products are called “PPPs for primary product groups”. Note that there are two forms of the presentation of PPPs for primary groups (each one is just the inverse of the other), i.e:
= √∏
and
= √∏
where A and G are Armenia and Georgia, p is price, and there are n items in the primary product group.
PPPs for larger aggregates
The PPP for Rice is next combined with the PPPs for other food items to obtain a PPP for Food. The Food PPP will then be combined with PPPs for other kinds of household expenditure to obtain a PPP for Household Consumption Expenditure and this in turn is combined with PPPs for Government
6 In practice, fixed imaginary weights for “more important” and “less important” products were also used in the calculation.
However products that were more or less important in the one country were almost always more or less important in the other, so the impact of using these weights was virtually negligible.
16
Expenditure, for Capital Formation, and the Foreign Trade Balance to produce the PPP for Gross Domestic Product as a whole.
Aggregation of the PPPs for primary product groups is done using expenditure weights which are calculated as the shares of expenditure on each primary product group in total expenditure on the GDP or respective aggregate (with the sum of the shares = 1 or 100). As there are two separate sets of expenditure weights, i.e. Georgia’s expenditure shares and Armenia’s expenditure shares, the aggregated PPPs are the geometric averages (Fisher’s index) of the PPPs weighted using each set of weights (Laspeyres and Paasche indices). For example, the ARM / GEO PPP for Food is obtained as follows:
[∑
( ∑
) ]
where there are k primary product groups in Food, and W are the expenditure weights on these various Food product groups as shares in total Food.
In other words, the ARM / GEO PPP for Food is the geometric average of the ARM / GEO product group PPPs for Food items weighted by Georgian shares (arithmetic mean) and those same PPPs weighted by Armenian shares (harmonic mean). The GEO / ARM PPP for Food is obtained in a parallel fashion.