comparison between aggregation techniques for pmsg … benha/electrical... · comparison between...
TRANSCRIPT

Energy Procedia 74 ( 2015 ) 1162 – 1173
ScienceDirect
1876-6102 © 2015 The Authors. Published by Elsevier Ltd. This is an open access article under the CC BY-NC-ND license (http://creativecommons.org/licenses/by-nc-nd/4 .0/).Peer-review under responsibility of the Euro-Mediterranean Institute for Sustainable Development (EUMISD)doi: 10.1016/j.egypro.2015.07.759
International Conference on Technologies and Materials for Renewable Energy, Environment and Sustainability, TMREES15
Comparison between Aggregation Techniques for PMSG Wind Farm
Mohammed. A. Badra, Ahmed. M. Atallahb, Mona A. Bayoumic,* aElectrical Engineering Department, Ain-Shames University, Cairo, [email protected], EGYPT bElectrical Engineering Department, Ain-Shames University, Cairo, [email protected], EGYPT cElectrical Engineering Department, Benha University, Benha, [email protected], EGYPT
Abstract
This paper presents a wind farm composed of different permanent synchronous generator (PMSG) wind turbines (same wind turbine technology but different rated power or operational conditions) coupled to the same grid connection point. A comparison between the three techniques of wind farm aggregation for a farm composed of PMSG wind turbines. Our comparison is for the closeness of the results of normal and transient response of both the complete model and the aggregated models. The chosen three techniques are, multi full aggregated model using equivalent wind speed (MFAM-EWS), semi aggregated model (SAM) and mixed semi full aggregated model (MSFAM). Simulation has been carried out for these techniques by MATLAB/SIMULINK program to compare them with the complete model to prove the effectiveness of each aggregation technique.
© 2015 The Authors. Published by Elsevier Ltd. Peer-review under responsibility of the Euro-Mediterranean Institute for Sustainable Development (EUMISD).
Keywords: Wind power; aggregation model; PMSG.
* Corresponding author. Tel.: 00201283992983.
E-mail address: [email protected]
Available online at www.sciencedirect.com
© 2015 The Authors. Published by Elsevier Ltd. This is an open access article under the CC BY-NC-ND license (http://creativecommons.org/licenses/by-nc-nd/4.0/).Peer-review under responsibility of the Euro-Mediterranean Institute for Sustainable Development (EUMISD)
Mohammed. A. Badr et al. / Energy Procedia 74 ( 2015 ) 1162 – 1173 1163
1. Introduction
Wind power has an important role in the future energy in many regions across the world. Where wind energy is one of the most important permanent clean energy sources. The growing worldwide market will lead to further improvements, such as larger wind turbines and offshore wind farms. These improvements will lead to further cost reductions [1].
Modeling of wind farms for network integration studies is becoming an important issue. Increasing the number of wind turbines in the wind farm has increased farm size, thus simulating the whole wind farm by modeling each wind turbine separately leads to complexity and reduces the speed of the simulation. In order to reduce the computational time and the complexity, they [2,3,4,5] simplify the whole wind farm by aggregated wind farm model.
The aggregated wind farm represents full wind farm with groups of turbines or one single equivalent turbine. This aggregated model can first represent the behavior (active and reactive power exchanged with the grid) during normal operation characterized by small deviations and changes of wind speeds. Secondly, it represents the behavior of wind farm during grid disturbances, such as voltage drops and frequency deviations [2]. The aggregated wind farm represents the full reaction of wind turbines to any wind fluctuations and grid disturbances.
There are different wind turbine generator types, which have become widespread and commonly used in wind power. However, due to the attractive characteristics of permanent magnet synchronous generators such as noise reduction, higher reliability, gearless, higher efficiency, lower cost, and smaller size, the need to study the aggregated models with PMSG based wind turbines has increased [6]. Therefore, PMSG wind turbines have been traded by some WT manufactures, such as Siemens Power Generation, GoldWind and GE Energy.
This paper focuses on the comparison between the complete wind farm and some of aggregated models using MATLAB/SIMULINK program. The complete wind farm consists of different PMSG wind turbines (the same wind turbine technology but different rated power and operational points), experiencing different incoming wind speeds. The aggregated models that have been considered in this paper are; (1) multi full aggregated model using equivalent wind speed (MFAM-EWS), (2) semi aggregated model (SAM) and (3) mixed semi full aggregated model (MSFAM).
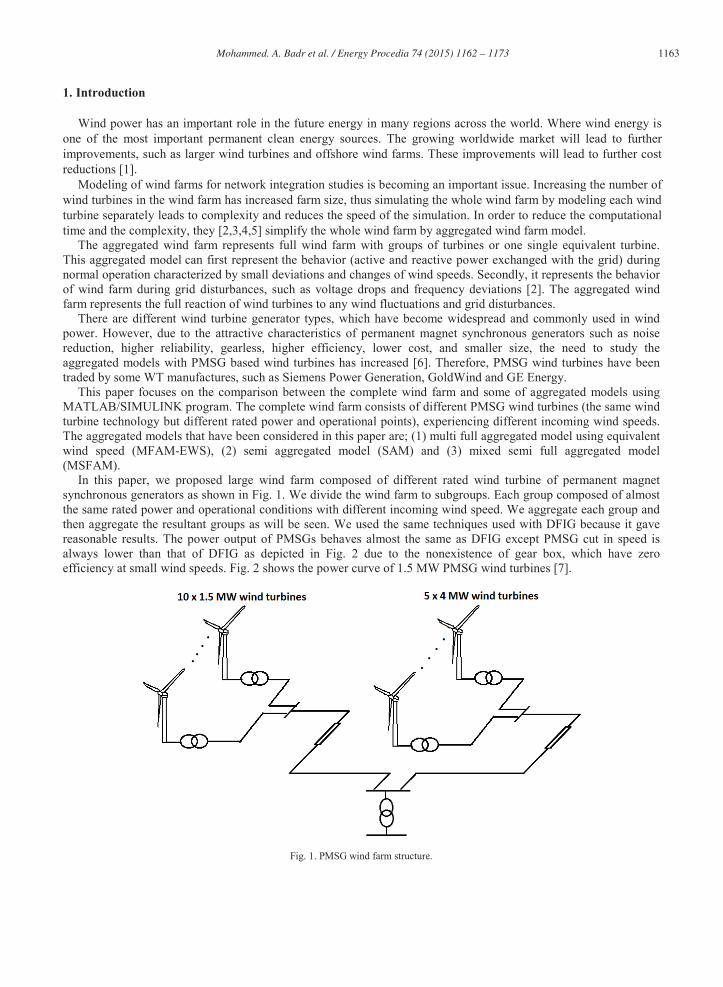
In this paper, we proposed large wind farm composed of different rated wind turbine of permanent magnet synchronous generators as shown in Fig. 1. We divide the wind farm to subgroups. Each group composed of almost the same rated power and operational conditions with different incoming wind speed. We aggregate each group and then aggregate the resultant groups as will be seen. We used the same techniques used with DFIG because it gave reasonable results. The power output of PMSGs behaves almost the same as DFIG except PMSG cut in speed is always lower than that of DFIG as depicted in Fig. 2 due to the nonexistence of gear box, which have zero efficiency at small wind speeds. Fig. 2 shows the power curve of 1.5 MW PMSG wind turbines [7].
Fig. 1. PMSG wind farm structure.

1164 Mohammed. A. Badr et al. / Energy Procedia 74 ( 2015 ) 1162 – 1173
Fig. 2. Dynamic power curve of GoldWind 1.5 MW PMSG wind turbine.
2. PMSG Wind Turbine Model
This paper uses 48 pole PMSG and back to back (B2B) Converter. Pulse width modulation (PWM) is used to produce the switching signals for converter switches. There is a braking resistor and capacitor between the two converters. Fig. 3 explains the general configuration of a PMSG system and we will study each component of the PMSG wind turbine.
Fig. 3. Configuration of a PMSG wind turbine.
2.1. Aerodynamic model
The kinetic energy of the wind produces a mechanical torque is converted into the electric energy through generator. The aerodynamic power in the rotor of the turbine model is given by equation [8]:
( )θλρω ,5.0 3pCAuP =
(1)
where P is the aerodynamic power, (kg/m3) the air density, A(m2) the rotor swept area, u(m/s) the wind speed, and Cp the power coefficient as a function of the tip speed ratio and the pitch angle of rotor blades. The wind turbine can produce maximum power when the turbine operates at maximum Cp (i.e., at Cp_opt). Therefore, it is necessary to keep the rotor speed at an optimum value of the tip speed ratio opt. If the wind speed varies, the rotor speed should be adjusted to follow the change [9].

Mohammed. A. Badr et al. / Energy Procedia 74 ( 2015 ) 1162 – 1173 1165
2.2. Mechanical shaft modeling
The mechanical energy is transferred from the generator through the drive train. In multi pole PMSGs there is no need to gear box which allows to operate at low speeds, so the generator is connected directly to wind turbine.
The drive train is represented by one mass model, where all rotating masses are represented by only one element as depicted in the following equation [10]:
dtdJTT r
eqemω=− (2)
where Tm & Te are the mechanical torque and electrical torque and Jeq is the equivalent inertia of the rotating system.
2.3. PMSG model
The dynamic model of the PMSG has been built in the d-q reference frame rotating at electrical speed with the position of the direct axis aligned along the permanent magnet flux position. The stator voltage equations in d-q reference frame have the following form [11]:
sqsqesd
sdsdssd iLdt
diLiRv ω+−−= (3)
( )sdsdmesq
sqsqssq iLdt
diLiRv −+−−= ψω (4)
where vsd, vsq are the generator voltages, isd , isq , are the generator currents, Rs is the stator winding resistance, Lsd, Lsq are the stator inductances, m is the magnet flux and e is the generator angular speed.
The mechanical equation is described by the following electromagnetic torque equation:
( )sqsdsqsdsqme iiLLipT )(23 −+= ψ (5)
As the PMSG uses a surface magnet generator, the inductances in a d-q reference frame are identical, so the electromagnetic torque can be expressed as:
sqme ipT ψ23= (6)
where p is the number of pole pairs. Equation (6) shows that the generator torque is controlled directly by iq component. The direct axis component of the current can be set to zero to minimize the current and hence minimizing resistive losses.
2.4. Power converter model
The PSMG is connected directly to the grid through B2B converter, where the converter is represented by a 3-phase controlled voltage source. These sources are driven by the control voltages of the PWM converters. Capacitor voltage variation represents the AC power flow in or out the converter. In this paper, we have used average converter model instead of the detailed converter model, where average converter model implies no switching, no change in circuit topology and it speeds up the simulation model. Neglecting converter losses the power balance equation can be obtained as follows [12]:

1166 Mohammed. A. Badr et al. / Energy Procedia 74 ( 2015 ) 1162 – 1173
sgDC PPP ++=0 (7)
dtdVCViVP DC
DCDCDCDC −== (8)
( )gsDC
DC PPCVdt
dV −= 1 (9)
where PDC is the active power of the DC-link, Pg is the active power at the AC terminal of the grid side converter, Psis the output active power of the PMSG, VDC is the capacitor terminal voltage, iDC is the capacitor current and C is the capacitance.
2.5. Braking resistor
The braking resistor is effective during normal operating conditions. When the voltage drops in the system, the terminal voltage of a wind turbine generator is reduced; also the active power that the wind turbine can export to the grid is reduced too. The energy imbalance appears in the wind turbine because the output power is quickly reduced by the inverter controller, while the input power extracted from the wind may not be reduced as quickly. This increase in energy in the DC link circuit cannot be exported. A braking resistor is placed in DC Link so as to dissipate this excess energy and restore the balance again. The braking resistor in variable speed drives balances the changes in output torque and prevent the DC link voltage to rise quickly [13]. This resistance is controlled using a power electronic switch as shown in Fig. 3.
2.6. Grid side converter model
The dynamic model of the grid connection when selecting a reference frame rotating synchronously with the grid voltage space vector is the following [14]:
gqgqggd
gdgdgcdgd iLdt
diLiRvv ω+−−=
(10)
gdgdggq
gqgqgcqgq iLdt
diLiRvv ω−−−= (11)
where vgd, vgq are the grid voltages, vcd, vcq are the voltage components of the grid side converter, igd, igq, are the grid currents, Rg is the grid resistance, Lgd, Lgq are the grid inductances and g is the grid frequency.
The active and reactive power in the synchronous reference frame is as follows:
( ) ( )gqgdgdgqggqgqgdgdg ivivQivivP −=+=23,
23
(12)
As the d-axis of the reference frame is oriented along the grid voltage 0.jvv gdg += , the active and reactive powers can be expressed as [11]:
gqgdggdgdg ivQivP23,
23 −== (13)
From equation 13, it can be deduced that the active and reactive power control can be achieved by controlling the direct and quadrature current components respectively.

Mohammed. A. Badr et al. / Energy Procedia 74 ( 2015 ) 1162 – 1173 1167
3. Control Strategy
This system has three levels of the controller. The function of each level will be explained as:
3.1 Generator side converter
As described in Fig. 4 the goal of this controller is to work at the generator speed that extracts the maximum power from the wind without exceed allowable limits [11]. The parameters of PI controller are described in Appendix C.
Fig. 4. Generator side converter control system.
3.2 Grid side converter
The aim of this controller is to maintain DC link voltage and frequency constant and to control the reactive power transferred to the network [9]. The structure the proposed controller is shown in Fig.5. The parameters of PI controller are described in Appendix C.
Fig. 5. Grid side converter control system.
3.3 Pitch angle control
This controller is necessary to control the rotational speed of the wind turbine. It activates in high wind speeds where the speed of the rotor exceeding the maximum rotor speed of the turbine via increase the blade pitch angle in order to reduce Cp and then reduces the power extracted from the wind [15].

1168 Mohammed. A. Badr et al. / Energy Procedia 74 ( 2015 ) 1162 – 1173
4. Aggregate Modeling Techniques
As mentioned before this paper working on a comparison between the complete wind farm model and the other three aggregated models. Now each technique will be explained separately.
4.1 Multi full aggregate model using equivalent wind speed
In this technique the full wind farm is divided into groups, each group contains the same wind turbine types (same capacity and operational conditions), then each group is represented by equivalent wind turbine as shown in Fig. 6.
Fig. 6. Multi full aggregated model.
For identical wind turbines, equivalent wind turbine and equivalent generator presents n-times the size of individual wind turbines, as described in the following equation [5]:
j
n
jjeq SnSS
=
==1
(14)
and the size of the equivalent compensating capacitors is given by:
j
n
jjeq CnCC
=
==1
(15)
where n is the number of wind turbines in a wind farm, Sj is the rated apparent power of each wind turbines, Seq is the rated apparent power of the equivalent wind turbine and Cj is the capacitance of each wind turbines.
The equivalent wind turbine or full aggregated wind turbine using equivalent wind speed (FWM_EWS) is consistent of one equivalent wind turbine and one equivalent generator (aggregated generator) with equivalent wind speed as shown in Fig. 7. The equivalent wind speed is derived from the power curve of the wind turbine as proposed in [5]:

Mohammed. A. Badr et al. / Energy Procedia 74 ( 2015 ) 1162 – 1173 1169
Fig. 7. Full aggregated model using equivalent wind speed.
4.2 Semi aggregated model
In the semi aggregated model (SAM), we have used the dynamic simplified model of each wind turbine with its speed to get the corresponding torques. Then, we sum up these torques to get the equivalent torque. Applying an equivalent torque to an equivalent generator model to get total active and reactive power exported to the grid system as shown in Fig.8.
Fig .8. Semi aggregated model.
4.3 Mixed semi full aggregated model
This technique merges between MFAM_EWS and SAM. In this technique, we group wind turbines that have the same type, size and parameters to one equivalent wind turbine. Each equivalent wind turbine receives its own equivalent wind speed, then; the output of all equivalent wind turbines is aggregated and inserted it into the equivalent generator as shown in Fig. 9.
Fig. 9. Mixed semi full aggregated model.

1170 Mohammed. A. Badr et al. / Energy Procedia 74 ( 2015 ) 1162 – 1173
5. Simulation Results
This research works on a large windMATLAB/SIMULINK program. This wind turbines. Fig. 1 presents 10 x 1.5 MW PMSdistribution system exporting power to a 22wind turbine is 11 m/s and the rated speedturbine type are provided in Appendix A.
The simulation studies the behavior of thecompares between the complete wind farmnormal condition (wind fluctuations) and fauthe PMSG wind turbines are depicted in aphigher wind speeds.
5.1 Normal operation
During normal operation, wind farm opcomplete and the three aggregated wind foperation are shown in Fig. 10.
(a)
Fig. 10. (a) Active power at PCC durin
When the three aggregated modeling teaggregated model using EWS achieve a betSo we can depend on MFAM_EWS for repre
5.2 Grid disturbance
Assuming that the network voltage has drFig. 11 compares between the responses of condition.
d farm with a capacity of a 35 MW wind fafarm consists of 15 PMSG wind turbines with differ
SG and 5 x 4 MW PMSG. These smaller farms conn0 KV grid through a 30 km 60 KV feeder. The rated
d of 4MW wind turbine is 13 m/s. The main parame
e wind farm integrated into the grid during steady statm and the aggregated models under two different ope
ult condition (grid disturbances). The variable wind sppendix B. 4 MW wind turbine has a higher elevatio
erates under wind speed fluctuations. The collectivefarm models at the point of common coupling (PC
(b)
ng normal operation; (b) Reactive power at PCC during normal oper
echniques are compared as depicted in Fig. 10(a, tter approximation of active and reactive power to theesenting the complete wind farm.
ropped to its half value due to a fault for a period of 0.f the complete wind farm and the three aggregated m
arm simulated by rent types of wind nected to a 60 KV
d speed of 1.5 MW eters of each wind
te and transients. It erating conditions: speeds received by on and exposed to
e responses of the CC) during normal
ration.
b), the multi full e complete model.
.5 second at t=10s. models during fault

Mohammed. A. Badr et al. / Energy Procedia 74 ( 2015 ) 1162 – 1173 1171
(a)
Fig. 11. (a) Active power at PCC dur
As shown in Fig. 11, it is clear that the Mstability. This means that we can rely on MFthe nearest results in active and reactive pow
The comparison of accuracy in active acomplete and aggregated wind farm models
Table 1. Accuracy in closeness.
Aggregated m
Accuracy in
Accuracy in
Table 2. Computation time.
Aggregated model
Computation time (
This observation demonstrates that any othe only 15 wind turbines used and MFAM_
(b)
ring grid disturbance; (b) Reactive power at PCC during grid disturb
MFAM_EWS is much closer to the complete wind farFAM_EWS even in cases of system dynamic disturbanwer. and reactive power (P and Q) and computation simu
are shown in Table 1and Table 2, respectively.
model MFAM-EWS SAM MSFAM
n P 0.06% 1.82% 0.88%
n Q 2.18% 10.28% 8.58%
l complete MFAM-EWS SAM MSFAM
(s) 203 36 31 26
of the three techniques consume lesser time than the c_EWS has a high accuracy in approximation to the wh
bance.
rm during transient nces, where it gives
ulation time for the
complete model for hole wind farm.
1172 Mohammed. A. Badr et al. / Energy Procedia 74 ( 2015 ) 1162 – 1173
6. Conclusion
This research has presented three aggregated models of variable speed wind farm equipped with PMSG wind turbines for dynamic studies. This study includes: 1- multi full aggregated model using equivalent wind speed, 2- semi aggregated model and 3- mixed semi full aggregated model. A comparison between the complete wind farm and these aggregated models using MATLAB/SIMULINK program during normal and abnormal conditions are performed. As a conclusion multi full aggregated model using equivalent wind speed model has the highest accuracy to the complete model in steady and transient states as well as it consumes less time in the simulation compared with the complete model. A complete simulation of the system items has been discussed and presented.
References
[1] T. Ackermann, Ed.,Wind power in power systems, 2nd ed. John Wiley & Sons, 2012. [2] J. Conroy, R. Watson. Aggregate modelling of wind farms containing full-converter wind turbine generators with permanent magnet
synchronous machines: transient stability studies. IET, Renewable Power Generation, vol. 3, pp. 39 - 52, 2009. [3] M. Ali, I.-S. Ilie, J.V. Milanovic, G. Chicco. Wind farm model aggregation using probabilistic clustering. IEEE Transactions on Power
Systems, Vol 28, pp. 309 - 316, 2013. [4] C. A. García, L. M. Fernández, F. Jurado. Evaluating reduced models of aggregated different doubly fed induction generator wind turbines for
transient stabilities studies. Wind Energy, Vol 18, pp. 133 - 152, 2015. [5] L. M. Fernandez, C. A. Garcia, J. R. Saenz, F.Jurado, “Equivalent models of wind farms by using aggregated wind turbines and equivalent
winds. Energy Conversion and Management, vol. 50, pp. 691–704, 2009. [6] C. N. Bhende, S. Mishra, S.G. Malla. Permanent magnet synchronous generator-based standalone wind energy supply system. IEEE
Transactions on Sustainable Energy, pp. 361- 373, 2011. [7]http://www.goldwindamerica.com/media/2012/12/Goldwind_15MW_Product_Brochure_2013.pdf [8] T. L.Van, T. H. Nguyen, D. Lee. Advanced pitch angle control based on fuzzy logic for variable-speed wind turbine systems. IEEE
Transactions on Energy Conversion, pp. 1-10, 2015. [9] Md. E. Haque, M. Negnevitsky, K. M. Muttaqi. A Novel control strategy for a variable-speed wind turbine with a permanent-magnet
synchronous generator. IEEE Transactions on Industry Applications, vol. 46, pp. 331 - 339, 2010. [10] V. Akhmatov. Modelling and ride-through capability of variable speed wind turbines with permanent magnet generators. Wind Energy, Vol
9, Issue 4, pp. 313–326, 2006. [11] J. Ivanqui, H. Voltolini, R. Carlson, and E. H. Watanabe , ““pq theory” control applied to wind turbine trapezoidal PMSG under symmetrical
fault,” IEEE International, Electric Machines & Drives Conference (IEMDC), pp. 534 – 540, 2013. [12] F. Wu, X.-P. Zhangb, P. Ju. Small signal stability analysis and control of the wind turbine with the direct-drive permanent magnet generator
integrated to the grid. Elsevier, Electric Power Systems Research 79, pp. 1661–1667, 2009. [13] J. F. Conroy, R. Watson. Low-voltage ride-through of a full converter wind turbine with permanent magnet generator. IET, Renewable
Power Generation, vol. 1, pp. 182-189, 2007. [14] M. Chinchilla, S. Arnaltes, J. C. Burgos. Control of permanent-magnet generators applied to variable-speed wind-energy systems connected
to the grid,” IEEE Transactions on Energy Conversion, vol 21, pp. 130-135, 2006. [15] F. M. González-Longatt, P. Wall, V. Terzija. A Simplified model for dynamic behavior of permanent magnet synchronous generator for
direct drive wind turbines. IEEE Trondheim , PowerTech , pp. 1–7, 2011.
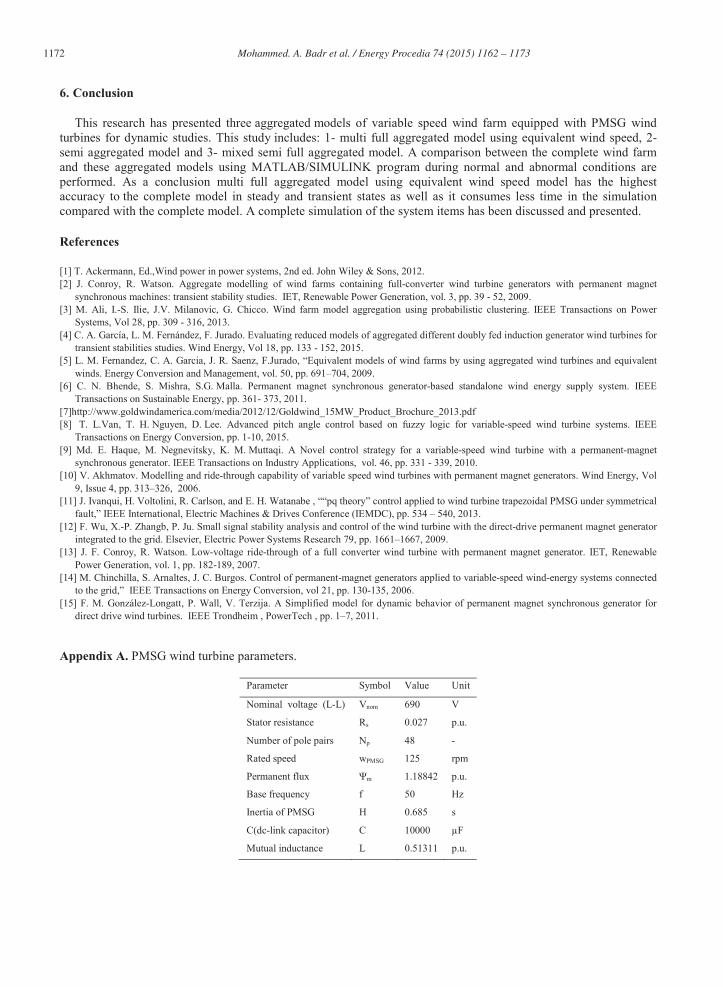
Appendix A. PMSG wind turbine parameters.
Parameter Symbol Value Unit
Nominal voltage (L-L) Vnom 690 V
Stator resistance Rs 0.027 p.u.
Number of pole pairs Np 48 -
Rated speed wPMSG 125 rpm
Permanent flux m 1.18842 p.u.
Base frequency f 50 Hz
Inertia of PMSG H 0.685 s
C(dc-link capacitor) C 10000 F
Mutual inductance L 0.51311 p.u.

Mohammed. A. Badr et al. / Energy Procedia 74 ( 2015 ) 1162 – 1173 1173
Appendix B. Wind speeds incident on the wind turbines.
Wind turbine Wind speed (m/s) Wind turbine Wind speed (m/s)
WT1 7 WT9 8.3
WT2 9 WT10 7.8
WT3 8 WT11 10
WT4 8.5 WT12 11
WT5 7.5 WT13 10.7
WT6 8.6 WT14 10.3
WT7 7.9 WT15 10.5
WT8 7.1
Appendix C. PI controller parameters.
Parameter Symbol Value Unit
Proportional gain of d-axis stator current regulator Kp1 0.1361 p.u.
Integrating gain of d-axis stator current regulator Ki1 2.7221 p.u.
Proportional gain of q-axis stator current regulator Kp2 0.1361 p.u.
Integrating gain of q-axis stator current regulator Ki2 2.7221 p.u.
Proportional gain of DC bus voltage regulator Kp3 8 p.u.
Integrating gain of DC bus voltage regulator Ki3 400 p.u.
Proportional gain of grid side converter current regulator Kp4 0.83 p.u.
Integrating gain of grid side converter current regulator Ki4 5 p.u.