comparison between lek counts and bioacoustic recording ... · die bioakustik befasst sich mit der...
TRANSCRIPT
Vol.:(0123456789)1 3
Journal of Ornithology https://doi.org/10.1007/s10336-019-01649-8
ORIGINAL ARTICLE
Comparison between lek counts and bioacoustic recording for monitoring Western Capercaillie (Tetrao urogallus L.)
Carlos Abrahams1,2
Received: 12 May 2018 / Revised: 3 September 2018 / Accepted: 1 March 2019 © The Author(s) 2019
AbstractBioacoustics is the study of animal sounds. The importance of bioacoustics for biological research and the survey and monitoring of bird populations is becoming increasingly recognized. This is particularly the case for the capture of long-term data on rare species that are prone to disturbance or are otherwise difficult to survey. The global population of the Western Capercaillie (Tetrao urogallus L.; hereafter ‘Capercaillie’) is declining, and its status in the UK is highly precarious. Current methods for monitoring this species are subject to a number of constraints that affect the quality of collected data. Bioacoustics could provide a useful complement to these existing methods, in particular for the assessment of activity at leks. This study used acoustic recorders to survey Capercaillie vocal activity for a month at ten lek sites, and quantified the numbers of calls produced. Traditional lek count surveys were undertaken at all sites during this time. The recorded vocal activity data (1) correlated with the number of birds recorded by human surveyors, (2) indicated that traditional surveys may be causing some disturbance at the lek sites, and (3) showed that call numbers are related to temporal and environmental variables. The bioacoustic approach can provide high-quality, long-term data, that can be effectively combined with the traditional lek survey technique. It should be utilized more frequently as a survey and monitoring tool to provide structured, coherent results that can be used to aid conservation efforts.
Keywords Rare species · Point count · Survey · Conservation
ZusammenfassungVergleich zwischen Balzplatzzählungen und bioakustischen Aufnahmen beim Monitoring des Auerhuhns (Tetrao urogallus L.)Die Bioakustik befasst sich mit der Untersuchung von Tierstimmen und deren Nutzen für die biologische Forschung. Sie gewinnt zunehmend an Anerkennung bei der Erfassung und dem Monitoring von Vogelpopulationen. Dies ist vor allem der Fall bei der Erhebung von Langzeitdaten zu seltenen Arten, welche störungsanfällig oder auf andere Weise schwer zu erfassen sind. Die globale Population des Auerhuhns (Tetrao urogallus L.) nimmt ab und ist vor allem im Vereinigten Königreich in einer höchst prekären Lage. Aktuelle Methoden beim Monitoring von Arten unterliegen zahlreichen Einschränkungen, welche die Qualität der gesammelten Daten beeinflussen. Die Bioakustik könnte eine nutzvolle Ergänzung oder Alternative zu diesen existierenden Methoden bieten, vor allem bei der Beurteilung von Aktivitäten an den Balzplätzen. Diese Studie verwendete akustische Aufnahmegeräte, um die Rufaktivität des Auerhuhns für einen Monat an zehn Balzplätzen zu untersuchen und die abgegebene Anzahl an Rufen zu quantifizieren. An allen Plätzen wurden während dieser Zeit zusätzlich traditionelle Balzplatzzählungen durchgeführt. Die aufgenommenen Rufaktivitätsdaten (i) korrelierten mit der Anzahl an Vögeln, die von den Beobachtern selber erfasst wurden, (ii) deuteten darauf hin, dass traditionelle Zählungen mit großer Wahrscheinlichkeit Störungen an den Balzplätzen verursachen und (iii) zeigten, dass die Rufanzahl in Zusammenhang mit Umweltvariablen steht. Der bioakustische Untersuchungsansatz bietet (neben anderen Vorteilen) Daten mit besserer Qualität, über einen längeren Zeitraum und mit einem geringeren Ressourcenbedarf als die traditionellen Verfahren der Balzplatzzählung. Sie sollte daher häufiger zu Untersuchungs- und Monitoringzwecken verwendet werden, um strukturierte, kohärente Daten zur Verfügung zu stellen, welche für Naturschutzbestrebungen unterstützend hinzugezogen werden können.
Communicated by S. Kipper.
Extended author information available on the last page of the article
Journal of Ornithology
1 3
Introduction
Bioacoustic techniques, involving the recording of animal sounds, have a long history in ecological study. However, technological innovations in the last 10–20 years have greatly increased the potential of this approach for research in a wide range of habitats and for a variety of taxa (Sueur et al. 2008; Marques et al. 2013). One particularly valuable area for development is the survey of bird assemblages or populations, including rare, cryptic and disturbance-prone species such as the Corncrake (Crex crex L.), Bit-tern (Botaurus stellaris L.), Nightjar (Caprimulgus euro-paeus L.) and Western Capercaillie (Tetrao urogallus L.) (Abrahams and Denny 2018). Automated static recording units (often called ‘passive’ or ‘autonomous’ recorders) are especially well suited to point count-type surveys for highly territorial and lekking species, where systematic spatial and temporal sampling can help determine occu-pancy, species composition or population size (Brandes 2008; Gasc et al. 2017; Shonfield and Bayne 2017).
Western Capercaillie (hereafter ‘Capercaillie’) is a rare and declining bird species in the UK, with a small rem-nant population in forest habitats in northeast Scotland (Wilkinson et al. 2018). The species has an ‘exploded’ lek mating system, where males display over a dispersed area to indicate their breeding condition—the numbers of birds attending dependent on the quality and amount of the surrounding old forest habitat (Hjorth 1970; Picozzi et al. 1992; Laiolo et al. 2011; Wegge et al. 2013). Alongside other methods (e.g. Jacob et al. 2010), counts of display-ing males at leks in spring are used to assess breeding population status and abundance for Capercaillie, for regional/national monitoring programmes (Picozzi et al. 1992; Pollo et al. 2005; Summers et al. 2010). In Scotland, these showed a decline in numbers of 29% between 2004 and 2010 (Ewing et al. 2012), although figures from 2010 to 2016 showed modest between-year fluctuations, with no significant overall trend (Wilkinson et al. 2018).
Although lek counting is one of the few ways to gain regular population data on this elusive species, there are a number of recognized problems with this method. Firstly, Capercaillies are known to be susceptible to human distur-bance (Ewing et al. 2012; Mollet et al. 2015), and regular impacts due to traditional counts could potentially have a negative effect on local populations. Surveys normally attempt to limit this disturbance by using trained survey-ors and employing hides while at the lek site (Haysom 2013). Secondly, the remoteness of many lek sites, com-bined with few suitably experienced surveyors, produces practical constraints on surveys, limiting their spatial and temporal coverage. With few monitoring visits taking place, the quality of data from lek counts may be affected
by differences in detection probabilities between sites or survey events, or by measurement and identification errors (Simons et al. 2009; Celis-Murillo et al. 2009). Finally, Capercaillie behaviour may affect lek attendance, and make the interpretation of count data difficult. Lek attend-ance is age dependent, with males aged > 2 years defend-ing territories close to the lek centre, while younger males establish peripheral territories or do not display territorial/lekking behaviour (Mollet et al. 2015). Time of day and date in the season can also impact lek-attendance patterns, and hence, lek counts. Such sources of variation need to be considered when assessing count data, and the detec-tion probability of birds estimated, protocols standardized, and lek counts adjusted to properly estimate populations (Walsh et al. 2004).
The use of acoustic recording, alongside existing survey methods, could reduce the recognized biases outlined above, enabling the improved monitoring of Capercaillie lek sites and providing more accurate population estimates (Laiolo et al. 2011; Oppel et al. 2014). This study used automated recording units for monitoring leks and aimed to determine how data from bioacoustic recording compares to the tradi-tional human lek count method. The objectives of the study were: (1) to compare methods of population assessment, by comparing counts of males from traditional surveys with levels of recorded call activity from the same leks; and (2) to determine whether the levels of call activity from different lek sites can be related to environmental variables, such as weather conditions.
Methods
Acoustic field recording
Ten Wildlife Acoustics (www.wildl ifeac ousti cs.com) Song-Meter SM2 acoustic recorders were placed at known Caper-caillie lek sites near Aviemore, Scotland (57.19°N, 3.82°W). A further two were also placed, but failed to record correctly, and were excluded from the analysis. The lek sites were commonly 3–5 km apart, with the furthest points at 27.5-km distance and encompassing an area of 209 km2. The record-ers were positioned on 4–5 April 2017, but programmed to start recording on 10 April 2017. Recorders were collected on completion of the 10 May 2017 recording session, after 31 days of operation.
Each recorder was programmed to record in mono, with one Wildlife Acoustics SMX-II omnidirectional microphone mounted on the recording unit. The recorders were placed in the vicinity of the normal lek count hide locations, with the microphones oriented horizontally towards the assumed lek site ‘centre’. The recorders were attached to trees at
Journal of Ornithology
1 3
approximately 1.5 m off the ground and Global Positioning System (GPS) coordinates taken.
The recorders were programmed to operate daily, from 1.5 h before sunrise until 1.5 h after sunrise. This resulted in a recording period from 0451–0751 hours on 10 April 2017 to 0326–0626 hours on 10 May 2017. Recording was limited to these times based on previous experience (Abra-hams and Denny 2018), standard lek count practice (Haysom 2013) and surveyor advice (S. West, personal communica-tion), whilst saving the limited battery life and data storage capacity.
Data was recorded in 10-min-duration full-spectrum data files in Waveform Audio File (.wav) format on SD cards at a sampling rate of 8000 Hz and 16 bits/sample. This resulted in recordings covering the frequency range up to 4000 Hz, sufficient to record Capercaillie vocalizations, but exclude higher frequency bird song and other sounds. All recordings had the date, time and recorder site reference appended as metadata.
Lek count
Lek counts took place between 16 April and 1 May 2017, during the period when recorders were placed on site. Hides were set up at the lek sites on the day before the count, and then surveyors entered the hides during the evening. The following morning, surveyors recorded Capercaillie activity and attempted to determine the number of male birds dis-playing (Haysom 2013). All sites were visited twice during the survey window, except for site 8528, which was only vis-ited once. Survey visits were separated by 1–12 days (mean of 5 days). At two locations, two separate hides were used (giving separate counts), as the lek areas were too large to cover with one hide only. At these two locations, recorders were placed to match the hides (i.e. with recorders 8552 and 9306 at one location, and 8535 and 8607 at another). Hence these two locations are effectively treated as each representing two separate lek sites. This may not be the case ecologically, but it is the case practically, in terms of both the lek counts and using acoustic recorders. The recorders were sufficiently spaced to avoid any double counting in the acoustic data, with separation distances of 260 m between sites 8535 and 8607, and 85 m between sites 8552 and 9306 (Venier et al. 2012; Sedláček et al. 2015; Abrahams and Denny 2018). Site names and details are not given here due to landowner confidentiality.
Call analysis
Data sets
The audio recordings taken from the field consisted of 5580 .wav files (49.9 GB of data). This dataset was analysed using
a semi-automated system to identify Capercaillie vocaliza-tions in the recordings, with a three-stage process to produce a Capercaillie call ‘recognizer’ and final output. An addi-tional dataset was used for recognizer training, consisting of recordings collected in the same area of Scotland in 2016 (Abrahams and Denny 2018). This 2016 dataset consisted of 1586 .wav files (28.2 GB data) collected over 14 days at three lek sites. It was originally recorded at 12-kHz sample rate, and so was downsampled to 8 kHz to match the 2017 recordings.
Data were analysed using Kaleidoscope Pro 4.3.2 soft-ware (Wildlife Acoustics 2017), using its cluster analysis method. This process uses hidden Markov models to search for repeated phrases in the recordings (e.g. the song of a particular bird species), and groups these into a number of clusters based on their similarity. This study represents one of the first published tests of this software, filling a recently identified gap in the literature (Knight et al. 2017; Priyadar-shani et al. 2018).
Training data recognizer development
The Kaleidoscope software was used to process the 2016 training dataset with unsupervised clustering, default set-tings and a 1–3 kHz frequency signal of interest (see “Appendix” section). This preliminary analysis scanned the raw recordings to identify individual phrase segments within the training data, each of these being 1.0–6.9 s in duration (the typical song length of Capercaillie), and comprising a sequence of syllables with a maximum inter-syllable gap of 1 s. These segments were then grouped by the software into clusters of similar sound characteristics (e.g. different spe-cies or song types), and the results saved.
All of the phrase segments from the 2016 training data were manually reviewed by a visual check of spectrograms and by listening to playback, and then tagged as ‘CP’ if Capercaillie vocalizations were present, or ‘NOTCP’ if Capercaillie vocalizations were not present (when the seg-ment was a record of sounds of other bird species or other noise). Each phrase segment could include vocalizations by more than one bird species, if these were singing simul-taneously within the target frequency band, but they were assigned as CP if calls from Capercaillie were present. The clustering process enabled a rapid review of the segments, as similar vocalizations were grouped together.
After all phrases had been tagged, a second pass classifi-cation was carried out on the training data by re-scanning the manually tagged recordings. This second run used the iden-tification tags to create a pairwise CP/NOTCP recognizer file with which to analyse the 2017 data. No further manual check was done at this second stage, as the sole intention of the second pass is to use the manual identification tags
Journal of Ornithology
1 3
entered into the first pass results to produce the recognizer file for future analysis.
Audio data analysis using call recognizer
The pairwise recognizer, produced from the 2016 training data, was used to analyse the 2017 data. Using the auto-mated process within the Kaleidoscope software, this identi-fied phrase segments in the data, using the same parameters as above, and assigned these vocalizations as either CP or NOTCP. The analysis output was a spreadsheet of call data, with one row per phrase segment (hyperlinked to the asso-ciated .wav file), providing information on the vocalization (e.g. duration and frequency), the recorder site, date and time, and whether it was assigned to CP or NOTCP.
Metrics were calculated to report the quality of the rec-ognizer process in detecting vocalizations of the target spe-cies. The proportions of false positives and false negatives within the output dataset were estimated by manual review of a random sub-sample of the clustered phrase segments, and precision, recall, and F-score calculated (Knight et al. 2017; Chambert et al. 2018). Precision is the proportion of classifications that are true detections of the target species, while recall is the proportion of target species vocalizations correctly recognized. The F-score is a combined score, summarising precision and recall together. The best recog-nizer models should have both high precision and recall, indicating low levels of false positive and false negative identifications.
Environmental data
The altitudes of recorder locations were derived from Ord-nance Survey maps, based upon the logged GPS locations. Daily weather data for the Met Office MIDAS station at Aviemore was accessed through the Centre for Environ-mental Data Analysis (www.ceda.ac.uk). This included the following parameters: precipitation amount (millimetres), maximum air temperature (degrees Celsius), minimum air
temperature (degrees Celsius), grass temperature (degrees Celsius), concrete temperature (degrees Celsius), sun dura-tion (hours), wind speed (miles per hour) and maximum gust speed (miles per hour). The altitude and weather parameters were all tested separately for relationships with the daily levels of call activity, using Spearman’s rank correlation. All data visualization and statistical tests were carried out using R and R Studio software (R Core Team 2013; RStudio Team 2015).
Results
Lek counts
The lek counts recorded between zero and seven males at each site (Table 1), with the maximum of seven males at two sites: 8621 and 9319. No males were recorded at sites 8535 and 8528, but only one count took place at the latter site. The number of males counted in repeat surveys stayed the same at only one site, and mostly varied by one or two individuals between visits.
Phrase segment classification
Analysis of the 2016 training data produced 20,493 phrase segments, grouped into 12 clusters. A total of 2114 segments
Table 1 Lek count data at each recorder site (with date of lek count survey)
Recorder site First lek count date No. of males Second lek count date No. of males
9348 19 April 2017 3 24 April 2017 49319 19 April 2017 5 1 May 2017 78528 16 April 2017 0 – –8621 22 April 2017 7 26 April 2017 58535 23 April 2017 0 30 April 2017 08607 23 April 2017 3 30 April 2017 19306 26 April 2017 2 29 April 2017 28552 26 April 2017 6 29 April 2017 59345 19 April 2017 1 23 April 2017 29558 21 April 2017 5 22 April 2017 6
Table 2 Phrase segment identifications at each analysis stage
Number of phrase segments with Capercaillie vocalizations present (CP) and no Capercaillie vocalizations present (NOTCP) for both manual and automated identifications with the training and analysis data sets
Identifier Training: manual Training: automated
Analysis: automated
Analysis: manual
CP 2114 3371 23,688 1146NOTCP 18,379 14,666 62,936 2609
Journal of Ornithology
1 3
(10.3%) were manually assigned as CP, with the remaining 18,379 segments (89.7%) tagged as NOTCP (Table 2).
A total of 86,624 phrase segments were obtained from the 2017 analysis data. Of these, 23,688 (27%) were matched by the software recognizer to CP, and 62,936 (73%) to NOTCP (Table 2). A random sample of 3755 phrase segments was manually reviewed, and 1146 (31%) identified as CP, with 2609 (69%) identified as NOTCP (see Table 3). These manu-ally identified segments were individually compared to the automated recognizer classifications, with 2952 segments (79%) correctly classified by the recognizer to either CP or NOTCP. There were 803 (21%) false identifications, com-prising 583 (15%) false positives, and 220 (6%) false nega-tives. These values mean that the recognizer classification had a precision of 0.61, recall of 0.81 and F-score (β = 1) of 0.70.
Call rate at each site
The mean number of automated CP phrase segments recorded over the month was 2369 per site (76/day per site) (Table 4). The highest levels of vocalization were recorded at site 8552, with 4114 CP segments recorded over the month (mean 133/day). The smallest number of segments was at site 8607, with only 794 (mean 26/day). Sites 8528 and 8535
had no males recorded in lek counts, but respectively had 2580 and 881 CP phrase segments. However, manual review confirmed that these were likely to be nearly all false posi-tives. The proportion of manually identified CP phrase seg-ments at each recorder site, as identified in the sub-sample of 3755 segments, varied between 0 and 90% (Table 4). This confirmed occupancy at all sites, apart from site 8528. A secondary check of all phrase segments for this particular recorder site confirmed that all CP phrase segments were false positives, despite the relatively high number of CP seg-ments identified by the automated recognizer.
To compensate for the incorrect classifications from the automated recognizer, the number of automated CP phrase segments for each recorder site was multiplied by its manu-ally identified CP percentage to produce a simple CP call index. This is shown in the final column of Table 4. It is proposed that this index provides a more accurate assess-ment of Capercaillie vocal activity at each recorder site than the uncorrected number of CP phrase segments.
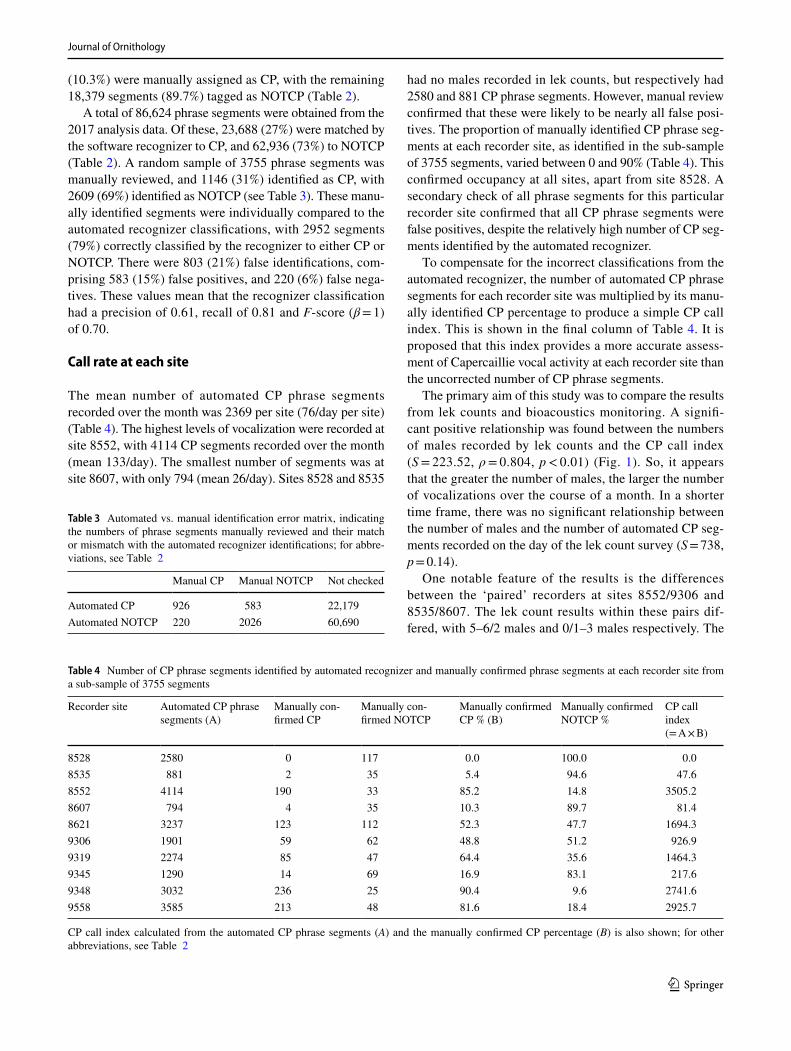
The primary aim of this study was to compare the results from lek counts and bioacoustics monitoring. A signifi-cant positive relationship was found between the numbers of males recorded by lek counts and the CP call index (S = 223.52, ρ = 0.804, p < 0.01) (Fig. 1). So, it appears that the greater the number of males, the larger the number of vocalizations over the course of a month. In a shorter time frame, there was no significant relationship between the number of males and the number of automated CP seg-ments recorded on the day of the lek count survey (S = 738, p = 0.14).
One notable feature of the results is the differences between the ‘paired’ recorders at sites 8552/9306 and 8535/8607. The lek count results within these pairs dif-fered, with 5–6/2 males and 0/1–3 males respectively. The
Table 3 Automated vs. manual identification error matrix, indicating the numbers of phrase segments manually reviewed and their match or mismatch with the automated recognizer identifications; for abbre-viations, see Table 2
Manual CP Manual NOTCP Not checked
Automated CP 926 583 22,179Automated NOTCP 220 2026 60,690
Table 4 Number of CP phrase segments identified by automated recognizer and manually confirmed phrase segments at each recorder site from a sub-sample of 3755 segments
CP call index calculated from the automated CP phrase segments (A) and the manually confirmed CP percentage (B) is also shown; for other abbreviations, see Table 2
Recorder site Automated CP phrase segments (A)
Manually con-firmed CP
Manually con-firmed NOTCP
Manually confirmed CP % (B)
Manually confirmed NOTCP %
CP call index (= A × B)
8528 2580 0 117 0.0 100.0 0.08535 881 2 35 5.4 94.6 47.68552 4114 190 33 85.2 14.8 3505.28607 794 4 35 10.3 89.7 81.48621 3237 123 112 52.3 47.7 1694.39306 1901 59 62 48.8 51.2 926.99319 2274 85 47 64.4 35.6 1464.39345 1290 14 69 16.9 83.1 217.69348 3032 236 25 90.4 9.6 2741.69558 3585 213 48 81.6 18.4 2925.7
Journal of Ornithology
1 3
CP call index and number of CP phrase segments differed substantially between the first pair of sites (where recorders were only 85 m apart), but matched closely at the second pair (Table 4, Fig. 1).
Call rate in relation to date/time
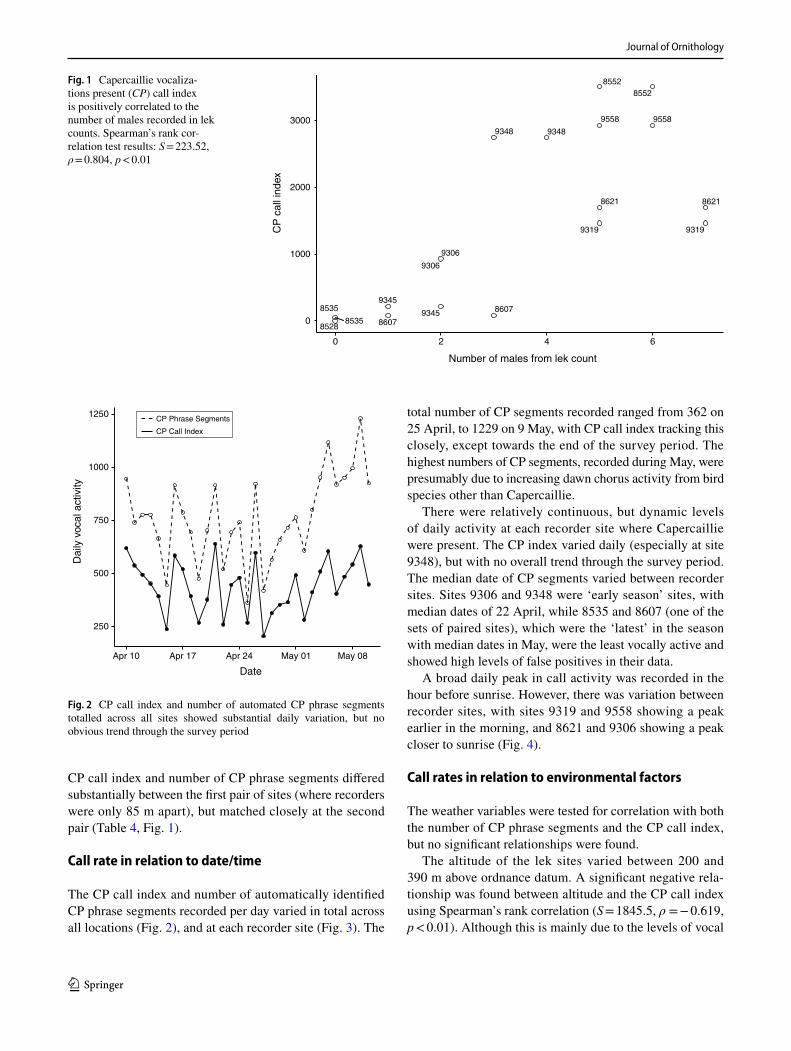
The CP call index and number of automatically identified CP phrase segments recorded per day varied in total across all locations (Fig. 2), and at each recorder site (Fig. 3). The
total number of CP segments recorded ranged from 362 on 25 April, to 1229 on 9 May, with CP call index tracking this closely, except towards the end of the survey period. The highest numbers of CP segments, recorded during May, were presumably due to increasing dawn chorus activity from bird species other than Capercaillie.
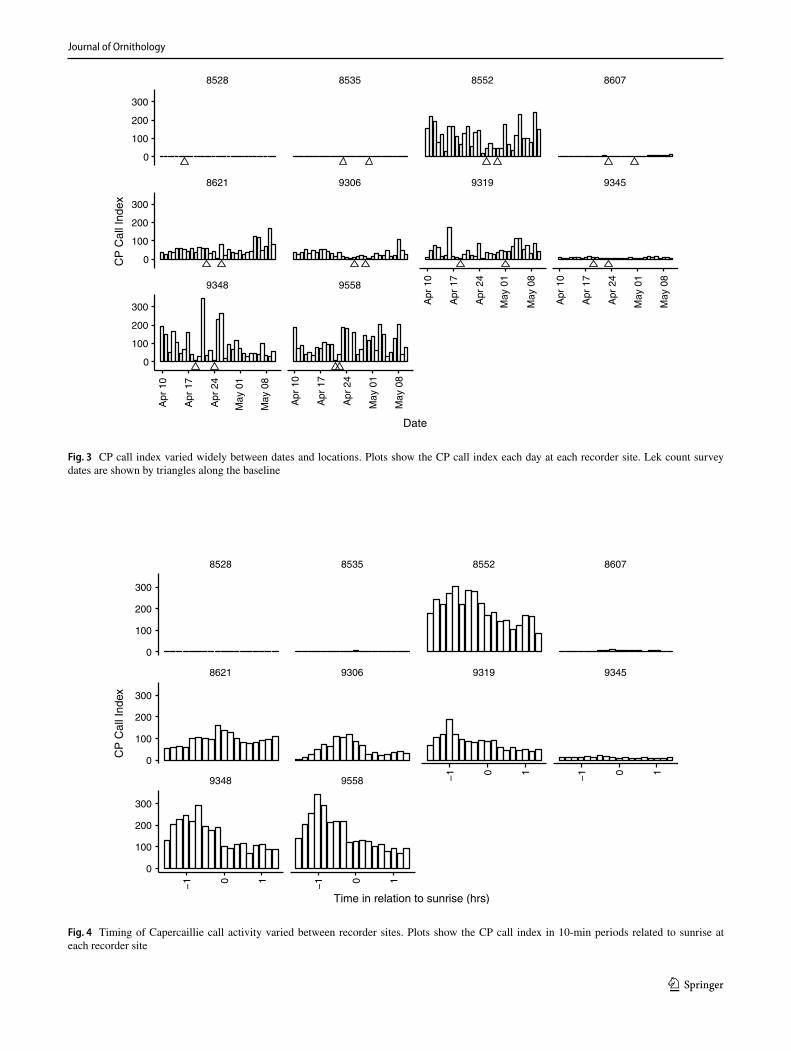
There were relatively continuous, but dynamic levels of daily activity at each recorder site where Capercaillie were present. The CP index varied daily (especially at site 9348), but with no overall trend through the survey period. The median date of CP segments varied between recorder sites. Sites 9306 and 9348 were ‘early season’ sites, with median dates of 22 April, while 8535 and 8607 (one of the sets of paired sites), which were the ‘latest’ in the season with median dates in May, were the least vocally active and showed high levels of false positives in their data.
A broad daily peak in call activity was recorded in the hour before sunrise. However, there was variation between recorder sites, with sites 9319 and 9558 showing a peak earlier in the morning, and 8621 and 9306 showing a peak closer to sunrise (Fig. 4).
Call rates in relation to environmental factors
The weather variables were tested for correlation with both the number of CP phrase segments and the CP call index, but no significant relationships were found.
The altitude of the lek sites varied between 200 and 390 m above ordnance datum. A significant negative rela-tionship was found between altitude and the CP call index using Spearman’s rank correlation (S = 1845.5, ρ = − 0.619, p < 0.01). Although this is mainly due to the levels of vocal
Fig. 1 Capercaillie vocaliza-tions present (CP) call index is positively correlated to the number of males recorded in lek counts. Spearman’s rank cor-relation test results: S = 223.52, ρ = 0.804, p < 0.01
9348 9348
9319 9319
8528
86218621
8535
85358607
8607
9306
9306
85528552
9345
9345
9558 9558
0
1000
2000
3000
6420
Number of males from lek count
CP
cal
l ind
ex
250
500
750
1000
1250
Apr 10 Apr 17 Apr 24 May 01 May 08
Date
Dai
ly v
ocal
act
ivity
CP Phrase Segments
CP Call Index
Fig. 2 CP call index and number of automated CP phrase segments totalled across all sites showed substantial daily variation, but no obvious trend through the survey period
Journal of Ornithology
1 3
9348 9558
8621 9306 9319 9345
8528 8535 8552 8607
Apr
10
Apr
17
Apr
24
May
01
May
08
Apr
10
Apr
17
Apr
24
May
01
May
08
Apr
10
Apr
17
Apr
24
May
01
May
08
Apr
10
Apr
17
Apr
24
May
01
May
08
0
100
200
300
0
100
200
300
0
100
200
300
Date
CP
Cal
l Ind
ex
Fig. 3 CP call index varied widely between dates and locations. Plots show the CP call index each day at each recorder site. Lek count survey dates are shown by triangles along the baseline
9348 9558
8621 9306 9319 9345
8528 8535 8552 8607
−1 0 1
−1 0 1
−1 0 1
−1 0 1
0
100
200
300
0
100
200
300
0
100
200
300
Time in relation to sunrise (hrs)
CP
Cal
l Ind
ex
Fig. 4 Timing of Capercaillie call activity varied between recorder sites. Plots show the CP call index in 10-min periods related to sunrise at each recorder site
Journal of Ornithology
1 3
activity of the birds present, it also appears to be partly attributable to the number of males in attendance at the lek, which is also negatively related to altitude (S = 1662.8, ρ = − 0.458, p = 0.048).
Call rates during lek counts
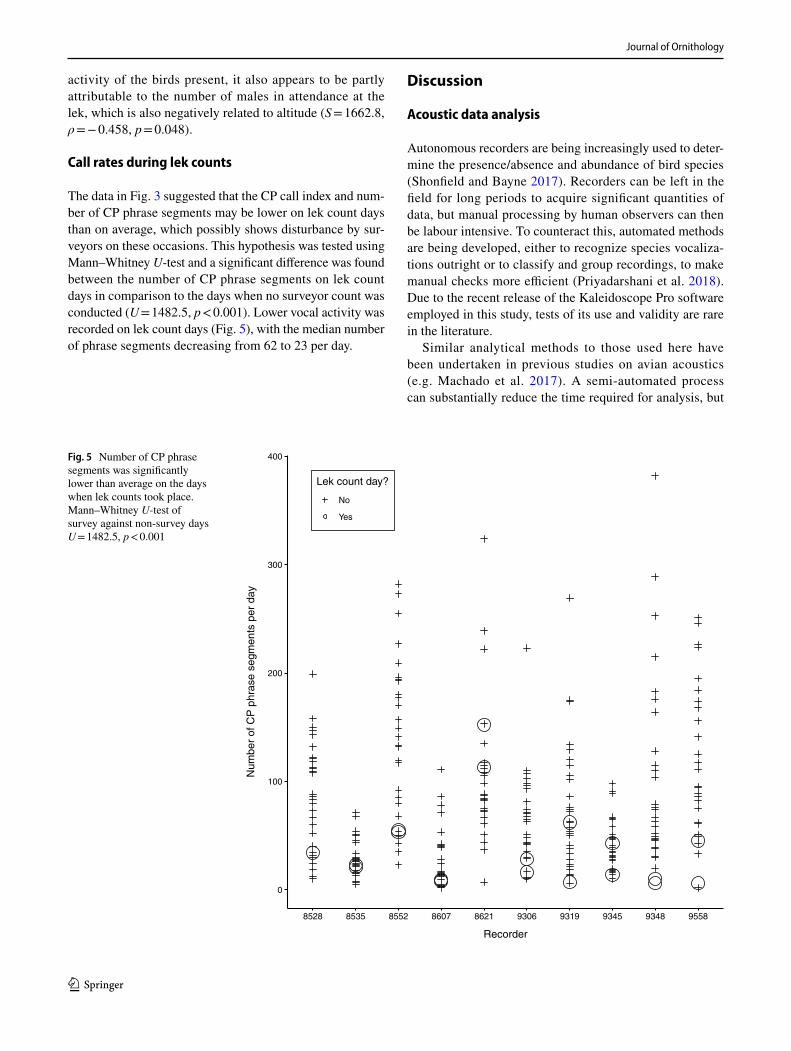
The data in Fig. 3 suggested that the CP call index and num-ber of CP phrase segments may be lower on lek count days than on average, which possibly shows disturbance by sur-veyors on these occasions. This hypothesis was tested using Mann–Whitney U-test and a significant difference was found between the number of CP phrase segments on lek count days in comparison to the days when no surveyor count was conducted (U = 1482.5, p < 0.001). Lower vocal activity was recorded on lek count days (Fig. 5), with the median number of phrase segments decreasing from 62 to 23 per day.
Discussion
Acoustic data analysis
Autonomous recorders are being increasingly used to deter-mine the presence/absence and abundance of bird species (Shonfield and Bayne 2017). Recorders can be left in the field for long periods to acquire significant quantities of data, but manual processing by human observers can then be labour intensive. To counteract this, automated methods are being developed, either to recognize species vocaliza-tions outright or to classify and group recordings, to make manual checks more efficient (Priyadarshani et al. 2018). Due to the recent release of the Kaleidoscope Pro software employed in this study, tests of its use and validity are rare in the literature.
Similar analytical methods to those used here have been undertaken in previous studies on avian acoustics (e.g. Machado et al. 2017). A semi-automated process can substantially reduce the time required for analysis, but
Fig. 5 Number of CP phrase segments was significantly lower than average on the days when lek counts took place. Mann–Whitney U-test of survey against non-survey days U = 1482.5, p < 0.001
0
100
200
300
400
8528 8535 8552 8607 8621 9306 9319 9345 9348 9558
Recorder
Num
ber
of C
P p
hras
e se
gmen
ts p
er d
ay
Lek count day?
No
Yes
Journal of Ornithology
1 3
introduces the potential for machine errors in call recogni-tion, with both false negative and false positive classifica-tions likely to result. Due to this, a range of studies have compared the efficiency of manual identification with a vari-ety of automated or semi-automated methods. These have found that automated methods require less time for data pro-cessing, but sometimes identify fewer target sounds than manual analysis, and can make more false positive identifi-cations (Swiston and Mennill 2009; Knight et al. 2017). The best approach is therefore likely to be an integrated approach with automated and manual methods combined, as used in the current study.
Recognizer metrics were calculated using manual identi-fication of a subset of the automated data to assess the qual-ity of the analysis (Knight et al. 2017; Chambert et al. 2018). Only 4% of the overall dataset was used for this assessment, but Chambert et al. (2018) state that quality assurance of automated recognizers can be achieved with a manual review of as little as 1% of the total data. The metrics indicated that the Kaleidoscope recognizer classification, as implemented here, had a precision of 0.61 and recall of 0.81. A number of previous studies reviewed by Knight et al. (2017) had a mean precision of 0.71 and mean recall of 0.60. The current study, therefore, had a precision lower than these reported cases, with a relatively high number of false positives. However, recall was high due to the low number of false negatives. In practical terms there is a benefit, in single-species studies like this one, from weighting analysis towards false posi-tives, as the smaller dataset of ‘positive’ identifications is easier to manually review, instead of finding missed calls in the larger ‘negative’ dataset.
The moderate level of precision in this study means that the number of CP phrase segments is likely to be an over-estimation of the actual Capercaillie calls in the data set (as presented in Table 4). This is especially clear in the data from site 8528, where all segments identified as CP were false positives. This potential inaccuracy was compensated for in this study by using the results from the manual review as a correction factor for the number of CP segments, to produce a CP call index that more accurately reflected actual Capercaillie vocal activity. As a consequence, taking into consideration the time and costs of analysis, an appropriate approach is believed to have been taken in this study to find a balance in terms of the accuracy required to generate use-ful data. Clearly the levels of false positive and false nega-tive classifications could be reduced, if needed, with more detailed manual checking of the data.
Capercaillie call activity is related to lek count numbers
The primary objective of this study was to determine whether bioacoustics could be used to assess lek activity
levels, and could be related to the numbers of display-ing males present. It is established for some species that call rate can be used as a proxy for population abundance (Laiolo et al. 2011; Oppel et al. 2014; Knight et al. 2017), and that vocal display effort can increase in line with lek size or visitation rates to the lek (Westcott 1992; Pizo and Aleixo 1998; Cestari et al. 2016).
For Capercaillie, vocal characteristics often correlate with male quality, health condition, and competition lev-els—‘fitter’ males using lower frequencies, higher song rates and longer display durations. Displaying Capercail-lie males from neighbouring grounds are also known to stimulate each other by increasing song rates, and song rate has been found to be significantly correlated to the number of displaying males in an area (Laiolo et al. 2011).
A significant positive relationship between Capercaillie lek count numbers and call activity was identified in this study, indicating that the CP call index and total number of CP phrase segments over an extended survey period (such as the month-long duration used here) may serve as an indicator of lek size. However, this does not appear to be true over shorter time frames, due to the considerable daily variation in call activity. This variation is likely the result of factors such as the date within the lekking season, and weather conditions affecting bird behaviour—factors that could also affect lek counts, and which are perhaps not considered fully within that method at the current time (Raynor et al. 2017; Fremgen et al. 2018). In addition, the mobility of Capercaillie around the lek site, with birds potentially displaying from different places on different mornings, may affect their detectability on a day-to-day basis, and adverse weather conditions (i.e. high winds and rain) could potentially mask calls in the recordings on some days.
The correlation found between lek numbers and call activity in this study indicates the potential for bioacoustics to be used alongside existing population monitoring meth-ods for Capercaillie. Bioacoustics could be used effectively to calibrate the results gained from lek counts, especially when monitoring a large number of sites, conducting sur-veys at night, and covering a broad timescale, which are all difficult to achieve with many traditional survey methods (Furnas and Callas 2015; Gasc et al. 2017). This would add a new dimension to the vital understanding and flexibility of approach gained from human surveyors undertaking lek counts, with both methods being employed together to pro-vide complementary information on lek activity (Venier et al. 2012; Shonfield and Bayne 2017).
Effects of lek count surveys on vocal activity
In this study, recorded vocal activity dropped to approxi-mately 1/3 of average levels on days when surveyors visited
Journal of Ornithology
1 3
the lek sites. As the most extreme examples of this, the lek counts at sites 9348 and 9558 both occurred on the 2 days when the lowest levels of call activity were recorded at these sites. This raises two potential issues. Firstly, it could indi-cate that surveyors caused sufficient disturbance to affect and reduce the vocal activity at the lek. This would be of con-cern, if true, as there could potentially be ecological effects of this on Capercaillie. The species is known to be suscep-tible to human disturbance, particularly at lek and brood-rearing times (Summers et al. 2009; Moss et al. 2014), and recreational impact studies have shown that disturbance of lekking birds may lead to local population effects, either by preventing display, avoidance of disturbed sites by hens, or preventing recruitment of young males (Marshall 2005). Studies have rarely been conducted on any bird species to determine whether the presence of surveyors has any sig-nificant impact on birds. One previous study, by Campbell and Francis (2012), used acoustic recording to assess point counts of passerines in old field habitat and found no differ-ence in the results when an observer was present or absent. How this finding relates to other habitats or species assem-blages is not known. Despite the lack of investigation into surveyor impacts on lek activity, the potential for this to occur in Capercaillie has been fully recognized, with precau-tions to avoid disturbance recommended as part of published survey methods (e.g. Haysom 2013). In this study, the over-all correlation between Capercaillie vocal activity and lek counts suggests that there are likely no longer-term effects over the lek period. In addition, the observations of normal behaviour in the field during lek count visits gave no indica-tion of other apparent adverse impacts.
A second potential explanation for the reduced call activ-ity on count days is that it is just a chance effect, and that no disturbance is caused by lek counting. However, this raises the question that if call activity (and hence lekking) hap-pens to be lower on the necessarily limited number of survey visits due to other factors such as weather, then the results from the survey might not accurately reflect the size of the lek, and could underestimate the number of males present. This would have an effect on the quality of the population assessment achieved from the count surveys. Further work on this issue is clearly needed.
Capercaillie call activity is related to temporal and environmental variables
The age and sex biases of lek counts are well recognized (Storch 1997; Mollet et al. 2015). In addition, there are a number of temporal and environmental conditions that can affect detectability and occupancy at leks (Walsh et al. 2004; Raynor et al. 2017; Fremgen et al. 2018). An understand-ing of these factors is critical to improving population esti-mates for the species being monitored (Drummer et al. 2011;
Sadoti et al. 2016; Priyadarshani et al. 2018). Within this study, the levels of vocal activity were affected by date, time and altitude, but (perhaps surprisingly) no relationship with weather variables was found.
The number of CP phrase segments recorded on a daily basis, totalled across all sites, varied by a factor of nearly 4, but with much greater variation within sites. There were differences between the CP call index and number of CP segments, with the latter showing the highest levels of call activity at the end of the survey period, during May. The median dates for CP call index ranged between 22 April and 5 May, and a daily peak was recorded at 0.5–1 h before sunrise, at approximately 0500 hours (similar to Abrahams and Denny 2018). These key periods of activity confirm the recommendations of Haysom (2013) that Capercaillie lek surveys in Scotland should take place from mid-April to early May, and between 0400 and 0600 hours. As the num-bers of birds present at the lek will vary depending on time of day and season, the programming of surveys is of high importance. For Black Grouse, Cayford and Walker (1991) found that the highest counts were obtained in April and early May, 1 h either side of sunrise, and also that counts varied by as much as 80% depending on the time and month they were taken. Bioacoustic monitoring therefore has great potential to confirm when best to conduct lek counts, or to allow inter-calibration of counts conducted at different dates across a season.
Lek attendance is likely to vary by latitude and eleva-tion for a range of species (Sadoti et al. 2016). The negative relationship with altitude found in this study appears to be driven both by the number of male birds present and their levels of vocal activity, with more birds calling more fre-quently at lower altitudes. This finding appears to contrast with research from other parts of Europe, which has found that Capercaillie prefer elevated sites, such as ridgelines (Rolstad and Wegge 1987; Saniga 2002), although Haysom (2013) notes that, in Scotland, leks usually occur on raised areas but not on the tops of hills. It is possible that the more populated leks here tend to occur in lower lying areas where environmental conditions are more benign. It is known that egg-laying becomes later with increasing altitude, so this variable does have an impact on life history. However, the leks studied here were in a relatively narrow altitude band, and it is possible that the relationship identified would not hold across a wider range of altitude.
Abrahams and Denny (2018), Drummer et al. (2011) and Sadoti et al. (2016) have all found an inverse relation-ship between lekking activity and wind speed. This may be related to noise sensitivity, as noted in the Greater Prairie Chicken Tympanuchus cupido (Walsh et al. 2015), so the use of detailed weather information from lekking areas is an important avenue for future study to better understand effects on lek attendance and vocal activity patterns. In addition,
Journal of Ornithology
1 3
masking by wind noise will also affect the quantity and qual-ity of bird vocalizations recorded by bioacoustic methods, so this should be taken into account when analysing and interpreting audio data. Despite the daily variation identified here in vocal activity, many studies often use single survey counts to assess lek attendance and population numbers. However, this cannot be recommended, as lek attendance and activity levels may be suppressed even when weather conditions are within the recommended ranges for surveys. As a result, multiple visits may be required to gain accurate lek count numbers, to counteract variations in detectability and occupancy; this should be incorporated into survey guid-ance (Cayford and Walker 1991; Sadoti et al. 2016).
Conclusion
The continued precarious state of the Capercaillie in Scot-land means that effective monitoring at both national and local levels is required. Large-scale surveys can track over-all population trends and changes in distribution, but can not effectively inform assessments of localized populations or conservation management actions. Recent developments in national survey methods (Wilkinson et al. 2018) have improved the accuracy of winter transect data. The same effort is now required to refine lek monitoring techniques. The recommendation by Wilkinson et al. (2018) that greater consistency should be developed in lek count methods is echoed here, to allow a better understanding of how lek counts relate to actual numbers of birds and how numbers vary across the season.
The deployment of the acoustic recorders in this study successfully recorded Capercaillie vocal activity at a num-ber of lek sites, providing comparable, simultaneous and long-term data from each location. This has provided new understanding of lekking activity levels over time, has indi-cated a potential weakness in human lek count methods, and has raised the possibility of using bioacoustics for efficient and effective population monitoring. There are limitations to the bioacoustics approach in recording only audio data, with issues over quiet individuals/species, range of detec-tion, the spacing of recorders, etc. However, the collection of valuable biological data, over long time periods and across large, difficult to access, areas, is a recognized benefit of the bioacoustics approach, enabling reliable estimates of species occurrence and, potentially, abundance (Swiston and Men-nill 2009; Blumstein et al. 2011; Furnas and Callas 2015; Gasc et al. 2017; Shonfield and Bayne 2017). Longer-term surveys using acoustic methods could provide an alterna-tive data source where lek counts are not possible, or poten-tially allow calibration between lek counts undertaken at different sites on different days (Sadoti et al. 2016). This would help to address variation in lek attendance through
the season (Sadoti et al. 2016; Fremgen et al. 2018). In addi-tion, bioacoustics offers a non-intrusive survey method in comparison to other techniques such as lek counts, GPS/radio tagging and use of dogs. The benefits of this when dealing with small, declining and disturbance-sensitive populations at a critical stage of their life history should not be underestimated.
In the future, the use of multiple microphone arrays could allow the location of individual male birds to be plotted across a site, to develop a map of distribution and activity areas across a lek (Mennill et al. 2012). This could poten-tially be combined with individual call recognition and genetic capture-recapture techniques to allow highly detailed assessments of Capercaillie ecology and conservation status (Jacob et al. 2010). There is an increasing body of scientific studies on avian bioacoustics (Gasc et al. 2017; Shonfield and Bayne 2017), but standard and consistently applied guidance is still lacking for conservation managers (Brown-ing et al. 2017; Abrahams 2018). However, as a first step, the relatively simple techniques demonstrated here should be developed and implemented to gather valuable new types of data that will help inform the conservation efforts for this iconic species.
Acknowledgements Many thanks to The Royal Society for the Protec-tion of Birds staff for providing access to lek locations and assisting with deployment of recording equipment, and to the landowners who allowed use of their sites. Thanks also to Adam Bates, Edward Raynor and other reviewers for their comments on a previous version of this article. This study complied with the current laws of the country in which it was performed.
Open Access This article is distributed under the terms of the Crea-tive Commons Attribution 4.0 International License (http://creat iveco mmons .org/licen ses/by/4.0/), which permits unrestricted use, distribu-tion, and reproduction in any medium, provided you give appropriate credit to the original author(s) and the source, provide a link to the Creative Commons license, and indicate if changes were made.
Appendix: Kaleidoscope 4.3.2 software settings
File parameters:
• No subdirectories• No split to max duration• Split channels—yes.
Signal parameters:
• Signal of interest 1000–3000 Hz• 1–6 s• Max inter syllable gap 1 s
Journal of Ornithology
1 3
Scan and cluster recordings:
• Max distance 1.0• FFT window 5.33 ms• Max states 12• Max distance for building clusters 0.5• Max clusters 500
References
Abrahams C (2018) Bird bioacoustic surveys—developing a standard protocol. Practice 102:20–23
Abrahams C, Denny M (2018) A first test of unattended, acoustic recorders for monitoring Capercaillie Tetrao urogallus lekking activity. Bird Study 65(2):197–207. https ://doi.org/10.1080/00063 657.2018.14469 04
Blumstein DTD, Mennill DJDDJ, Clemins P et al (2011) Acoustic mon-itoring in terrestrial environments using microphone arrays: appli-cations, technological considerations and prospectus. J Appl Ecol 48:758–767. https ://doi.org/10.1111/j.1365-2664.2011.01993 .x
Brandes T (2008) Automated sound recording and analysis techniques for bird surveys and conservation. Bird Conserv Int 18:S163–S173. https ://doi.org/10.1017/s0959 27090 80004 15
Browning E, Gibb R, Glover-Kapfer P, Jones KE (2017) Passive acous-tic monitoring in ecology and conservation. WWF Conserv Tech-nol Ser 1(2):1–75
Campbell M, Francis CM (2012) Using microphone arrays to examine effects of observers on birds during point count sur-veys. J Field Ornithol 83:391–402. https ://doi.org/10.1111/j.1557-9263.2012.00389 .x
Cayford JT, Walker F (1991) Counts of male Black Grouse Tetrao tetrix in North Wales. Bird Study 38:80–86
Celis-Murillo A, Deppe JL, Allen MF (2009) Using soundscape recordings to estimate bird species abundance, richness, and composition. J Field Ornithol 80:64–78. https ://doi.org/10.1111/j.1557-9263.2009.00206 .x
Cestari C, Loiselle BA, Pizo MA (2016) Trade-offs in male display activity with lek size. PLOS ONE. https ://doi.org/10.1371/journ al.pone.01629 43
Chambert T, Waddle JH, Miller DA et al (2018) A new frame-work for analysing automated acoustic species detection data: occupancy estimation and optimization of recordings post-processing. Methods Ecol Evol 9:560–570. https ://doi.org/10.1111/2041-210x.12910
Drummer TD, Corace RG, Sjogren SJ (2011) Sharp-tailed grouse lek attendance and fidelity in upper Michigan. J Wildl Manage 75:311–318. https ://doi.org/10.1002/jwmg.42
Ewing SR, Eaton MA, Poole TF et al (2012) The size of the Scot-tish population of Capercaillie Tetrao urogallus: results of the fourth national survey. Bird Study 59:126–138. https ://doi.org/10.1080/00063 657.2011.65293 7
Fremgen AL, Hansen CP, Rumble MA et al (2018) Weather conditions and date influence male Sage Grouse attendance rates at leks. Ibis. https ://doi.org/10.1111/ibi.12598
Furnas BJ, Callas RL (2015) Using automated recorders and occupancy models to monitor common forest birds across a large geographic region. J Wildl Manage 79:325–337. https ://doi.org/10.1002/jwmg.821
Gasc A, Francomano D, Dunning JB, Pijanowski BC (2017) Future directions for soundscape ecology: the importance of
ornithological contributions. Auk 134:215–228. https ://doi.org/10.1642/auk-16-124.1
Haysom S (2013) Capercaillie survey methods. Scottish Natural Herit-age, Inverness
Hjorth I (1970) Reproductive behaviour in Tetraonidae, with special reference to males. Viltrevy 7(4):184–596
Jacob G, Debrunner R, Gugerli F et al (2010) Field surveys of Caper-caillie (Tetrao urogallus) in the Swiss Alps underestimated local abundance of the species as revealed by genetic analyses of non-invasive samples. Conserv Genet 11:33–44. https ://doi.org/10.1007/s1059 2-008-9794-8
Knight EC, Hannah KC, Foley GJ et al (2017) Recommendations for acoustic recognizer performance assessment with application to five common automated signal recognition programs. Avian Con-serv Ecol 12:art14. https ://doi.org/10.5751/ace-01114 -12021 4
Laiolo P, Bañuelos MJ, Blanco-Fontao B et al (2011) Mechanisms underlying the bioindicator notion: spatial association between individual sexual performance and community diversity. PLOS ONE 6:e22724. https ://doi.org/10.1371/journ al.pone.00227 24
Machado RB, Aguiar L, Jones G (2017) Do acoustic indices reflect the characteristics of bird communities in the savannas of Central Brazil? Landsc Urban Plan 162:36–43. https ://doi.org/10.1016/j.landu rbpla n.2017.01.014
Marques TTA, Thomas L, Martin SWS et al (2013) Estimating animal population density using passive acoustics. Biol Rev 88:287–309. https ://doi.org/10.1111/brv.12001
Marshall K (2005) Capercaillie and recreational disturbance study. CNPA, FCS, SNH
Mennill DJ, Battiston M, Wilson DR et al (2012) Field test of an afford-able, portable, wireless microphone array for spatial monitoring of animal ecology and behaviour. Methods Ecol Evol 3:704–712. https ://doi.org/10.1111/j.2041-210x.2012.00209 .x
Mollet P, Kéry M, Gardner B et al (2015) Estimating population size for Capercaillie (Tetrao urogallus L.) with spatial capture-recap-ture models based on genotypes from one field sample. PLOS ONE 10:e0129020. https ://doi.org/10.1371/journ al.pone.01290 20
Moss R, Leckie F, Biggins A et al (2014) Impacts of human disturbance on Capercaillie Tetrao urogallus distribution and demography in Scottish Woodland. Wildl Biol 20:1–18. https ://doi.org/10.2981/wlb.12065
Oppel S, Hervias S, Oliveira N et al (2014) Estimating population size of a nocturnal burrow-nesting seabird using acoustic moni-toring and habitat mapping. Nat Conserv 7:1–13. https ://doi.org/10.3897/natur econs ervat ion.7.6890
Picozzi N, Catt DC, Moss R (1992) Evaluation of Capercaillie habitat. J Appl Ecol 29:751. https ://doi.org/10.2307/24044 85
Pizo MA, Aleixo A (1998) Lek behavior of the Gray-hooded Fly-catcher. Condor 100:726–731
Pollo CJ, Robles L, Seijas JM et al (2005) Trends in the abundance of Cantabrian Capercaillie Tetrao urogallus cantabricus at leks on the southern slope of the Cantabrian mountains, north-west Spain. Bird Conserv Int 15:397–409. https ://doi.org/10.1017/s0959 27090 50006 26
Priyadarshani N, Castro I, Marsland S (2018) The impact of environ-mental factors in birdsong acquisition using automated recorders. Ecol Evol 8:5016–5033. https ://doi.org/10.1002/ece3.3889
R Core Team (2013) R: a language and environment for statistical com-puting. R Foundation for Statistical Computing, Vienna, Austria
Raynor EJ, Whalen CE, Bomberger Brown M, Powell LA (2017) Location matters: evaluating Greater Prairie-Chicken (Tympa-nuchus cupido) boom chorus propagation. Avian Conserv Ecol 12(2):art17. https ://doi.org/10.5751/ACE-01126 -12021 7
Rolstad J, Wegge P (1987) Habitat characteristics of Capercaillie Tetrao urogallus display grounds in southeastern Norway. Ecog-raphy 10:219–229. https ://doi.org/10.1111/j.1600-0587.1987.tb007 62.x
Journal of Ornithology
1 3
RStudio Team (2015) RStudio: integrated development for R. RStudio Inc, Boston, MA
Sadoti G, Johnson K, Albright TP (2016) Modelling environmental and survey influences on lek attendance using long-term lek survey data. Ibis 158:821–833. https ://doi.org/10.1111/ibi.12391
Saniga M (2002) Habitat features of the Capercaillie (Tetrao urogallus) leks in the West Carpathians. J For Sci 48:415–424
Sedláček O, Vokurková J, Ferenc M et al (2015) A comparison of point counts with a new acoustic sampling method: a case study of a bird community from the montane forests of Mount Cameroon. Ostrich 86:213–220. https ://doi.org/10.2989/00306 525.2015.10496 69
Shonfield J, Bayne EM (2017) Autonomous recording units in avian ecological research: current use and future applications. Avian Conserv Ecol 12(1):14. https ://doi.org/10.5751/ace-00974 -12011 4
Simons TR, Pollock KH, Wettroth JM et al (2009) Sources of measure-ment error, misclassification error, and bias in auditory avian point count data. Model Demogr Process Mark Popul 3:237–254. https ://doi.org/10.1007/978-0-387-78151 -8_10
Storch I (1997) Male territoriality, female range use, and spatial organi-sation of Capercaillie Tetrao urogallus leks. Wildl Biol 3:149–161
Sueur J, Pavoine S, Hamerlynck O, Duvail S (2008) Rapid acous-tic survey for biodiversity appraisal. PLOS ONE. https ://doi.org/10.1371/journ al.pone.00040 65
Summers RW, McFarlane J, Pearce-Higgins JW (2009) Measuring avoidance by Capercaillies Tetrao urogallus of woodland close to tracks. Wildl Biol 13:19–27. https ://doi.org/10.2981/0909-6396(2007)13%5b19:mabct u%5d2.0.co;2
Summers RW, Dugan D, Proctor R (2010) Numbers and breeding suc-cess of Capercaillies Tetrao urogallus and Black Grouse T. tetrix at Abernethy Forest, Scotland. Bird Study 57:437–446. https ://doi.org/10.1080/00063 657.2010.50620 9
Swiston KA, Mennill DJ (2009) Comparison of manual and auto-mated methods for identifying target sounds in audio record-ings of Pileated, Pale-billed, and putative Ivory-billed Wood-peckers. J Field Ornithol 80:42–50. https ://doi.org/10.1111/j.1557-9263.2009.00204 .x
Venier LA, Holmes SB, Holborn GW et al (2012) Evaluation of an automated recording device for monitoring forest birds. Wildl Soc Bull 36:30–39. https ://doi.org/10.1002/wsb.88
Walsh DP, White GC, Remington TE, Bowden DC (2004) Evaluation of the lek-count index for greater sage-grouse. Wildl Soc Bull 32:56–68. https ://doi.org/10.2193/0091-7648(2004)32%5b56:eotli f%5d2.0.co;2
Walsh EJ, Whalen C, Powell L et al (2015) Hearing sensitivity in the Greater Prairie Chicken (Tympanuchus cupido). J Acoust Soc Am 137:2219. https ://doi.org/10.1121/1.49200 84
Wegge P, Rolstad J, Storaunet KO (2013) On the spatial relationship of males on “exploded” leks: the case of Capercaillie grouse Tetrao urogallus examined by GPS satellite telemetry. Ornis Fenn 90:222–235
Westcott D (1992) Inter- and intra-sexual selection: the role of song in a lek mating system. Anim Behav 44:695–703. https ://doi.org/10.1016/s0003 -3472(05)80296 -9
Wildlife Acoustics (2017) Kaleidoscope Pro 4 Analysis Software. Bos-ton, MA. https ://www.wildl ifeac ousti cs.com
Wilkinson NI, Eaton MA, Marshall G, Haysom S (2018) The popula-tion status of Capercaillie Tetrao urogallus in Scotland during winter 2015–16. Bird Study 0:1–16. https ://doi.org/10.1080/00063 657.2018.14394 48
Publisher’s Note Springer Nature remains neutral with regard to jurisdictional claims in published maps and institutional affiliations.
Affiliations
Carlos Abrahams1,2
* Carlos Abrahams [email protected]
1 Baker Consultants Limited, West Platform Cromford Station, Cromford Bridge, Matlock, Derbyshire DE4 5JJ, UK
2 Nottingham Trent University, Clifton Campus, Nottingham NG11 8NS, UK