comparison of electrical and mechanical water pump ... · pdf fileloughborough university...
TRANSCRIPT

Loughborough UniversityInstitutional Repository
Comparison of electrical andmechanical water pumpperformance in internal
combustion engine
This item was submitted to Loughborough University's Institutional Repositoryby the/an author.
Citation: WANG, X. ... et al, 2015. Comparison of electrical and mechanicalwater pump performance in internal combustion engine. International Journalof Vehicle Systems Modelling and Testing, 10 (3), pp.205-223
Additional Information:
• This article was published in the International Journal of Vehicle Sys-tems Modelling and Testing [ c© Inderscience] and the definitive version isavailable at:
Metadata Record: https://dspace.lboro.ac.uk/2134/16561
Version: Accepted for publication
Publisher: c© Inderscience
Rights: This work is made available according to the conditions of the Cre-ative Commons Attribution-NonCommercial-NoDerivatives 4.0 International(CC BY-NC-ND 4.0) licence. Full details of this licence are available at:https://creativecommons.org/licenses/by-nc-nd/4.0/
Please cite the published version.

RMIT University Page 1 of 27
2014 Accepted version by Int. J. of Vehicle Systems Modelling and Testing
Comparison of Electrical and Mechanical Water Pump Performance in Internal
Combustion Engine
Xu Wang*
School of Aerospace, Mechanical and Manufacturing Engineering,
RMIT University,
Bundoora East, Vic 3083, Australia
Fax: +61-3-99256108100
E-mail: [email protected]
*Corresponding author
Xingyu Liang
State Key Laboratory of Engines,
Tianjin University,
92#, Weijin Road, Nankai District,
Tianjin 300072, China
E-mail: [email protected]
Zhiyong Hao
Department of Energy and Power Engineering
Zhejiang University
Hangzhou, P R China
RMIT University Page 2 of 27
Rui Chen
School of Aeronautical, Automotive, Chemical and Materials Engineering
Loughborough University
Loughborough, Leicestershire, LE11 3TU, UK
e-mail: [email protected]
Keywords: Power; Torque; Electrical Water Pump; Mechanical Water Pump.
Reference to this paper should be made as follows: Wang, X., Liang, X., Hao, Z. and Chen, R.
(2015) ‘Comparison of Electrical and Mechanical Water Pump Performance in Internal
Combustion Engine’, International Journal of Vehicle Systems Modelling and Testing, Vol.
XX, Nos. XX, pp.XX–XX.
Biographical notes: Xu Wang received his BE (Hons) and MS in Internal Combustion
Engine from Tianjin University, China, in 1985 and 1989, respectively, and his PhD in
Mechanical Noise and Vibration from Monash University, Australia, in 1994. He is
currently an Associate Professor in Automotive Engineering, at RMIT University,
Australia. He is Fellow of Society of Automotive Engineers, Director of Society of
Automotive Engineers, Australiasia. His research interests include the areas of vehicle
design, development and manufacturing, noise and vibration control, design and
construction of robots and manufacturing plants, material engineering, internal combustion
engine, etc.

RMIT University Page 3 of 27
Xingyu Liang is an Associate Professor at State Key Laboratory of Engines, Tianjin
University, China.
Zhiyong Hao is a Professor at Department of Energy and Power Engineering, Zhejiang
University, China.
Rui Chen is a Professor at School of Aeronautical, Automotive, Chemical and Materials
Engineering, Loughborough University, UK.
Abstract
This paper illustrates the differences between mechanical and electrical water pumps of internal
combustion engine. Literatures have been studied in regard to engine cooling with the water
pumps. Main design features of the mechanical and electrical water pumps have been illustrated.
Engine dyno tests have been carried to evaluate if increased torque and power can be obtained in
a common internal combustion engine (ICE) fitted with an electric water pump. Experiments
were conducted to verify the effectiveness of an electrical pump over a standard mechanical
pump.
Keywords: Power; Torque; Electrical Water Pump; Mechanical Water Pump; Oil Temperature;
Water Temperature, Cylinder Wall Temperature.
1. Introduction
Since the invention of internal combustion engine in 1883, the process of combustion
unfortunately produces an abundance of waste heat energy which needs to be removed in a

RMIT University Page 4 of 27
systematic manner via a cooling system to prevent damage to any mechanical components. The
output of the energy as a percentage of the energy generated by the fuel in the combustion
process is shown in Figure 1 for a modern passenger car engine when tested through a “NEDC
ECE 15 EUDC” European drive cycle. Specifically, the energy generated has 13% exhaust heat
losses to the wall and 18% wall heat losses which needs to be removed by a transfer mechanism
to lower the engine’s temperature [Zoz, S. , Thelen, W. , Alcenius, T. and Wiseman, M., 2001].
Hence in this case the heat transfer medium is the coolant fluid circulated by a water pump in the
engine’s cooling system.
Figure 1 Output energy as a percentage of the energy generated by the fuel in a modern
passenger car engine tested in a “NEDC ECE 15 EUDC” European drive cycle [Zoz, S. , Thelen, W.
, Alcenius, T. and Wiseman, M., 2001].
When the engine power output is substantially increased, the large amount of heat
generated needs to be removed in a timely manner to prevent damage to the engine components.
In this case, the coolant fluid, marked in a blue colour as shown in Figure 2, is required to
circulate around an engine to sufficiently carry the heat away, not only from the combustion
chamber but also other critical areas of the engine such as the engine block, the cylinder head, the
radiator and the heater core as demonstrated in Figure 2. It is this movement and circulation of

RMIT University Page 5 of 27
the coolant fluid that is studied in this paper. Hence, the water pump can be either mechanically
or electrically driven to circulate the coolant fluid around the engine in this cooling system.
Instead of use of water, the coolant is often mixed with water in modern vehicle engines, which
prevents the coolant fluid from either freezing or boiling, because the freezing or boiling water
will significantly reduce the effectiveness of heat removal.
Figure 2 Water cooling engine cylinder head.
The water pump has been improved in line with the internal combustion engine, and so has
been optimized in terms of its reliability and performance. In its current state in many models of
vehicles it is built to be cost effective and able to meet the demands of the engine under light to
heavy loads. Presently, single stage radial centrifugal pumps are used in the vast majority of
motor vehicle cooling circuits [Van Basshuysen, R. and Schafer, F., 2007]. The speed of the
pump and coolant flow rate are linked directly to the engine speed, through a serpentine belt or
meshing gear running directly off the engine’s crankshaft, running at a specific transmission ratio.
The specific ratio, as well as the pump impeller pitch and general design, are specified in order to
protect the engine under high load conditions, for example hill climbing, towing or driving in
atmospheres with high ambient temperatures, or all of the conditions combined. The major
problem with the mechanical water pump is that its design has missed the process control where
RMIT University Page 6 of 27
the coolant fluid pump should be controlled via demand orientated controllers and not
mechanically linked. In simple terms a demand orientated controller should use a manipulated
variable, in this case, impeller speed, to handle the controlled variable, coolant fluid temperature.
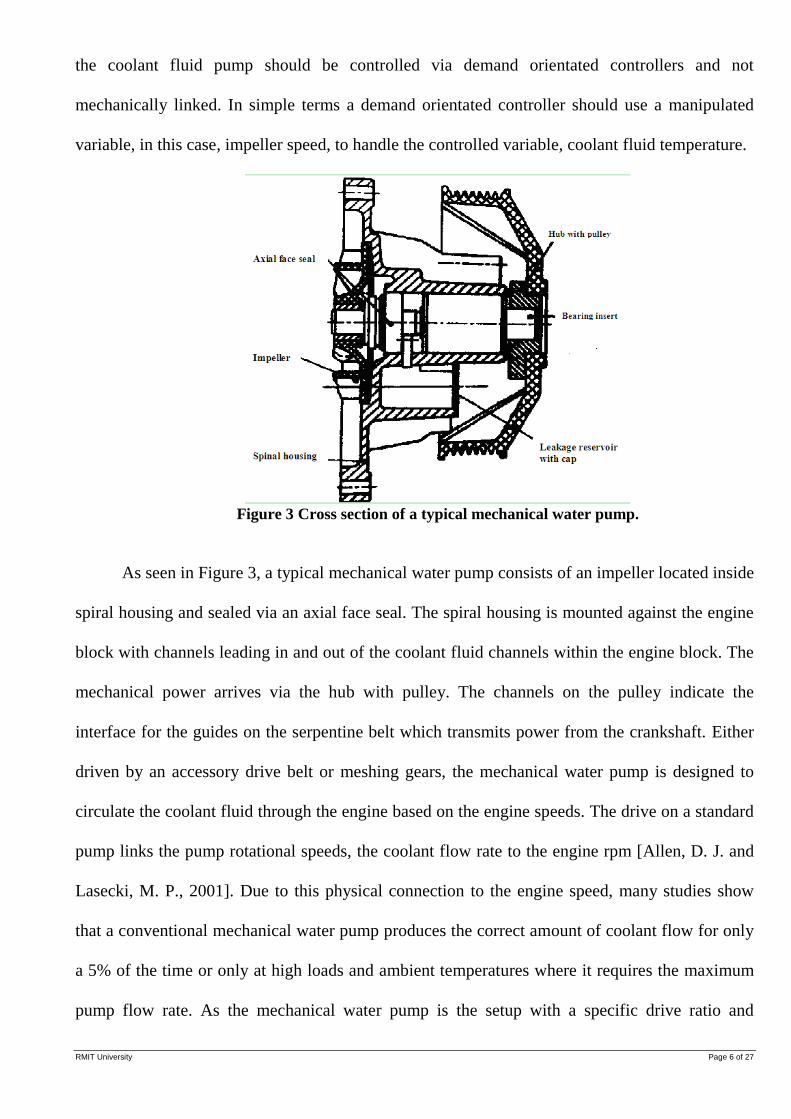
Figure 3 Cross section of a typical mechanical water pump.
As seen in Figure 3, a typical mechanical water pump consists of an impeller located inside
spiral housing and sealed via an axial face seal. The spiral housing is mounted against the engine
block with channels leading in and out of the coolant fluid channels within the engine block. The
mechanical power arrives via the hub with pulley. The channels on the pulley indicate the
interface for the guides on the serpentine belt which transmits power from the crankshaft. Either
driven by an accessory drive belt or meshing gears, the mechanical water pump is designed to
circulate the coolant fluid through the engine based on the engine speeds. The drive on a standard
pump links the pump rotational speeds, the coolant flow rate to the engine rpm [Allen, D. J. and
Lasecki, M. P., 2001]. Due to this physical connection to the engine speed, many studies show
that a conventional mechanical water pump produces the correct amount of coolant flow for only
a 5% of the time or only at high loads and ambient temperatures where it requires the maximum
pump flow rate. As the mechanical water pump is the setup with a specific drive ratio and
RMIT University Page 7 of 27
impeller suited for the highest or full load conditions at an engine speed, it is common for the
impeller to run the same speed unnecessary during a part load regular engine operation.
Also, at the speeds, higher than the rated engine speeds, the head, flow rate and hydraulic
efficiency of the mechanical water pump fall considerably [McCabe, W. L., Smith, J. C. and
Harriott, P., 1993]. At the speeds higher than the rated engine speeds, theoretical head capacity,
often called the head capacity relation, drops linearly with increased flow rate due to increased
circulatory flow and frictional losses. The actual head capacity drops much more severely due to
the losses in real situations. However it is common for vehicle engine to be run above the rated or
optimum speed [McCabe, W. L., Smith, J. C. and Harriott, P., 1993] where the coolant fluid flow
friction and shock losses convert the mechanical energy into heat. Leakage, disk friction and
bearing losses all contribute to the difference between actual power and theoretical power for the
working coolant fluid transfer. Therefore, beyond the rated or optimum flow rate, the hydraulic
power decreases [McCabe, W. L., Smith, J. C. and Harriott, P., 1993]. The ratio of hydraulic power
to the total power input rises rapidly at low rates, reaches a maximum and then falls in line with
the flow rate as it approaches the zero head, the maximum flow rate the pump can deliver under
any conditions [McCabe, W. L., Smith, J. C. and Harriott, P., 1993]. The mechanical water pump
efficiency falls at the increased flow rates after the rated or optimum flow rate is reached
[McCabe, W. L., Smith, J. C. and Harriott, P., 1993].
As the automotive industry strives to develop cleaner burning and more fuel efficient
engines, an electric water pump is becoming a sensible alternative to its mechanical counterpart.
Modern vehicles, in particular, the hybrid electric vehicles, have adopted advanced electronically
control systems and sensors which have impacts on the engine cooling system, because negative
aspects of the mechanically driven water pump are possible to be avoided [Allen, D. J. and
RMIT University Page 8 of 27
Lasecki, M. P., 2001]. Since the coolant flow rates of the mechanical water pumps are related to
the engine speeds [Wagner, J. R., et al., 2002], the thermal control using the mechanical water
pumps is generally not effective [Robert, D. and Chalgren, Jr., 2004] & [Haipeng, L. and Figliola,
R. S., 2004]. An electric water pump shall be a good alternative to the current mechanical water
pump, as the electric water pump may have an opportunity to remove a source of parasitic loss
from the internal combustion engine and provide a better control of the engine temperature
according to the engine heating and cooling requirements [Kluger, M. and Harris, J., 2007] &
[AP, N. S. and Golm, N. C., 1997] & [Choukroun, A. and Chanfreau, Matthieu, 2001].
Since an electric pump offers an effective flow control capability which is totally
independent of engine speeds, this can lower the system operating requirement with a reduced
pump flow rate at high engine speeds. This allows the engine to run at a more steady temperature,
as there is no sudden fluctuation in the coolant flow rate [Jawad, et al, 2004]. Some advantages of
an electric water pump used in internal combustion engines are discussed as below:
1. Design Losses – mechanical water pumps must be mounted where the power to
drive them is available. The power is usually at the front of the engine where belts or gear-train
can be used to provide the drive power. In some instances, this package constraint can limit the
ability to design a pump system and result in a reduced head flow. Furthermore, the mechanical
pump design has performance limiting characteristics such as fluid cavitations and erosion [Allen,
D. J. and Lasecki, M. P., 2001]. An electric pump can be remotely mounted, allowing the flow
characteristics to be hydraulically optimized while not impacting on the design constraint of both
the overall engine installation package and the cooling system effectiveness [Ribiero, E. G.,
2007].
2. Drive Losses – the gear drives of the mechanical water pump place large
accelerations into the pump shaft due to the gear teeth mesh which generates high cyclic side
RMIT University Page 9 of 27
loads on the pump bearings. The belt driven water pumps do not have the same accelerations as
the gear driven ones, but the belt driven water pumps can experience larger side loads due to the
drive belt tension. Both of these ‘driving’ factors require the mechanical water pumps to have
large bearings and the physical design to support the bearing loads. Electrical pumps feature a
drive motor in line with the impeller eliminating the need for large bearings and in some cases
seals depending on the type of coupling used between the motor and pump which further reduces
the pump drag friction loss [AP, N. S. and Golm, N. C., 1997].
3. Operating Losses - mechanical water pumps deliver the coolant flow and pressure
directly proportionally to engine speed, the only means of adjusting the coolant flow rate and
pressure is through use of the restriction valves. On the other hand, an electric pump can operate
as a function of the engine cooling requirement(s) which can adjust coolant flow rate based on
‘need’, not engine speed [Choukroun, A. and Chanfreau, Matthieu, 2001].
4. Eliminate Hot Soak after Shutdown - an electric pump is able to circulate coolant
fluid throughout the engine post shutdown which enables one to control the engine’s thermal
mass to prevent the overheat of critical components. This feature may also allow for design of
engines operating at higher temperatures considering that the hot soak design limits will be
eliminated [Ribiero, E. G., 2007] & [Koga, Y., 2006].
Although mechanical water pumps or electric water pumps were studied in a lot of
literatures, none of the literatures was to compare the both for the key performance index and
characteristics in the same internal combustion engine. The objectives of this paper are to back to
back compare an electrical water pump with a mechanical pump installed in a laboratory engine
with a dynamometer for main engine performances and to verify the effectiveness of the
electrical water pump over the standard mechanical water pump. In order to achieve those
objectives, water pumps are first studied for their fundamental designs as below.

RMIT University Page 10 of 27
2. Design of water pumps
A 3-D CAD model of a mechanical water pump used in the engine dyno test is shown in
Figure 4. This CAD model can be used as a geometry data input to a CFD (computational fluid
dynamics) software model to obtain the CFD results.
Figure 4 A CAD model of mechanical water pump.
The specific engine rotational speed can be calculated from the pump speed, discharge
head and flow rate as [Karassik, I. J., et al., 2001]:
75.0H
QNNs ………… (1)
where Ns is the specific engine speed in rpm; N is the pump rotational speed in rpm, H is the
discharge head and Q is the fluid mass flow rate. If the ratio of the crank pulley over the water
pump pulley is 2. Hence, the pump speed is 2 times of engine speed. With the flow rate, we can
calculate discharge head, the fluid horse power and the fluid inlet velocity, which will be used in
the following CFD analysis. The head coefficient can be written as
)cot(12
22
2
3
2
2
U
C
U
gH mh …… (2)

RMIT University Page 11 of 27
where Ψ is the head coefficient or shut off constant; g is the gravity acceleration; ηh is the
hydraulic efficiency; Cm3 is the meridian velocity; U2 is impeller peripheral speed; β2 is the
discharge vane angle; the slip factor μ is given by
ZC
C
u
u )sin(*1 2
3
'
3 …… (3)
where Cu3 is theoretical peripheral velocity; C’u3 is the actual fluid peripheral velocity; Z is the
number of blades. The meridian velocity is used to set inlet velocity for the Gambit software, and
impeller peripheral speed is used for calculating the shut off point for the plotted pump curves in
Figure 5. Given the head coefficient, the required impeller tip speed can be calculated by:
gHU
22 …… (4)
A 2D water pump geometry was drafted by a CAD software; the pre-processing software
Gambit was then used to generate mesh and define the boundary condition. After meshing the
geometry, the post-processing software Fluent 6 was used to calculate the pressure rises for
different pump flow rates from the above parameter inputs. The results of pressure rises versus
the pump flow rates are plotted in Figure 5 for the engine speeds of 2000 ~ 5000 rpm. It is seen
from Figure 5 that different engine speeds will have different water pump performance curves; as
the flow rate increases, the pump head decreases.

RMIT University Page 12 of 27
Figure 5 mechanical water pump performance
In the same way, the hydraulic efficiency of the mechanical water pump can be calculated and
given in Figure 6. It can be seen from Figure 6 that for each of the engine speeds, the hydraulic
efficiency first increases as the pump flow rate increases, then reaches a maximum value, finally
decreases as the pump flow rate increases. The maximum hydraulic efficiency value for each of
the hydraulic efficiency curve for each of the engine speeds is recorded in Table 1.
Figure 6 mechanical water pump efficiency.
The fluid horse power can be calculated by multiplying the flow rate with the total discharge
head. If the ratio of the crank pulley over the water pump pulley is assumed to be 2 for the
mechanical water pump, for example, the fluid horse power can be calculated from the X-Y data
at each of the points on one of the curves in Figure 5 for each of the engine speeds. The water
pump input powers for different engine speeds can be calculated from the fluid horse powers
divided by the maximum hydraulic efficiency values listed in Table 1.
Table 1 The variation of best efficiency and input power for different engine speeds.
Engine speed
(RPM) Best efficiency Input power (kW)
2000 37.5% 0.185
3000 48% 0.183
4000 53% 0.198
5000 55% 0.219

RMIT University Page 13 of 27
It is seen from Table 1 that at 5000 rpm, the mechanical water pump shows the highest best
efficiency and input power, which are 55% and 0.219 kW, respectively. Accordingly, at this
speed, the fuel consumption will be the highest as well.
A development electric water pump will be tested in the engine dynamometer in a
comparison with the benchmark mechanical water pump. The technical specifications of electric
water pump are given in Figure 7, and the electric water pump performance curve is given in
Figure 8 where the vertical axis represents the pressure rise, the horizontal axis represents the
flow rate. It is seen that when the pump flow rate increases, the pressure rise decreases. The
performance curve of the development electric water pump has the same trend as those curves in
Figure 5, but differently, it is independent of the engine speeds.
Figure 7 technical specifications of the development electric water pump [Davies Craig Catalogue,
2010].
It is seen from Figures 7 and 8 that at the best efficiency point, the input power of electric water pump is
7.5A*13.5V=101.25w=0.10125kw. This means the electric water pump consums much less energy or
fuel than the mechanical water pump in a comparison with the data in Table 1.

RMIT University Page 14 of 27
Figure 8 Electric water pump performance [Davies Craig Catalogue, 2010]
The materials of the pump housing of the mechanical water pump are usually aluminium
or gray cast iron. The material of the pump housing of the electric water pump can be nylon 66
(30% glass fibre filled), aluminium, nylon, plastics and gray cast iron for some of the parts
[Allen, D. J. and Lasecki, M. P., 2001]. The material difference leads to a weight saving for the
vehicle where the engine and the electric water pump are installed [Zoz, S., Thelen, W., Alcenius, T.
and Wiseman, M., 2001].
Figure 9 Materials for pump housing.
The materials of the pump impeller are usually duroplasts, thermalplasts, sheet metal, aluminium,
which are used in passenger car and gray cast iron which is used in commercial vehicle as shown
in Figure 9. Potential water pump impeller materials are titan-alloy, carbon-fibre and magnesium-
alloy as shown in Figure 10. Ti-alloy is a very lightweight but expensive material, and currently

RMIT University Page 15 of 27
is not affordable. The advantages of carbon fibre are low density, high tensile strength and low
thermal expansion. In addition, it is strong when stretched or bent, while weak when compressed
or exposed to high shock. The carbon fibre is currently having difficulties for a mass production.
Magnesium-alloy has excellent damping capacity, good heat dissipation, high castability and
excellent machinability. Compromising the cost and the characteristics of the above materials, the
Magnesium-alloy is relatively good to be selected as the future material for the electric water
pump impellers.
Figure 10 water pump impellers.
The manufacturing techniques of the mechanical water pump include casting, forging,
machining, assembly of the water pump and inspection. Machining the mechanical water pump
involves CNC turning, pin boring, grinding the side face, milling of housing and machining
impeller and pulley. An electric water pump is much simpler to manufacture than its mechanical
counterpart, as the total number of parts of the electric water pump is much less. The pump
housing can be made from thermal/injection moulding and machining processes, while the
impeller can be made from casting and machining processes.
Design failure mode and effect analysis (DFMEA) has been conducted for the electric
water pump. One of the major risks associated with the electric water pump could be the electric
motor burnout due to an impurity getting caught in the impeller and stopping the pump. For a
regular mechanical water pump, such a blockage would result in belt slippage and cause no major
issues with the pump itself. However with a direct linkage to a motor shaft in the electric water
pump, such a blockage would result in a burnout of the motor. To countermeasure this issue it is

RMIT University Page 16 of 27
recommended to use coolant fluid filters. A CFD analysis is performed to find the optimum
design to not allow the blockage whilst still maintaining required performance or a fuse in the
electric circuits may be used to protect the motor from an overload. One common method being
adopted by pump suppliers is to use a magnetic drive, whereby the pump is driven by magnetic
force through the pump housing. This has the added benefit for removing a flange / gasket and
potential source of coolant fluid leakage.
3. Engine dynamometer tests for the water pumps
In order to verify the effectiveness of an electrical pump over a standard mechanical pump,
engine dynamometer tests have been conducted where the engine fitted with the mechanical and
electric water pumps was run back to back. The two tests were:
1. Power and torque test across the RPM range
2. Cool down time / Heat Soak reduction test.
Furthermore, the dynamometer tests were also set up to record various engine temperatures at
each engine speed point to monitor any temperature changes.
As shown in Figures 11 and 12, the engine test facility is a 600 kW Power Masta engine
dynamometer connected to one computer which controls the engine dynamometer’s torque and
its threshold setting along with six data acquisition channels to record various temperatures via
thermocouples. In addition, another computer is installed with the MOTEC engine software
package, which acts as the test engine control computer. Two mechanical pumps were used in the
tests. One is a standard mechanical pump which is an “attached type” with a simple impeller
consisting of 10 folded metal blades. The pump uses a hub with pulley, driven through a
serpentine belt which is run from the crankshaft. The other is a modified mechanical pump with

RMIT University Page 17 of 27
the impellor machined off to maintain the drive shaft and bearings in order to avoid coolant fluid
leakage and to pass the coolant fluid freely through the engine. Hence, when the electric water
pump is fitted, the standard mechanical water pump is replaced with the modified pump to allow
the coolant fluid to flow through the engine as pumped by the electric water pump. The power
required to drive the hub would obviously be reduced and neglected. The development electric
pump was mounted in series between the engine and radiator core, that is, between the coolant
fluid outlet of the dynamometer cell’s radiator tank and the coolant fluid inlet side of the test
engine as shown in Figure 13. The electric water pump power switch was placed in the
Dynamometer control area in order that it could be switched on and off as required by the
operator.
Figure 11 engine dynamometer.
Figure 12 Computers for the engine control and data acquisition.

RMIT University Page 18 of 27
The test engine as shown in Figure 11, is a 3.8L V6 as used in many locally produced vehicles. The
engine specifications are listed in Table 2. The engine’s block and cylinder heads are built of cast iron and
joined to an aluminium intake manifold and timing cover with a front mounted water pump.
Figure 13 The development electric water pump and its mounting position.
In order to monitor the engine’s behaviour, the engine was instrumented with six individual
thermocouples, in addition, the engine heating and cooling time were recorded, when the electric water
pump was turned on or off. Since two computers were required, the computer’s clocks were synchronised
before running the tests. Once all the tests were completed, data logging stopped at the same time. The six
thermocouple positions are listed in Table 3.
Table 2 The test engine specifications
Capacity 3.8L V6 (L36)
Stroke 86 mm
Bore 97 mm
Power 205 hp / 153 kW
Torque 230 lb*ft / 312 N*m
Overall weight 178 kg
Table 3 Measurement temperatures at the locations of the six thermocouples
Number Temperatures at the locations
1 Water temperature - before thermostat
2 Water temperature - after thermostat
3 Engine oil temperature
4 Radiator tank temperature
5 Another Water Temperature - after
thermostat
6 Dynamometer cell temperature

RMIT University Page 19 of 27
Power run tests were scheduled with a couple of cool down times in between. The mechanical water
pump was first tested. The engine was started and run at idle until the oil temp reached above 60ºC. The
dynamometer controller was set at the desired speed points of 2000, 2500, 3000, 3500, 4000 and 5200
rpm. The engine was throttled to about 75% load at the test speed points each by each. From there the
engine was tested at about 75% load across the RPM range. Torque was recorded continuously and
average values were used. Power was then calculated from the engine speeds and torque values. Engine
torque, power and temperatures were recorded for all the speed points. The engine was switched off and
allowed to cool for a period of 20 minutes observing the water temperature at 2 minute interval, which
allows for observing whether the heat soak occurred and for experiencing how an engine usually cools
down. In order to record the cool down time for the engine with mechanical water pump, the engine was
started and run at idle until the oil temp stabilised, the engine was switched off, the temperature readings
of each thermocouple were recorded for 20 minutes. After the tests of the mechanical water pump were
completed, the mechanical water pump was replaced by the ‘dummy’ mechanical water pump with the
impeller machined off, the electric water pump was installed to pump the coolant fluid through the hoses
as shown in Figure 13. The above test procedures for the mechanical water pump were repeated for the
electric water pump. After the engine tests with the electric water pump were completed, the
engine was switched off for a 20 minute cooling period. The engine was started again and run at idle
until the oil temp stabilised, the engine was switched off, the electric water pump was allowed to keep
running for 20 minutes to investigate the impact of continued coolant flow on the heat soak.
4. Test results and discussions
With the test schedule completed, all the results were compared for the performance of
each water pump type. Figure 14 shows the powers and torques for the engine with the
mechanical and electric water pumps. When the engine is equipped with an electric pump, the
engine’s torque output is approximately 2~4 N*m higher than that with the mechanical pump at

RMIT University Page 20 of 27
each engine speed recorded. This is indicated by the red and dark blue curves in Figure 14, for the
mechanical and electrical pumps respectively. Since engine power is a function of the torque, the
engine power follows the difference in the torque and therefore the engine with the electrical
pump provides more power than that with the mechanical pump. When referring back to the
assumption regarding improving the engines efficiency by utilising an electric water pump to
reduce an engine’s parasitic loss, the engine power enhancement with an electric pump is
expected, although the effective engine cooling brought by the electric water pump may also
result in increased frictional losses and power loss.
Figure 14 Output torques and powers for the engine with the mechanical and electric water
pumps.
Water Temp Before Thermostat
0.0
10.0
20.0
30.0
40.0
50.0
60.0
70.0
80.0
90.0
100.0
2000 2500 3000 3500 4000 4500 5000 5500
Engine Speed (rpm)
Te
mp
era
tu
re
(0C
)
Mechanical Pump Electric Pump

RMIT University Page 21 of 27
Figure 15 Temperatures before the thermostat for the engine with the mechanical and
electric water pumps.
Figure 15 shows the temperatures before the thermostat in the engine with the mechanical
and electric water pumps. The chart clearly displays the dramatic effect which an electrical water
pump can have on an engine’s cooling system. Note that the dark blue curve, for the mechanical
water pump slightly increases inline with engine speed where as the red curve for the electric
water pump stays fairly stable and in fact, slightly decreases as engine speed increases. Figure 16
shows the oil temperature of the engine with the mechanical and electric water pumps. Once
again, the electric water pump provides slightly cooler oil with a temperature by approximately
10ºC less.
Oil Temperature
0
20
40
60
80
100
120
140
2000 2500 3000 3500 4000 4500 5000 5500
Engine Speed (rpm)
Te
mp
era
tu
re
(0C
)
Mechanical Pump Electric Pump
Figure 16 Oil temperatures for the engine with the mechanical and electric water pumps.
Closely related to the test engine’s intake air charge temperature, the dynamometer cell
ambient temperature was logged to ensure that the results are not skewed to favour one particular
pump. If the dynamometer cell’s temperature was hotter using one type of the pumps, the engine
would then have to work harder to produce the same amount of power. Temperatures recorded
for the engine dynamometer run with the two types of water pumps were very close. Referring to
the other temperature and performance results, it was noted that this did not significantly skew
the results.

RMIT University Page 22 of 27
Once all the performance and temperature data was collected for each type of the water
pumps, the time for engine cool down was measured, and the data shown in Figure 17. The
engine oil temperatures of the two pumps are almost exactly the same since the engine oil was no
longer circulated inside the engine when the engine was switched off. With respect to water
temperatures, the data clearly demonstrates the rapidly cooling down effect which the electric
water pump can have on the water temperature where the temperature decreased up to the
ambient within 4 minutes from the engine being turned off. Running the electric water pump after
the engine shutdown resulted in a significant temperature reduction within the first 4 minutes,
after which the engine temperature became stable. The temperature reduction significantly
reduces the risk of the heat soak and would therefore help to enhance the engine life and
reliability. If the dark blue curve for the mechanical water pump water temperature is studied, it is
clearly seen that the effect of ‘heat soak’ starts as the water temperature increases by at least 10ºC
from the engine being turned off, then slowly starts to cool down. This is because that the heat
was left in the engine block and the coolant fluid after the engine was shut down. In reality,
higher loads, speeds and ambient temperatures may result in larger heat soak, which explains why
some vehicles have their engine cylinder heads damaged because of overheating.
Cool down/Heat Soak Time
0
20
40
60
80
100
120
140
00:00 00:02 00:05 00:08 00:11 00:14 00:17
Time (Minutes)
Te
mp
era
ture
s (
0C
)
Water Temp - Mech Oil Temp - Mech Water Temp - Electric Oil Temp - Electric
Figure 17 Cool down/heat soak temperatures for the engine with the mechanical and electric water
pumps.
RMIT University Page 23 of 27
In a summary, the experimental analysis of mechanical and electrical water pumps for the
engine performance has shown that the electrical pump outperformed the mechanical water
pump. Understanding that the dynamometer cells ambient air temperatures were exactly the same
for the pumps tested; the tests have not been skewed to favour one particular pump. Referring to
the temperature results for the mechanical water pump vs. the electric water pump for the various
temperature sensors it is clearly evident that some parts of the engine were run approximately
40% cooler with the electric water pump, for example, both the coolant fluid temperature and the
engine oil temperature showed “cooler” values. As the electric water pump could pump more
than adequate quantities regardless of engine speeds, the coolant fluid temperature was kept
consistently low. With regards to the temperature performance, it is surely concluded that the
electrical water pump is the clear winner. At every testing speed point recorded, the electrical
pump outperformed the mechanical pump enabling the engine to run much cooler. One of
additional tests performed in future for potential improvements should be, for example, to
conduct an A-B-A-B test strategy, where the mechanical and electrical water pumps will be tested
twice independently to ensure the results are both repeatable and reproducible. Hence, this will be
a similar process to conduct the six sigma method of a “Gauge R&R”.
In order to further verify if the benefits are available for use of the electric water pump, it
is necessary to adequately size the electric water pump and control its use via a proper
understanding of the engine’s optimum operation temperatures and then implement an ECU to
manage the water pump switching to adequately control the engine temperature. Furthermore a
variable speed electric motor could also increase controllability of the engine temperature at the
optimum points.

RMIT University Page 24 of 27
5. Conclusions
With regards to the engine performance enhancement and temperature reduction, the
electric water pump well outperformed the mechanical water pump at every speed point. The
benefits of the electric water pump in terms of torque, power and fuel consumption improvements
will be realised with the detailed future development plans.
References
1. Allen, D. J. and Lasecki, M. P. (2001), Thermal Management Evolution and Controlled Coolant
Flow, SAE Technical Paper Series 2001-01-1732.
2. Zoz, S., Thelen, W., Alcenius, T. and Wiseman, M. (2001), Validation of Methods for Rapid
Design and Performance Prediction of Water Pumps, SAE 2001-01-1715.
3. Ribiero, E. G., (2007). Electric Water Pump for Engine Cooling, SAE Technical Paper 2007-01-
2785.
4. Koga, Y. (2006). Development for Stamped WATER PUMP (Innovative Structure WATER
PUMP), SAE Technical Paper 2006-01-0615.
5. Jawad, B., Zellner, K. and Riedel, C., (2004), Small Engine Cooling and the Electric Water Pump,
SAE 2004-32-0084.
6. Karassik, I. J., et al. (2001), pump handbook, 3rd edition, McGraw-Hill.
7. McCabe, W. L., Smith J. C. and Harriott, P. (1993), Unit Operations of Chemical Engineering,
Fifth Edition, McGraw Hill International, Singapore
8. Van Basshuysen, R. and Schafer, F. (2007), Modern Engine Technology from A to Z, SAE
International, ISBN: 978-0-7680-1705-2.

RMIT University Page 25 of 27
9. Robert, D. and Chalgren, Jr., (2004). Thermal Comfort and Engine Warm-Up Optimization of a
Low-Flow Advanced Thermal Management System, SAE Technical Paper 2004-01-0047.
10. Haipeng, L. and Figliola, R. S., (2004). Optimization of an Automotive Cooling System Based on
Exergy Analysis, SAE Technical Paper 2004-01-3541.
11. Kluger, M. and Harris, J., (2007). Fuel Economy Benefits of Electric and Hydraulic Off Engine
Accessories‟ SAE Technical Paper 2007-01-0268.
12. AP, N. S. and Golm, N. C., (1997). New Concept of Engine Cooling System (Newcool), SAE
Technical Paper SAE Technical Paper 971775.
13. Choukroun, A. and Chanfreau, Matthieu, (2001). Automatic Control of Electronic Actuators for
an Optimized Engine Cooling Thermal Management, SAE Technical Paper SAE Technical
Paper 2001-01-1758.
14. Wagner, J. R., Ghone M. C., Dawson, D. W. and Marotta, E. E. (2002). Coolant Flow Control
Strategies for Automotive Thermal Management Systems‟ SAE Technical Paper 2002-01-0713.
15. Davies Craig Catalog (2010), Electric Water Pump Selection Guide.
RMIT University Page 26 of 27
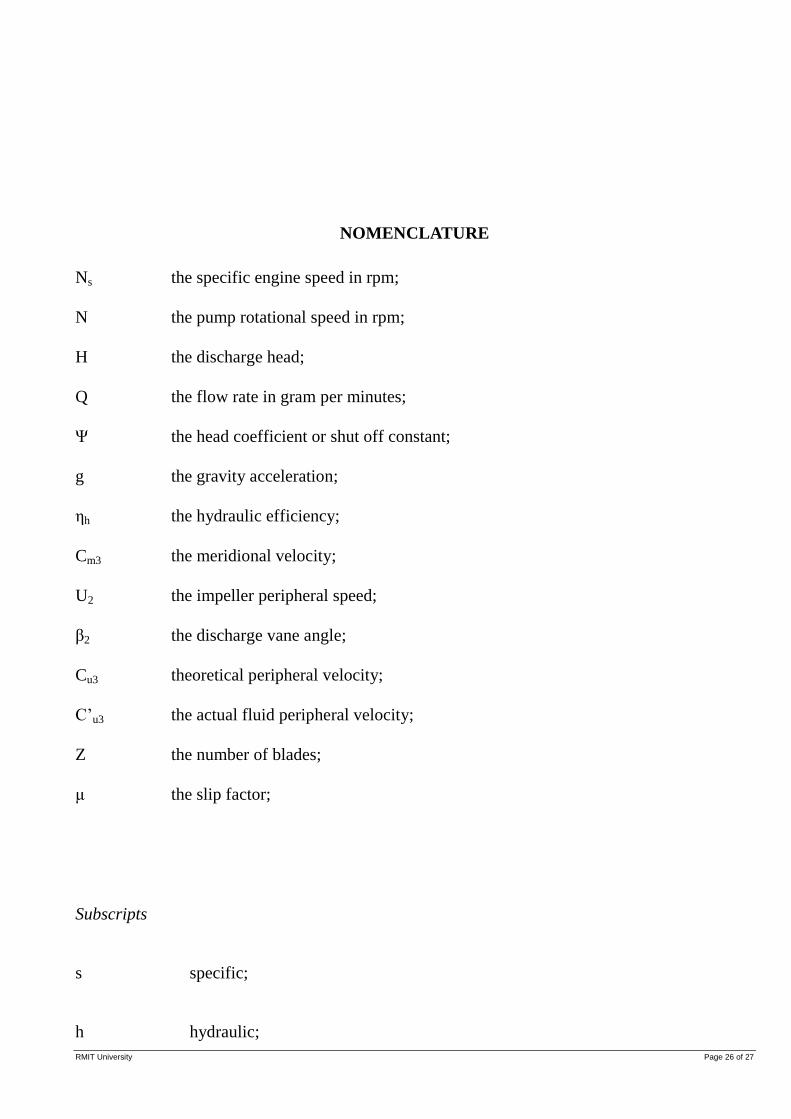
NOMENCLATURE
Ns the specific engine speed in rpm;
N the pump rotational speed in rpm;
H the discharge head;
Q the flow rate in gram per minutes;
Ψ the head coefficient or shut off constant;
g the gravity acceleration;
ηh the hydraulic efficiency;
Cm3 the meridional velocity;
U2 the impeller peripheral speed;
β2 the discharge vane angle;
Cu3 theoretical peripheral velocity;
C’u3 the actual fluid peripheral velocity;
Z the number of blades;
μ the slip factor;
Subscripts
s specific;
h hydraulic;

RMIT University Page 27 of 27
m3 meridional;
u3 peripheral velocity;
Abbreviations
ICE Internal Combustion Engine
NEDC ECE 15 EUDC New European Driving Cycle ‘ECE 15’ Extra-Urban Driving
Cycle
RPM Revolution Per Minute
FEAD Front End Accessory Drive
A/F Air/Fuel ratio;
CR Compression Ratio;
VVT Variable Valve Timing;