comparison of h2 and he carbon cleaning … · and he carbon cleaning mechanisms in extreme...
TRANSCRIPT

Comparison of H2 and He carbon cleaning mechanisms
in extreme ultraviolet induced and surface wave discharge
plasmas
A Dolgov1, D Lopaev
2, T Rachimova
2, A Kovalev
2, A Vasil’eva
2, C J Lee
1,
V M Krivtsun3, O Yakushev
3 and F Bijkerk
1
1 Dutch Institute for Fundamental Energy Research (DIFFER), Nieuwegein, The
Netherlands 2 Moscow State University, Moscow, Russian Federation
3 Institute for Spectroscopy, Moscow, Russian Federation
E-mail: [email protected]
Abstract. Cleaning of contamination of optical surfaces by amorphous carbon (a-C) is highly
relevant for extreme ultraviolet (EUV) lithography. We have studied the mechanisms for a-C
removal from a Si surface. By comparing a-C removal in a surface wave discharge (SWD)
plasma and an EUV-induced plasma, the cleaning mechanisms for hydrogen and helium gas
environments were determined. The C-atom removal per incident ion was estimated for
different sample bias voltages and ion fluxes. It was found that H2 plasmas generally had
higher cleaning rates than He plasmas: up to seven times higher for more negatively biased
samples in EUV induced plasma. Moreover, for H2, EUV induced plasma was found to be 2-3
times more efficient at removing carbon than the SWD plasma. It was observed carbon
removal during exposure to He is due to physical sputtering by He+ ions. In H2, on the other
hand, the increase in carbon removal rates is due to chemical sputtering. This is a new C
cleaning mechanism for EUV-induced plasma, which we call “EUV-reactive ion sputtering.”

1. Introduction
According to the International Technology Roadmap for Semiconductors (ITRS), extreme ultraviolet
lithography (EUVL) is currently the most advanced technology for the fabrication of integrated
circuits with characteristic half-pitch, hp 22 nm [1]. Multilayer mirrors (MLM) are the basic optical
element in EUV lithography. At an operating wavelength of 13.5 nm, MLMs consist of approximately
50-60 bi-layers of Mo:Si that are 6.7 nm thick. The mirrors are often covered with a protective layer
that is 1.5-2 nm thick. To obtain the desired optical resolution, the mirrors must have a surface
roughness much less than the wavelength, with reported values being approximately 0.2-0.3 nm. Thus,
multilayer mirrors in EUV lithography are expensive, high-technology items, making it desirable to
extend their useful lifetime as much as possible.
Previous research has demonstrated that MLMs lose their reflectivity due to the pollution of their
surfaces with amorphous carbon, and/or surface oxidation, induced by intense EUV radiation [2-5]. In
order to ensure optimal image resolution and uniform exposure, the EUVL optical system consists of
6-10 multilayer mirrors. In these circumstances, even a small loss of reflectivity for each mirror
simultaneously (~1-2%) leads to a significant deterioration in optical throughput. For example [6,7], a
carbon film just a few nm thick would already cause such loss of MLM reflectivity. In UHV
conditions, where the rate of accumulation of amorphous carbon is limited by the partial pressure of
hydrocarbons, the growth rate of the carbon layer can be quite high, ranging from 0.001 nm/hr to 0.01
nm/hr, depending on the precise EUV illumination and partial pressures [8.9].
Given that EUVL requires a long MLM lifetime (i.e. ~30000 hr) [10,11], it is obvious that cleaning
mechanisms for MLMs are required. Moreover, such cleaning systems should be realized in such a
way that interruptions to operation are minimized, i.e. in situ, without affecting the rest of the
equipment or the lithographic process. In terms of quantities, such in situ cleaning should remove
carbon with sufficient efficiency (at least faster than it deposits) and, at the same time, the capping
layer of the mirror should not suffer damage over the entire period of the MLM’s life.
At present, atomic hydrogen is used to clean MLMs [12-18], because the majority of basic hydrogen
compounds are volatile. However, the efficiency of atomic hydrogen cleaning of amorphous carbon is
extremely low [19] particularly in comparison with the surface recombination probabilities [20].
Moreover, atomic hydrogen generates heat (e.g., radiative heating from a hot filament), creating a high
radiation and thermal load on the MLM surface that affects the speed and selectivity of cleaning. The
efficiency of removing amorphous carbon from the MLM surface using plasmas is much higher than
atomic hydrogen cleaning [19]. A low-temperature low-pressure plasma, even at low densities,
provides fast, efficient and accurate carbon cleaning. This is why the generation and management of
such plasmas, near the MLM surface during EUVL operation, is of special importance for the
development of continuous in situ mirror cleaning technology. The EUV-photon energy of 91.8 eV is
sufficient to generate a cascade of photons and secondary electrons. The EUV-induced secondary
electrons collide with the background gas (mostly molecular hydrogen) to form a plasma above the
surface of the EUV optical element. Furthermore, intensive EUV radiation, along with the flux of
charged particles from the plasma, can induce processes on the surface with the participation of gas
molecules.
This paper investigates the mechanism of amorphous carbon cleaning in EUV-induced plasma. To
exclude surface sputtering and separate the influence of physical and chemical processes, the
background gases were limited to molecular hydrogen and helium. Moreover, to determine the role of
photons, analogous experiments were conducted in a low-temperature discharge plasma with similar
ion energies and plasma densities.

By comparing cleaning rates between these different regimes, the roles of ion energy, EUV radiation,
and chemical activity were clarified.
2. Samples and diagnostics of amorphous carbon
Previous research has shown that magnetron sputtered carbon films are structurally and chemically
similar to carbon films that grow during EUV illumination [21]. Hence, in this work, magnetron
deposited amorphous carbon films are used as model contamination layers. Films of carbon were
deposited on silicon wafers and model MLMs (40 bi-layers of Mo/Si, each ~6.9 nm thick). The as-
deposited carbon layers had thicknesses of ~20 and ~10 nm for the silicon wafer and MLM samples,
respectively. Amorphous carbon layer thicknesses were measured using Raman spectroscopy (RS) and
the Energy Dispersive Spectroscopy (EDS), i.e. X-ray fluorescence analysis (XRF). Figure 1 shows a
typical calibration curve for RS and XRF. The symbols show intensity of the EDS and RS signals
(carbon peak intensity for the EDS method and integral of the D- and G-peak region in RS) versus
carbon film thickness. The deposited carbon mass was measured during deposition by a quartz mass
balance. The layer thickness was measured using spectroscopic ellipsometry after deposition. A linear
regression of the data results in a measurement accuracy of ±0.5 nm (whatever a monolayer is) for
XRF and ±2 nm for RS. Since XRF provides higher precision, it was used for the data presented.
0 5 10 15 20 25 300
200
400
600
800
1000
1200
1400
0
2000
4000
6000
8000
10000
12000
14000
16000
XRF measurements
RS
in
ten
sity,
a.u
.
XR
F d
ete
cto
r sig
na
l,
a.u
.
C thickness, nm
RS measurements
Figure 1. The magnetron-deposited carbon peak intensities for XRF (EDS) and
RS versus the carbon thickness, measured by ellipsometry and quartz mass
balance (during the deposition).
3. EUV-induced plasma
A schematic of the EUV-induced plasma interaction chamber and sample surface is presented in figure
2. The interaction chamber is capable of operating at background pressures of ~(3-5)10-8
Torr, which
is maintained by separating the interaction chamber from the EUV source with a Zr/Si spectral purity
filter (~40% transmission at 13.5 nm). The interaction chamber can be supplied with either H2 or He,
which are passed though a cold-trap to remove contaminants before the gas is introduced to the
chamber.

The plasma is initiated by a short impulse of EUV 13.5 nm radiation, incident on the sample surface.
The EUV source is a Sn-based, discharge Z-pinch, which operation principle has been described in
detail elsewhere [22]. The source emits 100 ns pulses of broadband EUV radiation at a repetition rate
of 1.5 kHz. After focusing and filtering, the spectrum is centered on 13.5 nm.
An image of the intensity profile of the EUV radiation at the focus is presented in figure 3а. The
collector mirror’s focal spot and a halo of scattered EUV radiation of 1-2 mm, due mainly to the
roughness of the mirror surface are clearly visible. To eliminate most of the scattered EUV radiation, a
diaphragm of synthetic mica (Ø = 8 mm) was placed on top of the samples (see figure 3a). Figure 3b
presents a radial profile of the EUV radiation intensity inside the diagraph. It can be seen that the
intensity of the EUV radiation reduces significantly towards the edge of the exposure zone, while the
central area of 3 mm diameter has a relatively uniform distribution. The intensity profile of the EUV
radiation incident on the sample was taken into account in the analysis presented below. The pulse
energy was limited by the diaphragm to 0.042 mJ, whereas the average power was estimated to be
0.13 W/cm2.
As a consequence of the fixed EUV source geometry, a cylindrical biasing electrode system was used.
The sample plays the role of the cathode, being held at negative biases, down to -200 V. A metal
cylinder, 30 mm in diameter and ~60 mm long, served as a grounded anode, with the sample centered
on the axis of the cylinder, as shown in figure 2. In background-only tests, the photoelectron current
has a duration that is nearly identical to that of the EUV pulse duration, while the peak current
depends on the applied bias voltage (see figure 4а). In the presence of higher pressures (5-45 Pa), a
similar photoelectron current pulse was observed. However, the tail of the pulse was found to extend
to 4-10 µs (see figure 4а). Moreover, the current in the tail was found to increase for more negative
bias voltages. The tail is a product of ionization by accelerated ‘hot’ secondary photoelectrons, as well
as photoionization of gas molecules and atoms. However, it should be noted that the first process is,
apparently, the main one, based on the known Н2 and Не photoionization cross-sections, and the low
pressures used in our experiments. The total charge developed by the EUV pulse (i.e. the number of
electrons freed by ionization as well as photoelectrons) is estimated by integrating the current.
Figure 4b shows the total charge collected following the EUV pulse versus the applied bias voltage
(volt-coulomb characteristics) in vacuum and at different values of H2 pressure. The difference
between sample currents in a gas and vacuum corresponds to the charge generated in the gas, i.e.
plasma charge, and is related to the total ion charge collected by the sample surface. Assuming that the
plasma is quasi-neutral, the total ion charge was used to estimate the number of ions formed in the
volume of the EUV-induced plasma above the sample. It was also used to estimate the per-pulse ion
flux, incident on the surface, for each applied bias voltage.
The radial profile of removed carbon approximately matches the profile of EUV radiation (see figure
3b). Figure 5 presents the rate of carbon removal at the center of the EUV spot in 3 Ра Н2 and Не
plasmas for various bias voltages. It can be seen that the rate of carbon removal increases with
increasing bias voltage. Moreover, this rate is significantly higher for Н2 plasmas, compared to that for
Не plasmas. The increase in bias voltage leads to an increase in current and the energy of ions incident
on the sample surface, which, should, naturally, lead to an increase in the rate of carbon removal. Note
that the differences between the volt-coulomb characteristics for Н2 and Не EUV-induced plasma are
insignificant, i.e. the difference between ionic flux for Н2 and Не is insignificant. This means that the
number and kinetic energy of the particles incident on the sample surface for the two different plasmas
are the same. Similarly, He+ and H3
+ particles have nearly identical momentum, so they should be
equally effective at physical sputtering. Given these considerations, it is only possible to explain the
great difference in the rate of carbon removal between hydrogen and helium by chemical processes,

induced by hydrogen ions on the carbon surface. Such processes, as well as the role of EUV photons,
are examined in detail in Section 5.
Figure 2. Set up of the experiment for carbon cleaning in
EUV-induced plasma.
0 1 2 3 4 50
1
2
3
4
5
6
Positio
n o
f dia
phra
gm
boundary
Re
mo
ve
d C
la
ye
r,
nm
Distance from the center X, mm
(a) (b)
Figure 3. (a) EUV exposure pattern measured by sensitive foil and (b) C cleaning profile. To show (b)
cleaning rate profile for obtaining the cleaning rate averaged on the profile to recalculate it then into
the C yield atoms/ion since the total number of ions (charge of ions) came to the sample surface (on
1cm2 per a EUV pulse) is measured as averaged on the sample area (inside the mica diaphragm, the
position and size of which is indicated in yellow).

0.0 2.0x10⁻⁶
4.0x10⁻⁶
0.0
0.1
Cu
rre
nt, m
A
Time, sec.
vacuum
30 Pa of H2
-200 -150 -100 -50 0
To
tal ch
arg
e, n
C
Bias voltage, V
0Pa
6Pa
15Pa
30Pa
0
0.5
1
1.5
2
2.5
(a) (b)
Figure 4. (a) Time evolution of sample current in vacuum and gas (used to characterize the
plasma formation). The appearance a slow tail in the sample current is clearly visible for an
EUV pulse in the presence of a gas. The slow tail corresponds to the plasma decay current.
The decay time is determined by slow ion motion in the plasma over the sample surface,
where ions are accelerated by the plasma sheath in front of the sample surface, before they are
incident on the sample surface. (b) Integrated CV characteristics for EUV diode. The total
charge (the integral of the current curve, see figure 6) incident on a sample covered by carbon
film vs the applied bias voltage at the different H2 pressures.
0 50 100 150 200-0.4
0.0
0.4
0.8
1.2
1.6
Carbon removal area
He
C r
em
ova
l ra
te,
nm
/Msh
ot
Negative bias voltage, V
H2
Carbon growth area-5.0x10
-5
0.0
5.0x10⁻⁵
1.0x10⁻⁴
1.5x10⁻⁴
2.0x10⁻⁴
2.5x10⁻⁴
C r
em
ova
l ra
te,
ato
m/p
ho
ton
Figure 5. The averaged thickness of removed carbon in EUV-induced H2 and He plasma vs
the applied negative bias. The chamber pressure was 3 Pa, the EUV pulse energy was 85 J
(~51012
ph/cm2pulse), and EUV dose was 10
7 pulses. Negative values in the removed carbon
thickness correspond to the growth of the carbon layer under the EUV exposure.

4. Low-pressure SWD discharge plasma
Even the simplest assessments, based on discharge current, voltage, and charge characteristics,
demonstrate that the parameters of the plasma induced by EUV radiation are close to the parameters of
a standard low-pressure discharge plasma, e.g. those used in microelectronics for the purpose of
surface etching and cleaning. Thus, the removal of carbon due to EUV-induced plasma was compared
to that of a low temperature discharge plasma to clarify the mechanisms of amorphous carbon
removal.
The experimental setup is shown in figure 6. The plasma is formed in a long quartz tube (~100 cm
long, 5.6 cm inner diameter) by means of a surface-wave discharge (SWD) at 81 MHz. RF excitation
was achieved by two circular electrodes, placed close to one end of the tube. Не or Н2 was supplied to
the tube end at a pressure 2.7 Pa. The power supplied to the discharge was between 20 to 50 W,
chosen to ensure that the plasma column extended from the electrode to the gas inlet, which served as
a counter electrode for diagnostic measurements. The samples, which also served as an electrode to
probe the plasma, were < 10x10 mm2 in size, less than 10
-3 of the counter electrode area.
Figure 6. Set up for the experiments on C cleaning in SWD plasma, which has conditions similar
to the conditions of EUV-induced plasma.
As is well known [23], the characteristic feature of the plasma column in surface-wave discharge is
that the electron temperature and, accordingly, plasma potential and ion energy are nearly constant
along the column. On the other hand, the plasma density and, accordingly, the ion flux incident on a
surface, placed in the plasma, reduces with distance from the rf antenna. Therefore, the sample was
placed on a travelling flat probe, able to move along the plasma column, thus, allowing the incident
ion flux to be varied independently of the ion energy. To control the energy of the incident ions, the
sample was biased with respect to the plasma potential. The sample was connected to a low-pass filter
to remove the current induced by the plasma power supply. The parameters of the plasma above the
H2
He
pump
81 MHz generator
SWD
plasma OES
actinometry system
z
rf compensated Langmuir probe
diagnostics unit
movable cylindrical
probe
sample
(movable)

sample surface were determined, based on measured sample voltage-current characteristics. Figure 7
shows typical VI characteristics of the sample in Не and Н2 at different distances from the rf antenna.
-100 -80 -60 -40 -20 0 20 40 60-1
0
1
2
3
4
5
H2 2,7 Pa, 50W
12 cm
18 cm
24 cm
He 2,7 Pa, 20W
12 cm
18 cm
24 cm
Cu
rre
nt
de
nsity,
mA
/cm
2
Sample bias voltage, V
Figure 7. VI characteristics for the flat sample in SWD
plasma column in H2 (solid lines) and He (dashed lines) at
the different distances, z, from the rf antenna.
To verify the consistency of the measurements of the plasma parameters using the sample as a flat
probe (and, as a result, the energy of ions on the sample surface), the experiment also used an rf-
compensated standard cylindrical probe (~10 mm long, ~0.1 mm in diameter). It should be noted that,
compared with the “small” cylindrical probe, some distortion is observed in the electron part of the VI
characteristics of the sample – the well-known electron depletion effect – that is quite expected for
large-area probes. Therefore, the sample measurements are expected to underestimate the plasma
density, which is extracted from the electron part of VI characteristics, while accurately estimating the
electron temperature, Te. At the same time, the plasma densities extracted from the ion part of VI
characteristics of the cylindrical and the sample appear to be in a good agreement, although the
definition of a “flat probe” for the sample cannot be applied exactly in this case because of the low
plasma density. As was observed, the plasma sheath over the sample (probe) is rather big and not
purely flat. Taking into account that this fact can lead only to small discrepancies, a “flat-probe”
approach was used for calculating the energy and ion flux at the sample surface.
As an example, figure 8 demonstrates the rate of carbon removal in hydrogen plasma (black symbols
and lines) and helium plasma (grey symbols and lines) versus ion flux for different bias voltages
(Ubias=0 V and Ubias=-90 V). With an estimated density of amorphous carbon film of ~1.9 g/cm3
[24],
the rate of carbon removal was calculated in atom/(cm2s) on the right scale. Open and filled symbols
in figure 8 correspond to XRF (EDS) and RS data, respectively. The trend lines are the linear fits to
the data. The slope of each line is interpreted as carbon removal probability or C yield per ion for the
respective conditions (bias voltage and gas species).
The C yield for both H2 and He plasma is shown in figure 9 as function of the negative bias applied to
the sample. The error bars on vertical axis correspond, mainly, to the uncertainties in the

measurements and calculations of the C cleaning rate. As can be is seen in figure 9, the C yield is
higher for H2 plasma than for He plasma, and this difference increases with increasing bias. It should
be noted that this plot also differs from the similar plot for EUV-induced plasma (compare with figure
5). It shows that, while the average plasma conditions are similar, the characteristics of EUV-induced
plasma are dominated by the time-varying flux and intensity of ionizing radiation, incident on the
carbon surface. A comparative analysis of the carbon removal mechanism in discharge plasma and
EUV-induced plasma allows the role of the EUV radiation to be understood.
0.0 4.0x10¹⁴
8.0x10¹⁴
1.2x10¹⁵
0
1
2
3
4
He, Ubias
= -90V
He, Ubias
= 0V
H2, U
bias= 0V
C r
em
ova
l ra
te, 1
014 a
tom
/cm
2s
Ion flux, ion/cm2s
C r
em
ova
l ra
te, n
m/m
in
H2, U
bias= -90V
0
1
2
3
4
5
6
Figure 8. Carbon cleaning rate vs the ion flux (i.e. H3+ and He
+ for hydrogen and helium
plasmas, respectively) at two (-90 V and 0 V) biases (Ubias), applied to the sample. Data
for hydrogen and helium are shown by black and grey colors, respectively. The lines are
linear fits to the data. Open and filled symbols correspond, respectively, to XRF (EDS)
and RS measurements of the carbon film thickness.

0 20 40 60 80 100 1200.0
0.2
0.4
0.6
He
C y
ield
, a
tom
/io
n
Negative bias voltage, V
H2
Figure 9. The C yield (atom/ion) versus the negative bias applied to the sample in H2
(open circles) and He (filled circles) SWD plasmas.
5. Discussion
To understand the detailed mechanism of C cleaning in an EUV-induced plasma and to characterize
the role of EUV photons in this process, the EUV-induced and discharge plasmas should be compared
in a physically clear manner. The role of EUV radiation in C-cleaning can be understood by
comparing C-cleaning measurements with and without EUV radiation, but with similar fluxes and
energy of the incident ions. For this purpose, we will try to find a relation between the ion energy, the
applied bias, and plasma parameters in both types of plasmas.
The energy spectrum of the ions incident on the sample surface from the almost collision-less plasma
sheath should have a notable peak. The peak of the ion energy spectrum and the peak width can be
estimated as ~Ubias + Up and ~2Uf, respectively, where Up and Uf are plasma and float potentials. In
reality, the peak of the ion energy spectrum is somewhat lower, and the ion energy distribution is
wider than given by this simple estimation. However, the validity of such a treatment has been
confirmed by Monte Carlo calculations of the ion energy spectrum above sample surface [25]. Model
calculations and estimates show that, because of the fast reaction: H+
2 + H2 H + H3+ (k> 10
-9 cm
3 / s
for Ti <1 eV in the plasma volume), and the given experimental conditions, (H2 pressure 2.7 Pa,
plasma density ~ 109 cm
-3) H3
+ is the dominant ionized species. [26]).
In contrast to the discharge plasma, the type of ion and ion energy spectrum cannot be easily predicted
using only qualitative considerations for the EUV-induced plasma. According to model calculations
[25, 26], H3+ is still the dominant ion, but the energy distribution of both ions (H3
+ and H2
+) is
noticeably wider than the energy distribution of the ions in the continuous SWD plasma. In addition,
the peak of ion energy distribution is a factor of two lower compared to that of the SWD. case energy
equal to 0,5 U bias.

In experiments with the discharge plasma, the carbon removal yield per ion is assessed directly from
the data (see above). For the pulsed EUV-induced plasma, the yield is calculated as the average
number of removed carbon atoms per EUV pulse divided by number of ions incident on the sample
surface per pulse:
iCi
C
CQm
ehS
N
NR
Where ρ ≈ 1.9 g/cm3, is the carbon density,
S is the area of the focus, ‹h› is a spatial average of the
thickness of the removed carbon layer, estimated from the measured C layer thickness profile inside
diaphragm. The charge is of the ion is e, mc is the mass of the carbon atom, and Qi is the total number
of ions incident on the sample surface. Qi was determined by integrating the ion current.
C cleaning yields, calculated for both discharge and EUV-induced for hydrogen (a) and helium (b)
plasmas, versus the peak ion energy, calculated as described above, are shown in figures 10a and 10b,
respectively. As was mentioned above, the error bars shown on the horizontal axis represent the
approximate width of the ion energy distributions for both plasmas, while the error bars on vertical
scale correspond to the uncertainties associated with measurements of the C yield. For helium, the
carbon yields for EUV-induced and SWD plasmas are rather similar, while for hydrogen, the two are
quite significantly different. This shows that the mechanism of carbon removal in helium plasmas is
the same for both SWD and EUV-induced plasmas, and the role of EUV radiation is insignificant. For
the hydrogen plasma, the differences show that the EUV radiation is inducing additional processes that
increase the cleaning rate beyond a simple combination of physical and chemical sputtering.
Given the inert nature of helium ions, the removal of carbon from the surface is most likely due to
physical sputtering only. Physical sputtering has been studied in the literature for virtually all elements
of the periodic table, in both neutral and ionized states. Sputtering (sputtering yield) depends on the
mass, charge, and energy, Ei, of the incident ions, as well as the surface binding energy, Es, of the
target atoms, etc. An accurate model of physical sputtering and resulting sputtering yield calculations
can be found in [27]. In this review, a semi-empirical expression for the sputtering yield for almost all
combinations of incident ion and target material was obtained, which gives a limited set of free
parameters to fit in order to achieve reasonable agreement between observed and calculated sputtering
yields Bohdansky et al. [28] Yanamura et al. [29]. The sputtering yield for light ions is given by:
5.2
21
3.01
1
)()(
i
thn
s
iE
E
B
S
E
AEY
(1)
where A, B are empirical coefficients, for which we used values obtained by Yamamura and Tawara
[29].. Eth is the threshold energy, which is taken as a free parameter. Sn() is the nuclear stopping
cross-section, which can be expressed in terms of the elastic cross-section, sn(), and can be found by
substituting a reduced ion energy, , into the analytical expression:
(2) )..(.
).ln(.)(sn
8826708135561
71824413

The values of the parameters in equation (1), obtained from ref [29] for carbon surface bombarded by
He+ and H3
+ ions, are presented in table 1.
Table 1. The parameter values for equation 1 for
He+ - C and H3 + - C sputtering according to [29].
Physical ion
sputtering
(He+)
Physical ion
sputtering (H3+)
A 0.0342 0.0407
B 0.335 0.357
Sn() 115.03sn() 49.05sn()
9.2∙10-5Ei 2.09∙10
-4Ei
Eth 3.87Es 3.79Es
As follows from expression (1), the most important parameter for the mechanism of physical
sputtering is the binding energy of the target atoms: amorphous carbon in our case. The binding energy
also determines the threshold energy, Eth. As an estimate, Es, is usually assumed to be qual to the
sublimation energy (enthalpy of vaporization ∆HC) of the target material, which, for graphite-like
surfaces, is ∆HC 7.43 eV. However, as shown [30,31] in the analysis of amorphous carbon sputtering
by light ions, experimental data are well described using a smaller value of Es 4.5 eV.
Therefore the expression (1) was fit (dashed lines in figures 10a and 10b) to the experimental data for
both SWD and EUV-induced plasmas, using the parameters from table 1, and taking Es and Eth as free
parameters. The values of Es and Eth for He+ (see table 2) were found to be even lower than those
found in ref [30,31], which can be clearly seen in figure 10a and 10b when considering the C
sputtering yield at low ion energies.
Rigorous methods, that directly model the interaction of ion beams with a surface, such as TRIM
(TRansport of Ions in Matter) were also used to understand the carbon cleaning mechanism. TRIM is a
Monte Carlo computer program that calculates the interactions of energetic ions with amorphous
targets. The threshold energy, Eth, for sputtering amorphous materials is usually found to be close to
the energy required to displace a target atom Edispl = 25 eV (see table 3). Although TRIM is not
optimum for non-monochromatic ion-energy spectra, by approximating the ion-energy spectrum by its
average value, the rate of ion sputtering of carbon films by He+ and Н3
+ ions was estimated, and used
to gain insight into the mechanism of the carbon removal. Н3+ ions were approximated by two
different methods: Н3+ ions were assumed to be a hydrogen ion with a mass of 3 amu, and, in the
second case, as a helium ion with a mass of 3 amu. The results for these two cases were found to differ
by less than 1%. As above, the density of the carbon target is taken to be 1.9 g/cm3. Three parameters:
Edispl, Ebin.lat. and Ebin.surt were varied to obtain a best fit (solid lines) to the data in figures 10a and 10b.
Ebin.lat. is the binding energy of non-surface carbon atoms in the layer, while Ebin.surt is the surface
binding energy of carbon atoms. The values of the TRIM calculation parameters are presented in table
3. As can be seen from the disagreement between the best-fit values obtained from TRIM and those
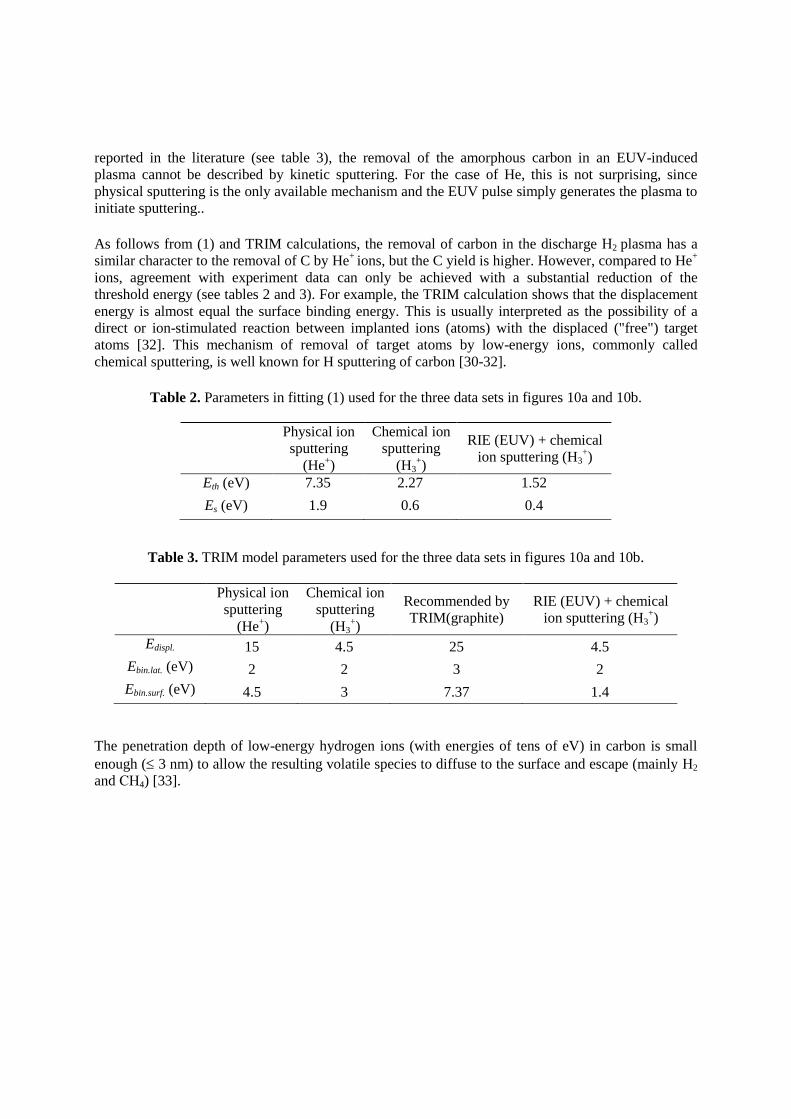
reported in the literature (see table 3), the removal of the amorphous carbon in an EUV-induced
plasma cannot be described by kinetic sputtering. For the case of He, this is not surprising, since
physical sputtering is the only available mechanism and the EUV pulse simply generates the plasma to
initiate sputtering..
As follows from (1) and TRIM calculations, the removal of carbon in the discharge Н2 plasma has a
similar character to the removal of C by He+
ions, but the C yield is higher. However, compared to He+
ions, agreement with experiment data can only be achieved with a substantial reduction of the
threshold energy (see tables 2 and 3). For example, the TRIM calculation shows that the displacement
energy is almost equal the surface binding energy. This is usually interpreted as the possibility of a
direct or ion-stimulated reaction between implanted ions (atoms) with the displaced ("free") target
atoms [32]. This mechanism of removal of target atoms by low-energy ions, commonly called
chemical sputtering, is well known for H sputtering of carbon [30-32].
Table 2. Parameters in fitting (1) used for the three data sets in figures 10a and 10b.
Physical ion
sputtering
(He+)
Chemical ion
sputtering
(H3+)
RIE (EUV) + chemical
ion sputtering (H3+)
Eth (eV) 7.35 2.27 1.52
Es (eV) 1.9 0.6 0.4
Table 3. TRIM model parameters used for the three data sets in figures 10a and 10b.
Physical ion
sputtering
(He+)
Chemical ion
sputtering
(H3+)
Recommended by
TRIM(graphite)
RIE (EUV) + chemical
ion sputtering (H3+)
Edispl. 15 4.5 25 4.5
Ebin.lat. (eV) 2 2 3 2
Ebin.surf. (eV) 4.5 3 7.37 1.4
The penetration depth of low-energy hydrogen ions (with energies of tens of eV) in carbon is small
enough ( 3 nm) to allow the resulting volatile species to diffuse to the surface and escape (mainly Н2
and СН4) [33].

10 10010
-3
10-2
10-1
100
H2 plasma
C y
ield
, a
tom
/io
n
Ion energy, eV
10 10010
-3
10-2
10-1
100
C y
ield
, a
tom
/io
n
Ion energy, eV
He plasma
(a) (b)
Figure 10. C atom yield (atom/ion) vs the mean energy of ions incident on the amorphous carbon surface in
H2 (a) and He (b) plasmas. Big dark circles with thick lines between them are experimental data for SWD
plasma while big dark squares with thick lines between them are experimental data for EUV-induced plasma.
Dotted black lines are fits according to expression (1) with parameters from table 1 and 2. Small symbols and
solid thin lines are estimates made for H3+ and He
+ ions by using TRIM calculations with parameters presented
in table 3.
Atomic hydrogen, formed in plasma due to gas dissociation, may promote carbon removal. However,
the flux of atomic hydrogen, incident on the sample surface, should be small in both the EUV-induced
and SWD plasmas. For example, the estimates of the density of H atoms in the discharge tube, from
actinometry on argon atoms [20], showed that the relative concentration of atomic hydrogen was ~0.5-
1%. According to the results of [30], and the measured ratio of hydrogen ionic and atomic fluxes,
incident on the sample is such that the rate of the reactive ion etching (RIE) involving hydrogen atoms
should not exceed the rate of chemical sputtering for SWD hydrogen plasmas.
Indeed, in the EUV-induced hydrogen plasma, the C atoms yield per ion is higher than in the SWD
plasma. To obtain agreement between experimental results and calculations using only physical
sputtering, the energy threshold has to be made very small (much smaller than any physical arguments
would allow). Additionally, it should be expected that the energy threshold is independent of the
plasma generation mechanism. The difference between the EUV-induced and the discharge plasmas in
H2 is relatively constant for all ion energies, which offers indirect evidence that this difference is due
to the EUV pulse, since the EUV photon fluence is the same for all data plotted in figures 10a and 10b.
This increase in the yield of carbon for EUV-induced plasma can be explained only by an additional
chemical mechanism, i.e. removal by the additionally formed atomic hydrogen.
This is also indirectly confirmed by TRIM calculations, in which, to describe the carbon yield in the
EUV-induced hydrogen plasma, Ebin.surt has to be reduced practically to an unrealistically low value
(see table 2). According to [30,31] this can only be due to ion-stimulated reactions between hydrogen
and carbon on the surface. This process is analogous to the process of RIE [30] with the difference that
the atomic hydrogen is formed directly on the surface layer of carbon, due to the dissociation and
ionization of adsorbed molecular hydrogen, followed by the dissociated species being "dissolved in
the surface layer." Furthermore, the EUV photons that are absorbed in the carbon generate excited
species (carbon radicals and ions). At the carbon layer surface, we estimate from reflection loss data

and secondary electron yield data [34] that up to 4% of the surface carbon atoms will be either ionized
or form a radical. We will refer to this combination of processes as reactive ion sputtering (RIS).
In a sense, the process of the formation of atomic hydrogen on the surface is similar to the process of
surface contamination and oxidation of surfaces. As is known, these processes are caused by
dissociation of hydrocarbons and water during exposure to EUV radiation [2-7]. Moreover, the
oxidation of carbon contamination under EUV radiation is even observed in ultra-high vacuum.
To estimate if surface dissociation is significant, the surface coverage of molecular hydrogen must be
estimated. The energy of desorption and residence time for hydrocarbon molecules and hydrogen
molecules are very different. For polyatomic hydrocarbon molecules, the desorption energy is much
higher than that of hydrogen. Therefore, even with large concentration differences in the volume
above the sample, the surface concentrations of hydrogen and hydrocarbons may be comparable.
These considerations allow the desorption energy of H2 from an amorphous carbon surface during
EUV illumination to be estimated.
Assuming that the increase in the carbon yield in the EUV-induced plasma is due only to the EUV-
dissociated hydrogen (i.e. almost half of the carbon is removed by RIS), the removal of one C atom is
estimated to require approximately 103 EUV photons. If it is also assumed that RIS results in CH4, the
minimum fraction of the surface occupied by dissociated H2 molecules can be estimated to be 2
10-3
. Sorption equilibrium coverage is given by:
surfacek
HsurfaceHd
22
kT
dE
ev
Hk
0
2 ][ (3)
(where [H2] ~ 7 1014
(3 Pa), k ~ 10-10
cm3/s is the rate constant corresponding to the sticking
coefficient ~1 and, in fact, is the rate constant of collisions in gas phase, 0 ~ 1013
s-1
is the so-called
"attempt frequency", that can be interpreted as the vibrational frequency of the adsorbed species in a
potential well with a depth corresponding to that of the desorption energy, Ed, so that only the fraction
of the particles having an energy higher than Ed. From eq (3), Ed ~ 380 K for surface adsorbed atomic
hydrogen (ignoring atomic hydrogen "dissolved" in the surface layer). Nevertheless this estimate
corresponds to the desorption energy of molecular hydrogen measured on different materials, both
metals [20] and dielectrics [35]. It should be noted that the density of adsorption sites is correlated
with surface defects, rather than simply the density of surface atoms. In this sense, the estimated value
of Ed characterizes not only the surface but also the depth of H2 diffusion [33]. Therefore, it reflects a
certain characteristic binding energy of H2 molecules with the surface layer of carbon, part of which is
activated by EUV radiation and the plasma. This “activated” (chemically active) carbon in principle is
able to react with H2, while atomic hydrogen is able to react with carbon whether it is activated or not.
Thus, under EUV radiation, carbon removal is not only due to physical and chemical sputtering by
ionized species, but is also due to the creation of volatile species from reactions between radicals and
between radicals and molecular species. Since radicals are not influenced by bias voltages, there is
very little atomic hydrogen incident on the surface. Instead, the radicals are created by the dissociation
of both the carbon surface, and adsorbed molecular hydrogen.

6. Conclusion
In the given work, the removal of thin amorphous carbon films from Si substrates in two types of
plasmas in presence of two types of gas: helium and hydrogen, was studied. The experimental data
clearly show that the measured carbon removal rates for SWD and EUV-induced He plasmas are
similar. He removes carbon through physical sputtering. Hydrogen was found to work differently. It
was shown that the hydrogen cleaning mechanism in the case of an EUV-induced plasma is about 5
times more efficient then in a SWD plasma. The qualitative analysis showed that the rate of cleaning
in EUV-induced Н2 plasma is greater than expected owing to reactive ion etching by atomic hydrogen,
adsorbed on the surface of carbon film. Analytical and computational models were used to show that
the data do not support physical sputtering in the case of hydrogen plasmas. Yet, a consistent carbon
binding energy and threshold energy for both SWD and EUV induced plasmas could be found once
chemical sputtering is taken into account. However, an EUV plasma was found to create a larger ratio
of atomic versus ionic hydrogen on the sample surface than in the case of SWD plasma.
Acknowledgments
This work is part of the research program “Controlling photon and plasma induced processes at EUV
optical surfaces (CP3E)” of the “Stichting voor Fundamenteel Onderzoek der Materie (FOM)” which
is financially supported by the Nederlandse Organisatie voor Wetenschappelijk Onderzoek (NWO).
The CP3E programme is cofinanced by Carl Zeiss SMT GmbH (Oberkochen), ASML (Veldhoven),
and the AgentschapNL through the Catrene EXEPT program.
References.
[1] International Technology Roadmap for Semiconductors, http://www.itrs.net
[2] Boller K J, Haelbich R P, Hogrefe H, Jark W, and Kunz C 1983 J Nucl. Instrum. Methods Phys.
Res. B 208 273-279.
[3] Meiling H, Mertens B, Stietz F, Wedowski M, Klein R, Kurt R, Louis E, and Yakshin A E 2001
Proc. of SPIE 4506 93-104.
[4] Hollenshead J and Klebanoff L 2006 J. Vac. Sci. Technol. B 24 64-82.
[5] Matsunari S, Aoki T, Murakami K, Gomei Y, Terashima S, Takase H, Tanabe M, Watanabe Y,
Kakutani Y, Niibe M, and Fukuda Y 2007 Proc. of SPIE 6517 65172X-8.
[6] Koster N, Mertens B, Jansen R, van de Runstraat A, Stietz F, Wedowski M, Meiling H, Klein R,
Gottwald A, Scholze F, Visser M, Kurt R, Zalm P, Louis E, and Yakshin A 2002 Microelectron
Eng 61-2 65-76
[7] Chen J Q, Louis E, Lee C J, Wormeester H, Kunze R, Schmidt H, Schneider D, Moors R, van
Schaik W, Lubomska M, and Bijkerk F 2009 Optics Express 17 16969-16979.
[8] Bienert M, Göhnemeier A, Natt O, Lowisch M 2009 J. Micro/Nanolith. 8-4 041509
[9] Banine V, Benschop J 2004 Proc. of SPIE 5401 1
[10] Silverman P J 2005 J. Microlith., Microfab., Microsyst. 4(1) 011006
[11] Seisyan R P 2005Techn. Phys. 50-5 535-545

[12] Motai K, Oizumi H, Miyagaki S, Nishiyama I, Izumi A, Ueno T, and Namiki A, 2008 Thin
Solid Films 516 839-843.
[13] Oizumi H, Izumi A, Motai K, Nishiyama I, and Namiki A, 2007 Jap. J App. Phys Part 2-
Letters & Express Letters 46 L633-L635.
[14] Graham S, Charles A S, Clift W M, Leonard E K, and Sasa B 2003 SPIE, 5037 460-469.
[15] Tsarfati T, Zoethout E, R W E van de Kruijs, and Bijkerk F 2009 Surf. Sci 603 2594-2599.
[16] Oizumi H, Yamanashi H, Nishiyama I, Hashimoto K, Ohsono S, Masuda A, Izumi A, and
Matsumura H, 2005 SPIE 5751 1147-1154.
[17] Nishiyama I, Oizumi H, Motai K, Izumi A, Ueno T, Akiyama H, and Namiki A 2005 AVS 23
3129-3131.
[18] Mertens B, Wolschrijn B, Jansen R, Koster N, Weiss M, Wedowski M, Klein R, Bock T, and
Thornagel R 2003 SPIE 5037 95-102.
[19] Braginsky O V, Kovalev A S, Lopaev D V, Malykhin E M, Rakhimova T V, Rakhimov A T,
Vasilieva A N, Zyryanov S M, Koshelev K N, Krivtsun V M, M van Kaampen and Glushkov
D 2012 J App. Phys. 111 093304
[20] Zyryanov S M, Kovalev A S, Lopaev D V, Malykhin E M, Rakhimov A T, Rakhimova T V,
Koshelev K N, and Krivtsun V M 2011 Plasma Phys. Rep. 37-10 881–889.
[21] Malykhin E M, Krivchenko V A, Lopaev D V, Rakhimova T V and Zyryanov S M 2011
Moscow University Physics Bulletin 66-1 54–58.
[22] Koshelev K N et al. 2006 in EUV Sources for Lithography (Ed. V Bakshi) (Bellingham,
Wash.: SPIE Press,) p. 175
[23] Moisan M, Pelletier J 1992 Microwave Excited Plasmas, Plasma Technology (Amsterdam-
London-New York-Tokyo: Elsevier)
[24] Nakayama T, Miyake A, Takase H, Terashima S, Sudo T, Watanabe Y and Fukuda Y 2009
SPIE 7271 72713
[25] Malykhin E, Lopaev D, Rakhimov A, Rakhimova T, Braginskii O, Kovalev A, Vasil’eva A
and Zyryanov S M 2011 Moscow University Physics Bulletin 66-2 184–189
[26] Astakhov D, Goedhee W J, Lopaev D, Ivanov V, Yakushev O, Krivtsun V M, Koshelev K.
and Bijkerk F 2012. 2D PIC modeling of the EUV induced hydrogen plasma and comparison
to the observed to the observed carbon etching rate. International Workshop on EUV and Soft
X-ray Sources: Dublin, Ireland (2012, oktober 08 - 2012, oktober 11)
[27] Sigmund P 1969 Phys. Rev. 184 383
[28] Bohdansky A1984 J Nucl. Instrum. Methods Phys. Res. B 2 587
[29] Yamamura Y and Tawara H 1996 At. Data Nucl. Data Tables 62 149

[30] Hopf C, A von Keudell, and Jacob W 2003 J App. Phys. 94 2373-2380
[31] Liu S, Sun J, Dai S, Stirner T, and Wang D 2010 J App. Phys 108 073302
[32] Bekrambekov L B 2008 Processes in solid under the ion ans plasma irradiation (Moscow:
M.MIPHI)
[33] Moller W 1989 J Nucl. Materials 162-164 138-150
[34] Chen, J, E Louis, J Verhoeven, R Harmsen, C J Lee, M Lubomska, M van Kampen, W van
Schaik, and F Bijkerk 2010 Applied Surface Science 257-2 354–361
[35] Kim Y C and Boudart M 1991 Langmuir 7 2999-3005