comparison of matrix frequency-doubling technology
TRANSCRIPT

RESEARCH ARTICLE
Comparison of matrix frequency-doubling
technology perimetry and standard
automated perimetry in monitoring the
development of visual field defects for
glaucoma suspect eyes
Rongrong Hu1,2, Chenkun Wang3¤, Lyne Racette2*
1 Department of Ophthalmology, First Affiliated Hospital, College of Medicine, Zhejiang University,
Hangzhou, Zhejiang, China, 2 Indiana University, Eugene and Marilyn Glick Eye Institute, Indianapolis,
Indiana, United States of America, 3 Indiana University, Fairbanks School of Public Health, Indianapolis,
Indiana, United States of America
¤ Current address: Vertex Pharmaceuticals Inc., Boston, Massachusetts, United States of America
Abstract
Background
Perimetry is indispensable for the clinical management of glaucoma suspects. Our goal is to
compare the performance of standard automated perimetry (SAP) and Matrix frequency-
doubling technology (FDT) perimetry in monitoring the development of visual field (VF)
defects in glaucoma suspect eyes.
Methods
Longitudinal data of paired SAP and FDT from 221 eyes of 155 glaucoma suspects enrolled
in the Diagnostic Innovations in Glaucoma Study or the African Descent and Glaucoma
Evaluation Study were included. All eyes had glaucomatous optic neuropathy or ocular
hypertension, but normal SAP and FDT results at baseline. The development of glaucoma-
tous VF defects was defined as the presence of a cluster of� 3 (less conservative) or� 4
(more conservative) locations confirmed on� 2 additional consecutive tests. Risk factors
for the development of VF defects were analyzed by COX proportional hazard models. After
conversion into common logarithmic units, the rates of change of global VF indices were fit-
ted with linear mixed models.
Results
FDT detected more eyes that developed VF defects than SAP using the less conservative
criterion, and no significant difference was observed using the more conservative criterion.
For those eyes detected by both SAP and FDT, FDT detected the development of VF
defects either earlier than SAP or simultaneously in most cases. Baseline structural mea-
surements were not significantly associated with an increased risk for the development of
PLOS ONE | https://doi.org/10.1371/journal.pone.0178079 May 18, 2017 1 / 14
a1111111111
a1111111111
a1111111111
a1111111111
a1111111111
OPENACCESS
Citation: Hu R, Wang C, Racette L (2017)
Comparison of matrix frequency-doubling
technology perimetry and standard automated
perimetry in monitoring the development of visual
field defects for glaucoma suspect eyes. PLoS ONE
12(5): e0178079. https://doi.org/10.1371/journal.
pone.0178079
Editor: Sanjoy Bhattacharya, Bascom Palmer Eye
Institute, UNITED STATES
Received: January 21, 2017
Accepted: May 6, 2017
Published: May 18, 2017
Copyright: © 2017 Hu et al. This is an open access
article distributed under the terms of the Creative
Commons Attribution License, which permits
unrestricted use, distribution, and reproduction in
any medium, provided the original author and
source are credited.
Data Availability Statement: All relevant data are
within the paper and its Supporting Information
files.
Funding: This research was supported by NIH
grant EY025756 (LR) and by grants from the
Zhejiang Provincial Natural Science Foundation of
China (grant no: LQ17H120003 and
LY13H120003, RH) and from the Health and
Family Planning Commission of Zhejiang Province,
China (grant no: 2016KYA089, RH).

glaucomatous VF defects on either SAP or FDT. Older age was significantly associated with
the development of VF defects on FDT but not on SAP. Both SAP and FDT detected a pro-
gressing worsening trend of pattern standard deviation over time with a similar rate of
change between these test types.
Conclusions
Matrix FDT would be useful to monitor the onset of VF defects in glaucoma suspects and
may outperform SAP in the early stage of glaucomatous VF damage.
Introduction
Despite the rapid advancement in imaging technologies, perimetry remains indispensable to
detect the presence of glaucoma or its progression in clinical practice. White-on-white stan-
dard automated perimetry (SAP), which is not selective for a particular ganglion cell type, has
been the reference standard to detect glaucomatous visual field (VF) damage. Frequency-dou-
bling technology (FDT) perimetry is an alternative type of perimetry that has received wide
interest. FDT was designed to target the magnocellular pathway [1] and recent studies show
that other types of retinal ganglion cells and cortical factors may also mediate the perception of
FDT stimuli [2–4].
Matrix FDT, the second generation of FDT, increases the spatial resolution of the test by
using a 24–2 testing pattern similar to SAP and has a fairly short (4–5 minutes) test duration
compared to SAP [5]. Unlike SAP, measurement variability does not increase with the worsen-
ing of VF sensitivity for FDT [6–11], which is advantageous to monitor the development of
glaucomatous VF defects or its progression. Cross-sectional studies have shown Matrix FDT is
comparable to or better than SAP in its discriminatory power for glaucomatous VF defects
[12–16]. Less is known, however, about the ability of Matrix FDT to detect the progressive
changes in eyes with a healthy status at baseline. The results of several recent longitudinal stud-
ies have not been conclusive in determining the performance of FDT compared to SAP in
detecting progression [17–21]. The goal of the present study is to compare Matrix FDT and
SAP in their ability to monitor the development of VF defects in a cohort of glaucoma suspect
eyes without VF abnormality at baseline.
Materials and methods
Study cohort
The study included 221 eyes of 155 subjects selected from the Diagnostic Innovations in Glau-
coma Study (DIGS) and the African Descent and Glaucoma Evaluation Study (ADAGES),
which have been described in detail elsewhere [22]. In brief, these longitudinal studies were
prospectively designed to assess structure and function in glaucoma. These multicenter studies
were approved by all appropriate Institutional Review Boards, adhered to the tenets of the dec-
laration of Helsinki for research involving human subjects, and were performed in conformity
with the Health Insurance Portability and Accountability Act.
All subjects underwent a full ophthalmic examination and had open angles, best-corrected
acuity of 20/40 or better, spherical refraction within 5.0 diopters, and cylinder correction
within 3.0 diopters. Subjects were excluded if they had a history of intraocular surgery (except
for uncomplicated cataract surgery); secondary causes of elevated intraocular pressure (e.g.,
Comparison of FDT and SAP in monitoring the development of visual field defects in glaucoma suspects
PLOS ONE | https://doi.org/10.1371/journal.pone.0178079 May 18, 2017 2 / 14
Acknowledgment is made to the donors of the
National Glaucoma Research, a program of
BrightFocus Foundation (LR), for support of this
research. This work was also supported in part by
a Shaffer grant from the Glaucoma Research
Foundation (LR), by an Indiana University—Purdue
University Indianapolis DRIVE award (LR), and by
an unrestricted grant from Research to Prevent
Blindness (LR). The DIGS and ADAGES studies
were supported by NIH Grants P30EY022589,
EY021818, EY11008, U10EY14267, EY019869;
Eyesight Foundation of Alabama; Edith C. Blum
Research Fund of the New York Glaucoma
Research Institute, New York, NY; and unrestricted
grant from Research to Prevent Blindness, New
York, New York. The funders had no role in study
design, data collection and analysis, decision to
publish, or preparation of the manuscript.
Competing interests: The authors have declared
that no competing interests exist.
iridocyclitis, trauma); other systemic or ocular diseases known to affect the VF (e.g., pituitary
lesions, demyelinating diseases, human immunodeficiency virus positive or acquired immune
deficiency syndrome, or diabetes); medications known to affect VF sensitivity; an inability to
perform VF examinations reliably or life-threatening diseases.
Inclusion criteria for the present study
All eyes included in this study were glaucoma suspects, defined as having documented glauco-
matous optic neuropathy by stereophotographs or documented ocular hypertension [22], but
without VF defects on SAP and Matrix FDT at the baseline of the present study. Glaucomatous
optic neuropathy was defined as evidence of excavation, neuroretinal rim thinning or notch-
ing, localized or diffuse retinal nerve fiber layer defect, or a between-eye asymmetry of the ver-
tical cup-disc ratio more than 0.2 [22]. Each photograph was graded by 2 certified graders
independently according to a standard protocol using standard photographs as reference in a
masked manner and in cases of disagreement, a third senior grader adjudicated [22].
All eyes therefore had normal VF that did not meet the minimum criteria for glaucomatous
VF damage on both SAP and Matrix FDT. These criteria were defined as having a glaucoma
hemifield test “outside normal limits”, or pattern standard deviation (PSD) at a P<5% level, or
a cluster of three non-edge locations worse than a P level of 5% with at least one worse than a P
level of 1% on the pattern deviation plot (PDP); and abnormality had to be confirmed on an
additional test of the same type [23]. All eyes had at least 5 visits, each of which included one
SAP and one Matrix FDT test that were taken within a 30-day window. A minimum of 3
months separated each of the consecutive visits. During the follow-up, each subject was treated
or observed without treatment at the discretion of the attending ophthalmologists. All eyes
were required to have a confocal scanning laser ophthalmoscopy image taken within three
months of the baseline VF tests. All data were collected between 2003 and 2014 and individual
information of included subjects cannot be identified.
Visual field tests: SAP and Matrix FDT
The SAP tests were taken with the 24–2 pattern and Swedish interactive thresholding algo-
rithm on the Humphrey Field Analyzer (Carl Zeiss Meditec, Dublin, California, USA). The
FDT tests were taken with the 24–2 pattern and Zippy Estimation by Sequential Testing
thresholding algorithm on the Humphrey Matrix FDT Perimeter (Carl Zeiss Meditec Inc.,
Dublin, CA) using Welch-Allyn technology. All visual fields were evaluated by the Visual Field
Assessment Center at the Department of Ophthalmology, University of California, San Diego
[24]. Only reliable visual fields, defined as� 33% fixation losses, false-negative responses and
false-positive responses, were included. Visual fields with the presence of artifacts (e.g., lid and
lens rim artifacts) were excluded.
To determine whether a given eye developed glaucomatous VF defects, two criteria were
used, which differed in their level of conservatism. Both were applied to SAP and Matrix FDT
VF tests. First, the less conservative criterion required the presence of at least 3 adjacent loca-
tions in the same hemifield on the PDP, all at a P<5% level or worse with at least one location
at a P<1% level or worse. A VF defect was identified when this cluster (using the same defini-
tion) was confirmed on at least two additional consecutive tests. Three tests were therefore
required to identify a visual field defect. The more conservative criterion was based on Liu et al
[20]. It required the presence of at least 4 adjacent locations in the same hemifield on the PDP,
all at a P<5% level or worse with at least one location at a P<1% level or worse. This cluster
(using the same definition) had to be confirmed by at least two additional consecutive tests.
Comparison of FDT and SAP in monitoring the development of visual field defects in glaucoma suspects
PLOS ONE | https://doi.org/10.1371/journal.pone.0178079 May 18, 2017 3 / 14

Baseline structural measures
Baseline structural measurements were taken by the confocal scanning laser ophthalmoscopy
with the Heidelberg Retina Tomograph II (HRT II, software version 3.1, Heidelberg Engineer-
ing, Heidelberg, Germany). The HRT software acquires three individual images for each eye
during the initial scanning, from which it automatically computes a mean topography image.
An experienced technician outlined the optic disc margin on the mean topography image
while viewing simultaneous stereophotographs of the optic disc [22]. Images with mean pixel
height standard deviation more than 50 μm were excluded [25].
Statistical analyses
The McNemar test was used to compare the proportion of eyes that developed glaucomatous
VF defects on FDT and SAP. The agreement between FDT and SAP in identifying eyes that
developed VF defects was calculated with the κ statistics. Agreement can be poor (κvalue < 0.0), slight (0.01 to 0.20), fair (0.21 to 0.40), moderate (0.41 to 0.60), substantial (0.61
to 0.80), or almost perfect (0.81 to 1.0) [26]. Kaplan-Meier curves were used to analyze the dif-
ference between test types in the time of detection of glaucomatous VF defects. The survival
probabilities on FDT and SAP were compared using Breslow tests.
Risk factors associated with the development of glaucomatous VF defects were analyzed by
COX proportional hazard models. Separate COX proportional hazard models were fitted for
FDT and SAP using the results based on the less conservative criterion. In eyes that developed
VF defects, the time to the appearance of the defect was used. For eyes that did not develop VF
defects, time to the last follow-up was used (censored observations). Rim area (RA), average
retinal nerve fiber layer (RNFL) thickness, and cup-disc area ratio measured by HRT, and age
at baseline were considered as independent variables in each model. The correlation between
two eyes of the same subject was accounted by the maximum partial likelihood estimates
under an independent working assumption using a robust sandwich covariance matrix esti-
mate [27].
Longitudinal global VF indices [mean deviation (MD) and PSD] were fitted by linear
mixed models. In order to have a common scale for the modeling, we converted the results
obtained from the perimeters from decibels (dB) to log10 units using the approach outlined by
Sun et al [28, 29]. For SAP, Weber contrast is used, which is the luminance increment divided
by the mean luminance; for FDT, this is equivalent to Michelson contrast [28, 30]. One dB
corresponds to 0.1 log10 unit change for SAP and to 0.05 log10 unit change for FDT [11, 28, 29,
31]. For SAP, the machine MD and PSD dB values can therefore be divided by 10 to obtain the
log10 values. For FDT, the machine MD and PSD dB values can be divided by 20 to obtain the
log10 values.
For the linear mixed models, follow-up time, test type, and their interaction were consid-
ered as the fixed effects. Random intercepts and slopes were included at the subject level. Hier-
archical random intercepts were included at eye levels with two eyes nested within each
subject. The Wald test was used to compare the main effect of test types and the rates of change
of MD and PSD between FDT and SAP (interaction effect). SAP was considered as the refer-
ence type. A simulation study (repetition = 500) was conducted to evaluate the sample size
requested for the linear mixed modeling. Assuming a balanced study design and all longitudi-
nal measurements collected at year 0, 1, 2, 3, and 4, datasets were simulated based on the esti-
mates of fixed effects, random intercept variance at both subject and eye levels, random slope
variance, covariance between random intercept and random slope, and residual variance for
MD and PSD. At an alpha of 0.05, the power analysis indicated that 100 subjects attained an
Comparison of FDT and SAP in monitoring the development of visual field defects in glaucoma suspects
PLOS ONE | https://doi.org/10.1371/journal.pone.0178079 May 18, 2017 4 / 14

empirical power of 99.8% for a rate of change of -0.01 log10 unit per year for MD, and an
empirical power of 99.6% for a rate of change of 0.005 log10 unit per year for PSD.
All analyses were carried out in R (https://www.r-project.org) and SAS (version 9.4; SAS
Institute, Inc., Cary, NC, USA). The R package visualFields [32] was used to process the VF
data. P < 0.05 was considered statistically significant in all analyses.
Results
At baseline, the mean age of the 155 glaucoma suspect subjects (221 eyes) included in the pres-
ent study was 57.2 ± 8.9 years. One hundred and two subjects (65.8%) were female. Of the 221
eyes included in the study, 100 eyes (45.2%) had glaucomatous optic neuropathy and 121
(54.8%) eyes had ocular hypertension. Of the 89 fellow eyes that have not been included, 85
eyes had repeatable VF damage [23] on either or both test types at baseline, and 4 eyes were
excluded due to unreliable VF results. The mean follow-up time of VF tests in each eye was
5.1 ± 1.8 years, with a median of 6 visits (ranging from 5 to 13 visits). The mean interval
between visits in each eye was 11.0 ± 2.8 months. Table 1 shows the median, and 1st and 3rd
quartiles of MD and PSD for SAP and FDT at baseline.
Using the less conservative criterion, 11 (5.0%) and 21 (9.5%) eyes developed glaucomatous
VF defects on SAP and FDT, respectively. Using the more conservative criterion, 10 (4.5%)
and 13 (5.9%) eyes developed VF defects on SAP and FDT, respectively. FDT identified signifi-
cantly more eyes as developing VF defects than SAP (P = 0.02) based on the less conservative
criterion. No significant difference was observed between SAP and FDT using the more con-
servative criterion (P = 0.51). Likewise, the survival probability of FDT for identifying the
development of VF defects was significantly worse than SAP using the less conservative crite-
rion (P = 0.04, Fig 1), and no significant difference was observed with the more conservative
criterion (P = 0.31).
Using the less conservative criterion, 8 eyes (3.6%) developed VF defects on both SAP and
FDT, among which 1 eye was detected by SAP 11.5 months earlier than FDT, 5 eyes were
detected by FDT 10.4 to 29.5 months earlier than SAP, and 2 eyes were detected by SAP and
FDT at the same visit. Using the more conservative criterion, 7 eyes (3.2%) developed VF
defects on both SAP and FDT, among which 1 eye was detected by SAP 10.5 months earlier
than FDT, 5 eyes were detected by FDT 10.4 to 29.5 months earlier than SAP, and 1 eye was
detected by SAP and FDT at the same visit. The agreement for detection of VF defects was
moderate between SAP and FDT (κ = 0.47, ranging from 0.22 to 0.66 using the less conserva-
tive criterion, Fig 2A; κ = 0.59, ranging from 0.29 to 0.82 using the more conservative criterion,
Fig 2B).
Fig 3 shows a case of a patient with ocular hypertension followed by SAP and Matrix FDT
in the present study. Using the less conservative criterion, FDT detected the development of a
VF defect in the supero-nasal area, which was confirmed in November 2006. A progressing
Table 1. Global indices of visual field at baseline.
Median First Quartile Third Quartile
SAP MD, dB -0.09 -0.87 0.79
SAP PSD, dB 1.46 1.30 1.65
FDT MD, dB -0.29 -2.69 2.02
FDT PSD, dB 2.67 2.33 3.04
SAP, standard automated perimetry; FDT, frequency-doubling technology perimetry; MD, mean deviation;
PSD, pattern standard deviation; dB, decibel.
https://doi.org/10.1371/journal.pone.0178079.t001
Comparison of FDT and SAP in monitoring the development of visual field defects in glaucoma suspects
PLOS ONE | https://doi.org/10.1371/journal.pone.0178079 May 18, 2017 5 / 14

Fig 1. The Kaplan-Meier survival analysis for the development of glaucomatous VF defects. The
Kaplan Meier survival curves show the survival probability of SAP and FDT for detection of VF development
using the less conservative criterion. The hash marks represent the censored follow-ups for eyes that did not
develop VF defects in the present study.
https://doi.org/10.1371/journal.pone.0178079.g001
Fig 2. The numbers of eyes that developed glaucomatous VF defects. The Venn diagrams show the number of eyes with the
development of glaucomatous VF defects detected by Matrix FDT and SAP using the less conservative criterion (A) and more
conservative criterion (B).
https://doi.org/10.1371/journal.pone.0178079.g002
Comparison of FDT and SAP in monitoring the development of visual field defects in glaucoma suspects
PLOS ONE | https://doi.org/10.1371/journal.pone.0178079 May 18, 2017 6 / 14
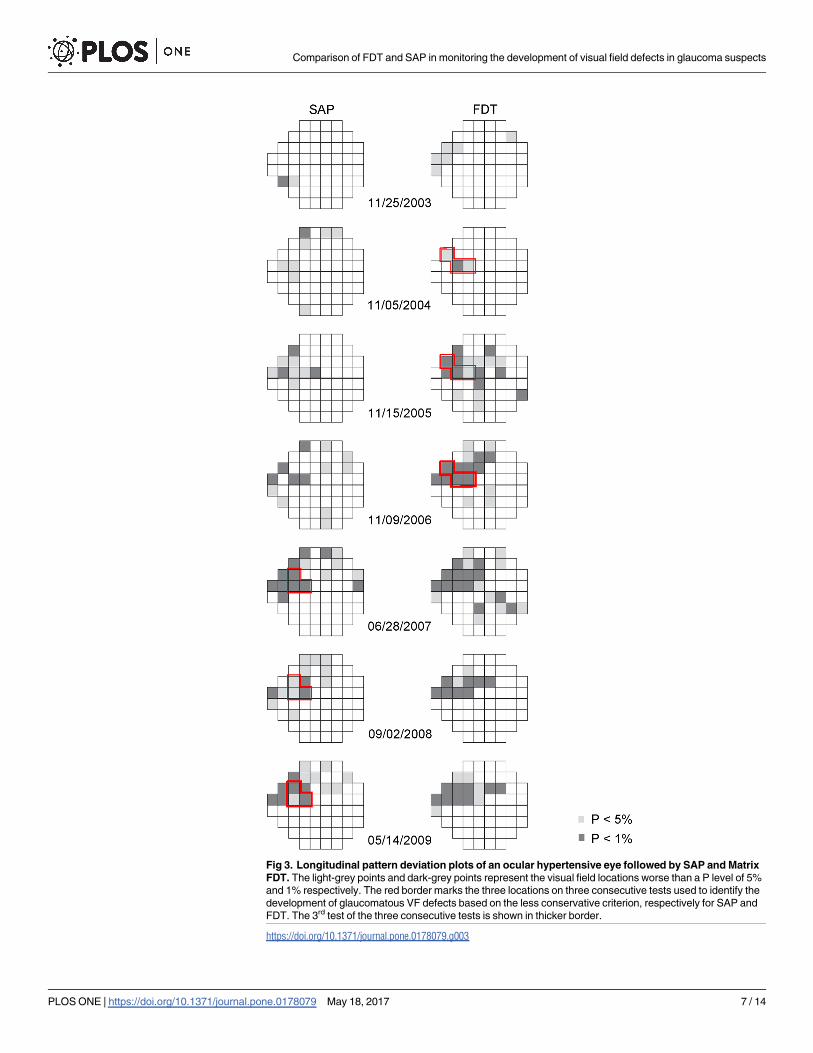
Fig 3. Longitudinal pattern deviation plots of an ocular hypertensive eye followed by SAP and Matrix
FDT. The light-grey points and dark-grey points represent the visual field locations worse than a P level of 5%
and 1% respectively. The red border marks the three locations on three consecutive tests used to identify the
development of glaucomatous VF defects based on the less conservative criterion, respectively for SAP and
FDT. The 3rd test of the three consecutive tests is shown in thicker border.
https://doi.org/10.1371/journal.pone.0178079.g003
Comparison of FDT and SAP in monitoring the development of visual field defects in glaucoma suspects
PLOS ONE | https://doi.org/10.1371/journal.pone.0178079 May 18, 2017 7 / 14
trend in the number and severity of abnormal locations was also observed. In contrast, more
variability was observed with SAP results and based on the less conservative criterion, the con-
firmable VF defect in the same area was established until the end of the follow-up period.
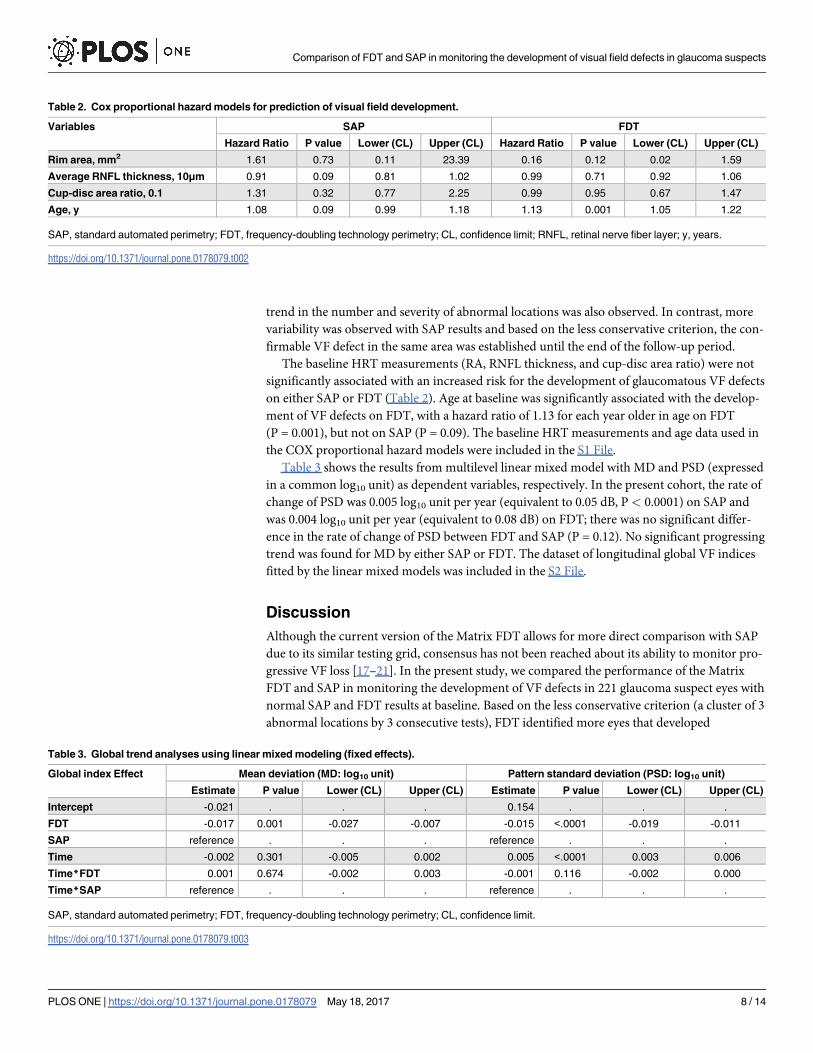
The baseline HRT measurements (RA, RNFL thickness, and cup-disc area ratio) were not
significantly associated with an increased risk for the development of glaucomatous VF defects
on either SAP or FDT (Table 2). Age at baseline was significantly associated with the develop-
ment of VF defects on FDT, with a hazard ratio of 1.13 for each year older in age on FDT
(P = 0.001), but not on SAP (P = 0.09). The baseline HRT measurements and age data used in
the COX proportional hazard models were included in the S1 File.
Table 3 shows the results from multilevel linear mixed model with MD and PSD (expressed
in a common log10 unit) as dependent variables, respectively. In the present cohort, the rate of
change of PSD was 0.005 log10 unit per year (equivalent to 0.05 dB, P < 0.0001) on SAP and
was 0.004 log10 unit per year (equivalent to 0.08 dB) on FDT; there was no significant differ-
ence in the rate of change of PSD between FDT and SAP (P = 0.12). No significant progressing
trend was found for MD by either SAP or FDT. The dataset of longitudinal global VF indices
fitted by the linear mixed models was included in the S2 File.
Discussion
Although the current version of the Matrix FDT allows for more direct comparison with SAP
due to its similar testing grid, consensus has not been reached about its ability to monitor pro-
gressive VF loss [17–21]. In the present study, we compared the performance of the Matrix
FDT and SAP in monitoring the development of VF defects in 221 glaucoma suspect eyes with
normal SAP and FDT results at baseline. Based on the less conservative criterion (a cluster of 3
abnormal locations by 3 consecutive tests), FDT identified more eyes that developed
Table 2. Cox proportional hazard models for prediction of visual field development.
Variables SAP FDT
Hazard Ratio P value Lower (CL) Upper (CL) Hazard Ratio P value Lower (CL) Upper (CL)
Rim area, mm2 1.61 0.73 0.11 23.39 0.16 0.12 0.02 1.59
Average RNFL thickness, 10μm 0.91 0.09 0.81 1.02 0.99 0.71 0.92 1.06
Cup-disc area ratio, 0.1 1.31 0.32 0.77 2.25 0.99 0.95 0.67 1.47
Age, y 1.08 0.09 0.99 1.18 1.13 0.001 1.05 1.22
SAP, standard automated perimetry; FDT, frequency-doubling technology perimetry; CL, confidence limit; RNFL, retinal nerve fiber layer; y, years.
https://doi.org/10.1371/journal.pone.0178079.t002
Table 3. Global trend analyses using linear mixed modeling (fixed effects).
Global index Effect Mean deviation (MD: log10 unit) Pattern standard deviation (PSD: log10 unit)
Estimate P value Lower (CL) Upper (CL) Estimate P value Lower (CL) Upper (CL)
Intercept -0.021 . . . 0.154 . . .
FDT -0.017 0.001 -0.027 -0.007 -0.015 <.0001 -0.019 -0.011
SAP reference . . . reference . . .
Time -0.002 0.301 -0.005 0.002 0.005 <.0001 0.003 0.006
Time*FDT 0.001 0.674 -0.002 0.003 -0.001 0.116 -0.002 0.000
Time*SAP reference . . . reference . . .
SAP, standard automated perimetry; FDT, frequency-doubling technology perimetry; CL, confidence limit.
https://doi.org/10.1371/journal.pone.0178079.t003
Comparison of FDT and SAP in monitoring the development of visual field defects in glaucoma suspects
PLOS ONE | https://doi.org/10.1371/journal.pone.0178079 May 18, 2017 8 / 14

glaucomatous VF defects compared to SAP. During the follow-up period, more eyes pro-
gressed on FDT compared to SAP using the survival analysis. For those eyes detected by both
test types, FDT detected the development of VF defects either earlier than or simultaneously
with SAP in most cases. The rate of change of PSD was similar for FDT and SAP. Our results
suggest that the Matrix FDT may be useful to monitor glaucomatous VF damage in early
disease.
We previously showed that FDT does not have significant benefits over SAP in monitoring
glaucoma progression using pointwise linear regression analysis in a cohort of patients with
primary open-angle glaucoma (median SAP MD of -2.25 dB at baseline) [21]. Likewise, using
permutation of pointwise linear regression, Redmond et al [18] did not find evidence that
FDT was more sensitive than SAP to identify VF progression in a cohort of patients diagnosed
with glaucoma (mean SAP MD of -2.6 dB at baseline). FDT may, however, be more sensitive
to VF changes in early disease, such as glaucoma suspect eyes with glaucomatous optic neurop-
athy or ocular hypertension (pre-perimetric glaucoma). Meira-Freitas et al [31], for example,
showed that the rate of FDT PSD change was predictive of the development of SAP VF defects
in glaucoma suspect eyes. The rate of SAP PSD change, however, was not predictive of the
development of FDT defects in their study. Another study by Liu et al [20] showed that
approximately 70% of glaucoma suspect eyes that developed VF defects were detected by FDT
either prior to, or simultaneously with SAP (mean SAP MD of -1.27 dB at baseline). Hence,
FDT may be of its highest value to monitor glaucomatous VF progression in the relatively
early stages of the disease rather than in the later stages.
In the present study, FDT identified more eyes that developed glaucomatous VF defects
than SAP using the less conservative criterion (a cluster of 3 abnormal locations by 3 consecu-
tive tests), which was an event-based analysis. The rate of change on PSD was, however, similar
for both FDT and SAP using the trend-based linear mixed modeling. Haymes et al [33]
reported a similar finding using the first generation of FDT. They showed that FDT detected
more progressing patients than SAP using glaucoma change probability analysis (event analy-
sis), but that SAP detected more progressing patients than FDT using linear regression in the
same study cohort.
Although there is no universally accepted method to identify VF progression, FDT may be
better-suited for event analysis methods rather than trend analysis methods such as linear
regression. Compared to SAP, the Matrix FDT has fewer discrete levels (0, 2, 3, 6, 7, 11, 12, 13,
18, 20, 23, 27, 32, 34, and 38 dB, while the step size of SAP is 1 dB). An underlying assumption
of linear regression is that there is a trend of gradual, linear deterioration of VF sensitivity.
FDT, with its larger steps, may therefore be at a disadvantage when compared to SAP to detect
gradual changes in visual function. In comparison, the fewer discrete levels of FDT may have a
smaller impact on its ability to identify change when event analysis is used. In addition, its
more consistent test-retest variability [6–11] may give FDT an advantage to detect progression
compared to SAP when event analysis is used.
Previous studies have shown that baseline HRT measurements can be used to predict the
development of glaucomatous VF defects in suspect eyes defined as having ocular hyperten-
sion [34, 35]. In the present study, no baseline HRT measurement was significantly associated
with an increased risk for the development of VF defects on either SAP or FDT. The disparity
among the results of studies may be related to several factors, such as length of follow-up,
inclusion criteria used to select study participants, definition of study end points, and so on.
For example, the length of follow-up was shorter in the present study compared to previous
studies [34, 35]. It is likely that more eyes would develop VF defects as the follow-up period
increases and significant association between baseline HRT measurements and outcomes of
VF defects would become apparent. Also we required the defects to be confirmed on two
Comparison of FDT and SAP in monitoring the development of visual field defects in glaucoma suspects
PLOS ONE | https://doi.org/10.1371/journal.pone.0178079 May 18, 2017 9 / 14
additional tests to maximize specificity, while previous studies [34, 35] only required defects to
be confirmed on one additional test, which may lead to differences in the portions of eyes that
developed VF defects. Our results are consistent with the notion that structural and functional
measurements may each provide unique information for glaucoma [36–39]. Results from large
clinical investigations [40–42] have identified older age as an independent risk factor for the
development of glaucoma. For the present study cohort, older age was significantly associated
with the development of glaucomatous VF defects on FDT, but not on SAP. Our findings
affirm the usefulness of FDT in detecting the development of glaucomatous VF defects in sus-
pect eyes. Higher baseline intraocular pressure (IOP) has been considered as another risk fac-
tor for the development of glaucoma [40–42]. Since a portion of our participants had begun
IOP-lowering treatments at baseline based on the discretion of the attending ophthalmologists,
we didn’t include baseline IOP for the analysis of risk factors.
Early detection of the onset of VF damage and its progression is paramount for the clinical
management of glaucoma suspects. An unavoidable drawback of all studies investigating glau-
coma progression, however, is the lack of a reference standard as no consensus has been
reached to define progression [38]. For this reason, we used two levels of criteria to identify the
development of VF defects and applied them to both SAP and FDT. Although these criteria
may be arbitrary, the presence of three or four adjacent locations in the same hemifield on
three consecutive tests would be enough to raise concern from a clinical perspective. While
these criteria do not represent a reference standard, they have been used in previous studies
[20, 43] and are clinically relevant. In the present study, FDT identified more eyes as develop-
ing VF defects compared to SAP using the less conservative criterion, while no significant dif-
ference between FDT and SAP was found using the more conservative criterion. It is possible
that the more conservative criterion was not sensitive enough to allow the detection of early
VF loss. Because of the lack of a gold standard and of a large enough sample of control eyes
with longitudinal follow-up beyond the tests included in this study, we did not directly assess
sensitivity and specificity in this study. Another limitation of the present study is that the
development of glaucomatous VF defects was analyzed only based on the local VF defects and
diffuse changes have not been considered, which is also a part of early glaucomatous VF dam-
age [44].
While the results of both SAP and FDT are expressed in the dB units, their results cannot
be directly compared because each test uses different stimuli and different measurement scales
[11, 28–31]. In our study, for the linear mixed modeling, we expressed SAP and FDT data in a
comparable scale by converting them into the common log10 values with the linear relation-
ship. A recent study by Fredette et al [11] has also shown a linear 2:1 relationship exists
between SAP and FDT data down to sensitivity values of 25 dB with SAP and 13 dB with FDT.
Beyond this range, a nonlinear relationship exists between SAP and FDT, and an alternative
conversion formula would be needed [11]. As the present study included glaucoma suspects
with normal baseline VF results and only a small portion of them developed early glaucoma-
tous VF defects, only a low percentage of our data came near the nonlinear range and we did
not do the nonlinear conversion for those data. Specifically, 1,463 SAP and 1,463 FDT tests (52
locations � 1,463 VF tests = 76,076 locations) were available for analysis in the present study;
5.04% of SAP locations had sensitivity values below 25 dB (3,831 locations) and 1.97% of FDT
locations (1,499 locations) had sensitivity values below 13 dB. Our conversion may also be
defective as the Matrix FDT only provides 15 possible sensitivity values that are unevenly
spaced, while the step size of SAP is 1 dB. In addition, several other factors may also complicate
the comparison between SAP and FDT, such as different normative databases with different
sample sizes and inclusion/exclusion criteria, different computation of VF indices, and so on.
Comparison of FDT and SAP in monitoring the development of visual field defects in glaucoma suspects
PLOS ONE | https://doi.org/10.1371/journal.pone.0178079 May 18, 2017 10 / 14

Further studies would be needed to determine the accurate correspondence of different mea-
surements used on SAP and FDT.
In conclusion, our results demonstrate that the Matrix FDT is useful to monitor the onset
of VF defects in glaucoma suspects during follow-up. Cross-sectional evidence has shown that
glaucomatous VF defects detected by FDT when SAP is within normal range can be associated
with RNFL thinning [45]. Further prospective studies to clarify its correlation with progressive
structural change and to evaluate clinical decision-making based on the results of this test are
needed.
Supporting information
S1 File. Baseline HRT measurements and age data used in the COX proportional hazard
models.
(CSV)
S2 File. Longitudinal global VF indices fitted by the linear mixed models.
(CSV)
Author Contributions
Conceptualization: RH LR.
Data curation: RH CW LR.
Formal analysis: RH CW LR.
Funding acquisition: RH LR.
Investigation: RH CW LR.
Methodology: RH CW LR.
Project administration: LR.
Resources: RH CW LR.
Software: RH CW LR.
Supervision: LR.
Validation: RH CW LR.
Visualization: RH CW LR.
Writing – original draft: RH LR.
Writing – review & editing: RH CW LR.
References1. Maddess T, Hemmi JM, James AC. Evidence for spatial aliasing effects in the Y-like cells of the magno-
cellular visual pathway. Vision Res. 1998; 38(12):1843–59. PMID: 9797962.
2. Swanson WH, Sun H, Lee BB, Cao D. Responses of primate retinal ganglion cells to perimetric stimuli.
Invest Ophthalmol Vis Sci. 2011; 52(2):764–71. https://doi.org/10.1167/iovs.10-6158 PMID: 20881286.
3. White AJ, Sun H, Swanson WH, Lee BB. An examination of physiological mechanisms underlying the
frequency-doubling illusion. Invest Ophthalmol Vis Sci. 2002; 43(11):3590–9. PMID: 12407172.
4. Zeppieri M, Demirel S, Kent K, Johnson CA. Perceived spatial frequency of sinusoidal gratings. Optom
Vis Sci. 2008; 85(5):318–29. PMID: 18451736.
Comparison of FDT and SAP in monitoring the development of visual field defects in glaucoma suspects
PLOS ONE | https://doi.org/10.1371/journal.pone.0178079 May 18, 2017 11 / 14

5. Nouri-Mahdavi K. Selecting visual field tests and assessing visual field deterioration in glaucoma. Can J
Ophthalmol. 2014; 49(6):497–505. PMID: 25433738.
6. Chauhan BC, Johnson CA. Test-retest variability of frequency-doubling perimetry and conventional
perimetry in glaucoma patients and normal subjects. Invest Ophthalmol Vis Sci. 1999; 40(3):648–56.
PMID: 10067968.
7. Spry PG, Johnson CA, McKendrick AM, Turpin A. Variability components of standard automated peri-
metry and frequency-doubling technology perimetry. Invest Ophthalmol Vis Sci. 2001; 42(6):1404–10.
PMID: 11328758.
8. Spry PG, Johnson CA. Within-test variability of frequency-doubling perimetry using a 24–2 test pattern.
J Glaucoma. 2002; 11(4):315–20. PMID: 12169968.
9. Artes PH, Hutchison DM, Nicolela MT, LeBlanc RP, Chauhan BC. Threshold and variability properties
of matrix frequency-doubling technology and standard automated perimetry in glaucoma. Invest
Ophthalmol Vis Sci. 2005; 46(7):2451–7. https://doi.org/10.1167/iovs.05-0135 PMID: 15980235.
10. Wall M, Woodward KR, Doyle CK, Artes PH. Repeatability of automated perimetry: a comparison
between standard automated perimetry with stimulus size III and V, matrix, and motion perimetry. Invest
Ophthalmol Vis Sci. 2009; 50(2):974–9. https://doi.org/10.1167/iovs.08-1789 PMID: 18952921.
11. Fredette MJ, Giguere A, Anderson DR, Budenz DL, McSoley J. Comparison of Matrix with Humphrey
Field Analyzer II with SITA. Optom Vis Sci. 2015; 92(5):527–36. https://doi.org/10.1097/OPX.
0000000000000583 PMID: 25875683.
12. Patel A, Wollstein G, Ishikawa H, Schuman JS. Comparison of visual field defects using matrix perime-
try and standard achromatic perimetry. Ophthalmology. 2007; 114(3):480–7. https://doi.org/10.1016/j.
ophtha.2006.08.009 PMID: 17123623.
13. Liu S, Lam S, Weinreb RN, Ye C, Cheung CY, Lai G, et al. Comparison of standard automated perime-
try, frequency-doubling technology perimetry, and short-wavelength automated perimetry for detection
of glaucoma. Invest Ophthalmol Vis Sci. 2011; 52(10):7325–31. https://doi.org/10.1167/iovs.11-7795
PMID: 21810975.
14. Leeprechanon N, Giangiacomo A, Fontana H, Hoffman D, Caprioli J. Frequency-doubling perimetry:
comparison with standard automated perimetry to detect glaucoma. Am J Ophthalmol. 2007; 143
(2):263–71. https://doi.org/10.1016/j.ajo.2006.10.033 PMID: 17178091.
15. Burgansky-Eliash Z, Wollstein G, Patel A, Bilonick RA, Ishikawa H, Kagemann L, et al. Glaucoma
detection with matrix and standard achromatic perimetry. Br J Ophthalmol. 2007; 91(7):933–8. https://
doi.org/10.1136/bjo.2006.110437 PMID: 17215267.
16. Spry PG, Hussin HM, Sparrow JM. Clinical evaluation of frequency doubling technology perimetry using
the Humphrey Matrix 24–2 threshold strategy. Br J Ophthalmol. 2005; 89(8):1031–5. https://doi.org/10.
1136/bjo.2004.057778 PMID: 16024860.
17. Xin D, Greenstein VC, Ritch R, Liebmann JM, De Moraes CG, Hood DC. A comparison of functional
and structural measures for identifying progression of glaucoma. Invest Ophthalmol Vis Sci. 2011; 52
(1):519–26. https://doi.org/10.1167/iovs.10-5174 PMID: 20847115.
18. Redmond T, O’Leary N, Hutchison DM, Nicolela MT, Artes PH, Chauhan BC. Visual field progression
with frequency-doubling matrix perimetry and standard automated perimetry in patients with glaucoma
and in healthy controls. JAMA Ophthalmol. 2013; 131(12):1565–72. https://doi.org/10.1001/
jamaophthalmol.2013.4382 PMID: 24177807.
19. Liu S, Yu M, Weinreb RN, Lai G, Lam DS, Leung CK. Frequency doubling technology perimetry for
detection of visual field progression in glaucoma: a pointwise linear regression analysis. Invest Ophthal-
mol Vis Sci. 2014; 55(5):2862–9. https://doi.org/10.1167/iovs.13-13225 PMID: 24595388.
20. Liu S, Yu M, Weinreb RN, Lai G, Lam DS, Leung CK. Frequency-doubling technology perimetry for
detection of the development of visual field defects in glaucoma suspect eyes: a prospective study.
JAMA Ophthalmol. 2014; 132(1):77–83. https://doi.org/10.1001/jamaophthalmol.2013.5511 PMID:
24177945.
21. Hu R, Wang C, Gu Y, Racette L. Comparison of Standard Automated Perimetry, Short-Wavelength
Automated Perimetry, and Frequency-Doubling Technology Perimetry to Monitor Glaucoma Progres-
sion. Medicine (Baltimore). 2016; 95(7):e2618.
22. Sample PA, Girkin CA, Zangwill LM, Jain S, Racette L, Becerra LM, et al. The African Descent and
Glaucoma Evaluation Study (ADAGES): design and baseline data. Arch Ophthalmol. 2009; 127
(9):1136–45. https://doi.org/10.1001/archophthalmol.2009.187 PMID: 19752422.
23. Anderson DR, Patella VM. Automated Static Perimetry. 2nd ed. St. Louis, Missouri: Mosby; 1999.
24. Racette L, Liebmann JM, Girkin CA, Zangwill LM, Jain S, Becerra LM, et al. African Descent and Glau-
coma Evaluation Study (ADAGES): III. Ancestry differences in visual function in healthy eyes. Arch
Ophthalmol. 2010; 128(5):551–9. https://doi.org/10.1001/archophthalmol.2010.58 PMID: 20457975.
Comparison of FDT and SAP in monitoring the development of visual field defects in glaucoma suspects
PLOS ONE | https://doi.org/10.1371/journal.pone.0178079 May 18, 2017 12 / 14

25. Fingeret M, Flanagan J, Liebmann JM. The Essential HRT Primer. Oakland, CA: Jocoto Advertising;
2005.
26. Landis JR, Koch GG. The measurement of observer agreement for categorical data. Biometrics. 1977;
33(1):159–74. PMID: 843571.
27. Lee EW, Wei LJ, Amato D. Cox-type regression analysis for large numbers of small groups of correlated
failure time observations. Netherlands: Kluwer Academic; 1992.
28. Sun H, Dul MW, Swanson WH. Linearity can account for the similarity among conventional, frequency-
doubling, and gabor-based perimetric tests in the glaucomatous macula. Optom Vis Sci. 2006; 83
(7):455–65. https://doi.org/10.1097/01.opx.0000225103.18087.5d PMID: 16840860.
29. Anderson AJ, Johnson CA, Werner JS. Measuring visual function in age-related macular degeneration
with frequency-doubling (matrix) perimetry. Optom Vis Sci. 2011; 88(7):806–15. PMID: 21478785.
30. Peli E. In search of a contrast metric: matching the perceived contrast of Gabor patches at different
phases and bandwidths. Vision Res. 1997; 37(23):3217–24. PMID: 9425539.
31. Anderson AJ, Johnson CA, Fingeret M, Keltner JL, Spry PG, Wall M, et al. Characteristics of the norma-
tive database for the Humphrey matrix perimeter. Invest Ophthalmol Vis Sci. 2005; 46(4):1540–8.
https://doi.org/10.1167/iovs.04-0968 PMID: 15790927.
32. Marin-Franch I, Swanson WH. The visualFields package: a tool for analysis and visualization of visual
fields. J Vis. 2013; 13(4). https://doi.org/10.1167/13.4.10 PMID: 23492926.
33. Haymes SA, Hutchison DM, McCormick TA, Varma DK, Nicolela MT, LeBlanc RP, et al. Glaucomatous
visual field progression with frequency-doubling technology and standard automated perimetry in a lon-
gitudinal prospective study. Invest Ophthalmol Vis Sci. 2005; 46(2):547–54. https://doi.org/10.1167/
iovs.04-0973 PMID: 15671281.
34. Zangwill LM, Weinreb RN, Beiser JA, Berry CC, Cioffi GA, Coleman AL, et al. Baseline topographic
optic disc measurements are associated with the development of primary open-angle glaucoma: the
Confocal Scanning Laser Ophthalmoscopy Ancillary Study to the Ocular Hypertension Treatment
Study. Arch Ophthalmol. 2005; 123(9):1188–97. https://doi.org/10.1001/archopht.123.9.1188 PMID:
16157798.
35. Weinreb RN, Zangwill LM, Jain S, Becerra LM, Dirkes K, Piltz-Seymour JR, et al. Predicting the onset of
glaucoma: the confocal scanning laser ophthalmoscopy ancillary study to theOcular Hypertension
Treatment Study. Ophthalmology. 2010; 117(9):1674–83. https://doi.org/10.1016/j.ophtha.2010.03.044
PMID: 20633931.
36. Miglior S, Zeyen T, Pfeiffer N, Cunha-Vaz J, Torri V, Adamsons I, et al. Results of the European Glau-
coma Prevention Study. Ophthalmology. 2005; 112(3):366–75. https://doi.org/10.1016/j.ophtha.2004.
11.030 PMID: 15745761.
37. Keltner JL, Johnson CA, Anderson DR, Levine RA, Fan J, Cello KE, et al. The association between
glaucomatous visual fields and optic nerve head features in the Ocular Hypertension Treatment Study.
Ophthalmology. 2006; 113(9):1603–12. https://doi.org/10.1016/j.ophtha.2006.05.061 PMID:
16949445.
38. Malik R, Swanson WH, Garway-Heath DF. ’Structure-function relationship’ in glaucoma: past thinking
and current concepts. Clin Experiment Ophthalmol. 2012; 40(4):369–80. https://doi.org/10.1111/j.1442-
9071.2012.02770.x PMID: 22339936.
39. Hu R, Marin-Franch I, Racette L. Prediction Accuracy of a Novel Dynamic Structure-Function Model for
Glaucoma Progression. Invest Ophthalmol Vis Sci. 2014; 55(12):8086–94. https://doi.org/10.1167/iovs.
14-14928 PMID: 25358735.
40. European Glaucoma Prevention Study G, Miglior S, Pfeiffer N, Torri V, Zeyen T, Cunha-Vaz J, et al.
Predictive factors for open-angle glaucoma among patients with ocular hypertension in the European
Glaucoma Prevention Study. Ophthalmology. 2007; 114(1):3–9. https://doi.org/10.1016/j.ophtha.2006.
05.075 PMID: 17070596.
41. Gordon MO, Beiser JA, Brandt JD, Heuer DK, Higginbotham EJ, Johnson CA, et al. The Ocular Hyper-
tension Treatment Study: baseline factors that predict the onset of primary open-angle glaucoma. Arch
Ophthalmol. 2002; 120(6):714–20; discussion 829–30. PMID: 12049575.
42. Kim KE, Kim MJ, Park KH, Jeoung JW, Kim SH, Kim CY, et al. Prevalence, Awareness, and Risk Fac-
tors of Primary Open-Angle Glaucoma: Korea National Health and Nutrition Examination Survey 2008–
2011. Ophthalmology. 2016; 123(3):532–41. https://doi.org/10.1016/j.ophtha.2015.11.004 PMID:
26746594.
43. Medeiros FA, Sample PA, Weinreb RN. Frequency doubling technology perimetry abnormalities as pre-
dictors of glaucomatous visual field loss. Am J Ophthalmol. 2004; 137(5):863–71. https://doi.org/10.
1016/j.ajo.2003.12.009 PMID: 15126151.
Comparison of FDT and SAP in monitoring the development of visual field defects in glaucoma suspects
PLOS ONE | https://doi.org/10.1371/journal.pone.0178079 May 18, 2017 13 / 14
44. Artes PH, Chauhan BC, Keltner JL, Cello KE, Johnson CA, Anderson DR, et al. Longitudinal and cross-
sectional analyses of visual field progression in participants of the Ocular Hypertension Treatment
Study. Arch Ophthalmol. 2010; 128(12):1528–32. https://doi.org/10.1001/archophthalmol.2010.292
PMID: 21149774.
45. Kim TW, Zangwill LM, Bowd C, Sample PA, Shah N, Weinreb RN. Retinal nerve fiber layer damage as
assessed by optical coherence tomography in eyes with a visual field defect detected by frequency dou-
bling technology perimetry but not by standard automated perimetry. Ophthalmology. 2007; 114
(6):1053–7. https://doi.org/10.1016/j.ophtha.2006.09.015 PMID: 17239441.
Comparison of FDT and SAP in monitoring the development of visual field defects in glaucoma suspects
PLOS ONE | https://doi.org/10.1371/journal.pone.0178079 May 18, 2017 14 / 14