comparison of plastic stress-strain material properties as
TRANSCRIPT

Scholars' Mine Scholars' Mine
Masters Theses Student Theses and Dissertations
1966
Comparison of plastic stress-strain material properties as Comparison of plastic stress-strain material properties as
determined from conventional experiments determined from conventional experiments
Wen Mo Chen
Follow this and additional works at: https://scholarsmine.mst.edu/masters_theses
Part of the Engineering Mechanics Commons
Department: Department:
Recommended Citation Recommended Citation Chen, Wen Mo, "Comparison of plastic stress-strain material properties as determined from conventional experiments" (1966). Masters Theses. 2965. https://scholarsmine.mst.edu/masters_theses/2965
This thesis is brought to you by Scholars' Mine, a service of the Missouri S&T Library and Learning Resources. This work is protected by U. S. Copyright Law. Unauthorized use including reproduction for redistribution requires the permission of the copyright holder. For more information, please contact [email protected].

COMPARISON OF PLASTIC STRESS - STRAIN 1'4ATERIAL PROPERriES
AS DEI'ERMINED FROM CO'NVENI'IONAL EXPERIMENTS
BY
WEN MO CHEN- !9~f-
A
THESIS
submitted to the f a culty of
'rHE UNIVERSI'rY OF MISSOURI AT ROLLA
in partial fulfillment of the requirements for the
Degree of
MASrER OF SCIENCE IN ENGINEERING MECHANICS
Rolla , r1issouri
~~~~~--~~~~
1966
Approved by
(advisor)

1
I. PURPOSE AND OBJECTIVES
In practice, the stress-strain curves of materials,
as obtained from different loading condition~are generally
not the same. However, in theory, it can be shown that by
appropriate selection of stress and strain related para
meters, the stress-strain curves obtained from a single
material, subjected to tension, compression, torsion and
bending loads, will coincide. Like materials have been
tested under the aforementioned loading conditions, and
these observations have been used to construct the appro
priate stress-strain diagrams. It is the primary purpose
of this study to present and discuss the relative agreement
between the theoretical and experimental results.

ABSl'RAC-r
In problems of engineering design, it is usually
assumed that the stress-strain diagrams of a given
material, as obtained from different loading conditions,
are the same. In fact, by using the classical theory of
plasticity, it can be shown that, with an appropriate
selection of stress and strain related parameters, the
diagrams should coincide.
rhree different materials - magnesium, aluminum and
steel, have been tested under tension, compression,
torsion and bending loads. Stress-strain diagrams were
constructefl from these observations. This thesis
presents an analysis of the relative agreement between
i
the theoretical and experimental results of these materials.
1 :i
AC f~\J OWL EDG EifcE\TT
rhe author wishes to express his sincere appreciation
to his advisor, Dr. Robert L. Davis, Assistant Professor
of Engineering Mechanics, for hls assistance in the comple
tion of this study.
The author would also like to take this opportunity
to thank all the other professors and his friends vrho have
sincerely instructed and helped him to overcome the diffi
culties that he has encountered.
111
TABLE OF CONrENTS
ABST RAGr •••••••••••••••••••••••••••••••••••••••••••••• 1 .
ACKN'OWLEDG MENT ••••••••••••••••••.••••••• , ••••••••••••• 11
• • • • • • • • • • • • • • • • • • • • • • • • • • • • • • • .••••• 111 TABLE OF CONTENTS
LIST OF FIGURES • • • • • • • • • • • • • • • • • • • • • • • • • • • • • • • • • • • • • •• 1v
LIST OF TABLES • • • • • • • • • • • • • • • • • • • • • • • • • • • • • • • • • • • • • • •• vi
NOT AI' IONS • • • • • • • • • • • • • • • • • • • • • • • • • • • • • • • • • • • • • • • • • • • •• vii
I. PURPOSE AND OBJECI' IVES •••••• , , •• , , • , •••••••• , , • , 1
II.
III,
INrRODUGr ION •••••••••.••..•••••••••••.•••••••. , • 2
THEORY OF STRESS-STRAIN CURVES OBTAINED FROM V~~IOUS
LOADING CONDITIONS • • • • • • • • • • • • • • • • • • • • • • • • • • • • •• 4
III-1.
III-2.
III-3.
Stress-Strain Curves for Tension and
Compression •••••• · ••••••• , •••..•••••••••• 4
Stress-Strain Curves for Torsion ••••••.• 8
Stress-Strain Curves for Bending •••••••• 16
I I I - 4. Summary • • • • • • • • • · • • • • • • • • • • • • • • • • • • • • • • • • 2 2
III-5. Stress-Strain Curves for Biaxial Tens1on.25
IV. EXPERIMENTAL FACILITIES AND PROCEDURES •••••••••• 29
v. RESULTS • • • • • • • • • • • • • • • • • • • • • • • • • • • • • • • • • • • • • • • •• 39
VI. SUMMfu~Y AND CONCLUSIONS • • • • • • • • • • • • • • • • • • • • • • • •• 58
REFEREN'CE •••••••••••••••••••••••.••.••.•••••••.••••••• 6 0
SELECTED BIBLIOGRAPHY • • • • • • • • • • • • • • • • • • • • • • • • • • • .•.•.. 61
VITA ••••.•••••••••••••••••••••••••••••••••••••••••••••• 6 2
APPENDIX I. SAMPLE RESULTS ••••••••••••••••••••••••••• 6 3
iv
LIST OF FIGURES
Fig. III-1 Effective stress-effective strain diagram 6
Fig.
Fig.
Fig.
III-2 Torsion of solid circular shaft
III-3 Shear stress-shear strain curve
III-4 Torque-angle of twist curve for circular
bar
Fig. III-5 Beam in pure bending
Fig.
Fig.
Fig.
Fig.
Fig.
Fig.
Fig.
Fig.
Fig.
Fig.
Fig.
Fig.
Fig.
Flg.
III-6 Element taken from deformed beam
III-7 Deformed bar in pure bending
III-8 Pressure-loaded membrane
III-9 Element taken from deformed membrane
III-10 Equivalent states of stress
IV-1 'rensile testing apparatus
IV-2
IV-3
IV-4
V-1
V-2
V-3
V-4
V-5
Compressive testing apparatus
Torsional testing apparatus
Bending testing apparatus
Effective stress-effective strain rela•
tions for tension
Effective stress-effective strain rela
tions for compression
Experimental torque-angle of twist curve
for circular bars
Experimental moment-curvature curve for
bending
Elastic portion of stress-strain curves
for aluminum
11
13
15
17
19
19
2.5
26
27
30
31
33
34
40
41
42
43
44
Fig.' V-6 Elastic portion of stress-strain curves for
magnesium 45
Fig. V-7 Elastic portion of stress-strain curves for
steel 46
Fig. V-8 Fractured tensile specimens
Fig. V-9 Fractured compressive specimens
Fig. V-10 Necking in tensile steel specimen
Fig. V-11 Fractured torsional specimens
Fig. V-12 Experimental comparison of plastic stress-
48
49
50
51
strain properties of aluminum 54
Fig. V-13 Experimental comparison of plastic stress-
strain properties of steel
Fig. V-14 Experimental comparison of plastic stress
strain properties of magnesium
Fig. A-1 Experimental torque-angle of twist curve
for aluminum bar
Fig.
Fig.
Fig.
A-2
A-3
A-4
External fiber strains for aluminum beam
Experimental moment-curvature curve for
bending
Beam curvature-strain curve for aluminum
55
56
67
70
7;1
72
v
vi
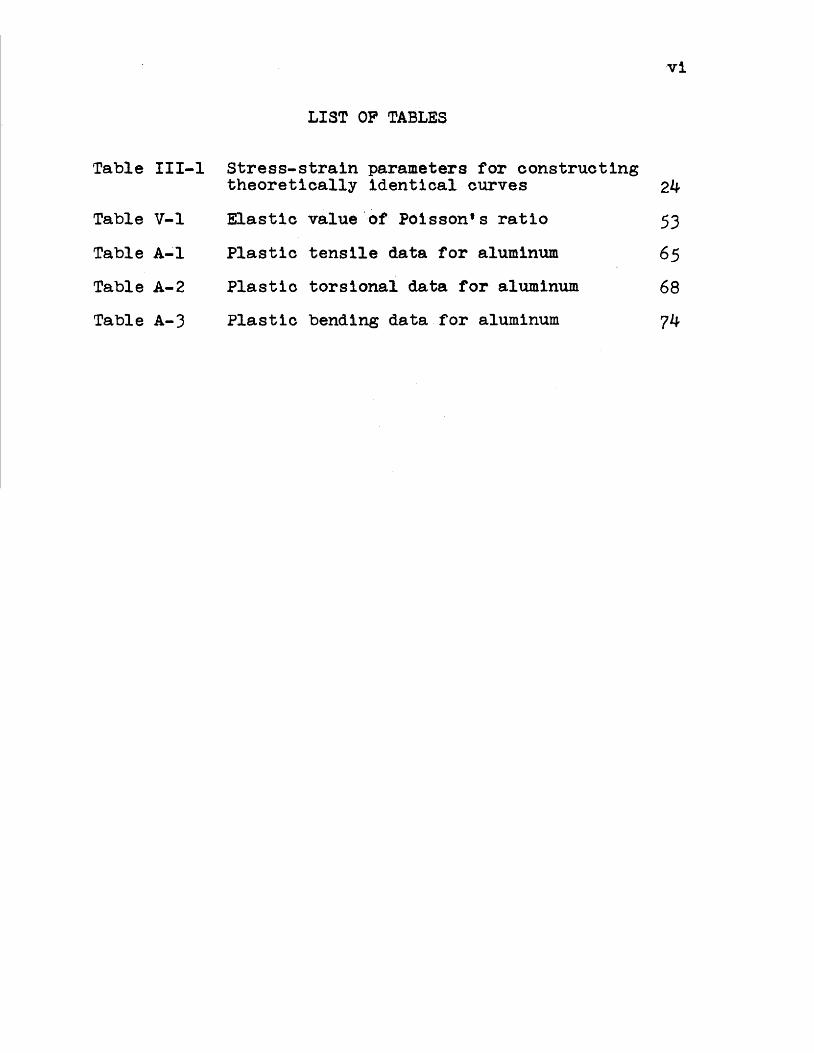
LIST OF TABLES
Table III-1 Stress-strain parameters for constructing theoretically identical curves 24
Table V-1 Elastic value'of Poisson's ratio 53
Table A...;l Plastic tensile data for aluminum 65
Table A-2 Plastic torsional data for aluminum 68
Table A-3 Plastic bending data for aluminum 74

Symbol
d
Et
E c
~i
F
G
ho ' h
I
Ip
k
ko
f.o t J.
Po
ro ' r
to ' t
T
w
w
wp
Vii
NOTATIONS
Definition
beam depth
modulus of elasticity for tension
modulus of elasticity for compres-sion
modulus of elasticity for biaxial tension
arbitrary function
modulus of rigidity
initial and current heights of the compressive specimen
centroidal moment of inertia of the cross section
polar moment of inertia of the circular bar
yield shear stress
maximum yield shear stress
initial and current lengths, respectively
internal pressure
initial and current radii, respec• tively
initial and current thickness, respectively
twisting moment
work done per unit volume
total work done
total plastic work done per unit volume
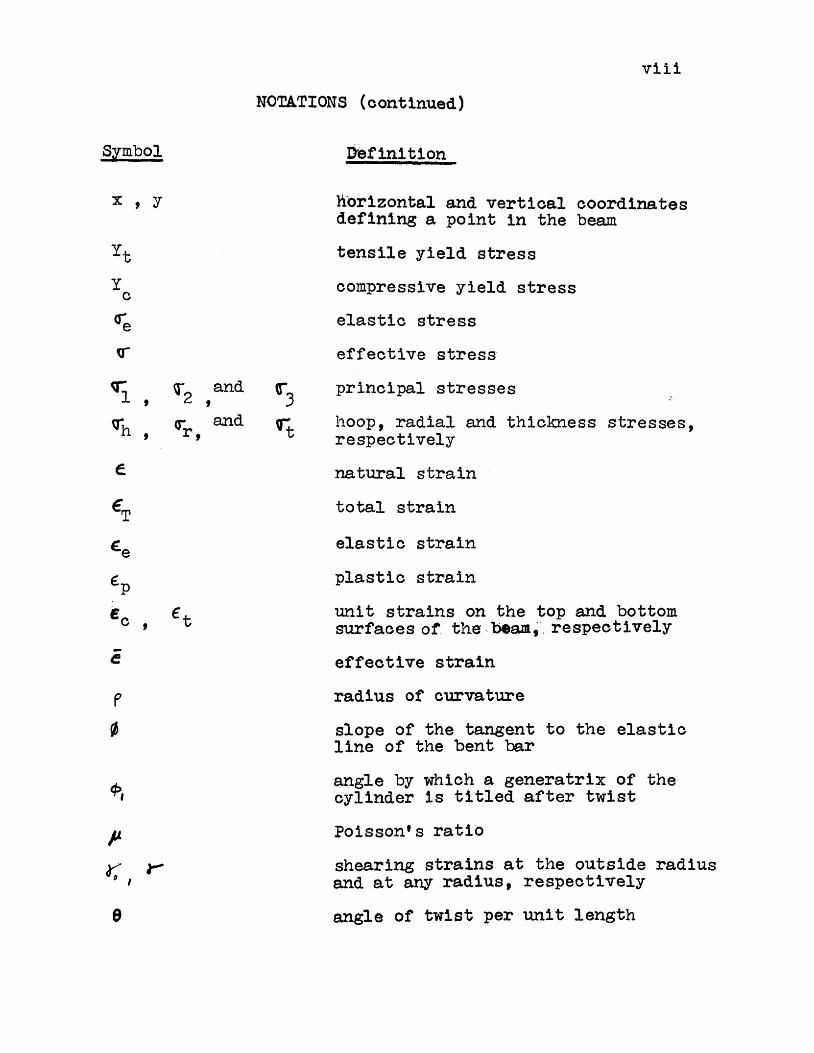
Symbol
X ' y
Yt y
c
ere
v-
~ ' Q"'h
' e
E'T
£e
€p
Ec ' -e
('
~
tf:>,
p
e
cr2 ,and
<rr '
and
viii
NO~TIONS (continued)
Definition
Worizontal and vertical coordinates defining a point in the beam
tensile yield stress
compressive yield stress
elastic stress
effective stress
principal stresses
hoop, radial and thickness stresses, respectively
natural strain
total strain
elastic strain
plastic strain
unit strains on the top and bottom surfaces of the, beam;·. respectively
effective strain
radius of curvature
slope of the tangent to the elastic line of the bent bar
angle by which a generatrix of the cylinder is titled after twist
Poisson's ratio
shearing strains at the outside radius and at any radius, respectively
angle of twist per unit length
Symbol
ix
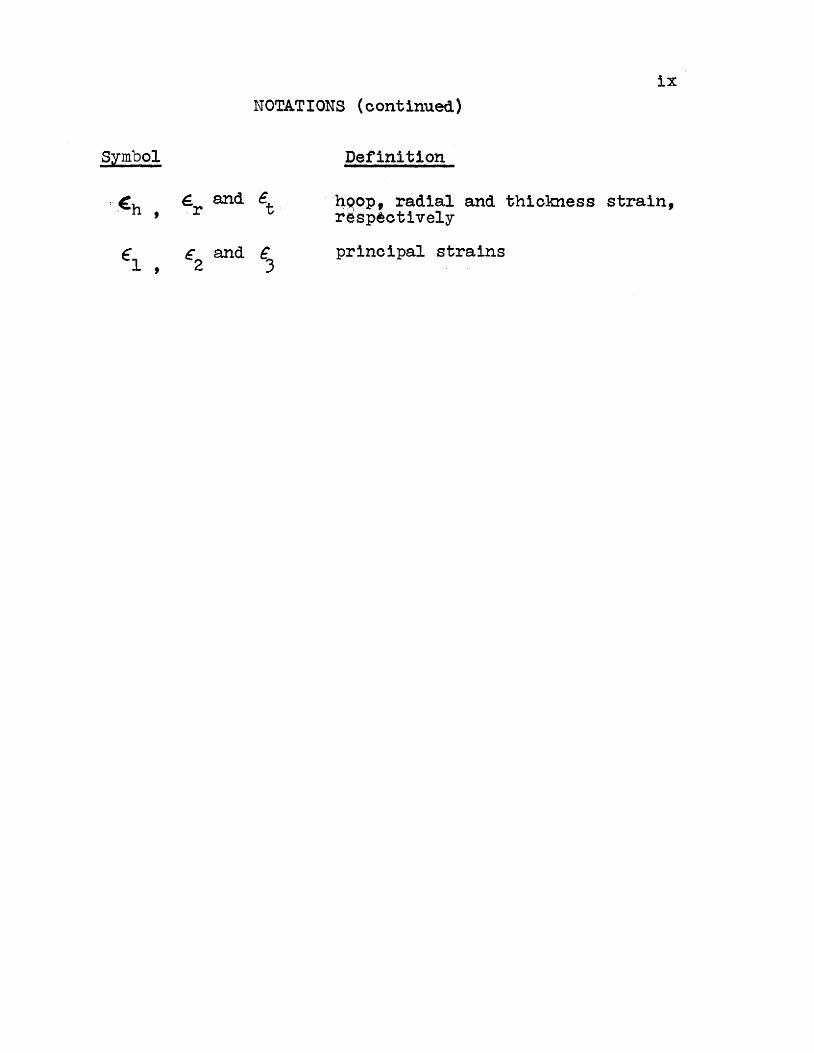
NOTATIONS (continued)
Definition
~Q~p, radial and thickness strain, respt9ct1vely
principal strains

I I. I tiT RODUCT I ON
When a material is subjected to external forces its
behavior depends not only upon the magnitudes of the
2
forces and the strength and the shape of the material
itself, but also upon the manner in which the forces are
applied. Metals, for example, generally exhibit rela
tively high tenacity and are therefore better suited to
resisting tensile loads. Brittle materials, such as
mortar, concrete, brick and cast iron, have tensile
stren3ths that· are low compared ~v-ith their compressive
strengths, and are principally employed to resist com
pressive forces. Again, the tensile strene;th of 't'lood is
relatively high, but it cannot always be used in structural
members because of its low shear resistance, which causes
failure before the full tensile resistance of a member
can be developed.
Before an engineer designs a structure, a stress
analysis must be made. It is usually assumed that the
material follows Hookets Law, and the modulus of elasticity
of the material is known. But for selecting the safe
dimension of a structure, this knowledge is not sufficient.
The designer must know the behavior of the material beyond
the proportional limit under various stress conditions.
Information of this type can be obtained only by experi
mental investigationso Material-testing laboratories are
equipped with test machines for performing tensile, com
pressive, torsional and bending tests of a specimen that
3
~.Arill p-rovi(1e adc1ect. information on material beha\rior.
In plastic design, it is generally assumed that the
stress-strain curves for tension, compression and bending
are identical. Thus, when an engineer designs a structure,
the property of the material to be used is obtained from a
simple tension test, an~ these results represent the basis
of deslgn regar~less of the nature of loa~ing or state of
st:ress in the structure. In practice, the behavior of a
~~i -;ren rnat erial, when subjected to various loari i ng cond1-
tto:'1s, i.s not the same, and these deviations must be
accounte~ for. this fact is extremely important in plastic
~nalysis, and is discussed further in Section V.
4
III. ·rHEORY OF 8rRESS-STRAIN CURVE~3 OHrAI"NED
FROM VARIOUS LOADING CONDITIONS
l.. Stre:3s-s:~rain curves for Tension and compression.
In securing stress-strain diagrams for a given
material, the three usual types of tests taken are the
tension of a rod, the compression of a short cylindri-
cal block, 3.nd the twisting of a thin-1-,ralled tube.
The results of such tests are represented by plotting
the mean stress acting in the current cross-sectional
area, against some measurement of the total strain.
For an ideal tensile test, the volume of the
tensile specimen is practically constant
nr a A = nr2 R 0 ~.
that is,
where
r a 0
r and rare the initial and current radii, 0
respectively.
£0
and ~ are the initial and current length,
respectively ..
(a)
The total work (W) done by the tensile force is
W = Jnr 0
2 Q"'edf + J nr2 YtdR
where ~e is the elastic stress, and Yt is the tensile
yield stress. Comparing the elastic work done '1J'ith
the plastic work, the elastic work is so small that it
can be neglected. Thus, the total work done is con
sidered to be
5
W = } 11' r 2y t dR • (b)
Combining equations (a) and (b), the work done per
unit volume (w) is
11 dJ w = Yt T .
'J.. The natural strain (€) is defined as
dE = slj-Hence, the work done_per unit volume is just the area
under the true stress-natural strain curve.
Now, the amount of recoverable elastic work done
is approximately equal to the shaded area (As) shown
in Figure III-1, which can be expressed mathematically
as
where Et is the modulus of elasticity for tension.
Thus, the total plastic work done per unit volume
is
J J1 Yt2
Wp = dwp = t.Yt~- 2Et •
According to theory of the "equivalent of plastic
work", the yield stress Yt is related to the plastic
work, thus

(!)
(IJ Q)
H .+) (/)
6
----+--d€ = ¥ --.J. E- Natural Strain
Fig. III-1
EFFECr IVE S'rRESS-EFFEGL' IVE SrRAii\: DIAGRA?1
1*
where the symbol F represents some arbitrary function.
If Yt is plotted against 1n+ - Yt , the argument of o Et
7
F is the area under the curve up to the stress level Yt.
Similarly, for simple compression, the compressive
yield stress is
y = F ( Ih~ _dh - y~ ) c e--n- 2E
h c
Y0
is the compressive yield stress
h and h are the initial and current heights of the 0
specimen, respectively
E0
is the modulus of elasticity for compression.
It can be shown that the
function of 1n-L1- - Yt as Yc o Et
true stress Yt is the same
is of ln~ - ~ • Thus, c
theoretically, the stress-strain curves for simple tension
and simple compression will coincide
against ln-t- - ~ , and Yc against A• Et
if Yt is plotted
ln~ - ~ • That c
is, the two curves coincide only when true stress is
plotted against the natural strain, but not when plotted
against the engineering strains J. J..f.. and hofi h
·U· Superscript numbers refer to references listed on page
60.
8
2. Stres3-8train Curves for Torsion
It is very interesting to find that, 3fter selec-
tton of the app~opriate stress anrl stratn relate\-l_
paramete~s, the stress-strain curves for torsion coin-
ci~e with that for tension. ~his fact is demonstrate~
in ~he fo11oT.Aring paragraphs.
Boo1<e's l9.1AJ for three dimensional stresses 1 n tl)e
plast tc range is TITi t ten as
€, = (!. [ G'; - P. t t-~-. +- crl ) ]
t& = ~ [ ~ )A l v-, -t Gi ) J (IIT-1) 2
tJ = ~ [ 0": -.l )A\<1, +'~)]
:~rhcrc p. ls Poisson's ratio, a no. f is, in general, a
function of the strains, and. can be netermined expert-
mentally. ·rhe quantities r, , 9; , and 'I; are the
principal stresses, an~ ~ , f~, ~0~ ~ are the
principal strains.
rhe equation of volvme constancy is wrttten in
terms of the total _strains as
c t + Gz -t ~ J = o • (III-2)
If equations (III-1) and (III-2) are combined, it
can be sho~vn that Poisson's ratio JJ. remains constant
and equal to one half in the plastic range.
I:·Jow, it is desired to find some relationships
between shear stress and normal stress, and shear
strain and normal strain. According to the Von Mises
yield criterlon
where
t~1US
Yt is the tensile yield stress
k is the yield shear stress
9
(III-4)
~v1a1cing use of the known relations of the material
constants gives
= Et _Et G 2(l+JA)- 3
where
f" is the modulus '_T
= Yt _ k 3e· -T
of rigidity
Ft is the modulus of elasticity for tension
r is the shearing strain at any radius r
Combining the above equations gives
10
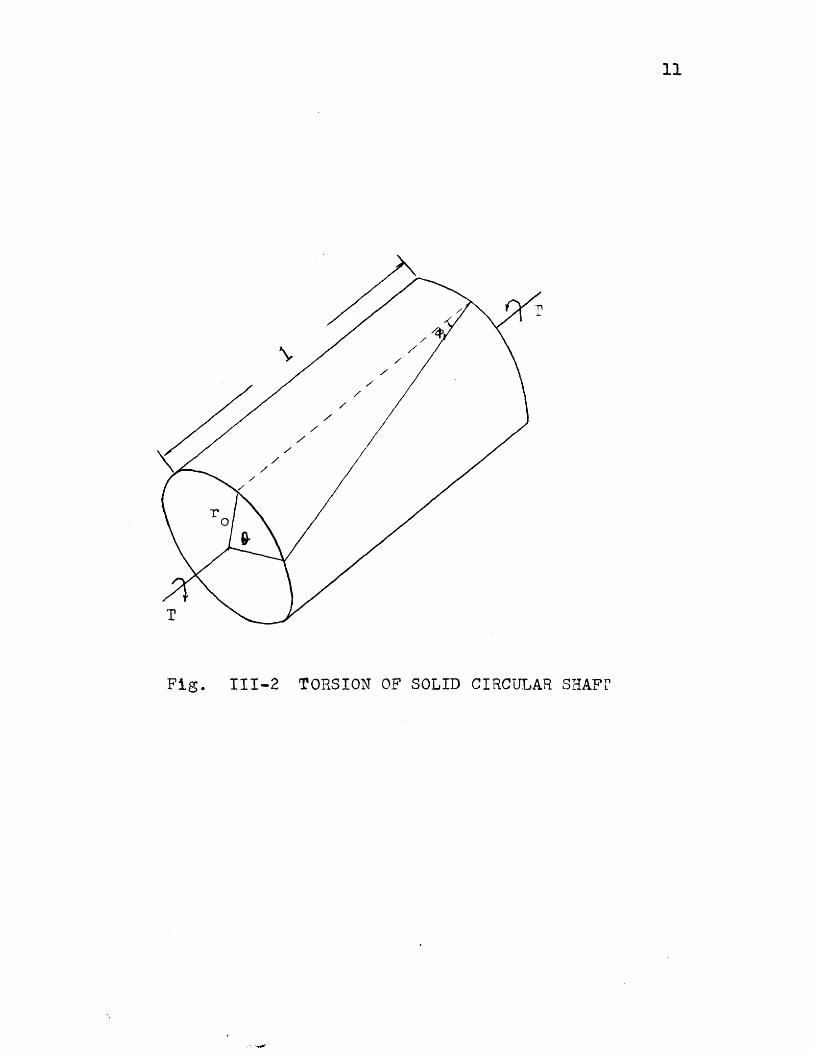
J'>~ov~r, consider and isotropic cylinder of unit gage
length and outside radius r0
, subjected to a plastic
torsional strain. (See Figure III-2) rorsion theory
assurr.es that the diameter of the bar remains constant
du_ring the loading process, thus, for incompressihle
materials, the gage length also remains fixed. At
any radius r, the shear strain is ( = tan~1 • And, for
a given angle of twist per unit lenzth e
or
a= .L r (c)
11Jhere r; is the shear strain at the outside rad.i u.s,
and ¢1 is angle by which a generatrix of the cylinrler
is tilted after twist.
Since the total strain (~) is the sum of the
s t~rains 1 n the elastic ( Ee) and plastic ( tp) ranges,
then the plastic strain can be expressed as
k t = tr- € = Y Yt = re -G
p e 7J-E; n . (III-5)
From equations (III-4) and (III-5), it is seen that
the stress-strain curves for the torsion of a circular k
shaft, constructed by plotting fjk versus r8 - G tT
will coincide with the usual curves for tension.
11
Fig. III-2 TORSION OF SOLID CIRCULAR SHAFr
12
Referring again to Figure III-2, the resisting
torque T, acting on a given cross section, is ~·rritten as
T = {o 1<(2 'lfr dr)r (III-6) Jo • Substituting equation (c) into equation (III-G) gives
Te' 2 TT
(III-7)
Thus, the t"t"Jisting nonent T is proportional to the
second monent of the shaded area under the stress-strain
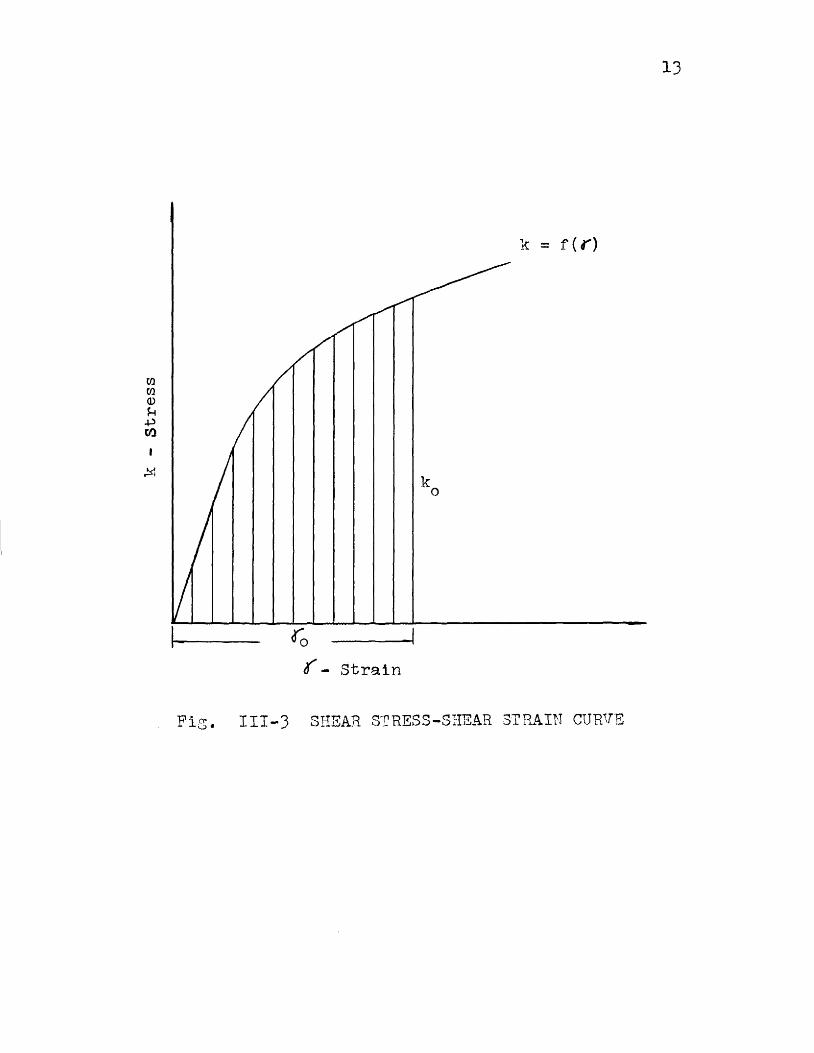
Clu~ve for shear' lr = f ( r) ' 'ShOT·m in FigUJ."e III-3. If the
nom.ent-tl·Jist curve, T = f(e), is lmo't'm from observation
of a torsion test, the un.kno1~m material stress-strain
curve for shear, k = f(Y), may be determined from equation
(III-7). Differentiating equation (III-7) with respect
to e
S~nce (is independent of 9, the first tern on the ri8ht
side is zero, thus
~eo This result is obtained by employing the Leibnitz
formula given on page 20.
13
k = r ( r)
ro K- Strain
Fig. III-3 SHEAR S'I'RESS-SHEAR STRAIN CURVE
14
If the T-e curve is lmo~m, the 1-c- Y curve can be
derived. Note that k = .....21:_ is the usual simnle 0 21fT:- -
e:x:pression for torque due to a maximu:n yield shear stress
of k 0 in the fully plastic condition of a non-~;ork
hardening material.
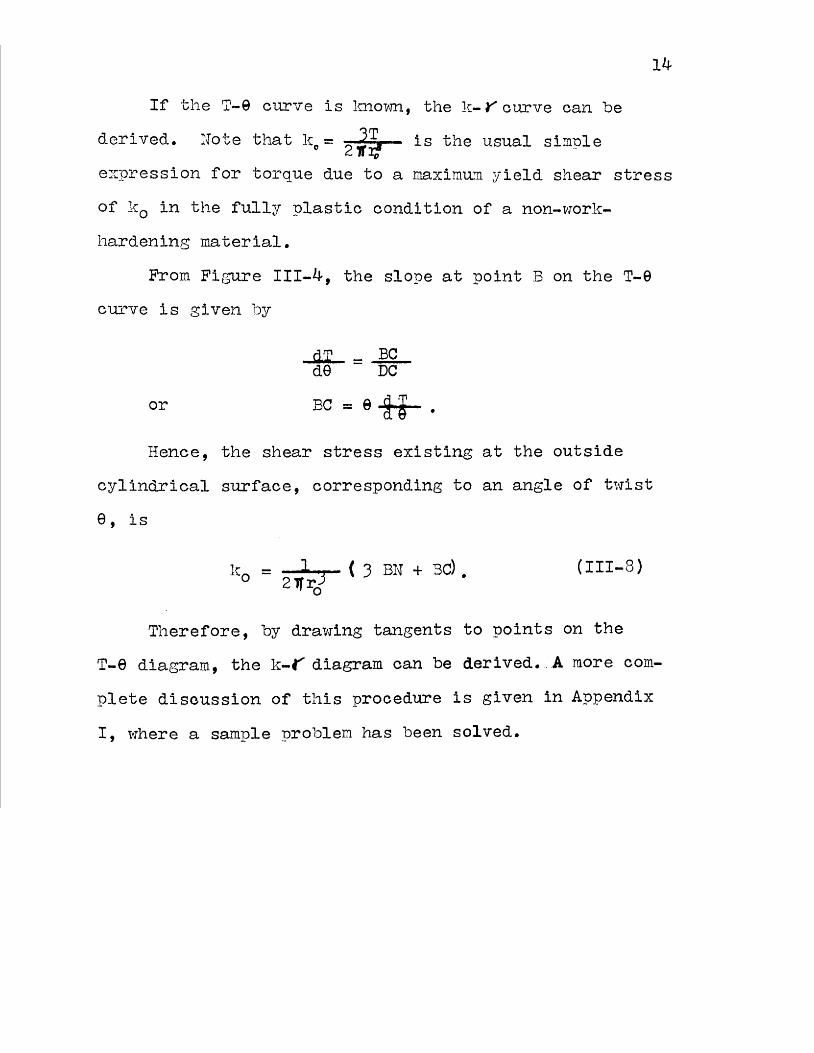
From Figure III-4, the slope at point B on the T-9
curve is given by
or
dT _ BC d9 - na-BC = etr.
Hence, the shear stress existing at the outside
cylindrical surface, corresponding to an angle of t1'J'ist
e' is
lc0 = 2 Tf~j ( 3 BN + 3c).
0
(III-8)
Therefore, by dra't'ring tangents to points on the
T-e diagram, the lc-r' diagram can be derived •. A more com
plete discussion of this procedure is given in Appendix
I, 't~here a sample problem has been solved.
15
( e -r)
---- --- c
N 0
9 - Angle of T1AT1st per Unit Lensth
Fig. III-4 TORQUE-ANGLE OF 1'v!IS1' CURVE FOB
CI;tCULAR BAtt

3. 3tress-Stra1n Curves for Ben:ling
In an ideal bending test, it is senerally assu:neo
that the extreme fibers on the tensile ann compressive
sides of the beam are under the sole influence of ten
sile and co~pressive stresses, respectively. In other
words, theoretically, the stress-strain curves for the
extreme fibers on both sides of the beam are the same
as those ob~aine~ from direct tensile and compresscve
tests. Althou13h yleldine; of the extreme fibe-r- is
marked 1,~r the supportin.:?; effect of the less hic;hly
stressed fibers near the neutral axis, it will be
shown later that, for certain materials, this effect is
small.
Consider a long prismatic beam ha.vine; a rectangu
lar cross section of width b and depth d subjecten to
tt<Jo equal and symmetrically spaced concentrated loads
as shO\rin in Figure III-5. It is assumed that a uni
axial state of stress exists at all points of the beam
with the longitudinal stress being the only nonvanish
ing principal stress along the pure bending portion.
If t1·Jo adjacent yertical lines m-m and n-n are clravm
along the side of the beam, experiment shows that
these lines remain essentially straisht cl~1r1ng bending,
and rotate so as to remain perpendicular to the
longitudinal fibers of the beam.

F
1- a ----,
F
F
m n ,~ a ---1
X
m n fi'
y
(a)
Loading of beam
1--rc--f
TF=112 d
l I I j neutral
_I 11
(b)
Cross section
(c)
stress distribution
Fig. III-.5 BEAJ.I IN PURE BENDING ~ -..J
T'he theory of bendins ls baserl on the assumption 't11n~
not only such lines as m-m remain strai3ht, but thqt
the entire transverse section of the heam, ori~inally
plane, remains plane and normal to the longitudinal
fibers of the beam after ben~ing.
From Figure III-6 it is seen that
(d)
and.
~vhere f is the radius of curvature, d is the bean
depth and Ec and Et are the unit strains on the top
and bottom surfaces, respecti vel;y. !,urther, from
Figure III-7
(e)
1vhere ¢ is the slope of the tangent to the elastic
line of the bent 't>ar ..fo is t~e ,gage length. Thus
¢ = _Jo__..._€_c~+......--€_t ..... ) 2d •
(III-9)
rhe equilibrium equations for any section of the
beam are
I 6'"dA = 0 'A
(f)
and
I VydA = M (g)

19
Fig. III-6 ELEMENr TAKEN FRON ~EFORMED BEAIVI
,-----F ~ i -1 F
Fig. III-7 DEFORMED BEAM IN PURE BENDING
20
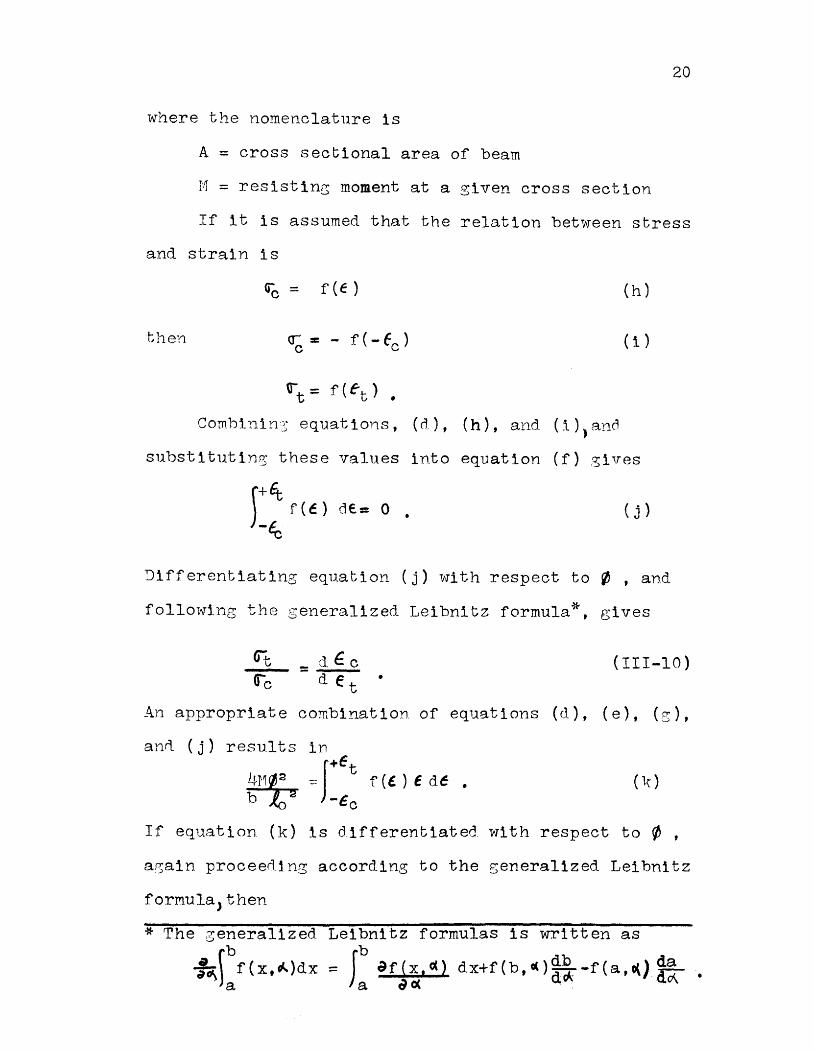
where the nomenclature is
A = cross sectional area of beam
M = resistinB moment at a given cross section
If it is assumed that the relation between stress
and strain is
(h)
then ( i)
(i""t = f(t"t) •
Combinin3 equations, (d), (h), and (i))and
substituting these values into equation (f) gives
f+9; f(f) df.= 0 • )_lc
( j )
Differentiating equation (j) with respect to ~ , and
following the generalized Leibnitz formula*, gives
(III-10) •
An appropriate combination of equations (d), (e), (~),
an~ (j) results in
~H£ 2 ~r:: f(£)Ede, ( k)
If equation (k) is differentiated. with respect to ¢ ,
again proceeding according to the generalized Leibnitz
formula, then
* The generalized Leibnitz formulas is written as
rb Jb db d 1"\J/(x,tl.)dx = a arJ!/11) dx+f(b,•l)dcl; -f(a,c() i!~ ,
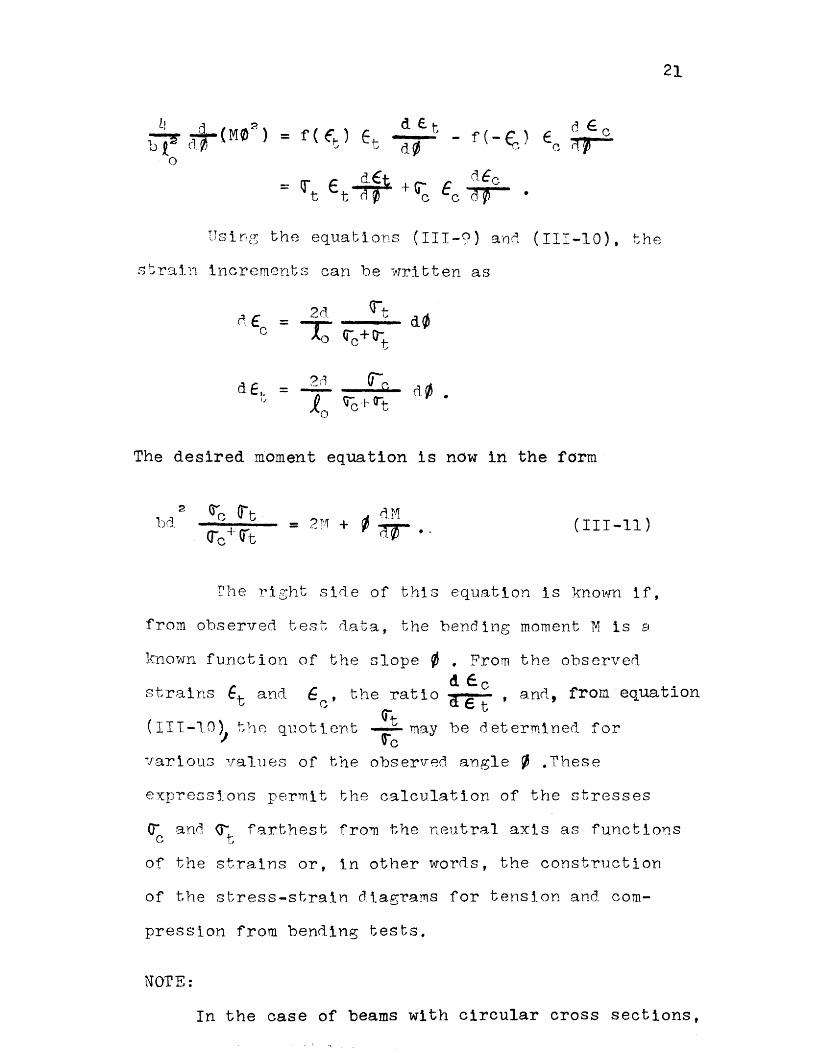
L! d ( M02) = ~ cl~ · ~) .X.. - 'fl
0
Usir
22
equatic~ (f) becomes
(III-12)
where r0
is the ra~ius of the circular cross sec
tton. Accor~inc to equation (e), f ~epen~s on
¢. If Aquatton (IIJ-12) is ~ifferenttated with
respect to ¢, it can be seen that the first ter~
of the rtght si~e of the ~e~eraltze~ Lethnttz
for11ula 0oes not 1ranish. That ts, tt is not 3.S
conve~:tent-, to find the relationship betwPen a-c
and ~t for heams of circular cross section. Con-
siderable effort has been put forth by this
author in an attempt to solve the beam proble~
for circular cross section; however, since the
completion of this thesis does not Qepend upon
the knowledge of circular bar behavior, this
problem has been left as a future thesis project.
~he reason for pursuing this problem was to Make
possible the selection of tension, co~presston,
torsion, and bending specimens from a single
piece of round bar stock.
4. Summary
From the preceding discussion of the theoretical
stress-strain curves for tension, compression, torsion
and bending, it is concluded that by appropriate
23
selection of stress and strair. related parameters,
these four curves will coincide. rable III-1 shows
the necessary quantities for stress and strain that
~1st be used in constructing these graphs for various
loading conditions.
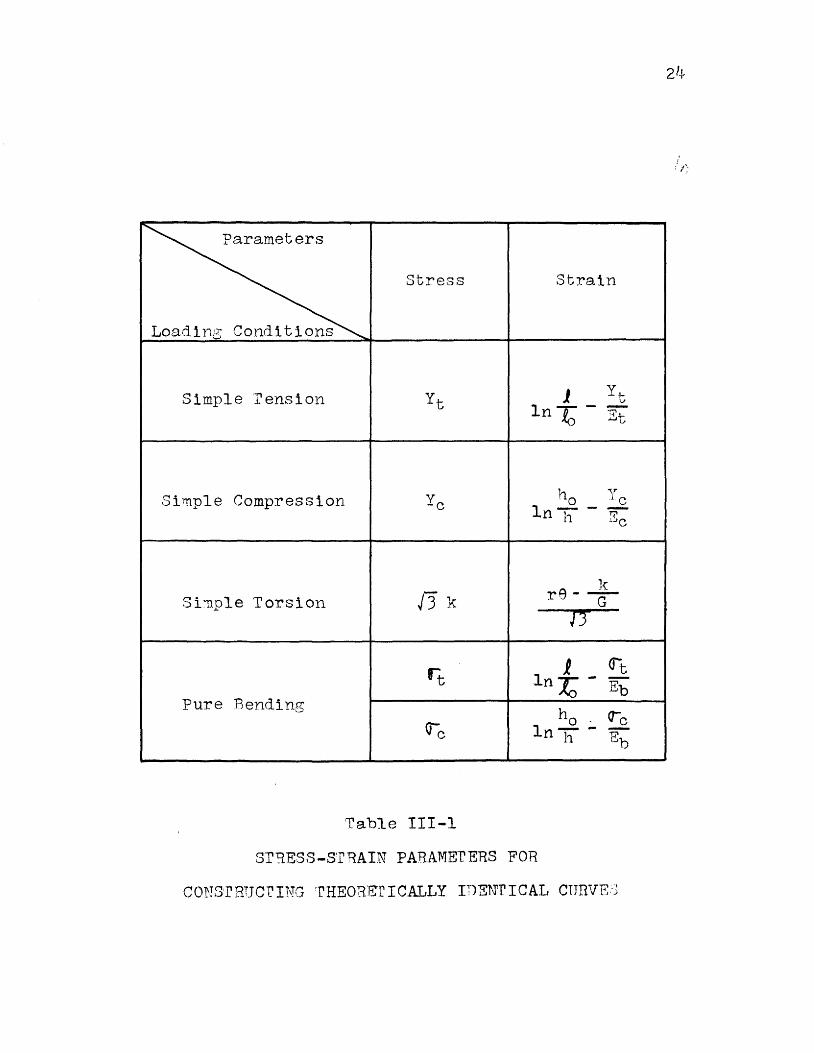
Parameters
Stress Strain
Loading Conditions
Simple rension Yt 1 yt ln 1:; - Et
Simple Compression Yc ho 'r .l.c ln11 - rr
~..~c
e k Si11ple Torsion /3 k r -G
n
rt J G'""t ln J;' - Eb
Pure Bending
v-c ho ere lnT - E b
Table III-1
81'"9-ESS-STRAIN PARAMErERS FOR
CO~JSrRUGl'ING ~rHEORET I CALLY IDENTICAL CURVE.·)
25
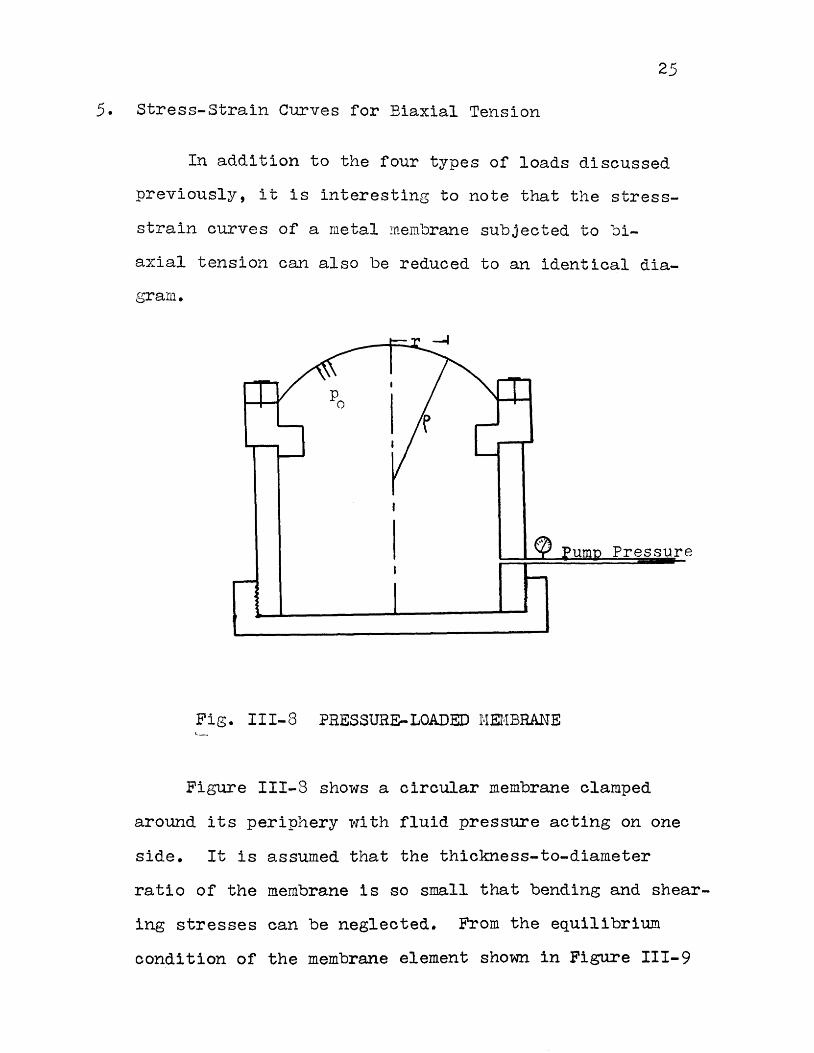
5. Stress-Strain Curves for Biaxial Tension
In addition to the four types of loads discussed
previously, it is interesting to note that the stress
strain curves of a metal rnembrane subjected to bi
axial tension can also be reduced to an identical dia-
gram.
Pressure
Fig. III-8 PRESSURE-LOADED HEHBRANE
Figure III-8 shows a circular membrane clamped
around its periphery ~ri th fluid pressure acting on one
side. It is assumed that the thickness-to-diameter
ratio of the membrane is so small that bending and shear
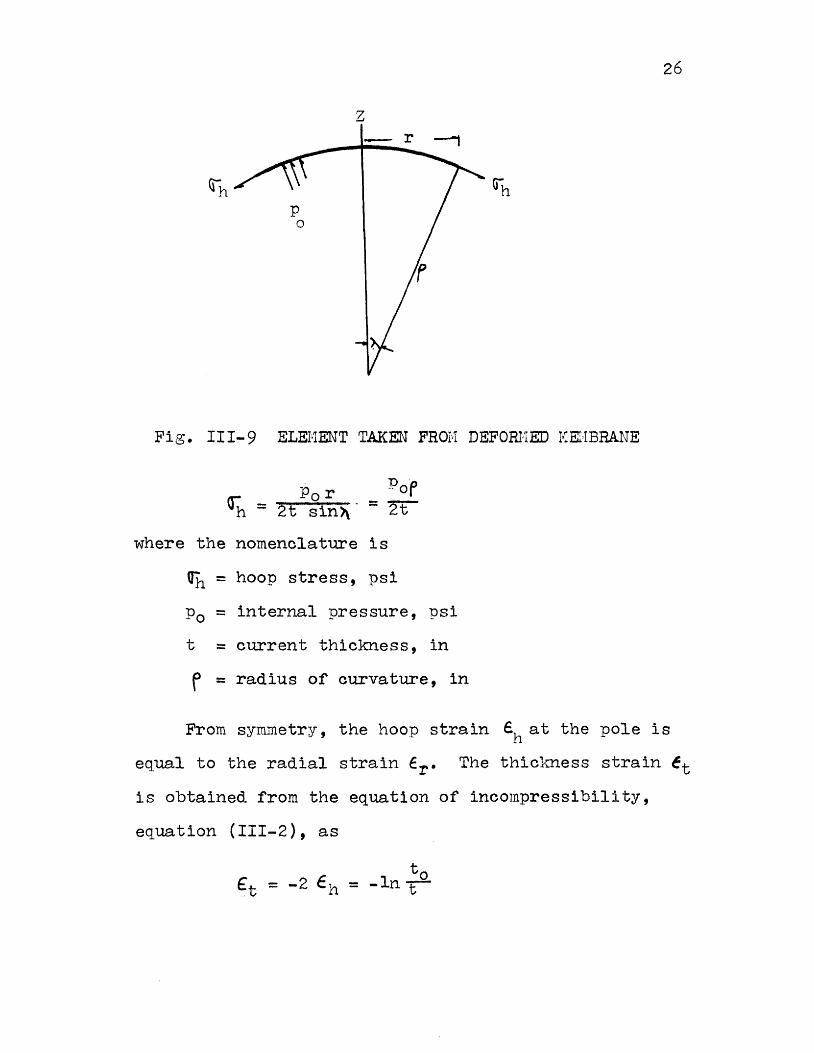
ing stresses can be neglected. From the equilibrium
condition of the membrane element shown in Figure III-9
p 0
z
Fig. III-9 ELEHENT TAKEN FROH DEFORI•·TED I·1EHBRANE
Po r Pof Oh = 2t sin)\ = 2t
where the nomenclature is
~h = hoop stress, psi
p 0 = internal pressure, psi
t = current thickness, in
r = radius of curvature, in
26
From symmetry' the hoop strain sh at the pole is
equal to the radial strain €r• The thickness strain et is obtained from the equation of incompressibility,
equation (III-2), as
to = -lnt

where t is the initial thickness, inches. 0
2?
Considering the stress system at the pole for a
thin membrane, the stress normal to the sheet is neg-
ligible, and the material at the pole is therefore sub
jected to a balanced bi-axial t·ensile stress. That is,
where the symbology is
'"t = thickness stress, psi
r:'-1 = hoop stress, psi
<rr = radial stress, psi
Thus ~t can be neglected. Since at the pole, the hoop
stress and radial stress are equal, the following diagram
can be used to express the state of stress.
o-h = crh+
O"r
Fig. III-10 EQUIVALIDJT STATES OF STRESS
Since it is assumed that a hydrostatic pressure has
no effect on yielding, the system is therefore equivalent
to a simple compressive stress ~h acting normal to the
sheet.
28
The equations for effective stress i' and effect
-strain e are
(III-13)1
It can be shown from equations (III-13), that the hoop
stress <r11 and thiclmess strain Et are just the effect
ive stress and effective strain, respectively. If the
quanti ties lrh and ·ln ~ _ ~h. (~i is modulus of elas-o bl
ticity for biaxial tension) are chosen as the ordinate
and abscissa, respectively, the resulting stress-strain
curve will coincide with the curves described in Table
III-1.

IV. EXPERIHENTAL FACILITIES AND PROCEDURES
!Three different materials - magnesium (AZ 6l.A)
aluminum (2~ST-4),and (AISl Cl018)steel have been tested
under tension, compression, torsion and bending loads.
All of the test specimens, for a given ~terial, are cut
from the same bar. The subject testing materials were
29
purchased in the form of a 12-foot section of bar, having
a 1~-inch by 3/4-inch rectangular cross section. The
bending test specimens were made by cutting a section of
appropriate length from the original bar. The tension,
compression, and torsion specimens were also made from
the original bar, but they required that a machining
operation be made.
A. Objective:
To obtain experimental stress-strain curves for
tension, compression, torsion and bending.
B. Equipment Necessary:
1. Tension Test (shown in Figure IV-1)
Testing machine with grips to fit specimen
Two inch dial gage (calibrated with increments of 0.0001")
Pair of dividers
One inch micrometer
Gage length punch
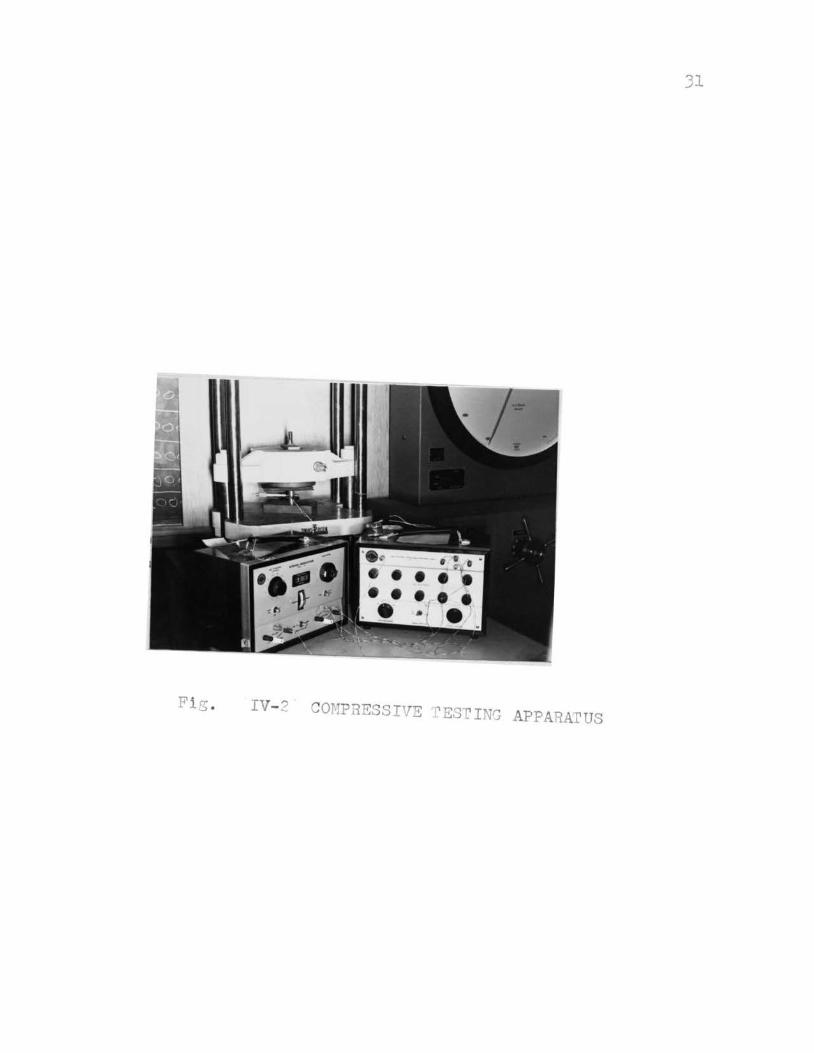
2. Compression Test (shown in FigureiV-2)
Testing Machine

30
Fig. IV-1 TENSILE TESTING APPARATUS
31
Fig . I - 2 CO· PRE SI' E r ES _I J PPARATUS
3'") f_~
Baldwin-Lima-Hamilton portable Model 120 strain indicator and the Model 225 Switching and Balancing Unit (this instrument has been designed and calibrated especially to work with resistance strain gages having an initial resistance of 120 ohms)
I~1 i cr ome t er s
Lubricant (graphite)
Bearing plates (these plates are essentially rigid in comparison to the compression specimens)
Budd Metalfilm strain gages (post yield, high elongation, type HE-141 gages having a gage factor of 2.02 to.s ~and an initial resistance of 120 ::!: 0. 2 ohms)
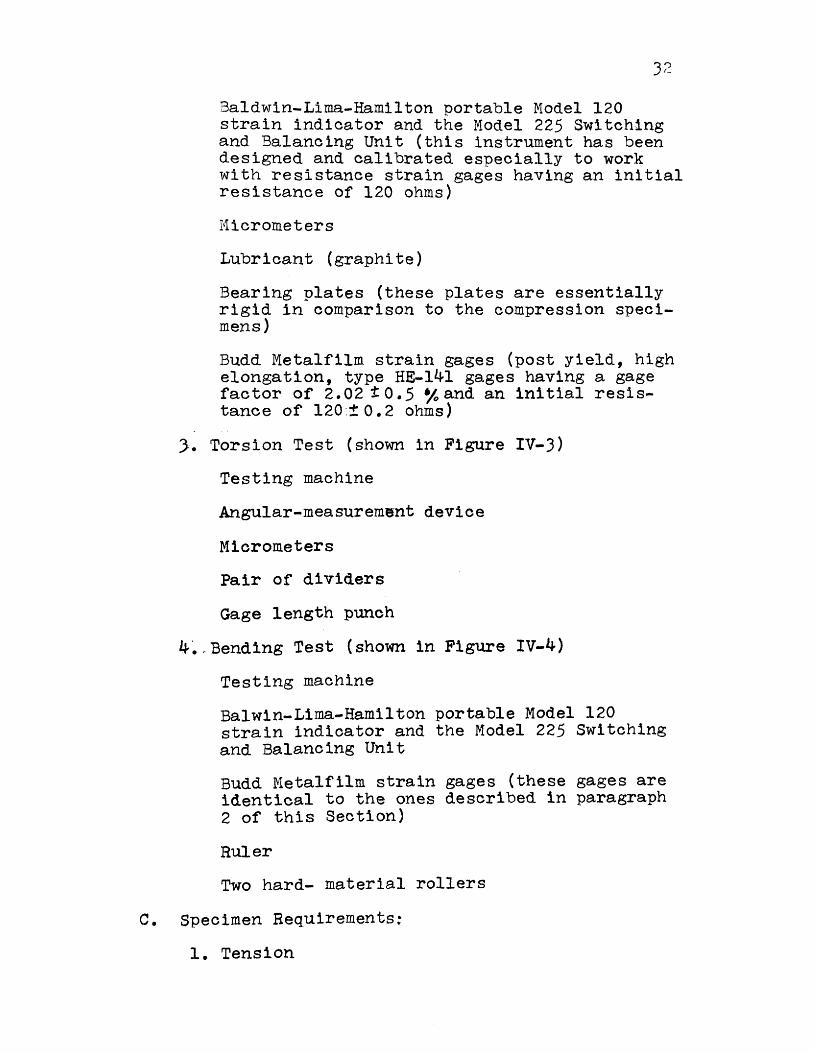
). Torsion Test (shown in Figure IV-3)
Testing machine
Angular-measurement device
Micrometers
Pair of dividers
Gage length punch
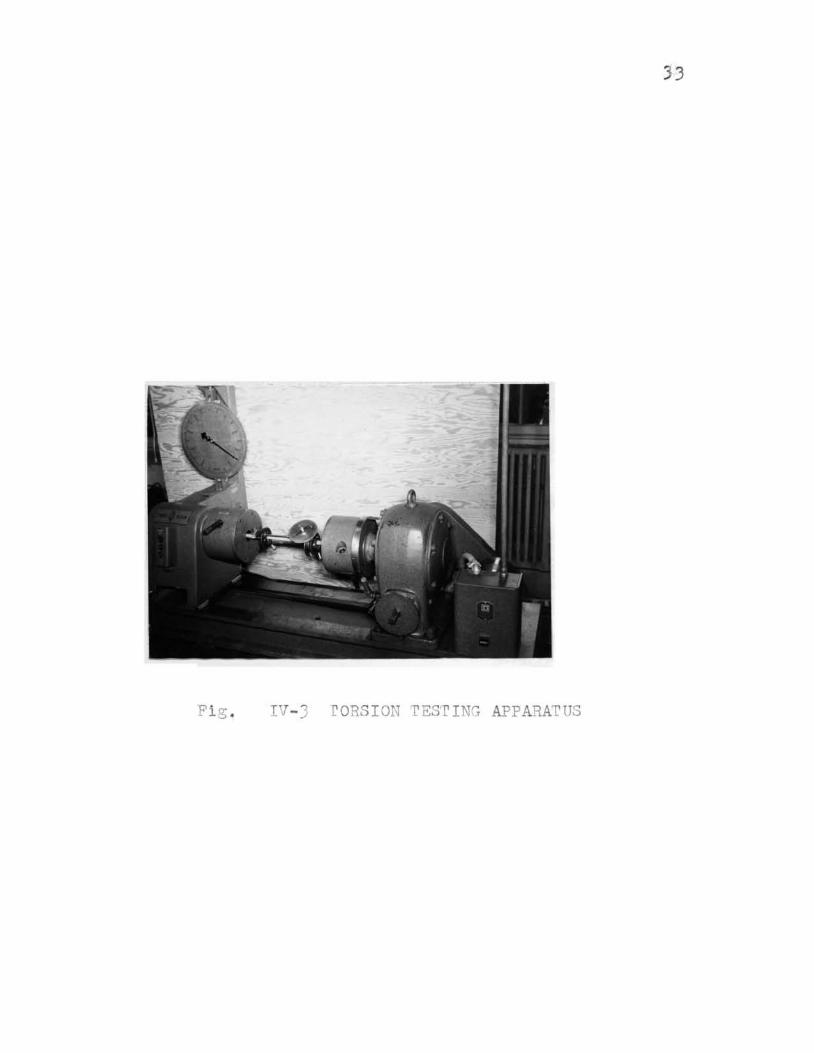
4~-Bending Test (shown in Figure IV-4)
Testing machine
Balwin-Lima-Hamilton portable Model 120 strain indicator and the Model 225 Switching and Balancing Unit
Budd Metalfilm strain gages (these gages are identical to the ones described in paragraph 2 of this Section)
Ruler
Two hard- material rollers
c. Specimen Requirements:
1. Tension
3
F ig ~ IV- 3 rORSION ES'ri G APPARATUS
34
Fi 0 . IV-4 BENDI G TE TI G APP R U
35
a. rhe central portion of the length is
usually of smaller cross section than
the end portions in order to cause
failure at a section where the stresses
are not affected by the gripping device.
b. The specimen must be symmetrical with
respect to the longitudinal axis through
out its length in order to avoid bending
during application of the load.
2. Compression:
a. Compressive specimemare li~ited to such
a length that colu~n action is not a
factor.
b. In order to get uniformly distributed
stresses over the cross section, the
ends of the specimen must be flat and
normal to the longitudinal axis of the
specimen. It is necessary to put a
good lubricant between the compression
plates and the ends of the specimen to
prevent the development of shear stresses
which will disrupt the assumed uniform
normal stress distribution.
). rorsion:
a. In order to prevent the occurrance of
complicated stress distributions, speci
men of circular cross section were used.
b. The specimen must be symmetrical with
respect to the longitudinal axis through
out its len::th.
'-~. Bend.ing:
a. The beam under test ~ust be so propor
tioned that it will not fall in shear
or by lateral deflection before it
reaches its ultimate flexural stren~th.
To prevent a shear failure, the
specimen must not be too short with
respect to the beam depth. The test
specimen were made ln acco~dance with
AS'-rT{~ designation: E lh-39.
b. For results 1_n 1vhich the measured per
formance is independent of the thickness
of the specimen, rectangular specimens
1-1ith -r,•ridths at least one and one-half
times the thickness must be used. The
edges must be smoothed such that
local1Zefl fracture will not take place.
D. Proc ed11re ~
1. Tension Test"
Using a 2-inch punch, two points, symmetrical
with respect to the specimen center, were
made, and the dial gage mounted in position.
The specimen, and dial gage, were then
37
mounted in the testin:; machlne, and a check
made to see that ~he ga~e and gripping de
vices functioned properly. Making sure that
the testing machine initially registered zero
load, the tension test was performed by
measuring and documenting the diameter of
the mid-point of the specimen, the specimen
elonzation as recorded on the ~ial gage, and
the corresponding machine load. This pro
cedure was repeated. at predetermined load.
increments until fracture of the specimen.
2. Compression Test~
Before testing, the en~s of the speciwen
and the face of the bearing plates were
cleaned with acetone and then coated with
graphite. Next, the strain indicator was
balanced and its initial reading recor~ed.
r·he diameter of the specimen and correspond
i~g strain at increasing loads were recorded.
The aliznm.ent and centering of the heads of
the testing machine, the bearing plates, and
the axis of the specimen were preserved
throughout the test.
3. rorsion Test,
Before testing, the gripping device of the
torsion testing machine was cleaned and then
the specimen and angular measurement device
38
mounte1. Doth the ~orque and an~ular
meo<n:.rer.:1Gnt device TJC?re zcroen and 0hecked
to sec that they were functioninG properly.
~he specimen ~ia~eter, D~~le of twist 9,
[.uv:l :nasni-t·uce of :~orque for predetermined
incTernents of torque w8re recorded.
4. 3endin~ ~est,
In orclcr to prod.uce pure benrlin:;, tv·ro
hard-mat crlal rol1ers \·'rere set at equStl dis-
-;·~as 111oun.ter.l on th8sc '~No rollers, and a con-
csnt.rated loa.(l, suppli~0 by t~1e CO'";'lp:resslon
machine, applie~ at the center of the top,
as sho1·v-n in :Pi cure IV-'+. I'he strain ea3es
located on the top and bottom sides of the
beam ar6 connected to individual channels of
the switching and balancing unit. Before
testins,hoth channels were balanced an~ the
i~itial readings recorded. A loan was
applied to the beam and held constant. 1he
strain 1n~icator was balanced and a new
stra1.n readtng obtained from both the tension
and compression cages. This process was
continued at predetermined load increments.
39
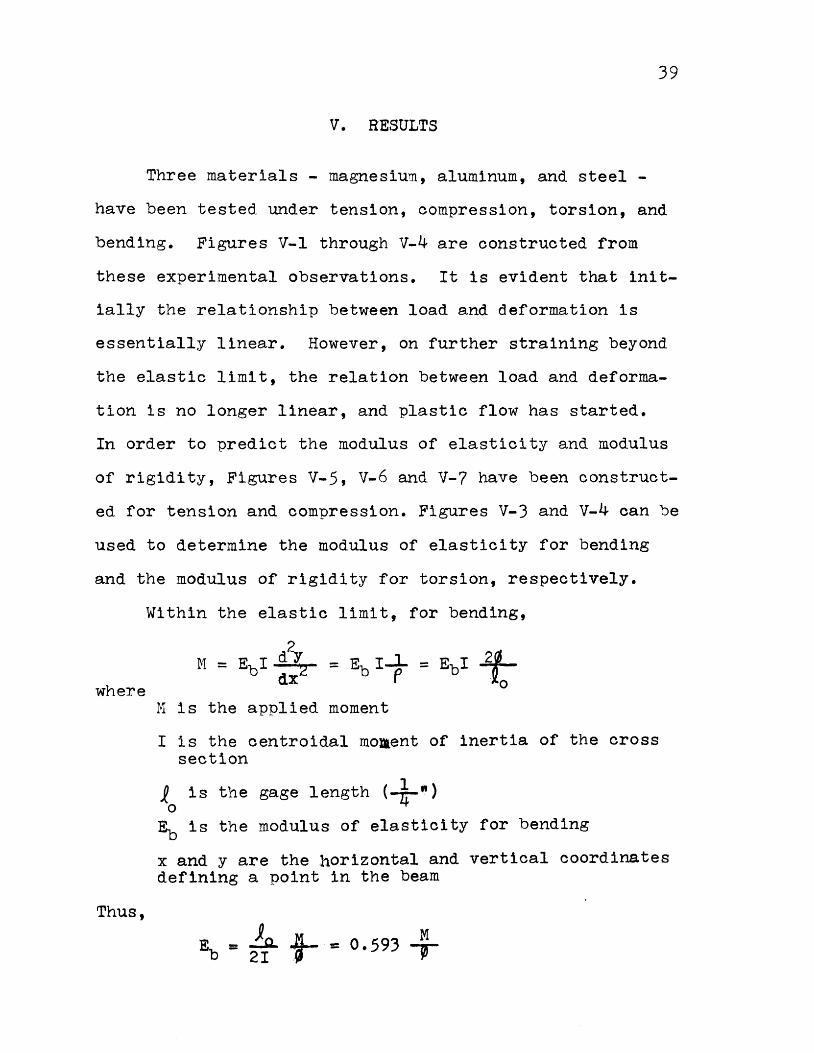
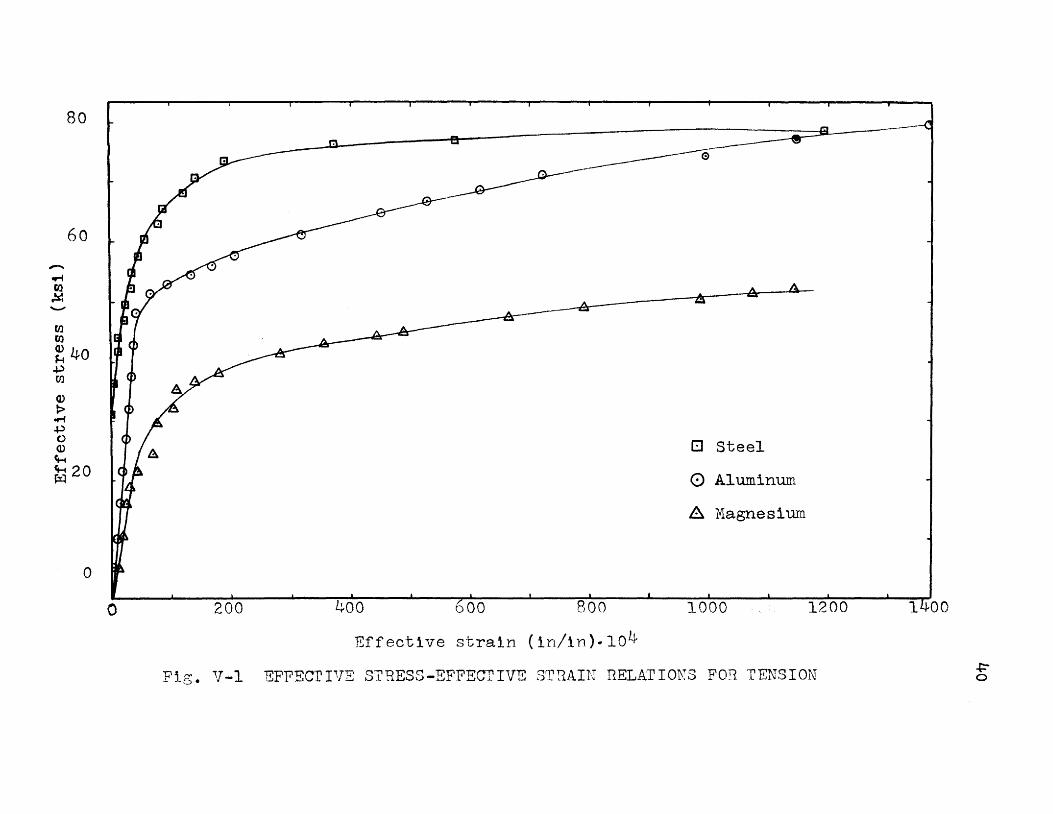
V. RESULTS
Three materials - magnesium, aluminum, and steel -
have been tested under tension, compression, torsion, and
bending. Figures V-1 through V-4 are constructed from
these experimental observations. It is evident that init-
ially the relationship between load and deformation is
essentially linear. However, on further straining beyond
the elastic limit, the relation between load and deforma
tion is no longer linear, and plastic flow has started.
In order to predict the modulus of elasticity and modulus
of rigidity, Figures V-5, V-6 and V-7 have been construct
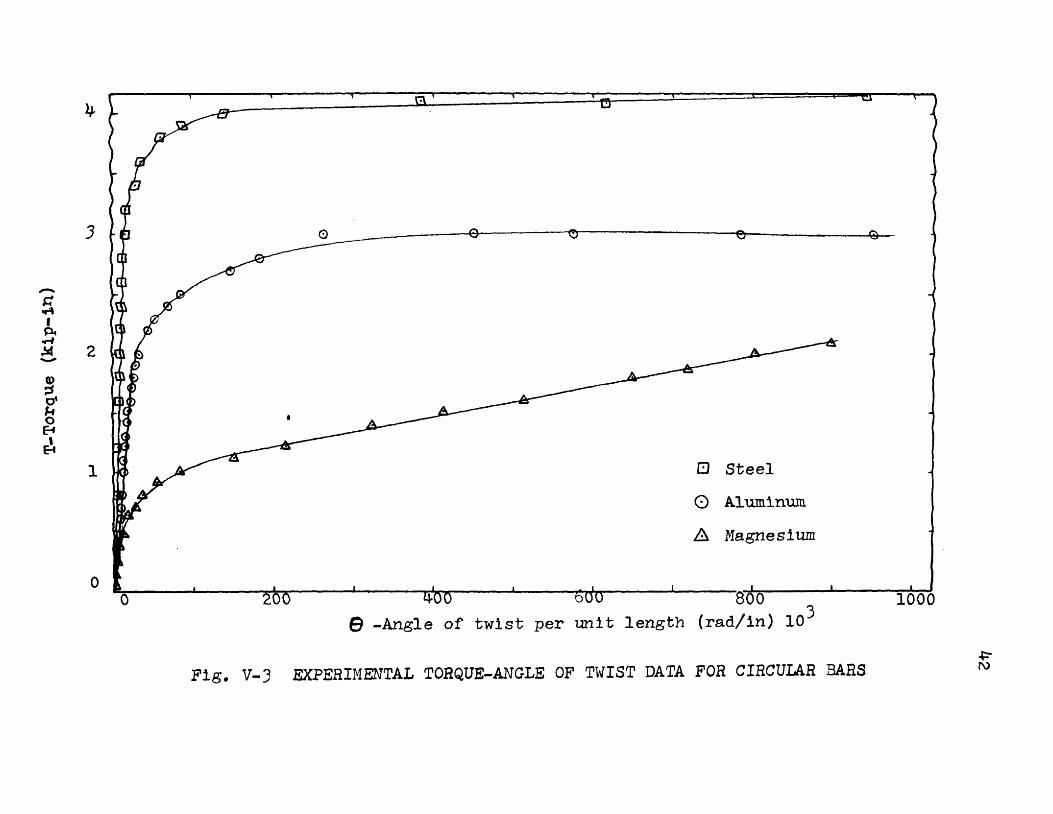
ed for tension and compression. Figures V-3 and V-4 can be
used to determine the modulus of elasticity for bending
and the modulus of rigidity for torsion, respectively.
where
Thus,
Within the elastic limit, for bending,
M is the applied moment
I is the centroidal moment of inertia of the cross section
10
is the gage length (-h-"l ~ is the modulus of elasticity for bending
x and y are the horizontal and vertical coordinates defining a point in the beam
E = ~ t- = 0.593 ~ b 2I . 'P
-..... fJl ~ -(J.l
en
80
60
~ 40 +' (I)
G)
:> ..... +' () Q)
~ ft-t 2 0 ~
0
0 200 400 oOO 800
Effective strain (in/in)-104
El Steel
0 Aluminum
8 Magnesium
1000 1200
Fig. V-1 EFFECriVE STRESS-EFFEGriVE STl1AilJ llELATIOKS FOR TENSION
1400
+=" 0

-.,-4 (1J
~ .........
Cll til G) J.t ..p fll ., t>
.,-4
..p C) G>
"" ft..t f%1
70
60
40
20 ... -
0 0
0 Steel
0 Aluminum
A Magnesium
8 8 5 Effective strain {in/in)
Fig. V-2 EFFECTIVE STRESS-EFFECTIVE STRAIN RELATIONS FOR COMPRESSION -+="' J--1
-a or!\ I P-4 .,...,.
.!14 ..._,
CD ~ o' J-1 0 8
~
},J.
3
2
1
0
~A~ EJ Steel
0 Aluminum.
8 Magnesium
0--- - - 200 4-00 bOO '8"00
e -Angle of twist per unit length (rad/in) 103
Fig. V-3 EXPERIMENTAL TORQUE-ANGLE OF TWIST DATA FOR CIRCULAR BARS
1000
~ l\)

-s:: oM I
p,. ...... ~ -.p
~ a 0 ~
I :e:
30
22
18
12
- ---EJ Steel
0 Aluminum .. . ,---6_
A Hagnesium
0~--~--~--~--~--~--~--~--~----~--~--~--~--~--~--~----0 22.5 45.0 3
Curvature (rad.) 12 x 10 6?.5 90.0
Fig. V-4 HOiviENT-CURVATURE DATA FOR BENDING +=" VJ
" ..... fl.l ~ ........,
Ol Ol Q)
k .f.) fiJ
~ ..... ,., Q) Q)
s::· .....
a
50
40
30
20
10
0 0 5 10 1.5
/ /
/
/
/ /
/
A"
/
/. /
/
/
/ /
/
// /""' 0
6 0 Tension (Et = 10.6 x 10 psi)
// /
~ Compression (E0 = 10.7 x 10⁶ psi)
Bending (Eb = 10.9 x 10⁶ psi)
(See Fig. V-4 for data)
20 25 30 35 4 Engineering strain (in/in) 10
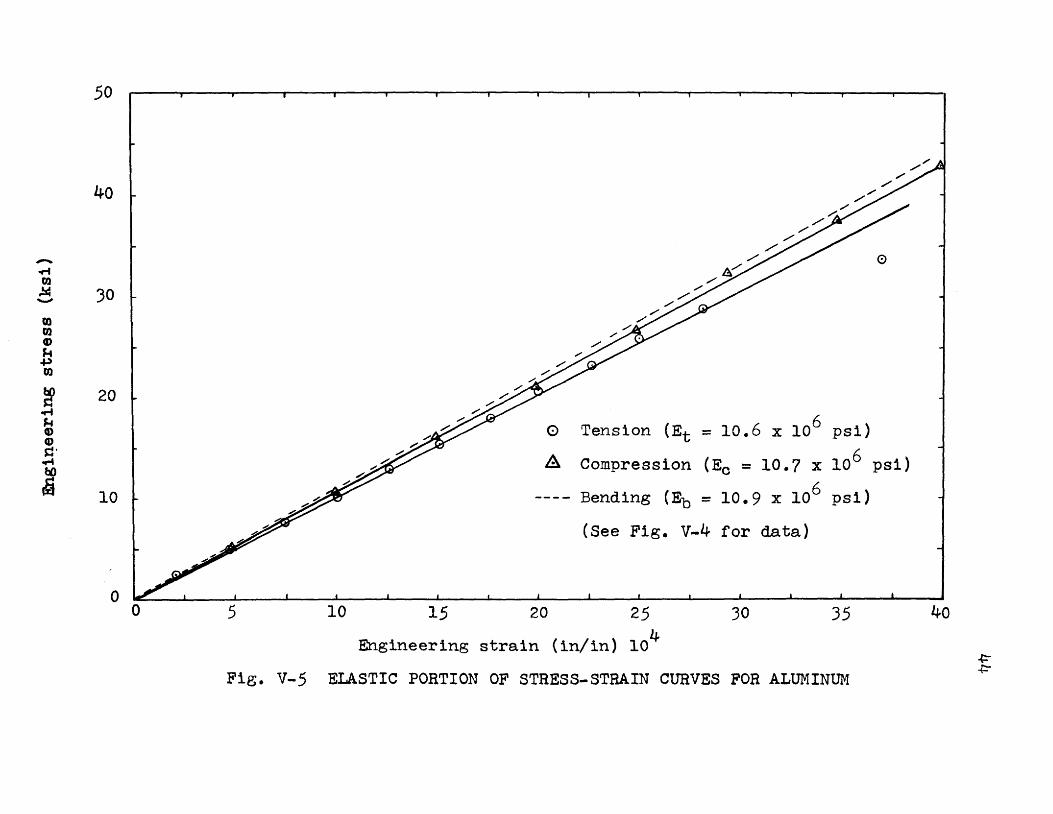
Fig. V-5 ELASTIC PORTION OF STRESS-STRAIN CURVES FOR ALUMINUM
40
~ +:-

"' ..... Ul ,!4 -
CD Ul G)
b l7J
t() ~ ..... ~ Q) .s a
20
16
12
8
4
/
/ /
/ /
/ / A
/ /
/
/ /
/
/
/ /
/
0
8
/ /
/ /
/ /
/
/ /
/ /
/
/ /
/ /
/
Tension (Et = 6.27 x 10⁶ psi) 6 Compression (E0 = 6.25 x 10 psi)
6 Bending (Eb = 6.8 x 10 psi)
(See Fig. V-4 for data)
12 16 2R 24 Engineering strain (in/in) 10
Fig. V-6 ELASTIC PORTION OF STRESS-STRAIN CURVES FOR ~~GNESIUM
32 i="
\..}'\

30
25
-.-4 til 20 ~ -tfl tfl CD ~
-1-) ~5 tfl
b01 ~ .-4 ~ (I)
~ ll() ...... bO
Gi $
0 0 20
/
40
/ , /
/ /
/ /
/ /
/ /
/
/
/ /
"::' /
/
/ /
""' /
/ /
/ /
/ ./
/
0 JY/
6 0 Tension (Et=30.6 x 10 psi)
6 A Compression (Ec=29 x 10 psi)
60
6 Bending (Eb=28.5 x 10 psi)
(See Fig. V-4 for data)
80 100
Engineering strain (in/in) 105
Fig. V-7 ELASTIC PORTION OF STRESS-STRAIN CURVES FOR STEEL ~ 0\
47
Hence the slope of the straight line portion of the M
'rersus f/J curve, multiplied by the constant 0.593, gives
the desired modulus, Eb.
Similarly, for torsion,
(V-3)
where IP is the polar moment of inertia of the circular
cross section.
of the T versus
Thus, the slope of the straight line section
e curve, multiplied by the factor 1/IP,
gives a value for the modulus of rigidity, G.
It is evident that the magnesium tensile specimens
(right · specimens in Figures V-8 and V-9) fractured along
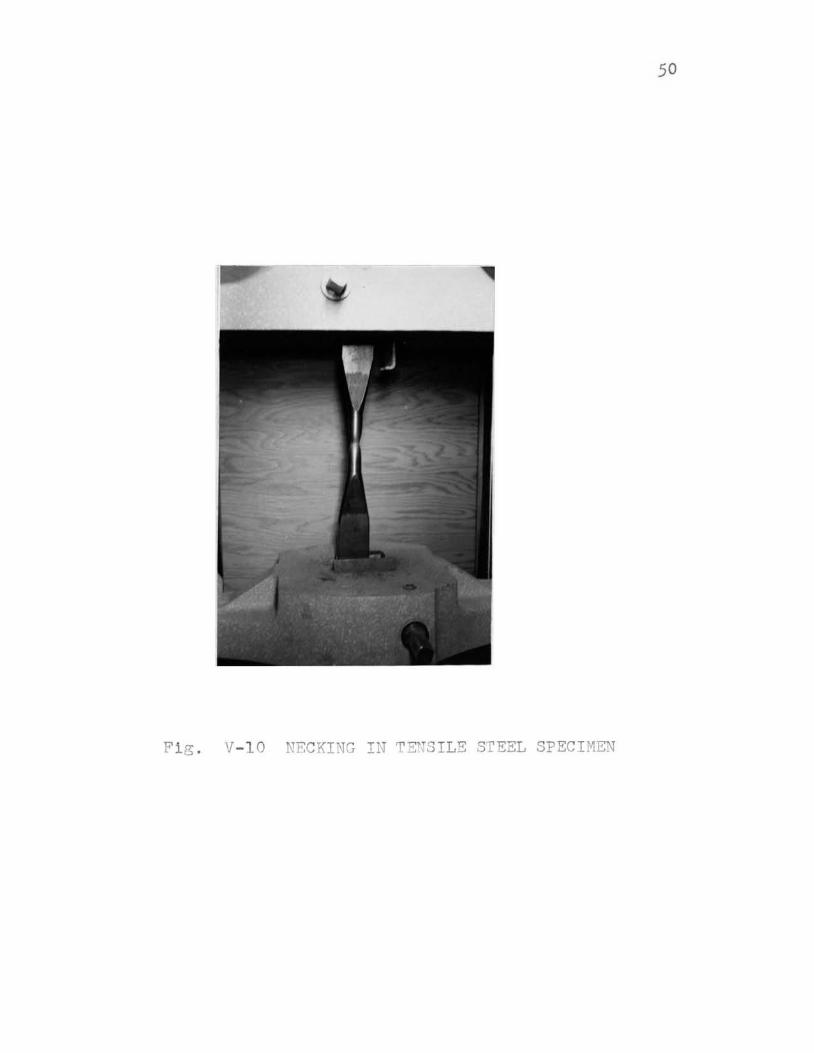
a 45° plane, which is indicative of a shear fracture. Fig
ure V-10 shows that a tensile steel specimen will neck down
locally before fracture. The stress distribution over the
smallest section of the neck is no longer uniaxial, but tr1-
axial. So once necking down occurs, the stress-strain dia-
gram has no meaning for simple tension.
The general types of observations and records of test
in torsion are similar to those of tension and compression.
However, the resulting shear fracture is quite distinct from
either the tension or compression fracture. A solid rod of
magnesium that fails during a torsion test will break along
a plane normal to the axis of the rod, as shown in the center
specimen of Figure V-11. For the steel bar (specimen on the
left in Figure V-11), the fracture is silky in texture, and
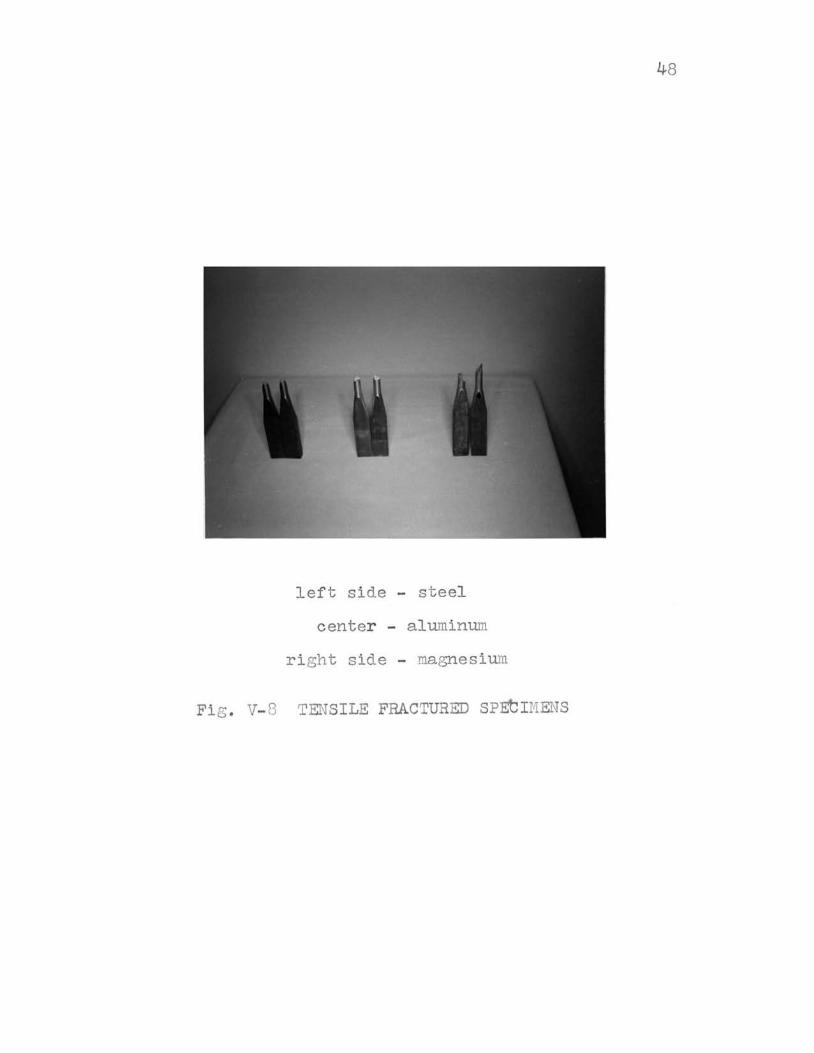
left side - steel
center - aluminum
right side - magnesium
Fig. V- 8 TENSILE FRACTURED SPEtiHENS
48
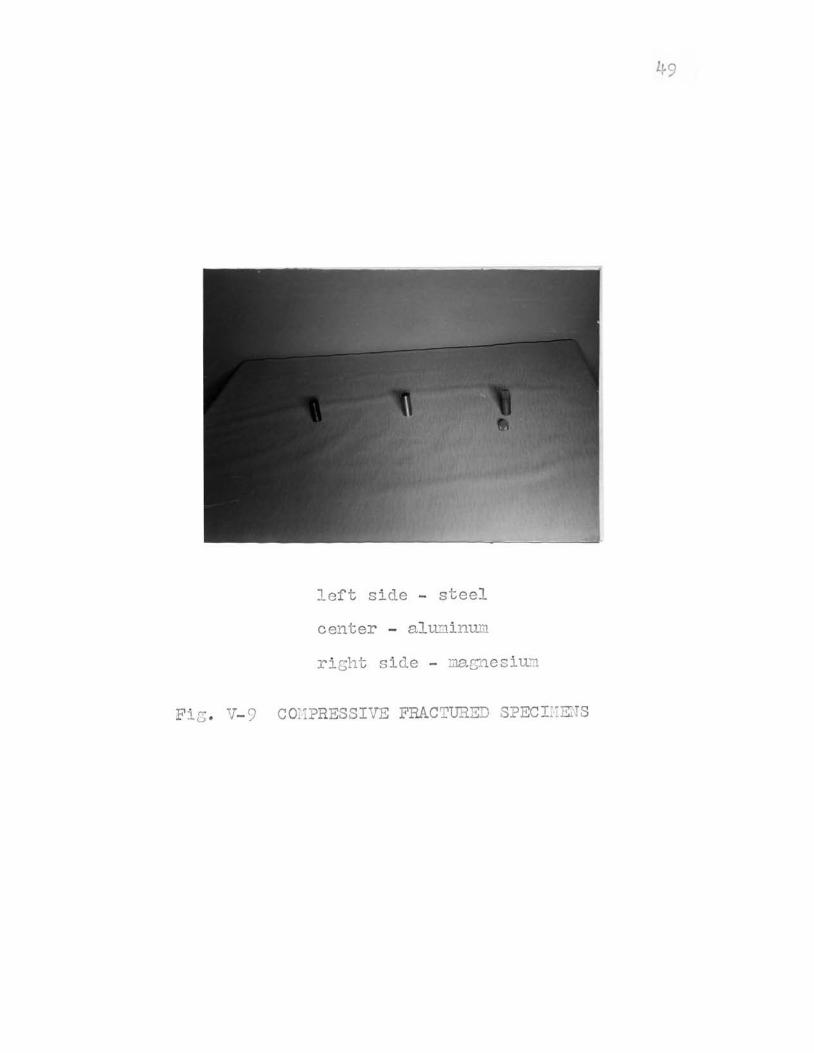
left side - steel
center - aluni num
right side - ma~~esium
FiG . V- 9 COHPRESSIVE FRACTURED SPECII1Ei·JS
50
Fi g . V-1 0 TF.CKING IN TE, SILE S EEL SPECIM~

Fie; . V-1
left s e - steel
center - magnesium
right side - a uminum
L'OR IOJ FRAGrURED PECIME S
51
52
the axis about which the final twisting takes place can be
seen. Since the surface of the break may not be quite
smooth, the outer portions, acting like cams, push the piece
apart in the direction of its longitudinal axis. The center
portion of the specimen that is not yet broken by shear is
possibly broken in tension by this cam action.
Elastic stress-strain diagrams for the three different
materials are obtained from various loading conditions and
are shown in Figures V-5, V-6 and V-7. For aluminum, the
modulus of elasticity in bending is reasonably close to that
in tension. However, for magnesium and steel, the modulus
of elasticity in flexure tends to be slightly below those for
tension and compression. Since some error is involved in
setting up the bending test, slight amounts of shear can be
present which will induce shearing strains, thereby causing
an increase in the observed strain over that due to fiber
strains alone.
Substituting the values of the moduli of elasticity and
rigidity into the equation
E G = -2-=-( 1-+-/A.~)
Poisson's ratio for all three materials can be found. The
results are shown in Table V-1.

53
material Hagnesium Aluminum Steel
Poisson ratio
J1 max 0.485 0.378 0.404
A min 0.365 0.352 0.307
Table V-1 ELASTIC VALUES OF POISSON'S RATIO
From this table, it can be seen that in the elastic range,
2o1sson•s ratio is always below one half.
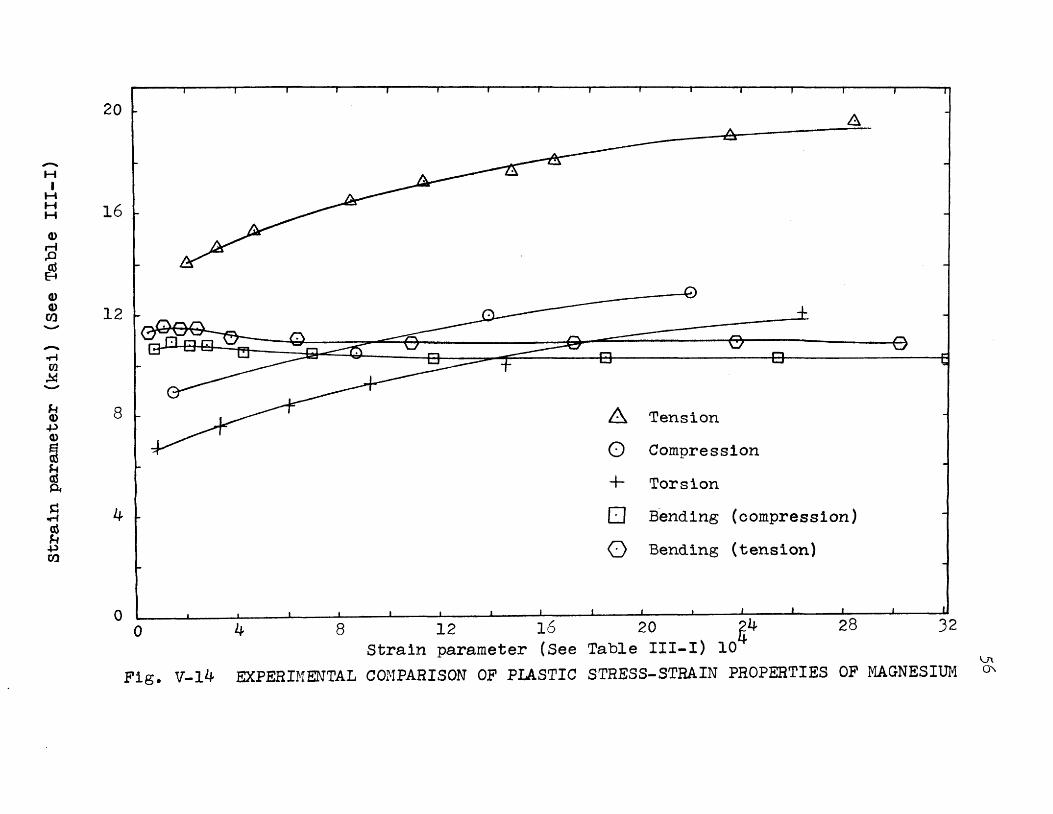
The stress diagrams shown in Figures V-12, V-13 and .
V-14 are constructed according to the stress and strain
parameters shown in Table III-1. A sample proble~, showing
how these stress-strain curves are constructed, is presented,
with discussion, in Appendix I. From these stress-strain
diagrams, it is seen that the torsion tests produce a dis
tinctively different curve (especially for the soft materials
aluminum and magnesium). The reason for this is that in
simple torsion, the principal axes of stress and strain do
rotate relative to the element during the loading process.
A more complete discussion of this is given in the next
section. Another explanation is that the center portion of
a cylinder of originally soft ductile metal, after it has
been subjected to a plastic torque, is permanently strained

-r-i I
H H H
<D r-i ,D m
8
<D Q)
Cll --.,..., ttl ~ -F-f Q) _,_, Q) a F-f m A
s::: .,..., oS F-f +> fJ)
100
80
60 1- . ---------- 0
a(i)=€fii.a + +
ld' ~+' ~ A Tension
40 p-r.l' 0 Compression
I + Torsion
J D Bending (compression)
20 ~ () Bending (tension)
0 100 200 300 400 500 600 700 800
Strain parameter (See Table III-I) (in/in) x 104
Fi~. V-12 EXPERIT,IE!JTAL COHPARISON OF PlASTIC STRESS-STRAIN PROPERTIES OF ALUI\1INUI-1 V'\ .{:'-

-100 oM (f.)
~ --r-l I
H 80 H H
Q)
r-l ,D m 8 (1) 60 (l) (/') -H (1) .p (1)
s ~ hO H ~ p.
(f.) (f.) (1)
H .p (I) 20
co 20
8 Tension
0 Compression
+ Torsion
8 Bending (compression}
()Bending (tension)
~0 bO Rn 100 1~0
Strain parameter (See fable III-1) (in/iD) x
F1 rr V-13 Ti'"'rn'P.ni,.·"'E~fT'/\L ,..,o~.';P""li~O"·~ Qf•' pT."'~)T'..,..L(1 ·":'>·'"D"7C;";-S,DIIJ··.r "PT')()"C'~"{T'I"'i'S OT;l "':'.,.,~T.i'T w• ,_J..._·:-r:-"_1.. J..lJl\:-.t'\ '-.I t_._i..l..-- _, ...... _._~l _ ...., . --~_ .. ~..._ ... _ 1.'-\. ... . L _. J.._j ••.• · • ) __ :._J --~
\)'\
\....1'\
-H I
H H H
Q)
:a ~ Q) Q) Cll --.,-i {Jl
~ -J...t Q)
-1-) Q)
~ J...t as A
~ .,.., as J...t +l Cll
20
16
12
8 ~
~~
' 4 ~
' 0
0
Fig. V-14
8
.~· 6 Tension
0 Compression
+ Torsion
D B~nding (compression)
0 Bending (tension)
4 8 12 16 20 44 28 32 Strain parameter (See Table III-I) 10
EXPERIMENTAL CONPARISON OF PlASTIC STRESS-STRAIN PROPERTIES OF NAGNESIUH \....1'\ ()".
57
in the axial direction. Thus the assumed distribution of
shearing stresses does not represent the complete system of
stresses since a system of secondary normal stresses occur
ring in the axial, and possibly also in the radial and
tangential directions, must be present. For this reason,
the effective strain equation (III-13) will not be satis
fied with the actual large deformation of the torsional
specimen.
The stress-strain diagrams in compression always appear
below those determined from tension tests. The reason for
this is that lateral expansion at the end of the specimen
is prevented by the friction force that exists on the sur
faces of contact between the specimen and the bearing plates,
thereby causing a complicated non-uniform stress distribu
tion. When this occurs, the total plastic work done by the
triaxial stresses are greater than that due to the axial
stress alone. In tension, if the specimen satisfies the
requirements mentioned in section IV-C, the stress distri
bution is always considered uniaxial until necking down
occurs.
58
VI S~1MARY AND CONCLUSIONS
This study shows that with the appropriate selection
of stress and strain related parameters the stress-strain
curves obtained from a single material subjected to tension,
compression, torsion and bending loads coincide. Further,
the stress-strain diagrams obtained from experimental ob
servation are presented 1and these diagrams show the relative
agreement for magnesium, aluminum and steel.
With the exception of the torsional loads, the stress
strain diagrams constructed from the various loading tests
show relatively little deviation for steel and aluminum
materials. The discrepancy in the torsion test results is
to be expected since the effective strain ~quation used in
this analysis is only valid if the following two conditions
are satisfied: {1) the ·orincipal axes of stress and strain
for a particle do not rotate with respect to the particle
during the process of straining; and, (2) the strain
increments are proportional to the total strains. Since
the torsion of a circular bar does not satisfy these con
ditions, the experimental results will show some deviation
from the expected curve. A more appropriate torsional
analysis can be made by utilizing the incremental effect
ive strain equation1 • Ho"t~ever, the results of this analysis
are valuable in that the magnitude of the error involved in
assuming the validity of equation (III-13) for torsion
problems is not fully discussed in the literature.
59
The stress-strain diagrams constructed from the
various load tests for magnesium have very little re
semblance. This was suspected at the outset of this
program since the handbook data for magnesium indicates
that it's tensile and compressive properties are different.
Magnesium was purposely selected to illustrate the care
that must be exercised in applying the simplified equations
of plasticity to all materials.
In making a more critical review of the results achieved
for the steel and aluminum, it is seen that the aluminum
stress-strain data gives the closest correlation. Using
the extent of strain as measured in a tensile test as an in
dex of ductility, it appears, from the results of this study,
that the materials that exhibit the greatest ductility are
most likely to satisfy the simplified laws of plasticity
previously presented.
Tensile tests are generally used as the basis of design
regardless of the nature of loading or state of stress in the
structure. Fortunately, \-the tensile stress-strain curves
are always in the highest position (see Figures V-12, V-13,
and V-14). Thus1 if an engineer uses tensile stress-strain
data for all design work, there is a degree of assurance
that this will be a conservative design •.
60
REFERENCES
1. P. B. Hell or and H. uohnson. Plasticity for l~!echanical Engineers. D. Van Nostrand Company,--rtd., Ne't·J York: 1962.
2. P. 1:1. Bridgman. Large Plastic Flow and Fracture. HcGrawHill Book Company, Ne1-.r York: 'i932.
J. Hugh Ford. Advanced Nechanics of ~Iaterials. Wiley and Sons, Inc., NeN York: 19SJ.
John
1.
2.
3.
SELECTED BIBLIOGRAPriT
A. Nadai~ Theor~ of Flow ~ Fracture £! Solids, Vol. 1. ~IcGraw-fiiT Book Company, Inc, New York: 1950.
P. B. ~!ellor and Ttl. Johnson. Plasticity for r1echanioal En~ineers. D. Van Nostrand Company,-rtd, New York: l9 2.
Hugh Ford. Advanced Nechanics of Haterials. and Sons, Inc., Ne~r York: -r9;.JJ.
John vliley
4. R. Hill. ~ Hathematical Theor;z of Plasticitl,• Oxford University Press, New York: 19)0.
5. Hoffman and Sachs. Theorl of Plasticitu. HcGraw-Hill Book Company, Inc., New York: 1953.

62
vrrA
The author of this thesis, Wen-mo Chen, son of Mr.
and Mrs. Mou-lin Chen,was born on June 20, 1939, at Yin-ko,
'raipei shen, TaiTN"an, Free China.
The author graduated from the Civil Engineerins
Department of Provincial Cheng Rune; University in 19'SJ.
After he received the B. s. dec;ree, he ser,red 1.11 the Chinese
Army for one year.
After leaving the Chinese Army, he stud.iefl Applier1
Mechanics at the Graduate School of Engineering, Colle3e
of Chinese Culture, for one year, and then transferefl to
the Department of Engineerinr; Mechanics, University of
Missouri at Rolla, for continued graduate study, in
September, 1965.
APPIDIDIX I
SANPLE RESULrS
As indicated earlier, in order to an3.lyzc ':.:1·; -:--~19.-
tive agreement of the stress-strain properties obtained
from basically different experi~ental tests of a given
materi9.l, some appropriate stre:3s anr1 stra:t·'l related parg,-
meters shoul·1 be selected and the correspondi~1.g dia.:ra~ns
constructed from experimental observations. These dia-
:;rams have been mentionec1 and cliscusse(l 1~1 previous
sections. Here, the aluminum specimeG is taken as an
example to sho't~J how these stress-strain ClJrvcs ~>Jere con-
structed for various loading conditions-tension, CO!n.pre~3-
sion, torsion and bending.
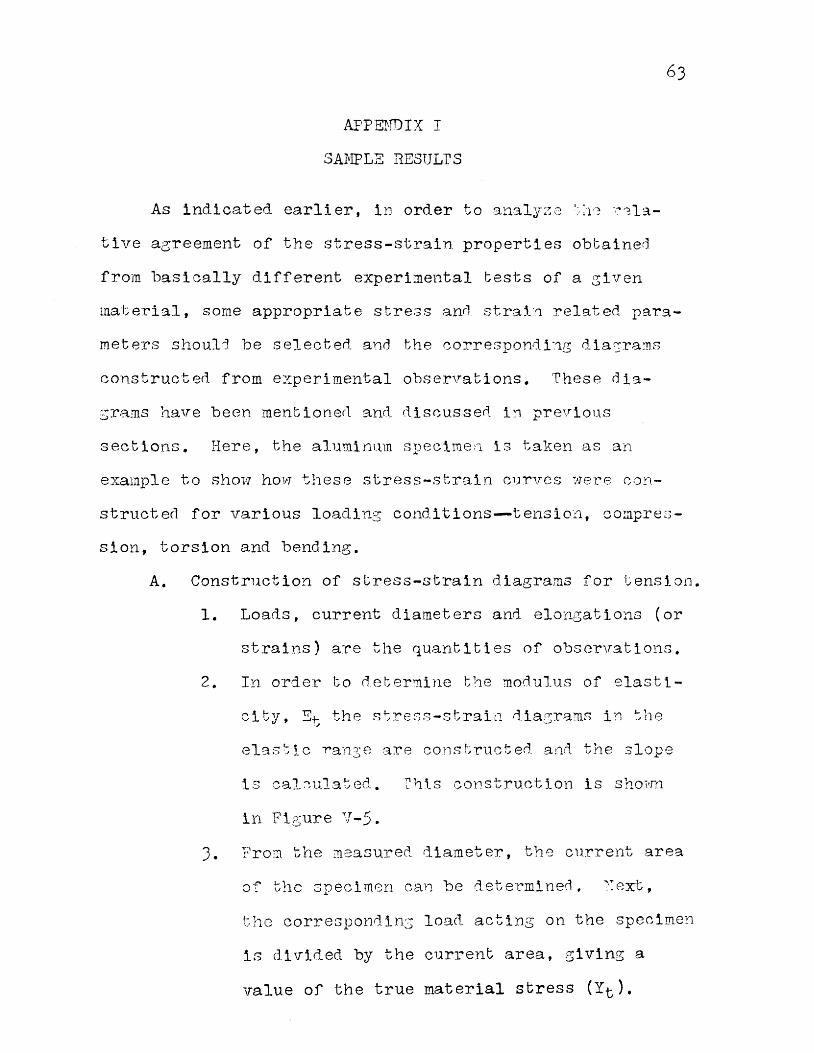
A. Const~1ction of stress-strain diagrams for tension.
1. Loads, current diameters and elongations (or
strains) are the quantities of observations.
2. In order to cle~ermine the modu1us of elastt-
city, S.t- the stres.s-strail1 dia(';rams in ~he .~
elas~ic ~an3e are constructed an~ the slope
is ca1.~u1ated. I'hts c.onstruction is shoi•rn
i 1" vi ·:)· ur e 'l- ~ -~ .l !~ • 1 _, •
). Pron the ::neasurefl~ diameter, the current area
of the specimen can be determine~. ~ext,
the correspon~lns load acting on the specimen
is divided by the current area, giving a
value of the true material stress (Yt)•
64
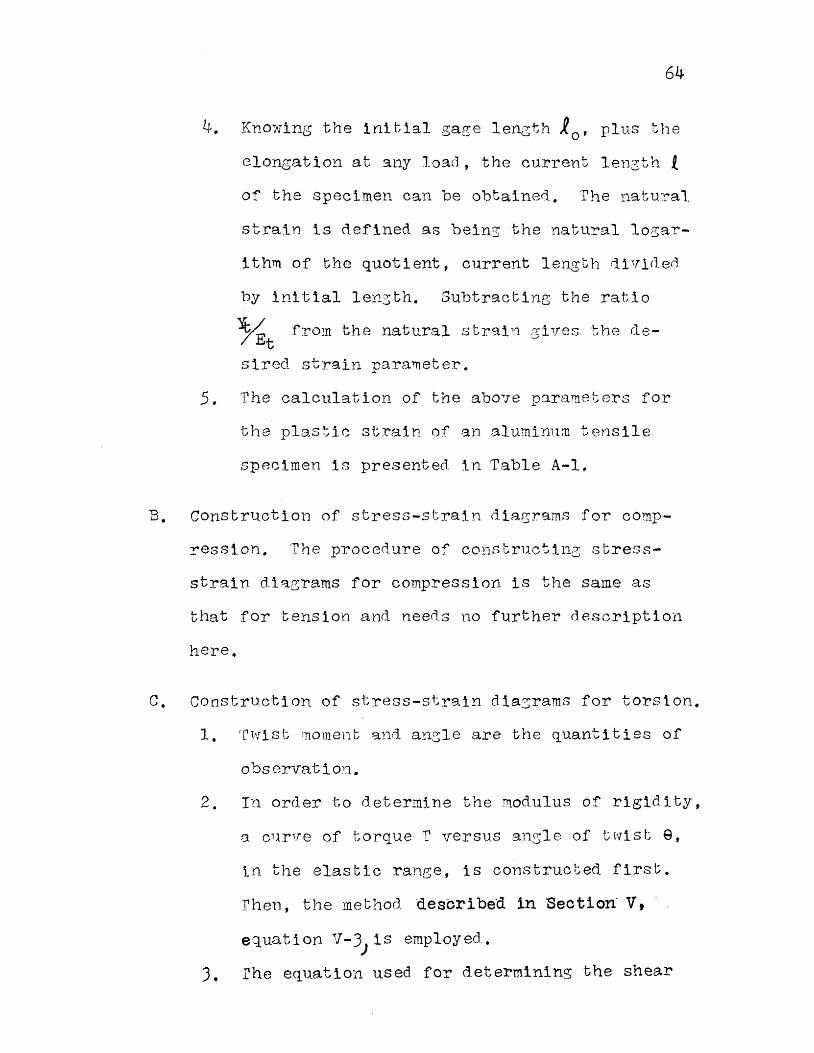
4. Knowing the initial gage len3th 10
, plus the
elongation at any load, the current length L
of the specimen can be obtained. The natu~al
strain is defined as being the natural lo~ar-
ithrn of the quotient, current length 'iividen
by initial len3th. Subtracting the ratio
X from the natural strg1n c;ives the de
sired strain parameter.
5. The calculation of the above para~eters for
the plastic strain of an aluminum tensile
specimen is presented in Table A-1.
B. Construction of stress-strain diagrams for comp-
ression. The procedure of constructinc; stress-
strain diagrams for compression is the same as
that for tension and needs no further description
here.
c. Construction of stress-strain dia~rams for torsion.
1. 'C1.v-1st moment 9-nd anGle are the quantities of
o bs ervat 1 OYl.
2. In order to determine the modulus of rigidity,
a cu.rve of torque T versus angle of tt'fist 9,
in the elastic range, is constructed first.
rhen, the method described in Section· V,
equation V-JJ is employed.
J. rhe equation used for determining the shear
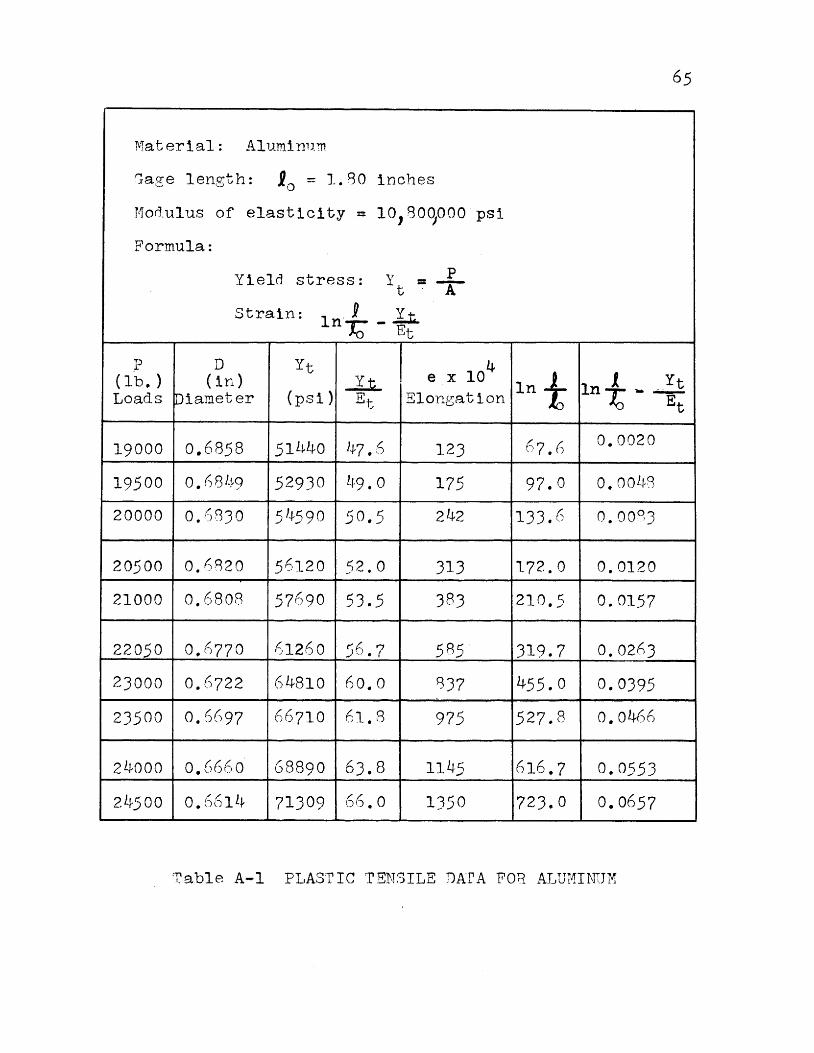
1\Taterial: Alumin,J.m
Sage length: Ro -- 1.80 inches
Hod.ulus of elasticity = 1o,soqooo psi
Formula:
Yield stress: y p t =-x-
Strain: 1n· J - ;t -r; ~t
p D Yt 104 (lb. ) (in) ....ll. e X lni ~ Yt lnJ;; ~ ...._ Loads Diameter (psi) j41 Elongation Et .;..Jt
19000 0.6858 51440 l.J-7. 6 123 67.() 0.0020
19500 0. () 81.~9 52930 h9. 0 175 97.0 o.oo'-f-8
20000 o.r5830 511-5 9 0 .50. s 242 133.6 0.00~3
20500 0.6820 56120 .52.0 313 172.0 0.0120
21000 0.6808 57690 53.5 383 210.5 0.0157
22050 O.h770 61260 c'? 7 .) ,) . 5R5 319.7 0.02h3
23000 0.6722 64810 6o.o 837 455.0 0.0395
23500 0.6097 66710 61.8 975 527.8 0. 0466
24000 0. 666 0 68890 63.8 114-5 616.7 0.0553
2L~5oo o.661l} 71309 66.0 1350 723.0 o. 0657
Table A-1 PLASTIC 'rENSILE DArA FOB ALUHINUM
66
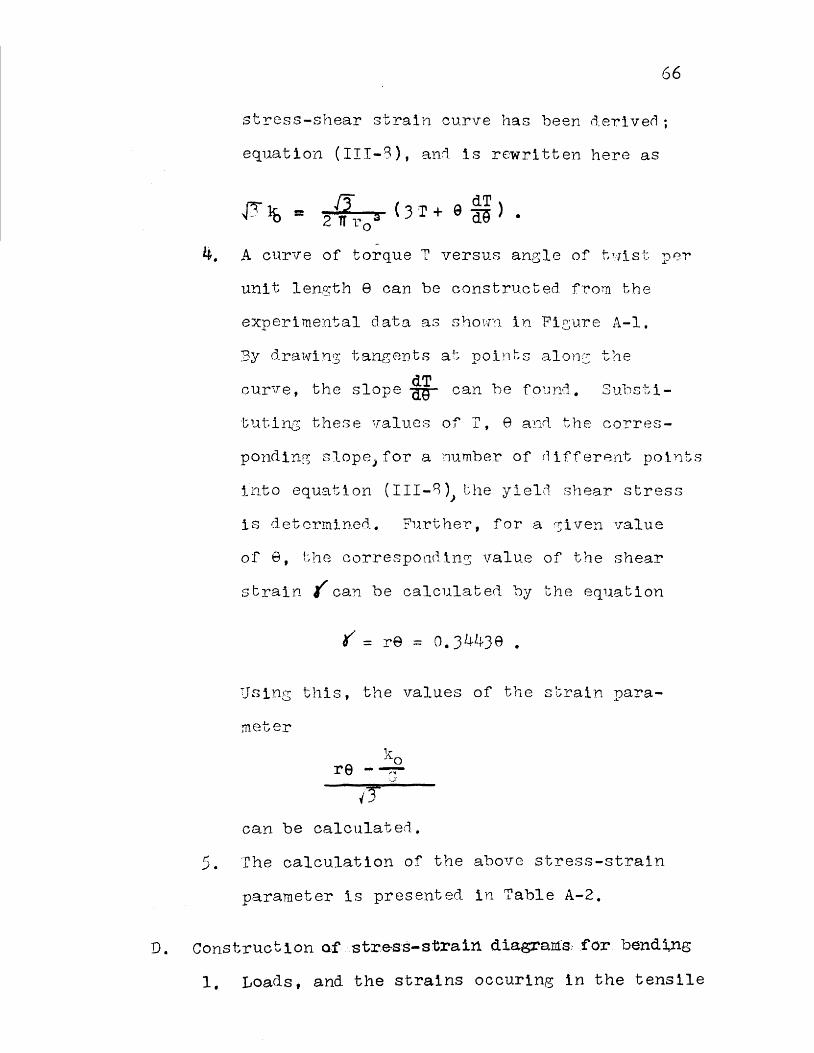
stress-shear strain curve has been ~erive~;
eq ua t 1 on ( I I I- g ) , a n:l. i s r ew r 1 t t en here as
$lf,= /lra(3T+9~). 0
4. A curve of torque r versus angle of twist per
unit length 8 can be constructed from the
experimental data as shown in Fisure A-1.
By drawing tangents at points alonz the
curve, th 1 dT h ~ e s ope a:g- can e fo~Jnu. Substi-
tutinc; these values of I', e a·•.1(l the corres-
pondinr; slope) for a number of (1 ifferent points
into equation (III-8)) the yield shear stress
is determined. Further, for a '3ive:n 7alue
of e, the correspon~tng value of the shear
strain {can be calculaten by t.he equation
( = re = O.J44J8 •
Using this, the values of the strain para-
meter
re /f
k 0
can be calculated.
5. The calculation of the above stress-strain
parameter is presented in Table A-2.
D. Construction of stres:s-strain diagrar.rfs: for bend:i,.ng
1. Loads, and the strains occuring in the tensile

0
0
0 0 0 (V"'\
'-0 P<
0 0 ..:::t C\J
0 0 <X) ......
0 0 C\1 ~
0 0 \...0
67
(1.)
(\} . 0
--.: C\l . 0
,.... ~ .,....
c ............
(\i "C . m 0 ~
..c ~ bO s:: ,, C)
r--' ,.-{ . G +.:>
or-1 ~ ~
H Q)
~ (\) ,-I ~-~ . (/)
0 .,-1 ;;
-l-.:
c.-. 0
Cf.~ c (l)
·r-1 0 tO
s:i 4!
(I) .:::r 0 . 0
0
(:) 0:' ~ j::l
.... ... .. ' 1--.... , ,:: H "'~ "':"" ,..._, 1--
....::1 <.
n: c IJ,
~ r . <l! C'l
~=--~ (.]
H ~ ~ r~
~=-0
f:J H l) ~- ~ ,:t::..
~ I
w ~ 0' o:' 0 1=-J
H ct ~-, ... , .... ~~~ H r-:: r~
~ rx:l
rl I
<
. t.) ..,.., (il
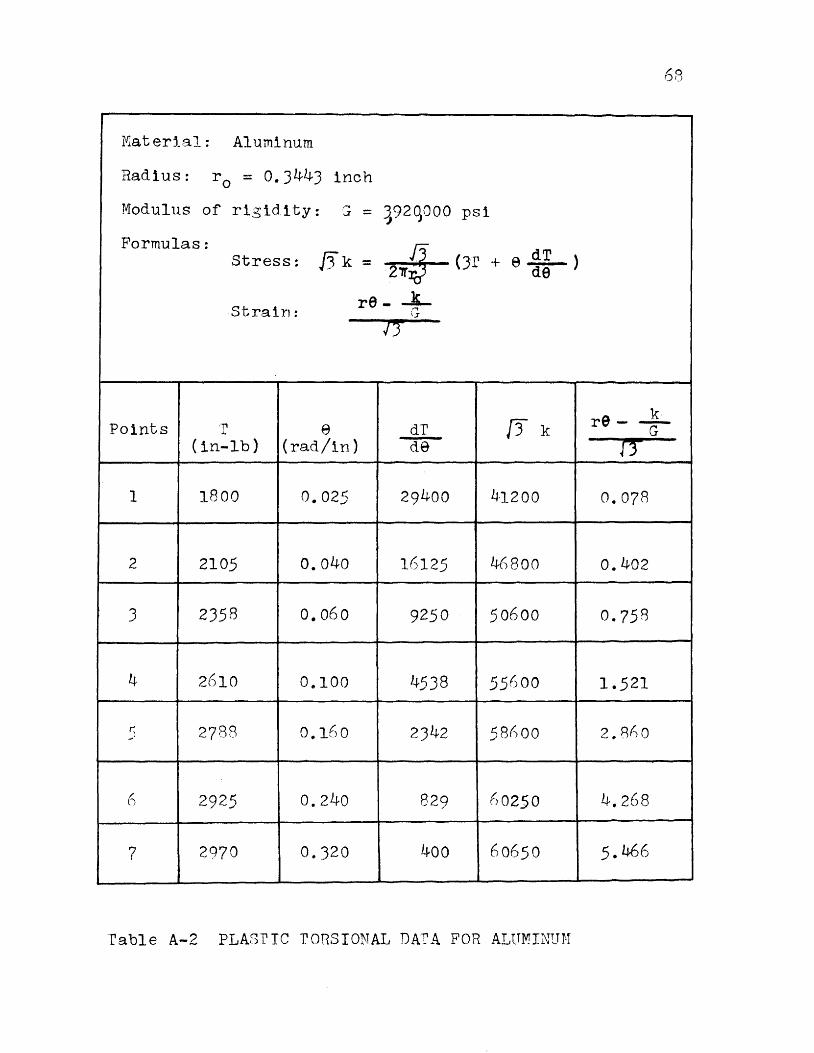
Material: Aluminum
Radius: r 0 = O.J44J inch
Modulus of rigidity: ~ = ~92qooo psi
Formulas: ./3k = ~(Jr
re- ....k...
Points
1
2
J
4
7
Stress:
Strair1:
·11 .L
(in-lb)
1800
2105
2358
2hl0
2788
2925
2970
e (rad/in)
0.025
0.040
o. 060
0.100
0.160
0.240
0.320
,,.., \_A
dT de
29400
16125
9250
4538
2)42
829
1-t-OO
/3k
q.l200
46800
50600
55600
58tSoo
h0250
60650
rable A-2 PLASriC roRSIONAL DATA FOR ALUMINUM
6R
k r9- 'G
rr 0.078
0.402
0.758
1.521
2. 8Ao
4.268
5. 466

and compresslve oide of the beam, are the
qualities of observation.
2. In order to determine the modulus of elasti-
city Eb for bendin3, an elastic curve of
moment J'.T versus curvature 0 is constructen
first, and then the method described in Sec-
tion V equati~n (V-2) is applte~.
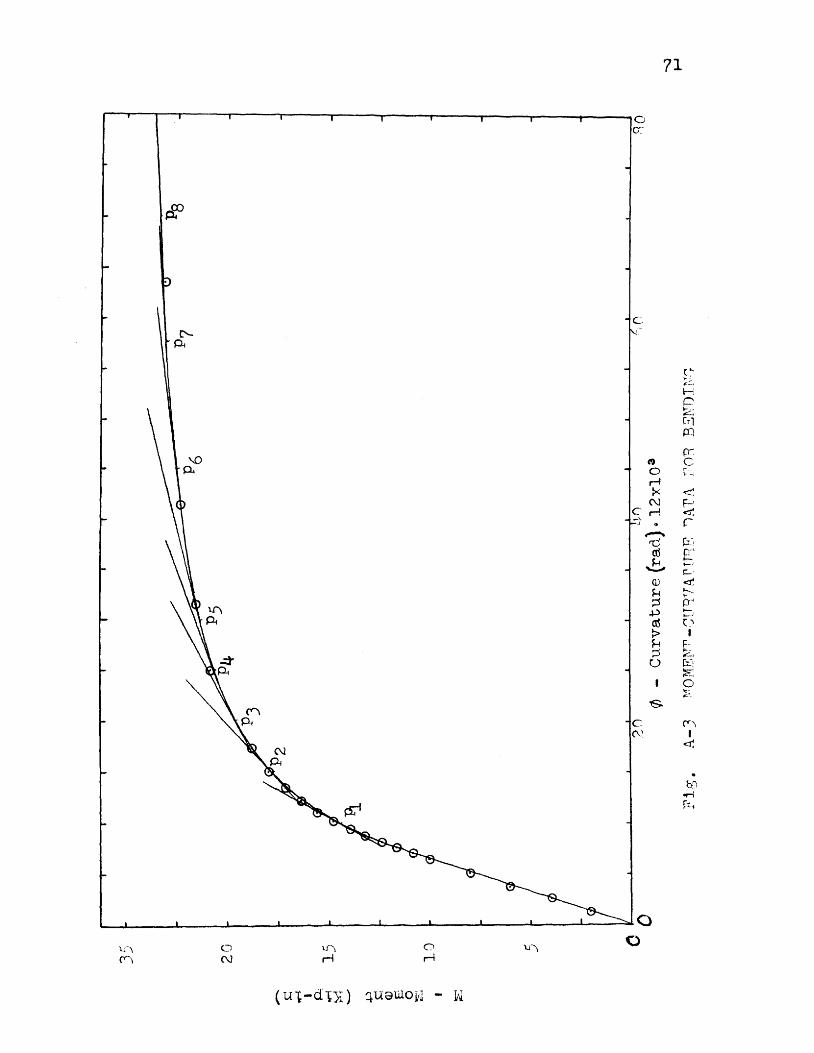
J • rr he a p p 1 :t c a "b 1 c c quat i 0 ns f 0 r rl c ~ e r:11 in 1 ng t h C!
stress-straill C11rve have b88<'1 rlc-r-i \TCrl pre-
(j;_ d ~-·-.) = v (A-1) CT"c (l€c
(A-2)
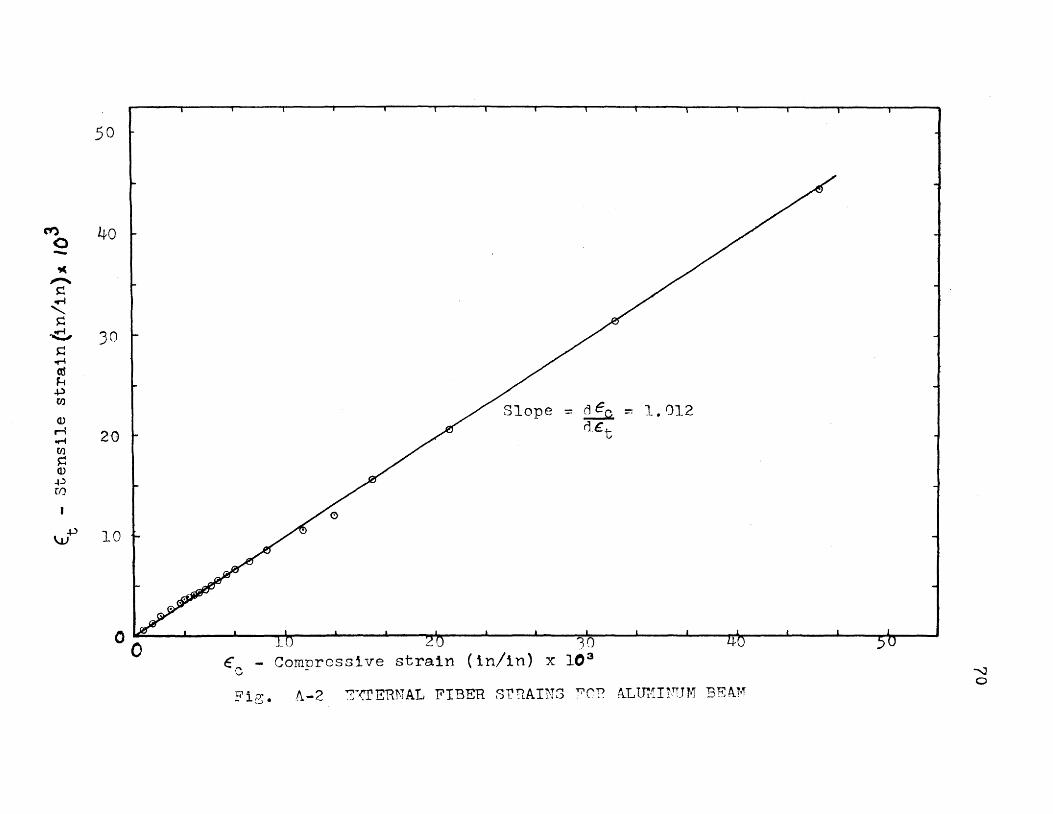
In order to find the relation be"SNeen a-t and
'b, 9. curve of €.c vers1ls Gt must be construct
ed .:J.s sho1"rn in Fic:ure A-2. 'I'h.e results of
this figure indicate that
a--f-= 1.012 o-~ • (A-3) v J
In order to establish the value of the right
sirle of equa~ion (A-2), ~ curiTe of bending
moment versus curvature must be constructe~,
which is shown in Figure A-3. By drawing
tangents at incli vidual points alent: this
curve, and substituting the values of Ivl, ¢
c-1)
0 -~ ,.,.., s:: ~
' s:: ~
s:: .n «1 F-1 4-) til
(1)
r-1 01'-4 tl)
s:: (1)
.p (/)
I
\JJ+l
50
40
30
20 l
10
~Slope = ~ = 1.012 0.~t
€c - Compressive strain (in/in) x
Fig. A-2 ~~crERNAL FIBER s-rB.AIN3 FC'? A..Llfl.~I!:rTJtlf BEA.l\1
---.J 0
71
C'-p.
(~ .. ~ t'-•
1-: c:' ~: rrl (:()
(), (') c 0 r-~,
.--4 ~ <
C\.1 f-' ,...-! <t
r ~
rC !=..:· 1:0 t' ~ t-/
~ (l) c:t, H '-,
y
~ f)' +) ...... 1:0 t) ~ I H F-;:; 1--
r~
0 r--, .... , ::8 0 >::-,_._
s c ('""\ (\) I
~
. b'l _;
r=-.
--~--~--~~--~--~----~--~--~----L---~-=~0 0
100~~~--~~--~~--~~~--~~--~~--~----
80 ('1"'\
0 r-f
>< C\l ..-i
60 -'d cd J.-4 .........
C1> ~
40 E ~ ~ 0
I
'& 20 0 Compressive strain, €c = 0.504 0
8 Tensile strain, ~t = 0.497 0
0 0 10 2 0 3 0 40 50
Beam strain (in/in) x 103
Fig. A-4 BEAM CURVATURE-STRAIN DATA FOR ALUMINID·I
--..] C\)
73
and the corresponding slopes into equation
(A-2), the results can be combined with
equation (A-3) to find the values of ~t and
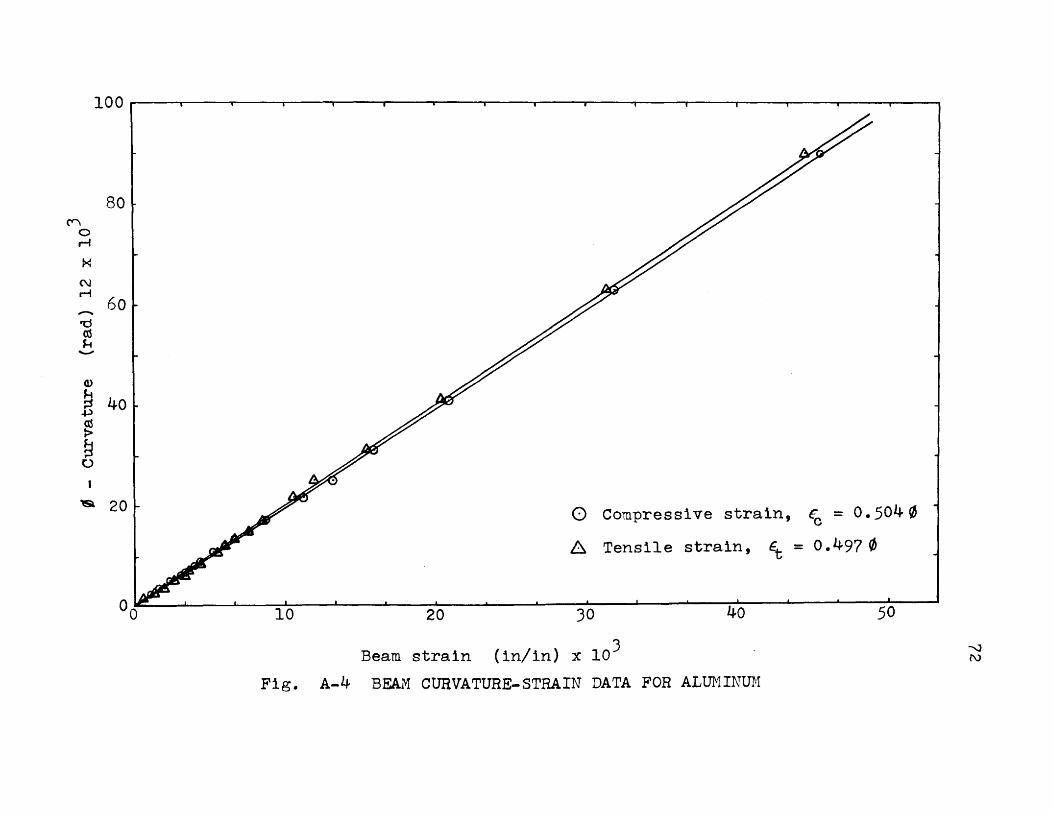
~0 • Further, by using the diagram of curva
ture ) - versus tc and c. t, shown in Figure
A-4, the corresponding strains can be found.
The required strain parameters are then found
by subtracting the quantities ~ and ~· b b
Thus, the stress-strain curves can now be
constructed.
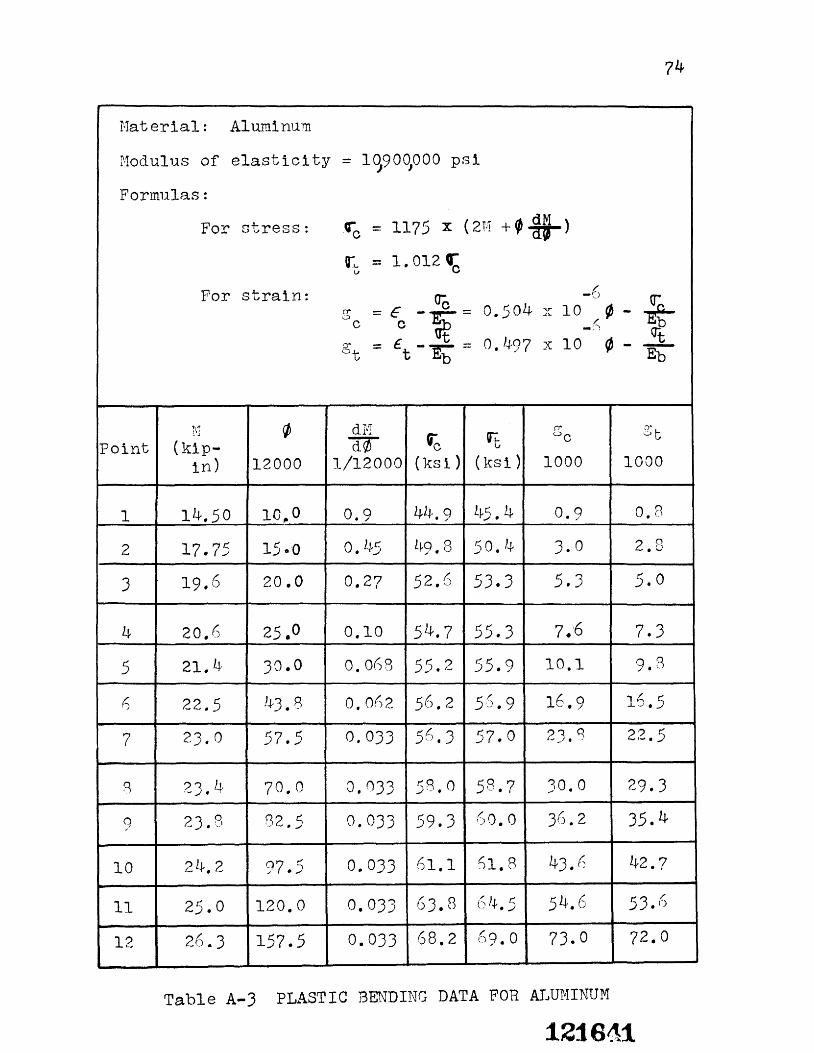
4. The calculation of the above stress-strain
parameter is presented in Table A-3.
74
Haterial: Aluminum
r-1od.u1us of elasticity = 1q9oo,ooo psi
Formulas:
For stress: G""G = 1175 X (2H +,.} u-;_ = 1. 012 ~
iJ
For strain: ac -6 {e-. cr = € 0.504 JC 10 fJ -~:) -r-= c c ~ I" ~b -~~
'Y = £t-~ == 0. l-J-<)7 X 10 ¢ - t Clt Eb
l\1 ~ d"·~'" 0" g~ l"l
Point (kip- dT ¥c ot OG
in) 12000 1/12000 (ksi) (ksi) 1000 1000
1 14.50 10~0 0.9 44- q . / L~5. 4 0.9 0.8
2 17.75 15·0 0 1-}c . ..) L~q o / • u 5o.'* ).0 2.8
3 19.6 20.0 0.27 52.6 53.3 5.3 5.0
4 20.6 25,0 0,10 51-}.7 55.3 7.:6 7.3
5 21. 1-t JO.O o. 068 55.2 55.9 10.1 9.8
r; 22 .. 5 !+-3. 8 0,0()2 56.2 5S.9 16.9 16.5
7 2).0 57.5 O.OJJ 56.3 57.0 2J,S 22.5
8 2],4 70.0 0,033 ss.o 58.7 30.0 29.3
9 2J.3 82.5 0.033 59.3 60.0 36.2 35.4
10 21}, 2 97.5 0.033 61.1 ~1.8 43 .. 6 42.7
11 25.0 120.0 O,OJJ 63.8 6 ).J- r:: ' •../ 5h. 6 5J.rS
12 2( 3 o. 157.5 0.033 68.2 69.0 73.0 72.0
Table A-3 PLASTIC BENDING DATA FOR ALUr1INUM
121641