finite element modeling of stress strain curve and micro stress … · 2013-12-24 · the phase β...
TRANSCRIPT

Journal of Minerals and Materials Characterization and Engineering, 2012, 11, 953-960 Published Online October 2012 (http://www.SciRP.org/journal/jmmce)
Finite Element Modeling of Stress Strain Curve and Micro Stress and Micro Strain Distributions of Titanium Alloys—
A Review
Gangi Setti Srinivasu, Narasimha Rao Raja Department Mechanical Engineering, National Institute of Technology, Warangal, India
Email: [email protected], [email protected]
Received July 15, 2012; revised August 20, 2012; accepted August 29, 2012
ABSTRACT
Most of the alloys like titanium, steel, brass, copper, etc., are used in engineering applications like automobile, aero- space, marine etc., consist of two or more phases. If a material consists of two or more phases or components it is very difficult to predict the properties like mechanical and other properties based on simple laws such as rule of mixtures. Titanium alloys are capable of producing different microstructures when it subjected to heat treatments, so much of money and time are squandering to study the effect of microstructure on mechanical properties of titanium alloys. This squandering can be reduced with the help of modeling and optimization techniques. There are many modeling tech- niques like Finite element method, Mat lab, Mathematical modeling etc. are available. But Finite element method is widely used for prediction because of capable of producing distributions of stresses and strains at any different loads. From the literature it is observed that there is a good agreement between the calculated and measured stress strain curves. This review paper describes the effect of volume fraction and grain size of alpha phase on the stress strain curve of the titanium alloys. It also can predict the effect of strength ratio on stress strain curve by using FEM. This informa- tion will be of great use in designing and selecting the titanium alloys for various engineering applications. Keywords: Titanium Alloys; Finite Element Modeling; Stress-Strain Curve
1. Introduction
Titanium alloys are considered as an important material because of its excellent combination of properties such as elevated strength to weight ratio, high fatigue life, tough- ness and excellent resistance to corrosion. It is heat treat- able and hot or cold deformed [1,2] and has gained more and more applications in many fields like aerospace, ma- rine etc. [3,4]. Titanium alloys are broadly classified into three types based on the chemical composition of the alloys and each of these families serves a specific role. This classification consists of α and near-α alloys, α/β alloys and β alloys. Low temperature allotrope form of titanium is α, and the microstructure of α and near-α al- loys consists predominantly of the α-phase. The α/β al- loys consist of mostly α phase and they do have more β phase. β is the high temperature allotropic form of tita- nium. Mostly β-alloys consist not fully β phase, but in very general terms, they are capable of retaining 100% β when quenched from the β-phase field [5-7].
Diffusion and diffusion less transformations taking place during heat treatment are important factors for de- termining the functional characteristics of these materials. These transformations are controlled by means of heat
treatment selection and the chemical composition of the phases that are present in these alloys, enable advance- ment in operational properties [8,9]. Mechanical proper- ties of titanium alloys are important criteria for both in aerospace as well as industrial applications. Microstruc- ture of the alloy is one of the important factors control- ling both the tensile strength and the fatigue strength [10,11]. The properties of titanium alloys can be varied over a wide range by heat treatment or thermo-mecha- nical processing [12-17]. The microstructure of the alloy can be changed from equiaxial through bi-modal to fully lamellar. A bi-modal microstructure is reported to have advantages in terms of yield stress, tensile stress and ductility and fatigue stress. A fully lamellar structure is characterized by high fatigue crack propagation resis- tance and high fracture toughness. The important para- meters for a lamellar structure with respect to mechanical properties are the β-grain size, size of the colonies of α-phase lamellae, thickness of the α-lamellae and the nature of the inter lamellar interface (β-phase) [18].
1.1. Modelling of Titanium Alloys
Titanium alloys exhibits different morphologies and vo-
Copyright © 2012 SciRes. JMMCE
G. S. SRINIVASU, N. R. RAJA 954
lume fractions of α when it is subjected to heat treat- ments. The way is to know the effect of these parameters on the properties of titanium alloys is experimentation, thus squandering of money, time and material. To reduce this squandering, modeling techniques are used in order to get the effect of parameters on properties. Modeling of material properties can be done by using different tech- niques such as finite element method (FEM), mathema- tical modeling, artificial neural networking etc.
1.2. Artificial Neural Network (ANN) Modelling
Malinov et al. [19] developed a model of artificial neural network for simulation of time-temperature—transfor- mation (TTT) diagrams for titanium alloy. This model predicted the influence of aluminium, vanadium, molyb- denum and oxygen on transformation kinetics in titanium alloys. The results are in good agreement with the theory of phase transformation. Using the model, TTT diagrams for some commercial alloys were predicted. Some other authors predicted the tensile properties, correlation be- tween the processing parameters on the properties of titanium alloys, etc. by using artificial neural network modeling [20-23].
1.3. Mathematical Modelling
Masaharu et al. [24] discussed the effects of shape and volume fraction of a second phase on stress states and deformation behavior of two-phase materials with the help of empirical relations. They embedded inhomoge- neous spheroidal (second phase) inclusions in a matrix. Analytical expressions to describe the stress states in elastically and plastically deformed two-phase materials are obtained with the Eshelby method and the Mori- Tanaka concept of the “average stress”. Considering that the second phase is also plastically deformable, the over- all deformation behavior of the two-phase materials is discussed with the results obtained by the evaluation of the stress and strain distributions in the materials. Some of the authors predicted the stress strain curve with the help of empirical relations [25-28] and phase transfor- mations of titanium alloys [29,30].
1.4. Finite Element (FE) Modelling
Finite element method (FEM) is one of the most used modeling technique in worldwide, different software packages are available in the market like ANSYS, NASTRAN based on the FEM. Jindrich Jinoch et al. [31] calculated the stress strain curve of α-β Ti-8Mn Alloy by using FEM, there is a small error between the calculated curve and measured curve but the fit is acceptable. S. Neti [32,33] modeled the deformation behavior of tita- nium alloy and the effect of strength ration on the stress strain curve. The author used NASTRAN software for
the modeling. Sreeramamurthy Ankem et al. [34] calcu- lated the effect of volume fraction of second phase on the tensile properties of titanium alloys by using FEM. Some other authors calculated the mechanical properties of titanium alloys, fracture surface, porosity effects by using FEM [35-40].
The aim of this review paper is to give idea on the importance of finite element modeling and the appli- cation of Finite element modeling to predict or model the mechanical properties of titanium alloys. It also explains how the advancements taking place in the modeling from past 20 years.
2. Finite Element Modeling (FEM) and Methodology
2.1. Modelling of Stress Strain Curve
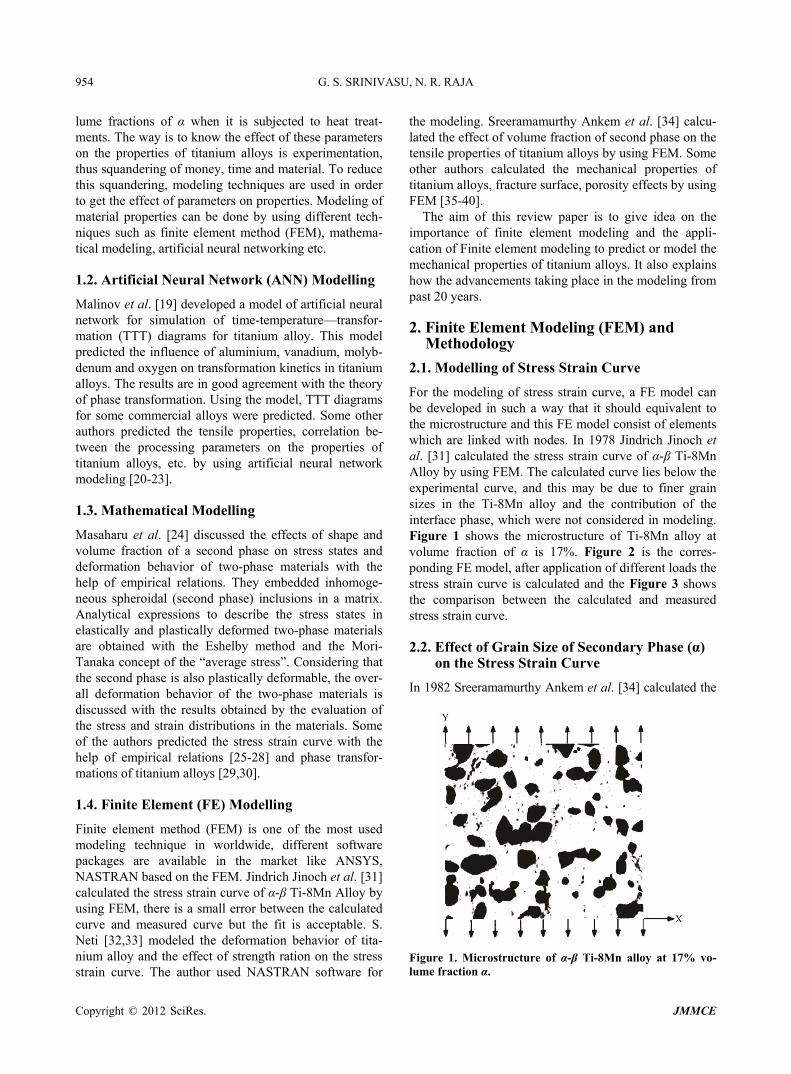
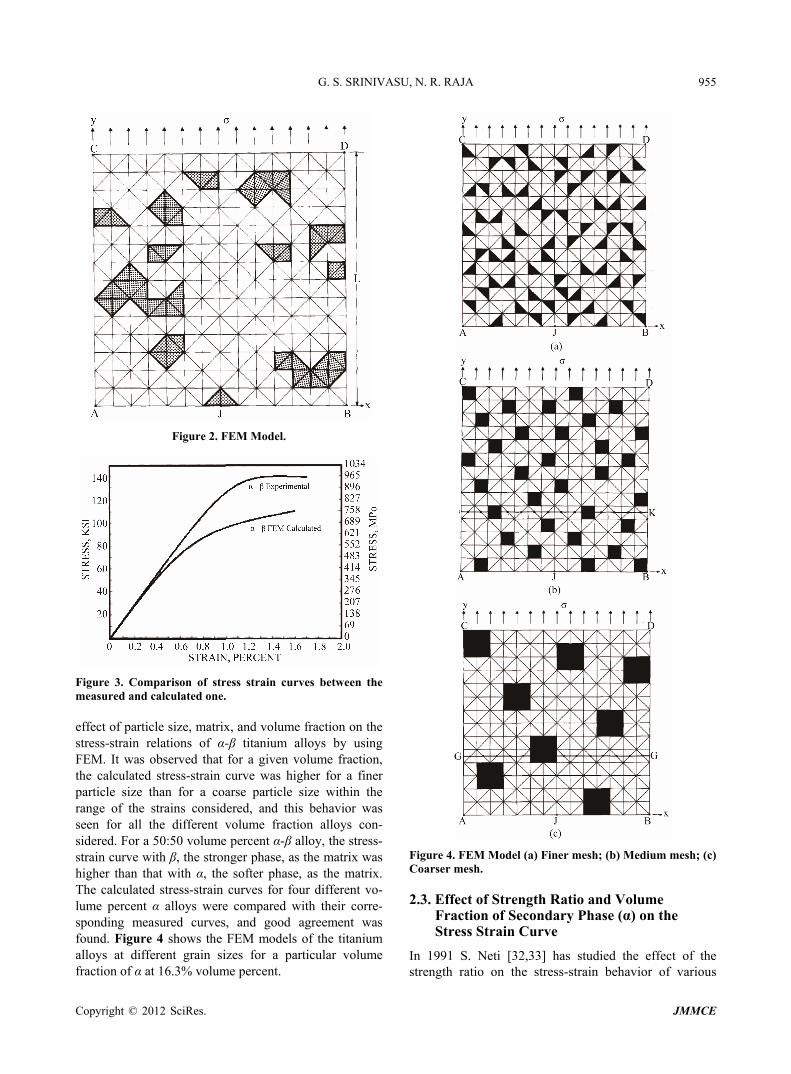
For the modeling of stress strain curve, a FE model can be developed in such a way that it should equivalent to the microstructure and this FE model consist of elements which are linked with nodes. In 1978 Jindrich Jinoch et al. [31] calculated the stress strain curve of α-β Ti-8Mn Alloy by using FEM. The calculated curve lies below the experimental curve, and this may be due to finer grain sizes in the Ti-8Mn alloy and the contribution of the interface phase, which were not considered in modeling. Figure 1 shows the microstructure of Ti-8Mn alloy at volume fraction of α is 17%. Figure 2 is the corres- ponding FE model, after application of different loads the stress strain curve is calculated and the Figure 3 shows the comparison between the calculated and measured stress strain curve.
2.2. Effect of Grain Size of Secondary Phase (α) on the Stress Strain Curve
In 1982 Sreeramamurthy Ankem et al. [34] calculated the
Figure 1. Microstructure of α-β Ti-8Mn alloy at 17% vo- lume fraction α.
Copyright © 2012 SciRes. JMMCE
G. S. SRINIVASU, N. R. RAJA 955
Figure 2. FEM Model.
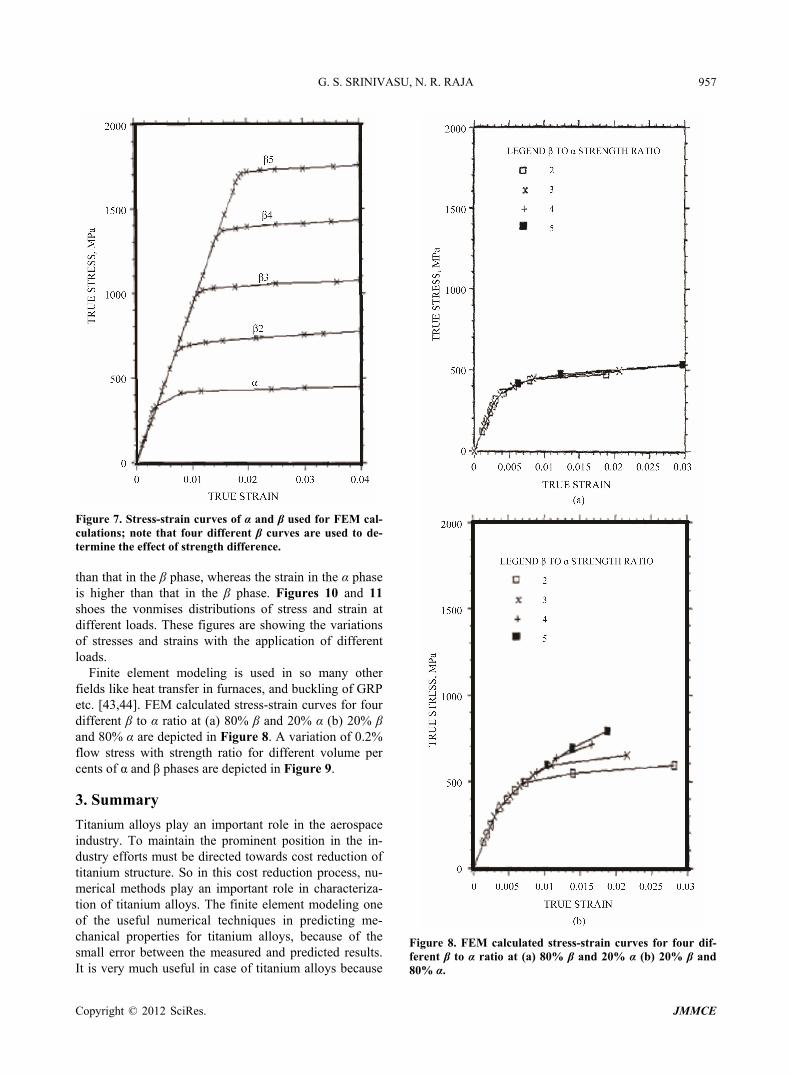
Figure 3. Comparison of stress strain curves between the measured and calculated one. effect of particle size, matrix, and volume fraction on the stress-strain relations of α-β titanium alloys by using FEM. It was observed that for a given volume fraction, the calculated stress-strain curve was higher for a finer particle size than for a coarse particle size within the range of the strains considered, and this behavior was seen for all the different volume fraction alloys con- sidered. For a 50:50 volume percent α-β alloy, the stress- strain curve with β, the stronger phase, as the matrix was higher than that with α, the softer phase, as the matrix. The calculated stress-strain curves for four different vo- lume percent α alloys were compared with their corre- sponding measured curves, and good agreement was found. Figure 4 shows the FEM models of the titanium alloys at different grain sizes for a particular volume fraction of α at 16.3% volume percent.
Figure 4. FEM Model (a) Finer mesh; (b) Medium mesh; (c) Coarser mesh.
2.3. Effect of Strength Ratio and Volume Fraction of Secondary Phase (α) on the Stress Strain Curve
In 1991 S. Neti [32,33] has studied the effect of the strength ratio on the stress-strain behavior of various
Copyright © 2012 SciRes. JMMCE

G. S. SRINIVASU, N. R. RAJA 956
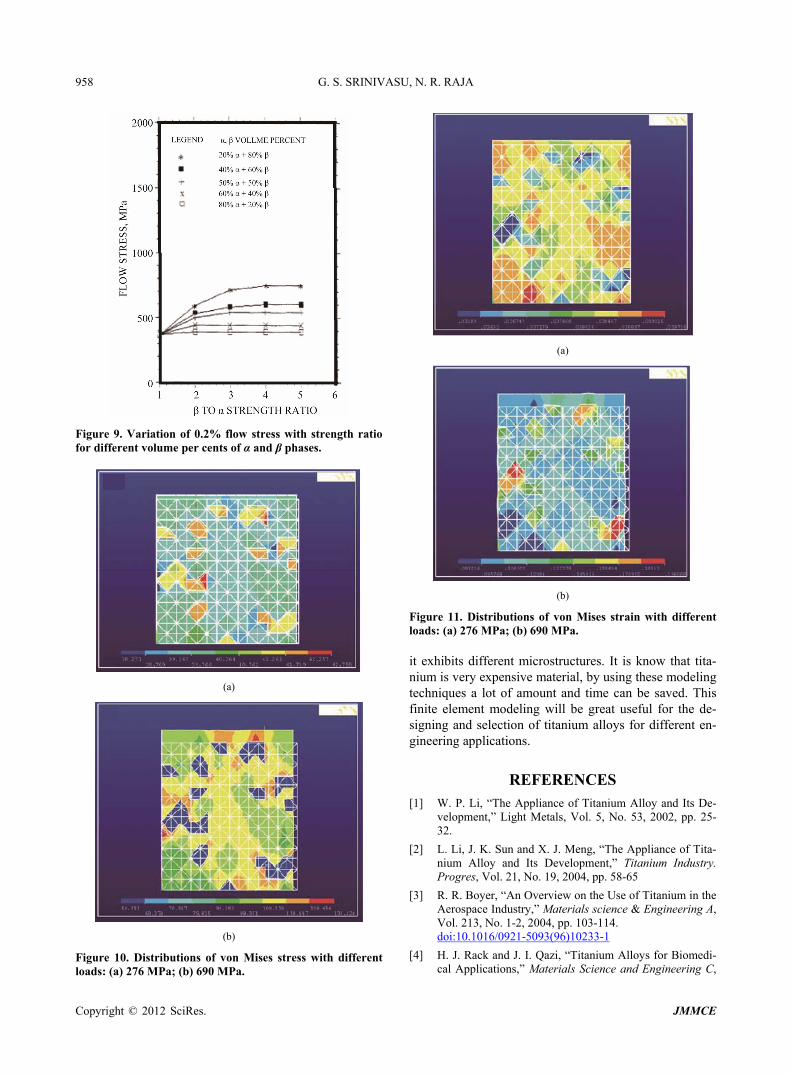
two-phase materials by the finite element method where the volume per cent of the second phase was varied from 20 to 80 vol.%. The strength ratio of the harder β phase to the softer α phase was varied from approximately 2 to 5 by keeping the α phase strength (0.2% YS) was cons- tant at 368 MPa. From his study it was observed that the flow stress of any given two-phase material did not vary linearly with the strength ratio. In addition to that, for a particular strength ratio, the flow stress of the two-phase material did not vary linearly with volume per cent. For materials with less than 40 vol.% β phase, the increase in the strength of the two-phase materials with either volume per cent of β or strength ratio was very small. This was attributed to the fact that the softer α phase, being the matrix, could deform relatively freely without the phase β undergoing plastic deformation up to a plastic strain of 0.5%. When the volume per cent of β was much greater than 50 vol.%, the softer a phase could not deform freely without the harder β phase undergoing plastic deformation, resulting in increased flow stresses with increased strength ratios. Figure 5 shows the dif- ferent stress-strain curves used for simulation. Figure 6 shows the FE models with different percentages of α and β. Figure 7 indicates the β stress strain curves at different ranges in order to get different strength ratios which are used in modeling.
2.4. Distributions of Stress and Strain
Recently most of the authors used ANSYS software for the analysis of stress strain curve and its distributions [39, 41,42]. In the year 2008 Zhao Xiqing et al. [39] did work on the distributions of stresses and strains within the phases at different loads. By comparing the calculated stress-strain curve with the measured one, it can be seen that the fit is acceptable. Thus, the FE model built in this work is effective. According to the above mentioned model, the distributions of stress and strain in the α and β
Figure 5. Comparison between the stress strain curves at different grain sizes of α.
Figure 6. FE Model (a) 20% β and 80% α; (b) 60% β and 40% α; (c) 50% β and 50% α. phases were simulated. It is observed from the author work that the stress gradients exist in both α and β phases, and the distributions of stress are non-homogeneous. The stress inside the phase is generally higher than the near interface. Meanwhile, the stress in the α phase is lower
Copyright © 2012 SciRes. JMMCE
G. S. SRINIVASU, N. R. RAJA 957
Figure 7. Stress-strain curves of α and β used for FEM cal-culations; note that four different β curves are used to de-termine the effect of strength difference. than that in the β phase, whereas the strain in the α phase is higher than that in the β phase. Figures 10 and 11 shoes the vonmises distributions of stress and strain at different loads. These figures are showing the variations of stresses and strains with the application of different loads.
Finite element modeling is used in so many other fields like heat transfer in furnaces, and buckling of GRP etc. [43,44]. FEM calculated stress-strain curves for four different β to α ratio at (a) 80% β and 20% α (b) 20% β and 80% α are depicted in Figure 8. A variation of 0.2% flow stress with strength ratio for different volume per cents of α and β phases are depicted in Figure 9.
3. Summary
Titanium alloys play an important role in the aerospace industry. To maintain the prominent position in the in- dustry efforts must be directed towards cost reduction of titanium structure. So in this cost reduction process, nu- merical methods play an important role in characteriza- tion of titanium alloys. The finite element modeling one of the useful numerical techniques in predicting me- chanical properties for titanium alloys, because of the small error between the measured and predicted results. It is very much useful in case of titanium alloys because
Figure 8. FEM calculated stress-strain curves for four dif-ferent β to α ratio at (a) 80% β and 20% α (b) 20% β and 80% α.
Copyright © 2012 SciRes. JMMCE
G. S. SRINIVASU, N. R. RAJA 958
Figure 9. Variation of 0.2% flow stress with strength ratio for different volume per cents of α and β phases.
(a)
(b)
Figure 10. Distributions of von Mises stress with different loads: (a) 276 MPa; (b) 690 MPa.
(a)
(b)
Figure 11. Distributions of von Mises strain with different loads: (a) 276 MPa; (b) 690 MPa. it exhibits different microstructures. It is know that tita- nium is very expensive material, by using these modeling techniques a lot of amount and time can be saved. This finite element modeling will be great useful for the de- signing and selection of titanium alloys for different en- gineering applications.
REFERENCES [1] W. P. Li, “The Appliance of Titanium Alloy and Its De-
velopment,” Light Metals, Vol. 5, No. 53, 2002, pp. 25- 32.
[2] L. Li, J. K. Sun and X. J. Meng, “The Appliance of Tita- nium Alloy and Its Development,” Titanium Industry. Progres, Vol. 21, No. 19, 2004, pp. 58-65
[3] R. R. Boyer, “An Overview on the Use of Titanium in the Aerospace Industry,” Materials science & Engineering A, Vol. 213, No. 1-2, 2004, pp. 103-114. doi:10.1016/0921-5093(96)10233-1
[4] H. J. Rack and J. I. Qazi, “Titanium Alloys for Biomedi- cal Applications,” Materials Science and Engineering C,
Copyright © 2012 SciRes. JMMCE
G. S. SRINIVASU, N. R. RAJA 959
Vol. 26, No. 8, 2006, pp. 1269-1277. doi:10.1016/j.msec.2005.08.032
[5] P. J. Bahia, D. Eylon, R. R. Boyer and D. A. Koss, “Beta Titanium Alloys and Their Role in the Titanium Industry —Keynote Lecture, Beta Titalzium Alloys,” Warrendale, PA, TMS, 1993, pp. 3-14.
[6] E. W. Collings, “The Physical Metalh¢rgy of Titalzium Alloys,” ASM, Materials Park, Ohio, 1984, pp. 2-4.
[7] T. W. Duerig and J. C. Williams, R. R. Boyer and H. W. Rosenberg, “Overview: Microstructure and Properties of Beta Titanium Alloys, Beta Titanium Alloys,” Warren- dale, PA, TMS, 1984, pp. 19-67.
[8] D. Eylon, S. Fujishiro, P. J. Postans and F. H. Froes, “High Temperature Alloys—A Review,” Journal of Met- als, Vol. 36, No. 4, 1984, pp. 55-62.
[9] S. Sastry, T. C. Peng, P. J. Mechter and J. E. O’Neal, “The Effect of Microstructure on the Mechanical Proper-ties of Two-Phase Titanium Alloys,” Journal of Metals, Vol. 36, No. 5, 1984, pp. 21-28.
[10] V. J. Colagelo and F. A. Heizer, “Analysis of Metallurgi- cal Failures”, John Wiley, New York, 1987.
[11] J. D. Emburg and F. Zok, “Micromechanisms of Frac- ture”, Proceedings of the 26th Conference of Metallur- gists, Winnipeg, 23-26 August 1987, p. 198
[12] J. Sieniawski, “Scientific Papers of the Rzeszow Univer- sity of Technology—Mechanics No. 10,” Rzeszow Uni- versity, Rzeszow, 1985.
[13] L. J. Hunter, M. Strangwood and P. Bowen, “Effect of Microstructure on the Fracture Behaviour of the α & β Titanium Alloy Ti-4Al-4Mo-2Sn-0.5Si wt.% (IMI 550) ,” In: P. A. Blenkinsop, W. J. Evans and H. M. Flower, Eds., Titanium’95, Science and Technology, The Institute of Materials, London, 1996, p. 925.
[14] J. Sieniawski, “The Effect of Phase Composition on the Fracture Toughness (KIc) of Structural Titanium Alloys,” Proceedings of the ISUMEL-2 Second International Sym- posium of Ukrainian Mechanical Engineers in Lviv, 2-6 September 1995, p. 101.
[15] G. Lutjering, “Influence of Processing on Microstructure and Mechanical Properties of α & β Titanium Alloys,” Materials Science and Engineering: A, Vol. 243, No. 1-2, 1998, pp. 32-45. doi:10.1016/S0921-5093(97)00778-8
[16] W. J. Evans, “Optimising Mechanical Properties in α & β Titanium Alloys,” Materials Science and Engineering: A, Vol. 243, No. 1-2, 1998 pp. 89-96. doi:10.1016/S0921-5093(97)00784-3
[17] C. Cauer and G. Luetjering, “Thermo-Mechanical Proc- essing of High Strength β-Titanium Alloys and Effect on Microstructure and Properties,” Journal of Materials Processing Technology, Vol. 117, No. 3, 2001, pp. 311- 317. doi:10.1016/S0924-0136(01)00788-9
[18] R. Filip, K. Kubiak, W. Ziaja and J. Sieniawski, “The Effect of Microstructure on the Mechanical Properties of Two-Phase Titanium Alloys,” Journal of Materials Proc- essing Technology, Vol. 133, No. 1-2, 2003, pp. 84-89. doi:10.1016/S0924-0136(02)00248-0
[19] S. Malinov, W. Sha and Z. Guo, “Application of Artificial Neural Network for Prediction of Time-Temperature
—Transformation Diagrams in Titanium Alloys,” Mate-rials Science and Engineering: A, Vol. 283, No. 1-2, 2000, pp. 1-10. doi:10.1016/S0921-5093(00)00746-2
[20] Y. C. Zhu, W. D. Zeng, Y. Sun, F. Feng and Y. G. Zhou, “Artificial Neural Network Approach to Predict the Flow Stress in the Isothermal Compression of As-Cast TC21 Titanium Alloy”, Computational Materials Science, Vol. 50, No. 5,2011, pp. 1785-1790. doi:10.1016/j.commatsci.2011.01.015
[21] S. Malinov and W. Sha, “Application of Artificial Neural Networks for Modelling Correlations in Titanium Al- loys,” Materials Science and Engineering: A, Vol. 365, No. 1-2, 2004, pp. 202-211. doi:10.1016/j.msea.2003.09.029
[22] J. McBride, S. Malinov and W. Shaa, “Modelling Tensile Properties of Gamma-Based Titanium Aluminides Using Artificial Neural Network,” Materials Science and Engi- neering: A, Vol. 384, No. 1-2, 2004, pp. 129-137. doi:10.1016/j.msea.2004.05.072
[23] S. Malinov, W. Sha and J. J. McKeown, “Modelling the Correlation between Processing Parameters and Proper- ties in Titanium Alloys Using Artificial Neural Network,” Computational Materials Science, Vol. 21, No. 3, 2001, pp. 375-394. doi:10.1016/S0927-0256(01)00160-4
[24] M. Kato, T. Fujii and S. Onaka, “Effects of Shape and Volume Fraction of Second Phase on Stress States in Two-Phase Materials,” Materials Science and Engineer- ing: A, Vol. 285, No. 1-2, 2000, pp. 144-150. doi:10.1016/S0921-5093(00)00639-0
[25] J. R. C. Guimaraes and D. L. Valeriano Alves, “On the Analysis of Stress-Strain Curves by Means of Empirical Equations,” Scripta Metallurgica, Vol. 9, No. 11, 1975, pp. 1147-1148. doi:10.1016/0036-9748(75)90395-6
[26] P. R. Rios, J. R. C. Guimares and K. K. Chawla, “Model- ling the Stress-Strain Curves of Dual Phase Steels,” Scripta Metallurgica, Vol. 15, No. 8, 1981, pp. 899-904. doi:10.1016/0036-9748(81)90274-X
[27] B. K. Kad, M. Dao, J. Robert and Asaro, “Numerical Simulations of Stress-Strain Behavior in Two-Phase α2 + β Lamellar TiAl Alloys,” Materials Science and Engi- neering: A, Vol. 192-193, 1995, pp. 97-103. doi:10.1016/0921-5093(94)03210-6
[28] X. P. Wu, S. R. Kalidindi, C. Necker and A. A. Salem, “Prediction of Crystallographic Texture Evolution and Anisotropic Stress-Strain Curves during Large Plastic Strains in High Purity α-Titanium Using a Taylor-Type Crystal Plasticity Model,” Acta Materialia, Vol. 55, No. 2, 2007, pp. 423-432. doi:10.1016/j.actamat.2006.08.034
[29] S. Malinov, W. Sha and P. Markovsky, “Experimental Study and Computer Modelling of the β ⇒ α + β Phase Transformation in β21s Alloy at Isothermal Conditions,” Journal of Alloys and Compounds, Vol. 348, No. 1-2, 2003, pp. 110-118. doi:10.1016/S0925-8388(02)00804-6
[30] J. D. C. Teixeira, B. Appolaire, E. Aeby-Gautier, S. Denis and L. Hericher, “Modeling of the Phase Transformations in Near-β Titanium Alloys during the Cooling after Forg- ing,” Computational Materials Science, Vol. 42, No. 2, 2008, pp. 266-280. doi:10.1016/j.commatsci.2007.07.056
[31] J. Jinoch, S. Ankem and H. Margolin, “Calculations of
Copyright © 2012 SciRes. JMMCE
G. S. SRINIVASU, N. R. RAJA
Copyright © 2012 SciRes. JMMCE
960
Stress-Strain Curve and Stress and Strain Distributions for an α-β Ti-8Mn Alloy,” Materials Science and Engi- neering, Vol. 34, No. 3, 1978, pp. 203-211. doi:10.1016/0025-5416(78)90052-6
[32] S. Neti, M. N. Vijayshankar and S. Ankem, “Finite Ele- ment Method Modeling of Deformation Behavior of Two-Phase Materials Part I: Stress-Strain Relations,” Materials Science and Engineering: A, Vol. 145, No. 1, 1991, pp. 47-54. doi:10.1016/0921-5093(91)90294-W
[33] S. Neti, M. N. Vijayshankar and S. Ankem, “Finite Ele- ment Method Modeling of Deformation Behavior of Two-Phase Materials Part II: Stress and Strain Distribu- tions,” Materials Science and Engineering: A, Vol. 145, No. 1, 1991, pp. 55-64. doi:10.1016/0921-5093(91)90295-X
[34] S. Ankem and H. Margolin, “Finite Element Method (FEM) Calculations of Stress-Strain Behavior of Al- pha-Beta Ti-Mn Alloys: Part I. Stress-Strain Relations,” Metallurgical Transactions A, Vol. 13 No. 4, 1982, pp. 595-601.
[35] N. Ramakrishnan and V. S. Arunachalam, “Finite Ele- ment Methods for Materials Modeling,” Progress in Ma- terials Science, Vol. 42, No. 1-4, 1991, pp. 253-261. doi:10.1016/S0079-6425(97)00031-5
[36] H. Shen and L. C. Brinson, “Finite Element Modeling of Porous Titanium,” International Journal of Solids and Structures, Vol. 44, No. 1, 2007, pp. 320-335. doi:10.1016/j.ijsolstr.2006.04.020
[37] L. Durand, M. Massaoudi, M. Cabie, A. Ponchet, “Me- chanical Behaviour of a Two-Phase Material from the Behaviour of Its Components: Interface Modelling by Fi- nite Element Method,” Materials and Design, Vol. 29, No. 8, 2008, pp. 1609-1615. doi:10.1016/j.matdes.2007.10.002
[38] W. Ziaja, “Finite Element Modelling of the Fracture Be- haviour of Surface Treated Ti-6Al-4V Alloy,” Computa- tional Materials Science and Surface Engineering, Vol. 1, No. 1, 2009, pp. 53-60.
[39] X. Q. Zhao, X. L. Zang, Q. F. Wang, P. Joongkeun and Q. X. Yang, “Numerical Simulation of the Stress-Strain Curve and the Stress and Strain Distributions of the Tita- nium-Duplex Alloy,” Rare Metals, Vol. 27, No. 5, 2008, pp. 463-467. doi:10.1016/S1001-0521(08)60163-1
[40] L. M. Wang, J. J. Xu, L. Yan, Z. D. Liu and G. Yang, “A FEM Study on the Mechanical Responses of Pseudoelas- tic TiNi Alloys to a Particle Normal Loads,” Wear, Vol. 260, No. 6, 2006, pp. 573-579. doi:10.1016/j.wear.2004.12.035
[41] B. Liao, C. L. Zhang, J. Wu, D. Y. Cai, C. M. Zhao, X. J. Ren and Q. X. Yang, “Numerical Simulation of the Stress-Strain Curve of Duplex Weathering Steel,” Mate- rials and Design, Vol. 29, No. 2, 2008, pp. 562-567. doi:10.1016/j.matdes.2006.12.021
[42] H.-F. Dong, J. Li, Y. Zhang, J. Park and Q.-X. Yang, “Numerical Simulation on the Microstress and Mi- crostrain of Low Si-Mn-Nb Dual-Phase Steel,” Interna- tional Journal of Minerals, Metallurgy and Materials, Vol. 17, No. 2, 2010, pp. 173-178. doi:10.1007/s12613-010-0209-8
[43] O. O. Oluwole, P. O. Atanda and B. I. Imasogie, “Finite Element Modeling of Heat Transfer in Salt Bath Fur- naces,” The Journal of Minerals and Materials Charac- terization and Engineering, Vol. 8, No. 3, 2009, pp. 229- 236.
[44] C. C. Ihueze, “The Galerki Approach for Finite Elements of Field Functions: The Case of Buckling in GRP,” The Journal of Minerals and Materials Characterization and Engineering, Vol. 9, No. 4, 2010, pp. 389-409.