comparison of the performance of...
TRANSCRIPT
COMPARISON OF THE PERFORMANCE OF DIFFERENT TIME DELAY
ESTIMATION TECHNIQUES FOR ULTRASOUND ELASTOGRAPHY
A Thesis
by
SRINATH SAMBASUBRAMANIAN
Submitted to the Office of Graduate Studies of
Texas A&M University
in partial fulfillment of the requirements for the degree of
MASTER OF SCIENCE
August 2010
Major Subject: Electrical Engineering

COMPARISON OF THE PERFORMANCE OF DIFFERENT TIME DELAY
ESTIMATION TECHNIQUES FOR ULTRASOUND ELASTOGRAPHY
A Thesis
by
SRINATH SAMBASUBRAMANIAN
Submitted to the Office of Graduate Studies of
Texas A&M University
in partial fulfillment of the requirements for the degree of
MASTER OF SCIENCE
Approved by:
Chair of Committee, Raffaella Righetti
Committee Members, Jim Ji
Deepa Kundur
Javier Jo
Head of Department, Costas Georghiades
August 2010
Major Subject: Electrical Engineering

iii
ABSTRACT
Comparison of the Performance of Different Time Delay Estimation Techniques for
Ultrasound Elastography. (August 2010)
Srinath Sambasubramanian, B.Tech. , National Institute of Technology, Tiruchirapalli
Chair of Advisory Committee: Dr. Raffaella Righetti
Elastography is a non-invasive medical imaging modality that is used as a diagnostic
tool for the early detection of several pathological changes in soft tissues. Elastography
techniques provide the local strain distributions experienced by soft tissues due to
compression. The resulting strain images are called “elastograms”. In elastography, the
local tissue strains are usually estimated as the gradient of local tissue displacement. The
local tissue displacements are estimated from the time delays between gated pre- and
post-compression echo signals. The quality of the resulting elastograms is highly
dependent on the accuracy of these local displacement estimates. While several time
delay estimation (TDE) techniques have been proposed for elastography applications,
there is a lack of systematic study that statistically compares the performance of these
techniques. This information could prove to be of great importance to improve currently
employed elastographic clinical methods.
This study investigates the performance of selected time delay estimators for
elastography applications. Time delay estimators based on Generalized Cross
Correlation (GCC), Sum of Squared Differences (SSD) and Sum of Absolute

iv
Differences (SAD) are proposed and implemented. Within the class of GCC algorithms,
we further consider: an FFT-based cross correlation algorithm (GCC-FFT), a hybrid
time-domain and frequency domain cross correlation algorithm with prior estimates
(GCC-PE) and an algorithm based on the use of fractional Fourier transform to compute
the cross correlation (GCC -FRFT) . Image quality factors of the elastograms obtained
using the different TDE techniques are analyzed and the results are compared using
standard statistical tools.
The results of this research suggests that correlation based techniques outperform
SSD and SAD techniques in terms of SNRe, CNRe, dynamic range and robustness. The
sensitivity of GCC-FFT and SSD were statistically similar and statistically higher than
those of all other methods. Within the class of GCC methods, there is no statistically
significant difference between SNRe of GCC-FFT, GCC-PE and GCC –FRFT for most
of the strain values considered in this study. However, in terms of CNRe, GCC-FFT and
GCC-FRFT were significantly better than other TDE algorithms. Based on these results,
it is concluded that correlation-based algorithms are the most effective in obtaining high
quality elastograms.

v
To my parents

vi
ACKNOWLEDGEMENTS
I would like to thank my Committee Chair, Dr. Raffaella Righetti for being extremely
kind and supportive throughout the course of this research. My thanks to my colleagues
at the lab, Raghavendra Desai, Sthiti Deka and Xu Yang, for their technical inputs and
suggestions. I am grateful to my committee members, Dr. Jim Ji, Dr. Deepa Kundur and
Dr. Javier Jo, for their guidance and support.
My thanks to Ms. Prabha Acharya for giving me the opportunity to work as a
Graduate Assistant in the Texas A&M University Library. Thanks also go the
department faculty and staff for making my time at Texas A&M University a great
experience.
Finally, this work would have been impossible but for the love and support
showed by my family and friends. My sincere thanks to all of them.

vii
TABLE OF CONTENTS
Page
ABSTRACT .............................................................................................................. iii
DEDICATION .......................................................................................................... v
ACKNOWLEDGEMENTS ...................................................................................... vi
TABLE OF CONTENTS .......................................................................................... vii
LIST OF FIGURES ................................................................................................... ix
LIST OF TABLES .................................................................................................... xi
CHAPTER
I INTRODUCTION ............................................................................... 1
A. Motivation. ................................................................................. 1
B. Research Plan ............................................................................. 2
C. Structure of the Thesis ................................................................ 4
II ELASTOGRAPHY ............................................................................. 5
A. Steps to Obtain an Elastogram. .................................................. 6
1. Pre and Post Compression Data Acquisition .......................... 6
2. Global Temporal Stretching ................................................... 6
3. Time Delay Estimation ........................................................... 8
4. Strain Estimation .................................................................... 9
B. Summary ..................................................................................... 12
III TIME DELAY ESTIMATION ALGORITHMS ................................ 13
A. Problem Formulation .................................................................. 13
B. Generalized Cross Correlation-Fast Fourier Transform
(GCC-FFT) ................................................................................. 14
C. Generalized Cross Correlation with
Prior Estimates (GCC-PE) ........................................................ 17
D. Fractional Fourier Transform ..................................................... 19
E. Sum of Squared Differences (SSD) and Sum of Absolute
Differences (SAD) ...................................................................... 22
F. Summary ..................................................................................... 24

viii
CHAPTER Page
IV PERFORMANCE INDICATORS AND RESULTS .......................... 26
A. Image Quality Parameters .......................................................... 27
1. Elastographic Signal-to-Noise Ratio ...................................... 27
2. Elastographic Contrast-to-Noise Ratio ................................... 28
3. Elastographic Dynamic Range ............................................... 29
4. Elastographic Sensitivity ........................................................ 29
5. Computational Time ............................................................... 30
B. Simulation Study ........................................................................ 30
C. Experimental Validation ............................................................. 32
D. Statistical Analysis of Results .................................................... 33
E. Simulation Results ...................................................................... 33
F. Results- Image Quality Analysis ................................................. 37
1. SNRe ....................................................................................... 37
2. CNRe ...................................................................................... 41
3. Dynamic Range ...................................................................... 45
4. Sensitivity ............................................................................... 47
5. Computational Time ............................................................... 48
G. Experimental Result ................................................................... 49
H. Summary .................................................................................... 50
V CONCLUSIONS AND FUTURE WORK ......................................... 51
A. Conclusions ................................................................................ 51
B. Future Work ................................................................................ 52
REFERENCES .......................................................................................................... 53
VITA ......................................................................................................................... 56

ix
LIST OF FIGURES
FIGURE Page
1 Schematics of the steps necessary to obtain an elastogram ...................... 7
2 Elastograms of a simulated medium containing a hard inclusion at 1%
applied strain. (a) Ideal simulated strain distribution map (b) Elasto-
gram obtained using a simple gradient strain estimation method (c)
Elastogram obtained using a staggered strain estimation method (d)
Elastogram obtained using a least squared estimation method ................. 11
3 Example of pre and post compression windows ....................................... 14
4 Schematic of the GCC-FFT method .......................................................... 15
5 (a) Example of ideal displacement map obtained from a simulated
medium containing a hard inclusion at 1 % applied strain.
(b) Corresponding estimated displacement map obtained using
GCC-FFT algorithm (after median filtering) ............................................ 17
6 (a) Example of ideal displacement map obtained from a simulated
medium containing a hard inclusion at 1 % applied strain.
(b) Corresponding estimated displacement map obtained using
GCC-PE algorithm (after median filtering) .............................................. 18
7 Schematic for obtaining the peak of fractional correlation ....................... 21
8 (a) Example of ideal displacement map obtained from a simulated
medium containing a hard inclusion at 1 % applied strain. (b)
Corresponding estimated displacement map obtained using
GCC-FRFT algorithm (after median filtering) .......................................... 22
9 (a) Example of ideal displacement map obtained from a simulated
medium containing a hard inclusion at 1 % applied strain.
(b) Corresponding estimated displacement map obtained using
SSD algorithm (after median filtering) ..................................................... 23

x
FIGURE Page
10 (a) Example of ideal displacement map obtained from a simulated
medium containing a hard inclusion at 1 % applied strain.
(b) Corresponding estimated displacement map obtained using
SAD algorithm (after median filtering) ..................................................... 24
11 Ideal strain images of (a) The uniform simulated medium used
for the SNRe study and (b) The medium containing a hard inclusion
used for the CNRe study ............................................................................ 31
12 (a) Ideal strain image at 5% applied strain. Elastograms obtained using
(b) GCC-FFT (c) GCC-PE (d) GCC-FRFT (e) SSD (f) SAD ................... 34
13 Examples of elastograms obtained using GCC-FFT at different window
lengths: (a) 0.5 mm (b) 2 mm (c) 4 mm .................................................... 35
14 Examples of elastograms obtained using GCC-PE at different window
lengths: (a) 0.5 mm (b) 2 mm (c) 4 mm .................................................... 35
15 Examples of elastograms obtained using GCC-FRFT at different window
lengths: (a) 0.5 mm (b) 2 mm (c) 4 mm .................................................... 36
16 Examples of elastograms obtained using SSD at different window
lengths: (a) 0.5 mm (b) 2 mm (c) 4 mm .................................................... 36
17 Examples of elastograms obtained using SAD at different window
lengths: (a) 0.5 mm (b) 2 mm (c) 4 mm .................................................... 37
18 Strain filters corresponding to the Generalized Cross Correlation methods
implemented in this study ......................................................................... 38
19 Strain filters corresponding to the SSD and SAD methods
implemented in this study ......................................................................... 39
20 CNRe as a function of strain for the Generalized Cross Correlation
methods ..................................................................................................... 42
21 CNRe as a function of strain for SSD and SAD methods ......................... 43
22 Experimental results obtained using the GCC methods ............................ 49
23 Experimental results obtained using the SSD and SAD methods ............. 50

xi
LIST OF TABLES
TABLE Page
I SNRe values for the various algorithms for different values
of applied strains .......................................................................................... 40
II Strains for which the p-value between sets of measurements of SNRe
obtained using two algorithms was found < 0.05 ......................................... 41
III CNRe values for the various algorithms for different values
of applied strains .......................................................................................... 43
IV Strains for which the p-value between sets of measurements of CNRe
obtained using two algorithms was found < 0.05 ......................................... 45
V Dynamic range estimated for the various TDE algorithms implemented
in this study .................................................................................................. 46
VI p-values obtained for dynamic range measurements ................................... 46
VII Sensitivity of the various algorithms ............................................................ 47
VIII p-values obtained for sensitivity measurements ........................................... 48
IX Computational time per pixel for the various algorithms implemented
in this study .................................................................................................. 48

1
CHAPTER I
INTRODUCTION
Ultrasound Elastography is a non-invasive medical imaging modality that provides the
distribution of local strains experienced by soft tissues due to compression [1], [2]. The
resulting strain images are referred to as “elastograms”. Elastography is currently used as
a diagnostic tool in detecting pathological changes in soft tissues [1].
A. Motivation
Pathological changes are usually associated with changes in tissue’s mechanical
properties [2]. Palpation is one of the preliminary methods in detecting tumors. Palpation
is subjective and does not allow the classification of tumors [2]. Alternatively, a
physician can use medical imaging techniques or biopsy, which is a costly and painful
invasive procedure.
Ultrasonic B-mode imaging is an established medical imaging tool that is used in
a variety of clinical applications [2]. Malignant or Benign tumors may have echogenic
properties which might make them undetectable in conventional B-mode ultrasonic
images [2]. However, cancerous tissues may be several times harder than the
surrounding soft tissues [3]. Therefore imaging tissue stiffness or related parameters can
____________
The journal model is IEEE Special Issue on Systems Biology.

2
serve as a tool to diagnose cancers and possibly distinguish between benign and
malignant tumors [2]. For example in the case of a breast tumor, a benign tumor may be
several times softer than a malignant one [3]. Since the echogenicity and the stiffness of
tissue are unrelated properties, imaging tissue stiffness or strain will provide new
additional information that is related to pathological tissue structure [2].
Elastography methods aim at imaging the local strains that a tissue experience
under quasi-static compression [1] [2]. Local strains are usually estimated as the gradient
of local tissue displacement, which are computed from the time delays between gated
pre- and post-compression echo signals. The quality of the resulting elastograms is
highly dependent on the accuracy and precision of these local displacement estimates
[4]. While several time delay estimation (TDE) techniques have been proposed for
elastography applications, there is a lack of systematic study that statistically compares
the performance of these techniques. This information could prove of great importance
to improve currently employed elastographic clinical methods.
Therefore, the primary motivation of this work is to provide a solid
understanding of potentials and limitations of several TDE techniques for elastography
applications so that quality elastograms can be produced and used in conjunction with
ultrasound B- mode images as a reliable diagnostic tool.
B. Research Plan
Elastography is traditionally implemented by first estimating the displacement between a
pair of reflected RF echo signals [2]. Often, cross correlation methods are used to

3
estimate these displacements. Thereafter, the local strains are computed from the
estimated displacement using gradient methods [2]. In addition to correlation, there are
many other methods that can be used for time delay estimation (TDE). This thesis
explores a number of TDE elastography methods. Specifically the aim of this work is as
follows:
1. Develop software that generates the axial and lateral displacement maps and axial and
lateral elastograms.
2. Implement different Time Delay Estimation (TDE) algorithms. These are based on
generalized cross correlation, Sum of Squared Differences (SSD) [5], Sum of Absolute
Differences (SAD) [5]. Within the class of GCC algorithms, an FFT-based cross
correlation algorithm (GCC-FFT), a hybrid time-domain and frequency domain cross
correlation algorithm with prior estimates (GCC-PE) and a new algorithm based on the
use of fractional Fourier transform (GCC-FRFT) are implemented. It should be noted
that the use of fractional Fourier transform for elastography applications has never been
reported so far.
3. Perform statistical analysis on the performance of the algorithms, in terms of
elastographic signal-to-noise ratio (SNRe), elastographic contrast-to-noise ratio (CNRe),
sensitivity and dynamic range and computational time. The performance is evaluated for
a range of applied strain values. The results are statistically compared using standard
statistical tests.

4
C. Structure of the Thesis
Chapter II discusses the basic and concepts and the various steps involved in obtaining
an elastogram
Chapter III provides the methods and implementation of the various TDE
algorithms that are considered in this study.
Chapter IV discusses the performance indicators used for quantifying image
quality of elastograms. It also provides the results of the image quality analysis and the
statistical analysis.
Chapter V presents the conclusions and the avenues for future work in this area.

5
CHAPTER II
ELASTOGRAPHY
Elastograms represent maps of local tissue strains experienced by a tissue under quasi-
static compression. Local tissue strains are related to the underlying mechanical
properties of the tissue, which depend on the molecular building blocks of the tissue and
on the structural organization of these blocks [2]. In order to image the mechanical
behavior of a tissue, a mechanical stimulus of some kind must be propagated into the
tissue and precision means for detecting internal tissue motion must be provided.
Imaging tissue’s mechanical properties is a challenging task due to the difficulty in
describing a tissue’s behavior using mathematical models. For creating a simple, viable
mathematical model of the behavior of a tissue, certain assumptions have to be made
[2].When the mechanical stimulus is propagated through the tissue for a very short
duration (ideally an impulse), it can be assumed that the response of the tissue only
depends on the current applied stimulus and not on any previous loading. The viscosity
of the tissue can then be ignored and the tissue can then be assumed to be an elastic
material [2].
Now that the tissue has been approximated to a perfect elastic material, when a
quasi static uniaxial compression is applied [5], [4], [6], [2], all the particles in the
medium will experience a longitudinal strain along the direction of the applied
compression. Harder tissue regions experience lower strains whereas softer tissue

6
regions experience higher strains. In elastography, the local tissue strain maybe defined
as [2]:
ϵ = �� – ��� (2.1)
where ϵ denotes the strain , d� and d� denote the time delay estimates of observation
windows 1 and 2 respectively at any time t and t +Δt.
A. Steps to Obtain an Elastogram
In order to obtain a map of the distributions of these strains (i.e., an elastogram) several
steps must be executed. Fig 1 shows the steps required for obtaining an elastogram.
1. Pre and Post Compression Data Acquisition
Prior to tissue compression, a set of digitized Radio Frequency (RF) echo lines are
obtained from the tissue of interest using a standard diagnostic ultrasound system (pre-
compression frame).Then the tissue is slightly compressed using the ultrasonic
transducer, and another set of RF echo lines are obtained from the same tissue area of
interest (post-compression frame). It is important to note that the compression is usually
a very small percentage of the tissue depth (<1%), typically less than one mm.
2. Global Temporal Stretching
Due to the compression of the tissue, echoes obtained from acoustic scatterers in the
tissue are distorted. Thus, the post compression echo signals are not just the exact

delayed version of the pre compression echo signals. This
the actual strain) is a major cause of loss of correlation between the pre and post
compression signal. This effect is known as echo signal decorrelation, and it is one of the
Fig. 1. Schematics of the steps necessary
delayed version of the pre compression echo signals. This distortion (which constitutes
the actual strain) is a major cause of loss of correlation between the pre and post
compression signal. This effect is known as echo signal decorrelation, and it is one of the
. Schematics of the steps necessary to obtain an elastogram.
7
distortion (which constitutes
the actual strain) is a major cause of loss of correlation between the pre and post
compression signal. This effect is known as echo signal decorrelation, and it is one of the

8
important factors that limit the quality of elastograms [7]. Therefore, the echo-signal
decorrelation should be minimized to obtain a meaningful estimation of tissue
displacement.
In order to limit this decorrelation, a global stretching [7] is usually
performed on the post compression frame prior to time delay estimation. In global
temporal stretching, all post compression echo lines are stretched equally by the same
strain magnitude as the strain applied during compression. This method is
computationally inexpensive and also significantly improves the correlation between pre
and post compression signals hence leading to improved displacement map estimation.
Temporal stretching basically realigns the pre and post compression signals, and it is
implemented using linear interpolation.
3. Time Delay Estimation
The estimation of the time delay between the pre and post compression temporally
stretched signals is perhaps the most important step in the generation of an elastogram,
and the one that mostly affects the quality of elastograms [4]. Time delay occurs due to
spatial shift in the tissue caused by its compression. If the velocity of sound in the tissue
is assumed to be constant, the time delay is directly proportional to the spatial shift in the
tissue. Thus by estimating the time delay, the spatial shift can also be estimated.
Time delay estimation can be performed in many different ways and several
methods are considered in this study. In all the methods considered in this study,
congruent echo lines from the pre and post compression signals are divided into several

9
temporal windows of equal length and their time delay is estimated using the different
algorithms. The window length is an important parameter in determining the quality of
the elastogram and it has to be a function of the ultrasonic wavelength [8]. The windows
are translated in small overlapping steps along the axial direction [2]. This is repeated for
all the depths and for all the A-lines to obtain the complete displacement map. The
different time delay estimation algorithms are discussed in detail in Chapter III.
The estimates obtained using the TDE algorithms are coarse and to obtain a finer
sub sample displacement, either oversampling or interpolation techniques can be used
[2]. In this work, a parabolic interpolation is used to obtain sub sample displacement [9].
Parabolic interpolation is a quadratic interpolation method that fits a parabola to the
function at three unique points (maximum value and the one prior and after the
maximum value). The new displacement is obtained as the peak value of the fitted
parabola.
Prior to strain estimation, the obtained displacement map is then usually median
filtered to remove salt-and-pepper noise in the displacement map.
4. Strain Estimation
Strain distribution image or elastogram is obtained from the displacement map. One
simple method of obtaining an elastogram is to compute the gradient of the displacement
map [2]. However, this method provides very noisy strain estimates which result in low
elastographic SNR as can be seen in Fig 2(b). Other more advanced techniques have

10
been proposed to estimate strain. Among these are: the staggered strain estimation [10]
and the least squares strain estimator [11].
Staggered strain estimator uses a multi step strain estimation technique [10]. It
first computes the strain by computing the gradient of displacements between non
overlapping adjacent windows rather than successive overlapping windows as in the case
of the simple gradient method. Subsequently, windows are shifted by a fraction of the
window length and strain is estimated for non-overlapping windows with this window
translation. This is repeated till the cumulative window shift equals or exceeds the
window length. The results from all the iterations are staggered [10]. The obtained
gradient is the strain estimate of that particular window. This process is repeated for one
particular A-line and then for all the A-lines to obtain the elastogram. This method
significantly improves the quality of image and eliminates a number of noisy strain
estimates [10]. Fig 2(c) shows an elastogram obtained using staggered strain estimation
method.
Least squares strain estimator estimates the strain by making a piece wise linear
fit of the displacement data of the displacement map to obtain the strain [11]. This
method is also shown to considerably improve the elastographic SNR, but at the
expenses of spatial resolution [11]. This method is the one of choice for the statistical
study reported in this thesis, due to its simplicity and the fact that is widely applied in
elastography studies. Therefore, below, we summarize the major steps necessary to
estimate the strains using a least squares strain estimator.

(a)
(c)
Fig. 2. Elastograms of a simulated medium containing a hard inclusion at 1% applied
strain. (a) Ideal simulated
simple gradient strain estimation method
strain estimation method.
method.
The displacement estimates around a small kernel N can be modeled as
d�i� = a. z�i� �where
d : displacement estimates
(b)
(d)
Fig. 2. Elastograms of a simulated medium containing a hard inclusion at 1% applied
strain. (a) Ideal simulated strain distribution map. (b) Elastogram obtained using a
estimation method. (c) Elastogram obtained using a sta
(d) Elastogram obtained using a least squared estimation
he displacement estimates around a small kernel N can be modeled as
� b for i = 1 … N
d : displacement estimates
11
Fig. 2. Elastograms of a simulated medium containing a hard inclusion at 1% applied
b) Elastogram obtained using a
(c) Elastogram obtained using a staggered
(d) Elastogram obtained using a least squared estimation
(2.2)
12
z : tissue depth
N : size of the kernel
a,b : constants to be estimated.
Equation 2.2 can be written in matrix form as
d = A. a
b (2.3)
where A is a N x 2 matrix where the first column represents the depth position z (i) and
the second is a column of ones.
a
b = A
T [ A.A
T ]
-1 . d (2.4)
The quantity ‘a’ represents the strain estimate.
B. Summary
In this chapter, we described the necessary steps that must be performed in order to
obtain an elastogram. The different Time delay estimation techniques are critical in
obtaining a high quality elastogram, and they form the central portion of this thesis. A
selection of different TDE techniques is discussed in the next chapter. The method used
to estimate the strains from the local displacements is also important. In this chapter, we
summarized several methods, with particular emphasis on the least squares strain
estimator, which has been used in this thesis for performing the statistical study.

13
CHAPTER III
TIME DELAY ESTIMATION ALGORITHMS
A. Problem Formulation
Time delay estimation (TDE) is a classical problem which appears in a variety of
applications like audio signal processing, wireless communications and biomedical
signal processing etc [5]. As discussed in the previous chapter, time delay estimation is
also a critical step in the generation of an elastogram. It can be formulated as follows:
Let r��t�and r��t� be random processes that represent the reference and the delayed
signals, s�t� be the pulse echo point spread function of the imaging system, h��t� is the
tissue scattering function and h��t� = h��at� where a = ���� ,where ϵ is the applied
strain. n��t� and n��t� represent additive noise processes introduced from electronic
sources [7]. Then, r��t� and r��t� can be written as:
r��t� = h��t� ∗ s�t� � n� �t� (3.1)
r� �t� = h��t� ∗ s �t� � n� �t� (3.2)
Fig 3 shows the time delay between the pre and post compression A-lines obtained in
ultrasound elastography. There are several methods for estimating the delay between
r��t� and r��t� .The central work of this thesis consists of implementing the various time
delay estimation algorithms and investigating their performance in terms of elastogram
image qualities. In the next sections, a detailed technical description of each of the TDE
method implemented in this study is provided.

14
Fig. 3. Example of pre and post compression windows.
B. Generalized Cross Correlation-Fast Fourier Transform (GCC-FFT)
Generalized Cross Correlation is one of the most effective methods used in time delay
estimation because it is computationally less complex and provides accurate time delay
estimates [2]. In this method, the cross correlation function between the pre and post
compression windows is computed. The estimated delay is obtained by finding the time-
lag that maximizes the cross-correlation between the two signals. The expression for
cross correlation is given by [12]:
# �$ � = %[ '� [() '� [( � $) ) (3.3)
0 20 40 60 80 100 120-20
-15
-10
-5
0
5
10
15
20
Depth
Am
plit
ude o
f th
e e
cho s
ignal
TIMEDELAY

= 1* + '� [ , ) '� [ ,-./�
where
'� : Pre compressed signal window
'� : Post compressed signal window
# �$ � : Cross Correlation function between pre and post compressed signal windows.
$ : Time delay between pre and post com
N : Number of samples in a window
A schematic of the GCC-FFT method is shown in Fig. 4.
Fig. 4. Schematic of the GCC
) , � $)
: Pre compressed signal window
: Post compressed signal window
: Cross Correlation function between pre and post compressed signal windows.
: Time delay between pre and post compressed signal window.
N : Number of samples in a window
FFT method is shown in Fig. 4.
Fig. 4. Schematic of the GCC-FFT method.
15
�3.4�
: Cross Correlation function between pre and post compressed signal windows.

16
A definitive indicator of the accuracy of the time delay estimate is the normalized
cross correlation coefficient which is obtained by normalizing the cross correlation
function by the product of peaks of autocorrelation function of the pre and post
compressed window [4]. The time shift error in the normalized cross-correlation
function is significantly lower than in the unnormalized cross-correlation function and
hence is preferred over the unnormalized cross-correlation function [13]. Usually, the
cross correlation is carried out in frequency domain and not in time domain because it is
more computationally efficient.
In the frequency domain, the cross correlation function is found out as the
inverse Fourier transform of the product the FFT of the pre compression window and the
conjugation of FFT of the post compression window. FFT implementation takes only
logarithmic time complexity (while it would take quadratic time complexity o (n2) to
perform cross correlation in time domain). The position of the peak of the cross-
correlation function yields the time-delay estimate. This process is repeated for all the
windows and for all the A-lines to obtain a complete displacement map. An example of
simulated displacement map obtained using the GCC-FFT is shown in Fig. 5.

(a)
Fig. 5. (a) Example of ideal displacement map obtained from a simulated medium
containing a hard inclusion
displacement map obtained using GCC
C. Generalized Cross Correlation with Prior E
Generalized Cross Correlation with prior estimates
neighboring regions of the tissue are almost the same biologically and undergo similar
displacements when subjected to compressive strain
reduce the amount of computations necessary
this algorithm makes use of only 3 values of lags within a predicted region to make an
estimate of the displacement of a window
the displacements of the windows are c
scan [14]. The displacement of the very first window in the first row is calculated using
the generalized cross correlation method. Now the position of the peak of the correlation
function is stored. The value of the position of the peak is used to obtain the correlation
(b)
(a) Example of ideal displacement map obtained from a simulated medium
containing a hard inclusion at 1 % applied strain. (b) Corresponding estimated
displacement map obtained using GCC-FFT algorithm (after median filtering)
Correlation with Prior Estimates (GCC-PE)
Generalized Cross Correlation with prior estimates algorithm makes use of the fact that
neighboring regions of the tissue are almost the same biologically and undergo similar
displacements when subjected to compressive strain [14]. This fact can be exploited to
reduce the amount of computations necessary to obtain the displacement map. Typically,
this algorithm makes use of only 3 values of lags within a predicted region to make an
estimate of the displacement of a window [14]. In order to obtain the displacement map,
the displacements of the windows are calculated in a manner very similar to that of raster
. The displacement of the very first window in the first row is calculated using
the generalized cross correlation method. Now the position of the peak of the correlation
value of the position of the peak is used to obtain the correlation
17
(a) Example of ideal displacement map obtained from a simulated medium
% applied strain. (b) Corresponding estimated
FFT algorithm (after median filtering).
algorithm makes use of the fact that
neighboring regions of the tissue are almost the same biologically and undergo similar
. This fact can be exploited to
to obtain the displacement map. Typically,
this algorithm makes use of only 3 values of lags within a predicted region to make an
. In order to obtain the displacement map,
alculated in a manner very similar to that of raster
. The displacement of the very first window in the first row is calculated using
the generalized cross correlation method. Now the position of the peak of the correlation
value of the position of the peak is used to obtain the correlation
value for next window (to the right of the current window) only at that particular value.
The correlation values are computed for positions preceding and succeeding the
predicted peak. These values are used for parabolic interpolation and the improved
correlation coefficient is obtained.
the entire first row and similarly repeated for all other rows to obtain the complete
displacement map.
(a)
Fig. 6. (a) Example of ideal displacement map obtained from a simulated
containing a hard inclusion
displacement map obtained
The prediction of the search bracket from one window to the
occasional errors. These errors could be due to a multitude of reasons like a region that is
value for next window (to the right of the current window) only at that particular value.
The correlation values are computed for positions preceding and succeeding the
ese values are used for parabolic interpolation and the improved
correlation coefficient is obtained. This is repeated to obtain the time delay estimates of
the entire first row and similarly repeated for all other rows to obtain the complete
(b)
(a) Example of ideal displacement map obtained from a simulated
a hard inclusion at 1 % applied strain. (b) Corresponding estimated
displacement map obtained using GCC-PE algorithm (after median filtering)
The prediction of the search bracket from one window to the next may genera
occasional errors. These errors could be due to a multitude of reasons like a region that is
18
value for next window (to the right of the current window) only at that particular value.
The correlation values are computed for positions preceding and succeeding the
ese values are used for parabolic interpolation and the improved
This is repeated to obtain the time delay estimates of
the entire first row and similarly repeated for all other rows to obtain the complete
(a) Example of ideal displacement map obtained from a simulated medium
at 1 % applied strain. (b) Corresponding estimated
PE algorithm (after median filtering).
next may generate
occasional errors. These errors could be due to a multitude of reasons like a region that is

19
a boundary between hard and soft part of a tissue. In those cases, predicted position may
turn out to be incorrect. An array with the values of the predicted position of the peak is
maintained. If the prediction turns out to be correct (a threshold of 0.9 is used in the
implementation), the value of the prediction array is updated with the previously
predicted position value. In case the prediction is poor, the value of correlation
coefficient is lower than the threshold, the predicted value is discarded and the
displacement is computed using the standard generalized cross correlation TDE method
and that position of the peak is used for the next prediction and so on. This search is
carried out only if the prediction fails .This ensures that the standard algorithm is run
only for a small region and not on the entire RF data as it was done earlier. On analysis
with different test samples, the recovery search (search to find out the peak when
prediction failed) to find the new peak was triggered on an average only in 2-3 % of all
the windows. This drastically reduces the time required to obtain the displacement map.
However, in highly heterogeneous tissues, this number could be significantly higher. An
example of simulated displacement map obtained using the GCC-PE is shown in Fig. 6.
D. Fractional Fourier Transform
Fractional Fourier Transform is a linear transformation which is a generalization of the
Fourier Transform. Fractional Fourier transform [15] of a signal f (t) is defined as
23�4� = 5�1 − 7. cot 9� 12; . <= >?�@�.A�� . B [<�= >C> �@�ADE=FGD �@�D�� )H�H . I�J�KJ �3.5�
where α = a. π/2 and 4 is the complex frequency;
20
The kernel inside the square rackets in Eq 3.5 is a chirp function and hence the above
transformation can be interpreted as a coordinate transformation in which the chirp
functions play the role of basis functions.
a) When a =1, i.e. α = π/2, the Fractional Fourier transform simplifies as
23�4� = 1√2; B f�t�exp �−jH�H 4J�KJ
which is the conventional Fourier transform.
b) When a = 0, the equation simplifies to the identity operation, which is the time
domain signal itself.
Fractional Fourier Transform provides an additional parameter ‘a’ when
compared to the traditional Fourier transform. This parameter ‘a’ provides more
flexibility as compared to the traditional Fourier transform, which can be utilized in
many applications. For any value of ‘a’ between 0 and 1, Fractional Fourier transform
can be imagined as the rotation of the signal which is determined by the parameter ‘a’ in
the time-frequency axis, thus giving a transform domain which gives both time and
frequency information [15]. Thus, Fractional Fourier transform based estimators are
linear estimators which are of much broader class than the Fourier transform based
Generalized cross correlation estimators.
One of the significant applications of Fractional Fourier transform is in the area
of signal filtering and estimation [16]. The reasoning behind using Fractional Fourier
transform for filtering is that there are circumstances where elimination of noise is not
possible just either in time domain or frequency domain while it is possible in certain
Fractional Fourier transform domain [16].

While the use of FFT to obtain time delay estimates is optimal when the system
and signals involved are time invariant, it may not be optimal for time varying signals
and systems [16]. Thus in this study, we explore the use of FRFT for elastogra
applications, which has never been proposed so far. A schematic for obtaining the peak
of fractional correlation is shown in Fig 7.
Fig. 7. Schematic for obtaining the peak of fractional correlation
To find the optimal value of ‘a’, we compute f
values of ‘a’ evenly spaced out between 0 and 1 is found out. Fractional correlation is
computed by taking the Fractional
multiplying it with the conjugated Fractional
While the use of FFT to obtain time delay estimates is optimal when the system
and signals involved are time invariant, it may not be optimal for time varying signals
. Thus in this study, we explore the use of FRFT for elastogra
applications, which has never been proposed so far. A schematic for obtaining the peak
of fractional correlation is shown in Fig 7.
. Schematic for obtaining the peak of fractional correlation.
To find the optimal value of ‘a’, we compute fractional correlations
values of ‘a’ evenly spaced out between 0 and 1 is found out. Fractional correlation is
Fractional Fourier transform of pre compression window and
multiplying it with the conjugated Fractional Fourier transform of post compression
21
While the use of FFT to obtain time delay estimates is optimal when the system
and signals involved are time invariant, it may not be optimal for time varying signals
. Thus in this study, we explore the use of FRFT for elastography
applications, which has never been proposed so far. A schematic for obtaining the peak
ractional correlations [17] for
values of ‘a’ evenly spaced out between 0 and 1 is found out. Fractional correlation is
pre compression window and
post compression

window, and by finally performing
obtained product [17]. The value corresponding to the peak of all fractional correlation
coefficient is stored in an array and the maximum of al
correlation coefficient is used as the correct estimate of displacement.
simulated displacement map obtained using the GCC
(a)
Fig. 8. (a) Example of ideal displacement map obtained from a simulated
containing a hard inclusion
displacement map obtained using GCC
E. Sum of Squared Differences
Sum of Squared Differences (SSD) and Sum of Absolute Differences (SAD)
algorithms where the displacement is found out by measuring the delay that minimizes
R� (Euclidean distance) and
performing a conventional inverse Fourier transform
The value corresponding to the peak of all fractional correlation
coefficient is stored in an array and the maximum of all the peaks of all fractional
correlation coefficient is used as the correct estimate of displacement. An example of
simulated displacement map obtained using the GCC-FRFT is shown in Fig. 8.
(b)
a) Example of ideal displacement map obtained from a simulated
a hard inclusion at 1 % applied strain. (b) Corresponding estimated
displacement map obtained using GCC-FRFT algorithm (after median filtering)
Sum of Squared Differences (SSD) and Sum of Absolute Differences
Sum of Squared Differences (SSD) and Sum of Absolute Differences (SAD)
algorithms where the displacement is found out by measuring the delay that minimizes
nce) and R� (Taxicab or Manhattan norm) norms respectively
22
Fourier transform on the
The value corresponding to the peak of all fractional correlation
l the peaks of all fractional
An example of
FRFT is shown in Fig. 8.
a) Example of ideal displacement map obtained from a simulated medium
at 1 % applied strain. (b) Corresponding estimated
FRFT algorithm (after median filtering).
(SSD) and Sum of Absolute Differences (SAD)
Sum of Squared Differences (SSD) and Sum of Absolute Differences (SAD) are TDE
algorithms where the displacement is found out by measuring the delay that minimizes
(Taxicab or Manhattan norm) norms respectively

between the pre compression and the post compression signals
of this method is similar to that of the generalized cross correlation method except that
the part of the code where correlation is computed is essentially replaced with the
computation of SSD or SAD. The SSD and SAD functions can be expressed as
#SST�$� = +['��(� − '�U#SVT�$� = +['��(� − '
UThe time delay is computed by finding the value of the delay
or the SAD functions, viz:
W = argY Z,( [#SVT [' #SSTusing the SSD is shown in Fig. 9.
(a)
Fig. 9. (a) Example of ideal displacement map obtained from a simulated medium
containing a hard inclusion
displacement map obtained using the SSD algorithm (after median filtering
between the pre compression and the post compression signals [5]. The implementation
of this method is similar to that of the generalized cross correlation method except that
where correlation is computed is essentially replaced with the
computation of SSD or SAD. The SSD and SAD functions can be expressed as
��( � $�)� '��( � $�)
The time delay is computed by finding the value of the delay $ that minimizes the SSD
SST ). An example of simulated displacement map obtained
using the SSD is shown in Fig. 9.
(b)
9. (a) Example of ideal displacement map obtained from a simulated medium
containing a hard inclusion at 1 % applied strain. (b) Corresponding estimated
displacement map obtained using the SSD algorithm (after median filtering
23
. The implementation
of this method is similar to that of the generalized cross correlation method except that
where correlation is computed is essentially replaced with the
computation of SSD or SAD. The SSD and SAD functions can be expressed as [7]:
�3.6�
�3.7�
that minimizes the SSD
n example of simulated displacement map obtained
9. (a) Example of ideal displacement map obtained from a simulated medium
Corresponding estimated
displacement map obtained using the SSD algorithm (after median filtering).

An example of simulated displacement map obtained using the SAD is shown in
Fig. 10.
(a)
Fig. 10. (a) Example of ideal displacement map
containing a hard inclusion
displacement map obtained using the SAD algorithm (after median filtering)
F. Summary
In this chapter, a selection of different TDE algorithms was discussed. The TDE
methods implemented in this thesis are widely used in clinical elastography
and they are all based on a cost function. We have provided the detailed techniques use
to implement these methods. The implemented TDE methods can provide both axial and
lateral displacement maps. From the displacement maps obtained using these TDE
n example of simulated displacement map obtained using the SAD is shown in
(b)
10. (a) Example of ideal displacement map obtained from a simulated medium
containing a hard inclusion at 1 % applied strain (b) Corresponding estimated
displacement map obtained using the SAD algorithm (after median filtering)
In this chapter, a selection of different TDE algorithms was discussed. The TDE
methods implemented in this thesis are widely used in clinical elastography
they are all based on a cost function. We have provided the detailed techniques use
to implement these methods. The implemented TDE methods can provide both axial and
lateral displacement maps. From the displacement maps obtained using these TDE
24
n example of simulated displacement map obtained using the SAD is shown in
obtained from a simulated medium
(b) Corresponding estimated
displacement map obtained using the SAD algorithm (after median filtering).
In this chapter, a selection of different TDE algorithms was discussed. The TDE
methods implemented in this thesis are widely used in clinical elastography applications
they are all based on a cost function. We have provided the detailed techniques used
to implement these methods. The implemented TDE methods can provide both axial and
lateral displacement maps. From the displacement maps obtained using these TDE
25
algorithms, elastograms can be obtained using the strain estimation methods explained in
the previous chapter. In the next chapter, we perform a comprehensive image quality
analysis of the axial strain elastograms obtained using the various TDE methods
described in this chapter. Results obtained using different image quality indicators will
be analyzed using standard statistical methods.

26
CHAPTER IV
PERFORMANCE INDICATORS AND RESULTS
In order to compare the performance of the different time day estimation techniques
implemented in this thesis, a study was carried out by applying the time delay estimation
algorithms to media with different mechanical properties which were simulated. Using
the obtained elastograms, an image quality analysis was performed. The quality of the
elastograms was quantified using image quality factors typically used in elastography
studies [2]. These include: the elastographic signal-to-noise ratio (SNRe), the
elastographic contrast-to-noise ratio (CNRe), sensitivity and dynamic range. In this
study, the spatial resolution was not evaluated as the elastographic spatial resolution is
fundamentally limited by the physics of the ultrasound system and the window length
(which was kept the fixed in the implementation of the TDE techniques) [8].
In general, the image quality factors in elastography obtained depend on the
following parameters:
1. Quality of Time Delay Estimates obtained from various TDE algorithms [13].
2. Transducer Parameters. (Transducer center frequency, Bandwidth, Beamwidth,
Sampling frequency) [2].
3. Signal Processing Parameters. (Length of the window, Percentage of overlap) [2],
[18].
4. Mechanical Parameters. (Elastic modulus, Poisson's ratio) [2].

27
The transducer, signal processing and mechanical parameters are interdependent and
their values must be chosen together in such a way so as to obtain a quality elastogram
[2]. For example, the window length (signal processing parameter) must be a function of
ultrasound wavelength (transducer parameter). A change in transducer parameters
should influence the signal processing parameters as well. In this study, the transducer,
signal processing and mechanical parameters are fixed for all algorithms to evaluate
image quality of the various TDE algorithms under the exact same conditions.
A. Image Quality Parameters
The parameters that are used to determine the quality of the obtained elastographic
image are
1. Elastographic Signal-to-noise Ratio (SNRe) [8].
2. Elastographic Contrast-to-noise Ratio (CNRe) [8].
3. Elastographic Dynamic Range [4].
4. Elastographic Sensitivity [2].
5. Computational Time.
1. Elastographic Signal-to-Noise Ratio
Signal to noise ratio is a measure of the signal strength (or power) relative to the noise.
The elastographic SNR has been defined as [8]
^*#_ = a (4.1)

28
where b is the mean of the strain in the area of interest in the elastogram and and c is the
standard deviation of the strain in the area of interest in the elastogram. SNRe is usually
computed from uniform media (or uniform regions of strain in the material).
Related to the notion of SNR e is an elastographic theoretical framework, which
has been referred to in the literature as “Strain Filter” [19]. The strain filter is the plot of
the upper bound of achievable SNR e as a function of the applied strain. The strain filter
has a typical bandpass characteristic in the strain domain, indicating that there exist a
range of applied strains for which the SNR e is maximized. At low values of applied
strains, the SNR e is limited by electronic noise effects and at high values, it is limited by
signal decorrelation [19]. Each strain filter curve depends on the signal processing and
system parameters used to obtain the elastogram [19].
The strain filter concept can also be extended to predict elastographic CNR and
dynamic range at a given resolution in terms of the signal processing and system
parameters used to obtain the elastograms [19]. Thus, the strain filter can be used to
quantify the performance of a Time delay estimation algorithm by providing graphically
various image quality parameters.
2. Elastographic Contrast-to-Noise Ratio
Contrast to noise ratio quantifies the ability to distinguish between differences in
intensity in an image.
The elastographic CNR is defined as [8]

29
d*#_ = ��`e�`f��ae�Eaf� (4.2)
where bD and bg are the mean values of the estimated strain in the target and the
background respectively, and cD and cg are the respective standard deviation of the
estimated strains.
3. Elastographic Dynamic Range
Dynamic range [13] in elastography is defined as the difference between the maximum
measurable strain and the minimum measurable strain at a given SNRe. In dB, this ratio
can be expressed as:
W#_ = 20 log jDk3.UlmnjDk3.Ulop (4.3)
Where qJ'r,(s.U and qJ'r,(s3t are the minimum and maximum measurable strain,
respectively, at a given SNRe. For this study, the dynamic range was computed at an
SNRe = 30 dB and using Eq 4.3.
4. Elastographic Sensitivity
Sensitivity is defined as the minimum measurable applied strain at a given value of
SNRe [13]. Sensitivity value quantifies the performance of the time delay estimation
algorithm at low values of applied strain. For this study, the dynamic range was
computed at an SNRe = 30 dB.

30
5. Computational Time
Computational time was estimated on a pixel basis to evaluate the time required for each
of the algorithm to compute a pixel in the elastogram on a computer that runs on a Intel
® Core ™ 2 Duo CPU @ 2 GHz and 2 GB RAM. The algorithms were implemented
using MATLAB (Mathworks, Inc., Natick, MA, USA).
B. Simulation Study
In order to evaluate the performance of the various time delay algorithms, a simulation
study was carried out. The Finite-element (FE) simulated media were generated using a
commercial software package (Comsol Multiphysics 3.5a, Comsol Inc., Palo Alto, CA).
Each phantom had dimensions of 40 mm x 40 mm x 40 mm and was compressed from
the top. Slip boundary conditions at the bottom and a plane-strain state model was
assumed. Several models of simulated media were generated: uniform phantoms (for the
SNRe study) and phantoms containing an inclusion (for the CNRe study). Fig 11 shows
the ideal strain distribution of a uniform medium (a) and a medium containing a hard
inclusion (b).

(a)
Fig. 11. Ideal strain images of (a) T
study (b) The medium containing a hard inclusion used for the CNR
The SNRe was measured on simulated uniform cubic phantoms (elastic modulus
= 2 kPa and Poisson’s ratio = 0.49). The CNR
phantoms containing a 10 mm diameter cylindrical inclusion (background: elastic
modulus = 2 kPa and Poisson’s
Poisson’s ratio = 0.49). The mechanical simulation software provided us with the values
of displacements at each node in the phantom.
mechanical models were then used
data using dedicated ultrasound simulation software routines created in our laboratory.
In all models, a scatterer density of at least 40 scatterers
satisfying the requirement f
(b)
11. Ideal strain images of (a) The uniform simulated medium used for the SNR
he medium containing a hard inclusion used for the CNRe study.
was measured on simulated uniform cubic phantoms (elastic modulus
= 2 kPa and Poisson’s ratio = 0.49). The CNRe was measured on simulated cubic
phantoms containing a 10 mm diameter cylindrical inclusion (background: elastic
modulus = 2 kPa and Poisson’s ratio = 0.49; inclusion: elastic modulus = 10 kPa and
Poisson’s ratio = 0.49). The mechanical simulation software provided us with the values
of displacements at each node in the phantom. The displacements obtained from the
mechanical models were then used to create the pre- and post-compression simulated RF
data using dedicated ultrasound simulation software routines created in our laboratory.
scatterer density of at least 40 scatterers / pulse-width was used,
satisfying the requirement for obtaining fully developed Rayleigh backscatterers.
31
he uniform simulated medium used for the SNRe
study.
was measured on simulated uniform cubic phantoms (elastic modulus
was measured on simulated cubic
phantoms containing a 10 mm diameter cylindrical inclusion (background: elastic
ratio = 0.49; inclusion: elastic modulus = 10 kPa and
Poisson’s ratio = 0.49). The mechanical simulation software provided us with the values
The displacements obtained from the
compression simulated RF
data using dedicated ultrasound simulation software routines created in our laboratory.
width was used,
or obtaining fully developed Rayleigh backscatterers. The

32
speed of sound was fixed at 1540 m/s (speed of sound in tissues). The sonographic
signal-to-noise ratio (SNRs) was set at 20 dB by adding other uncorrelated RF A-lines to
both the pre- and post-compression A-lines. The parameters of the simulated ultrasound
transducer had 128 elements, a 6.6 MHz center frequency and 50% fractional bandwidth
at -6 dB, 1 mm beamwidth and 40 MHz sampling frequency.
The performance of the various TDE algorithms implemented in this study is
compared at applied strains ranging from 0.01 % to 10 %. To study the effects of the
window length on the resulting elastograms, different window lengths were considered
(0.5 to 4 mm). The window overlap was fixed at 80% the window length. The stretching
factor was assumed to be equal to the applied strain. From the simulated pre and post
compression RF signals, displacement maps were obtained using the various TDE
algorithms. In all cases, least squares strain estimation method was used to obtain the
elastogram. For statistical purposes, 50 independent realizations were used for each case
considered.
C. Experimental Validation
In addition to simulations and as a proof-of-principle, the applicability of the various
TDE techniques implemented in this study was tested on a set of experimental RF data
obtained from a tissue mimicking phantom. These experimental data were acquired
using a 38 mm real-time linear array scanner Sonix RP (Ultrasonix, Richmond, BC,
Canada) that has 128 elements, a bandwidth between 5-14 MHz, a center frequency of

33
6.6 MHz, 50% fractional bandwidth at -6 dB, sampling frequency of 40 MHz, applied
strain percentage of 0.001 % and 1 mm beamwidth at the focus.
D. Statistical Analysis of Results
Statistical comparison of the results (SNRe, CNRe, Sensitivity and Dynamic Range)
obtained from the different TDE techniques were performed using t-testing and
confidence interval bounds [12].
E. Simulation Results
Fig 12 shows examples of elastograms obtained using the various TDE methods
implemented in this study as applied to the uniform simulated medium at a 5% applied
strain.

(a)
(d)
Fig. 12. (a) Ideal strain image at
GCC-FFT (c) GCC-PE (d) GCC
Figs. 13-18 show the effect of window length (0.5 mm, 2 mm, 4 mm) on the
estimated strains using the various TDE algorithms implemented in this
applied strain). The improvement of CNR
resolution at increased window lengths can be observed in these figures
(b) (c)
(e) (f)
(a) Ideal strain image at 5% applied strain. Elastograms obtained using
(d) GCC-FRFT (e) SSD (f) SAD.
18 show the effect of window length (0.5 mm, 2 mm, 4 mm) on the
estimated strains using the various TDE algorithms implemented in this
The improvement of CNRe as well as corresponding loss in spatial
resolution at increased window lengths can be observed in these figures [18]
34
(c)
(f)
obtained using (b)
18 show the effect of window length (0.5 mm, 2 mm, 4 mm) on the
estimated strains using the various TDE algorithms implemented in this study (at a 1%
as well as corresponding loss in spatial
[18].

35
(a) (b) (c)
Fig. 13. Examples of elastograms obtained using GCC-FFT at different window lengths:
(a) 0.5 mm (b) 2 mm (c) 4 mm.
(a) (b) (c)
Fig. 14. Examples of elastograms obtained using GCC-PE at different window lengths:
(a) 0.5 mm (b) 2 mm (c) 4 mm.
20 40 60 80 100 120
50
100
150
200
250
300
20 40 60 80 100 120
10
20
30
40
50
60
70
80
20 40 60 80 100 120
5
10
15
20
25
30
35
20 40 60 80 100 120
50
100
150
200
250
300
20 40 60 80 100 120
10
20
30
40
50
60
70
80
20 40 60 80 100 120
5
10
15
20
25
30
35

36
(a) (b) (c)
Fig. 15. Examples of elastograms obtained using GCC-FRFT at different window
lengths: (a) 0.5 mm (b) 2 mm (c) 4 mm.
(a) (b) (c)
Fig. 16. Examples of elastograms obtained using SSD at different window lengths: (a)
0.5 mm (b) 2 mm (c) 4 mm.
20 40 60 80 100 120
50
100
150
200
250
300
20 40 60 80 100 120
10
20
30
40
50
60
70
80
20 40 60 80 100 120
5
10
15
20
25
30
35
20 40 60 80 100 120
50
100
150
200
250
300
20 40 60 80 100 120
10
20
30
40
50
60
70
80
20 40 60 80 100 120
5
10
15
20
25
30
35

37
(a) (b) (c)
Fig. 17. Examples of elastograms obtained using SAD at different window lengths:
(a) 0.5 mm (b) 2 mm (c) 4 mm.
F. Results- Image Quality Analysis
1. SNRe
Fig 18 shows the strain filter curves corresponding to the different algorithms cross
correlation based algorithms implemented in this study. Each point in the graph is an
average over 50 independent realizations; the error bars represent the standard deviation.
It can be seen from this graph that all GCC algorithms have similar performance with
respect to SNRe in the range of strains considered in this study. For very low strains, the
GCC-FFT algorithm appears to outperform the other GCC methods.
20 40 60 80 100 120
50
100
150
200
250
300
20 40 60 80 100 120
10
20
30
40
50
60
70
80
20 40 60 80 100 120
5
10
15
20
25
30
35

38
Fig. 18. Strain filters corresponding to the Generalized Cross Correlation methods
implemented in this study.
Fig 19 shows simulated strain filter curves corresponding to the SAD and SSD
algorithms implemented in this study. It can be seen from these graphs that the SSD
method appears to outperform the SAD method for most values of applied strains.
-1 -0.5 0 0.5 1
0
10
20
30
40
log (Applied Strain)
SN
Re
GCC-FFT
GCC-PE
FRFT

39
Fig. 19. Strain filters corresponding to the SSD and SAD methods implemented in this
study.
Table I shows the values of SNR obtained for the various TDE algorithms for the
range of applied strains considered in this study. From the SNR values, it can be seen
that the images obtained using GCC-FFT and GCC-FRFT methods have higher values
of SNRe for most values of applied strains as compared to the other methods.
-1 -0.5 0 0.5 1-10
0
10
20
30
40
50
log(Applied strain)
SN
Re
SSD
SAD

40
Table I. SNRe values for the various algorithms for different values of applied strains.
Applied
Strain %
GCC-FFT GCC-PE GCC-
FRFT
SSD SAD
0.05 15.6848 -0.3713 2.3775 4.9217 -8.6363
0.1 15.2313 11.9307 13.83 14.0346 5.0704
0.5 31.6763 29.4375 31.68 31.842 29.0279
1 45.1074 45.2014 45.1 43.6747 47.6906
2 44.7227 44.7659 44.72 44.22 44.9321
3 43.4051 43.1903 43.40 43.2186 38.6313
5 42.2105 42.286 38.22 42.0449 35.6311
10 31.2227 31.3055 27.92 25.3672 26.0959
Table II shows the results of the statistical analysis performed to test for the
presence of statistically significant differences among the SNRe measurements as
obtained from the various TDE algorithms. In Table II, we indicate the values of strains
for which the p-value computed on the SNRe results of two different algorithms is less
than 0.05, which would indicate a statistically significant difference between the two sets
of results at a 95% confidence level. This table confirms that the findings reported in
Table 1 are statistically significant.

41
Table II. Strains for which the p-value between sets of measurements of SNRe obtained
using two algorithms were found < 0.05.
GCC-FFT GCC-PE GCC-FRFT SSD SAD
GCC-FFT - 0.05%, 0.1%,
0.5%
0.05%,
0.1%, 0.5%,
10%
All applied
strains,
except 3%
and 5%
All applied
strains,
except 2%
GCC-PE 0.05%,
0.1%,
0.5%
- All applied
strains,
except 1%,
3% and 5%
All applied
strains,
except 3%
and 5%
All applied
strains,
except 3%
and 5%
GCC-FRFT 0.05%,
0.1%, 0.5%,
10%
All applied
strains, except
1%, 3% and
5%
- All applied
strains,
except 0.5%
and 3%
All applied
strains,
except 2%
and 10%
SSD All applied
strains,
except 3%
and 5%
All applied
strains, except
3% and 5%
All applied
strains,
except 0.5%
and 3%
- All applied
strains
SAD All applied
strains,
except 2%
All applied
strains, except
0.5% and 2%
All applied
strains,
except 2%
and 10%
All applied
strains
-
2. CNRe
Fig 20 shows the CNRe as a function of strain for the different GCC algorithms
implemented in this study. Each point in the graph is an average over 50 independent
realizations; the error bars represent the standard deviation. It can be inferred from these
curves that the performances of GCC- FFT method and GCC-FRFT are similar for most
values of applied strains except at very low (at 0.01 % GCC-FFT performs better) and

42
very high values of strains (at 10 % GCC-FRFT performs better). It can also be noted
that the GCC-FFT method outperforms the GCC-PE at all the applied strains.
Fig. 20. CNRe as a function of strain for Generalized cross correlation (GCC) methods.
Fig 21 shows the CNRe as a function of strain for the SSD and SAD algorithms
implemented in this study.
-2 -1.5 -1 -0.5 0 0.5 1-60
-45
-30
-15
0
15
30
45
60
log(Applied Strain)
CN
Re
GCC
CPE
FRFT

43
Fig. 21. CNRe as a function of strain for the SSD and SAD methods.
Table III shows the values of CNRe obtained for various algorithms at different
values of applied strains.
Table III. CNRe values for the various algorithms for different values of applied strains.
Applied
Strain (%)
GCC-FFT GCC-PE GCC-FRFT SSD SAD
0.01 11.8507 7.685 6.06 10.8656 20.16
0.05 34.3976 29.9286 34.32 34.7383 36.0595
0.1 42.9188 36.304 42.89 41.0946 35.1714
0.5 47.1768 40.0102 47.18 44.6693 28.1369
1 51.0146 46.5297 50.98 48.5919 53.6217
2 49.9445 49.3774 49.925 47.5814 52.64
3 50.2566 49.3224 50.27 48.0536 51.7895
5 45.0803 44.6614 40.9 -24.5763 16.8963
10 -33.7706 -33.7584 13.92 -30.4459 -29.8481
-2 -1.5 -1 -0.5 0 0.5 1
-50
-35
-20
-5
10
25
40
55
log(Applied strain)
CN
Re
SSD
SAD

44
The results reported in Table III suggest that the GCC algorithms outperform
SSD and SAD methods, especially at higher values of applied strains (this difference is
also visible from the strain elastograms shown earlier).
These observations were verified statistically by computing the p-values, which
are reported in Table IV. In Table IV, we indicate the values of strains for which the p-
value computed on the CNRe results of two different algorithms is less than 0.05, which
would indicate a statistically significant difference between the two sets of results at a
95% confidence level. From Table IV, GCC-FFT and GCC-FRFT indicate that they are
statistically similar for most values of the applied strains except at very low (0.1 %) and
high values (10 %) of strains.

45
Table IV. Strains for which the p-value between sets of measurements of CNRe
obtained using two algorithms were found < 0.05.
GCC-FFT GCC-PE GCC-FRFT SSD SAD
GCC-FFT - All applied
strains,
except 2%
5% and 10%
0.1% and
10%
All applied
strains,
except
0.05% and
10%
All applied
strains,
except 5%
and 10%
GCC-PE All applied
strains,
except 2%
5% and 10%
- All applied
strains,
except
0.01% and
2%
All applied
strains,
except
0.01% and
10%
All applied
strains,
except 0.1%
and 10%
GCC-FRFT 0.1% and
10%
All applied
strains,
except
0.01% and
2%
- All applied
strains,
except
0.05%
All applied
strains
SSD All applied
strains,
except
0.05% and
10%
All applied
strains,
except
0.01% and
10%
All applied
strains,
except
0.05%
- All applied
strains,
except 10%
SAD All applied
strains,
except 5%
and 10%
All applied
strains,
except 0.1%
and 10%
All applied
strains
All applied
strains,
except 10%
-
3. Dynamic Range
Table V shows the values of dynamic range obtained for the various algorithms
considered in this study. As we can see from the table, the values of dynamic range of
GCC methods and SSD are fairly close to each other, while SAD appears to suffer of a
lower dynamic range than the other methods.

46
Table V. Dynamic range estimated for the various TDE algorithms implemented in this
study.
TDE Algorithm Uniform case(dB) Inclusion case(dB)
GCC-FFT 29.13 43.83
GCC-PE 27.92 38.19
FRFT 26.36 44.51
SSD 25.8 39.45
SAD 23.34 18.38
Table VI reports the results of the statistical analysis performed on the dynamic
range results. In Table VI, the actual p-values found out using t-testing is reported.
Table VI. p-values obtained for dynamic range measurements.
GCC-FFT GCC-PE GCC-FRFT SSD SAD
GCC-FFT - 0.002 0 0 0
GCC-PE 0.002 - 0.0001 0 0
GCC-FRFT 0 0.0001 - 0.013 0
SSD 0 0 0.013 - 0
SAD 0 0 0.013 0 -
From the Tables V and VI, it can be seen that the dynamic range associated with
GCC methods is statistically significantly higher than that of SSD and SAD methods.

47
4. Sensitivity
Table VII shows the results of the sensitivity study performed on the algorithms
implemented in this study.
Table VII. Sensitivity of the various algorithms.
TDE Algorithm Uniform case(%) Inclusion case(%)
GCC-FFT 0.4248 0.037
GCC-PE 0.496 0.0477
FRFT 0.43 0.039
SSD 0.4236 0.0367
SAD 0.518 0.52
Overall, the sensitivity values of GCC-FFT and SSD algorithms were found to be
better than the other algorithms. From the p-values reported in Table VIII, it can be seen
that the sensitivity of GCC-FFT and SSD algorithms is statistically significantly higher
than the sensitivity of the other algorithms.

48
Table VIII. p-values obtained for sensitivity measurements.
GCC-FFT GCC-PE GCC-FRFT SSD SAD
GCC-FFT - 0 0.03 0.63 0
GCC-PE 0 - 0 0 0.01
GCC-FRFT 0.03 0 - 0.007 0
SSD 0.63 0 0.007 - 0
SAD 0 0.01 0 0 -
5. Computational Time
Table IX shows the results of the computational time study performed on the algorithms
implemented in this study.
Table IX. Computational time per pixel [s] for the various algorithms implemented in
this study.
Algorithm Time to calculate displacement for one pixel (sec)
GCC-FFT 4.4497e-004 ± 1.9538e-005
GCC-PE 1.1649e-004 ± 4.2218e-006
GCC-FRFT 0.0532 ± 0.0039
SSD 0.0033 ± 1.6258e-004
SAD 0.0035 ± 2.6729e-004

In our implementations of the various TDE algorithms, the GCC
the fastest of all methods, followed by the GCC
SAD methods, instead, appear to be significantly slower. These results are expected
because, as previously explained, the PE method uses prior knowledge to reduce
computational time.
G. Experimental Results
Figures 22 and 23 show experimental results obtained from a phantom containing a
cylindrical inclusion. These results were used just as a proof o
applicability of the various algorithms to real data. These results were not used for
statistical analysis.
GCC-FFT
Fig. 22. Experimental results obtained using the GCC methods.
In our implementations of the various TDE algorithms, the GCC
the fastest of all methods, followed by the GCC-FFT method. The GCC-FRFT, SSD and
SAD methods, instead, appear to be significantly slower. These results are expected
viously explained, the PE method uses prior knowledge to reduce
Figures 22 and 23 show experimental results obtained from a phantom containing a
cylindrical inclusion. These results were used just as a proof of principle of the
applicability of the various algorithms to real data. These results were not used for
GCC-PE GCC
. Experimental results obtained using the GCC methods.
49
In our implementations of the various TDE algorithms, the GCC-PE method is
FRFT, SSD and
SAD methods, instead, appear to be significantly slower. These results are expected
viously explained, the PE method uses prior knowledge to reduce
Figures 22 and 23 show experimental results obtained from a phantom containing a
f principle of the
applicability of the various algorithms to real data. These results were not used for
-FRFT

SSD
Fig. 23. Experimental results obtained using the SSD and SAD methods.
H. Summary
In this chapter, we reported the technical details relative to the various TDE algorithms
implemented in this study. We also reported a statistical analysis on the performance of
these algorithms using simulations. These results suggest that the GCC methods
outperform SSD and SAD methods for all image quality factors analyzed for this study.
SAD
Experimental results obtained using the SSD and SAD methods.
In this chapter, we reported the technical details relative to the various TDE algorithms
implemented in this study. We also reported a statistical analysis on the performance of
hese algorithms using simulations. These results suggest that the GCC methods
outperform SSD and SAD methods for all image quality factors analyzed for this study.
50
In this chapter, we reported the technical details relative to the various TDE algorithms
implemented in this study. We also reported a statistical analysis on the performance of
hese algorithms using simulations. These results suggest that the GCC methods
outperform SSD and SAD methods for all image quality factors analyzed for this study.

51
CHAPTER V
CONCLUSIONS AND FUTURE WORK
A. Conclusions
In this thesis, a comparative study of various time delay estimation algorithms for
elastography was performed. The TDE methods considered included: methods based on
generalized cross correlation, methods based on sum of squared differences, and
methods based on sum of absolute differences. Within the generalized cross correlation
methods, we considered: FFT-based method, correlation with prior estimates, and
Fractional Fourier Transform method. The performance of the various TDE techniques
was statistically analyzed based on various performance indicators. Based on the results
of the analysis performed in this study, performance indicators of correlation-based
algorithms are statistically significantly higher than performance indicators of SSD and
SAD algorithms both at low strains and high strains. This would indicate that
correlation-based algorithms are more sensitive and more robust than SSD and SAD
methods.
Within the class of GCC methods, the FFT-based method appears to outperform
the other GCC methods considered for this study. Though correlation with prior
estimates outperforms other algorithms in terms of speed of computation, the quality of
the image produced appears to be compromised when compared to the FFT generalized
cross correlation method.

52
The Fractional Fourier Transform based algorithm theoretically finds normalized
correlation coefficient that are greater than or equal to those obtained from FFT
generalized cross correlation method. Its performance in terms of CNR is better than
GCC-FFT at high values of strains but at applied strains its performance is statistically
comparable with the performance of GCC-FFT, with the disadvantage of being
significantly slower.
B. Future Work
The algorithms considered in this study were all based on cost functions. In the future,
the study could be extended to algorithms based on individual sample tracking [20] or
zero-crossing methods. .
Though all the algorithms that were implemented in this study are capable of
obtaining both axial and lateral displacement and strain estimations, their performances
were investigated only for the axial case. However, an analysis of the performance of
these algorithms for the lateral case is currently undergoing.
Finally, the simple simulation models used in this work are based on simplistic
noise conditions and, thus, represent an optimistic scenario with respect to real data. In
this study, we reported a proof-of-principle of the applicability of these algorithms to
experimental real data, but no statistical analysis could be performed on these data. In
the future, it will be very important to extend this study to real data and test the
performance of these algorithms in situations of clinical interest.
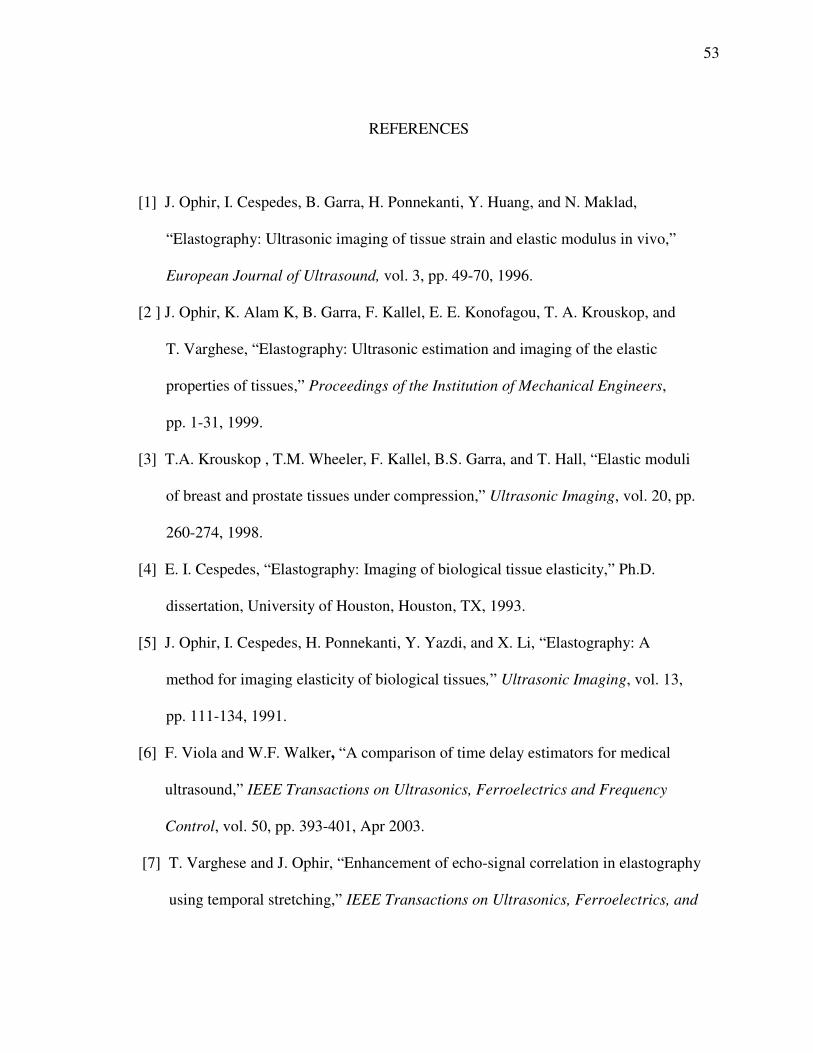
53
REFERENCES
[1] J. Ophir, I. Cespedes, B. Garra, H. Ponnekanti, Y. Huang, and N. Maklad,
“Elastography: Ultrasonic imaging of tissue strain and elastic modulus in vivo,”
European Journal of Ultrasound, vol. 3, pp. 49-70, 1996.
[2 ] J. Ophir, K. Alam K, B. Garra, F. Kallel, E. E. Konofagou, T. A. Krouskop, and
T. Varghese, “Elastography: Ultrasonic estimation and imaging of the elastic
properties of tissues,” Proceedings of the Institution of Mechanical Engineers,
pp. 1-31, 1999.
[3] T.A. Krouskop , T.M. Wheeler, F. Kallel, B.S. Garra, and T. Hall, “Elastic moduli
of breast and prostate tissues under compression,” Ultrasonic Imaging, vol. 20, pp.
260-274, 1998.
[4] E. I. Cespedes, “Elastography: Imaging of biological tissue elasticity,” Ph.D.
dissertation, University of Houston, Houston, TX, 1993.
[5] J. Ophir, I. Cespedes, H. Ponnekanti, Y. Yazdi, and X. Li, “Elastography: A
method for imaging elasticity of biological tissues,” Ultrasonic Imaging, vol. 13,
pp. 111-134, 1991.
[6] F. Viola and W.F. Walker, “A comparison of time delay estimators for medical
ultrasound,” IEEE Transactions on Ultrasonics, Ferroelectrics and Frequency
Control, vol. 50, pp. 393-401, Apr 2003.
[7] T. Varghese and J. Ophir, “Enhancement of echo-signal correlation in elastography
using temporal stretching,” IEEE Transactions on Ultrasonics, Ferroelectrics, and

54
Frequency Control, vol. 44, no. 1, Jan 1997.
[8] S. Srinivasan, R. Righetti, and J. Ophir, “Tradeoffs between signal to noise ratio
and axial resolution in ultrasound elastography,” Ultrasound in Med. & Biol., vol.
29, no. 6, pp. 847–866, 2003.
[9] Stanford University Center for Computer Research in Music and Acoustics,
“Matlab for Parabolic Peak Interpolation,” https://ccrma.stanford.edu/~jos/sasp/M-
atlab _Parabolic_Peak_Interpolation.html, accessed in Jan 2010.
[10] S. Srinivasan, J. Ophir, and S.K. Alam, “Elastographic imaging using staggered
strain estimates,” Ultrasonic Imaging, vol. 24, pp. 229- 245, 2002.
[11] F. Kallel and J. Ophir, “A least squares estimator for elastograph, Ultrasonic
Imaging,” vol. 19, no. 3, pp. 195-208, 1997.
[12] J. Bendat, and A. Piersol, Random Data: Analysis and Measurement Procedure,
John Wiley and Sons, New York, 1986.
[13] T. Varghese and J. Ophir, “Performance optimization in elastography: Multi-
compression with temporal stretching,” Ultrasonic Imaging, vol. 18, pp. 193-
214, 1996.
[14] R. Zahiri-Azar and S. Salcudean, "Motion estimation in ultrasound images using
time domain cross correlation with prior estimates," IEEE Transactions on
Biomedical Imaging, vol. 53, no. 10, pp. 1990-2000, Oct 2006.
[15] Wikipedia, “Fractional Fourier Transform,” http://en.wikipedia.org/wiki/Fraction-
al_Fourier_Transform, accessed in May 2010.
[16] M.A. Kutay, H.M. Ozaktas, O. Arikan, and L. Onural, “Optimal filtering in

55
fractional Fourier Domains,” IEEE Transactions on Signal Processing, vol. 45,
no. 5, pp. 1129 – 1143, May 1997.
[17] Y. Bitran, Z. Zalevsky, D. Mendlovic, and R.G. Dorsch, “Fractional correlation
operation: performance analysis,” Applied Optics, vol. 35, pp. 297-303, 1996.
[18] R. Righetti, J. Ophir, and P. Ktonas, “Axial resolution in elastography,” Ultra-
sound in Med. & Biol., vol. 28, no. 1, pp. 101-113, 2002.
[19] T. Varghese and J. Ophir, “A theoretical framework for performance
characterization of elastography: The strain filter,” IEEE Transactions on
Ultrasonics, Ferroelectrics, and Frequency Control, vol. 44, pp. 164-172, no. 1,
Jan 1997.
[20] R. Zahiri-Azar and S. Salcudean, “Time delay estimation in ultrasound echo
signals using individual sample tracking,” IEEE Transactions on Ultrasonics,
Ferroelectrics, and Frequency Control, vol. 55, no. 12, Dec 2008.

56
VITA
Name: Srinath Sambasubramanian
Address: Department of Electrical and Computer Engineering,
Texas A&M University,
214 Zachry Engineering Center,
TAMU 3128,
College Station, Texas 77843-3128
Education: B.Tech, Instrumentation and Control Engineering
National Institute of Technology, Trichy, 2005
M.S., Electrical Engineering, Texas A&M University, 2010