comparison of us and eu programs to control light- duty vehicle
TRANSCRIPT

Comparison of US and EU programs to control light-duty vehicle emissions
Kate Blumberg, Francisco Posada
April 8, 2015

§ Overview on new vehicle standards§ Weight classifications§ Test cycles
§ New vehicle emissions standards§ Limit values§ Durability§ Evaporative emissions§ OBD
§ New vehicle greenhouse gas standards§ Compliance and enforcement of new vehicle standards§ Standards and programs for vehicles in circulation
§ Vehicle inspection§ Remote sensing § Low emission zones
Slide 2Outline

US & California European UnionFuel quality • Gasoline: 30 ppm sulfur average / 80 max
(2006); 10 ppm average / 80 max (2017)• Diesel: 15 ppm sulfur max (2007)
• Gasoline & diesel: 50 ppm sulfur max (2005)• Gasoline & diesel: 10 ppm sulfur max (2009)
Test cycle Federal Test Procedures + Supplemental Cycles:• FTP-75 (city cycle, includes cold start)• US06 (high speed)• SC03 (air conditioning)• HWFET (highway cycle, fuel economy only)
New European Drive Cycle:• NEDC (city and extra urban, includes cold start)World-Harmonized Light-Duty Vehicle Test Procedure: • WLTP (cold start, low, medium, high and aggressive
driving in a single cycle)• Expected implementation in 2017
Coverage Emissions:• Tier 2 standards cover all vehicles up to 3,855
kg GVWR and passenger vehicles up to 4,535• LEV II and III and Tier 3 extend coverage to all
complete vehicles up to 6,350 kg GVWRGHG:• Light-duty standards cover all LDVs (up to 3855
kg) and MDPVs (up to 4535kg) • Heavy-duty standards (all other on-road
vehicles, including all trucks above 3855 kg)
Emissions:• Limit values set for passenger cars & light commercial
vehicles by vehicle class/weight up to 2610 kg (RM)CO2:• Passenger car standards apply to vehicles designed for
the carriage of passengers (up to 3.5 tonnes GVWR)• Light commercial vehicle standards include all light
trucks with RM up to 2610 kg in the N1 category (up to 3.5 tonnes GVWR)
Timeframe Emissions:• US Tier 2 (phase in 2004-2009), Tier 3 (phase in 2017-2025)• California LEV II (phase in 2004-2010), LEV III (phase in 2015-2028)GHG:• Light-duty standards include 2012-2016
standards and 2017-2025 standards
Emissions:• Euro 4 (2005 for new vehicle type approval, 2006 all)• Euro 5a (2009 new, 2011 all); 5b (2011 new, 2013 all)• Euro 6 (2014 new, 2015 all); Euro 6c adds RDE (~2017)CO2:• Current standards apply for the 2015 model year. 2020
standards are fully phased in for the 2021 model year and apply for all years beyond, until replaced.
Slide 3Overview
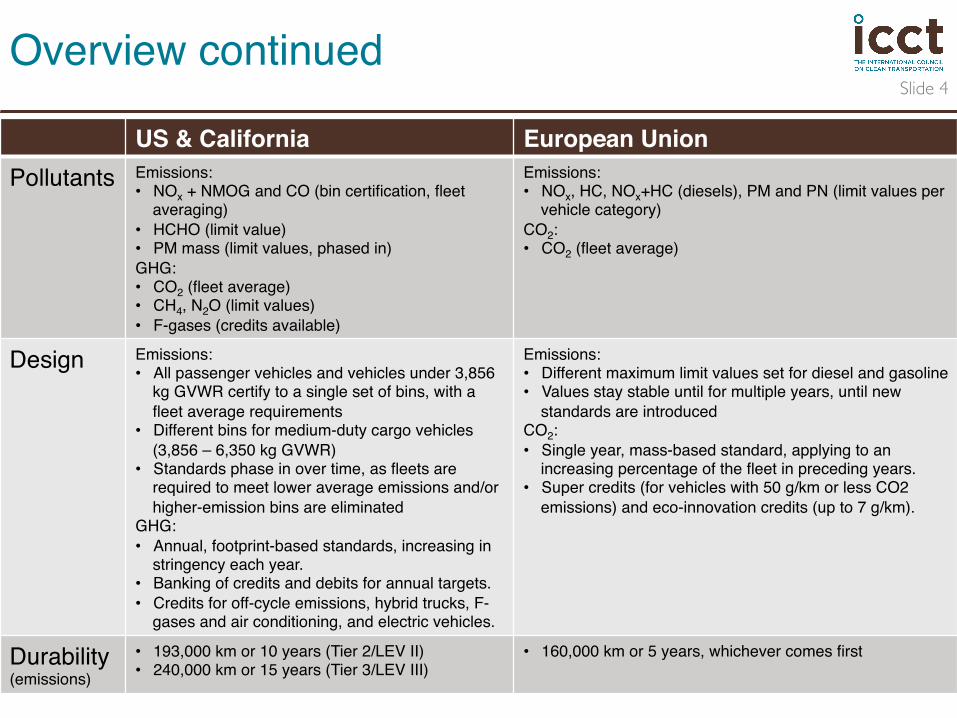
US & California European UnionPollutants Emissions:
• NOx + NMOG and CO (bin certification, fleet averaging)
• HCHO (limit value)• PM mass (limit values, phased in)GHG:• CO2 (fleet average)• CH4, N2O (limit values)• F-gases (credits available)
Emissions:• NOx, HC, NOx+HC (diesels), PM and PN (limit values per
vehicle category)CO2: • CO2 (fleet average)
Design Emissions:• All passenger vehicles and vehicles under 3,856
kg GVWR certify to a single set of bins, with a fleet average requirements
• Different bins for medium-duty cargo vehicles (3,856 – 6,350 kg GVWR)
• Standards phase in over time, as fleets are required to meet lower average emissions and/or higher-emission bins are eliminated
GHG:• Annual, footprint-based standards, increasing in
stringency each year.• Banking of credits and debits for annual targets.• Credits for off-cycle emissions, hybrid trucks, F-
gases and air conditioning, and electric vehicles.
Emissions:• Different maximum limit values set for diesel and gasoline• Values stay stable until for multiple years, until new
standards are introducedCO2:• Single year, mass-based standard, applying to an
increasing percentage of the fleet in preceding years.• Super credits (for vehicles with 50 g/km or less CO2
emissions) and eco-innovation credits (up to 7 g/km).
Durability(emissions)
• 193,000 km or 10 years (Tier 2/LEV II)• 240,000 km or 15 years (Tier 3/LEV III)
• 160,000 km or 5 years, whichever comes first
Slide 4Overview continued
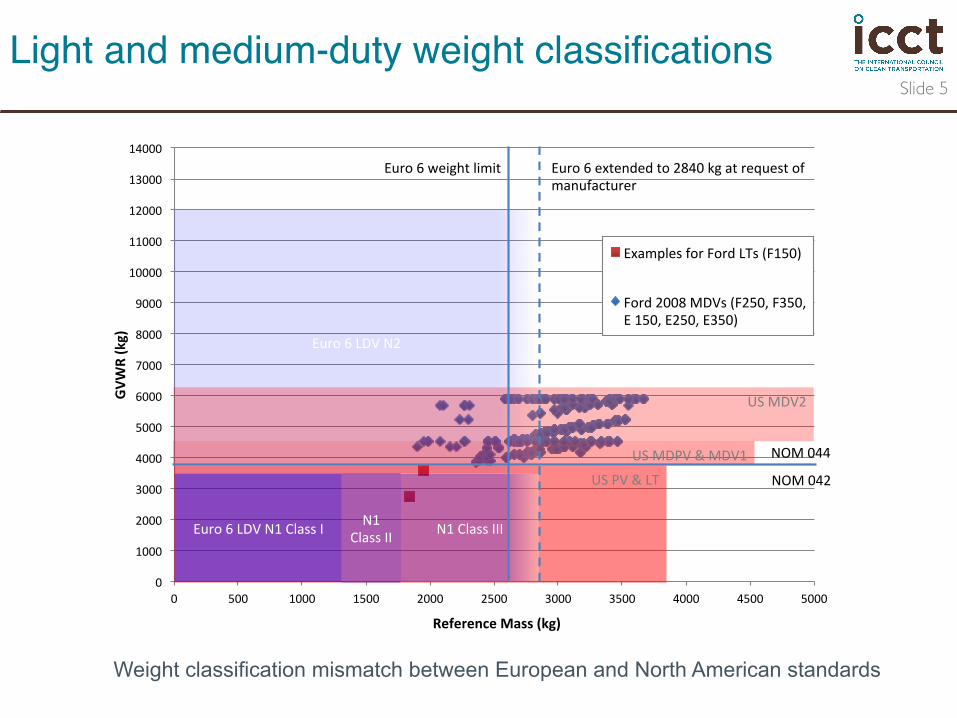
Slide 5Light and medium-duty weight classifications
Weight classification mismatch between European and North American standards
0"
1000"
2000"
3000"
4000"
5000"
6000"
7000"
8000"
9000"
10000"
11000"
12000"
13000"
14000"
0" 500" 1000" 1500" 2000" 2500" 3000" 3500" 4000" 4500" 5000"
GVWR%(kg)%
Reference%Mass%(kg)%
Examples"for"Ford"LTs"(F150)"
Ford"2008"MDVs"(F250,"F350,"E"150,"E250,"E350)"
Euro"6"LDV"N2"
US"MDPV"&"MDV1"
US"PV"&"LT"
N1"Class"III""N1"
Class"II""Euro"6"LDV"N1"Class"I""
US"MDV2"
NOM"044"
NOM"042"
Euro"6"weight"limit"" Euro"6"extended"to"2840"kg"at"request"of"manufacturer"
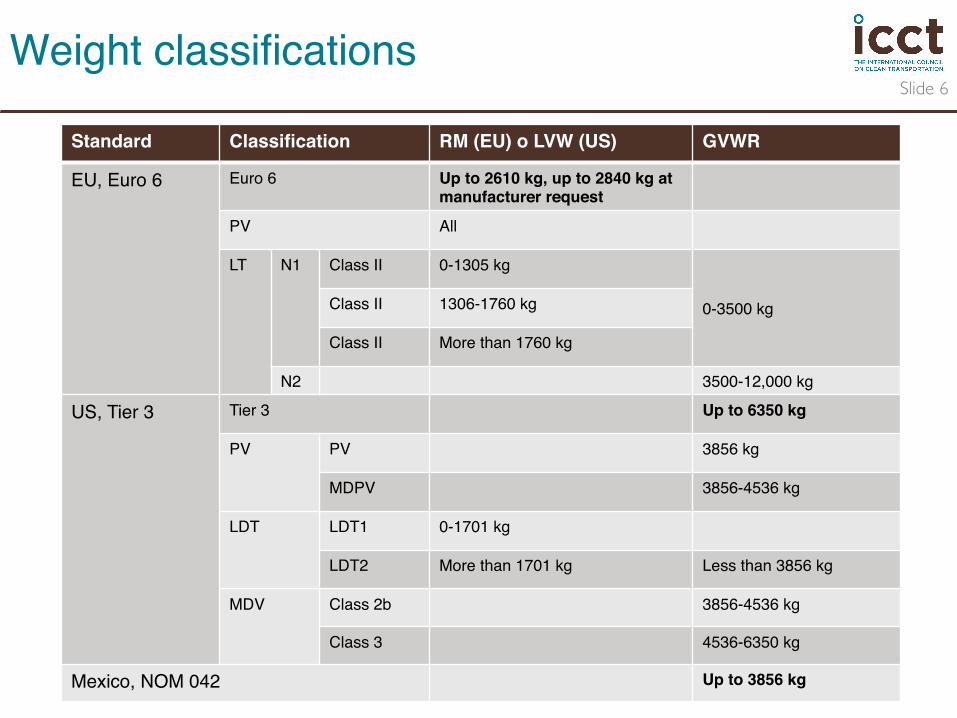
Standard Classification RM (EU) o LVW (US) GVWR
EU, Euro 6 Euro 6 Up to 2610 kg, up to 2840 kg at manufacturer request
PV All
LT N1 Class II 0-1305 kg
0-3500 kgClass II 1306-1760 kg
Class II More than 1760 kg
N2 3500-12,000 kg
US, Tier 3 Tier 3 Up to 6350 kg
PV PV 3856 kg
MDPV 3856-4536 kg
LDT LDT1 0-1701 kg
LDT2 More than 1701 kg Less than 3856 kg
MDV Class 2b 3856-4536 kg
Class 3 4536-6350 kg
Mexico, NOM 042 Up to 3856 kg
Slide 6Weight classifications

7Test cycles
130 km/h vs. 120 km/h
more dynamic driving
longer test cycle
NEDC (1970s / 1990s) WLTP (2014, replace NEDC in 2017)
+ improved test procedure http://www.theicct.org/wltp-november2013-update
0
20
40
60
80
100
120
140
0 100 200 300 400 500 600 700
Spe
ed (k
m p
er h
our)
Time (seconds)
0 10 20 30 40 50 60 70 80 90
100
0 100 200 300 400 500 600 700
Spe
ed (k
m p
er h
our)
Time (seconds)
0
10
20
30
40
50
60
70
80
90
100
0 200 400 600 800 1000 1200 1400 1600 1800
Spe
ed (k
m p
er h
our)
Time (seconds)
FTP, plus supplemental family SC03 (Air conditioning)
US06 (Aggressive Driving)
0
20
40
60
80
100
120
0 100 200 300 400 500 600 700 800 900
Spe
ed (k
m p
er h
our)
Time (seconds)
HWFET (Highway, Fuel Economy only)

§ Bin 5 (fleet average) becomes the highest (interim) bin in Tier 3
§ Euro 6 standards are similar in stringency to Tier 2
§ Realworld NOx emissions from Euro 6-certified diesels are ~600 mg/km.
Slide 8Emissions standards
Tier 3 Bins (FTP)
NMOG+ NOX PMa CO HCHO
(mg/km) (mg/km) (mg/km) (mg/km)Tier 2 Bin 5/ 56+44=100 6 2610 11Bin 160 100 2 2610 2Bin 125 78 2 1305 2Bin 70 44 2 1057 2Bin 50 31 2 1057 2Bin 30 19 2 622 2Bin 20 12 2 622 2Bin 0 0 0 0 0
Tier 2 Bins (FTP)
NMOG NOx PMa CO HCHO(mg/km) (mg/km) (mg/km) (mg/km) (mg/km)
Bin 8 78 124 12 2610 11Bin 7 56 93 12 2610 11Bin 6 56 62 6 2610 11Bin 5 56 44 6 2610 11Bin 4 44 25 6 1305 7Bin 3 34 19 6 1305 7Bin 2 6 12 6 1305 2Bin 1 0 0 0 0 0
Euro 6 standards by vehicle class
NMOG+ NOX PMa CO PN
(mg/km) (mg/km) (mg/km) (#/km)DieselLT, N2 & N1, III 215 5 740 6.0 x 10¹¹
LT N1, II 195 5 630 6.0 x 10¹¹
LT N1, I & PV 170 5 500 6.0 x 10¹¹
Gasoline (NMOG & NOx are set as separate limits)LT, N2 & N1, III 242 5 2270 6.0 x 10¹¹
LT N1, II 205 5 1810 6.0 x 10¹¹
LT N1, I & PV 160 5 1000 6.0 x 10¹¹

Slide 9US EPA Tier 3 and CA LEV III Program
• Unlike Euro standards, US Tier 3 & CA LEV III standards: • Are fuel-neutral (same for gasoline and diesel). • Apply to all passenger vehicles and light trucks, phasing down to a single fleet average for all. • Cover medium-duty commercial trucks (separate bins provided), previously regulated with heavy-duty engine standards.
• Fleet average, bin standards: • NMOG+NOx are fleet average standards: each vehicle certified to a per-vehicle “bin” standard and values are sales
weighted to calculate fleet-average emissions. • Bin structure allows manufacturers flexibility, provides motivation for marketing of significantly cleaner vehicles.
• PM is a per-vehicle limit: • Phased-in as a % of new vehicle sales. • Final Tier 3 limit is 3 mg/mi (1.9 mg/km) in 2022, LEV III includes additional phase-in period to 1 mg/mi (0.6 mg/km).
Tier 3 PM (mg/mi) 2017 2018 2019 2020 2021 2022Phase-in (%) 20% 20% 40% 70% 100% 100%FTP certification (mg/mi) 3 3 3 3 3 3FTP In-use (mg/mi) 6 6 6 6 6 3
Tier 3NMOG+NOx (mg/mi)
2017 2018 2019 2020 2021 2022 2023 2024 2025+
LDV & LDT1 86 79 72 65 58 51 44 37 30
LDT2, 3,4 & MDPV 101 92 83 74 65 56 47 38

Slide 10US and European standards are not equivalent
§ Very little change from Euro 3 to 6 in exhaust emissions. Evaporative emissions go down for Euro 6 gasoline vehicles. § Diesel emissions might decline as WLTC and Real Driving Emissions (RDE) are incorporated into Euro 6.§ Different test cycle complicate comparison: NEDC is a little stronger for gasoline vehicles (cold start is more important)
but weaker for diesels (higher loads are more important). WLTP is more similar to FTP. § US Tier 2 and 3 standards are fleet average standards, whereas Euro 6 is based on maximum limits. Current NOM 042
standards also set maximum value limits, which do not provide incentive to introduce cleaner models.
0"
0.1"
0.2"
0.3"
0.4"
0.5"
0.6"
0.7"
0.8"
0.9"
Euro"4"diesel" Euro"4"gasoline"
Euro"5"diesel" Euro"5"gasoline"
Euro"6"diesel"" Euro"6"gasoline"
US"Tier"2"" US"Tier"3""
Emission
'Factors'(real0w
orld)'+
'Cer6fi
ca6n
''Lim
its'(gram/km)'Evapora>ve"Emissions"Factors"
HC"Emission"Factors"
NOx"Emission"Factors"
NOx"+"HC"Cer>fica>on"limit"
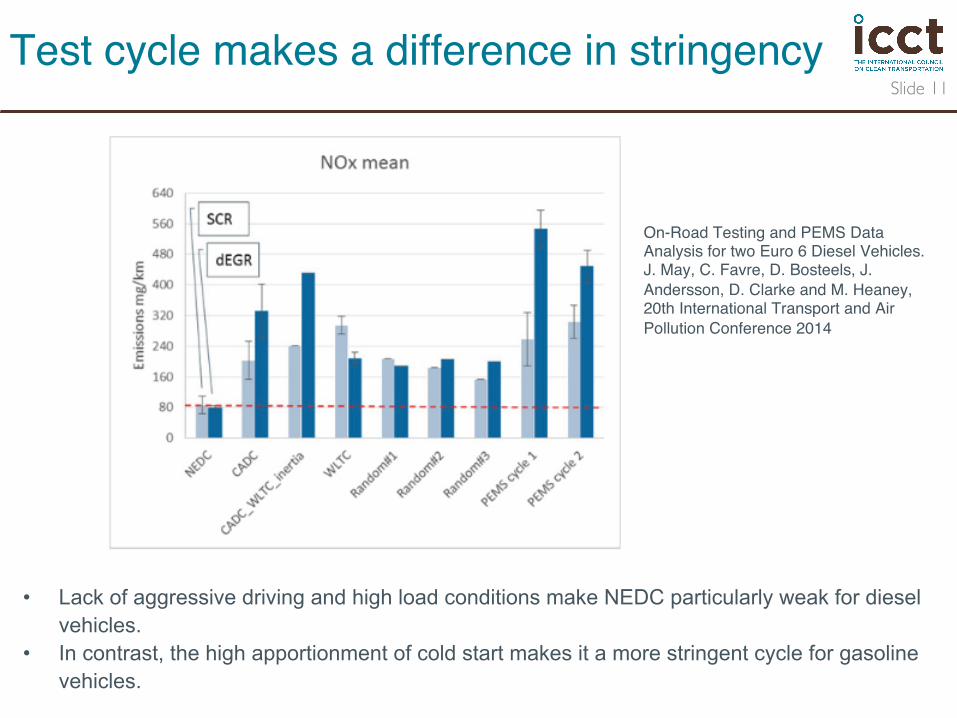
On-Road Testing and PEMS Data Analysis for two Euro 6 Diesel Vehicles. J. May, C. Favre, D. Bosteels, J. Andersson, D. Clarke and M. Heaney, 20th International Transport and Air Pollution Conference 2014
Slide 11Test cycle makes a difference in stringency
• Lack of aggressive driving and high load conditions make NEDC particularly weak for diesel vehicles.
• In contrast, the high apportionment of cold start makes it a more stringent cycle for gasoline vehicles.

Slide 12
§ Values for ARB LEV and EPA Tier programs are fleet average values; Euro program values are max-per-vehicle values
§ Only LEV III and Tier 3 have set NMOG+NOx standards; all other “standards” presented here are the summation of independent NOx Standards and NMHC or NMOG
Comparison of Standards – NOx and NMHC/NMOG

Slide 13Useful Life of Emissions Control Systems
0"
2"
4"
6"
8"
10"
12"
14"
16"
0"
50,000"
100,000"
150,000"
200,000"
250,000"
300,000"
Euro"4,"5,"6" Tier"2/"LEV"II" Tier"3/"LEV"III"
Useful'Life'(years)'U
seful'Life
'(km)'
km"
years"
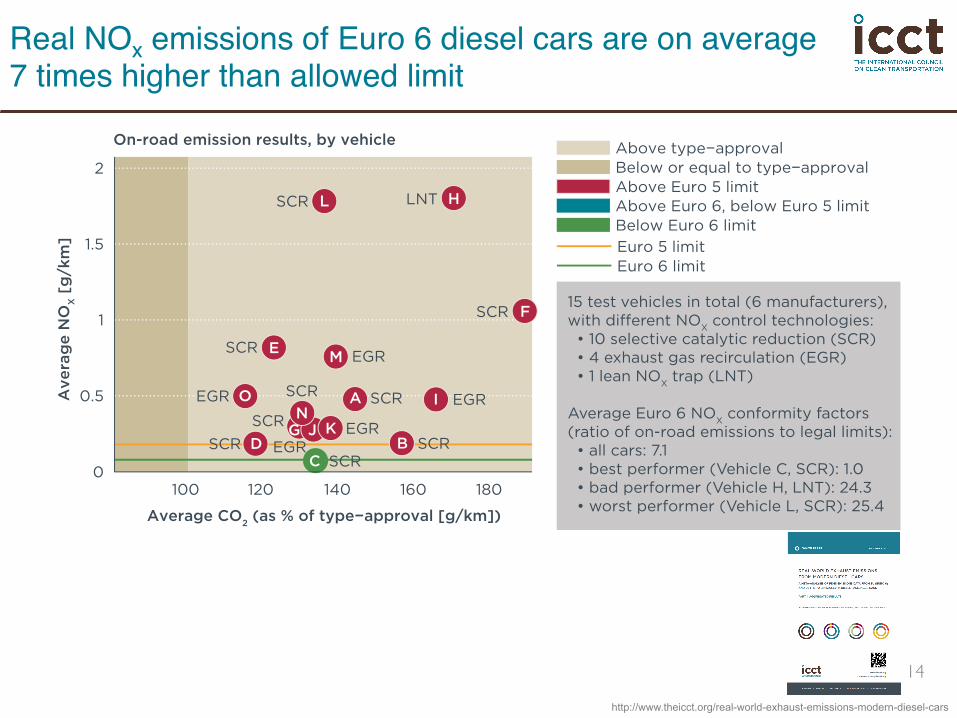
Real NOx emissions of Euro 6 diesel cars are on average 7 times higher than allowed limit
A
BC
D
E
F
G
H
I
J K
L
M
NOA
vera
ge N
OX [
g/km
]
Average CO2 (as % of type−approval [g/km])
100 120 140 160 1800
0.5
1
1.5
2
SCR
SCRSCR
SCR
SCR
SCR
SCR
LNTSCR
SCR
Above type−approvalBelow or equal to type−approvalAbove Euro 5 limitAbove Euro 6, below Euro 5 limitBelow Euro 6 limit Euro 5 limitEuro 6 limit
15 test vehicles in total (6 manufacturers),ent NOX control technologies:
• 10 selective catalytic reduction (SCR) • 4 exhaust gas recirculation (EGR) • 1 lean NOX trap (LNT)
Average Euro 6 NOX conformity factors (ratio of on-road emissions to legal limits): • all cars: 7.1 • best performer (Vehicle C, SCR): 1.0 • bad performer (Vehicle H, LNT): 24.3 • worst performer (Vehicle L, SCR): 25.4
On-road emission results, by vehicle
EGR
EGR
EGR
EGR
EGR
http://www.theicct.org/real-world-exhaust-emissions-modern-diesel-cars
14

Slide 15Passenger vehicle GHG standards

Slide 16Light truck GHG standards

§ Standard stringency§ Similar stringency for both passenger cars and light trucks, standards are
similarly split§ US standards
§ Annual fleet average standards with banking of credits and debits, ensure ongoing fleet improvement while allowing flexibility in compliance
§ Footprint-based standards allow for GHG reductions/efficiency improvement due to weight reductions
§ Rigorous testing requirements, more comprehensive test cycles, and real compliance enforcement
§ European standards§ Standards are 4 years ahead of US standards§ Fewer light trucks result in better overall fleet average§ Higher share of diesels further increase fuel economy
Slide 17GHG standards
Slide 18
In-Use Emissions

19Compliance and Enforcement
Pre-production testing Certificate of Conformity
Manufacturer
Conformity tests about 10% of vehicles
EPA
vehicle design and build 0 km 100,000 km 50,000 km
Selective Enforcement Audit + Confirmatory Road Load Testing
EPA
In-use verification tests on random sample
Manufacturer
In-use surveillance random / selected sample
EPA
1
2
3
4
5
Pre-production testing Certificate of Conformity
Manufacturer 1
http://www.theicct.org/blogs/staff/bought-tiger-got-hello-kitty-how-fix-vehicle-fuel-economy-fraud-china
In-use verification Test on random sample
2 Manufacturer

20
http://www.theicct.org/real-world-exhaust-emissions-modern-diesel-cars
NOx emissions of Euro 6 diesel cars higher than the Euro 3 limit value

21
Real-world fuel consumption of new cars in EU is about 30+% higher than claimed by manufacturers
http://www.theicct.org/laboratory-road-2014-update

22
The growing gap appears to be largely attributable models being strongly optimized to the test cycle
http://www.theicct.org/blogs/staff/trend-that-cant-continue-europes-car-co2-emissions-gap

23
A growing gap means that only part of the expected fuel consumption/CO2 reduction may be real
http://www.theicct.org/laboratory-road-2014-update

24
There are many ways to optimize vehicles for the laboratory testing

§ European Union§ Requires periodic inspection of all vehicles and trailers at regular intervals§ Allows for unannounced roadside inspections of commercial vehicles in any EU country,
regardless of place of registration§ Sets standards for implementation§ Member states are responsible for implementation
§ United States§ Clean Air Act requires I/M for certain regions, based on air quality, population and
location§ Sets standards for implementation and QA/QC§ States are responsible for I/M implementation§ State programs may include tailpipe emissions tests (idle, acceleration, etc) and/or OBD
tests for MY1996+, along with visual checks, evaporative emissions tests (primarily gas cap)
§ Mostly focus on gasoline vehicles, set cutpoints, frequency, and MY requirements by state
Slide 25Vehicle inspection

§ Widely used in US and Europe§ US OBDII and EU EOBD Systems are very different, with different
software and hardware requirements§ EOBD systems: Euro 5 communication compliant with ISO 15031-5 Euro 6 communication complaint with ISO 15765-4 § OBDII systems are complaint with ISO 15765-4
§ Ensuring proper implementation§ Provisions (like those to be discussed by ARB) are critical to guard
against cheating are critical to ensure effectiveness of programs§ Also need requirements in place for reporting of defects, doing field
fixes and implementing running changes§ OBD appears to be a relatively robust tool for controlling
emissions from vehicles in use, if proper safeguards and procedures are in place
Slide 26OBD in inspection

§ Programs are widespread in Europe and U.S.§ Useful tool for monitoring mean on-road fleet emissions
§ Ensure that new vehicle standards are operating as intended§ Ensuring the effectiveness of I/M programs, including guarding against
corruption in test centers§ Can be used to better calibrate emissions modeling
§ Challenging to use results for enforcement or to replace I/M§ Requires a mandate to repair/further inspect identified high emitters§ Clean screen can reduce the burden of I/M programs
Slide 27Remote sensing

Copyright © 2007 Envirotest Systems
Slide 28Remote sensing: OBD effective

Chen, Y., Borken-Kleefeld, J. (2014). Amospheric Environment 88 (2014) 157-164
Remote sensing: high diesel NOx emissions29
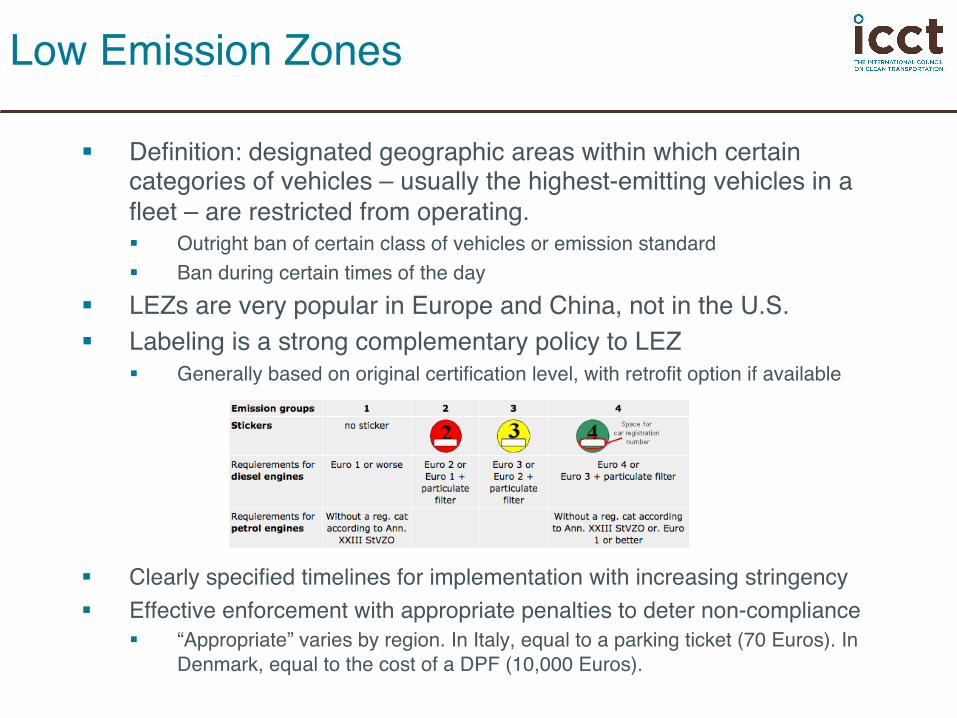
Low Emission Zones
§ Definition: designated geographic areas within which certain categories of vehicles – usually the highest-emitting vehicles in a fleet – are restricted from operating.§ Outright ban of certain class of vehicles or emission standard§ Ban during certain times of the day
§ LEZs are very popular in Europe and China, not in the U.S.§ Labeling is a strong complementary policy to LEZ
§ Generally based on original certification level, with retrofit option if available
§ Clearly specified timelines for implementation with increasing stringency§ Effective enforcement with appropriate penalties to deter non-compliance
§ “Appropriate” varies by region. In Italy, equal to a parking ticket (70 Euros). In Denmark, equal to the cost of a DPF (10,000 Euros).

Low Emission Zones – selected results

§ Compliance and enforcement is the most critical aspect of all regulations and the key to success of US and CA policies
§ US/CA programs are both more complex and more rigorous while providing more flexibilities to manufacturers§ Bin system encourages manufacturers to design and market
increasingly clean vehicles§ Footprint-based GHG standards reward weight reduction§ Enforcement is a real threat, standards are very detailed to eliminate
loopholes § OBD enforcement mechanisms both reduce ability to cheat and
increase increase information to regulators (defect reporting requirements)
§ European LEZs have been effective in reducing air pollution in key areas and accelerating fleet turnover
Slide 32Conclusions

Slide 33
Autoline interview with Oliver Schmidt, Powertrain Development, VW