comparisons between field- and lidar-based measures of
TRANSCRIPT
Comparisons between field- and LiDAR-basedmeasures of stand structural complexity
Van R. Kane, Robert J. McGaughey, Jonathan D. Bakker, Rolf F. Gersonde,James A. Lutz, and Jerry F. Franklin
Abstract: Forest structure, as measured by the physical arrangement of trees and their crowns, is a fundamental attributeof forest ecosystems that changes as forests progress through successional stages. We examined whether LiDAR datacould be used to directly assess the successional stage of forests by determining the degree to which the LiDAR datawould show the same relative ranking of structural development among sites as would traditional field measurements. Wesampled 94 primary and secondary sites (19-93,223-350, and 600 years old) from three conifer forest zones in westernWashington state, USA, in the field and with small-footprint, discrete return LiDAR. Seven sets of LiDAR metrics weretested to measure canopy structure. Ordinations using the of LiDAR 95th percentile height, rumple, and canopy densitymetrics had the strongest correlations with ordinations using two sets of field metrics (Procrustes R = 0.72 and 0.78) and acombined ser of LiDAR and field metrics (Procrustes R = 0.95). These results suggest that LiDAR can accurately charac-terize forest successional stage where field measurements are not available. This has important implications for enablingbasic and applied studies of forest structure at stand to landscape scales.
Introduction
The three-dimensional arrangement of trees and theircrowns is a fundamental attribute of forest ecosystems thatcorrelates strongly with many ecological processes and serv-ices, including biological diversity (McElhinny et al. 2005).Forest structure has many components but is often describedby the size and spatial distribution of trees and by the hori-zontal and vertical distribution of their foliage (Spies 1998;Van Pelt and Nadkami 2004; McElhinny et al, 2005). Thesecomponents often change as stands mature as do other as-pects of forest structure and diversity that are directly or in-
directly related to the size and spatial distribution of treessuch as coarse woody debris, dead trees, abundance and di-versity of the understory, and seral tree regeneration and bi-odiversity (Franklin and Spies 1991; Lindenmayer andFranklin 2002).
Because of the strong allometric relationships betweencanopies and other aspects of stand structure, LiDAR meas-urements have been shown to produce more accurate esti-mates of parameters such as mean tree diameter, basal area,biomass, and height than other remote sensing options(Lefsky et a1. 2001). Researchers have used LiDAR data tomeasure crown height and length (Nesser and Okland 2002)

and to estimate variation in tree diameter, tree density, andbasal area (Lefsky et a1. 1999), aboveground biomass(Lefsky et a1. 2002), and fuel loads (Skowronski et al.2007).
The ability to map the structural stage of forests acrosslandscapes using LiDAR data would be useful to researchersstudying forest structure and function, biologists mappingpotential habitat, and managers seeking to inventory theirproperties. Several researchers have found that canopies rep-resenting different stages within a successional trajectoryhave distinct characteristics when measured with LiDAR, in-cluding tulip popular deciduous forests (Harding et a1. 2001;Parker and Russ 2004) and Pacific Northwest conifer forests(Lefsky et a1. 1999). Hill and Thomson (2005) used LiDARand hyperspectral data to map different stages of forest suc-cession in England. Falkowski et a1. (2009) used LiDARdata to successfully predict forest successional stage usingsix categorical stages previously defined from field data forRocky Mountain forests with a 95.5% accuracy rate. Thislatter work demonstrates the potential of LiDAR to provideforest classifications that would be immediately interpretableand usable by a wide variety of forest professionals.
These previous studies examined the ability of LiDARdata to distinguish between distinct successional stages.However, forest succession can be thought of as a continu-ous process that produces gradients of structural characteris-tics rather than distinct classes of structure. Our studyexamines the ability of LiDAR data to measure successionalong gradients of multiple structural characteristics. Dem-onstrating this ability would provide the theoretical basis forclassifying succession with LiDAR data. It would also pro-vide an alternative method for measuring succession to theimputation method used by Falkowski et al. (2009). Thiswould be useful either where adequate successional classifi-cation schemes do not exist or when researchers want to testthe comprehensiveness of existing classification schemes(e.g., Kane et al. 2010).
No single field or LiDAR measurement captures the stateof a stand's structural development. Instead, studying pat-terns of development requires examining relative changes insuites of metrics, often using multivariate analyses such asordinations (Spies and Franklin 1991; Larson et al. 2008).For example, four field variables (mean diameter at breastheight (DBH), standard deviation of DBH, tree density, anddensity of trees with DBH > 100 cm) are strongly correlatedwith the structural stage in Pacific Northwest forests (Spiesand Franklin 1991) and can be used to estimate the degreeto which a stand has progressed toward old-growth charac-teristics (Acker et al. 1998). Subsequent work has empha-sized the importance of the number and size of canopy gapsas a measure of structural state (Spies 1998; Van Pelt andFranklin 2000). Lefsky et al. (2005) found that a combina-tion of three LiDAR metrics (mean height of LiDAR re-turns, standard deviation of LiDAR returns, and canopyclosure) closely correlate with field measurements of struc-tural attributes.
Our goal in this study was to examine whether LiDARdata could be used to directly assess the relative succes-sional stage of forests using plots spanning a range of agesand forest zones in the conifer forests of the Pacific North-
west, USA We pursued this goal through three specific ob-jectives.
The first objective was to determine the degree to whichLiDAR metrics would show the same relative ranking ofstructural development among sites as would traditionalfield measurements. Previous work had established that can-opy structural complexity increases during forest structuraldevelopment as measured by increased crown height, crownsurface roughness (rumple), and canopy gaps (Van Pelt andFranklin 2000; Ishii and McDowell 2002; Van Pelt and Nad-karni 2004; Ogunjemiyo et al, 2005; Kane et al. 2008;Van Pelt and Sillett 2(08). These characteristics can beeasily measured with LiDAR. We assessed correlation be-tween field and LiDAR assessments of structural develop-ment by quantitatively comparing ordinations using bothtypes of data. If the ordinations were highly correlated, thiswould provide a basis for mapping the successional stagesdirectly from LiDAR data alone.
The second objective was to determine whether a smallset of easily interpreted LiDAR metrics could be used to dif-ferentiate sites based on their relative structural complexity.This objective paralleled the work of Lefsky et al. (2005),who examined this question using LiDAR data from an ex-perimental large-footprint, waveform instrument. Becausemost LiDAR acquisitions use small-footprint, discrete returninstruments, their results should be validated using this morecommon data type. The identification of such a subset couldmake maps of forest structure easier to interpret by a varietyof forest professionals.
A third objective was to determine the effect of using afixed-sized LiDAR sample area when our field data werecollected over variable plot sizes. While variable-sized fieldplots are common in many studies, fixed-grid cells are usedto create maps from remote sensing data sets. We calculatedour LiDAR metrics using both fixed-sized areas and varia-ble-sized areas that matched the variable field plot areas. Itwas presumed that LiDAR data calculated from areas thesame size as the underlying plots would be more stronglycorrelated with field measurements than would those fromthe fixed grid size.
Methods
Structural characteristics measuredWe selected five field and six LiDAR metrics that had
been identified in other studies as key for distinguishing for-est structural condition (Table 1). Data for example plots arepresented in Fig. 1 and Table 2.
Four field metrics were based on key live tree structuralattributes identified by Spies and Franklin (1991): meanDBH, standard deviation (SD) of DBH, density of trees perhectare, and density of trees with DBH > 100 cm. Canopycover was selected as a fifth field metric because of its im-portance as an indicator of disturbance and availability oflight to lower canopy layers and the understory (Spies1998; Van Pelt and Franklin 2000).
The LiDAR metrics were selected from three categoriesof metrics found by Lefsky et al. (2005) to be highly corre-lated with field measurements of stand structure: height, var-iation of height, and canopy density (which is a LiDARmeasure of canopy closure). We tested their suggested Li-

Since we used only first return LiDAR data (see below),it is likely that most of our measurements represent theupper canopy. The number of returns from the subcanopywas insufficient to draw any conclusions regarding structureat this level.
Study areaThe 36679 ha Cedar River Municipal Watershed is lo-
cated on the western slope of Cascade Range in WashingtonState, USA (Fig. 3). Elevations range from 165 to 1655 m.Forests at elevations below -800 m lie in the Western Hem-lock Zone (Henderson et al. 1992; Franklin and Dyrness1988). Elevations from -800 to 1200 m lie in the PacificSilver Fir Zone. Forests above -1200 m lie in the MountainHemlock Zone.
It is believed that the three forest zones follow similar se-quences of structural development following stand-replacingdisturbance (Franklin and Spies 1991; Larson and Franklin2006; Parish and Antos 2006). Early seral stands in theWestern Hemlock Zone typically are dominated by Pseudot-
DAR rnetrics (mean height, SD of height, and canopy den-sity) along with the 95th percentile of height, coefficient ofvariation (CV) of height, and rumple. Rumple is the ratio ofcanopy outer surface area to ground surface area (Parker etal. 2004) as measured by the LiDAR-derived canopy surfacemodel and digital terrain model (see "LiDAR data" below).It is therefore a three-dimensional measure of canopy struc-tural heterogeneity, whereas SD and CV of height are one-dimensional measures (Fig. 2).
There are fundamental differences between field- and Li-DAR-derived measurements of height. For example, field-measured "mean height" typically refers to the mean of themaxima for individual treetops in field measurements. Li-DAR-measured "mean height" refers to the mean of all re-turns along the exposed crown surfaces and understory andground, where visible to the instrument. The 95th percentileLiDAR height measurement used in this study is the heightat which 95% of LiDAR returns fall below. This measure-ment is likely closely aligned with field-measured meanheight of canopy maxima.

suga menziesii «Mirb.) Franco var. menziesii (Douglas-fir)),especially following harvest. Thuja plicata Donn ex D. Don(western redcedar) and Tsuga heterophylla (Raf.) Sarg.(western hemlock) are often early or later seral components.Forests in the Pacific Silver Fir Zone are primarily com-posed of shade-tolerant species Abies amabilis (Dougl. exLoud.) Dougl. ex J. Forbes (Pacific silver fir) and T. hetero-phylla (Lertzrnan and Krebs 1991), with some early seralstands dominated by Abies procera Rehd. (noble fir). Standsin the Mountain Hemlock are often dominated by A. amabi-lis mixed with Tsuga mertensiana (Bong.) Carriere (moun-tain hemlock). Mature trees in the Pacific Silver Fir andMountain Hemlock Zones generally do not reach the sameheights and crown dimensions as comparable species in theWeatern Hemlock Zone.
The time scales for structural development differ in thethree zones, with development slowing with increasing ele-vation. Competitive exclusion in the Western HemlockZone, for example, commonly lasts for 50 years (Franklinet al. 2002), for 100-300 years in the Pacific Silver FirZone (Packee et al. 1982), and for centuries in the MountainHemlock Zone (Parish and Antos 2006).
The majority of the watershed's forests (84%) are secondgrowth (<100 years old) that established naturally (pre-1920s) or were planted following harvest (starting in the1920s) (Erckmann et al. 2000). Timber harvests began inthe western lowlands of the watershed in the early 20th cen-tury and moved eastward to higher elevations until harvestceased in the 1990s. As a result, the ages of second-growthstands are correlated with elevation and forest zone. Lessthan 1% of the watershed was 100-200 years old; no standsin that age range were included in this study. A portion ofthe watershed (16%), primarily at mid- to high elevations,consists of primary forests 200-350 years old that appear to

have regenerated following widespread stand-replacing dis-turbances, presumably fires (Hemstrom and Franklin 1982;J.A. Henderson (personal communication, 2009)). Forests inone basin survived the disturbances of 200-350 years agoand have a cohort of trees -600 years old.
Field dataThe watershed contains a network of 115 permanent sam-
ple plots laid out in an approximate grid designed to samplethe range of forest types and environmental conditionswithin the watershed. Field data were collected between2003 and 2005, with most sampling done in the summerand early fall. Twenty-one plots were eliminated from thisstudy because of missing data or because deciduous treescomprised >5% of the basal area. Of the 94 plots that wereused in this study, 59 were second-growth and 35 were pri-mary forests (Fig. 4).
The stand age for each plot site was estimated by coringdominant trees within the plot and assigning the age of theoldest trees to the site. All secondary forest sites were aged,and 17 of the 35 primary forest plots were aged. Forest ageswere further verified with historic harvest and regenerationmaps maintained by the Watershed's management.
Field plot radius was chosen to include >25 live trees
with DBH > 12.7 cm. Plots ranged from 0.04 to 0.16 hawith a mean of 0.10 ha and a mode of 0.08 ha (59% ofplots). The location of each plot center was determined us-ing a Trimble Pathfinder Pro XRS GPS System and re-corded on a TSCI Asset Surveyor. The data werepostprocessed using Trimble Pathfinder software to removesatellite position distortion.
Each tree was classified as dominant, codominant, inter-mediate, or overtopped (Smith et al. 1997). Only data fromdominant, codorninant, and intermediate trees were includedin this study because these trees had crowns that would havebeen measured by the LiDAR instrument. Canopy cover wasmeasured as the mean of 16 canopy closure measurementstaken using a spherical densiometer at four points alongeach of four lines radiating from the plot center in each car-dinal direction.
LiDAR dataLiDAR data were collected by Spectrum Mapping, LLC
using their DATIS II system over the winter of 2002-2003.The nominal flying height above ground for the LiDAR ac-quisition was 2000 m. The LiDAR data were collected usinga laser pulse repetition rate of 35 kHz and a scan rate of25 Hz while being confined to a scan angle of ±13.5o. These

surfaces to provide a sufficient number of ground pointswithin each cell given the moderate density of the LiDARdata and the dense canopy present at many plot sites. Foreach iteration, weights were computed by comparing the re-turn elevation with the elevation interpolated from the sur-face derived in the previous iteration or the initial surfacefor the first iteration. Points below the surface were givenlarge weights and points above the surface were given aweight of zero. At the conclusion of each iteration, a newsurface, presumably closer to the "true" ground surface,was computed. After the desired number of iterations, pointson or below the final intermediate surface were identified asground points. The algorithm requires that the user specifythe number of iterations. For this study, five iterations wereused to remove nonground returns.
Once a set of ground returns was identified, a digital ter-rain model covering the entire watershed was created using3 m x 3 m grid cells. If identified ground points werepresent in a cell, the cell was assigned the minimum valueof those points. If no ground points were present in a cell,the ground elevation was interpolated using a "bole-filling"algorithm to searcb in eight adjacent directions for valid ele-vations and then compute the distance-weighted average ofthe valid elevations from surrounding cells. All canopy
specifications resulted in a ground footprint diameter of0.46 m, with an average spacing of laser pulses of 1.0 macross track and 2.0 m along track. Up to five returns wererecorded from each pulse. Swath centerline spacing was400 m with an approximate overlap of 50% between adja-cent flightlines.
Pulse (first return) point density for study plots rangedfrom 0.4 to 2.7 m-2 (mean = 0.97 m-2) among study plots(Fig. 4). The proportion of pulses without multiple returnsranged from 0.59 to 1.00 (mean = 0.85). To ensure that var-iation in the multiple return proportions did not affect re-sults, only the three-dimensional positions of the first returnLiDAR data were used for calculating canopy structure met-rics. As a result, only trees witb exposed crown Surfaceswere likely included in the LiDAR data.
LiDAR data were processed using the FUSION softwarepackage (beta version derived from version 2.64; http://forsys.cfr.washington.edu/fusion.html). A digital terrainmodel was calculated for the entire watershed, All returnsin the LiDAR point cloud were filtered to identify groundreturns using an iterative algorithm (Kraus and Pfeifer1998; Andersen et a1. 2006) that computed an initial surfaceusing the weighted average of all LiDAR returns. A cell sizeof 8 m x 8 m was chosen for the initial and intermediate
ResultsCorrelation between field- and LiDAR-based measures ofstructural complexity
Individual metricsMost field and LiDAR metrics were con-elated (Table 3).
Canopy cover (a field measurement) and canopy density (aLiDAR measurement) were strongly correlated. Mean DBH,SD of DBH, SD of height, and rumple were con-elated.Mean and 95th percentile height formed another set of cor-related metrics. On the other hand, tree density, large-tree(> 100 cm DBH) density, and CV of height had no signifi-cant correlations with many metrics and only weak correla-tions with others metrics.
OrdinationsOrdinations using different sets of metrics were found to
explain similar amounts of variation and show similar rela-tionships between sites (Fig. 6 shows four of the J 0 ordina-tions performed). Because a substantial portion of thevariance in' all ordinations was explained in the first twoaxes, only these axes are presented and interpreted. The firsttwo axes explained 71.3% of variations for the "all field andLiDAR" metrics ordination (Fig. 6a), 78.4% for the "allfield" ordination (Fig. 6b), and 83.0% for the "all LiDAR"ordination (not shown). In the first two of these ordinations,the variation explained in the first two axes was reduced be-cause the density of trees >100 cm DBH was loaded moststrongly onto the third axis. The first two axes explained87.7% - 96.5% of the variation in ordinations based on sub-
structural metrics were based on heights above the digitalterrain model.
For each plot, LiDAR metrics were calculated for a sam-ple of the LiDAR data the same size as the field plot and fora fixed 30 m x 30 m (0.09 ha) area centered on the plot'sGPS location. The 30 m x 30 m size approximated themost common plot size and is characteristic of a grid cellsize that might be used in a mapping effort. Canopy surfacemodels were created for each study site from first returnsusing a 1.5 m grid cell and a 3 x 3 smoothing algorithm.These parameters were compromises that provided realisticcanopies over the range of canopy types and pulse densitiesin the study. The 1.5 m cell size was chosen to ensure thatmost sites averaged at least one point per grid cell definingthe canopy surface model height. Smoothing eliminated thejagged, unnatural canopy surface that is common when mod-erate-density LiDAR data are used without smoothing, suchas "pits" within tree crowns due to small gaps that permit afirst return from the ground surface.
Statistical analysisCorrelations between field and LiDAR metrics were com-
pared both for individual metries using Pearson coefficientsand for multivariate sets of metrics using principal compo-nents analysis (PCA). PCA was appropriate for these data,as most variables had approximately linear relationshipswith each other (McCune and Grace 2002). Correlationswere computed for both the fixed- and the variable-sized Li-DAR samples. Plots were identified by age classes in ordi-nations.
We selected 10 combinations of field and LiDAR metricsfor PCA and comparison. Three "base" combinations wereused: one that included all 11 field and LiDAR metrics, onethat used only the five field metrics, and one that used onlythe six LiDAR metrics. The remaining seven combinationswere subsets of three metrics following the same pattern asLefsky et al. (2005): a size measurement, a size variationmeasurement, and a cover measurement. One of these sevensets of three rnetrics used field metrics and the others useddifferent combinations of LiDAR metrics.
Within the ordinations, PCA was conducted with theprcomp function of the R statistical package (release 2.6.1)(R Development Core Team 2007). All variables were nor-malized prior to analysis to eliminate differences in scaleand units of measurement among variables. Separate ordina-tions were done for the LiDAR data that matched the size ofeach study site and for the fixed 30 m x 30 m areas.
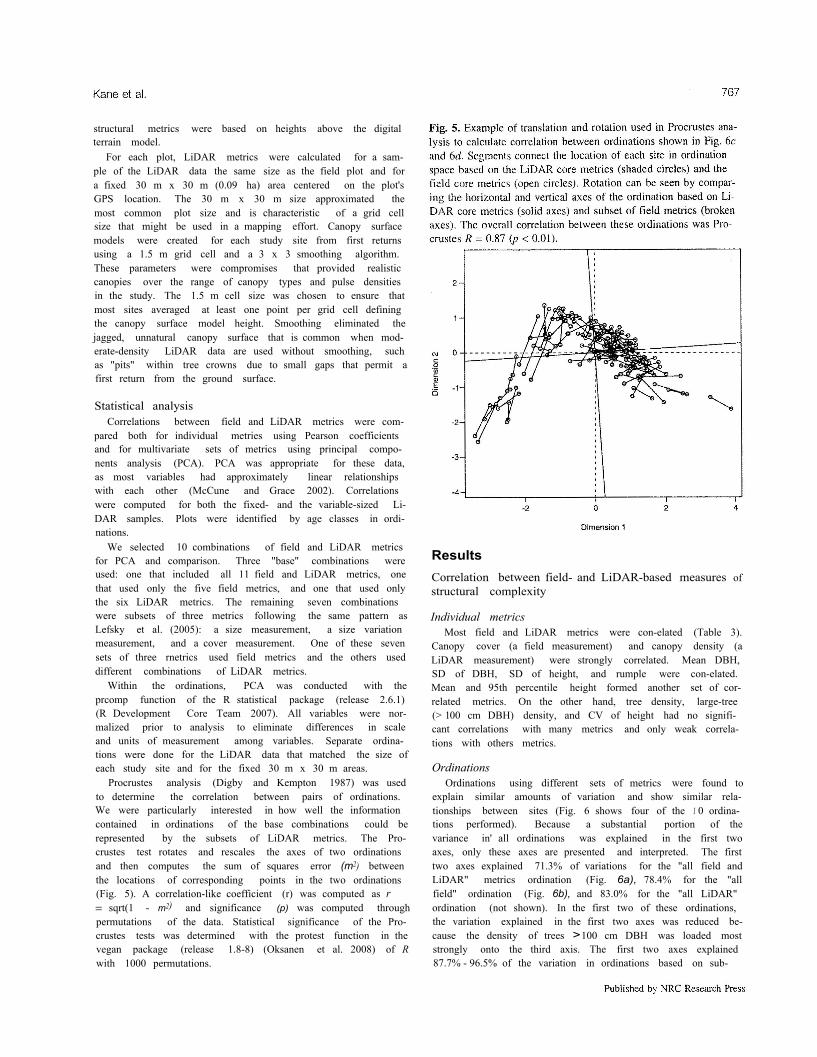
Procrustes analysis (Digby and Kempton 1987) was usedto determine the correlation between pairs of ordinations.We were particularly interested in how well the informationcontained in ordinations of the base combinations could berepresented by the subsets of LiDAR metrics. The Pro-crustes test rotates and rescales the axes of two ordinationsand then computes the sum of squares error (m2) betweenthe locations of corresponding points in the two ordinations(Fig. 5). A correlation-like coefficient (r) was computed as r= sqrt(1 - m2) and significance (p) was computed throughpermutations of the data. Statistical significance of the Pro-crustes tests was determined with the protest function in thevegan package (release 1.8-8) (Oksanen et al. 2008) of Rwith 1000 permutations.

and field metrics were higher when the fixed 30 m x 30 mLiDAR plots were used than when the variable-sized Li-DAR samples were used that matched the size of the under-lying field plot (Table 4). Variable-sized plot sites producedhigher correlations between subsets of LiDAR metrics andthe full set of LiDAR merrics.
DiscussionCorrelation between field- and LiDAR-based measures ofstructural complexity
The high correlation between field and LiDAR metricsand ordinations in our study indicates that these two sets ofmeasurements captured similar patterns in stand structure.Our findings, therefore, support the use of LiDAR measure-ments to directly map forest structural complexity and inferage-related successional stage (as was clone in Kane et al.2010).
The changes in the field and LiDAR ordinations appear tocorrespond to key changes in structure for Pacific Northwestforests (Spies and Franklin 1991; Franklin et al. 2002). Inthe ordinations, the arm labeled ">Closure" appears to rep-resent the processes of canopy closure and mortality typicalof the biomass accumulation/competitive exclusion stages.The other arm labeled ">Ccmplexity" appears to representthe increase of structural heterogeneity, canopy layering,and the creation of canopy gaps typical of the maturationand vertical diversification stages. The strong pattern in theordinations suggests that the field and LiDAR metrics corre-late well with dominant processes in forest structural devel-opment.
Authors who have studied the development of foreststructure have emphasized that the process is highly varia-ble, with some sites developing advanced structural charac-teristics more quickly than others (Franklin er al. 2002;Larson et al. 2008). This was evident in the arm of our ordi-nations representing the accumulation of greater complexityfollowing canopy closure. Younger sites were more commonat the base of this rum and only primary sites were found atits end, but considerable mixing of site ages occurred in be-
sets of field (Fig. 6c) and LiDAR (Fig. 6d) metrics. In eachordination, the first principal component was primarily cor-related with measures of size (DBH or height) and size var-iation. The second principal component was primarilycon-elated with measures of canopy closure/density and (or)tree density.
Each ordination showed a distinct V-sbaped pattern. Thearms of the "V" were labeled based on the characteristicsof the sites present. In each ordination, one arm had sites<50 years old predominating, a trend of increasing heightand canopy density, and was labeled ">Closure". The otherarm had sites >75 years old predominating, a trend of in-creasing rumple and decreasing canopy density, and was la-beled ">Complexity". Sites 50-75 years old werepredominant at the base of the "V".
Effect of using different subsets of LiDAR metricsOrdinations using different sets of metrics generally were
correlated, and two subsets of LiDAR metrics were foundthat were highly correlated with the full set of field and Li-DAR metrics and the sets of field metrics. With the excep-tion of ordinations that included CV of height, ordinationshad Procrustes correlations of 0.71-0.96 (Table 4). Ordina-tions that included CV of height had correlations of 0.40-0.87. Ordinations with subsets of three LiDAR metrics thatdid not include CV of height had similar correlations withthe "'all tield and LiDAR", "all field", and "field subset"ordinations. The ordination produced with the LiDAR 95thpercentile of height, rumple, and canopy density had slightlyhigher correlations with "all field and LiDAR" and "allfield" ordinations than other tested subsets of LiDAR met-rics. An ordination that substituted SD of height for rumplehad a marginally higher correlation with the "field subset"ordination.
Effect of LiDAR sample areaIn almost every case, Pearson correlations were higher for
the fixed-sized LiDAR sample than for the variable-sizedLiDAR sample that matched the plot size (Table 3). Corre-lations between ordinations using subsets of LiDAR metrics


stand development shown in these ordinations are more fullyexplored in a companion paper (Kane et a1. 2010).
Our study had limitations for studying structural develop-ment of Pacific Northwest forests because of the lack ofsites in the 94- to 222-year-old and 351- to 599-year-oldage ranges. These data gaps may reduce the ability to ex-trapolate our results to conifer forests of all age ranges.However, the lack of gaps in the ordinations suggests thatour data set captured dominant processes that drive the de-velopment of structural complexity. Future LiDAR acquisi-tions that include larger wider ranges of stand ages can testthis assertion and extend our results. These results shouldalso be tested using other forest types.
The arch present in the PCA ordinations was not a mathe-matical artifact as can occur with community data (Podaniand Miklos 2002). It was also present in nonmetric multidi-mensional scaling ordinations (not shown), indicating that itwas an inherent characteristic of the data set. The. arch struc-ture was also seen in the ordinations of structural metricsperformed by Spies and Franklin (1991) and Lefsky et a1.(2005).
The arch itself corresponds to changing dominance of keyprocesses during stand development (Franklin et a1. 2002).Canopy closure increases early in stand development butthe canopy then partially reopens through gap formation.Tree density decreases through competition mortality anddisturbance and then increases because of the emergence oftrees from the understory. Structural heterogeneity of thecanopy surface (rumple) remains relatively low early instand development but begins to increase as vertical andhorizontal diversification of the canopy surface develops.
Selection of a subset of metricsLefsky et al, (2005) found that stand structure can be
characterized using three categories of LiDAR metrics: oneto represent biomass (height measurement), one to measurecanopy structural complexity (variability of height), and oneto measure canopy gaps and leaf area index (canopy density)(Lefsky et al. 2005). We found that subsets that includedone LiDAR metric from each of these categories correlatedwith sets of metrics that included field data better than didthe full suite of LiDAR metrics. Hence, we may reduce re-dundancy of these measures to an intuitive subset of LiDARmetrics to describe stand structure.
We used 95th percentile height as our measure of standheight (Lefsky et a1. 2005). This metric was loaded moststrongly on the first principal component (Fig. 6d). Individ-ual metrics to represent height were highly correlated, sug-gesting that the choice of particular metrics probably madelittle difference to the conclusions. Nonetheless, we suggestthat 95th percentile height is preferable to mean height be-cause of the pattern of crown development for trees in ourregion. While foliage distribution in young conifer stands isgenerally concentrated in the top canopy layers and crownsare relatively short, foliage is more evenly distributedthroughout the canopy space in older stands due to greaterlight penetration (Ishii and McDowell 2002; Van Pelt andSillett 2008). Mean height of LiDAR returns, therefore,would reflect the combination of tree height growth and fo-liage redistribution, making interpretation of results prob-lematic. In addition, the 95th percentile height metric is less

sensitive to outliers than metrics such as maximum height,which was not tested because it can be skewed by a smallportion of the area with abnormally high material or evenby returns from flying birds.
Rumple, our metric for canopy structural complexity, gen-erally had higher values for older plots, consistent with the-ories of canopy development for many forests (Ishii et a1.2004) but possibly not for forests with periodic large-scaledisturbances (Brokaw et al. 2004). This study tested two al-tematives to rumple, SD of height and CV, as a measure ofspatial heterogeneity. We found that CV produced weakercorrelations with field metric ordinations and that rumplegenerally had slightly higher correlations than SD. Lefskyet a1. (2005) used SD of height but could not have calcu-lated rumple from their large-footprint, waveform LiDARdata. We prefer rumple because it is sensitive to the three-dimensional arrangement of canopy material (Fig. 2). Rum-ple is correlated with a number of measures of stand struc-tural complexity (Kane et al. 2008) and increases with standage (Ogunjemiyo et a1. 2005). Work by Zenner (2004) alsosupports the selection of rumple. He demonstrated thatstands with similar measurements of tree diameter and countcould have very different spatial arrangements of trees dueto differences in disturbance histories. These stands wouldpresumably also have different spatial arrangements of can-opy material. We suggest that a metric sensitive to the three-dimensional arrangement of the canopy surface may be amore sensitive detector of past disturbance than a one-di-mensional metric such as SD. However, our field data didnot allow us to determine whether rumple was detectingstructural complexity that SD of height would not. A goalfor future research would be to determine how rumple meas-urements are correlated with spatial patterns in tree andcrown distributions.
We used canopy density as our metric of gaps and canopycontinuity. Canopy density rapidly increased with age foryoung plots, remained at high values for most secondarysites >35 years, and declined modestly for primary sites;these dynamics were consistent with both the field data forcanopy closure and the theories of canopy development(Van Pelt and Franklin 2000; Van Pelt and Nadkarni 2004).
Effect of size of LiDAR sample areaA surprising result from our study was that correlations
between field- and LiDAR-based ordinations generally werelower when based on variable-sized LiDAR study areas thanwhen based on fixed 0.09 ha study areas. The fixed-sizestudy areas were larger than most second-growth sites butsmaller than most primary forest sites. These differencessuggest that there may be an optimal sample area size forcharacterizing forests from LiDAR canopy data. This is anavenue for further study; researchers might explore differ-ent-sized areas for measuring LiDAR data to determine ifthere is an optimal size for their forest types.
ConclusionsThe cost of traditional field measurements limits the
amount of forest structural data that can be collected. Wedeveloped methods for measuring the structural complexityof closed-canopy conifer forests using simple LiDAR met-rics that were strongly correlated with structure as measured
through field metrics of live trees. Future studies that coor-dinate field and LiDAR measurements might seek to betterunderstand the relationship between the processes acting ontree stems and canopies.
The low cost of LiDAR acquisition (on a per hectare ba-sis) opens up new opportunities to measure and study foreststructure at stand to landscape scales. These data would pro-vide forest ecologists and managers with data from theequivalent area of hundreds of thousands of field plots.Data sets representing large spatial scales combined withfield data would permit in-depth explorations of forest de-velopment across different age ranges, geomorphologies,and spatial scales to explore variation in the paths alongwhich structural complexity develops.
This study supports Lefsky et al.'s (2005) conclusion thatforest structure can be characterized with a small set of coreLiDAR metrics with high correlation with field rnetrics. Wealso found that LiDAR metrics retain their correlation whenthe size of the LiDAR sample area differs from the size of thefield plot. The specific metrics and LiDAR samples that bestdescribe canopy structural complexity may differ among forestbiomes, but we believe that identifying core sets of easily in-terpreted LiDAR metrics will make LiDAR data more usableby a wide range of ecologists and forest professionals.
AcknowledgementsThis work was supported by NASA Headquarters under
the NASA Earth and Space Science Fellowship Program(grant NNX07 AN75H). The Watershed Services Division ofSeattle Public Utilities, the King County Government ofWashington State, and the Nature Conservancy of Washing-ton State provided funding Support. The Watershed ServicesDivision of Seattle Public Utilities shared their permanentplot and LiDAR data used in the study. Comments by DerekChurchill, James A. Freund, R. Keala Hagmann, CharlesHalpern, Andrew J. Larson, and Christian Torgersen im-proved earlier drafts of this article. We thank two anony-mous reviewers for their suggestions.
ReferencesAcker, S.A., Sabin, T.E., Ganio, L.M., and McKee, W.A. 1998.
Development of old-growth structure and limber volume growthtrends in maturing Douglas-fir stands. For. Ecol. Manag. l04(1-3): 265-280. doi:10.1016/S0378-1127(97)00249-1.
Andersen, H.E., Reutebuch, S.E., and McGaughey, R.J. 2006. Arigorous assessment of tree height measurements obtained usingairborne lidar and conventional field methods. Can. J. RemoteSens. 32(5): 355-366.
Brokaw, N., Fraver, S., Grear, J.S., Thompson, J., Zimmerman,J.K., Waide, R.B., Everham, E.M., III, Hubbell, S.P., and Foster,R.B. 2004. Disturbance and canopy structure in two tropical for-ests. In Tropical forest diversity and dynamism - findings froma large-scale plot network. Edited by E.C. Losos and E.G. LeighJr. University of Chicago Press, Chicago, III. pp. 177-194.
Digby, P.G.N., and Kempton, R.A. 1987. Multivariate analysis ofecological communities. Chapman and Hall, London, U.K.
Erckmann, J., Chinn, A., Flagor, S., Kurko, K., Freeman, J., Little,R., Schneider, G., and Vanderhoof. J. 2000. Final Cedar RiverWatershed Habitat Conservation Plan. City of Seattle, Wash.Available from www.seattle.gov/util/AbouCSPU/Water_System/Habitat_Conservation_Plan/ AbouttheHCP/Documents/index.htm.
Falkowski, M.J., Evans, J.S., Martinuzzi, S., Gessler. P.E., andHudak, A.T. 2009. Characterizing forest succession with lidardata: an evaluation for the Inland Northwest USA. RemoteSens. Environ. 113(5): 946-956. doi: 10.1016/j.rse.2009.01.003.
Franklin, J.F., and Dyrness, C.T. 1988. Natural vegetation of Ore-gon and Washington. Oregon State University Press. Corvallis,Ore.
Franklin. J.F., and Spies, T.A. 1991. Composition, function, andstructure of old-growth Douglas-fir forests. In Wildlife andvegetation of unmanaged Douglas-fir forests. Edited by L.F.Ruggiero, K.B. Aubry, A.B. Carey, and M.H. Huff. U.S. For.Servo Gen. Tech. Rep. PNW-GTR-285. pp. 71-80.
Franklin, J.F., Spies, T.A., Van Pelt, R., Carey, A.B., Thornburgh,D.A., Berg, D.R., Lindenmayer, D.B., Harmon, M.E., Keeton,W.S., Shaw, D.C., Bible, K., and Chen, J.Q. 2002. Disturbancesand structural development of natural forest ecosystems with sil-vicultural implications, using Douglas-fir forests as an example.For. Ecoi. Manag. 155(1-3): 399-423. doi:10.1016/S0378-1127(01)00575-8.
Harding, D.J., Lefsky, M.A., Parker, G.G., and Blair, J.B. 2001.Laser altimeter canopy height profiles - methods and valida-tion for closed-canopy, broadleaf forests. Remote Sens. Environ.76(3): 283-297. doi:1O.1016/S0034-4257(00)00210-8.
Hemstrom, M.A., and Franklin, J.F. 1982. Fire and other distur-bances of the forests in Mount Rainier National Park. Quat.Res. 18(1): 32-51. doi: 10.1016/0033-5894(82)90020-5.
Henderson, JA., Lesher, R.D., Peter, D.H., and Shaw, D.C. 1992.Field guide to the forested plant associations of the Mt. Baker-Snoqualmie National Forest. Tech. Pap. R6. ECOL TP 028-91.U.S. Department of Agriculture Forest Service, Pacific North-west Research Station
Hill, R.A., and Thomson, A.G. 2005. Mapping woodland speciescomposition and structure using airborne spectral and LiDARdata. Int. J. Remote Sens. 26(17): 3763-3779. doi:lO.l0801014311 60500114706.
Ishii, H., and McDowell, N. 2002. Age-related development ofcrown structure in coastal Douglas-fir trees. For. Ecol. Manag.169(3): 257-270. doi:l0. 1016/S0378-1 127(01)00751-4.
Ishii, H.T., Van Pelt, R., Parker, G.G., and Nadkami, N.M. 2004.Age-related development of canopy structure and its ecologicalfunctions. In Forest canopies. Edited by M.D. Lowman andH.B. Rinker. Elsevier Academic Press, Burlington, Mass.
Kane. V.R., Gillespie, A.R., McGaughey, R., Lutz, J.A., Ceder, K.,and Franklin, J.F. 2008. Interpretation and topographic compen-sation of conifer canopy self-shadowing. Remote Sens, Environ.112( 10): 3820-3832. doi: 10.1016/j.rse.2008.06.00l.
Kane, V.R., Bakker, J.D., McGaughey, RJ., Lutz, J.A., Gersonde,R.F., and Franklin, J.F. 2010. Examining conifer canopy struc-tural complexity across forest ages and elevations with LiDARdata. Can. J. For. Res. 40(4): 774-787. doi:10.1l391X10-064.
Kraus, K., and Pfeifer, N. 1998. Determination of terrain models inwooded areas with airborne laser scanner data. ISPRS J. Photo-gramm. Remote Sens, 53(4): 193-203. doi: 10.1016/S0924-2716(98)00009-4.
Larson. A.J., Lutz, J.A., Gersonde, R.F., Franklin, J.F., and Hietpas,F.F. 2008. Potential site productivity influences the rate of foreststructural development. Ecol. Appl. 18(4): 899-910. doi: 10.1890107-1191.1. PMID: 18536251.
Larson, J.A., and Franklin, FJ. 2006. Structural segregation andscales of spatial dependency in Abies amabilis forests. J. Veg.Sci. 17(4): 489-498.
Lefsky, M.A., Cohen, W.B., Acker, S.A., Parker, G.G., Spies, T.A.,and Harding, D. 1999. Lidar remote sensing of the canopy struc-ture and biophysical properties of Douglas-fir western hemlock
forests. Remote Sens. Environ. 70(3): 339-361. doi: 10.1016/S0034-4257(99)00052-8.
Letsky, M.A., Cohen, W.B., and Spies, T.A. 2001. An evaluationof alternate remote sensing products for forest inventory, moni-toring, and mapping of Douglas-fir forests in western Oregon.Can. J. For. Res. 31(1): 78-87. doi:10.1139/cjfr-31-1-78.
Lefsky, M.A., Cohen, W.B., Harding, D.J., Parker, G.G., Acker,S.A.. and Gower, S.T. 2002. Lidar remote sensing of above-ground biomass in three biomes. Glob. Ecol. Biogeogr. 11(5):393-399. doi: 10.1046/j.1466-822x.2002.00303.x.
Lefsky, M.A., Hudak, A.T., Cohen, W.B., and Acker, S.A. 2005.Patterns of covariance between forest stand and canopy structurein the Pacific Northwest. Remote Sens. Environ. 95(4): 517-531. doi: 10.1016/j.rse.2005.01.004.
Lertzman, K.P., and Krebs, C.J. 1991. Gap-phase structure of asub-alpine old-growth forest. Can. J. For. Res. 21(12): 1730-1741. doi:l0.1139/x91-239.
Lindenmayer, D.B., and Franklin, J.F. 2002. Conserving forest bio-diversity: a comprehensive multiscaled approach. Island Press,Washington, D.C.
Lutz, J.A., and Halpern, C.B. 2006. Tree mortality during early for-est development: a long-term study of rates, causes. and conse-quences. EcoL. Monogr. 76(2): 257-275. doi: 10.1890/0012-9615(2006)076[0257 :TMDEFD]2 .0.CO;2.
McCune, B., and Grace, J.B. 2002. Analysis of ecological commu-nities. MjM Software Design, Gleneden Beach, Ore.
McElhinny, C., Gibbons, P., Brack, c., and Bauhus, J. 2005. Forestand woodland stand structural complexity: its definition andmeasurement. For. Ecol. Manag. 218( 1-3): 1-24. doi: 10.1016/j.foreco.2005.08.034.
Naesset, E., and Okland, T. 2002. Estimating tree height and treecrown properties using airborne scanning laser in a boreal naturereserve. Remote Sens. Environ. 79(1): 105-115. doi:10.10161S0034-4257(01 )00243-7.
Ogunjemiyo, S., Parker, G., and Roberts, D. 2005. Reflections inbumpy terrain: Implications of canopy surface variations for theradiation balance of vegetation. IEEE Geosci. Remote Sens.Lett. 2(1): 90-93. doi:10.1109/LGRS.2004.841418.
Oksanen, J., Kindt, R., Legendre, P., O'Hara, B., Simpson, G.L.,Henry, M., Stevens. H., and Wagner, H. 2008. Vegan: commu-nity ecology package. R package version 1.13-1. Available fromhttp://r-forge.r-project.org/projects/vegan.
Packee, E.C., Oliver, C.D., and Crawford, P.O. (Editors). 1982.Ecology of Pacific silver fir. Institute of Forest Resources Con-tribution No. 45. College of Forest Resources, University of Wa-shington, Seattle, Wash.
Parish, R., and Antos, J.A. 2006. Slow growth, long-lived trees,and minimal disturbance characterize the dynamics of an an-cient, montane forest in coastal British Columbia. Can. J. For.Res. 36(11): 2826-2838. doi: 10.1139/X06-166.
Parker, G.G., and Russ, M.E. 2004. The canopy surface and standdevelopment: assessing forest canopy structure and complexitywith near-surface altimetry. For. Ecol. Manag. 189( 1-3): 307-315. doi: 10.1016/j.foreco.2003.09.00l.
Parker, G.G., Harmon, M.E., Lefsky, M.A., Chen, J., Van Pelt, R.,Weis, S.B., Thomas, S.C., Winner, W.E., Shaw, D.C., andFranklin, J.F. 2004. Three-dimensional structure of an old-growth Pseudotsuga-Tsuga canopy and its implications for ra-diation balance, microclimate, and gas exchange. Ecosystems(N.Y., Plint), 7(5): 440-453. doi: 10.1007/5 I0021-004-0 l36-5.
Podani, J., and Miklos, I. 2002. Resemblance coefficients and thehorseshoe effect in principal coordinates analysis. Ecology, 83(12):3331-3343. doi: 10.1890/0012-9658(2002)083[3331 :RCATHE]2.0.CO;2.
R Development Core Team. 2007. R: a language and environmentfor statistical computing. Available from http://www.R-project.argo
Skowronski, N., Clark, K., Nelson, R., Hom, J., and Patterson, M.2007. Remotely sensed measurements of forest structure andfuel loads in the Pinelands of New Jersey. Remote Sens. En-viron. 108(2): 123-129. doi:10.1016/j.rse.2006.09.032.
Smith, D.M., Larson, B.C., Kelty, M.J., and Ashton. P.M.S. 1997.the practice of silviculture: applied forest ecology. John Wiley& Sons, New York.
Spies, T.A. 1998. Forest structure: a key to the ecosystem. North-west Sci. 72: 34-39.
Spies, T.A., and Franklin, J.F. 199J. The structure of naturalyoung, mature, and old-growth Douglas-fir forests in Oregonand Washington. In Wildlife and vegetation of unmanaged Dou-glas-fir forests. Edited by L.F. Ruggiero, K.B. Aubry, A.B.Carey, and M.H. Huff. U.S. For. Servo Gen. Tech. Rep. PNW-GTR-285. pp. 91-109.
Tappeiner, J.C., Huffman, D., Marshall, D., Spies, T.A., andBailey. J.D. 1997. Density, ages, and growth rates in old-growthand young-growth forests in coastal Oregon. Can. J. For. Res.27(5): 638-648. doi:l0.1 I39/cjfr-27-5-638.
Van Pelt, R., and Franklin, J.F. 2000. Influence of canopy structureon the understory environment in tall, old-growth. conifer for-ests. Can. J. For. Res. 30(8): 1231-1245. doi:10.1139/cjfr-30-8-1231.
Van Pelt, R., and Nadkarni, N.M. 2004. Development of canopystructure in Pseudotsuga menziesii forests in the southern Wa-shington Cascades. For. Sci. 50(3): 326-341.
Van Pelt. R.. and Sillett, S.C. 2008. Crown development of coastalPseudotsuga menziesii. including a conceptual model for tallconifers. Ecol. Monogr. 78(2): 283-311. doi:10.1890/07-0158.l.
Winter, L.E., Brubaker, L.B., Franklin, J.F., Miller, E.A., andDeWitt, D.Q. 2002. Initiation of an old-growth Douglas-firstand in the Pacific Northwest: a reconstruction from tree-ringrecords. Can. J. For. Res. 32(6): 1039-1056. doi: 10.1139/x02-031.
Zenner, E.K. 2004. Does old-growth condition imply high live-treestructural complexity? For. Ecol. Manag. 195(1-2): 243-258.doi: 10.1016/j.foreco.2004.03.026.
Zenner, E.K. 2005. Development of tree size distributions in Dou-glas-fir forests under differing disturbance regimes. Ecol. Appl.15(2): 701-714. doi:10.1890/04-0150.