comparitive analysis of interline power...
TRANSCRIPT
475 | P a g e
COMPARITIVE ANALYSIS OF INTERLINE POWER
FLOW CONTROLLER WITH PI &FUZZY LOGIC
CONTROLLER
Ch. Venkata Krishna Reddy1, B. Suresh Kumar
2, D. Ashok Kumar
3 1,2
Assistant Professor, Department of Electrical and Electronics Engineering,
Chaitanya Bharathi Institute of Technology, Hyderabad
3Assistant Professor, Department of Electrical and Electronics Engineering,
Sreenidhi Institute of Technology, Hyderabad
ABSTRACT
Cost of the transmission lines plays a vital role in the network company. Because of the various practical
constraints, the transmission lines are often only utilized for a fraction of it individual limits. To improve the
economical aspects one possibility would be to add to the value of transmission lines by transport large amount
of energy through those lines. One of the solutions to this problem will be a FACTS technology. An Interline
Power Flow Controller (IPFC) is a converter-based FACTS controller for series compensation with capability
of controlling power flow among multi-lines within the same corridor of the transmission line. In this paper, it is
proposed to develop the Interline power flow controller using Pi controller and Fuzzy Logic Controller.. The
basic characteristics of IPFC are to be analyses on two similarly dimensioned parallel transmission lines. The
model has to be simulated with Matlab simulink program to demonstrate system behavior of interline power
flow controller. Numerical results are to be demonstrated on the IEEE 30 Bus system with the Interline power
flow controller model. It has to be validating that there is a possibility of regulating active power flow, reactive
power flow and minimizing the power losses simultaneously with proposed IPFC parameter.
Keywords: Flexible AC Transmission System (FACTS), Voltage Source Converter (VSC), Interline
Power Flow Controller (IPFC), PI Controller, Fuzzy Controller.
I. INTRODUCTION
In general the FACTS controller can be divided in to two group converter based FACTS controller and Non
converter based FACTS controller. Non-Converter based FACTS controller include Static Var compensator
(SVC) and Thyristor-controlled series capacitor (TCSC) have the advantage of generating or absorbing reactive
power without the use of ac capacitors and reactors. Converter based FACTS controller include STATCOM,
SSSC, UPFC and IPFC which has the capable of individually control the active and reactive power flow on the
transmission line. The basic concept of FACTS controller are clearly explained in the book, „understanding
FACTS concepts and Technology of Flexible The detailed explanation about series connected FACTS controller
476 | P a g e
such as Static Synchronous Series compensator (SSSC) and Interline power flow controller given in [2, 3]. Both
SSSC and IPFC have the capable of operating in capacitive/ inductive mode. The Unified Power Flow
Controller (UPFC) is an combination of two FACTS device such as STATCOM and SSSC linked together with
the common DC link, were as the IPFC consist of two are more than two SSSC linked together with the common
DC link. Each SSSC provide the reactive power compensation to the individual line were it connected and also it
has the capable of transmitting the real power from underutilized line to the overloaded line these concepts was
explained in [4]. The paper [5] a simple mathematical model of IPFC was proposed for the optimal control of
power flow on the transmission lines. Mathematical models of generalized unified power flow controller
(GUPFC) and IPFC and their implementation in Newton power flow are demonstrate in [6].
In the year 2002 a basic characteristic of Voltage Source Converter based Interline Power Flow Controller was
discussed in paper [7] by the author Jianhong chen etal. Along with two basic control scheme, namely (i) Special
Control Scheme and (ii) General control Scheme. The Special control scheme is designed for the power flow
control of a transmission system with two identical parallel lines while the general control scheme can be used to
solve the power flow control problem in a multi-line transmission system. Both special and general control
schemes are based on the decoupled PI controller. A current source converter topology based inter line power
flow controller was proposed in paper [8], along with decoupled stat-feedback control for the injected voltage
with a separated dc current controller. Here the dynamic model of the system is derived and divided into a liner
part and a nonlinear part. The linear part is controlled in an inner loop by a decoupled state-feedback controller.
The nonlinear part is controlled in an outer loop by a PI controller which regulates the dc side current.
In paper [9] the regulation model of an Interline Power Flow Controller and its control strategies at rated
capacity was discussed. Rated capacity operation is important in determining the maximum power transfer
capability under voltage stability conditions. A model decomposition approach is proposed to select the best
damping control input signals. The proposed technology was demonstrated on a 20-bus testsystem. The dispatch
result shows that the IPFC improve the power transfer in the system. The author Sasan Salem proposed a two 3-
level neutral point clamped voltage source converter for interline power flow controller in paper [10]. In this
proposal interline power flow controller was designed to compensate the impedances of two similarly
dimensioned parallel transmission lines. The behavior of the system under various transient and load changes at
the receiving-end of the transmission system was presented. The interline power flow controller has the
capability in compensating both resistance and reactance of the transmission line, and maintaining the dc-link
voltage constant. The dc link voltage is balanced by using a balancing circuit based on zero sequence current.
In this paper a detailed switching level simulation model of IPFC was developed on the Matlab Simulink
environment. Here the IPFC was developed to compensate the impedance of the transmission line.
An in-direct controller Strategy was developed to controller the power flow on the transmission line i.e. the
power flows on the transmission line was controlled by varying the active impedance of the transmission line.
The controller is also otherwise called as reactance controller as in [10]. The performance on the IPFC on the
parallel transmission line was demonstrated. IEEE 30 Bus system was modeled in the Simulink and it
performance was investigated without IPFC,IPFC with PI,Fuzzy logic controllers. Three different case studies
were carry out on the practical 30 Bus system to study the dynamic behavior of the IPFC. Power flow analysis at

477 | P a g e
base load, 10% increasing in load condition and under fault condition were carryout without IPFC,IPFC with PI,
Fuzzy logic controllers.
II. PROBLEM FORMULATION
The losses in the Transmission Line and demand on the power system increased gradually. The increasing in
Losses and demand is fulfilled either by increasing the generation or by improving the existing system. FACTS
technology is essential to alleviate some of the problem but not all of these difficulties. Converter based FACTS
controller have the capability to control both active and reactive power flow on the transmission line. The line
current and injected voltage the effective reactance of the transmission line is varied. SSSC is used to control the
power flow in single transmission line whereas the IPFC is used to control the powerflow power flow on the
multi transmission line.
III. INTERLINE POWER FLOW CONTROLLER
IPFC consist of a number of DC to AC inverters, each inverter providing reactive power compensation to the
different line. IPFC can also view as a combination of number of SSSC linked together at their DC terminals. A
detailed simulink model of IPFC is shown in the Fig. 1. With this configuration any of the inverter can be
controlled to supply the real power to the common DC link from its own transmission line. Thus the overall
surplus power can be made to utilize from the lightly loaded line to overloaded line. For analysis purpose let as
consider the IPFC consist of two Voltage source converters among which converter 1 will act as the master
which control the power flow on the line one independent of the line 2. Converter 2 on the line 2 is meant for
maintaining the DC link voltage irrespective of variation in supply. The simulink model consists of Generator,
IPFC, Parallel transmission lines and two loads. The generator is modeled using three phase voltage source
followed by impedance. The values of generator parameters are given in the Appendix I.
Fig.1.Simulink model of IPFC
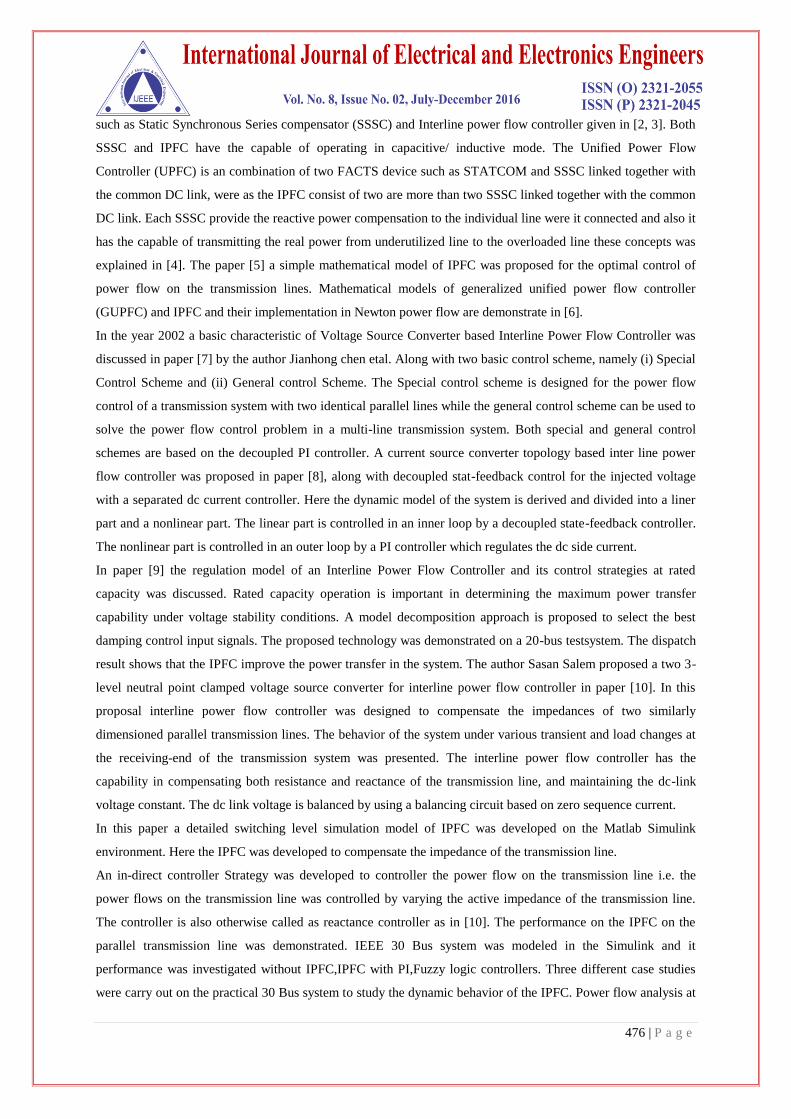
Voltage source converters are connected in series with the transmission line through the series transformer which
is shown in Fig. 2 and Fig. 3. The rating of the series transformer and the value of the DC link capacitance are
given in the Appendix II. The transmission lines are constructed using the distributed parameter block available
in the simulink environment. The value of the transmission line parameter and loads on the line 1 and line 2 are
478 | P a g e
given in Appendix III.
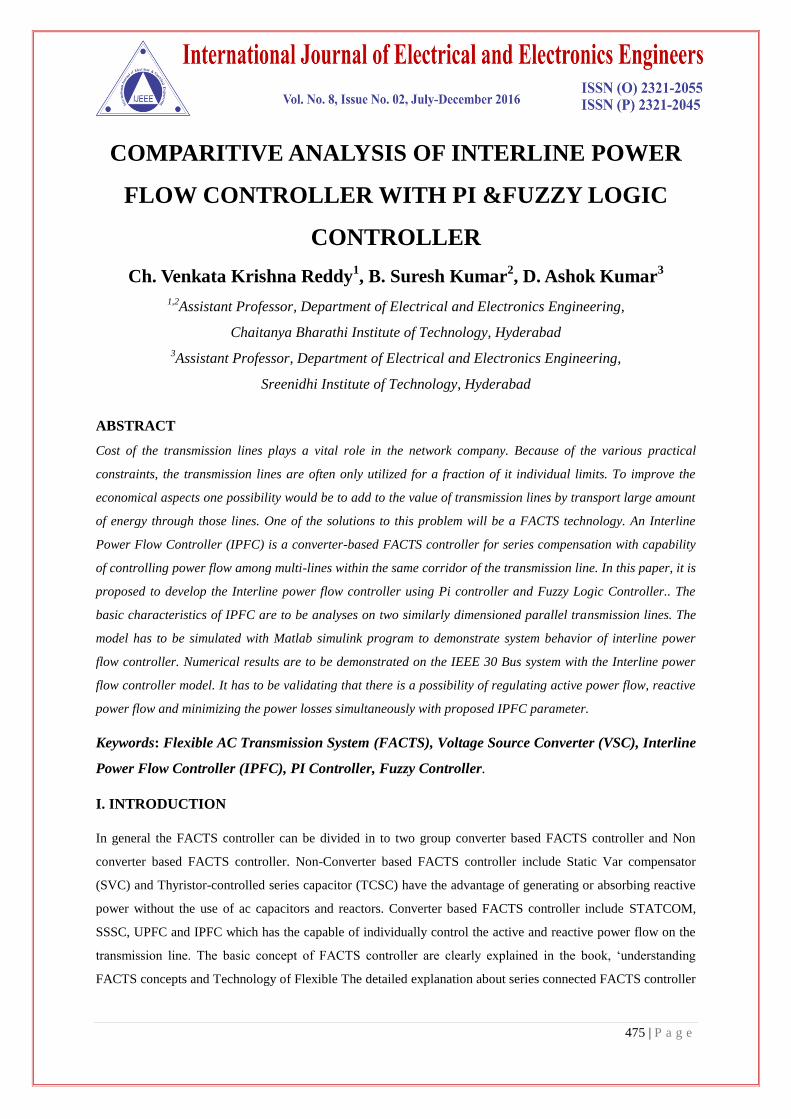
Fig.2.Series Transformer along With VSC
In case of UPFC the active power demand of the series converter was supplied by the shunt device. However in
IPFC the active power demand of one series inverter is compensated by another series inverter. The power
exchange between two inverters depending on the current flows through the transmission lines.
Fig.3.Simulink Model of VSC along With Series Transformer
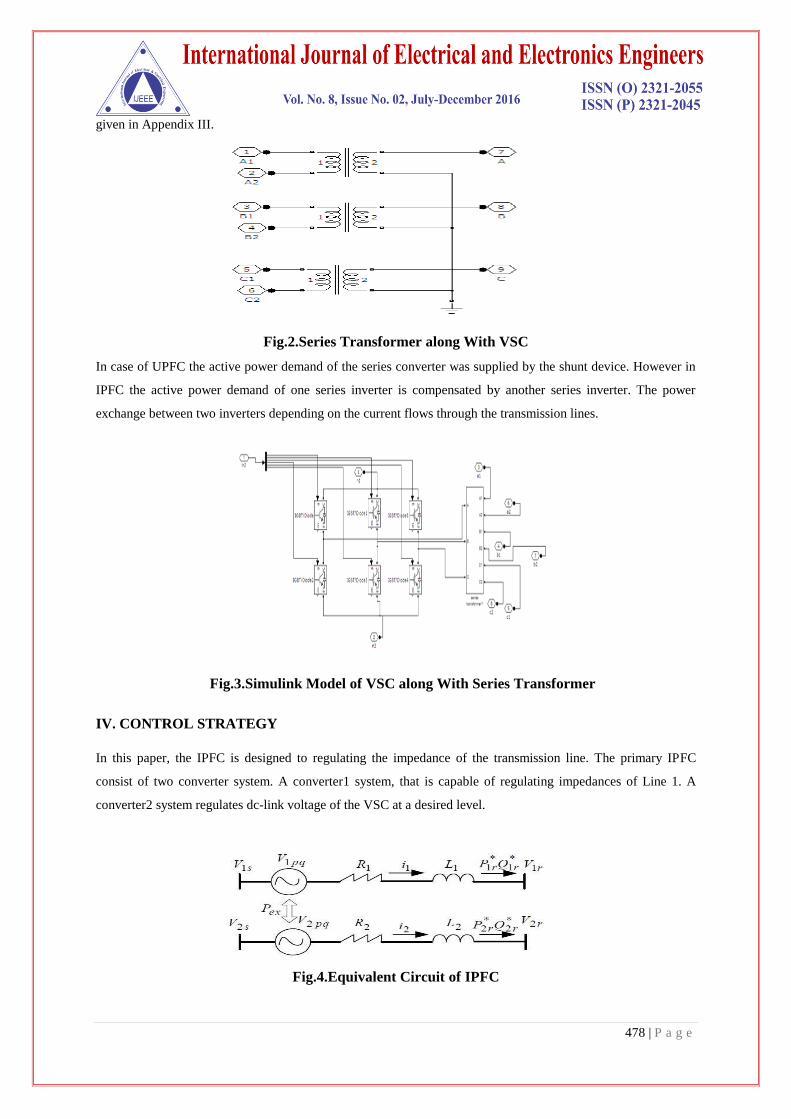
IV. CONTROL STRATEGY
In this paper, the IPFC is designed to regulating the impedance of the transmission line. The primary IPFC
consist of two converter system. A converter1 system, that is capable of regulating impedances of Line 1. A
converter2 system regulates dc-link voltage of the VSC at a desired level.
Fig.4.Equivalent Circuit of IPFC
479 | P a g e
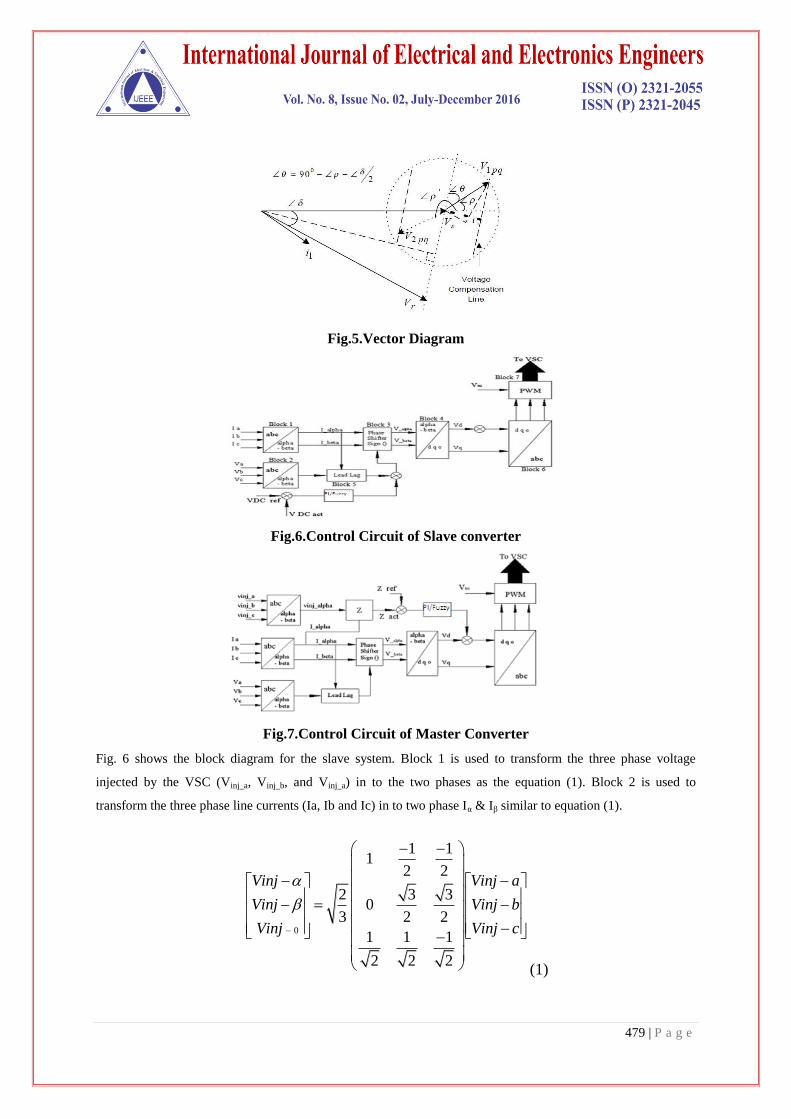
Fig.5.Vector Diagram
Fig.6.Control Circuit of Slave converter
Fig.7.Control Circuit of Master Converter
Fig. 6 shows the block diagram for the slave system. Block 1 is used to transform the three phase voltage
injected by the VSC (Vinj_a, Vinj_b, and Vinj_a) in to the two phases as the equation (1). Block 2 is used to
transform the three phase line currents (Ia, Ib and Ic) in to two phase Iα & Iβ similar to equation (1).
0
1 11
2 2
2 3 30
3 2 2
1 1 1
2 2 2
Vinj Vinj a
Vinj Vinj b
Vinj Vinj c
(1)
480 | P a g e
Block 5 (Lead/ Lag Block) receives the reference signal of the line voltage Vα and from block 3 and the
reference signal of the line current Iα from block 2 and computes the 90° phase shift and its sign. This
information is summed with the output angle from the DC voltage controller. Block 3 receives the Iα and Iβ
reference signals from block 2. These signals are modulated by the sum of the signals from the DC voltage
controller and Lead/ Lag blocks to generate the modified reference signals Vα‟ and Vβ‟. Block 4 is the α – β – 0
to d – q- 0 transformation block used to convert the two phase reference components in stationary frame Vα‟ and
Vβ‟ to two phase reference component in synchronously rotating frame Vd‟ and Vq‟ as per the equation (5).
These signals are then fed to PWM trigger unit to generate the pulse.
0
cos sin2
sin cos 03
0 0
0
0
d a
q b
c
s wt wt s
s wt wt s
s s
(2)
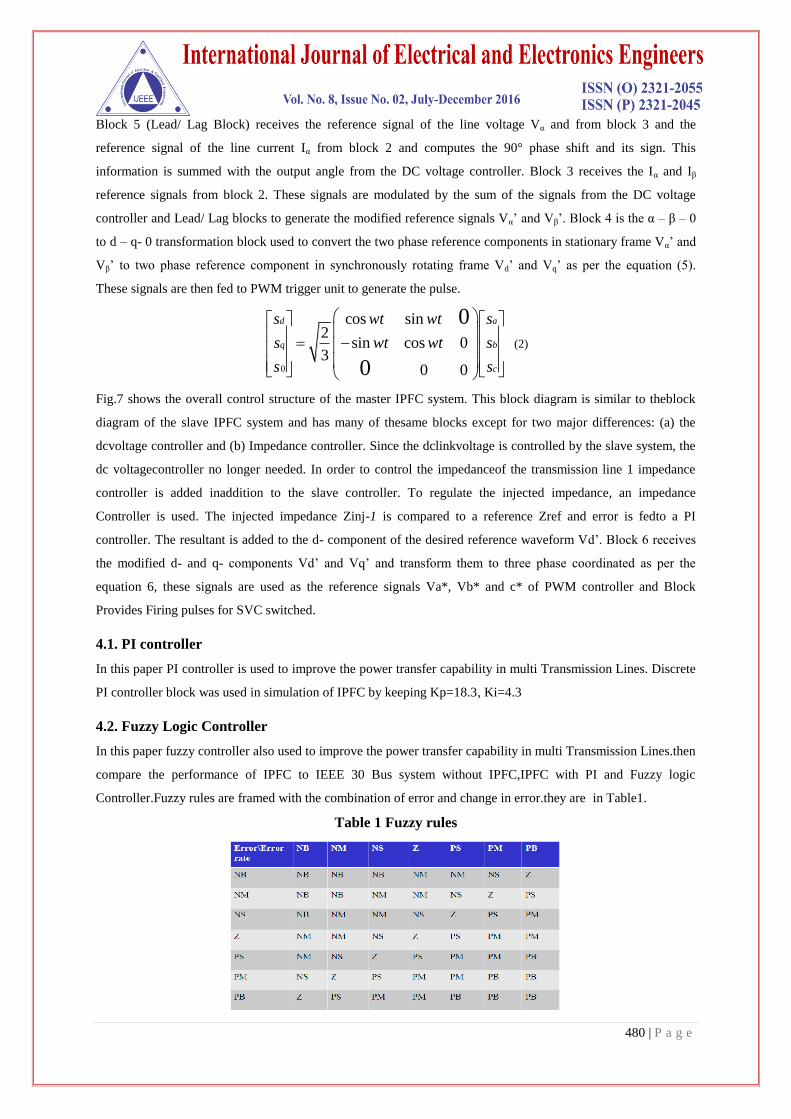
Fig.7 shows the overall control structure of the master IPFC system. This block diagram is similar to theblock
diagram of the slave IPFC system and has many of thesame blocks except for two major differences: (a) the
dcvoltage controller and (b) Impedance controller. Since the dclinkvoltage is controlled by the slave system, the
dc voltagecontroller no longer needed. In order to control the impedanceof the transmission line 1 impedance
controller is added inaddition to the slave controller. To regulate the injected impedance, an impedance
Controller is used. The injected impedance Zinj-1 is compared to a reference Zref and error is fedto a PI
controller. The resultant is added to the d- component of the desired reference waveform Vd‟. Block 6 receives
the modified d- and q- components Vd‟ and Vq‟ and transform them to three phase coordinated as per the
equation 6, these signals are used as the reference signals Va*, Vb* and c* of PWM controller and Block
Provides Firing pulses for SVC switched.
4.1. PI controller
In this paper PI controller is used to improve the power transfer capability in multi Transmission Lines. Discrete
PI controller block was used in simulation of IPFC by keeping Kp=18.3, Ki=4.3
4.2. Fuzzy Logic Controller
In this paper fuzzy controller also used to improve the power transfer capability in multi Transmission Lines.then
compare the performance of IPFC to IEEE 30 Bus system without IPFC,IPFC with PI and Fuzzy logic
Controller.Fuzzy rules are framed with the combination of error and change in error.they are in Table1.
Table 1 Fuzzy rules
481 | P a g e
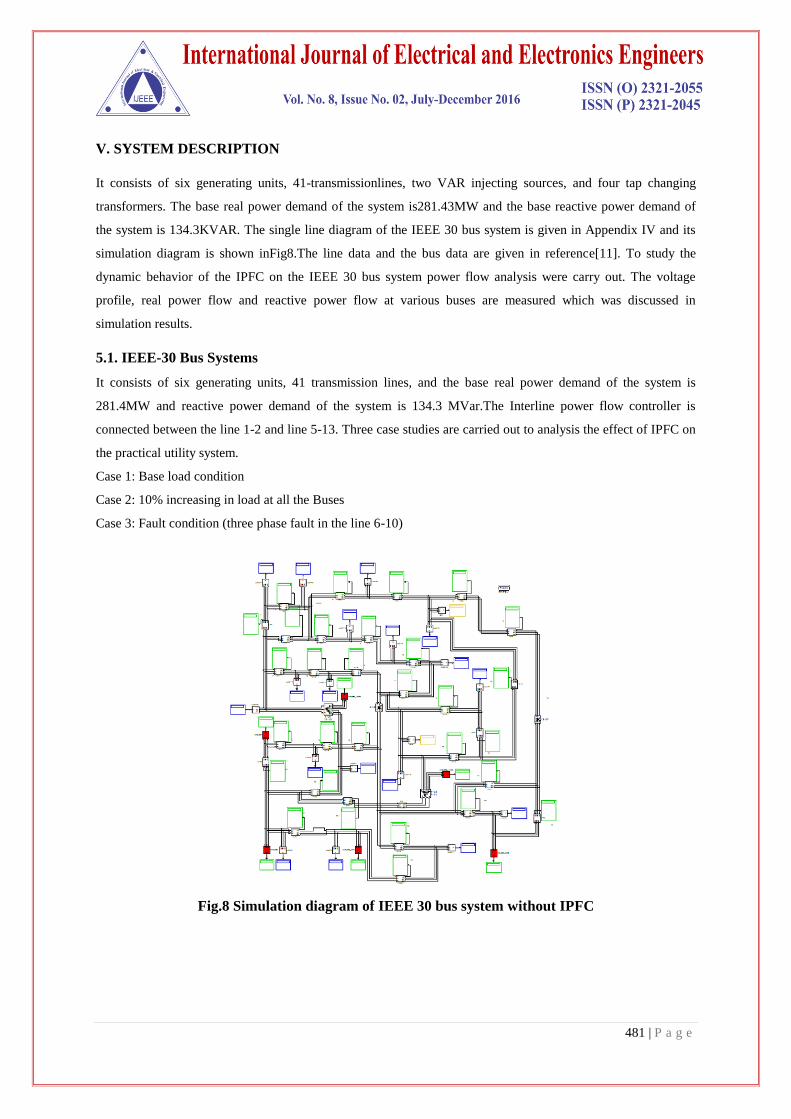
V. SYSTEM DESCRIPTION
It consists of six generating units, 41-transmissionlines, two VAR injecting sources, and four tap changing
transformers. The base real power demand of the system is281.43MW and the base reactive power demand of
the system is 134.3KVAR. The single line diagram of the IEEE 30 bus system is given in Appendix IV and its
simulation diagram is shown inFig8.The line data and the bus data are given in reference[11]. To study the
dynamic behavior of the IPFC on the IEEE 30 bus system power flow analysis were carry out. The voltage
profile, real power flow and reactive power flow at various buses are measured which was discussed in
simulation results.
5.1. IEEE-30 Bus Systems
It consists of six generating units, 41 transmission lines, and the base real power demand of the system is
281.4MW and reactive power demand of the system is 134.3 MVar.The Interline power flow controller is
connected between the line 1-2 and line 5-13. Three case studies are carried out to analysis the effect of IPFC on
the practical utility system.
Case 1: Base load condition
Case 2: 10% increasing in load at all the Buses
Case 3: Fault condition (three phase fault in the line 6-10)
Fig.8 Simulation diagram of IEEE 30 bus system without IPFC

482 | P a g e
Fig.9 Simulation diagram of IEEE 30 bus system with IPFC
VI. SIMULATION RESULTS AND DISCUSSION
Case 1: Base load Condition
Load flow analysis on the 30 Bus systems is carryout with and without Interline power flow controller at base
load condition. The Base active and reactive power demand of the system are 281.4MW and 134.3MVar
respectively. Voltage profile and real and reactive power at various buses are measured which is give in the table
2. From the illustration, it is inferred that before placing the interline power flow controller the average voltage
profile at all the buses was found to be 0.94pu, after placing the IPFC between the line 1-2 and line 5-13 the
average voltage profile at all the buses improved to 1.02pu. The real and reactive power delivered to all the
loads also increased. The comparison of various parameter bus voltages, real and reactive powers at various
buses are given in Fig.10 to12
Fig.10 Voltage at various buses under base load condition
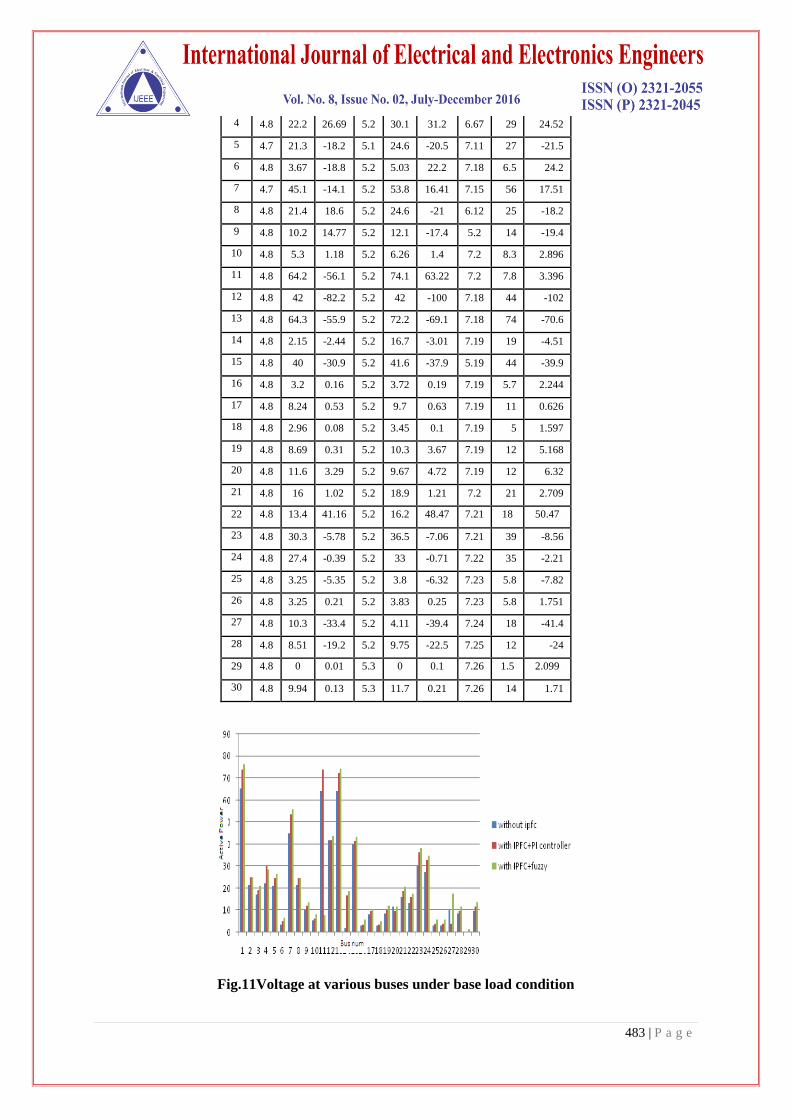
Table 2 Result under base load condition
Base Load Condition
Bu
s
No.
Without IPFC With IPFC+PI With IPFC+Fuzzy
VB P Q VB P Q VB P Q
1 4.7 65.4 -54.3 5.1 74.2 -67.1 7.08 76 -68.6
2 4.7 21.7 -18.2 5.1 25 -20.5 7.1 25 -16.3
3 4.8 17.3 -17.6 5.2 19.3 -21.4 7.17 21 -23.4
483 | P a g e
4 4.8 22.2 26.69 5.2 30.1 31.2 6.67 29 24.52
5 4.7 21.3 -18.2 5.1 24.6 -20.5 7.11 27 -21.5
6 4.8 3.67 -18.8 5.2 5.03 22.2 7.18 6.5 24.2
7 4.7 45.1 -14.1 5.2 53.8 16.41 7.15 56 17.51
8 4.8 21.4 18.6 5.2 24.6 -21 6.12 25 -18.2
9 4.8 10.2 14.77 5.2 12.1 -17.4 5.2 14 -19.4
10 4.8 5.3 1.18 5.2 6.26 1.4 7.2 8.3 2.896
11 4.8 64.2 -56.1 5.2 74.1 63.22 7.2 7.8 3.396
12 4.8 42 -82.2 5.2 42 -100 7.18 44 -102
13 4.8 64.3 -55.9 5.2 72.2 -69.1 7.18 74 -70.6
14 4.8 2.15 -2.44 5.2 16.7 -3.01 7.19 19 -4.51
15 4.8 40 -30.9 5.2 41.6 -37.9 5.19 44 -39.9
16 4.8 3.2 0.16 5.2 3.72 0.19 7.19 5.7 2.244
17 4.8 8.24 0.53 5.2 9.7 0.63 7.19 11 0.626
18 4.8 2.96 0.08 5.2 3.45 0.1 7.19 5 1.597
19 4.8 8.69 0.31 5.2 10.3 3.67 7.19 12 5.168
20 4.8 11.6 3.29 5.2 9.67 4.72 7.19 12 6.32
21 4.8 16 1.02 5.2 18.9 1.21 7.2 21 2.709
22 4.8 13.4 41.16 5.2 16.2 48.47 7.21 18 50.47
23 4.8 30.3 -5.78 5.2 36.5 -7.06 7.21 39 -8.56
24 4.8 27.4 -0.39 5.2 33 -0.71 7.22 35 -2.21
25 4.8 3.25 -5.35 5.2 3.8 -6.32 7.23 5.8 -7.82
26 4.8 3.25 0.21 5.2 3.83 0.25 7.23 5.8 1.751
27 4.8 10.3 -33.4 5.2 4.11 -39.4 7.24 18 -41.4
28 4.8 8.51 -19.2 5.2 9.75 -22.5 7.25 12 -24
29 4.8 0 0.01 5.3 0 0.1 7.26 1.5 2.099
30 4.8 9.94 0.13 5.3 11.7 0.21 7.26 14 1.71
Fig.11Voltage at various buses under base load condition

484 | P a g e
Fig.12 Voltage at various buses under base load condition
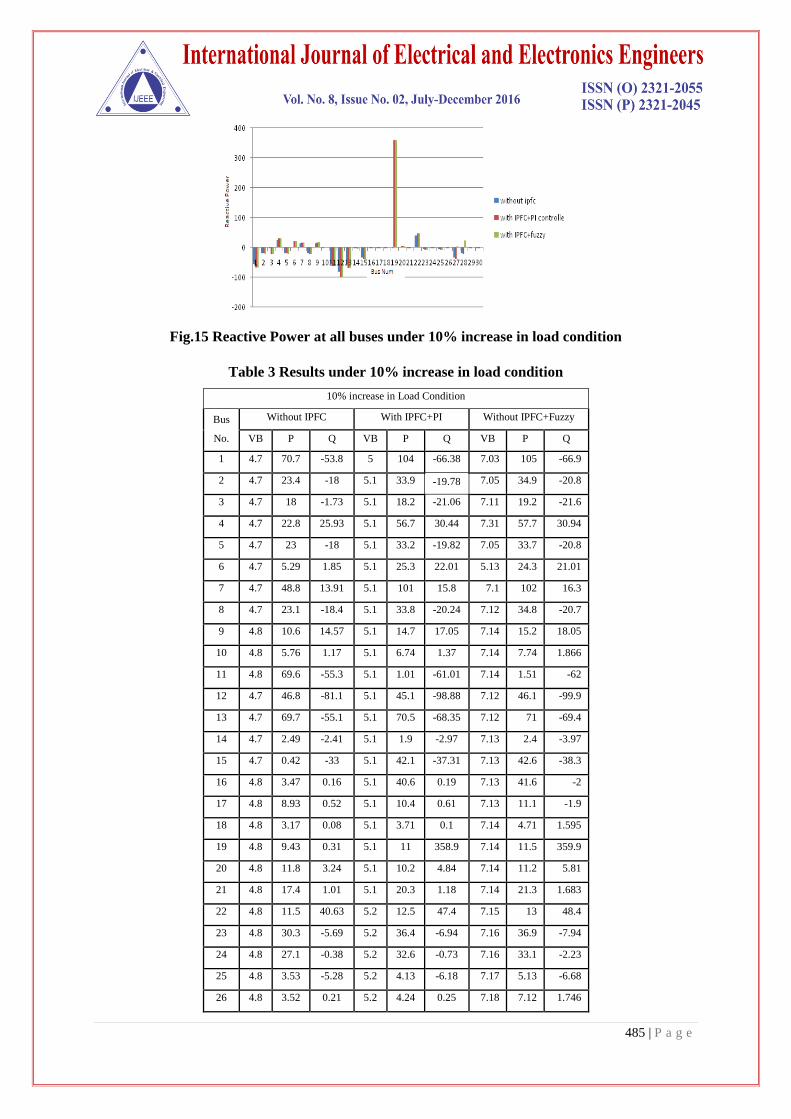
Case 2: 10% increasing in load at all the Buses
In this case the active power demand at all the buses is increased by 10%, the real power demand of the system is
keeping at 309.54MW. The reactive power demand remains same as the base value 134.3MVar and load flow
analysis is carryout with and without IPFC. From the load flow result it is inferred that due to increasing in load
demand the voltage profile at all the buses reduced further when compared to the base load condition. After
placing the IPFC between the lines 1-2 to line 5-13, the system will able to maintain the voltage profile within
the allowable limit. Load flow result under 10% increases in load condition is given in the Table 3 and the
comparisons of various parameters are given in Fig. 13 to Fig. 15.
Fig.13 Voltage at all buses under 10% increase in load condition
Fig.14Active Power at all buses under 10% increase in load condition
485 | P a g e
Fig.15 Reactive Power at all buses under 10% increase in load condition
Table 3 Results under 10% increase in load condition
10% increase in Load Condition
Bus
No.
Without IPFC With IPFC+PI Without IPFC+Fuzzy
VB P Q VB P Q VB P Q
1 4.7 70.7 -53.8 5 104 -66.38 7.03 105 -66.9
2 4.7 23.4 -18 5.1 33.9 -19.78 7.05 34.9 -20.8
3 4.7 18 -1.73 5.1 18.2 -21.06 7.11 19.2 -21.6
4 4.7 22.8 25.93 5.1 56.7 30.44 7.31 57.7 30.94
5 4.7 23 -18 5.1 33.2 -19.82 7.05 33.7 -20.8
6 4.7 5.29 1.85 5.1 25.3 22.01 5.13 24.3 21.01
7 4.7 48.8 13.91 5.1 101 15.8 7.1 102 16.3
8 4.7 23.1 -18.4 5.1 33.8 -20.24 7.12 34.8 -20.7
9 4.8 10.6 14.57 5.1 14.7 17.05 7.14 15.2 18.05
10 4.8 5.76 1.17 5.1 6.74 1.37 7.14 7.74 1.866
11 4.8 69.6 -55.3 5.1 1.01 -61.01 7.14 1.51 -62
12 4.7 46.8 -81.1 5.1 45.1 -98.88 7.12 46.1 -99.9
13 4.7 69.7 -55.1 5.1 70.5 -68.35 7.12 71 -69.4
14 4.7 2.49 -2.41 5.1 1.9 -2.97 7.13 2.4 -3.97
15 4.7 0.42 -33 5.1 42.1 -37.31 7.13 42.6 -38.3
16 4.8 3.47 0.16 5.1 40.6 0.19 7.13 41.6 -2
17 4.8 8.93 0.52 5.1 10.4 0.61 7.13 11.1 -1.9
18 4.8 3.17 0.08 5.1 3.71 0.1 7.14 4.71 1.595
19 4.8 9.43 0.31 5.1 11 358.9 7.14 11.5 359.9
20 4.8 11.8 3.24 5.1 10.2 4.84 7.14 11.2 5.81
21 4.8 17.4 1.01 5.1 20.3 1.18 7.14 21.3 1.683
22 4.8 11.5 40.63 5.2 12.5 47.4 7.15 13 48.4
23 4.8 30.3 -5.69 5.2 36.4 -6.94 7.16 36.9 -7.94
24 4.8 27.1 -0.38 5.2 32.6 -0.73 7.16 33.1 -2.23
25 4.8 3.53 -5.28 5.2 4.13 -6.18 7.17 5.13 -6.68
26 4.8 3.52 0.21 5.2 4.24 0.25 7.18 7.12 1.746

486 | P a g e
27 4.8 11.1 -32.9 5.2 13 -38.53 7.19 11 3.79
28 4.8 8.66 -18.9 5.2 8.24 -21.92 7.19 1.64 22.92
29 4.8 0 0.01 5.2 0 0.1 7.2 1.5 2.097
30 4.8 10.8 0.18 5.2 12.3 0.21 7.2 13.3 1.606
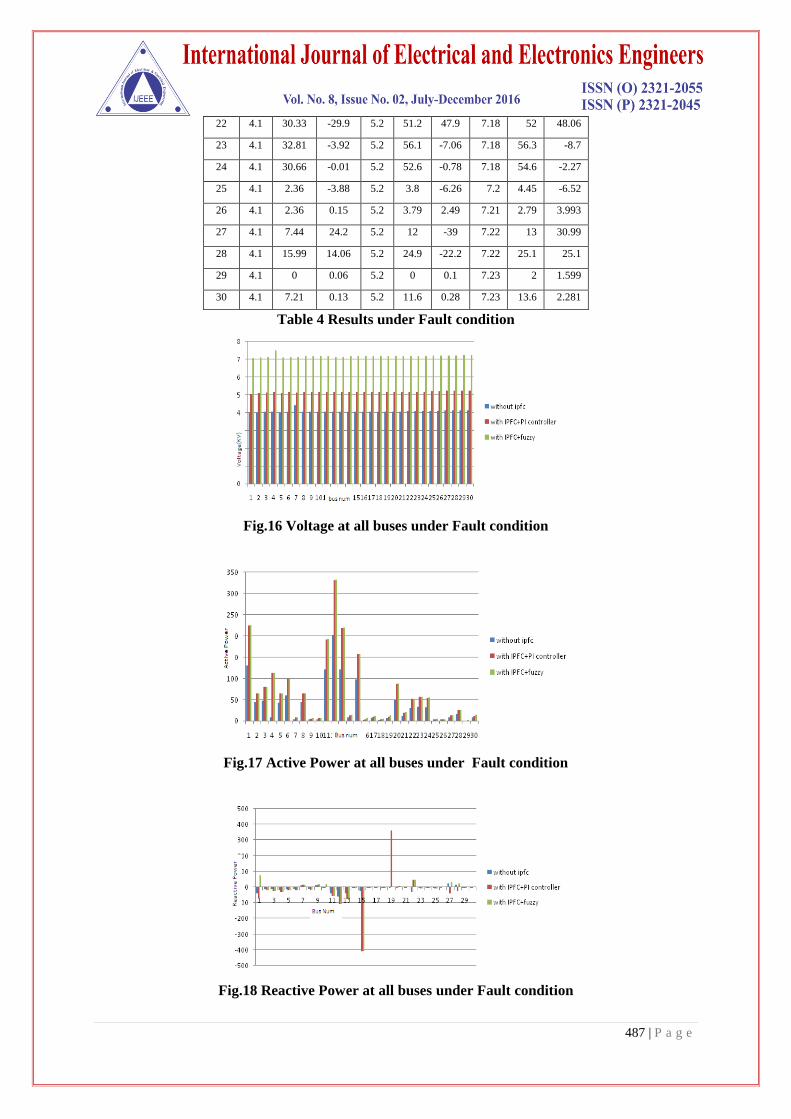
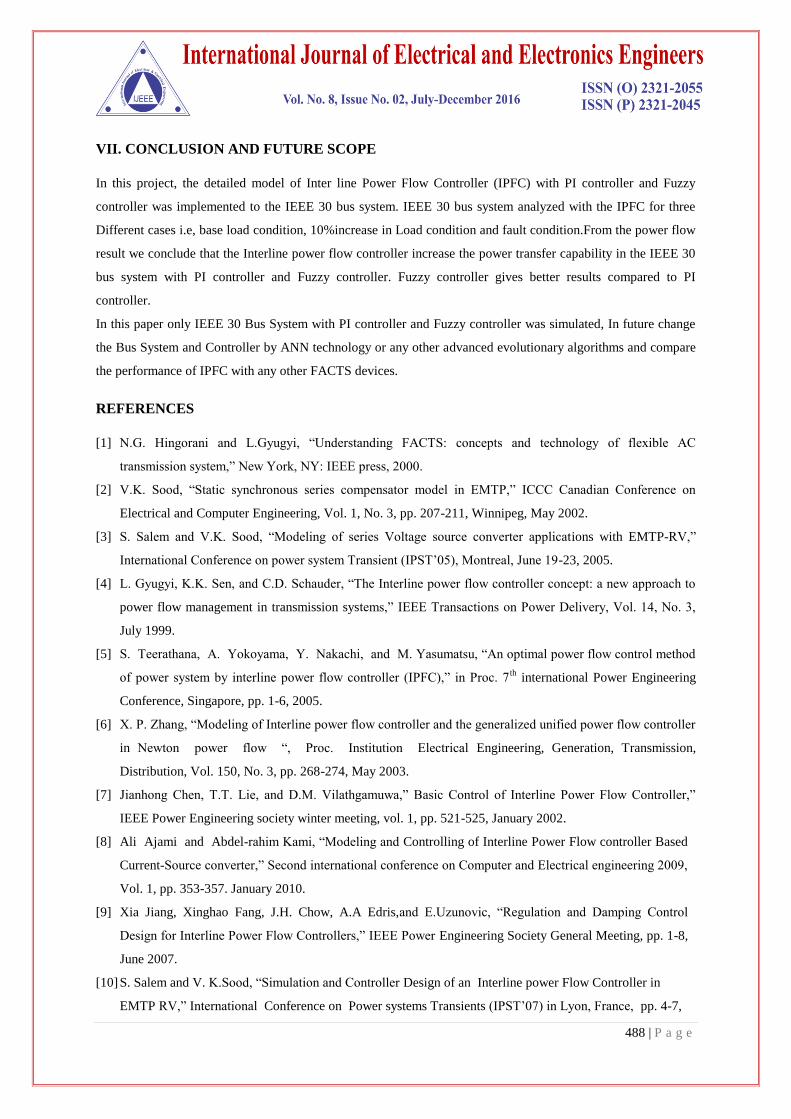
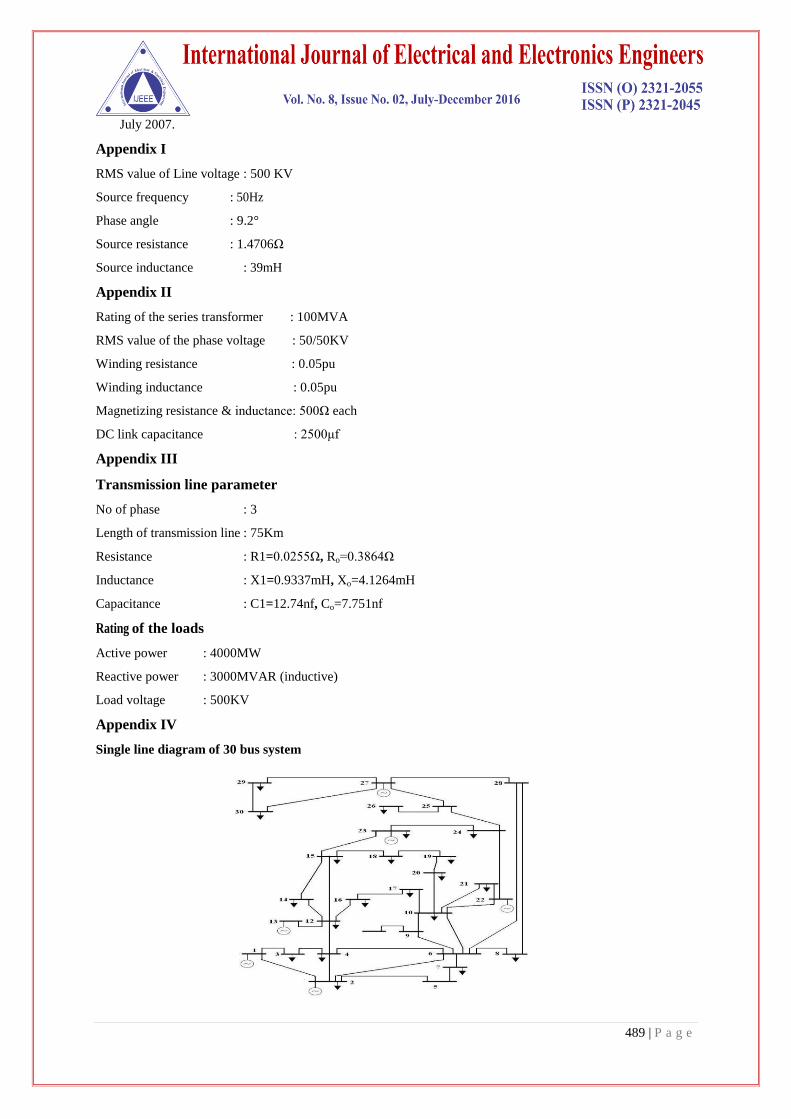
Case 3: Fault condition
To analysis the effectiveness of IPFC on the power flow management under fault condition, in this case a three
phase short circuit fault is created in the line 6-10 with fault resistance 500 ohm. Due to occurrence of the three
phase fault the average voltage profile at all the buses are reduced from 0.94pu to 0.8pu. Were as after placing
the IPFC in the system, it will able to maintain the voltage profile within the allowable limit and it will able to
deliver the required power to the load. Load flow result under fault condition is given in the Table 4 and the
comparisons of various parameters are given in Fig. 16 to Fig. 18.
Table 4 Results under Fault condition
fault Condition
Bus
No.
Without IPFC With IPFC+PI
Without
IPFC+Fuzzy
VB P Q VB P Q VB P Q
1 4 130.3 -39.3 5.1 225 -73.3 7.06 227 75.33
2 4 43.33 -13.2 5.1 64.1 -17.8 7.09 65.1 -18.8
3 4.1 47.79 -12.6 5.1 79.7 -22.2 7.14 80.7 -22.7
4 4.1 7.74 -19.8 5.2 113 -32.2 7.51 114 -33
5 4 43 -13.2 5.1 63.8 -18 7.09 64.3 -18.8
6 4.1 59.97 -12.6 5.2 98.2 -20.6 7.15 98.9 -21.1
7 4.4 3.7 10.22 5.1 7.13 15.5
4
7.13 7.63 16.54
8 4.1 43.2 -13.5 5.2 64.1 -18.3 7.17 64.6 -17.3
9 4.1 2.91 10.81 5.2 4.97 17.4
5
7.17 5.97 17.95
10 4.1 3.88 0.86 5.2 6.19 1.38 7.17 6.97 19.45
11 4.1 121 -40.7 5.2 192 -55.3 7.16 193 -56.8
12 4.1 202.3 -60.4 5.2 332 -108 7.15 333 -109
13 4.1 120.9 -40.5 5.2 218 -75.7 7.15 219 -76.2
14 4.1 8.32 -1.95 5.2 12.4 -3.58 7.16 13.4 -4.18
15 4.1 97.31 -22.7 5.2 157 -409 7.16 157 -408
16 4.1 2.32 0.12 5.2 3.73 0.19 7.16 5.73 1.692
17 4.1 5.98 0.38 5.2 9.6 0.62 7.16 11.2 2.119
18 4.1 2.12 0.06 5.2 3.4 0.1 7.17 4.62 1.596
19 4 6.3 0.23 5.2 10.1 362.
9
7.17 12.1 3.644
20 4.1 49.07 -2.95 5.2 86 8.09 7.17 88 9.59
21 4.1 11.63 0.74 5.2 18.7 1.2 7.17 20.7 2.696
487 | P a g e
22 4.1 30.33 -29.9 5.2 51.2 47.9 7.18 52 48.06
23 4.1 32.81 -3.92 5.2 56.1 -7.06 7.18 56.3 -8.7
24 4.1 30.66 -0.01 5.2 52.6 -0.78 7.18 54.6 -2.27
25 4.1 2.36 -3.88 5.2 3.8 -6.26 7.2 4.45 -6.52
26 4.1 2.36 0.15 5.2 3.79 2.49 7.21 2.79 3.993
27 4.1 7.44 24.2 5.2 12 -39 7.22 13 30.99
28 4.1 15.99 14.06 5.2 24.9 -22.2 7.22 25.1 25.1
29 4.1 0 0.06 5.2 0 0.1 7.23 2 1.599
30 4.1 7.21 0.13 5.2 11.6 0.28 7.23 13.6 2.281
Table 4 Results under Fault condition
Fig.16 Voltage at all buses under Fault condition
Fig.17 Active Power at all buses under Fault condition
Fig.18 Reactive Power at all buses under Fault condition
488 | P a g e
VII. CONCLUSION AND FUTURE SCOPE
In this project, the detailed model of Inter line Power Flow Controller (IPFC) with PI controller and Fuzzy
controller was implemented to the IEEE 30 bus system. IEEE 30 bus system analyzed with the IPFC for three
Different cases i.e, base load condition, 10%increase in Load condition and fault condition.From the power flow
result we conclude that the Interline power flow controller increase the power transfer capability in the IEEE 30
bus system with PI controller and Fuzzy controller. Fuzzy controller gives better results compared to PI
controller.
In this paper only IEEE 30 Bus System with PI controller and Fuzzy controller was simulated, In future change
the Bus System and Controller by ANN technology or any other advanced evolutionary algorithms and compare
the performance of IPFC with any other FACTS devices.
REFERENCES
[1] N.G. Hingorani and L.Gyugyi, “Understanding FACTS: concepts and technology of flexible AC
transmission system,” New York, NY: IEEE press, 2000.
[2] V.K. Sood, “Static synchronous series compensator model in EMTP,” ICCC Canadian Conference on
Electrical and Computer Engineering, Vol. 1, No. 3, pp. 207-211, Winnipeg, May 2002.
[3] S. Salem and V.K. Sood, “Modeling of series Voltage source converter applications with EMTP-RV,”
International Conference on power system Transient (IPST‟05), Montreal, June 19-23, 2005.
[4] L. Gyugyi, K.K. Sen, and C.D. Schauder, “The Interline power flow controller concept: a new approach to
power flow management in transmission systems,” IEEE Transactions on Power Delivery, Vol. 14, No. 3,
July 1999.
[5] S. Teerathana, A. Yokoyama, Y. Nakachi, and M. Yasumatsu, “An optimal power flow control method
of power system by interline power flow controller (IPFC),” in Proc. 7th
international Power Engineering
Conference, Singapore, pp. 1-6, 2005.
[6] X. P. Zhang, “Modeling of Interline power flow controller and the generalized unified power flow controller
in Newton power flow “, Proc. Institution Electrical Engineering, Generation, Transmission,
Distribution, Vol. 150, No. 3, pp. 268-274, May 2003.
[7] Jianhong Chen, T.T. Lie, and D.M. Vilathgamuwa,” Basic Control of Interline Power Flow Controller,”
IEEE Power Engineering society winter meeting, vol. 1, pp. 521-525, January 2002.
[8] Ali Ajami and Abdel-rahim Kami, “Modeling and Controlling of Interline Power Flow controller Based
Current-Source converter,” Second international conference on Computer and Electrical engineering 2009,
Vol. 1, pp. 353-357. January 2010.
[9] Xia Jiang, Xinghao Fang, J.H. Chow, A.A Edris,and E.Uzunovic, “Regulation and Damping Control
Design for Interline Power Flow Controllers,” IEEE Power Engineering Society General Meeting, pp. 1-8,
June 2007.
[10] S. Salem and V. K.Sood, “Simulation and Controller Design of an Interline power Flow Controller in
EMTP RV,” International Conference on Power systems Transients (IPST‟07) in Lyon, France, pp. 4-7,
489 | P a g e
July 2007.
Appendix I
RMS value of Line voltage : 500 KV
Source frequency : 50Hz
Phase angle : 9.2°
Source resistance : 1.4706Ω
Source inductance : 39mH
Appendix II
Rating of the series transformer : 100MVA
RMS value of the phase voltage : 50/50KV
Winding resistance : 0.05pu
Winding inductance : 0.05pu
Magnetizing resistance & inductance: 500Ω each
DC link capacitance : 2500μf
Appendix III
Transmission line parameter
No of phase : 3
Length of transmission line : 75Km
Resistance : R1=0.0255Ω, Ro=0.3864Ω
Inductance : X1=0.9337mH, Xo=4.1264mH
Capacitance : C1=12.74nf, Co=7.751nf
Rating of the loads
Active power : 4000MW
Reactive power : 3000MVAR (inductive)
Load voltage : 500KV
Appendix IV
Single line diagram of 30 bus system