competition in petroleum industry
TRANSCRIPT
7/31/2019 Competition in Petroleum Industry
http://slidepdf.com/reader/full/competition-in-petroleum-industry 1/56
PUBLIC ENTERPRISES, GOVERNMENT POLICYAND
IMPACT ON COMPETITION
INDIAN PETROLEUM INDUSTRY
Final Report
Prepared for the Competition Commission of India
January 2009
Indicus Analytics
New Delhi
7/31/2019 Competition in Petroleum Industry
http://slidepdf.com/reader/full/competition-in-petroleum-industry 2/56
i
Team MembersAshok DesaiLaveesh BhandariRamrao MundheMaj. General Bhupindra Yadav
Special Thanks to
Experts at the Competition Commission of IndiaPayal Malik

7/31/2019 Competition in Petroleum Industry
http://slidepdf.com/reader/full/competition-in-petroleum-industry 3/56
ii
Contents
I Introduction............................................................................................................................... 1
II Refinery Technology and Products .......................................................................................... 3
III Global Oil Industry.................................................................................................................... 5
IV Indian Oil Industry .................................................................................................................... 9
V Competition in Exploration ..................................................................................................... 14
VI Competition in user Industries................................................................................................ 18
VII Competition in Refining Industry ............................................................................................ 20
VIII Competition in Gas Industry................................................................................................... 21
IX Conclusion.............................................................................................................................. 22
Data Appendix............................................................................................................................... 25
Petroluem Statistics .............................................................................................................................. 25 A. At a Glance................................................................................................................... 25
B. Production .................................................................................................................... 27 C. Consumption................................................................................................................ 34 D. Imports ........................................................................................................................ 39 E. Exports ........................................................................................................................ 40 F. Sales and Marketshares .............................................................................................. 42 G. Prices ........................................................................................................................... 45 H. Subsidies...................................................................................................................... 51 I. Financials ..................................................................................................................... 52
7/31/2019 Competition in Petroleum Industry
http://slidepdf.com/reader/full/competition-in-petroleum-industry 4/56
1
I Introduction
This paper is about the Indian petroleum refining industry. But this industry is extremely open;trade flows are large compared to production. And there is considerable overlap between oilproduction and refining internationally, and to some extent in India. So we begin with a briefdiscussion of the international petroleum industry and its components – refining being one ofthem.
Petroleum is extracted from underground reserves; then it is cracked or “refined” into endproducts for various uses. The petroleum industry thus has two parts: an oil exploration andproduction industry upstream and a refinery industry downstream. Most oil producers also ownrefineries. But the reverse is not true; a high proportion of oil is sold to refinery companies that donot produce crude oil.
Sedimentary rocks in which hydrocarbons are trapped often hold gas, sometimes in associationwith crude oil and sometimes alone. It consists mostly of methane, which is lighter than air andtoxic. It therefore requires airtight tanks for storage and similarly leak-proof pipes or trucks fortransport, which raise its capital costs. Associated gas was flared in early years of the industry; itis still flared at remote or minor wells where the cost of its collection and transport would be high,or often reinjected into the oilfield to maintain pressure which forces oil up to the surface. But
where the quantities are large enough, natural gas is mined and traded. It is mainly used as anindustrial, domestic and vehicular fuel.
Motor vehicles run almost exclusively on petrol and high-speed diesel oil, both fuels derived frommineral oil – although they can be modified to run on certain biofuels. Vehicles are so widelydispersed that they require an extensive distribution system for these two refinery products. Asmotor vehicle use has spread across the world, it has brought along with it petrol pumps,logistics, storage and supply of fuels. There is thus a third part of the petroleum industrydownstream from refineries which distributes the products. It is owned by refineries in mostcountries. But this is not inevitable. Some countries have distribution chains that are independentof producers and refiners; and in countries which do not have refineries, distribution is undertakenby either local or foreign oil companies.
Oil has collected in pools and seeps for thousands of years. The Chinese are recorded as having
extracted oil from wells 800 feet deep through bamboo pipes in 347; they used it to evaporatebrine and make salt. American Indians used to put it to medicinal uses. Persians, Macedoniansand Egyptians used tars to waterproof ships. Babylonians used asphalt in the eighth century toconstruct the city’s walls, towers and roads. But the easily available oil was not put to any massuse because the crude itself was not a good fuel; it gave out much soot and smoke. A distillationprocess using a retort was invented by Rhazes (Muhammad ibn Zakariya Razi) in Persia in the9
thcentury; liquid heated in it vapourized, passed through a curved spout and condensed in
another container. The process could be used to make kerosene; but it was more often used tomake alcohol and essence of flowers for perfume. It was a batch process, its fuel consumptionwas high, and it was not equally efficient at distilling kerosene from all crudes.
A more efficient and reliable distillation process came out of a series of inventions after 1846. Thelast invention was the invention of oil fractionation in 1854 by Benjamin Silliman, a professor ofscience in Yale. It used a vertical column which separated components more efficiently, and
which could be used continuously.
Oil was first produced in Titusville, Pennsylvania (USA) in 1859 by one Edwin L Drake, whorefined it into kerosene, which was then used as an illuminant. Electricity did not emerge as anilluminant till the Edison Electric Light Company was founded in 1878. Well into the 20
thcentury,
kerosene, gas and electricity continued to compete as illuminants. Whilst the use of gas as anilluminant has virtually disappeared, a large population, especially in India, continues to usekerosene as illuminant.

7/31/2019 Competition in Petroleum Industry
http://slidepdf.com/reader/full/competition-in-petroleum-industry 5/56
2
The invention of the motor car by Karl Friedrich Benz in 1885 created a market for petrol, a newrefined product (petrol is called Benzin in Germany, but is not named after Karl Benz). In 1898,Rudolf Diesel invented an engine in which oil was ignited by compression; the diesel engine heinvented came to power larger vehicles, principally trucks and buses. Diesel engines used adifferent fuel, which was named diesel oil. After this, the production and use of motor vehiclesspread rapidly in the United States, especially after 1908 when Henry Ford began massmanufacture of his Model T; and petroleum and diesel oil became the most important refinedproducts, first in the US and progressively across the world.
However, only a certain proportion of crude oil can be converted into motor fuels. The demand forkerosene, the original distillate extracted from crude oil, has gone down with the spread ofelectricity. So other refined products have been developed, and non-vehicular uses developed forthem. Some of the products differ little from motor fuels; for instance, naphtha, extensively usedto make nitrogenous fertilizers and chemicals, is little different from petrol; and jet fuel is verysimilar to kerosene. Thus, refineries find markets for their products in many industries other thanmotor transport (Appendix-table C4).
The Industry in India
India imports three-quarters of the crude it refines (Appendix-table D1). It exports refineryproducts (Appendix-table E2); its net exports are roughly ten per cent of production. The
government operates an elaborate set of cross-subsidies to insulate domestic from internationalprices; such cross-subsidies have serious effects on the finances of the Indian companies(Appendix-table I2) involved, and influence competition amongst them. The oil companies, bothpublic and private, are so large a part of the economy that the cross-subsidy regime cannot besustained in all circumstances; sooner or later, the government has to bring domestic pricescloser to international prices. Hence the state of competition in the international market andinternational prices are important for the domestic market.
In Section II, which follows, we give an introduction to refinery technology, products, and themarkets they serve. In Section III, we briefly describe the global exploration, production andrefining industries. In Section IV, we describe the Indian market structure in terms of thecompanies operating in it, their products and markets. In Sections V, VI, VII and VIII, we outlinethe market structure in exploration and production, user industries, refining and gas respectively.In Section IX, we turn to the major barriers to competition and to the steps that need to be taken if
greater competition is to be introduced in the domestic market for refined products.
7/31/2019 Competition in Petroleum Industry
http://slidepdf.com/reader/full/competition-in-petroleum-industry 6/56
3
II Refinery Technology and Products
This section provides a brief overview of the technology and production process. Anunderstanding of these issues is critical as it helps understand industry structure.
Crude oil is a liquid mixture of hydrocarbons – chemical compounds consisting roughly of sixparts of carbon and one of hydrogen, both of which are fuels; it generally also carries small
quantities of sulphur, salts, metals, oxygen and nitrogen. It was formed from organic remainsaccumulated undersea and eventually trapped in sedimentary rocks; these rocks are where crudeoil exploration is concentrated. Generally the oil is compressed, and gushes out if a pipe ispushed into an oil-bearing trap. But as it is extracted, the pressure diminishes, and it is oftenartificially reinforced by injection of air or water into the reservoir to push up the oil.
Crude oil contains hydrocarbons that vary in their boiling point; refining is a process in whichcrude oil is heated in a vacuum until it evaporates and then allowed to rise up a column. Differenthydrocarbons liquefy at different temperatures and can be collected at various heights in thedistillation column.
In the basic refinery process, crude is heated to 600ºC by injection of superheated steam andpumped in at the bottom of a vertical distillation column. As the vapour rises up the column, itcools. The column has trays at various heights with holes. As the vapour cools, fractions with
different boiling points liquefy, collect in the trays and are drained off; products with high boilingpoints rise to the top, while products with low boiling points collect on lower trays. The principalproducts, with their approximate boiling points, are petroleum gas (20ºC), naphtha (40ºC), petrol(70ºC), kerosene and jet fuel (120ºC), diesel (200ºC), lubricant (300ºC), and furnace oil (370ºC);solid petroleum coke collects at the bottom after the liquid fractions are removed.
The proportions in which these products come out vary to an extent with the crude; crudes areclassified as light or heavy according to the proportion of light products. But the balance ofdemand and supply for the products is such that the prices of furnace oil are much lower thanthose of light products such as petrol, kerosene and diesel oil. In August 2008, internationalprices of residual fuel oil ranged from $2.29 to $2.48 a gallon; the corresponding range was$2.68-3.05 for petrol, $3.06-$3.29 for diesel oil, and $3.18-$3.38 for jet fuel. So othertechnologies are employed to crack, alter or recombine molecules and make lighter hydrocarbonsfrom residual fuel oil.
The principal products obtained from the primary refining and cracking processes are (seeAppendix - table B5 and C1 for product-wise production and consumption) :
Liquefied petroleum gas (LPG), mostly a combination of butane and propane. It is heavier thanair, and liquefies under pressure. It is used as a household cooking fuel, refrigerant, and vehicularfuel; 4 million vehicles are estimated to be powered by LPG in the world.
Petrol is used to fuel internal combustion engines, mainly vehicular. Its early use as a killer of liceand their eggs has completely disappeared.
Naphtha is used to make additives for high-octane petrol, and to make polymeric plastics andurea, a nitrogenous fertilizer.
Aviation turbine fuel (ATF) is the fuel used in propeller planes. It is akin to petrol.
Kerosene, also known as paraffin, is used as an illuminant and cooking fuel in India and otherpoor countries, and as a space heating fuel in industrial countries.
Jet fuel, used in jet planes, is closely akin to kerosene.
High-speed diesel oil is used in engines running at 750 revolutions per minute (rpm) or more. Itis mostly used in diesel-powered vehicles
Light diesel oil is used in diesel engines running at lower speed – mainly irrigation pumps andgeneration sets.

7/31/2019 Competition in Petroleum Industry
http://slidepdf.com/reader/full/competition-in-petroleum-industry 7/56
4
Furnace oil is made by diluting residual fuel oil from refining with middle distillates such as dieseloil. It is used in boilers, bunkers, heaters, furnaces, or as fertilizer feedstock. Low-sulphur heavystock (LSHS) is a variant of furnace oil.
Lubricating oil consists of greases and viscous oils used to lubricate moving parts in industry,automobiles, railway engines and carriages and marine engines.
Paraffin wax is used as an electrical insulator, for heat storage and in thermostats.Asphalt is a black thermoplastic product that is used to make roads and sometimes forwaterproofing. It is similar to tar, which is made from coal. Asphalt is also found in natural form; itwas used to waterproof Egyptian mummies.
Petroleum coke is mostly used as fuel, but is also used to make electrodes and dry cellbatteries.
Some petrochemicals are produced in large enough bulk to take a significant proportion ofrefinery products: the world consumed 345 million tons of hydrocarbons in 2004 to make 310million tons of petrochemicals. Most of the hydrocarbons are first turned into one of threeintermediates - ethylene, propylene and aromatics – before being converted to other products. Ofthe latter, plastics accounted for 225 million tons, and fibres for 38 million tons; solvents,detergents and synthetic rubber accounted for most of the rest.
7/31/2019 Competition in Petroleum Industry
http://slidepdf.com/reader/full/competition-in-petroleum-industry 8/56
5
III Global Oil Industry
In the early years of the industry, oil or gas seeped out of the earth in many places; elsewhere itwas discovered by accident while drilling for water. But such easy discoveries are long gone.Undiscovered oil is all underground, and oil exploration today uses considerable instrumentation
– gravimeters, magnetometers, seismic reflectors and refractors – and stratigraphy, which isessentially correlation of available geological data. The data obtained are correlated to guess thelocation of rock formations and identify those that are most likely to contain hydrocarbons. Thenrigs are used to drill into those formations. Drilling costs much more than geological tests; so oilcompanies invest heavily in geological investigation.
Oil production requires drilling a well into land or seabed. Land usually belongs to someone; if it isnot privately owned, it belongs to the government. Similarly, maritime countries claim ownershipof the continental shelves along their coastlines. If someone wants to explore for oil, he has to getpermission to drill. If he finds oil, he will normally want first right of exploitation. So it is normal forexplorers to make an agreement with the owner, called a concession, which lays down the rightsof the concessionaire and the payments he would make for them. In the early years, when oildevelopments were small, it was generally enough to get a concession from a private owner or anumber of neighbours. In the US, there were large unoccupied areas where companies could drillwithout anybody’s permission.
But as oil is came to be extracted from deeper formations, investment went up, and explorationpassed into the hands of companies which could raise capital. Also, a large area of concessionbecame necessary to avoid disputes with neighbouring concessionaires. Such large areasrequired the intervention of governments. In the early concessions, governments played the roleof landlords, and generally levied a royalty per barrel of oil extracted. For instance, the Shah ofPersia gave a concession in 1901 to William D’Arcy, a rich Englishman, to prospect for oil in mostof Iran for 60 years, for which he was promised £20,000 in cash, £20,000 in shares of the oilcompany and 16 per cent of profits. Standard Oil of California negotiated a concession with theKing of Saudi Arabia in 1933.

7/31/2019 Competition in Petroleum Industry
http://slidepdf.com/reader/full/competition-in-petroleum-industry 9/56
6
Table 1: Top twenty countries by oil consumption, 2007
GDP PPP Consn Output Exports ImportsRefiningcapacity
Reserves Energy intensityCountry
$trn2005 Million barrels per day Trillion barrels Mbd/$trn
USA 13.8 20.7 7.6 1 13.2 17 22 1.5
China 7 6.5 3.6 0.4 3.2 5.8 16 0.9
Japan 4.2 5.6 0.1 0.1 5.4 4.5 1.3
Germany 2.8 2.7 0.2 2.1 2.3 1.0
Russia 2.1 2.5 9.4 7 0.1 5.4 74 1.2
India 3.1 2.3 0.8 0.4 2.1 2.5 6 0.7
Canada 1.2 2.1 3.1 1.6 1 2 179 1.8
South Korea 1.2 2.1 0.6 2.3 2.6 1.8
Brazil 1.8 2 1.6 0.3 0.4 1.9 12 1.1
France 2 2 0.7 0.5 1.9 2 1.0
Mexico 1.3 1.9 3.4 1.8 0.2 1.5 12 1.5
Italy 1.8 1.8 0.1 0.5 2.2 2.3 1.0
Saudi Arabia 0.6 1.8 9.5 7.9 2.1 263 3.0
United Kingdom 2.1 1.8 2.1 1.5 1.1 1.8 5 0.9
Spain 1.4 1.6 0.3 0.1 1.6 1.4 1.1
Iran 0.8 1.5 4 2.5 1.6 133 1.9Indonesia 0.8 1.2 1.1 0.5 0.4 1.1 5 1.5
Netherlands 0.6 0.9 0.1 1.4 2.3 1.2 1.5
Thailand 0.5 0.9 0.2 0.9 1.8
Australia 0.7 0.9 0.5 0.1 0.5 0.7 1.3
The rest 15.4 19.4 32.1 20.3 7.7 8.3 1.3
World 65.2 82.2 80.5 48.5 47.7 68.9 1.3
Std deviation/Mean 1.32 1.42 1.80 1.89 1.23 1.12 1.33 0.36Sources: Oil: NationMaster.com. GDP PPP: World Bank
These concession agreements gave a relatively small share of the profits to the governments ofoil-producing countries. But over the years, they either took shares in the concessionairecompanies or nationalized them. By 2007, 77 per cent of oil production was in governments’hands; their share of reserves would be even higher, since the industries of countries with thelargest reserves are all nationalized.
Table 1 gives production, consumption, trade and reserves of the top 20 consumers of oil. Thefigures are not entirely accurate, but they are good enough for the broad conclusions we seek.The 20 countries account for three-quarters of global consumption; the remaining 186 countriesaccount for only a quarter. The US accounts for a quarter and the next five countries for the nextquarter.
These twenty countries also account for three-quarters of the world’s GDP (at purchasing powerparity; that is, calculated at the same prices for all countries). It would thus seem that income is amajor determinant of oil consumption. It is, but oil intensity is equally important. The last columnshows oil consumption per unit of GDP. It tends to be high in oil-producing countries, especially ifthey have extreme climates like Saudi Arabia, Iran and Canada. It is low in developing countrieslike India and China. Amongst industrial countries, some like Britain, France and Germany have
brought down oil intensity considerably. Many countries tried to increase energy efficiency afterthe first oil crisis of 1973; some did so more effectively than others.
The top 20 countries produce three-fifths of the world’s oil. This is because the biggestconsumers include most of the biggest producers – Saudi Arabia, Russia, the US, Canada,Mexico, Iran and Indonesia: oil producers tend to consume relatively more oil. Naturally, they areoil exporters as well. That is why the top 20 consumers account for three-fifths of the world’s oilexports.

7/31/2019 Competition in Petroleum Industry
http://slidepdf.com/reader/full/competition-in-petroleum-industry 10/56
7
But being the largest consumers, they account for five-sixths of the world’s oil imports. And theyaccount for seven-eighths of the world’s refining capacity. Oil refineries are more often sited closeto consumption centres; so consuming countries have a larger share of refining capacity than ofoil production. The ratio of standard deviation to mean confirms these conclusions. Productionand exports vary most across the 20 countries. Consumption varies much less, and variability ofimports is even less; the variability of both is comparable to the variability of GDP at purchasingpower parity. Refining capacity has the least variability, and is most evenly spread across thecountries. (Variability of reserves is also low; but this is because nine of the 20 countries havereserves close to zero.)
Table 2: Top twenty countries by natural gas consumption, 2006
World Natural Gas Production, Most Recent Annual Estimates, 2006 (Trillion cubic feet)
Country Output Wasted Reinjected Marketed Dry gas Imports Exports Consn
United States 23.5 0.1 3.3 19.4 18.5 4.2 0.7 21.7
Russia 23.2 0.0 0.0 23.2 23.2 1.8 8.4 16.6
Iran 6.0 0.4 1.1 4.4 3.8 0.2 0.2 3.8
Germany 0.7 0.0 0.0 0.7 0.7 3.3 0.4 3.5
Canada 7.8 0.1 0.5 7.2 6.5 0.3 3.6 3.3
Japan 0.2 0.0 0.0 0.2 0.2 3.1 0.0 3.2
United Kingdom 3.0 0.1 0.0 3.0 2.8 0.7 0.4 3.2Italy 0.4 0.0 0.0 0.4 0.4 2.7 0.0 3.0
Saudi Arabia 3.0 0.0 0.0 3.0 2.6 0.0 0.0 2.6
Ukraine 0.7 0.0 0.0 0.7 0.7 1.9 0.0 2.6
Mexico 1.8 0.1 0.0 1.7 1.7 0.4 0.0 2.2
China 2.1 0.0 0.0 2.1 2.1 0.0 0.1 2.0
Uzbekistan 2.2 0.0 0.0 2.2 2.2 0.0 0.4 1.8
France 0.1 0.0 0.0 0.1 0.0 1.8 0.0 1.8
Netherlands 2.7 0.0 0.0 2.7 2.7 0.9 1.9 1.7
UAE 2.6 0.0 0.6 1.9 1.7 0.0 0.3 1.5
Argentina 1.8 0.0 0.0 1.8 1.6 0.1 0.2 1.5
India 1.1 0.0 0.0 1.1 1.1 0.3 0.0 1.4
Thailand 0.9 0.0 0.0 0.9 0.9 0.3 0.0 1.2
Spain 0.0 0.0 0.0 0.0 0.0 1.2 0.0 1.2
All others 44.0 2.5 8.7 32.8 30.5 9.3 14.9 24.8
World Total 127.8 3.4 14.3 109.3 104.0 32.6 31.6 104.4
Source: US Energy Information Administration
Table 2 summarizes production, consumption and trade in natural gas for 2006. Incidentally, abarrel of oil has the energy equivalent of 6000 cubic feet of gas; so the 2006 global gasconsumption of 104.4 trillion cft of gas comes is equivalent to 47.7 million barrels per day of oil – more than half the oil consumption given in Table 1. As will be seen, 2.7 per cent of the gas wasflared or vented, and 11.1 per cent was reinjected into oilfields. The remaining 109.3 tcftcontained other gases besides methane, liquid hydrocarbons and water; its methane equivalentwas 104 tcft. Gas production and consumption show similar concentration to oil. One majordifference is that Russia is the foremost producer, consumer and exporter of gas. West Europeancountries are large importers; they import gas from Norway and the Netherlands, which extract
North Sea gas offshore, as well as from Russia.
World gas reserves on 1 January 2005 were 180 trillion cubic meters or 6300 trillion cubic feet; 70trcm or 39 per cent of them were offshore. Two-thirds of them belonged to three countries – Russia (26 per cent), Iran (15 per cent) and Qatar (14 per cent). Apart from natural gas, there areestimated to be 100-260 trcm of coal-bed methane, 402-442 trcm of tight gas (gas trapped in
7/31/2019 Competition in Petroleum Industry
http://slidepdf.com/reader/full/competition-in-petroleum-industry 11/56
8
dense sands), 42-45 trcm of shale gas and 13,000-24,000 trcm of hydrates (methane trapped infrozen water molecules)
1.
These, in brief, are the production and market structures with which the Indian oil industry isnecessarily connected because of its dependence on imports of crude as well as refinedproducts. Oil production is extremely unequally distributed. Oil importing countries have to get oilfrom producers since the international wholesale market is not large enough to supply large
consumers. Oil production is extremely unequally distributed, and oil exports even more so. Theonly countries with sizeable surpluses of oil are those in the Middle East – Saudi Arabia, Iran,Kuwait, Bahrain, and when its oil production facilities are restored, Iraq – and Russia. North SeaOil, extracted by Norway, Britain and Netherlands, is mostly consumed within Western Europe;and Canadian and Mexican oil goes to the US.
There is no single market in oil. There are three types of oil distribution arrangements.First, there are oil markets in the US and Western Europe where common crudes of thoseregions are traded. Here the pricing is competitive, although some of the suppliers’ market shareis large. Next, considerable quantities of oil are sold through contracts of varying lengths. Priceswould normally not vary in the life of these contracts, but they would in the long run take marketprices as the benchmark. Many contracts provide for revision of prices depending on a change ininternational market conditions. Finally, a certain proportion of oil is allocated by governments atprices of their choice; these prices may or may not be aligned to international market prices.
India, like all big oil consumers, has enough refining capacity (Appendix-table B4). But since theoutput pattern of refineries seldom matches domestic consumption patterns, there have to besome exports and imports of refined products. As will be explained later, policy-induceddistortions force export of some refined products for which there is a market in India – even somethat are imported (Appendix- tables D2 & E2). And India has the choice of importing refinedproducts instead of crude. So there are both imports and exports of refined products.
1Armelle Saniere (2006): Gas reserves, discoveries and production. Panorama 2006. Institut Francaise du
Petrole, Reuil-Malmaison, France. www.ifp.com/content/download/56056/1266306/version/3/file/IFP- Panorama06_05- Reserves DecouvProd-VA.pdf
7/31/2019 Competition in Petroleum Industry
http://slidepdf.com/reader/full/competition-in-petroleum-industry 12/56
9
IV Indian Oil Industry
As in the US, China and Iran, oil seeped out of the soil in India as well; British travelers in Assamreported such pools from 1825 onwards. Once fractionation technology was proved in the US,industrial refining of oil became feasible. Assam Railways & Trading Company Limited wasregistered in London in 1881 to exploit Assam’s natural resources. It struck oil in exploitablevolume near Digboi in 1889; at that point it transferred its oil interests to a separate company,Assam Oil Company. AOC built a refinery in Digboi in 1901. AOC was taken over in 1917 byBurmah Oil Company, which later became Burmah Shell and then Shell. Expanded andmodernized a number of times, the Digboi refinery continues to function till today.
In 1938, AOC took a prospecting licence for 6,290 square miles in Assam. it ceded theconcession after the War started in 1939, and resumed it in 1947. AOC struck oil in Naharkotia in1953. By that time, however, the government of India had become paranoid about foreignownership of business; there was a long standoff between it and AOC over the exploitation of thenew oilfield. Finally in 1959, AOC and the government set up Oil India Limited, a 67:33 jointventure, to exploit the Naharkotiya oilfield; in 1961 it became a 50:50 joint venture.
Apart from the small refinery in Digboi, India did not produce refinery products when it becameindependent in 1947; it depended almost entirely on imports, mostly from Anglo-Iranian Oil
Company’s refinery in Abadan. Three companies sold the products through their distributionnetworks – Burmah Shell, Standard Vacuum and Caltex (now merged into Shell, Exxon andChevron respectively). Burmah Shell was the largest, with an almost 50 per cent share of themarket.
In December 1953, the Indian government entered a 25:75 joint venture with Standard Vacuumfor survey of 10,000 square miles in West Bengal. The company did some gravimetric andseismic surveys, and drilled seven holes. It found some gas in some which it considered non-commercial; it did not find any oil. The general impression was that Standard Vacuum put littleeffort into prospecting in West Bengal. This could have been due to the incentive structure.Standard Vacuum had access to cheap crude from the Gulf; if it found oil in India, the governmentwould force it to exploit it. Its cost was likely to be higher, and the company would either haveearned lower profit margins or the government would have had to protect domestic refining;Standard Vacuum would have had to negotiate the level of protection.
The negotiations between Standard Vacuum and the government on the refinery threw up a largenumber of issues, many of which are relevant to the policy context today.
2The following are
important.
1. The company wanted a guarantee against nationalization for 30 years, later reducedto 25.
2. It wanted freedom to import crude. The implication was that it did not want to beforced to use domestic oil or oil that the government negotiated access to.
3. It wanted freedom to distribute its refinery products. It wanted to use its owndistribution network to sell the products, and did not want to be forced to distributethrough other networks, government’s or otherwise. Price fixing is anterior todistribution; the company also did not want price control. It would price its refined
products at landed cost of imports (including duty). Import parity would be withMexican oil and products, not Middle Eastern. Import parity was understood to placea ceiling on prices.
2 A detailed if rather partisan summary of the negotiations between the government and the oil companies –
principally Standard Vacuum – is given in H N Kaul , K D Malviya and the Evolution of Indian Oil, Allied
Publishers, Delhi.
7/31/2019 Competition in Petroleum Industry
http://slidepdf.com/reader/full/competition-in-petroleum-industry 13/56
10
4. It wanted free access to foreign exchange for all practical purposes – crude, freight,equipment, services, dividend remittance, including crude and services bought fromits foreign operations – to be valued at international prices.
5. It wanted no import duty to be charged on crude and on equipment not produced inIndia. There was an import duty on diesel oil; wharfage rates too were such as to givesome protection. The company wanted that these levels of protection would not be
reduced. It wanted an import duty on petrol equal to the excise duty plus 12 Paiseper imperial gallon. Import duties applicable to the company should be no lower thanthose applicable to its competitors.
6. The tankers that brought in crude should be allowed to be used for coastaldistribution of refinery products.
7. There should be no restrictions on local borrowings for equipment, construction andinventories.
8. Its capital investment would be given 10 per cent straight-line depreciation in thecalculation of income tax.
9. The company wanted exemption of the Industrial Development and Regulation Act of1951, which gave the government the authority to control industrial production,
expansion and diversification. The government agreed; but Shell and Caltex did notget this assurance.
The government also wanted a number of things.
1. It wanted Standard Vacuum to set up a local subsidiary to build and run the refiner.Standard Vacuum was against it for three reasons: (1) The subsidiary would be subject toincome tax; (2) it would have to pay sales tax on whatever refined products it sold to thedistribution company; and (3) if the government placed controls on dividend payments,the subsidiary would be subjected to them. But eventually it did agree to set up asubsidiary. The government wanted the local subsidiary to issue shares to localshareholders; it issued a quarter of its capital of $6 million to them in preference shares.The other two companies issued non-voting shares to local shareholders.
2. Should India discover oil, the government wanted the Company to promise to use it in
preference to imports. The company agreed; price was unspecified.
3. The government reserved the right to impose and vary excise duties, but promised tomaintain the existing differentials between excise and import duties. In other words, if itimposed or increased an excise duty, it would increase import duty by at least that much.
4. The government wanted the company to train and employ Indians.
5. The government had agreed at independence to continue pooling dollars with theCommonwealth; at the same time, the British government owed it a large debt, termedsterling reserves, for supplies during the War. So it wanted Standard Vacuum to buycrude and other importables from the Sterling Area as far as possible. The companyagreed, since AIOC, the company that produced oil in Iran and Kuwait, was British andwould accept Pounds.
6. In the event of the government acquiring tankers, it wanted the company to use them inpreference to other tankers. The company agreed, subject to the use of its own tankersand prior contractual commitments.
7. The government wanted the company to give priority to local purchases over imports; thecompany agreed.
The negotiations continued for three years, but no agreement emerged. The oil companiesprevaricated. The government suspected that the oil companies were happy with the import ofrefined products from Abadan refinery, which they sold in India at certain and high profits. Butafter Iran nationalized the Abadan refinery in May 1951, India looked a safer country to operate

7/31/2019 Competition in Petroleum Industry
http://slidepdf.com/reader/full/competition-in-petroleum-industry 14/56
11
in. In November, Standard Vacuum signed an agreement with the government to set up arefinery. Burmah Shell and Caltex followed in the next two years. Esso’s 25,000 bpd refinery wasinaugurated in Bombay in 1954, Burmah Oil Company’s 30,000 bpd refinery went onstream inBombay in 1955, and Caltex’s 10,000 bpd refinery went up in Vizagapatam in 1957.
The government was frustrated with the experience of negotiations with the three oil companies.In the 1950s, the government took a number of steps to reduce dependence on foreign oil
companies. In 1956, it set up Oil and Natural Gas Commission to explore for oil, and brought inSoviet and Rumanian rigs and crews to prospect for oil. The two areas chosen were the Cambayarea in Gujarat and the Jawalapuri-Janaur area in what is now Himachal Pradesh. The Sovietcrew considered Gujarat more promising, and drilled there first. The first well was spudded on 25July 1958; on 24 September it struck oil under 150 atm pressure at 7000 feet. Further exploratorydrilling led to the discovery of Ankleshwar and Kalol oilfields in 1960, and suggested that the oil-bearing strata extended offshore to what came to be known as Bombay High. Oil from this areawas the foundation of ONGC’s emergence as an oil producer. Gas too was found in and offGujarat, both associated and non-associated.
In 1984, the government separated ONGC’s gas business and gave it to a separate subsidiary,Gas Authority of India Limited (GAIL). GAIL built a pipeline from Hazira on the Gujarat coast toDelhi, and supplied gas to government-owned power stations and fertilizer plants on the way. Italso set up joint ventures with government oil companies and state governments to supply gas to
Bombay and Delhi for transport and domestic fuel, and to Andhra Pradesh for transport. In 1987 itset up Petronet, a joint venture with three other government oil companies, to import LNG fromQatar. Pricing and distribution of public sector gas are entirely decided by the government; thereis no element of market in this area.
3
The Soviet surveys had shown the oil-bearing structures of Gujarat extending into the sea in1964-67, but the Soviets did not have the technology for offshore exploration or production. In1974, a Japanese survey ship leased by ONGC discovered the prolific Bombay High offshorefield. It has been the mainstay of ONGC’s business since then.
Once oil was discovered in Gujarat, the government had to think about how to exploit it. In 1958,it set up Indian Refineries to set up refineries. In 1959, it set up Indian Oil Company to undertakedistribution. The two were later merged into Indian Oil Corporation. IOC was given a monopoly ofimports of refinery products; with that, it soon overtook the three foreign companies in distribution.
Thus the foundations of the government-owned oil industry were in place by 1961.
A 2mtpa refinery to process Gujarat crude was built with Soviet help in Koyali, Gujarat in 1966.But Gujarat crude could not meet the growing national demand. So in the 1960s, the governmenttook to building coastal refineries in joint ventures with foreign companies. The 2.5 mtpa Cochinrefinery came up in 1966 with investment from Phillips Petroleum, the 2.5 mtpa Madras refinerywent on-stream in 1969 with participation from AMOCO and National Iranian Oil Company, andthe lubricants plant of Lubrizol India came up in Bombay in 1969 with participation of Esso.
4
In 1960, US President Dwight Eisenhower introduced oil import quotas favouring Mexico andCanada and discriminating against Middle Eastern producers and Venezuela. This upset thelatter. In September 1960, Iraq, Iran, Saudi Arabia, Kuwait and Venezuela got together to“coordinate” policies and formed the Organization of Petroleum Exporting Countries. Theorganization was just a talking club for ten years. But in 1970, OPEC resolved to raise its
members’ share of oil revenue to 55 per cent, and began negotiations with oil companies to effectthe increase. There followed a spate of measures by which Middle Eastern oil producingcountries nationalized or imposed revenue shares on oil producing companies, or cancelledconcessions. Oil concessions were nationalized by Algeria in 1971, Iraq in 1972 and Kuwait in1976-77. Libya nationalized a number of oilfields held by foreign companies between 1971 and1976, and took an 85 per cent share onshore and an 81 per cent share in the oilfields of others.
3 Cf Mike Jackson (2005): Natural gas sector reform in India: case study of a hybrid market design.
Stanford Program on Energy and Sustainable Development. Working Paper 43, July.4 C S Venkataratnam and Anil Verma, Challenge of Change, Allied Publishers, Delhi 1997.

7/31/2019 Competition in Petroleum Industry
http://slidepdf.com/reader/full/competition-in-petroleum-industry 15/56
12
(Iran had nationalized the British-owned Anglo-Iranian Oil Company in March 1951.) The SaudiKing threatened Arabian American Oil Company (Aramco) with nationalization with 1950 and gota half-share in profits. He acquired a 25 per cent share in Aramco in 1973, increased it to 60 percent in 1974, and took full ownership of the company in 1980. Kuwait nationalized its oil industryin 1975, Bahrain took a majority share in its concessionaire oil company in 1980.
After the 1967 war between Israel and Palestine, Arab members of OPEC formed Organization of
Arab Petroleum Exporting Countries. Israel defeated Egypt and Syria in the Yom Kippur war in1973. Enraged, OPEC raised the price of its crude from $3 to $12 a barrel, and made it effectiveby cutting supply. After this, oil producing countries realized that they could raise their revenueby raising the price of their crude. So they started increasing prices without coordination.
While the nationalizations of the 1970s did not immediately disrupt the relationships between oilproducing countries and their licensee foreign companies, they introduced extreme uncertainty inthe companies’ business environment. Their attempts to cope with this uncertainty changed theworld oil industry in three major ways.
1. The companies began to explore for oil in more difficult environments such as the NorthSea, Gulf of Mexico, and the Caspian Sea. Exploration in these fields was moreexpensive. So smaller companies failed or were bought up; the industry got moreconcentrated.
2. The governments of the US and Britain did not control oil produced in their jurisdictionsin the way the Middle Eastern oil producers did. So oil produced in Texas, Gulf ofMexico and the North Sea began to be traded on commodity markets. For the first time,an open market in crude emerged. Quotations for crude such as Brent
3. Till the 1970s, refineries were tailored to a single crude source, and generally produceda limited set of products. The uncertainty of crude supply led refiners to design or modifyrefineries to take a broader variety of crudes and make a greater range of products. Notall refineries did; refineries are quite durable, and many refineries remained unchanged.Many closed down. But catalytic cracking technology developed to make refining moreflexible.
5
As oil producing countries increased their share of profits and oil at the expense of foreign oilcompanies, the oil supplies they controlled went up and those of oil companies went down. In the
circumstances, the main reason for having foreign oil companies operate refineries in India – namely, their access to crude – disappeared. In 1976, India nationalized the three refineriesowned by Shell, Caltex and Esso. In 1981, the government bought out Burmah Oil’s 50 per centstake in Assam Oil Company. With the nationalizations, the entire Indian oil industry passed intogovernment hands, and came to be run as a part of the government.
In 1977, the government introduced an Administered Price Mechanism, to be operated by an OilCoordinating Committee. The ministry of petroleum fixed so-called retention prices designed togive oil producers 15 per cent and refiners 12 per cent on their net worth. And it set administeredprices at which products were sold to consumers. The difference between the revenue and duesof an oil company went its account with OCC. So overall, the price level was cost-plus; but thegovernment could cross-subsidize individual products at will.
It was the oil companies’ practice to construct their own petrol pumps and give them to dealers to
run. Under the private companies, dealerships were given to trusted associates, and theybecame a part of the companies. After nationalization, the government decided to set up a fairersystem. In 1983 it set up four Oil Selection Boards; each board had a retired judge and one othermember. An SC/ST member was added in 1993. Oil pumps made good profits with littleinvestment on the part of the dealer and at low risk. So many more people wanted pumps thancould get them, and recommendations and corruption were rampant in their allocation. In January
5 Jerome Davis, The Changing World of Oil: An Analysis of Corporate Change and Adaptation.Ashgate,
London, pp 1-10.

7/31/2019 Competition in Petroleum Industry
http://slidepdf.com/reader/full/competition-in-petroleum-industry 16/56
13
1996, a PIL led to a court enquiry, which revealed that the personal assistant of Satish Sharma,the petroleum minister, got oil companies to give pumps to relatives and friends of politicians, andcharged others money. The same scandal continued under the ensuing BJP government, andblew up in 2002; Prime Minister Vajpayee cancelled all the 3850 allotments made in the previoustwo years. There has been no public scandal since then, but that does not necessarily mean thatthe system works any better now.
7/31/2019 Competition in Petroleum Industry
http://slidepdf.com/reader/full/competition-in-petroleum-industry 17/56
14
V Competition in Exploration
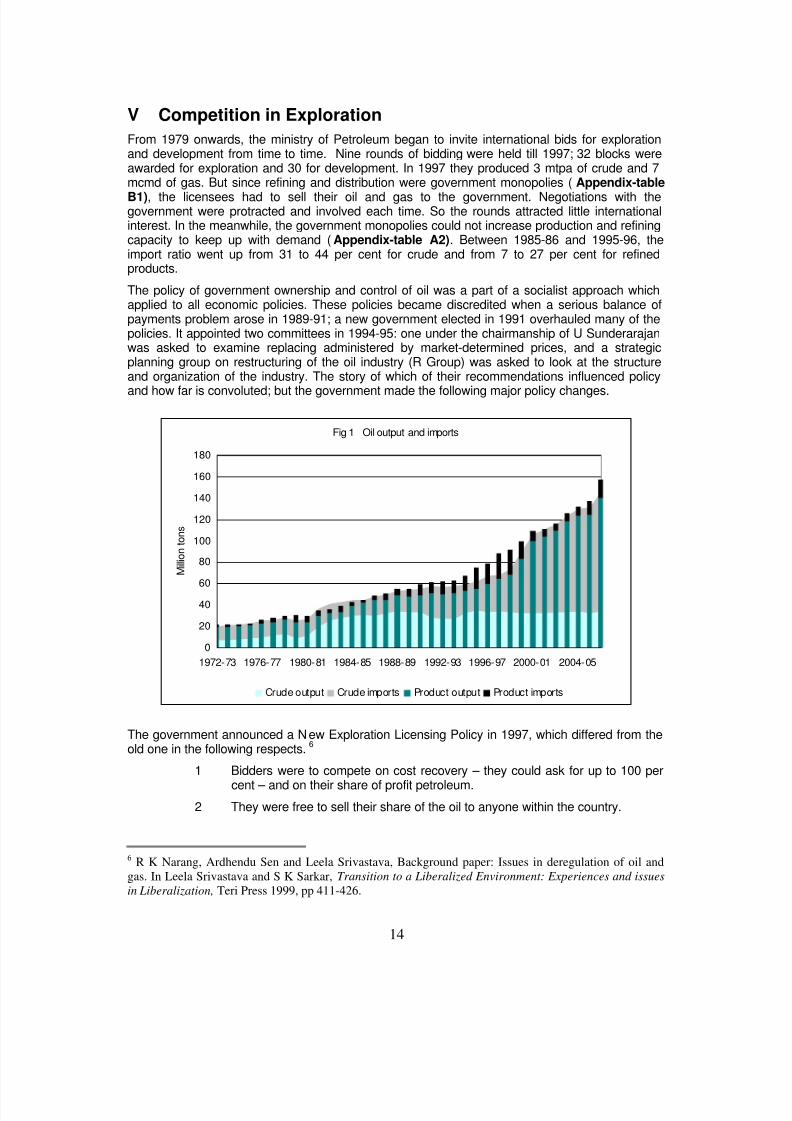
From 1979 onwards, the ministry of Petroleum began to invite international bids for explorationand development from time to time. Nine rounds of bidding were held till 1997; 32 blocks wereawarded for exploration and 30 for development. In 1997 they produced 3 mtpa of crude and 7mcmd of gas. But since refining and distribution were government monopolies (Appendix-tableB1), the licensees had to sell their oil and gas to the government. Negotiations with thegovernment were protracted and involved each time. So the rounds attracted little internationalinterest. In the meanwhile, the government monopolies could not increase production and refiningcapacity to keep up with demand (Appendix-table A2). Between 1985-86 and 1995-96, theimport ratio went up from 31 to 44 per cent for crude and from 7 to 27 per cent for refinedproducts.
The policy of government ownership and control of oil was a part of a socialist approach whichapplied to all economic policies. These policies became discredited when a serious balance ofpayments problem arose in 1989-91; a new government elected in 1991 overhauled many of thepolicies. It appointed two committees in 1994-95: one under the chairmanship of U Sunderarajanwas asked to examine replacing administered by market-determined prices, and a strategicplanning group on restructuring of the oil industry (R Group) was asked to look at the structure
and organization of the industry. The story of which of their recommendations influenced policyand how far is convoluted; but the government made the following major policy changes.
Fig 1 Oil output and imports
0
20
40
60
80
100
120
140
160
180
1972-73 1976-77 1980-81 1984-85 1988-89 1992-93 1996-97 2000-01 2004-05
M
i l l i o n t o n s
Crude output Crude imports Product output Product imports
The government announced a New Exploration Licensing Policy in 1997, which differed from theold one in the following respects.
6
1 Bidders were to compete on cost recovery – they could ask for up to 100 percent – and on their share of profit petroleum.
2 They were free to sell their share of the oil to anyone within the country.
6 R K Narang, Ardhendu Sen and Leela Srivastava, Background paper: Issues in deregulation of oil and
gas. In Leela Srivastava and S K Sarkar, Transition to a Liberalized Environment: Experiences and issues
in Liberalization, Teri Press 1999, pp 411-426.

7/31/2019 Competition in Petroleum Industry
http://slidepdf.com/reader/full/competition-in-petroleum-industry 18/56
15
3 Conditions regarding minimum expenditure, required partnership withgovernment oil companies, and signature, discovery and production bonuseswere scrapped.
4 Tax provisions were defined, and their stability promised. There would be a 7-year income tax holiday, exemption from customs duty on exploration anddrilling equipment, royalty was fixed at 10 per cent except for onshore crude
which would pay 12.5 per cent, 5 per cent royalty on discoveries in waterdeeper than 400 meters, and development expenditure could be amortizedover 10 years.
5 The licence could be assigned to third parties under conditions.
6 A Conciliation and Arbitration Act passed in 1996, based on the model set byUnited Nations Commission on International Trade Law, would apply todisputes.
7 Bidders were required to give the Directorate of Hydrocarbons, which was setup in 1993, the results of their surveys; in case they abandoned theconcession, the results would become available to subsequent bidders.
Under the New Exploration Licensing Policy, six rounds were held and 162 production-sharing
licences were given till 1 April 2007, against 28 before the introduction of NELP. Of the licences,77 per cent were offshore, and 53 per cent were to government companies. The sedimentaryarea explored went up from 50 per cent in 1995-96 to 85 per cent in 2006-07 of the total 3.14square kilometers (1.79 million onshore and up to 400 meters offshore, 1.35 million deep-waterbeyond 400 meters). Well explored area went up from 15 to 20 per cent, poorly explored areafrom 17 to 21 per cent, and area being explored from 18 to 44 per cent. These figures suggestthat many licensees were sitting on concessions because they did not see a satisfactory path toprofitable exploitation of discoveries, or were negotiating such a path.
A seventh round of NELP was opened on 1 April 2008. In July, six multinational companies(Chevron and Conoco-Philips of the US, Britain's BG (British Gas) and BP (British Petroleum),Canada's Niko and Anglo-Dutch Shell) wrote to the government to say that they would not bid ifthe regulatory framework remained uncertain and the government did not adhere to contractualarrangements. Instances of such were (1) the Enron affair, in which Maharashtra government
reneged on a contractual obligation to buy electricity at a fixed price (it was saved from litigationby Enron’s liquidation on account of fraud committed by the company in its home country, US),(2) the government’s taking away the contractual right of the owners of the Panna-Mukta fields – Reliance, British Gas and ONGC – to sell gas, and forcing them to sell it to GAIL at a price of itschoosing to GAIL (the exploration contracts embodied freedom of sale and pricing), and (3)DGH’s renegotiation of conditions embodied in the model production sharing contracts issued atthe time of announcement of earlier rounds after bidders had invested money and found oil orgas. The companies were also of the view that DGH, which was supposed to be a regulator,acted more like an arm of the government. The government did not respond to the six companies’concerns; consequently, they did not take part in the bids.
In the event, of the 57 blocks on offer, 12 received no bids, and 19 received only one bid. Of the45 winning bids, one was rejected by Cabinet Committee on Economic Affairs, resulting in 44production sharing contracts. ONGC and its associates got 20 concessions. Thus, the round
confirmed a decline in interest amongst international companies, especially experienced ones.
There is a more general disincentive to bidding in the fact that the bidders have to sell theirproduction in India, which remains a market dominated by government companies; it is thusimpossible to be sure that the concessionaire would get an internationally comparable price forhis output. This is particularly obvious in the case of Cairn Energy, which bought a block inRajasthan from Shell in 2002 and soon struck oil. The find in Barmer was far from the sea. Itcould be sold to Indian Oil Coorporation, but negotiations have not borne fruit till now. The crudeis waxy, and difficult to transport. Cairn has been drilling more exploration wells and raising itsestimate of reserves. Now it is planning to lay a heated pipeline to Salaya and export the crude.

7/31/2019 Competition in Petroleum Industry
http://slidepdf.com/reader/full/competition-in-petroleum-industry 19/56
16
Table 2: Oil and Gas Reserves on 1
stApril 2007
(Mtoe)
ONGC OIL Others Total
Oil 4603 815 629 6047
Gas 1820 290 838 2948
Oil in place 6423 1105 1467 8995
Oil 1313 243 172 1727
Gas 982 151 511 1645
Ultimate reserves 2295 394 683 3372Source: Directorate of Hydrocarbons
It is also probably true of Reliance, which first struck oil in Krishna-Godavari basin offshore, andlater gas as well. In 2006, Niko Resources whom Reliance had called in as consultant estimatedgas reserves at 1 trillion cbm. Reliance tried to sell the gas to power utilities on the south and eastcoast, but failed to reach agreement over the price. The power utilities are owned by stategovernments and make heavy losses. So their ability to pay is in doubt.
Thus, private entry was allowed in oil exploration and production in the 1980s, and private firmshave discovered substantial oil and gas resources. But none has used them to enter domesticrefining and distribution. This is because deregulation of the downstream industries has not keptpace with that of exploration.
Exploration and production costs vary enormously according to the location and depth ofhydrocarbons and the size of reserves. There is a suggestion that the absence of competitionmakes it possible for the oil concessionaires to take bribes from suppliers of equipment andservices in return of overpayments and. to overestimate investment costs. The chief safeguardagainst this possibility is The Directorate of Hydrocarbons, whose block management committeeapproves all field development plans. When it awards E&P contracts, it looks at both costs and atthe technological capacity of the applicant and his ability and willingness to save time, do athorough exploration and bring reserves into production. Besides its own expertise, itscomparison of competing bids would help it make a judgment on individual proposals. The
expertise it acquires in evaluating bids should give it capacity to supervise PSUs’ activities also. Itis authorized to hire outside experts and consultants when necessary.
A suspicion that ONGC’s costs had been padded arose in 2006. In April 2007, the allegation thatReliance Industries padded costs was made by the Communist Party of India (Marxist). ONGCpointed out that DeGolyer and McNaughton, an outside consultant, did a third-party audit of all itsprojects. Reliance got a third-party audit done by Gafney, Cline and Associates when the originaldiscoveries were made, but was asked to get a new audit done.
There are two other authorities that check the proposed costs of public enterprises. They wouldbe approved by the parent ministry. It does not have the expertise to make an informedexamination; but that does not prevent it from examining the costs. It is also within its purview totake the help of international experts. The other is the Comptroller and Auditor General. He onlymakes an ex post examination long after the costs are incurred. He reports to Parliament, whichcan make the government take action on his report. Parliament committees obtain a reply toCAG’s findings from the government, but there is no further action. Thus the safeguards withinthe government against overstatement of costs are not very effective.
What is crucial here is that there should be multiple competitors for concessions. This requiresexpertise in formulating invitations for exploration contracts. From the fact that most explorationcontracts have gone to a handful of Indian companies – mostly government, some private – it canbe inferred that there is little competition for them. The reasons are also clear: that thegovernment restricts the discoverer’s right to sell any oil or gas he finds in the world market, andthat the dominance of public sector undertakings in the domestic refining industry makes it

7/31/2019 Competition in Petroleum Industry
http://slidepdf.com/reader/full/competition-in-petroleum-industry 20/56
17
impossible for a discoverer to get a fair market price for his oil. Hence if there is padding of costs,it is due to the restraints on competition placed by the government of India.

7/31/2019 Competition in Petroleum Industry
http://slidepdf.com/reader/full/competition-in-petroleum-industry 21/56
18
VI Competition in user Industries
A major entry barrier into oil refining and gas is lack of competition in major markets for refinedproducts. Government dominance of user industries and the losses it forces them to make limittheir capacity to pay internationally comparable prices. Some of the user firms also suffer fromendemic liquidity problems on account of their poor profitability, and delay payments for
feedstock. Two such industries are important: electricity, which in other countries is an importantmarket for gas and furnace oil, and fertilizer, whose preferred feedstocks are gas and naphtha.Overstatement of costs is not very effective.
The electricity industry is dominated by electricity boards, which are essentially departments ofstate governments and have no operational freedom. The prices they charge are decided by thegovernments, and are fixed at unremunerative levels. As a result, they depend for investmentfunds on state governments, which are themselves in no great financial shape. Owing to theirunprofitability, they are often short of liquidity and delay paying suppliers of fuel. Till 2004, theyhad run up enormous debts to coal and oil companies. Then the central government forced stategovernments to settle the debts as part of more general financial strengthening. The centre hasthe power and influence to force state governments to pay. Private companies would not be ableto do so. Hence the electricity boards remain unpromising customers for gas or furnace oilproduced by private companies.
The centre tried to break this impasse by passing the Regulatory Commissions Act in 1998. Itappointed a Central Electricity Regulatory Commission and persuaded a number of states to setup then own ERCs. It also passed a new Electricity Act in 2002 which envisaged introduction ofcompetition from the private sector. Under its persuasion, a number of states corporatized theirelectricity boards and separated generation and distribution. But despite all this activity, electricitypricing practices did not change. Electricity boards continued to be financially weak and hencepoor customers for hydrocarbon products. As long as they remain unable or unwilling to pay,enterprises of the central government, in gas, oil and electricity, will have an advantage incollecting their dues from state electricity boards as against any private competitors that maycome up.
The fertilizer industry produces nitrogenous, phosphatic, compound and mixed fertilizers. Ofthese, only nitrogenous fertilizers require hydrocarbon feedstocks; the normal feedstocks are gas
and naphtha, which are first converted to ammonia and then into its compounds. Phosphatic andcomplex fertilizers were decontrolled in 1992, and nitrogenous fertilizers with low nitrogen contentin 1994. But urea, which constitutes 85 per cent of nitrogenous fertilizer consumption, remainsunder control. It is administered by the Fertilizer Industry Coordination Committee, which isconstituted entirely of central government secretaries except for two representatives of privateplants.
FICC operates a retention price scheme. It collects output and cost figures from all plants, adds12 per cent return on capital, and thereby arrives at the total realization required. It divides therealization by the nitrogen output to get nitrogen price, which is then used to derive the prices ofvarious fertilizers. The difference between the prices and the costs is given to plants as subsidyor taken away as tax. A similar exercise is done to calculate total transport costs to the farmer,which are then so distributed between plants that farm gate price of urea is the same across thecountry.
While input costs rose, the ministry of fertilizers has hesitated to raise prices. The result is that itis paying an enormous fertilizer subsidy. To keep the subsidy down, it has endeavoured to keepinput prices as low as possible. This is one reason why the government has tried to commandeergas supplies from private producers and reneged on the freedom of pricing promised to them.
The domination of the electricity and the fertilizer industries by the central and state governments,the losses they make and the consequent pressure to keep input prices low make the twoindustries unattractive as customers. This is not so material to public enterprises whose lossesare borne by the government, but their ability to bear losses gives them an advantage against

7/31/2019 Competition in Petroleum Industry
http://slidepdf.com/reader/full/competition-in-petroleum-industry 22/56
19
power plants, and discourages private investment in hydrocarbons. Unless electricity and fertilizermarkets are decontrolled, this handicap of private hydrocarbon firms cannot be removed.
7/31/2019 Competition in Petroleum Industry
http://slidepdf.com/reader/full/competition-in-petroleum-industry 23/56
20
VII Competition in Refining Industry
Refinery licences were given to the Birla group (jointly with Hindustan Petroleum Corporation, asubsidiary of IOC) in 1988, the Essar group in 1993, and Reliance Industries in 1996. The Birlas’Mangalore refinery was ready by 1999; it could not be started because HPC, whom the Birlagroup had taken in as partner for its access to market, refused to lift the products. Finally the Birla
group sold off its 37.38 per cent stake to ONGC in 2003. The first phase of the Reliance refineryin Jamnagar was ready in 1999. Although Reliance got a licence for petrol pumps in 2002, it hassold only a small proportion of its petrol and diesel output through pumps; it has exported thebulk. In 2007, it sought and got 100% EOU status. It gave Reliance duty-free access to crudeprovided it balanced its total imports and exports. The Ruias’ Vadinar refinery went onstream inNovember 2006. The delays were partly due to their legendary lack of finance; but they were alsonot in a hurry because they could not work out a feasible marketing strategy. Distribution hashandicapped growth of private refining, and hence emergence of competition.
On 1 April 2002, the government announced the abolition of the Administered Price Mechanismand of the Oil Coordination Committee which administered the price controls. It introduced directsubsidies on kerosene and LPG (Appendix-table H1), and raised taxes on petrol and domesticcrude (Appendix-table G7). The petroleum ministry issued retail distribution licences to ONGC,GAIL, OIL, Reliance Industries, Mangalore Refineries, Essar Oil and Cairn Energy. Of the
licensees, only Reliance and Essar opened a significant number of pumps (Appendix-table F3). Reliance set up pumps which were shopping centres at the same time. On the highways, theyalso offered food, accommodation and baths to truck drivers. They sold 410 kiloliters a month onthe average in 2005-06, against public sector outlets which sold 140 kilolitres. So although theyhad only 1432 outlets out of the total 30,000, their share of retail sales was close to 14 per cent(Appendix-table F1).
Then, on 27 March 2007, Reliance applied for the status of a 100% export-oriented unit; it gotthat status in February 2008. In 2007-08, its exports came to 60 per cent of its sales. On 24March 2008, Reliance announced that it was closing down all its petrol pumps. The reason wasthat the government was subsidizing petrol and diesel sold out of its companies’ pumps, but didnot give the subsidies to private competitors. So retail sales were no longer profitable forReliance. Essar did not take a public decision to close down pumps; it simply stopped regularsupplies to its pumps. As Table 3 shows, its sales in 2007-08 were insignificant relatively to themarket. Thus as from May 2008, retail sales of petrol and diesel oil are a government monopoly(Appendix- table F2); there is no competition.
One consequence of this lack of competition was the recurring shortage of diesel oil in TamilNadu between May and August 2008, when Reliance was exporting it at the same time. Reliancehad no petrol pumps any more, so it could not have supplied the market. It could have sold dieselto public sector oil companies, but then it would have breached the conditions of its EOU status.The EOU category, introduced into the trade policy in the 1960s, has outlived its usefulness.While it is reasonable to exempt exports from domestic taxes, there is no reason to make thatexemption conditional on minimum exports. It is not certain whether the segregation of exportersand domestic producers was useful when it was tried first; it has outlived its usefulness, and inthe Tamil Nadu diesel crisis it proved counterproductive.

7/31/2019 Competition in Petroleum Industry
http://slidepdf.com/reader/full/competition-in-petroleum-industry 24/56
21
VIII Competition in Gas Industry
Automotive fuels have to be reached to vehicle owners; hence oil refining companies cannot dowithout access to a marketing network. Gas, however, requires an expensive transport network inthe form of pipelines; hence gas producers prefer to sell to as few consumers as possible, andprefer large buyers. Where gas has been available beyond industrial needs, it has been piped tohouseholds; but such domestic networks have been confined to cities. Unless pipelines ofdifferent suppliers get interconnected, there is no competition between them; each has amonopoly of supply to the customers connected to its pipeline. There is only one common carrierpipeline network in India. It has been built by Gujarat State Petroleum Corporation through twosubsidiaries – Gujarat State Petronet, whose pipelines connect the cities of Gujarat, and GujaratGas, which lays retail connections within the cities.
It transports supplies from three sources to Bombay and cities of Gujarat: liquefied natural gasfrom Qatar that Petronet brings into Dahej, gas supplies from Gujarat Gas, a British Gassubsidiary, which in turn buys gas from ONGC and sells it across Gujarat, and GAIL’s sales inGujarat.
GAIL was incorporated in 1984 to evacuate associated gas from ONGC’s Gujarat oilfields. Itsmost important gas pipeline is the Hazira-Vijaypur-Jagdishpur pipeline of GAIL which carries
ONGC’s gas output from Gujarat to a series of power and fertilizer plants from the Gujarat coastto Punjab. As its gas supply ran short, it also started taking Petronet’s gas imports from Qatar.
Assam Gas Company, which is owned by the government of Assam, supplies gas to a fertilizerplant, a petrochemical plant, four power stations, 250 tea gardens, 400 industrial establishmentsand 20,000 domestic consumers.
Reliance, which found considerable gas offshore in the Krishna-Godavari field starting in 2003,has not laid pipelines to evacuate the gas because it has not yet finalized customers. As shown inChapter VI above, the two industries that are major potential customers, electricity and fertilizers,are owned by the central and state governments. Most of the enterprises in them make losseswhich are financed by governments; it would be impossible for new private plants to compete withthese plants. Since these markets are closed, the only feasible option for Reliance is to sell itsoutput to GAIL at whatever price it can get, and let the government distribute it to plants of its
choice.

7/31/2019 Competition in Petroleum Industry
http://slidepdf.com/reader/full/competition-in-petroleum-industry 25/56
22
IX Conclusion
In 2007-08, India’s five largest companies in terms of sales were oil companies. Four out of fivewere owned by the government. The sales of the sixth – Essar Oil – were negligible. Reliance’sshare of sales was 17 per cent of all the oil companies’ sales, but 60 per cent of its output wasexported. So it does not require much analysis to conclude that the Indian oil industry is anoligopoly, and that it is dominated by government firms (Appendix-table F1). The retail marketfor petrol and diesel is almost entirely a government monopoly. This monopoly also affectsexploration and production, for as we have seen, a number of companies that have struck oil orgas cannot find a domestic market because of the government’s monopoly of distribution. Howcan this situation be changed, and competition be introduced?
Table 3: India's oil companies' revenues, 2007-08
Company Rs billion Per cent
Indian Oil Corporation 2015 34.7
Reliance Industries 1112 19.2
Bharat Petroleum 972 16.8
Hindustan Petroleum 939 16.2
Oil and Natural Gas Corporation 755 13Essar Oil 6 0.1Total 5799 100
Source: Company annual accounts.
The domestic market is close to a monopoly. All hydrocarbon products are tradeable, althoughtheir transport costs vary greatly – highest for gas, lower for crude, and the more valuable arefined product, the lower proportionally are transport costs. So the most expeditious way ofintroducing competition is freeing imports. There cannot be competition in exploration andproduction if refining and distribution are concentrated; and there cannot be competition inrefining unless crude is freely importable. Hence the first condition for a more competitive marketis absence of restrictions on foreign trade.
The next condition is tax parity of imports and domestic production. This means that whatever
domestic taxes are levied should be applicable to imports as well. Import duties may be levied;but unless there is a reason to protect exploration and production beyond the size to which theywould grow without protection, crude imports should be duty-free, so that there is maximumincentive to invest in refining. There will inevitably be taxation of refined products, since some ofthem are considered inputs into luxuries (e g, aviation fuel and petrol), and are in fact sources ofprolific revenue. Duties on domestic production must be matched by equal import duties, so thatthere is no discrimination in favour of exports.
Under competitive conditions, refining adds little value to crude. The tonnage of refined productscomes to 90-95 per cent of the crude input; and the throughput of a refinery is so high incomparison to its capital costs that a low average profit margin gives a high rate of return. In2007-08, a profit margin before tax of 16.7 per cent translated into a return on assets of 15.5 percent for Reliance; for IOC, a margin of 3.9 per cent translated into a return on assets of 12.3 percent. IOC was forced by the government to give huge subsidies on sales of petrol, diesel and
kerosene (Appendix-table H1); on the other hand, its refineries are older and their historical costper ton is lower. But even for a highly sophisticated refinery like that of Reliance, the capital-output ratio is close to one; for simpler refineries it would be much lower, and the return on capitalwould be higher than the margin. Typically, a refinery’s margin might be 10 per cent, and crudemight account for 80-90 per cent of its costs. Since some refinery products are consideredluxuries and others necessities, taxes on them will be different; and the average tax on refinedproduct will be high. In the circumstances, the tax system can be simplified and competition inrefining intensified by not taxing crude at all, and concentrating all taxation on refined products.

7/31/2019 Competition in Petroleum Industry
http://slidepdf.com/reader/full/competition-in-petroleum-industry 26/56
23
Finally, we come to entry restrictions. Here, the answer is different for exploration and production,and for refining. We shall deal first with exploration and production, but it should be borne in mindthat the attractiveness of exploration is closely dependent on the ease of entry in refining anddistribution.
It is difficult to conceive of completely free entry into exploration because it involves access toland which has to be approved and sometimes organized by the government. So some form of
exploration licensing is unavoidable. The high proportion of concessions granted to ONGC wouldsuggest otherwise, but there is no overt discrimination against foreign companies or exclusion ofany companies other than on such self-evident criteria as minimum experience and minimuminvestment. The government’s insistence that discovered oil and gas must be used in India – itsimplicit export ban – reduces the potential value of finds and probably leads to fewer bids andlower revenue for the government; now that the balance of payments is no longer a policyproblem, this domestic use requirement is outdated. We have argued above for duty-free importsof crude. In those circumstances, an export ban or insistence on domestic use makes even lesssense.
So the only important variable in exploration and production would be taxation of production(exploration can obviously not be taxed). The customary form of taxation here is that thegovernment tax a share of the oil produced – what is called profit oil. If profit oil is zero, theproducing company takes all the oil that is produced, and the government gets nothing. The
government must be very desperate to produce oil domestically before it takes zero profit oil. Thisis not the situation in India.
At the other extreme, profit oil can be 100 per cent. No oil company would agree to this unless thegovernment paid all costs plus some profit. So this case really comes to the governmentexploring oil. Exploration does not necessarily imply production; a government may exploresimply to get better knowledge of the country’s oil resources. The knowledge would reduce therisk in production, and would get the government better terms when it does decide to produce. Atpresent, the government gives companies exploration licences with the condition that the data theconcessionaires collect in the course of exploration must be given to the government; they aredeposited with Directorate of Hydrocarbons. Given the fact that there is no urgency to produce, itwould be a good idea to separate exploration and production; the government should investsimply in exploration and data collection. When it decides on production, it will then have readydata to sell to potential bidders; it will get more bids, and better terms.
So much for exploration. However, it is refining and distribution that require reforms to introducecompetition. There is one precondition that is already satisfied and is therefore likely to beignored: that product standards should be defined and enforced. Oil products are extremelydifferentiated; different uses require different specifications, some require tight specifications, andnon-standardized products can be dangerous in some uses such as aviation. So standards haveto be defined and enforced by the government.
Such standards will be correlated with the earlier-mentioned commodity taxes. In India, theextreme variation in tax rates creates powerful incentives to pass off a highly taxed product as aless taxed one, and more often, to adulterate products; for instance, it is common to mix divertsubsidized kerosene and mix it with high-speed diesel oil. The solution adopted has been to put adye in subsidized kerosene. That is an ineffective remedy, for the dye does not make keroseneless eligible for adulteration. The correct solution would be to have the same tax on close
substitutes, and to subsidize the people intended directly.
There is one other condition that would need to be modified. When allowing private entry, thegovernment has insisted that new entrants must set up a minimum proportion of pumps in‘backward’ or ‘rural’ areas. Ideally, there should be no such condition; if the government wantsmore petrol pumps in certain areas, it must give them subsidies until they reach a certainminimum turnover. The government has a service tax; it can be applied to petrol pumps, and acut-off point may be set below which there would be no tax.

7/31/2019 Competition in Petroleum Industry
http://slidepdf.com/reader/full/competition-in-petroleum-industry 27/56
24
It is possible to introduce competition in distribution alone, without any changes in refining. Thefirst condition for it would be to abolish licensing of pumps. There is no argument for licensingexcept that captive pumps of oil companies have existed ever since they started selling petrol;there is a strong argument against licensing in India, that it creates rampant corruption, whichreaches right up to the minister.
Second, there should be free imports of products. There should be no canalization of product
imports, and no quantitative restrictions. But distribution requires considerable investment instorage, logistics and petrol pumps. If competition is not introduced in refining, the onlycompetition can come from imports; it will not emerge unless new entrants are assured ofcontinued access to imports for a long period. To ensure a level playing field, domestic tax ratesand import duties should be identical, so that the tax burden is the same irrespective of the originof supplies.
This is an argument that applies to all the policy changes suggested here, and not just to taxation.The oil production and distribution chain requires large capital investments whose life runs intodecades. If the benefits of competition are to be reaped, the policy regime must be stable fordecades, and must in advance be known to be stable. If the government is serious aboutcompetition, it must accept and announce self-restraint on its freedom to make and changepolicies.
Finally, transportation affects competition in an important way. For all hydrocarbons, pipelines arethe cheapest medium of transport. Differentiation of refined products makes dedicated pipelinesfor them expensive, but even amongst them, petrol and diesel are consumed in large enoughquantities to make piping economical. Currently, all pipelines in India are owned by gas or oilcompanies, and thus insulate them from competition. If all the pipelines were common carriersand carried oil, gas or products for all customers without discrimination at preannounced prices,refineries and gas-based plants would spread out more evenly across the country, and therewould be greater competition amongst them. The case is similar to that of electricity, in whichthere cannot be competition for the final market unless a transmitter and distributor providesaccess from every generator to every consumer. One solution that was tried out was to decreethat all companies that had pipelines would allocate a certain proportion of pipeline capacity forcommon carriage. As far as we know, this regulation was a dead letter from the start; there hasbeen no common carriage in India. The best solution now would be to nationalize all existingpipelines and give them to a new company to run as a public utility on a cost-plus basis. The nextbest solution would be to give all the pipelines of state-owned companies to a common carrier. Ingas in particular, competition cannot emerge in the absence of a common carrier.
The conclusions we have reached have implications for the Competition Commission. The oilindustry has a regulator of sorts in Directorate General of Hydrocarbons. It provides expertise thatthe ministry lacks and buys such expertise as it does not have (or makes oil companies buy it).But it confines itself to technological issues and avoids the economic issues discussed above;and on policy it keeps close to the government and does not choose to take an independent view.This is where a role for the Competition Commission is inescapable. It is for the CompetitionCommission to decide at what level to frame its interventions. Quite a few of governmentobstructions to competition that are found in the oil industry are present in other industries aswell; the Competition Commission would have to take a view on whether to take an industry-specific approach or to take up more general issues of policy. Either way, there is a role that only
the Competition Commission can play.
***
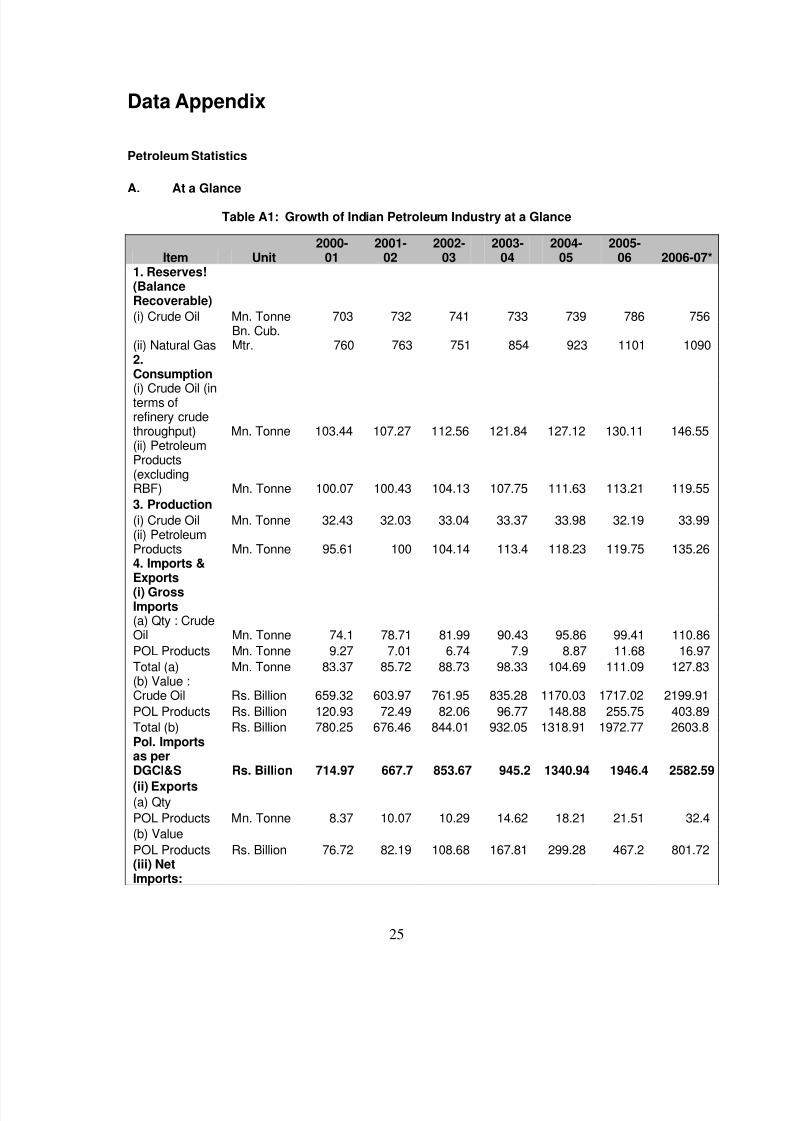
7/31/2019 Competition in Petroleum Industry
http://slidepdf.com/reader/full/competition-in-petroleum-industry 28/56
25
Data Appendix
Petroleum Statistics
A. At a Glance
Table A1: Growth of Indian Petroleum Industry at a Glance
Item Unit2000-
012001-
022002-
032003-
042004-
052005-
06 2006-07*1. Reserves!(BalanceRecoverable)
(i) Crude Oil Mn. Tonne 703 732 741 733 739 786 756
(ii) Natural GasBn. Cub.Mtr. 760 763 751 854 923 1101 1090
2.
Consumption(i) Crude Oil (interms ofrefinery crudethroughput) Mn. Tonne 103.44 107.27 112.56 121.84 127.12 130.11 146.55(ii) PetroleumProducts(excludingRBF) Mn. Tonne 100.07 100.43 104.13 107.75 111.63 113.21 119.55
3. Production
(i) Crude Oil Mn. Tonne 32.43 32.03 33.04 33.37 33.98 32.19 33.99(ii) PetroleumProducts Mn. Tonne 95.61 100 104.14 113.4 118.23 119.75 135.264. Imports &Exports(i) GrossImports(a) Qty : CrudeOil Mn. Tonne 74.1 78.71 81.99 90.43 95.86 99.41 110.86
POL Products Mn. Tonne 9.27 7.01 6.74 7.9 8.87 11.68 16.97
Total (a) Mn. Tonne 83.37 85.72 88.73 98.33 104.69 111.09 127.83(b) Value :Crude Oil Rs. Billion 659.32 603.97 761.95 835.28 1170.03 1717.02 2199.91
POL Products Rs. Billion 120.93 72.49 82.06 96.77 148.88 255.75 403.89
Total (b) Rs. Billion 780.25 676.46 844.01 932.05 1318.91 1972.77 2603.8Pol. Imports
as perDGCI&S Rs. Billion 714.97 667.7 853.67 945.2 1340.94 1946.4 2582.59
(ii) Exports
(a) Qty
POL Products Mn. Tonne 8.37 10.07 10.29 14.62 18.21 21.51 32.4
(b) Value
POL Products Rs. Billion 76.72 82.19 108.68 167.81 299.28 467.2 801.72(iii) NetImports:

7/31/2019 Competition in Petroleum Industry
http://slidepdf.com/reader/full/competition-in-petroleum-industry 29/56
26
(a) Qty : CrudeOil Mn. Tonne 74.1 78.71 81.99 90.43 95.86 99.41 110.86
POL Products Mn. Tonne 0.9 -3.06 -3.55 -6.72 -9.83 -9.83 -15.43
Total (a) Mn. Tonne 75 75.65 78.44 83.71 86.48 89.58 95.43(b) Value :Crude Oil Rs. Billion 659.32 603.97 761.95 835.28 1170.03 1717.02 2199.91
POL Products Rs. Billion 44.21 -9.7 -26.62 -71.04 -150.4 -211.45 -397.83Total (b) Rs. Billion 703.53 594.27 735.33 764.24 1019.63 1505.57 1802.8(iv) Unit Valueof Crude OilImports(Gross) Rs./MT 8898 7673 9293 9237 12206 17272 198445. India'sTotal Exports Rs. Billion 2035.71 2090.18 2551.37 2933.67 3618.79 4564.18 5716.426. Pol.Imports as %of India'sTotal Exports(i) Gross
Imports % 38.3 32.4 33.1 31.8 36.4 43.2 45.5(ii) Net Imports % 34.6 28.4 28.8 26.1 28.2 33 31.57.Contributionof Oil SectortoCentre/StateResources(i) Royalty fromCrude Oil Rs. Billion 22.72 24.86 30.67 31.74 42.71 50.6 N.A.(ii) Royaltyfrom Gas Rs. Billion 6.08 6.59 7.78 8.54 8.29 9.81 N.A.(iii) OilDevelopmentCess Rs. Billion 27.28 28.78 50.91 51.43 52.48 50.07 70.34(iv) Excise &Custom Duties Rs. Billion 359.12 361.04 451.27 507.33 563.95 631.43 718.93
(v) Sales Tax Rs. Billion 233.75 200.9 297.41 328.49 390 N.A. N.A.
(vi) Dividend Rs. Billion 34.82 32.87 67.94 63.1 94.36 N.A. N.A.8. Natural Gas:(i) GrossProduction
Bn. Cub.Mtr. 29.477 29.714 31.389 31.962 31.763 32.202 31.747
(ii) UtilisationBn. Cub.Mtr. 27.86 28.037 29.963 30.906 30.775 31.325 30.791
Abbr: NA : Not Available.Note : * : Provisional.
! : As on 1st April of Initial year.Source: Ministry of Petroleum and Natural Gas. Government of India, (downloaded from www.indiastat.com)
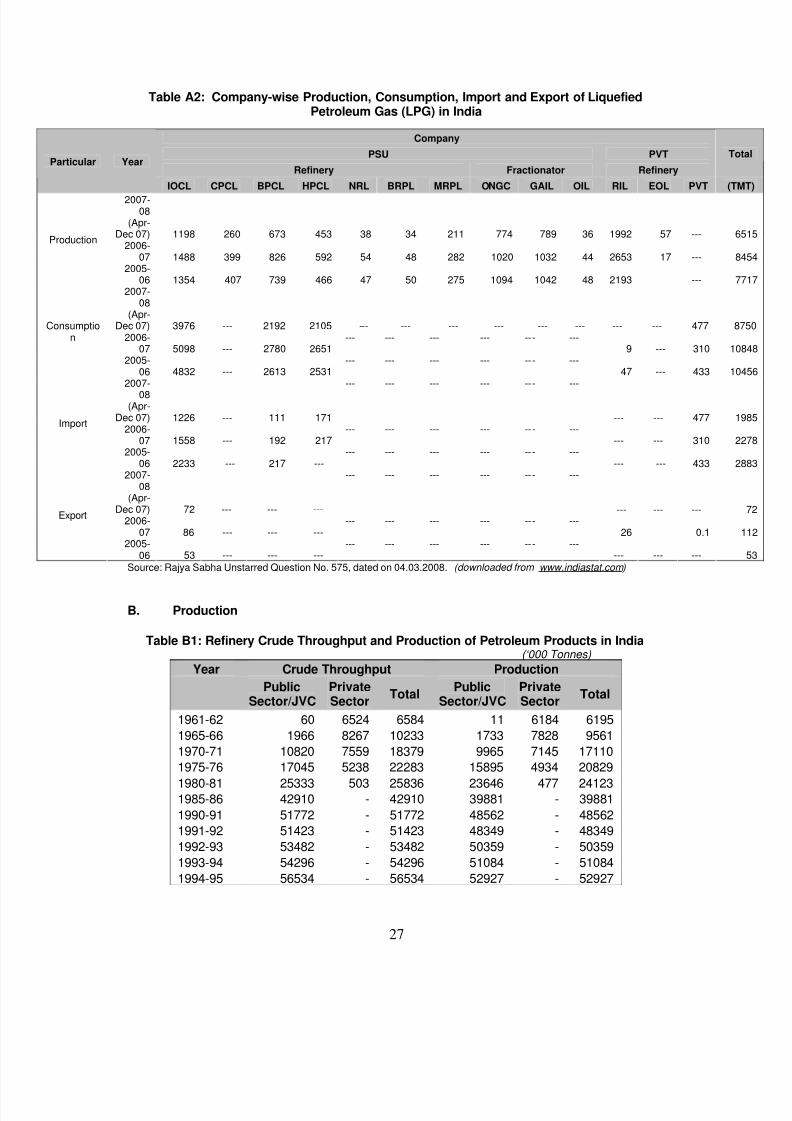
7/31/2019 Competition in Petroleum Industry
http://slidepdf.com/reader/full/competition-in-petroleum-industry 30/56
27
Table A2: Company-wise Production, Consumption, Import and Export of LiquefiedPetroleum Gas (LPG) in India
Company
PSU PVT
Refinery Fractionator Refinery
TParticular Year
IOCL CPCL BPCL HPCL NRL BRPL MRPL ONGC GAIL OIL RIL EOL PVT (2007-
08(Apr-
Dec 07) 1198 260 673 453 38 34 211 774 789 36 1992 57 --- 2006-
07 1488 399 826 592 54 48 282 1020 1032 44 2653 17 ---
Production
2005-06 1354 407 739 466 47 50 275 1094 1042 48 2193 ---
2007-08
(Apr-Dec 07) 3976 --- 2192 2105 --- --- --- --- --- --- --- --- 477
2006-07 5098 --- 2780 2651
--- --- --- --- --- ---9 --- 310
Consumption
2005-06 4832 --- 2613 2531
--- --- --- --- --- ---47 --- 433
2007-08
(Apr-Dec 07) 1226 --- 111 171
--- --- --- --- --- ---
--- --- 477 2006-
07 1558 --- 192 217--- --- --- --- --- ---
--- --- 310
Import
2005-06 2233 --- 217 ---
--- --- --- --- --- ------ --- 433
2007-08
(Apr-Dec 07) 72 --- --- ---
--- --- --- --- --- ---
--- --- --- 2006-
07 86 --- --- ------ --- --- --- --- ---
26 0.1
Export
2005-06 53 --- --- ---
--- --- --- --- --- ------ --- ---
Source: Rajya Sabha Unstarred Question No. 575, dated on 04.03.2008. (downloaded from www.indiastat.com )
B. Production
Table B1: Refinery Crude Throughput and Production of Petroleum Products in India(‘000 Tonnes)
Year Crude Throughput Production
PublicSector/JVC
PrivateSector
TotalPublic
Sector/JVCPrivateSector
Total
1961-62 60 6524 6584 11 6184 6195
1965-66 1966 8267 10233 1733 7828 9561
1970-71 10820 7559 18379 9965 7145 17110
1975-76 17045 5238 22283 15895 4934 20829
1980-81 25333 503 25836 23646 477 24123
1985-86 42910 - 42910 39881 - 39881
1990-91 51772 - 51772 48562 - 48562
1991-92 51423 - 51423 48349 - 48349
1992-93 53482 - 53482 50359 - 50359
1993-94 54296 - 54296 51084 - 51084
1994-95 56534 - 56534 52927 - 52927
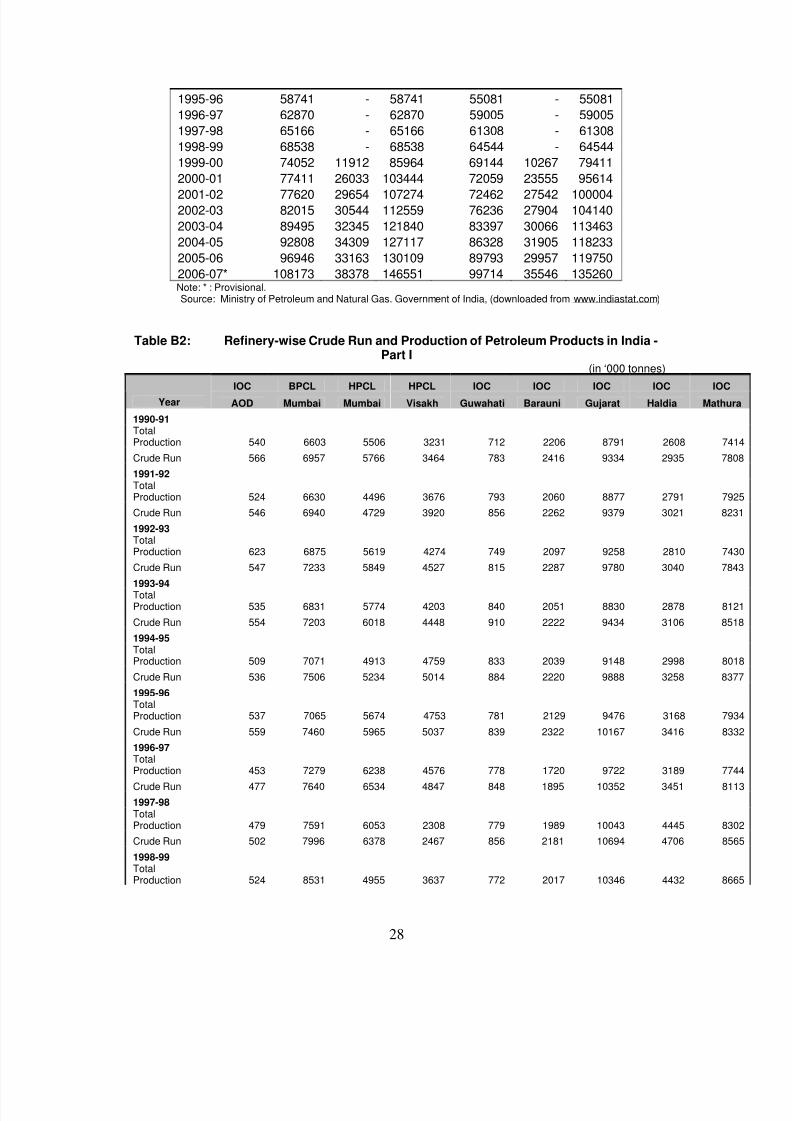
7/31/2019 Competition in Petroleum Industry
http://slidepdf.com/reader/full/competition-in-petroleum-industry 31/56
28
1995-96 58741 - 58741 55081 - 55081
1996-97 62870 - 62870 59005 - 59005
1997-98 65166 - 65166 61308 - 61308
1998-99 68538 - 68538 64544 - 64544
1999-00 74052 11912 85964 69144 10267 79411
2000-01 77411 26033 103444 72059 23555 95614
2001-02 77620 29654 107274 72462 27542 1000042002-03 82015 30544 112559 76236 27904 104140
2003-04 89495 32345 121840 83397 30066 113463
2004-05 92808 34309 127117 86328 31905 118233
2005-06 96946 33163 130109 89793 29957 119750
2006-07* 108173 38378 146551 99714 35546 135260Note: * : Provisional.Source: Ministry of Petroleum and Natural Gas. Government of India, (downloaded from www.indiastat.com)
Table B2: Refinery-wise Crude Run and Production of Petroleum Products in India -Part I
(in ‘000 tonnes)
IOC BPCL HPCL HPCL IOC IOC IOC IOC IOC
Year AOD Mumbai Mumbai Visakh Guwahati Barauni Gujarat Haldia Mathu
1990-91TotalProduction 540 6603 5506 3231 712 2206 8791 2608 74
Crude Run 566 6957 5766 3464 783 2416 9334 2935 78
1991-92TotalProduction 524 6630 4496 3676 793 2060 8877 2791 79
Crude Run 546 6940 4729 3920 856 2262 9379 3021 82
1992-93TotalProduction 623 6875 5619 4274 749 2097 9258 2810 74
Crude Run 547 7233 5849 4527 815 2287 9780 3040 781993-94TotalProduction 535 6831 5774 4203 840 2051 8830 2878 81
Crude Run 554 7203 6018 4448 910 2222 9434 3106 85
1994-95TotalProduction 509 7071 4913 4759 833 2039 9148 2998 80
Crude Run 536 7506 5234 5014 884 2220 9888 3258 83
1995-96TotalProduction 537 7065 5674 4753 781 2129 9476 3168 79
Crude Run 559 7460 5965 5037 839 2322 10167 3416 83
1996-97
TotalProduction 453 7279 6238 4576 778 1720 9722 3189 77
Crude Run 477 7640 6534 4847 848 1895 10352 3451 81
1997-98TotalProduction 479 7591 6053 2308 779 1989 10043 4445 83
Crude Run 502 7996 6378 2467 856 2181 10694 4706 85
1998-99TotalProduction 524 8531 4955 3637 772 2017 10346 4432 86
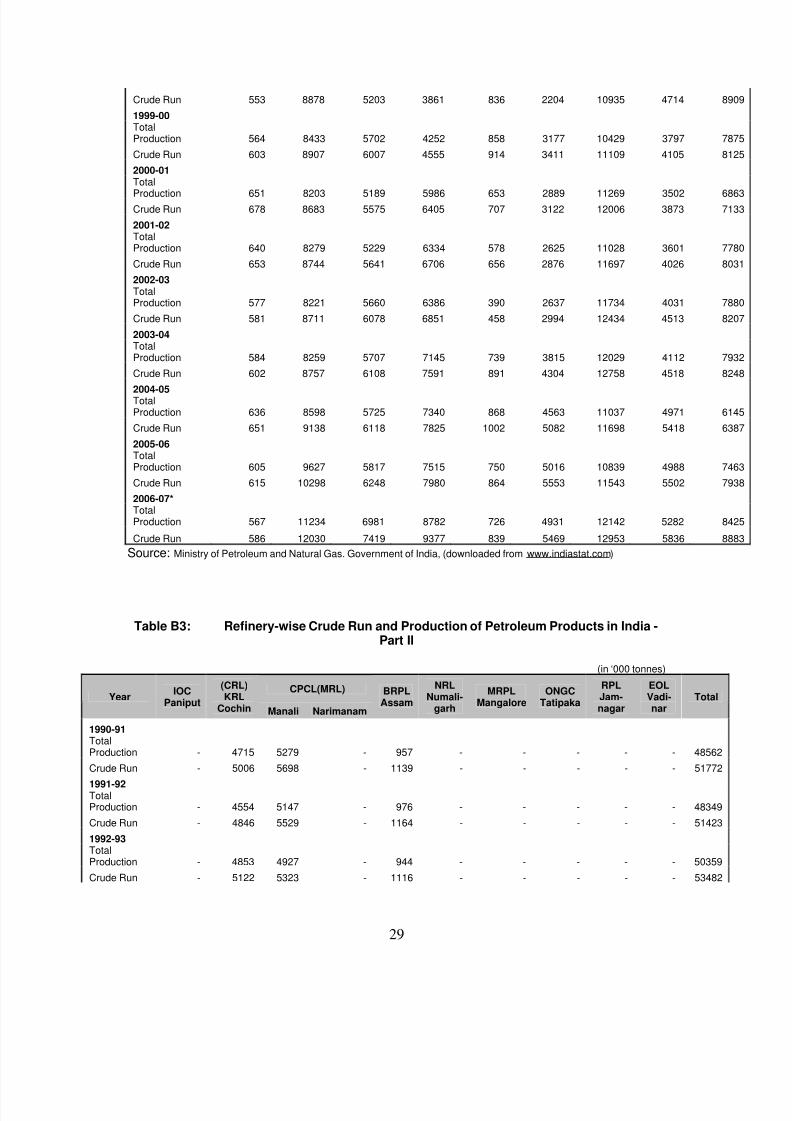
7/31/2019 Competition in Petroleum Industry
http://slidepdf.com/reader/full/competition-in-petroleum-industry 32/56
29
Crude Run 553 8878 5203 3861 836 2204 10935 4714 89
1999-00TotalProduction 564 8433 5702 4252 858 3177 10429 3797 78
Crude Run 603 8907 6007 4555 914 3411 11109 4105 81
2000-01Total
Production 651 8203 5189 5986 653 2889 11269 3502 68
Crude Run 678 8683 5575 6405 707 3122 12006 3873 71
2001-02TotalProduction 640 8279 5229 6334 578 2625 11028 3601 77
Crude Run 653 8744 5641 6706 656 2876 11697 4026 80
2002-03TotalProduction 577 8221 5660 6386 390 2637 11734 4031 78
Crude Run 581 8711 6078 6851 458 2994 12434 4513 82
2003-04TotalProduction 584 8259 5707 7145 739 3815 12029 4112 79
Crude Run 602 8757 6108 7591 891 4304 12758 4518 82
2004-05TotalProduction 636 8598 5725 7340 868 4563 11037 4971 61
Crude Run 651 9138 6118 7825 1002 5082 11698 5418 63
2005-06TotalProduction 605 9627 5817 7515 750 5016 10839 4988 74
Crude Run 615 10298 6248 7980 864 5553 11543 5502 79
2006-07*TotalProduction 567 11234 6981 8782 726 4931 12142 5282 84
Crude Run 586 12030 7419 9377 839 5469 12953 5836 88
Source: Ministry of Petroleum and Natural Gas. Government of India, (downloaded from www.indiastat.com)
Table B3: Refinery-wise Crude Run and Production of Petroleum Products in India -Part II
(in ‘000 tonnes)
CPCL(MRL)Year
IOCPaniput
(CRL)KRL
Cochin Manali Narimanam
BRPLAssam
NRLNumali-
garh
MRPLMangalore
ONGCTatipaka
RPLJam-nagar
EOLVadi-nar
Total
1990-91TotalProduction - 4715 5279 - 957 - - - - - 48562
Crude Run - 5006 5698 - 1139 - - - - - 51772
1991-92TotalProduction - 4554 5147 - 976 - - - - - 48349
Crude Run - 4846 5529 - 1164 - - - - - 51423
1992-93TotalProduction - 4853 4927 - 944 - - - - - 50359
Crude Run - 5122 5323 - 1116 - - - - - 53482

7/31/2019 Competition in Petroleum Industry
http://slidepdf.com/reader/full/competition-in-petroleum-industry 33/56
30
1993-94TotalProduction - 4568 5313 120 1020 - - - - - 51084
Crude Run - 4862 5728 126 1167 - - - - - 54296
1994-95TotalProduction - 4803 6461 370 1005 - - - - - 52957
Crude Run - 5135 6921 382 1179 - - - - - 56534
1995-96TotalProduction - 7010 5162 358 1011 - 23 - - - 55081
Crude Run - 7421 5599 370 1215 - 39 - - - 58741
1996-97TotalProduction - 6890 6143 332 1306 - 2635 - - - 59005
Crude Run - 7293 6621 345 1542 - 2912 - - - 62870
1997-98TotalProduction - 7312 6437 533 1485 - 3552 - - - 61308
Crude Run - 7729 6965 556 1718 - 3853 - - - 65166
1998-99TotalProduction 1908 7304 5652 619 1445 - 3737 - - - 64544
Crude Run 2208 7770 6101 644 1653 - 4069 - - - 68538
1999-00TotalProduction 3688 7826 5870 612 1665 186 4713 - 10267 - 79411
Crude Run 4153 7830 6377 636 1905 215 5200 - 11912 - 85964
2000-01TotalProduction 5206 7039 5524 559 1353 1293 5879 - 23556 - 95614
Crude Run 5707 7520 6046 579 1488 1451 6438 - 26033 - 103444
2001-02TotalProduction 5323 6398 5676 549 1314 2052 5043 13 27542 - 100004
Crude Run 5822 6797 6123 566 1475 2307 5487 13 29654 - 107274
2002-03TotalProduction 5561 7063 5658 631 1352 1665 6699 91 27904 - 104140
Crude Run 6101 7580 6176 643 1463 1879 7253 93 30544 - 112559
2003-04TotalProduction 5818 7419 5827 645 1963 1961 9352 90 30066 - 113463
Crude Run 6338 7854 6387 653 2126 2200 10069 91 32345 - 121840
2004-05TotalProduction 5826 7387 7397 733 2118 1834 11059 92 31904 - 118233
Crude Run 6390 7924 8181 742 2311 2042 11809 93 34309 - 127117
2005-06TotalProduction 5780 6456 8742 671 2246 1918 11268 92 29957 - 119750
Crude Run 6507 6939 9680 682 2356 2133 12014 93 33163 - 130109
2006-07*TotalProduction 8016 7237 8841 609 1932 2227 11689 93 34174 1372 135260
Crude Run 9435 7742 9784 618 2067 2504 12536 94 36616 1763 146551
Abbr for Part I and II:IOC : Indian Oil Corporation Limited.HPCL : Hindustan Petroleum Corporation Limited.

7/31/2019 Competition in Petroleum Industry
http://slidepdf.com/reader/full/competition-in-petroleum-industry 34/56
31
BPCL : Bharat Petroleum Corporation Limited.AOD : Assam Oil Division.
Note : * : Provisional.Source : Ministry of Petroleum and Natural Gas, Govt. of India.Abbr. : IOC : Indian Oil Corporation Limited.
CPCL : Chennai Petroleum Corporation Limited.BRPL : Bongaigaon Refinery & Petrochemicals Limited.NRL : Numaligarh Refineries Limited.
MRPL : Mangalore Refinery & Petrochemicals Limited.ONGC : Oil & Natural Gas Commission/Corporation Limited.RPL : Reliance Petroleum Limited.KRL : Kochi Refineries Limited.CRL : Cochin Refineries Limited.
Note : * : Provisional.Source : Ministry of Petroleum and Natural Gas. Government of India, (downloaded from www.indiastat.com)
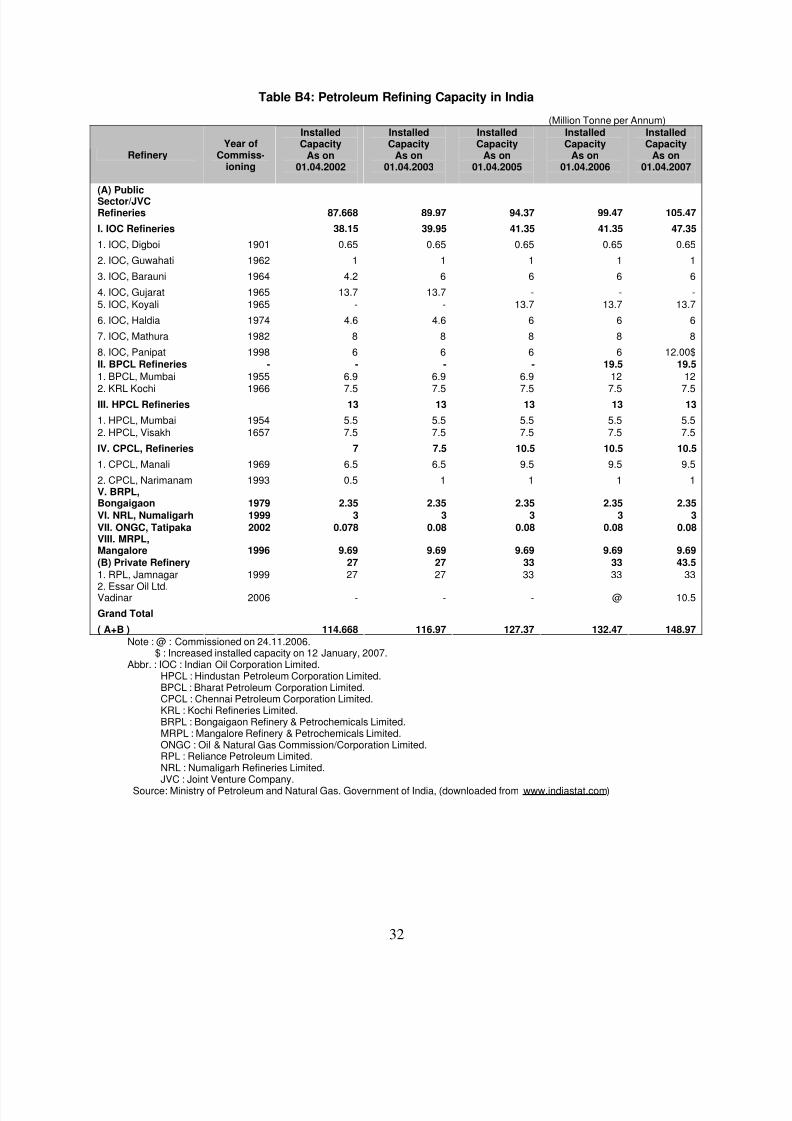
7/31/2019 Competition in Petroleum Industry
http://slidepdf.com/reader/full/competition-in-petroleum-industry 35/56
32
Table B4: Petroleum Refining Capacity in India
(Million Tonne per Annum)InstalledCapacity
InstalledCapacity
InstalledCapacity
InstalledCapacity
InstalledCapacity
RefineryYear of
Commiss-ioning
As on01.04.2002
As on01.04.2003
As on01.04.2005
As on01.04.2006
As on01.04.2007
(A) PublicSector/JVCRefineries 87.668 89.97 94.37 99.47 105.47
I. IOC Refineries 38.15 39.95 41.35 41.35 47.35
1. IOC, Digboi 1901 0.65 0.65 0.65 0.65 0.65
2. IOC, Guwahati 1962 1 1 1 1 1
3. IOC, Barauni 1964 4.2 6 6 6 6
4. IOC, Gujarat 1965 13.7 13.7 - - -5. IOC, Koyali 1965 - - 13.7 13.7 13.7
6. IOC, Haldia 1974 4.6 4.6 6 6 6
7. IOC, Mathura 1982 8 8 8 8 8
8. IOC, Panipat 1998 6 6 6 6 12.00$II. BPCL Refineries - - - - 19.5 19.5
1. BPCL, Mumbai 1955 6.9 6.9 6.9 12 122. KRL Kochi 1966 7.5 7.5 7.5 7.5 7.5
III. HPCL Refineries 13 13 13 13 13
1. HPCL, Mumbai 1954 5.5 5.5 5.5 5.5 5.52. HPCL, Visakh 1657 7.5 7.5 7.5 7.5 7.5
IV. CPCL, Refineries 7 7.5 10.5 10.5 10.5
1. CPCL, Manali 1969 6.5 6.5 9.5 9.5 9.5
2. CPCL, Narimanam 1993 0.5 1 1 1 1V. BRPL,Bongaigaon 1979 2.35 2.35 2.35 2.35 2.35
VI. NRL, Numaligarh 1999 3 3 3 3 3
VII. ONGC, Tatipaka 2002 0.078 0.08 0.08 0.08 0.08VIII. MRPL,Mangalore 1996 9.69 9.69 9.69 9.69 9.69
(B) Private Refinery 27 27 33 33 43.5
1. RPL, Jamnagar 1999 27 27 33 33 332. Essar Oil Ltd.Vadinar 2006 - - - @ 10.5
Grand Total
( A+B ) 114.668 116.97 127.37 132.47 148.97
Note : @ : Commissioned on 24.11.2006.$ : Increased installed capacity on 12 January, 2007.
Abbr. : IOC : Indian Oil Corporation Limited.HPCL : Hindustan Petroleum Corporation Limited.BPCL : Bharat Petroleum Corporation Limited.CPCL : Chennai Petroleum Corporation Limited.KRL : Kochi Refineries Limited.BRPL : Bongaigaon Refinery & Petrochemicals Limited.MRPL : Mangalore Refinery & Petrochemicals Limited.ONGC : Oil & Natural Gas Commission/Corporation Limited.RPL : Reliance Petroleum Limited.NRL : Numaligarh Refineries Limited.JVC : Joint Venture Company.
Source: Ministry of Petroleum and Natural Gas. Government of India, (downloaded from www.indiastat.com)

7/31/2019 Competition in Petroleum Industry
http://slidepdf.com/reader/full/competition-in-petroleum-industry 36/56
33
Table B5: Production of Petroleum Products in India( ' 000 Tonne)
Products 2000-01 2001-02 2002-03 2003-04 2004-05 2005-06 2006-07* 2007-08*
(a) From Crude
OilI. Light Distillatesof which 25048 26539 28619 31971 32865 32427 38104 40111
LPG 4088 4778 4903 5348 5570 5525 6315 6732
Mogas 8070 9699 10361 10999 11057 10502 12539 14167
Naphtha 9908 9180 9650 11317 14100 14509 16660 16440
SBPS/Hexane 93 84 82 89 81 98 79 -
Others (LD) 2982 2882 3705 4307 2138 1891 2590 2772II. MiddleDistillates ofwhich 52445 54409 55937 60018 62509 64432 71225 76649
Kerosene 8714 9681 10028 10187 9298 9078 8491 7794
ATF/RTF/Jet A-1 2513 2595 3053 4289 5201 6196 7805 9107HSD 39052 39899 40207 43316 45903 47572 53465 58361
LDO 1481 1703 2079 1659 1546 923 803 671
JBO 57 44 47 43 36 39 32 -
MTO 214 212 243 242 226 212 187 -
Others (MD) 685 531 570 567 561 663 661 716
III. Heavy Ends ofwhich 18121 19056 19584 21474 23205 22891 25931 28170
Furnance Oil 6479 7488 7529 8737 10560 10320 12325 12638
LSHS/HHS/RFO 4913 4739 4638 4635 4410 3985 3372 3167
Total Fuel Oils 11392 12227 12167 13372 14780 14305 15697 -
Lube Oils 684 651 684 666 646 677 825 881Bitumen 2721 2561 2941 3397 3349 3576 3891 4507
Petroleum Coke 2473 2784 2659 2743 3162 3182 3779 4129
Paraffin Wax 51 45 42 53 64 63 63 64
Others Waxes 61 37 3 0 4 3 -2 -1
Total Waxes 112 82 45 53 68 66 - -
Others (HE) 739 751 1088 1243 1010 - - 2784
Total Production 95614 100004 104140 113463 118579 119750 135260 144930CrudeThroughput 103444 107274 112559 121840 127116 130109 146551 -(b) From NaturalGas
LPG 2045 2205 2370 2320 2240 2185 2093 2060Abbr.: LPG : Liquefied Petroleum Gas.
HSD : High Speed Diesel.LDO : Light Diesel Oil.ATF : Aviation Turbine Fuel.
Note : LD : Includes Propylene, C-3, Propane, Hexane, Special Boiling Point Spirit,Benzene, Toluene, Petroleum Hydro Carbon Solvent, Natural Heptane,Methyl Tertiary Butyl Ether, Poly Isobutine, PBFS and MEKFS.
MD : Includes Mineral Turpentine Oil, JP-5, Linear Alkyl Benzene Feed Stock,Aromex, Jute Batching Oil, Solvent 1425, Low Sulphur Heavy Fuel HSD,DHCB and Special Kerosene.
HE : Includes Carbon Black Feed Stock, Sulphur, Solar Oil, LARO and Extracts.
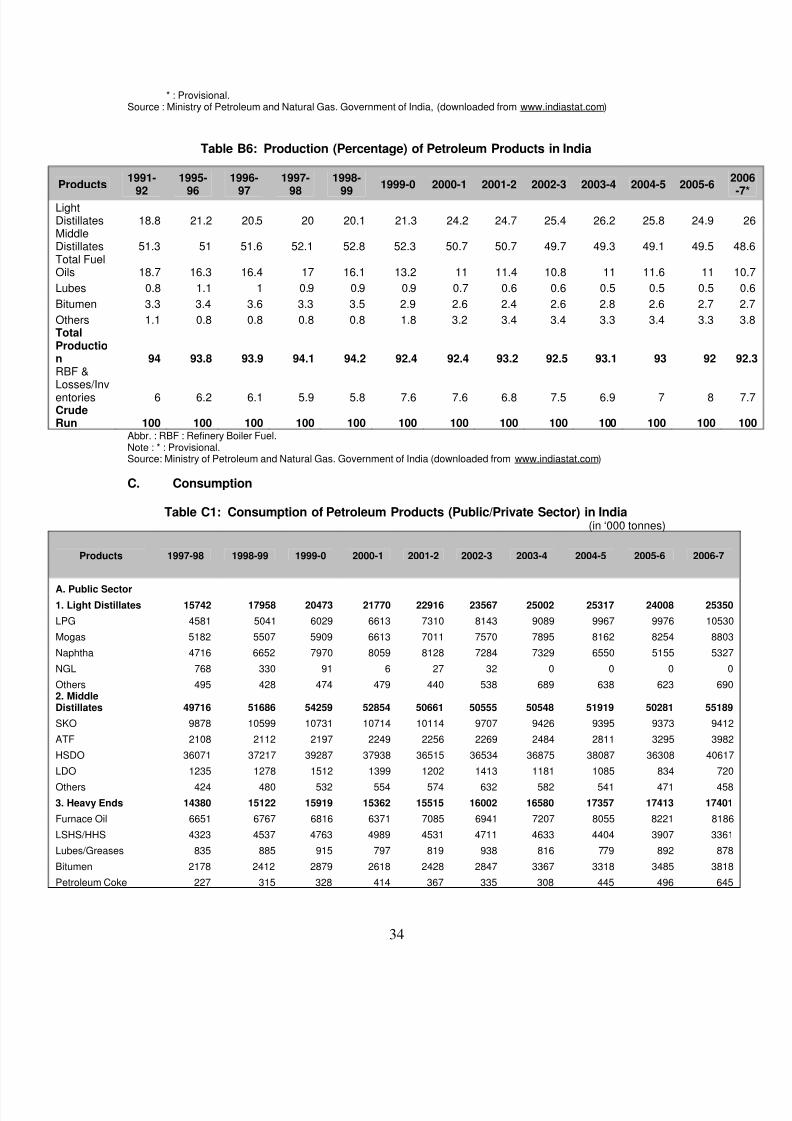
7/31/2019 Competition in Petroleum Industry
http://slidepdf.com/reader/full/competition-in-petroleum-industry 37/56
34
* : Provisional.Source : Ministry of Petroleum and Natural Gas. Government of India, (downloaded from www.indiastat.com)
Table B6: Production (Percentage) of Petroleum Products in India
Products
1991-
92
1995-
96
1996-
97
1997-
98
1998-
99 1999-0 2000-1 2001-2 2002-3 2003-4 2004-5 2005-6LightDistillates 18.8 21.2 20.5 20 20.1 21.3 24.2 24.7 25.4 26.2 25.8 24.9 MiddleDistillates 51.3 51 51.6 52.1 52.8 52.3 50.7 50.7 49.7 49.3 49.1 49.5 Total FuelOils 18.7 16.3 16.4 17 16.1 13.2 11 11.4 10.8 11 11.6 11
Lubes 0.8 1.1 1 0.9 0.9 0.9 0.7 0.6 0.6 0.5 0.5 0.5
Bitumen 3.3 3.4 3.6 3.3 3.5 2.9 2.6 2.4 2.6 2.8 2.6 2.7
Others 1.1 0.8 0.8 0.8 0.8 1.8 3.2 3.4 3.4 3.3 3.4 3.3 TotalProduction 94 93.8 93.9 94.1 94.2 92.4 92.4 93.2 92.5 93.1 93 92 RBF &
Losses/Inventories 6 6.2 6.1 5.9 5.8 7.6 7.6 6.8 7.5 6.9 7 8 CrudeRun 100 100 100 100 100 100 100 100 100 100 100 100
Abbr. : RBF : Refinery Boiler Fuel.Note : * : Provisional.Source: Ministry of Petroleum and Natural Gas. Government of India (downloaded from www.indiastat.com)
C. Consumption
Table C1: Consumption of Petroleum Products (Public/Private Sector) in India(in ‘000 tonnes)
Products 1997-98 1998-99 1999-0 2000-1 2001-2 2002-3 2003-4 2004-5 2005-6 2006-7
A. Public Sector
1. Light Distillates 15742 17958 20473 21770 22916 23567 25002 25317 24008 25350
LPG 4581 5041 6029 6613 7310 8143 9089 9967 9976 10530
Mogas 5182 5507 5909 6613 7011 7570 7895 8162 8254 8803
Naphtha 4716 6652 7970 8059 8128 7284 7329 6550 5155 5327
NGL 768 330 91 6 27 32 0 0 0 0
Others 495 428 474 479 440 538 689 638 623 6902. MiddleDistillates 49716 51686 54259 52854 50661 50555 50548 51919 50281 55189
SKO 9878 10599 10731 10714 10114 9707 9426 9395 9373 9412
ATF 2108 2112 2197 2249 2256 2269 2484 2811 3295 3982
HSDO 36071 37217 39287 37938 36515 36534 36875 38087 36308 40617
LDO 1235 1278 1512 1399 1202 1413 1181 1085 834 720
Others 424 480 532 554 574 632 582 541 471 458
3. Heavy Ends 14380 15122 15919 15362 15515 16002 16580 17357 17413 17401
Furnace Oil 6651 6767 6816 6371 7085 6941 7207 8055 8221 8186
LSHS/HHS 4323 4537 4763 4989 4531 4711 4633 4404 3907 3361
Lubes/Greases 835 885 915 797 819 938 816 779 892 878
Bitumen 2178 2412 2879 2618 2428 2847 3367 3318 3485 3818
Petroleum Coke 227 315 328 414 367 335 308 445 496 645
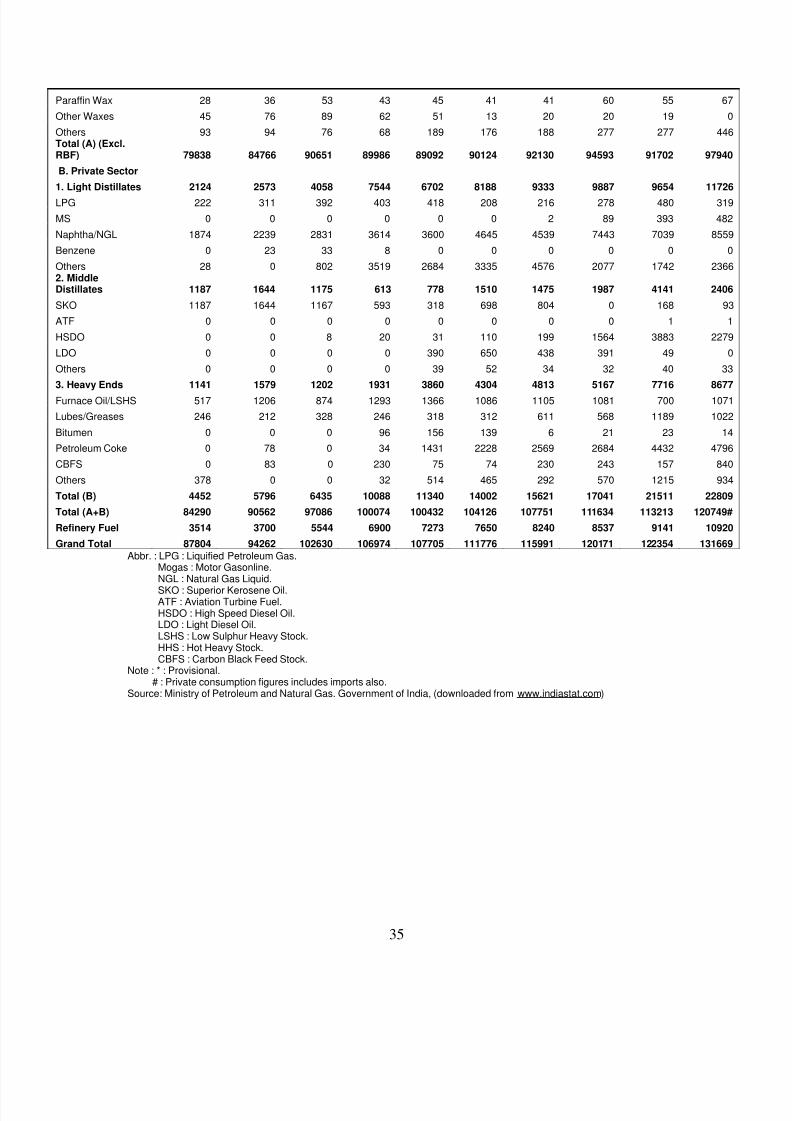
7/31/2019 Competition in Petroleum Industry
http://slidepdf.com/reader/full/competition-in-petroleum-industry 38/56
35
Paraffin Wax 28 36 53 43 45 41 41 60 55 67
Other Waxes 45 76 89 62 51 13 20 20 19 0
Others 93 94 76 68 189 176 188 277 277 446Total (A) (Excl.RBF) 79838 84766 90651 89986 89092 90124 92130 94593 91702 97940
B. Private Sector
1. Light Distillates 2124 2573 4058 7544 6702 8188 9333 9887 9654 11726LPG 222 311 392 403 418 208 216 278 480 319
MS 0 0 0 0 0 0 2 89 393 482
Naphtha/NGL 1874 2239 2831 3614 3600 4645 4539 7443 7039 8559
Benzene 0 23 33 8 0 0 0 0 0 0
Others 28 0 802 3519 2684 3335 4576 2077 1742 23662. MiddleDistillates 1187 1644 1175 613 778 1510 1475 1987 4141 2406
SKO 1187 1644 1167 593 318 698 804 0 168 93
ATF 0 0 0 0 0 0 0 0 1 1
HSDO 0 0 8 20 31 110 199 1564 3883 2279
LDO 0 0 0 0 390 650 438 391 49 0
Others 0 0 0 0 39 52 34 32 40 33
3. Heavy Ends 1141 1579 1202 1931 3860 4304 4813 5167 7716 8677
Furnace Oil/LSHS 517 1206 874 1293 1366 1086 1105 1081 700 1071
Lubes/Greases 246 212 328 246 318 312 611 568 1189 1022
Bitumen 0 0 0 96 156 139 6 21 23 14
Petroleum Coke 0 78 0 34 1431 2228 2569 2684 4432 4796
CBFS 0 83 0 230 75 74 230 243 157 840
Others 378 0 0 32 514 465 292 570 1215 934
Total (B) 4452 5796 6435 10088 11340 14002 15621 17041 21511 22809
Total (A+B) 84290 90562 97086 100074 100432 104126 107751 111634 113213 120749#
Refinery Fuel 3514 3700 5544 6900 7273 7650 8240 8537 9141 10920
Grand Total 87804 94262 102630 106974 107705 111776 115991 120171 122354 131669
Abbr. : LPG : Liquified Petroleum Gas.
Mogas : Motor Gasonline.NGL : Natural Gas Liquid.SKO : Superior Kerosene Oil.ATF : Aviation Turbine Fuel.HSDO : High Speed Diesel Oil.LDO : Light Diesel Oil.LSHS : Low Sulphur Heavy Stock.HHS : Hot Heavy Stock.CBFS : Carbon Black Feed Stock.
Note : * : Provisional.# : Private consumption figures includes imports also.
Source: Ministry of Petroleum and Natural Gas. Government of India, (downloaded from www.indiastat.com)
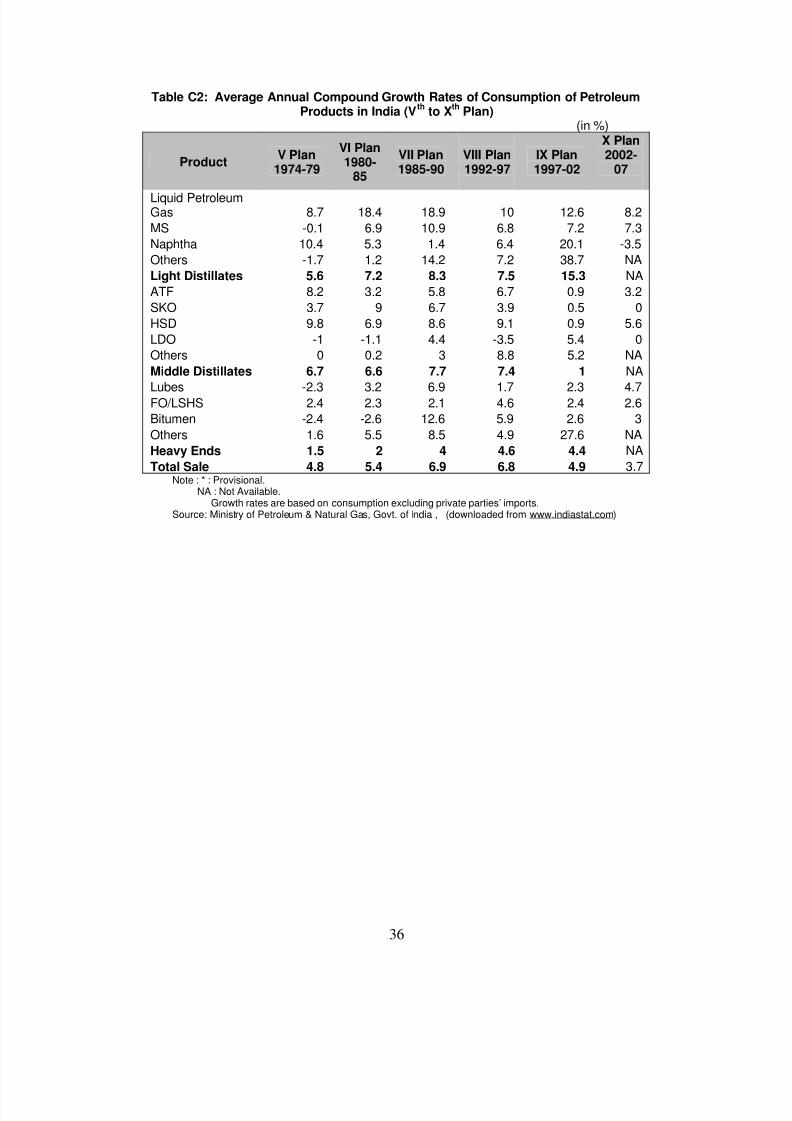
7/31/2019 Competition in Petroleum Industry
http://slidepdf.com/reader/full/competition-in-petroleum-industry 39/56
36
Table C2: Average Annual Compound Growth Rates of Consumption of PetroleumProducts in India (V
thto X
thPlan)
(in %)
ProductV Plan
1974-79
VI Plan1980-
85
VII Plan1985-90
VIII Plan1992-97
IX Plan1997-02
X Plan2002-
07
Liquid PetroleumGas 8.7 18.4 18.9 10 12.6 8.2
MS -0.1 6.9 10.9 6.8 7.2 7.3
Naphtha 10.4 5.3 1.4 6.4 20.1 -3.5
Others -1.7 1.2 14.2 7.2 38.7 NA
Light Distillates 5.6 7.2 8.3 7.5 15.3 NA
ATF 8.2 3.2 5.8 6.7 0.9 3.2
SKO 3.7 9 6.7 3.9 0.5 0
HSD 9.8 6.9 8.6 9.1 0.9 5.6
LDO -1 -1.1 4.4 -3.5 5.4 0
Others 0 0.2 3 8.8 5.2 NA
Middle Distillates 6.7 6.6 7.7 7.4 1 NA
Lubes -2.3 3.2 6.9 1.7 2.3 4.7
FO/LSHS 2.4 2.3 2.1 4.6 2.4 2.6
Bitumen -2.4 -2.6 12.6 5.9 2.6 3
Others 1.6 5.5 8.5 4.9 27.6 NA
Heavy Ends 1.5 2 4 4.6 4.4 NA
Total Sale 4.8 5.4 6.9 6.8 4.9 3.7Note : * : Provisional.
NA : Not Available.Growth rates are based on consumption excluding private parties’ imports.
Source: Ministry of Petroleum & Natural Gas, Govt. of India , (downloaded from www.indiastat.com)

7/31/2019 Competition in Petroleum Industry
http://slidepdf.com/reader/full/competition-in-petroleum-industry 40/56
37
Table C3: Per Capita Consumption of Selected Petroleum Products in India(in Kgs.)
Year Naphtha M.S. SKO HSDO LDO F.O.(Regular) LSHS/HHSIndia-Total@
Sales/Consumption
1985-86 4.2 3 8.3 19.7 1.5 5 5.3 57.3
1986-87 4.2 3.2 8.6 20.6 1.5 4.9 5.5 59.31987-88 3.6 3.6 9.1 22.3 1.6 5.3 5 62
1988-89 4.3 3.9 9.8 23.8 1.8 5.8 4.9 63.7
1989-90 4.1 4.2 10 25.2 1.8 5.5 5.3 69.1
1990-91 4.1 4.2 10 25 1.8 5.3 5.4 68.4
1991-92 4.1 4.2 9.9 26.9 1.7 5.8 5 70.6
1992-93 4 4.2 10 28.7 1.7 6.2 4.7 72.9
1993-94 3.8 4.5 10.3 30.6 1.6 5.9 4.9 75.2
1994-95 4 4.9 10.6 33.4 1.6 6.9 4.8 81.1
1995-96 4 5.1 10.2 35.2 1.4 7.1 4.6 79.2
1996-97 4.4 5.2 9.6 36 1.3 7.1 4.7 86.2
1997-98 4.9 5.4 10.3 37.8 1.3 7 4.5 90.1
1998-99 6.4 5.7 10.9 38 1.3 6.7 4.7 92.21999-00 8.1 6 10.9 40 1.5 6.9 4.9 102
2000-01 7.8 6.4 10.4 36.9 1.4 6.2 4.9 103.72001-02 7.9 6.8 9.8 35.6 1.6 8.2 4.4 97.82002-03 11.5 7.3 10.1 35.5 2 7.8 4.6 108.12003-04 7.1 7.7 9.2 35.9 1.1 7 4.5 112.92004-05 13.6 8 9.1 38.5 1.4 8.9 4.3 116.82005-06 11.1 7.9 8.7 36.7 0.8 8.1 3.6 111.7
2006-07* 11.3 8.2 8.4 37.9 0.6 8.2 3 115.5@ : All India actual consumption of all products incl. Ref. Fuel &
International Bunkers upto the year 1995-96. Later on totalconsumption includes imports from Pvt. Parties and Excluding RBF.
* : Provisional.Source: Ministry of Petroleum and Natural Gas. Government of India, (downloaded from www.indiastat.com)
Table C4: Sector-wise (End Use) Consumption of Selected Petroleum Products in India( ' 000 tonne)
Petroleum
ProductYear Transport
Plantation
PowerGeneratio
nIndustry
Miscellaneous
Services
PrivateSales
Total
1991-92 20282 346 110 1416 526 - 226801992-93 21726 388 108 1489 582 - 242931993-94 23059 494 115 1512 698 - 258781994-95 24742 621 229 1783 886 - 282611995-96 28034 789 167 2386 878 7 322611996-97 20276 6783 2284 3608 2068 - 350191997-98 20662 6891 2390 3843 2285 - 36071
1998-99 21367 6750 2576 4254 2270 - 372171999-00 22386 7593 2622 3890 2796 8 392952000-01 22197 7497 2596 3132 2516 20 379582001-02 21662 7227 2509 2687 2430 31 365462002-03 21832 7278 2497 2548 2379 110 366442003-04 21772 7210 2526 2442 2925 199 370742004-05 22505 7479 2769 2536 2798 1564 39651
HighSpeed
Diesel Oil
2005-06 21578 7015 2683 2446 2586 3816 40124

7/31/2019 Competition in Petroleum Industry
http://slidepdf.com/reader/full/competition-in-petroleum-industry 41/56
38
2006-07(P)
21611 7914 2894 5108 3091 2248 42866
1991-92 80 37 236 644 465 - 14621992-93 85 35 211 647 429 - 14071993-94 82 36 190 625 437 - 13701994-95 83 35 169 641 441 - 1369
1995-96 68 41 166 700 336 - 13111996-97 66 34 184 633 306 - 12231997-98 64 34 189 626 322 - 12351998-99 63 41 170 646 358 - 12781999-00 59 47 176 769 461 - 15122000-01 58 46 215 681 399 - 13992001-02 53 51 165 621 312 390 15922002-03 40 56 173 754 390 650 20632003-04 57 46 147 727 250 392 16192004-05 49 37 88 628 290 291 14762005-06 49 28 65 422 270 49 883
LightDiesel Oil
2006-07(P)
53 130 67 133 337 0 720
1991-92 343 164 527 3692 211 - 49371992-93 339 190 555 3962 227 - 52731993-94 405 186 490 3603 342 - 50261994-95 440 188 580 3944 685 - 58371995-96 321 214 720 4836 405 475 69711996-97 351 250 764 4691 478 660 71941997-98 315 274 549 4865 648 517 71681998-99 349 319 571 4824 704 1206 79731999-00 351 286 515 4901 763 874 76902000-01 318 276 481 4543 753 1293 76642001-02 308 322 551 5057 847 1366 84512002-03 263 376 488 4714 1100 1086 8027
2003-04 339 251 371 4364 1881 1105 83112004-05 251 ** 314 1743 5747 1099 9154
FurnaceOil
2006-07(P)
276 ** 254 973 5600 1083 8186
1990-91 13 49 1835 2605 22 - 45241991-92 22 29 1798 2335 81 - 42651992-93 10 35 1779 2122 48 - 39941993-94 12 40 1676 2366 72 - 41661994-95 2 27 1624 2258 141 - 40521995-96 3 32 1747 2246 161 @ 41891996-97 3 25 1634 2480 171 @ 43131997-98 3 21 1614 2482 203 @ 43231998-99 5 43 1297 2980 212 @ 45371999-00 7 27 1363 3036 330 @ 47632000-01 1 22 1657 2948 361 @ 49892001-02 - 21 1403 2735 372 @ 45312002-03 - 44 1639 2694 334 @ 47112003-04 - 5 1569 2263 796 @ 46332004-05 - - 1238 1453 1713 @ 44042005-06 0 0 560 1390 1957 @ 3907
LowSulphurHeavyStock
2006- 0 0 298 1358 1705 @ 3361

7/31/2019 Competition in Petroleum Industry
http://slidepdf.com/reader/full/competition-in-petroleum-industry 42/56
39
07(P)Abbr. : (P) : Provisional.Note : @ : LSHS sales through pvt. parties included in Furness Oil sales.
** : Included in Miscellaneous services. Breakup not available.Source : Ministry of Petroleum and Natural Gas. Government of India, (downloaded from www.indiastat.com)
D. Imports
Table D1: Net Import of Crude Oil and Petroleum Products by India (Qty. ' 000 Tonnes, Value: Rs in Crore)
Crude Oil Petroleum Products TotalYear
Quantity Value Quantity Value Quantity Value
1990-91 20699 6118.42 6012 3656.27 26711 9774.69
1991-92 23994 7820.05 6509 4003.62 30503 11823.67
1992-93 29247 10685.86 7564 4753.32 36811 15439.18
1993-94 30822 10688.52 8042 5532.62 38864 16221.14
1994-95 27349 10316.03 10697 5934.33 38046 16250.36
1995-96 27342 11517 16900 10745.87 44242 22262.87
1996-97 33906 18538.19 17103 13548.71 51009 32086.9
1997-98 34494 15872 20589 13043 55083 28915
1998-99 39808 14917 23052 11970 62860 26887
1999-00 57805 40028 15862 13488 73667 53516
2000-01 74097 65932 902 4421 74999 70353
2001-02 78706 60397 -3056 -970 75650 59427
2002-03 81989 76195 -3061 -2021 78928 74174Note : * : Provisional.
: # : MMTSource : Ministry of Petroleum and Natural Gas. Government of India, (downloaded from www.indiastat.com)
Table D2: Gross Import of Crude Oil and Petroleum Products in India (Qty. ' 000 Tonnes, Value : Rs in Crore)
2004-05 2005-06 2006-07 2007-08Item
Qty. Value Qty. Value Qty. Value Qty. Value
A. Crude Oil 95861 117003 99409 171702 110858 219991 121672 27699B. PetroleumProducts
I. Light Distillates 5391 9973 6074 14514 8651 23097 9462 29010
LPG 2334 4413 2719 6579 2288 5782 2829 8563
MS 233 501 485 1283 421 1326 326 1132
Naphtha 2214 4029 2473 5735 5474 14870 5965 18401
Propane/MTBE 610 1030 397 917 468 1119 342 914II. MiddleDistillates 1027 2047 1615 3948 2344 6814 5424 17507
ATF 3 14 2 11 2 17 3 20
SKO 210 429 881 2214 1424 4250 2489 8324
HSD 814 1604 732 1723 918 2547 2932 9163Others 0 0 0 0 0 0 - -
III. Heavy Ends 2410 2868 3988 7113 5971 10478 7830 29926
FO/LSHS 741 692 789 1099 986 1487 1241 2300
Lubes/OthersHEI
1669 2176 3199 6014 4985 8991 6589 27627
Total 8828 14888 11677 25575 16966 40389 22716 76443
Grand Total 104689 131891 111086 197277 127824 260380 144388 349142* : Provisional
Note :HEI
: Includes Bitumen, Lube Oil Base Stock,, Low Sulphur Waxy Residue,

7/31/2019 Competition in Petroleum Industry
http://slidepdf.com/reader/full/competition-in-petroleum-industry 43/56
40
Carbon Black feed Stock, Rubber Processing Oil and Paraffin Wax.Source : Ministry of Petroleum and Natural Gas. Government of India, (downloaded from www.indiastat.com)
Table D3: Quantum and Value of Crude Oil Imported by Public Sector Oil RefiningCompanies and Private Oil Refining Companies in India
(Qty. : in Million Metric Tonne; Value : Rs. in Crore)
Year Imports by PSUs PrivateCompanies
Quantity Value Quantity Value
2005-06 69 123530 30.4 48172
2006-07 77.5 157689 34 61340
2007-08* 76.4 170824 34.6 72382 Source: Lok Sabha Starred Question No. 372, dated on 17.04.2008.
(downloaded from www.indiastat.com)
E. Exports
Table E1: Export of Crude Oil and Petroleum Products from India(Qty. ' 000 Tonnes, Value : Rs in Crore)
Crude Oil Petroleum Products TotalYear Quantity Value Quantity Value Quantity Value
1990-91 - - 2648 1003.94 2648 1003.94
1991-92 - - 2936 1214.65 2936 1214.65
1992-93 - - 3719 1606.28 3719 1606.28
1993-94 - - 4034 1508.81 4034 1508.81
1994-95 - - 3254 1587.36 3254 1587.36
1995-96 - - 3435 1831.98 3435 1831.98
1996-97 - - 3162 2084.78 3162 2084.78
1997-98 - - 2381 1266 2381 1266
1998-99 - - 720 306 720 306
1999-00 - - 746 698 746 698
2000-01 - - 8365 7672 8365 76722001-02 - - 10065 8219 10065 8219
2002-03 - - 10289 10868 10289 10868
2003-04 - - 14620 16781 14620 16781
2004-05 - - 18211 29928 18211 29928
2005-06 - - - - 21.51# 46720
2006-07* - - - - 32.39# 80172
2007-08* (April-Sept.) - - - - 19.90# 49981Note : * : Provisional.
: #: MMTSource : Ministry of Petroleum & Natural Gas, Govt. of India. (downloaded from www.indiastat.com)
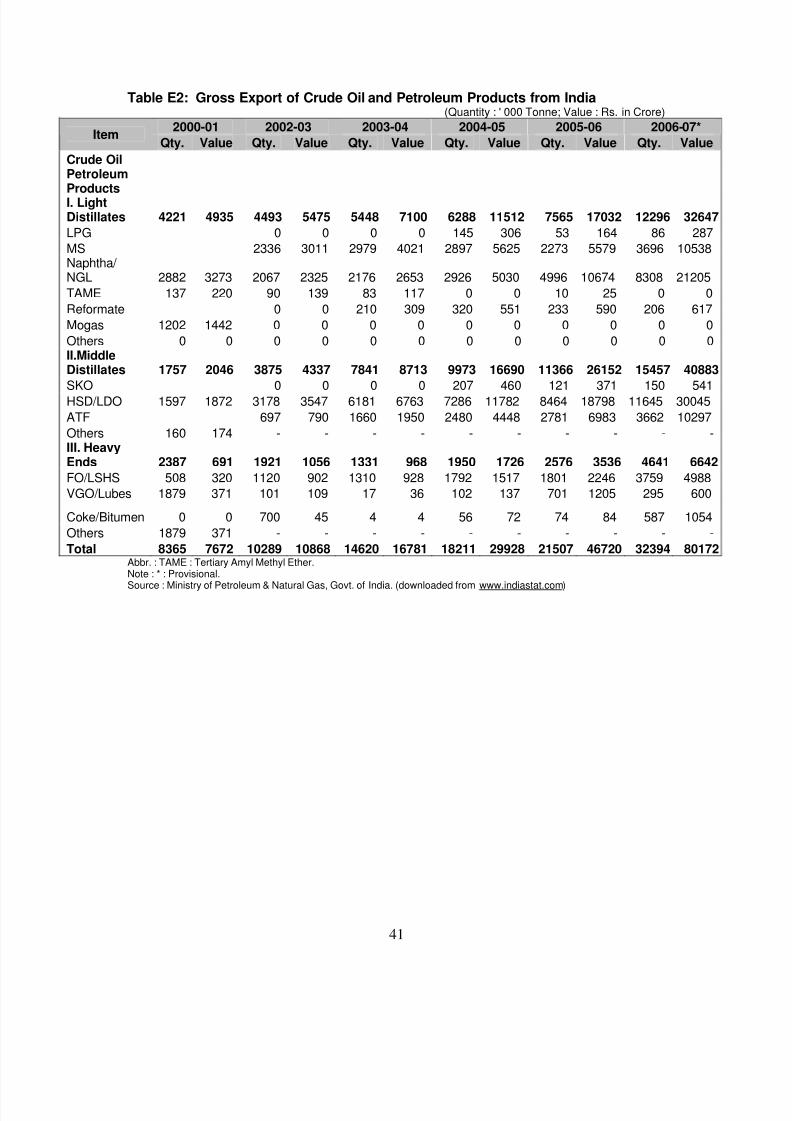
7/31/2019 Competition in Petroleum Industry
http://slidepdf.com/reader/full/competition-in-petroleum-industry 44/56
41
Table E2: Gross Export of Crude Oil and Petroleum Products from India (Quantity : ' 000 Tonne; Value : Rs. in Crore)
2000-01 2002-03 2003-04 2004-05 2005-06 2006-07*Item
Qty. Value Qty. Value Qty. Value Qty. Value Qty. Value Qty. Value
Crude OilPetroleum
ProductsI. LightDistillates 4221 4935 4493 5475 5448 7100 6288 11512 7565 17032 12296 32647
LPG 0 0 0 0 145 306 53 164 86 287
MS 2336 3011 2979 4021 2897 5625 2273 5579 3696 10538Naphtha/ NGL 2882 3273 2067 2325 2176 2653 2926 5030 4996 10674 8308 21205
TAME 137 220 90 139 83 117 0 0 10 25 0 0
Reformate 0 0 210 309 320 551 233 590 206 617
Mogas 1202 1442 0 0 0 0 0 0 0 0 0 0
Others 0 0 0 0 0 0 0 0 0 0 0 0II.MiddleDistillates 1757 2046 3875 4337 7841 8713 9973 16690 11366 26152 15457 40883
SKO 0 0 0 0 207 460 121 371 150 541HSD/LDO 1597 1872 3178 3547 6181 6763 7286 11782 8464 18798 11645 30045
ATF 697 790 1660 1950 2480 4448 2781 6983 3662 10297
Others 160 174 - - - - - - - - - -III. HeavyEnds 2387 691 1921 1056 1331 968 1950 1726 2576 3536 4641 6642
FO/LSHS 508 320 1120 902 1310 928 1792 1517 1801 2246 3759 4988
VGO/Lubes 1879 371 101 109 17 36 102 137 701 1205 295 600
Coke/Bitumen 0 0 700 45 4 4 56 72 74 84 587 1054
Others 1879 371 - - - - - - - - - -
Total 8365 7672 10289 10868 14620 16781 18211 29928 21507 46720 32394 80172Abbr. : TAME : Tertiary Amyl Methyl Ether.
Note : * : Provisional.Source : Ministry of Petroleum & Natural Gas, Govt. of India. (downloaded from www.indiastat.com)
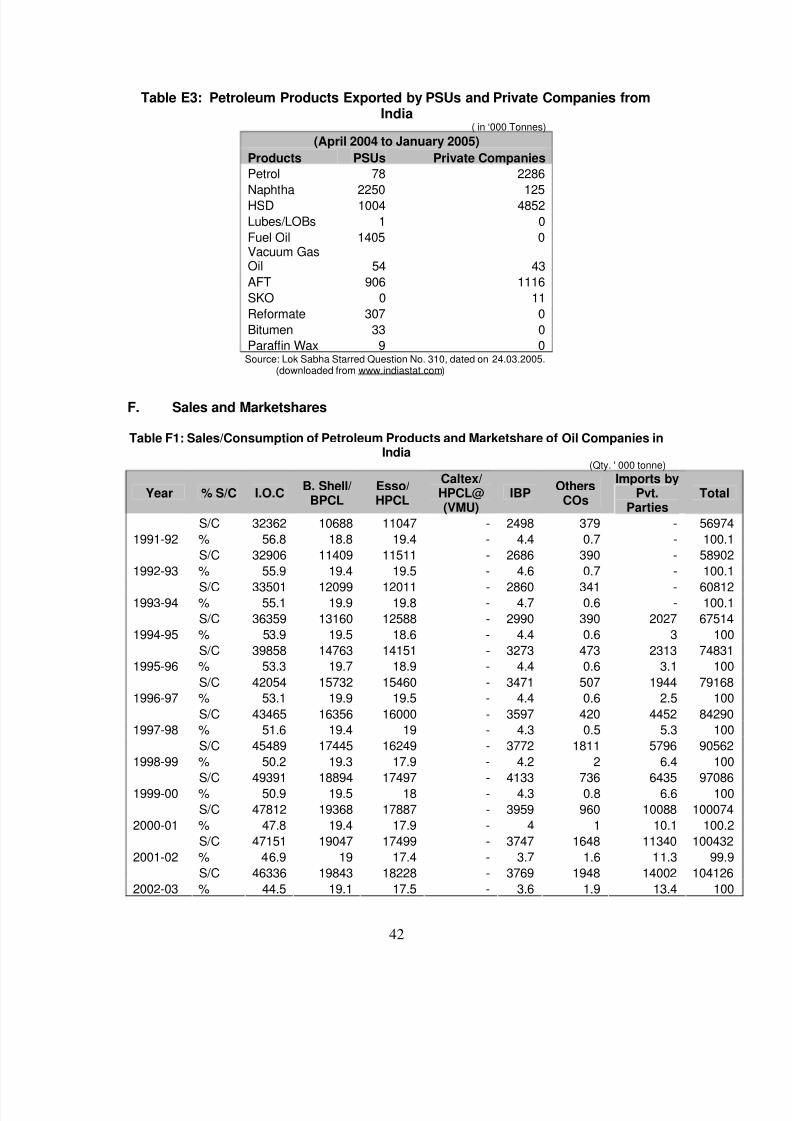
7/31/2019 Competition in Petroleum Industry
http://slidepdf.com/reader/full/competition-in-petroleum-industry 45/56
42
Table E3: Petroleum Products Exported by PSUs and Private Companies fromIndia
( in ‘000 Tonnes) (April 2004 to January 2005)
Products PSUs Private Companies
Petrol 78 2286
Naphtha 2250 125HSD 1004 4852
Lubes/LOBs 1 0
Fuel Oil 1405 0Vacuum GasOil 54 43
AFT 906 1116
SKO 0 11
Reformate 307 0
Bitumen 33 0
Paraffin Wax 9 0Source: Lok Sabha Starred Question No. 310, dated on 24.03.2005.
(downloaded from www.indiastat.com)
F. Sales and Marketshares
Table F1: Sales/Consumption of Petroleum Products and Marketshare of Oil Companies inIndia
(Qty. ' 000 tonne)
Year % S/C I.O.CB. Shell/
BPCLEsso/HPCL
Caltex/HPCL@(VMU)
IBPOthers
COs
Imports byPvt.
PartiesTotal
S/C 32362 10688 11047 - 2498 379 - 5697
1991-92 % 56.8 18.8 19.4 - 4.4 0.7 - 100.
S/C 32906 11409 11511 - 2686 390 - 5890
1992-93 % 55.9 19.4 19.5 - 4.6 0.7 - 100.S/C 33501 12099 12011 - 2860 341 - 6081
1993-94 % 55.1 19.9 19.8 - 4.7 0.6 - 100.
S/C 36359 13160 12588 - 2990 390 2027 6751
1994-95 % 53.9 19.5 18.6 - 4.4 0.6 3 10
S/C 39858 14763 14151 - 3273 473 2313 7483
1995-96 % 53.3 19.7 18.9 - 4.4 0.6 3.1 10
S/C 42054 15732 15460 - 3471 507 1944 7916
1996-97 % 53.1 19.9 19.5 - 4.4 0.6 2.5 10
S/C 43465 16356 16000 - 3597 420 4452 8429
1997-98 % 51.6 19.4 19 - 4.3 0.5 5.3 10
S/C 45489 17445 16249 - 3772 1811 5796 9056
1998-99 % 50.2 19.3 17.9 - 4.2 2 6.4 10S/C 49391 18894 17497 - 4133 736 6435 9708
1999-00 % 50.9 19.5 18 - 4.3 0.8 6.6 10
S/C 47812 19368 17887 - 3959 960 10088 10007
2000-01 % 47.8 19.4 17.9 - 4 1 10.1 100.
S/C 47151 19047 17499 - 3747 1648 11340 10043
2001-02 % 46.9 19 17.4 - 3.7 1.6 11.3 99.
S/C 46336 19843 18228 - 3769 1948 14002 10412
2002-03 % 44.5 19.1 17.5 - 3.6 1.9 13.4 10

7/31/2019 Competition in Petroleum Industry
http://slidepdf.com/reader/full/competition-in-petroleum-industry 46/56
43
S/C 46778 20297 18577 - 4162 2316 15621 107752003-04 % 43.4 18.8 17.2 - 3.9 2.1 14.5 10
S/C 48018 20697 19091 - 4594 2193 17041 11159
2004-05 % 43 18.5 17.1 - 4.2 2 15.3 10
S/C 46160 20477 18309 - 4316 2440 21511 11321
2005-06 % 40.8 18.1 16.2 - 3.8 2.2 19 10
S/C 53425 22661 19698 - $ 2156 22809* 120742006-07# % 44.2 18.8 16.3 - 1.8 18.9 10
S/C : Sales/Consumption.Note : @ : Included under Esso/HPCL from 1980-81 Onwards.
: Consumption excludes RBF.# : Provisional$ : IBP has been merged with IOC.* : Private consumption figures includes imports also.
Source: .Ministry of Petroleum & Natural Gas, Govt. of India. (downloaded from www.indiastat.com)
Table F2: State/Company-wise Number of Retail Outlets of Petroleum Products inIndia
(As on 01.04.2008) (As on 01.04.2007)States/UTs
IOCL/AOD HPCL BPCL Total IOCL/AOD IBP HPCL BPCL Total
Andhra Pradesh 1391 753 706 2850 952 363 715 653 2683ArunachalPradesh 46 0 1 47 39 2 0 1 42
Assam 440 61 22 523 377 26 61 15 479
Bihar 854 252 295 1401 551 223 227 282 1283
Chhatisgarh 213 137 148 498 153 41 140 137 471
Delhi 201 96 105 402 152 47 95 105 399
Goa 21 31 39 91 18 3 31 37 89
Gujarat 914 404 433 1751 645 240 393 423 1701
Haryana 868 337 254 1459 585 224 307 238 1354
HimachalPradesh 158 63 52 273 124 28 62 50 264Jammu &Kashmir 175 99 90 364 154 10 96 88 348
Jharkhand 338 163 148 649 239 67 158 145 609
Karnataka 1113 524 519 2156 858 181 474 481 1994
Kerala 761 466 381 1608 523 192 445 366 1526MadhyaPradesh 753 370 472 1595 602 91 350 444 1487
Maharashtra 1194 887 1010 3091 913 211 864 970 2958
Manipur 53 0 2 55 42 5 0 0 47
Meghalaya 94 16 6 116 75 9 15 5 104
Mizoram 19 2 0 21 15 0 2 0 17Nagaland 41 2 3 46 37 2 2 2 43
Orissa 490 183 238 911 351 74 164 231 820
Punjab 1436 633 544 2613 922 426 577 521 2446
Rajasthan 1086 654 546 2286 886 131 624 506 2147
Sikkim 14 3 11 28 12 2 3 10 27
Tamil Nadu 1385 739 779 2904 1038 236 714 712 2700
Tripura 38 0 0 38 36 1 0 0 37
Uttar Pradesh 2346 916 916 4178 1728 481 870 890 3969
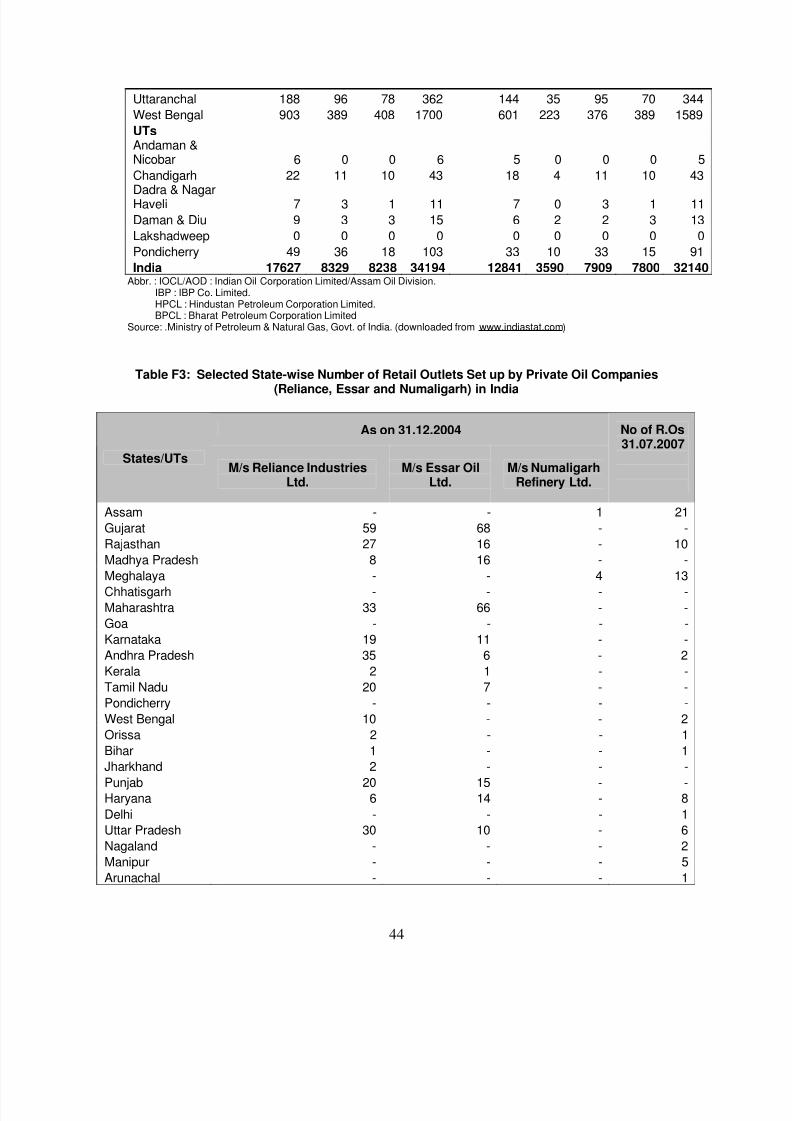
7/31/2019 Competition in Petroleum Industry
http://slidepdf.com/reader/full/competition-in-petroleum-industry 47/56
44
Uttaranchal 188 96 78 362 144 35 95 70 344
West Bengal 903 389 408 1700 601 223 376 389 1589
UTsAndaman &Nicobar 6 0 0 6 5 0 0 0 5
Chandigarh 22 11 10 43 18 4 11 10 43
Dadra & NagarHaveli 7 3 1 11 7 0 3 1 11
Daman & Diu 9 3 3 15 6 2 2 3 13
Lakshadweep 0 0 0 0 0 0 0 0 0
Pondicherry 49 36 18 103 33 10 33 15 91
India 17627 8329 8238 34194 12841 3590 7909 7800 32140Abbr. : IOCL/AOD : Indian Oil Corporation Limited/Assam Oil Division.
IBP : IBP Co. Limited.HPCL : Hindustan Petroleum Corporation Limited.BPCL : Bharat Petroleum Corporation Limited
Source: .Ministry of Petroleum & Natural Gas, Govt. of India. (downloaded from www.indiastat.com)
Table F3: Selected State-wise Number of Retail Outlets Set up by Private Oil Companies(Reliance, Essar and Numaligarh) in India
As on 31.12.2004
States/UTsM/s Reliance Industries
Ltd.M/s Essar Oil
Ltd.M/s Numaligarh
Refinery Ltd.
No of R.Os31.07.2007
Assam - - 1 21
Gujarat 59 68 - -
Rajasthan 27 16 - 10
Madhya Pradesh 8 16 - -
Meghalaya - - 4 13Chhatisgarh - - - -
Maharashtra 33 66 - -
Goa - - - -
Karnataka 19 11 - -
Andhra Pradesh 35 6 - 2
Kerala 2 1 - -
Tamil Nadu 20 7 - -
Pondicherry - - - -
West Bengal 10 - - 2
Orissa 2 - - 1
Bihar 1 - - 1
Jharkhand 2 - - -Punjab 20 15 - -
Haryana 6 14 - 8
Delhi - - - 1
Uttar Pradesh 30 10 - 6
Nagaland - - - 2
Manipur - - - 5
Arunachal - - - 1

7/31/2019 Competition in Petroleum Industry
http://slidepdf.com/reader/full/competition-in-petroleum-industry 48/56
45
Pradesh
Uttaranchal - - - 1
India 274 230 5 74Source:Source : Lok Sabha Unstarred Question No. 2369, dated 17.03.2005 &
Rajya Sabha Unstarred Question No. 5066, dated 10.05.2005. &Lok Sabha Unstarred Question No. 703, dated 16.08.2007.(downloaded from www.indiastat.com )
G. Prices
Table G1: Major City-wise Retail Selling Prices of Petrol and Diesel in India
(Rs./Litre) (As on 01.04.2007)
Major City Petrol Diesel
North
New Delhi 42.85 30.25
Chandigarh 44.09 30.63
Dehradun 44.58 32.7
Jaipur 46.49 33.07
Jammu 44.78 30.99
Lucknow 46.41 33.65
Shimla 45.68 31.38
Srinagar 46.11 31.92
EastKolkata 46.9 32.88
Agartala 42.87 30.4
Aizwal 42.69 30.27
Bhubaneshwar 44.55 33.5
Gangtok 45.67 33.24
Guwahati 45.52 31.39
Imphal 42.16 30.17
Itanagar 42.93 30.43
Kohima 43.31 30.48
Patna 46.48 32.97
Port Blair 37.84 29.22
Ranchi 43.96 33.01Shillong 43.19 30.57
West
Mumbai 48.41 34.96
Ahmedabad 47.74 35.21
Bhopal 46.99 34.8
Panjim 44.36 33.19
Raipur 44.82 34.13
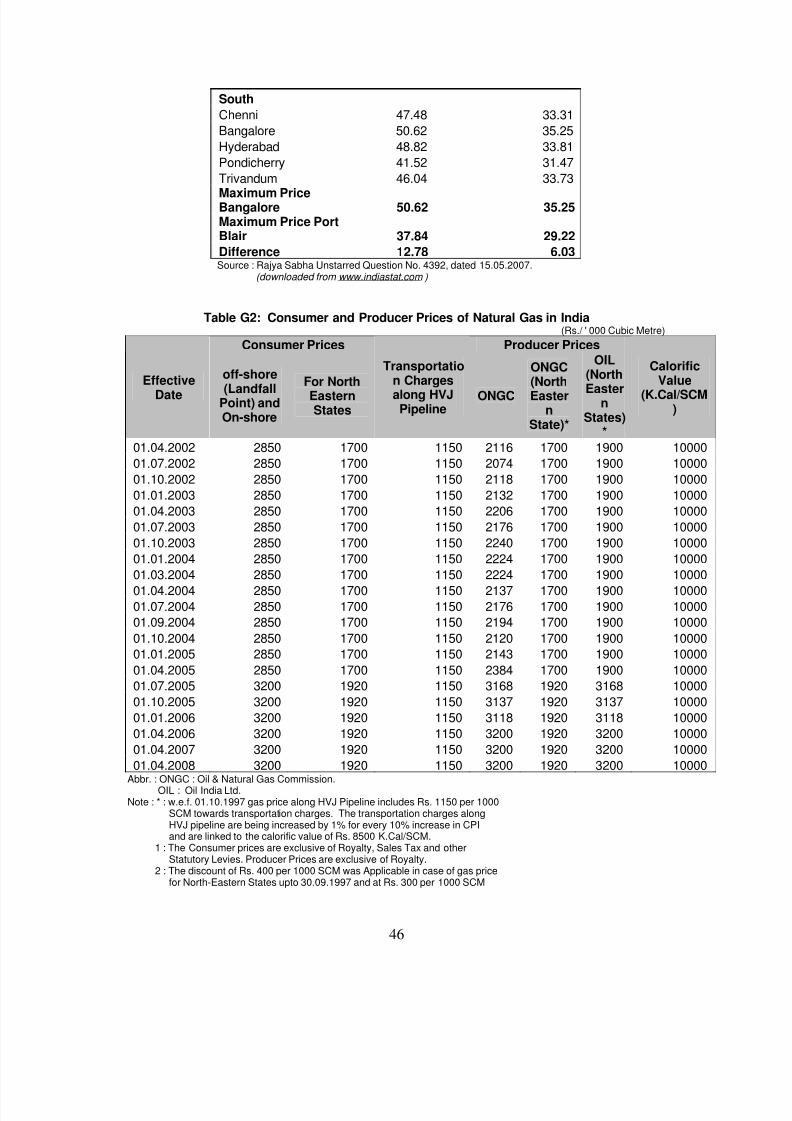
7/31/2019 Competition in Petroleum Industry
http://slidepdf.com/reader/full/competition-in-petroleum-industry 49/56
46
South
Chenni 47.48 33.31
Bangalore 50.62 35.25
Hyderabad 48.82 33.81
Pondicherry 41.52 31.47
Trivandum 46.04 33.73
Maximum PriceBangalore 50.62 35.25Maximum Price PortBlair 37.84 29.22
Difference 12.78 6.03Source : Rajya Sabha Unstarred Question No. 4392, dated 15.05.2007.
(downloaded from www.indiastat.com )
Table G2: Consumer and Producer Prices of Natural Gas in India (Rs./ ' 000 Cubic Metre)
Consumer Prices Producer Prices
EffectiveDate
off-shore(LandfallPoint) andOn-shore
For NorthEasternStates
Transportatio
n Chargesalong HVJPipeline
ONGC
ONGC
(NorthEaster
nState)*
OIL
(NorthEastern
States)*
Calorific
Value(K.Cal/SCM
)
01.04.2002 2850 1700 1150 2116 1700 1900 10000
01.07.2002 2850 1700 1150 2074 1700 1900 10000
01.10.2002 2850 1700 1150 2118 1700 1900 10000
01.01.2003 2850 1700 1150 2132 1700 1900 10000
01.04.2003 2850 1700 1150 2206 1700 1900 10000
01.07.2003 2850 1700 1150 2176 1700 1900 10000
01.10.2003 2850 1700 1150 2240 1700 1900 10000
01.01.2004 2850 1700 1150 2224 1700 1900 10000
01.03.2004 2850 1700 1150 2224 1700 1900 1000001.04.2004 2850 1700 1150 2137 1700 1900 10000
01.07.2004 2850 1700 1150 2176 1700 1900 10000
01.09.2004 2850 1700 1150 2194 1700 1900 10000
01.10.2004 2850 1700 1150 2120 1700 1900 10000
01.01.2005 2850 1700 1150 2143 1700 1900 10000
01.04.2005 2850 1700 1150 2384 1700 1900 10000
01.07.2005 3200 1920 1150 3168 1920 3168 10000
01.10.2005 3200 1920 1150 3137 1920 3137 10000
01.01.2006 3200 1920 1150 3118 1920 3118 10000
01.04.2006 3200 1920 1150 3200 1920 3200 10000
01.04.2007 3200 1920 1150 3200 1920 3200 10000
01.04.2008 3200 1920 1150 3200 1920 3200 10000Abbr. : ONGC : Oil & Natural Gas Commission.
OIL : Oil India Ltd.Note : * : w.e.f. 01.10.1997 gas price along HVJ Pipeline includes Rs. 1150 per 1000
SCM towards transportation charges. The transportation charges alongHVJ pipeline are being increased by 1% for every 10% increase in CPIand are linked to the calorific value of Rs. 8500 K.Cal/SCM.
1 : The Consumer prices are exclusive of Royalty, Sales Tax and otherStatutory Levies. Producer Prices are exclusive of Royalty.
2 : The discount of Rs. 400 per 1000 SCM was Applicable in case of gas pricefor North-Eastern States upto 30.09.1997 and at Rs. 300 per 1000 SCM
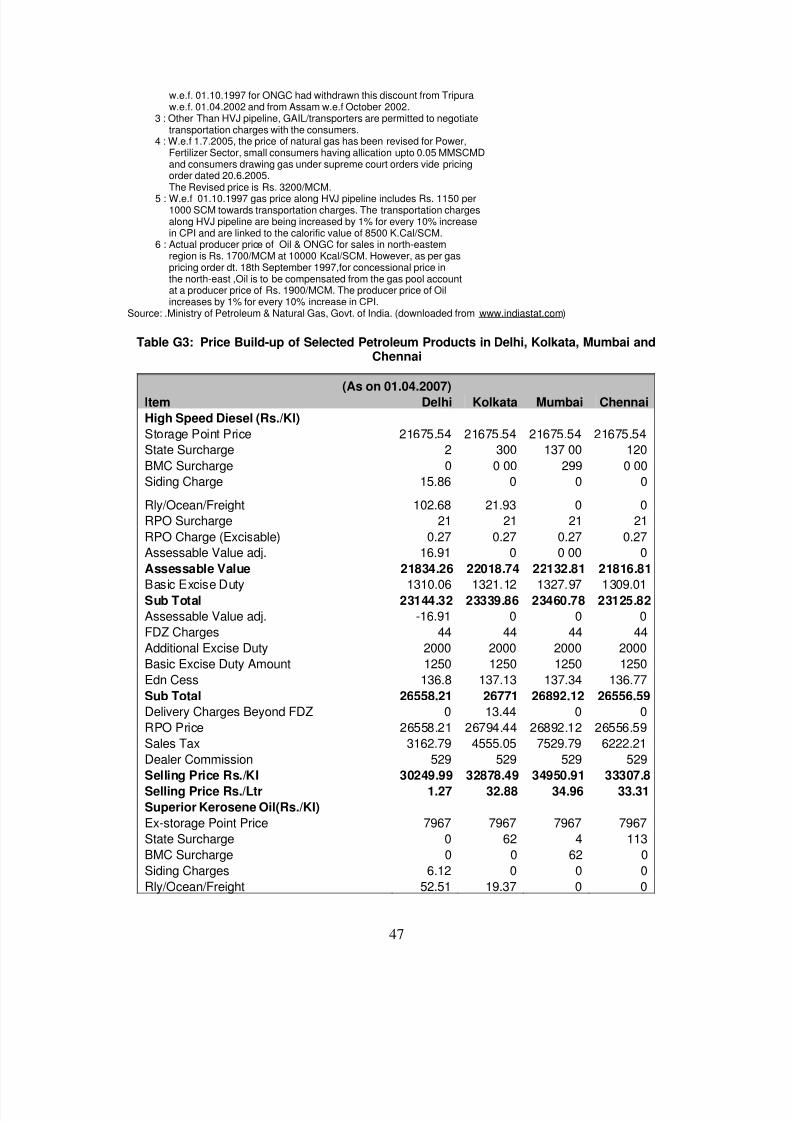
7/31/2019 Competition in Petroleum Industry
http://slidepdf.com/reader/full/competition-in-petroleum-industry 50/56
47
w.e.f. 01.10.1997 for ONGC had withdrawn this discount from Tripuraw.e.f. 01.04.2002 and from Assam w.e.f October 2002.
3 : Other Than HVJ pipeline, GAIL/transporters are permitted to negotiatetransportation charges with the consumers.
4 : W.e.f 1.7.2005, the price of natural gas has been revised for Power,Fertilizer Sector, small consumers having allication upto 0.05 MMSCMDand consumers drawing gas under supreme court orders vide pricingorder dated 20.6.2005.
The Revised price is Rs. 3200/MCM.5 : W.e.f 01.10.1997 gas price along HVJ pipeline includes Rs. 1150 per1000 SCM towards transportation charges. The transportation chargesalong HVJ pipeline are being increased by 1% for every 10% increasein CPI and are linked to the calorific value of 8500 K.Cal/SCM.
6 : Actual producer price of Oil & ONGC for sales in north-easternregion is Rs. 1700/MCM at 10000 Kcal/SCM. However, as per gaspricing order dt. 18th September 1997,for concessional price inthe north-east ,Oil is to be compensated from the gas pool accountat a producer price of Rs. 1900/MCM. The producer price of Oilincreases by 1% for every 10% increase in CPI.
Source: .Ministry of Petroleum & Natural Gas, Govt. of India. (downloaded from www.indiastat.com)
Table G3: Price Build-up of Selected Petroleum Products in Delhi, Kolkata, Mumbai andChennai
(As on 01.04.2007)
Item Delhi Kolkata Mumbai Chennai
High Speed Diesel (Rs./Kl)
Storage Point Price 21675.54 21675.54 21675.54 21675.54
State Surcharge 2 300 137 00 120
BMC Surcharge 0 0 00 299 0 00
Siding Charge 15.86 0 0 0
Rly/Ocean/Freight 102.68 21.93 0 0
RPO Surcharge 21 21 21 21
RPO Charge (Excisable) 0.27 0.27 0.27 0.27
Assessable Value adj. 16.91 0 0 00 0
Assessable Value 21834.26 22018.74 22132.81 21816.81Basic Excise Duty 1310.06 1321.12 1327.97 1309.01
Sub Total 23144.32 23339.86 23460.78 23125.82
Assessable Value adj. -16.91 0 0 0
FDZ Charges 44 44 44 44
Additional Excise Duty 2000 2000 2000 2000
Basic Excise Duty Amount 1250 1250 1250 1250
Edn Cess 136.8 137.13 137.34 136.77
Sub Total 26558.21 26771 26892.12 26556.59
Delivery Charges Beyond FDZ 0 13.44 0 0
RPO Price 26558.21 26794.44 26892.12 26556.59
Sales Tax 3162.79 4555.05 7529.79 6222.21
Dealer Commission 529 529 529 529Selling Price Rs./KI 30249.99 32878.49 34950.91 33307.8
Selling Price Rs./Ltr 1.27 32.88 34.96 33.31
Superior Kerosene Oil(Rs./KI)
Ex-storage Point Price 7967 7967 7967 7967
State Surcharge 0 62 4 113
BMC Surcharge 0 0 62 0
Siding Charges 6.12 0 0 0
Rly/Ocean/Freight 52.51 19.37 0 0

7/31/2019 Competition in Petroleum Industry
http://slidepdf.com/reader/full/competition-in-petroleum-industry 51/56
48
Assessable Value 8025.63 8048.37 8033 8080
Entry Tax Amount/TN rebate 0 0 0 -576
Sates Tax 321.03 321.93 321.32 300.16
Sub Total - Rs/KI 8346.65 8370.31 8354.32 7804.16
Wholesales Margin 204 204 204 143
Transport Charges 284.25 203.3 243 52.25
Wholesales Price/KI 8834.9 8777.61 8801.32 7999.41Retailers Margin 180 176.45 208 360
Leakage and other Expenses 0 205.18 38.26 30
Retail Transportation 0 130 0 0
Rounding off 75.1 0 2.42 0
Selling Price Rs./KI 9090 9289.24 9050 8389.41
Selling Price Rs./Ltr 9.09 9.29 9.05 8.39
ATF (Domestic Airlines)
Basic Price 24870 25410 24970 25240
Inland Differential 570 0 0 0
State Surcharge 2 1520 590 1032
Freight 323.08 590.59 100 148.37
Siding Charges 9.85 0 0 0Marketing Cost 1850 3100 1750 1650
MSL Cost 206 206 206 206
Assessable Value 27830.93 30826.59 27616 28276.37
Excise Duty 2226.47 2466.13 2209.28 2262.11
Education Cess @3% on ED 66.79 73.98 66.28 67.86
Toll Tax 0 0 0 0Posted airfield price per KL (Exclusiveof Sales Tax and other Levies) 30124.2 33366.7 29891.56 30606.35
Furnace Oil (Rs./KI)
Ex-storage Point Price 17050 16600 16900
State Surcharge 105 191.6 375
Notional Railway Freight 286.36 0 0Assessable Value 17441.36 16791.6 17275
Excise duty + edu cess 2874.34 2767.26 2846.92
Total inclusive of excise duty + edu cess 20315.7 19558.86 20121.92
Sales Tax 812.63 2444.86 2515.24
Total 21128.32 22003.71 22637.16
Light Diesel Oil (Rs/KI)
Ex-storage Point Price 21090 21090 21090 21090
Stale Surcharge 25 370 121.28 455
Notional Railway Freight 254.63 340 0 0
Assessable Value 21369.63 21800 21211.28 21545
Excise duty + edu cess 3521.72 3592.64 3495.62 3550.62
Additional Levy alongwith cess 2575 2575 2575 2575Total Inclusive of Excise duty + educess 27466.35 27967.64 27281.9 27670.62
Sales Tax 3433.29 4754.5 3410.24 6917.65
Total 30899.64 32722.14 30692.14 34588.27Note : Selling price for Superior Kerosene Oil is for Public
Distribution System (PDS).Source: .Ministry of Petroleum & Natural Gas, Govt. of India. (downloaded from www.indiastat.com)
Table G4: Wholesale Price Indices of Crude Oil and Petroleum Products in India

7/31/2019 Competition in Petroleum Industry
http://slidepdf.com/reader/full/competition-in-petroleum-industry 52/56
49
(Base: 1993-94=100)
(2000-2001 and 2002-2003 to 2007-2008)
Products Weight (%) 2000-01 2002-03 2003-04 2004-05 2005-06 2006-07 2007-08*
Light Distillates
LPG 1.83731 248.2 284 285.5 316 334.8 334.8 334.8
Petrol 0.88815 154.2 163.4 178.7 203.5 231.1 254.8 242.3
Naphtha 0.41885 294.7 256.5 315.6 432.1 530.4 615.9 694.4Middle Distillates
Kerosene 0.68928 270.2 359.7 359.2 357.9 357.6 357.6 357.6Aviation TurbineFuel 0.16953 144.2 135.7 149.3 174.1 228.7 262.6 272.7High Speed DieselOil 2.02034 228.8 273.5 300.4 360.4 430.4 468.2 451.6
Light Diesel Oil 0.16015 232.2 233 284.6 366.3 445.3 491.1 491.2
Heavy Ends
Furnace Oil 0.49335 203.5 179.7 227.2 265.5 347.4 393.2 438.4
Lubricating Oil 0.16367 142.6 154.7 163.8 189.3 194.5 248.8 275
Bitumen 0.149 203.5 207.6 251.2 267.4 288 421.7 479
All Commodities 100 156.7 166.8 180.3 189.5 197.2 210.4 215.7Note : * : Provisional.Source: .Ministry of Petroleum & Natural Gas, Govt. of India. (downloaded from www.indiastat.com)
Table G5: Duty Structure of Central Government on Petroleum Products in India
(As on November, 2007)
ItemsBasic
CustomsDuty
CentralExcise Duty
Cess/SpecialAdditional
Excise Duty
Crude 5% NilRs. 2500 per
tonne
Rs.2 per litre+
Petrol (MS) 7.50% 6%+Rs. 5/litre Rs. 6 per litre
Diesel (HSD) 7.50%6%+Rs.
1.25/litre Rs. 2/litre
LDO 10% 16%+Rs.2.5/litre -
Naphtha 5% 16% -
LPG domestic Nil Nil -
LPG 5% 8% -
SKO PDS Nil Nil -
SKO 10% 16% -
LNG 5% Nil -OtherProducts 10% 16% -
Source : Rajya Sabha Starred Question No. 77, dated on 20.11.2007.(downloaded from www.indiastat.com )
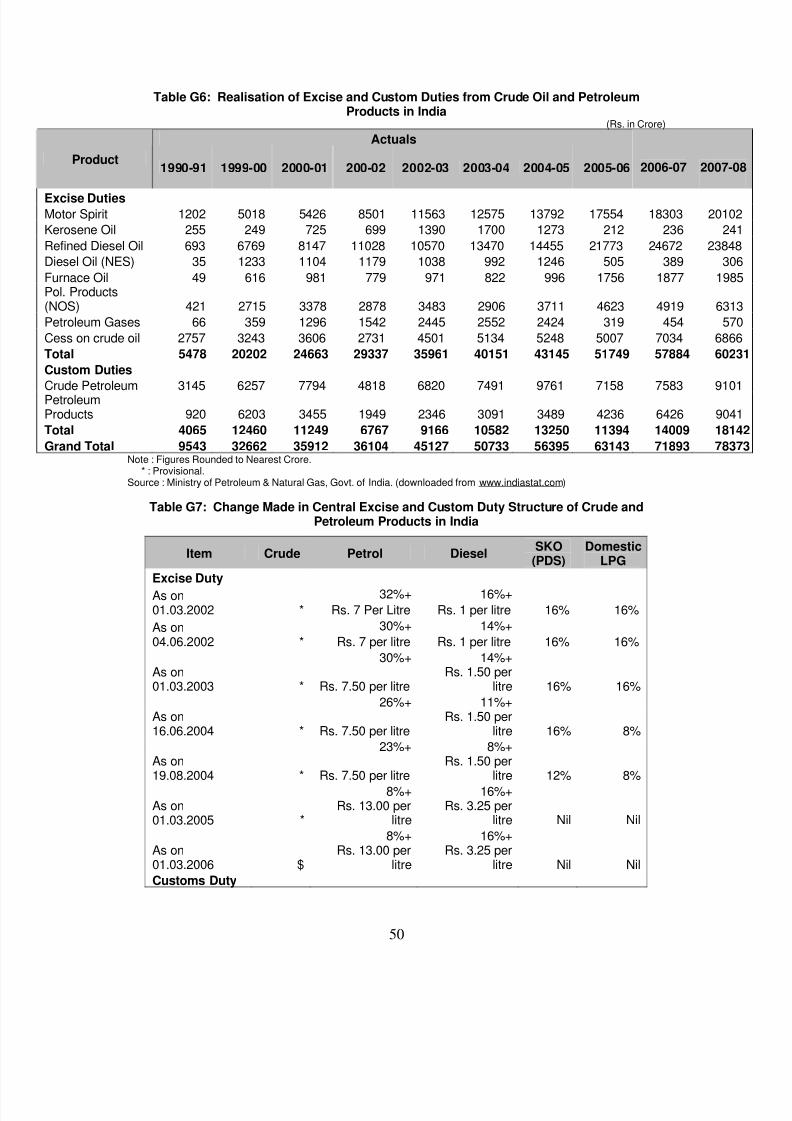
7/31/2019 Competition in Petroleum Industry
http://slidepdf.com/reader/full/competition-in-petroleum-industry 53/56
50
Table G6: Realisation of Excise and Custom Duties from Crude Oil and PetroleumProducts in India
(Rs. in Crore)
Actuals
Product1990-91 1999-00 2000-01 200-02 2002-03 2003-04 2004-05 2005-06 2006-07
2007-
Excise Duties
Motor Spirit 1202 5018 5426 8501 11563 12575 13792 17554 18303 201
Kerosene Oil 255 249 725 699 1390 1700 1273 212 236 2
Refined Diesel Oil 693 6769 8147 11028 10570 13470 14455 21773 24672 238
Diesel Oil (NES) 35 1233 1104 1179 1038 992 1246 505 389 3
Furnace Oil 49 616 981 779 971 822 996 1756 1877 19Pol. Products(NOS) 421 2715 3378 2878 3483 2906 3711 4623 4919 63
Petroleum Gases 66 359 1296 1542 2445 2552 2424 319 454 5
Cess on crude oil 2757 3243 3606 2731 4501 5134 5248 5007 7034 68
Total 5478 20202 24663 29337 35961 40151 43145 51749 57884 602
Custom Duties
Crude Petroleum 3145 6257 7794 4818 6820 7491 9761 7158 7583 91PetroleumProducts 920 6203 3455 1949 2346 3091 3489 4236 6426 90
Total 4065 12460 11249 6767 9166 10582 13250 11394 14009 181
Grand Total 9543 32662 35912 36104 45127 50733 56395 63143 71893 783Note : Figures Rounded to Nearest Crore.
* : Provisional.Source : Ministry of Petroleum & Natural Gas, Govt. of India. (downloaded from www.indiastat.com)
Table G7: Change Made in Central Excise and Custom Duty Structure of Crude andPetroleum Products in India
Item Crude Petrol DieselSKO(PDS)
DomesticLPG
Excise Duty
32%+ 16%+As on01.03.2002 * Rs. 7 Per Litre Rs. 1 per litre 16% 16%
30%+ 14%+As on04.06.2002 * Rs. 7 per litre Rs. 1 per litre 16% 16%
30%+ 14%+As on01.03.2003 * Rs. 7.50 per litre
Rs. 1.50 perlitre 16% 16%
26%+ 11%+As on16.06.2004 * Rs. 7.50 per litre
Rs. 1.50 perlitre 16% 8%
23%+ 8%+
As on19.08.2004 * Rs. 7.50 per litre
Rs. 1.50 perlitre 12% 8%
8%+ 16%+As on01.03.2005 *
Rs. 13.00 perlitre
Rs. 3.25 perlitre Nil Nil
8%+ 16%+As on01.03.2006 $
Rs. 13.00 perlitre
Rs. 3.25 perlitre Nil Nil
Customs Duty
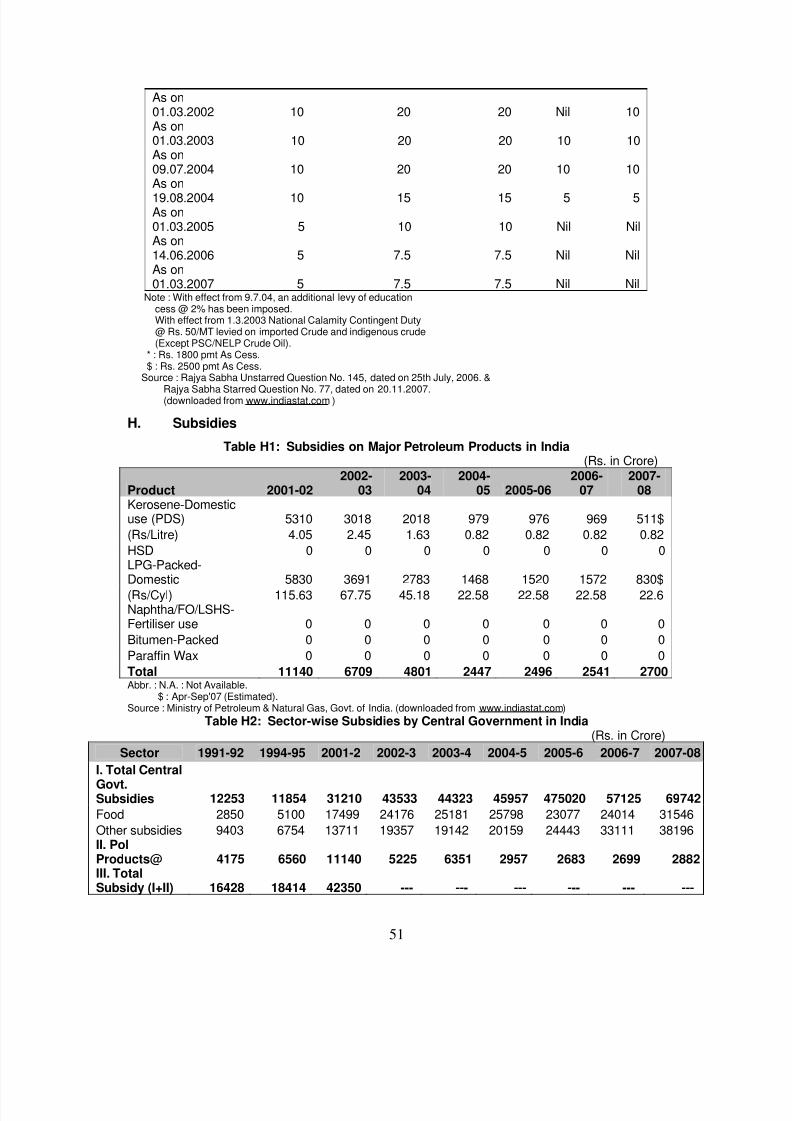
7/31/2019 Competition in Petroleum Industry
http://slidepdf.com/reader/full/competition-in-petroleum-industry 54/56
51
As on01.03.2002 10 20 20 Nil 10As on01.03.2003 10 20 20 10 10As on09.07.2004 10 20 20 10 10
As on19.08.2004 10 15 15 5 5As on01.03.2005 5 10 10 Nil NilAs on14.06.2006 5 7.5 7.5 Nil NilAs on01.03.2007 5 7.5 7.5 Nil Nil
Note : With effect from 9.7.04, an additional levy of educationcess @ 2% has been imposed.With effect from 1.3.2003 National Calamity Contingent Duty@ Rs. 50/MT levied on imported Crude and indigenous crude(Except PSC/NELP Crude Oil).
* : Rs. 1800 pmt As Cess.$ : Rs. 2500 pmt As Cess.
Source : Rajya Sabha Unstarred Question No. 145, dated on 25th July, 2006. &Rajya Sabha Starred Question No. 77, dated on 20.11.2007.(downloaded from www.indiastat.com )
H. Subsidies
Table H1: Subsidies on Major Petroleum Products in India(Rs. in Crore)
Product 2001-022002-
032003-
042004-
05 2005-062006-
072007-
08Kerosene-Domesticuse (PDS) 5310 3018 2018 979 976 969 511$
(Rs/Litre) 4.05 2.45 1.63 0.82 0.82 0.82 0.82
HSD 0 0 0 0 0 0 0
LPG-Packed-Domestic 5830 3691 2783 1468 1520 1572 830$
(Rs/Cyl) 115.63 67.75 45.18 22.58 22.58 22.58 22.6Naphtha/FO/LSHS-Fertiliser use 0 0 0 0 0 0 0
Bitumen-Packed 0 0 0 0 0 0 0
Paraffin Wax 0 0 0 0 0 0 0
Total 11140 6709 4801 2447 2496 2541 2700Abbr. : N.A. : Not Available.
$ : Apr-Sep'07 (Estimated).Source : Ministry of Petroleum & Natural Gas, Govt. of India. (downloaded from www.indiastat.com)
Table H2: Sector-wise Subsidies by Central Government in India
(Rs. in Crore) Sector 1991-92 1994-95 2001-2 2002-3 2003-4 2004-5 2005-6 2006-7 2007-08
I. Total CentralGovt.Subsidies 12253 11854 31210 43533 44323 45957 475020 57125 69742
Food 2850 5100 17499 24176 25181 25798 23077 24014 31546
Other subsidies 9403 6754 13711 19357 19142 20159 24443 33111 38196II. PolProducts@ 4175 6560 11140 5225 6351 2957 2683 2699 2882III. TotalSubsidy (I+II) 16428 18414 42350 --- --- --- --- --- ---

7/31/2019 Competition in Petroleum Industry
http://slidepdf.com/reader/full/competition-in-petroleum-industry 55/56
52
IV. PolSubsidy as %of TotalSubsidy 25.41 35.63 26.3 12 14.33 6.43 5.65 4.72 4.13
Abbr. : RE : Revised Estimate.Note : @ : These do not form part of Govt. Budget upto 2001-02.Source : Ministry of Petroleum & Natural Gas, Govt. of India. (downloaded from www.indiastat.com)
I. Financials
Table I 1: Profit After Tax (PAT) of Oil PSUs in India(Rs. in Crore)
Company 2001-02 2002-03 2003-04 2004-05 2005-06 2006-07
Upstream Oil Cos.
ONGC 6197.88 10529.3 8664.4 12983.05 14430.78 15642.92
IOCL - - - 4891 4915 7499
BPCL - - - 965.8 291.65 1805.48HPCL - - - 1277.33 405.63 1571.17GAIL 1185.83 1639 1869.34 1954 2310 2387
OIL 525.22 916.73 949.7 1061.68 1689.93 1639.99
Sub Total 7908.93 13085.03 11483.44 23132.86 24042.99 30545.56
Integrated Oil Cos.
IOC 2884.66 6114.89 7004.82 4891.38 889.66* -
HPC 787.98 1537.36 1903.94 1277.33 -1607.78* -
BPC 849.83 1250.03 1694.57 965.8 -1658.60* -
IBP 195.79 87.75 214.66 58.87 -520.83* -
Sub Total 4718.26 8990.03 10817.99 7193.38 -2897.55* -Stand AloneRefineries
KRL 68.77 456 555.09 842.12 220.60* -
MRPL -492.48 -411.81 459.42 879.76 401.10* -
NRL 122.98 174.63 214.95 409.15 273.65* -
CPCL 63.71 302.89 400.05 596.97 451.70* -
BRPL -198.61 178.45 303.74 478.3 144.11* -
Sub Total -435.63 700.16 1933.25 3206.3 1491.16* -
Total-PSU 12191.56 22775.22 24234.68 26398.34 13193.84* -Source : Ministry of Petroleum & Natural Gas, Govt. of India. &
Lok Sabha Starred Question No. 333, dated 06.09.2007.(downloaded from www.indiastat.com )
Table I2: Financial performance of petroleum refining companies in India
(in Rs Crore)
SalesCompensation to
employeesPBDITA PAT NetworthCompany
NameMar-06 Mar-07 Mar-06 Mar-07 Mar-06 Mar-07 Mar-06 Mar-07 Mar-06 Mar-07
BharatPetroleumCorpn. Ltd. 85149.62 107452.27 881.61 1003.70 1447.80 4142.18 291.61 1805.38 9139.42 10273.53BongaigaonRefinery &Petrochemicals 6454.17 6565.14 112.63 142.89 314.98 328.96 174.76 184.98 871.64 974.80

7/31/2019 Competition in Petroleum Industry
http://slidepdf.com/reader/full/competition-in-petroleum-industry 56/56
Ltd.
ChennaiPetroleumCorpn. Ltd. 25476.71 29425.54 96.82 150.63 1134.35 1306.88 480.96 565.27 2281.53 2637.74
Essar Oil Ltd. 649.27 475.77 18.32 12.32 -83.83 -45.33 -93.68 -67.49 2520.73 2805.74H P C L-MittalEnergy Ltd. 0.00 0.00 0.00 0.00 0.00 0.00 0.00 0.00 300.00 338.94
HindustanPetroleumCorpn. Ltd. 77526.39 97647.13 695.62 731.23 1394.09 3522.89 405.55 1570.98 8735.62 9598.65Indian OilCorpn. Ltd. 199430.91 250380.17 1860.19 2620.86 9886.94 14617.69 4914.36 7498.56 29302.67 34857.29KochiRefineries Ltd.[Merged]MangaloreRefinery &PetrochemicalsLtd. 28242.86 32208.13 47.96 55.20 1190.91 1629.22 371.62 525.52 2395.34 2756.80Nagarjuna OilCorpn. Ltd. 0.00 0.00 0.00 0.00 0.00 0.00 0.00 0.00 592.01 684.51NumaligarhRefinery Ltd. 5809.64 7917.45 38.43 48.50 649.80 761.28 448.93 568.80 1691.33 2044.97Petro Energy
Products Co.India Ltd.RelianceIndustries Ltd. 89124.46 118353.71 978.45 2094.05 14990.01 20532.13 9069.34 11943.91 49804.26 63967.13ReliancePetroleum Ltd. 0.00 0.00 0.00 0.00 0.00 0.00 0.00 0.00 3150.00 13448.82
Source: Prowess CMIE
***