complete proposal
TRANSCRIPT

1600 W Fox Park Dr
West Jordan, UT Build-to-suit Charter School Development
By Catherine Harmon
1 | P a g e
TABLE OF CONTENTS
What’s inside…
How to navigate through this RFP
contents
Introduction of the project
EXECUTIVE SUMMARY
Feasibility/High and best use analysis of the site
SITE SELECTION
Demand and supply analysis of schools in the market area
Market condition
Cost analysis, proforma and show me the money
Investment opportunities
Enough talking. Let’s do it!
Conclusion
Want more details
Supplemental info

2 | P a g e
EXECUTIVE SUMMARY
PROJECT OVERVIEW:
The Jordan Arts Academy development is a proposed build-to-suit charter school project. The project will
reuse/repurpose an existing Carmike Movie Theater. The proposed school will accommodate a total of 700
students from grade K through 8. Construction/renovation is expected to begin in January of 2015 with eight
months of total construction time (complete by August 30, 2015).
SITE:
• 6.9 acre site, located on 1600 West Fox Park Drive in West Jordan, Utah.
• East-west access through 9000 South roadway; north-south access through Redwood Road or the nearby
Freeway I-15.
• Existing building is one level, 50,000 gross SF with a 20-foot ceiling.
• PC Zoning (Planned Community); Conditional Use - no onerous conditions that would inhibit the use of a
school on this site.
• All utilities are available on the site
• No environmental concerns on the site based on current use as a cinema
• Currently listed for sale; will accept an offer of $3 million; closing by November 25, 2014.
MARKET:
• Rapid student population growth in Jordan School District
• $495,000,000 Jordan School District Facilities Bond proposal was rejected by voters
• Charter schools in Jordan School District have students on waiting list sufficient to fill double of the
current charter school capacities.
• Grade K-8 current enrollment is above 120% of building capacity within 2.5 miles radius of the site.
• The demand of school seats is expected to increase to 158% by 2020 in the 2.5 mile radius of the site.
3 | P a g e
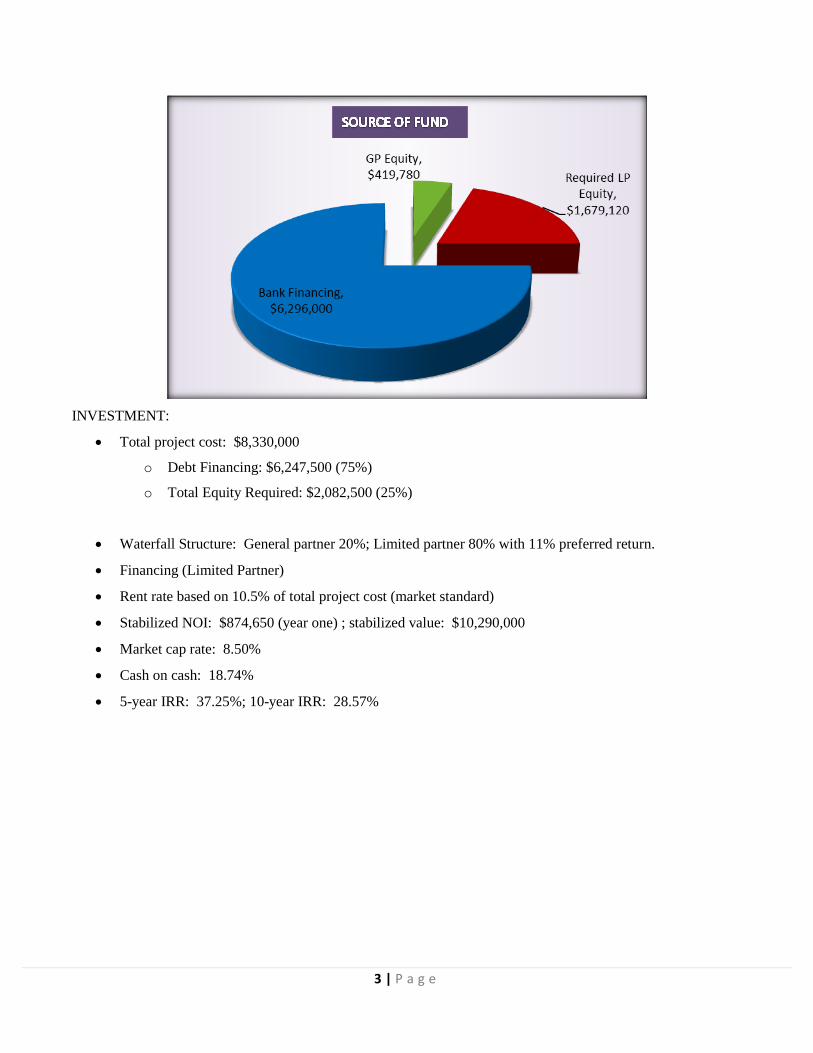
INVESTMENT:
• Total project cost: $8,330,000
o Debt Financing: $6,247,500 (75%)
o Total Equity Required: $2,082,500 (25%)
• Waterfall Structure: General partner 20%; Limited partner 80% with 11% preferred return.
• Financing (Limited Partner)
• Rent rate based on 10.5% of total project cost (market standard)
• Stabilized NOI: $874,650 (year one) ; stabilized value: $10,290,000
• Market cap rate: 8.50%
• Cash on cash: 18.74%
• 5-year IRR: 37.25%; 10-year IRR: 28.57%

4 | P a g e
SITE SELECTION
LOCATION:
The site selected is located at 1600 W Fox Park Dr., West Jordan, UT. The site is a 6.89 acre parcel with an
existing one-story, 50,000 gross square foot building, which is currently used as a movie theater (Carmike 12).
The building has 12 screens, a ticket sales area, a lobby with concession area, a manager’s office, employee
lounges, bathrooms, and janitor closets, which was constructed in 1995. The site is fully landscaped with over
400 surface parking stalls. The site also has well-maintained curbing and sidewalks. The property is currently
listed for $3.4 million.
ZONING:
The site is zoned P-C (Plan Community) under the West Jordan City Municipal Code. The current use is
conditional use (a movie theater). West Jordan City Ordinance indicates the use of a school on the subject site is
“conditional use” (as all schools are conditional use in any types of zoning). Preliminary meeting with West
Jordan City planners determined that the use of a school on the site will be conditioned based on access and
parking. West Jordan City planners also mentioned the use of subject site other than existing use (a movie
theater) will be more than likely to require additional approval from the planning department.
There are no onerous conditions that would inhibit construction of a school on this site and a conditional use for a
school under certain design aspects is considered to be easily achievable.
Site

5 | P a g e
NEIGHBORHOOD AREA:
Subject site is adjacent to various types of land uses (please refer to the map in the following page):
North: Subject site is directly adjacent to a neighborhood shopping center, including some local discount big box
stores such as ShopKo and Asian City.
West: Several restaurants, such as Winger’s, Flavors of India, and Fortune Buffets, are directly on the west side
of subject.
North and East: Stonebridge Apartments are multi-family residential complex adjacent to the south and east of
the subject site.
Single family residents are mostly located in about half of a mile around the subject site. The residential
developments in the area are mixed with new and old developments, and their prices range from $200,000’s to
well over $500,000. The immediate surroundings of the subject site are mostly built out. The recent built single
family residences in around the subject site are custom homes. Most of the new single family residential
Site

6 | P a g e
developments are proposed along 5600 West Road, which is more than 2 miles west of the subject site, as the
population in West Jordan continues to grow.
NEIGHBORHOOD ACCESS
The primary arterial streets within or near the subject’s neighborhood include:
North-south arterials: Redwood Road and Interstate 15
East-west arterials: 9000 South, and 9800 South
The subject is roughly equidistant from Redwood Road and the 9000 South.
Interstate 15 and Interstate 80 are the major north/south and east/west freeway transportation systems
respectively. Interstate 15 and Interstate 80 are the primary means of interstate motor travel. These two interstates
intersect just south of Salt Lake City.
The following map shows the access from and to the site:
ENVIROMENTAL:
The site was evaluated for environmental conditions that might complicate or prohibit the development of any of
the parcels. This evaluation did not uncover any major environmental concerns in the following areas:
Wetlands: The site does not contain any wetlands that are registered in the National Wetlands Inventory (NWI).
Floodplain: A review of the FEMA Flood Maps revealed that the site is not within any major flood zone.
Faultline: The property does not overlay any of the valley’s major fault lines.
9000 South
Site

7 | P a g e
Liquefaction: The site’s soils have a moderate level of liquefaction potential. This rating is not uncommon in the
area, but a proper geotechnical and structural engineer should be consulted prior to development of the site.
Contamination: Based on West Jordan City Environmental Map, no known environmental contamination was
ever discovered on the site. There’s no previous use except farming/grazing.
Environmental Phase I report will be ordered before land acquisition is finalized.
UTILITIES:
All utilities will be available through the following parties:
Utility Type Providers Address Phone #Water West Jordan City 8000 S. Redwood Rd., West Jordan, UT 801-526-6512Storm Sewer West Jordan City 8001 S. Redwood Rd., West Jordan, UT 801-526-6512Garbage/Recycling West Jordan City 8001 S. Redwood Rd., West Jordan, UT 801-526-6512Sanitary sewer West Jordan City 8002 S. Redwood Rd., West Jordan, UT 801-526-6512Electricity Rocky Mountain Power 201 S Main St. # 2300, SLC, UT 888-221-7070Gas Questar Gas PO Box 45360, SLC, UT 801-324-5517
Site

8 | P a g e
PHYSICAL PROPERTY LIMITATIONS:
There are no significant physical property limitations at this site. The terrain is generally flat and has been paved
with some landscaping. Curbing and sidewalks has been established when the existing building was constructed
in 1995. The existing building is a one story movie theater with gross square footage of 50,000.
HIGHEST AND BEST USE:
Legally Permissible: The charter school building will be a conditional use, based on access and parking, and will
be legally conforming development on the subject site.
Physically Possible: The site is an interior lot, irregular in shape. The street frontage provides adequate access to
the site. Drainage appears adequate and the site is not located in a flood zone. All utilities are available in
adequate quantity to serve several legally permissible uses. The frontage streets are in average condition. The site
is physically possible for the existing and other legally permissible uses.
Financially Feasible: Based on the subject’s specific location and physical characteristics, development of the site
with a school building that is complimentary to the surrounding land uses represents the most likely financially
feasible option.
Maximally Productive: A few uses may generate sufficient revenue to satisfy the required rate of return on
investment and provide a return on the land. However, residential uses will require complete demolition of the
existing building and construction of new ones, which will not be cost effective. Most retail tenant is seeking
frontage of major streets. The subject site, being in an interior lot, might have disadvantage on rent rate. The
building size will also be a challenge to find a single tenant retailer. Therefore, only the following uses are
considered:
• Movie Theater: The existing use of the site is a Carmike 12 movie theater, built in 1995. The
owner/operator of the theater has been struggling to make profit in the recent years as the theater becomes
outdated, in comparisons to the competitors like the Cinemark Draper (opened in 2011), the Megaplex in

9 | P a g e
the District (opened in 2006), the Cinemark 24 Jordan Landing (opened in 1999), and Jordan Commons
Megaplex (opened in 1999).
• Office Use: The existing building was constructed as a Class B/C building type and can be renovated to a
multi-tenant office building. To meet desirable profitability, the total cost cannot exceed $5 million as
month rent rate for a Class B/C office building in the area is averaged at $1.1/SF. With a low monthly
rent rate of $1/SF, the property may need more than 12 month absorption period to reach stabilization of
10% vacancy rate.
• Charter School: The tenant has agreed to pay a percentage of total cost of the development, as it is a
single tenant build-to-suit project. Based on the financial analysis in the next section, the charter school is
a maximally productive use for the subject site.
Based on the foregoing, the charter school building use meets the requirements of Highest and Best Use.

10 | P a g e
MARKET CONDITION
SUBJECT’S MARKET POSITION
The proposed site is located in the well-established area of West Jordan City. The market area is set to be 2.5
mile radius of subject site. The map below shows the neighborhood land use. The demographic within this radius
is predominantly middle income to upper-middle income. The improvements will also be located along an arterial
street in addition to close proximity to major highway interchanges. That location enhances the accessibility and
appeal.
SUBJECT’S PRIMARY MARKETING AREA
The proposed site is located in the well-established area of West Jordan City. The market area is set to be 2.5
mile radius of subject site. The following map illustrates the neighborhood land use within one -mile primary
target area:

11 | P a g e
The subject is generally within the one to 15 minute driving period of its target market. Typically schools will
capture the majority of its student population from within this radius. Due to the demand to enroll in these charter
schools, the property also has a secondary market. Due to the fact that the subject school specializing in visual
and performing arts, it is expected that some parents will drive their children from up to 30 minutes away.
Charter schools are independently operated public schools. They operate on public funds without tuition. The
market analysis is most focused on demand and supply of public schools and charter schools.
JORDAN SCHOOL DISTRICT:
Jordan School District projected the school enrollment will increase by more than 29,000 students in the next ten
years. In the attempt to meet the growing demand, Jordan School District proposed a half billion dollar bond to
fund new schools and renovate two existing schools. The bond proposal was voted down in November of 2013
and Jordan School District has no further plans to build any additional schools at this time.
The map below identifies the boundaries, precincts and schools (flags and dots) of Jordan School District. As
shown, the Jordan School District covers a large territory. The west side of the district is experiencing a
tremendous growth in population. However, there are no schools on the west of the map to support the growth.
Site

12 | P a g e
WEST JORDAN CITY:
According to 2010 US Census, West Jordan is the 4th largest city in Utah according to the 2010 Census, behind
Salt Lake City, Provo and West Valley. The City has experienced an over 60% population growth since 2000.
West Jordan’s populations were 108,383 and 110,551 in 2012 and 2013, respectively. The growth trend appears
to continue for West Jordan City.
DEMAND ANALYSIS:
Current elementary school and middle school enrollments are at 120% capacity in West Jordan area. Jordan
School district has been adding over 260 “portable classrooms” to every school in the district, in the attempt to
alleviate the excess capacity. The School District recently added double sessions - AM/PM schools. The AM
session will go from 6am to noon and PM session will go from 1pm to 7pm.
The City projects strong growth with over 126,000 residents in 2020 and over 155,000 residents by 2030. The
home ownership rate is high at 77.5% and persons per household are 3.44, comparing to the average of 3.09
persons per household of the State. With West Jordan City’s growth plan with an average of 3.41 residents per
household, the City will need 4,800 new housing units. An average of .97 students per household will result in
4,656 additional students. According to US Censes, approximately 78.3% of school age children in West Jordan
are elementary and middle school ages, as of 2010. At this rate, 3,295 of new students will be added to the
existing overcrowded schools.
Based on the existing excess enrollments of $1,721 students and a projected growth of 3,295 students by 2020, the
elementary school and middle school enrollments are expected to be at 168%.
13 | P a g e
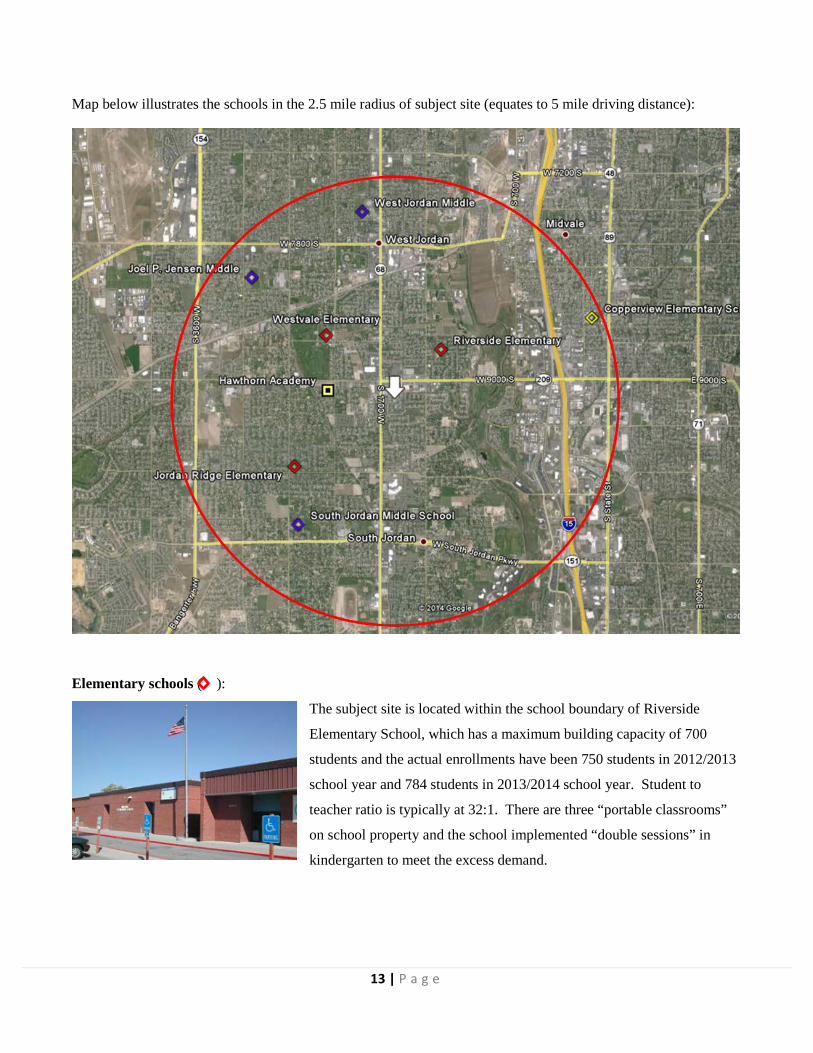
Map below illustrates the schools in the 2.5 mile radius of subject site (equates to 5 mile driving distance):
Elementary schools ( ):
The subject site is located within the school boundary of Riverside
Elementary School, which has a maximum building capacity of 700
students and the actual enrollments have been 750 students in 2012/2013
school year and 784 students in 2013/2014 school year. Student to
teacher ratio is typically at 32:1. There are three “portable classrooms”
on school property and the school implemented “double sessions” in
kindergarten to meet the excess demand.

14 | P a g e
Westvale Elementary School is approximately 1 mile northwest of the
subject site. It also has the maximum building capacity of 700 students
and actual enrollment was 842 students in 2012/2013 school year with a
33.4:1 student to teacher ratio. There are four “portable classrooms” on
school property to meet the excess demand.
Jordan Ridge Elementary School is approximately 1.3 mile southwest of
the subject site. The school has a maximum building capacity of 800
students and the actual enrollment has been as many as 1,130 students in
2012/2013 school year. There are eight “portable classrooms” on school
property with double sessions scheduling to meet the overwhelmingly
high demand.
Middle Schools ( ):
The subject site is within the school boundary of West Jordan Middle
School, which is approximately 2 miles north of the site. West Jordan
Middle School has a maximum of 950 student capacity. The current
enrollment is 969 students for the 2013/2014 school year, incorporating
three “portable classrooms” on the school property to meet the excess
demand.
South Jordan Middle School is the closest middle school to the subject
site (approximately 1.75 miles southwest). South Jordan Middle School
has a maximum building capacity of 1,400 students and the actual
enrollments were 1,582 students in 2013/2014 school year. The school
added four “portable classrooms” on school property to meet the excess
demand.
Joel P. Jensen Middle School is approximately 2 miles northwest of the
subject site. The school has a maximum of 750 student capacity and the
current enrollment is 850 students for the 2013/2014 school year. School
uses three “portable classrooms” to meet the excess demand.

15 | P a g e
Charter Schools (: ):
Hawthorn Academy is a K-8 charter school which is located
approximately 0.75 miles west of the subject site. Hawthorn Academy
has met its maximum enrollment capacity of 700 students since they
open in 2012. As of Spring 2014, there are over 1,000 students on the
waiting list to get in Hawthorn Academy.
Other Schools:
Copperview Elementary School is a public elementary school in Canyon School District, which is approximately
2.5 miles northeast of the subject site. The school is currently operated at its full capacity of 700 students.
SUPPLY ANALYSIS
COMPETITIONS:
The schools within 2.5 miles radius of the subject site are mostly overcrowded or like Hawthorn Academy that
has a long waiting list. Therefore, they are not considered as competitions. Instead, the proposed charter school
can potentially draw students from the excess demand of the surrounding schools.
Private Schools:
Challenger School is a well-known K-8 private school and has a West Jordan location, which is located directly
across the street from Westvale Elementary School (about 1 mile northwest from subject site). The Challenger
School West Jordan location only serves for pre-k to first grade with current enrollment of 60 full-time and part-
time students. This West Jordan location serves more like a daycare center than a school.
The demographic that private schools serve is different than what the public or charter schools may serve, as
private schools charge tuition ranges from $5,000 to $10,000 per year. However, charter schools often offer an
additional education option that the private school was able to offer without charging tuitions. Private schools can
be a source of potential demand.

16 | P a g e
FUTURE SUPPLY:
Due to the fact that Jordan School District is unable to increase funding, it is not likely to build additional schools
in the School District. Since the bond proposal was vote down in November of 2013, Jordan School District has
no future plan to raise funds.
Based on the list of charter schools approved to open in 2014/2015, no charter schools are expected to build
within 5 miles of the subject site. The newly constructed charter schools typically select their site in the aural area
where land is inexpensive. The subject site is located in an existing established area, where the land is pricey and
infill is usually more challenging.
LEASE RATES
Lease rates will vary depending upon the school property itself. Newly constructed properties usually have a cost
based formula that includes an entrepreneurial profit for the developer. Lease rates have been in a rough range
from $12.50 to $21.00 per square foot, depending upon the size and type of facility. One school on the upper end
of the range is chartered for autistic children and has a smaller building size, much smaller classrooms, and
several specialty features. Current median lease rates are generally in the $14.00 to $16.50 per square foot range
dependent upon location, building type (elementary versus high school), and land acquisition costs.
DEMAND AND SUPPLY INTEGRATION
Market demand in overall student enrollment continues to increase and is not likely to dissipate any time in the
near term. Population and household growth continues to increase, even though there is currently a slowdown in
the previous rapidity of single family housing growth. New schools cannot be speculatively built and must be
authorized by the State prior to granting the charter. Thus the possibility of oversupply of product is impossible
since the State limits the growth of the product. Cities and municipalities cannot deny the construction of a charter
school but do have building code compliance responsibilities over the project. “Circuit breakers” and/or
mechanisms are in place to constrain the growth of charter schools as a quality control method by the State of
Utah. The growth in parental choice and oversight continues to increase.
ABSORPTION / STABILIZATION
Charter schools are build-to-suit structures and are stabilized upon completion. Unless there are significant
construction delays, the student population is also stabilized upon completion. To avoid such as situation, the
selection of experienced general contractor is critical.

17 | P a g e
INVESTMENT OPPORTUNITIES
COST
Project costs are detailed in the table. Total project cost is budgeted for $8,330,000, consisting of $3,000,000 for
the land existing building, $4,222,336 hard cost, 929,539 soft cost and $178,125 interest reserve.
Costs/ TOTALSF BUDGET %
LAND/ACQUISITION COSTSLand with existing building $60.0 $3,000,000 $0 $3,000,000
TOTAL LAND/ACQUSITION COST $10.0 $3,000,000 36% $0 $3,000,000
HARD COSTSConstruction Costs $68.0 $3,400,000 $1,832,500 $1,567,500Site Preparation $1.8 $438,487 $0 $438,487Hard Cost Contingency (10%) $7.7 $383,849 $0 $383,849SUBTOTAL HARD COSTS $84.4 $4,222,336 51% $1,832,500 $2,389,836
SOFT COSTSA&E Consultants (5%) $3.8 $191,924 $0 $191,924Permits and Fees $4.5 $224,344 $0 $224,344Taxes $1.3 $64,989 $0 $64,989Financing Fees $1.9 $93,750 $0 $93,750Legal, Appr., Enviro, etc $1.2 $60,268 $0 $60,268Development Fees (3%) $5.0 $250,000 $250,000 $0Soft Cost Contingency (5%) $0.9 $44,264 $0 $44,264SUBTOTAL SOFT COSTS $18.6 $929,539 11% $250,000 $679,539
INTEREST RESERVE $3.6 $178,125 2% $0 $178,125TOTAL PROJECT $166.6 $8,330,000 $2,082,500 $6,247,500LOAN TO COST 25.0% 75.0%
LOAN
Jordan Arts AcademyGross Site Area of 6.9 Acres
EQUITY
EXISTING BUILDING COST (WITH LAND):
The site consists of 6.9 acres (300,564 SF) with an existing 50,000 SF Carmike cinema. The listing price of the
site is $3,400,000. After a series of negotiations, the property owner expressed interest to sell at no less than
$3,000,000 ($60/gross building SF, or $10/land SF).
HARD COSTS:
Construction Costs: Costs for the renovation of the existing building include adding new windows, re-
configuring floor plan, leveling the existing theater floor and other interior/exterior alternations. After meeting
with Kris Larson at Construction Control Corporation, he estimated the renovation of the building will range from
$65/SF to $70/SF. $68/SF is used for the construction cost in the cost budget.

18 | P a g e
Site Preparation: The subject site is completely finished as surface parking lot with curb and landscaping. The
parking lot on the west side of the building will be demolished with full landscape of soccer field and playground.
Sidewalk with trees will be added around the entire site with 6’ bamboo fences around the field and playground
on the west side of the building. The site improvement is typically $3/SF for an elementary school. Due to the
fact that the site has been improved and only need some alternation, the site preparation cost is estimated to be at
$1.80/SF for 250,564 SF (site minus building footprint).
Hard Cost Contingency: The project cost budget has been carefully analyzed. Due to the nature of the adaptive
reuse project, there might be undetermined complications within existing building. Therefore, 10% hard cost
contingency is budgeted in case of unforeseen construction obstacles during the construction.

19 | P a g e
SOFT COSTS:
Impact and Connection Fees: According to the West Jordan fee schedule: $2.058 per building SF for police and
fire, $15,101 per acre for storm drain, and $17,247 for water and sewer. The project is exempt from road fees.
State Inspection & 3rd Party Examiner: All schools must pass the State inspection process. Large school
districts usually have inspection staff. For charter schools, a certified, licensed, qualified inspector will be hired
for the duration of construction. A local inspector who has over 20 years of experience of specializing in school
construction inspections provided detailed cost information. The inspector fee is typically $35/hr for Civil/Public
works; $45/hr for Special Inspection; $55/hr for Code Compliance. The State of Utah, Division Facilities
Construction & Management sets their fees at $65 an hour. Therefore, $19,605 is budgeted for the 3rd party
inspector and additional $21,688 for other State Inspection Fee.
Tax: Tax is assessed based on the property value with tax rate of 1.452% (2013 tax rate).
Legal Fee: Real estate attorney, Brian Rosander, at Parsons, Behle & Latimer has completed a preliminary
review on the scope of the project and agreed to provide legal representation from the entitlement process to the
completion of the construction for $35,000 at a cost-plus basis.
Soft Cost Contingency: While there is high confidence in the soft cost budget, an additional 5% soft cost
contingency has been included to cover any unexpected occurrences.
INTEREST RESERVE:
A construction loan interest reserve is provided to pay for all construction loan interest during the construction
period. Based on a 60% average loan balance (total loan amount: $6,247,500) at 4.75% interest rate for 12
months, $178,125 is projected.
20 | P a g e
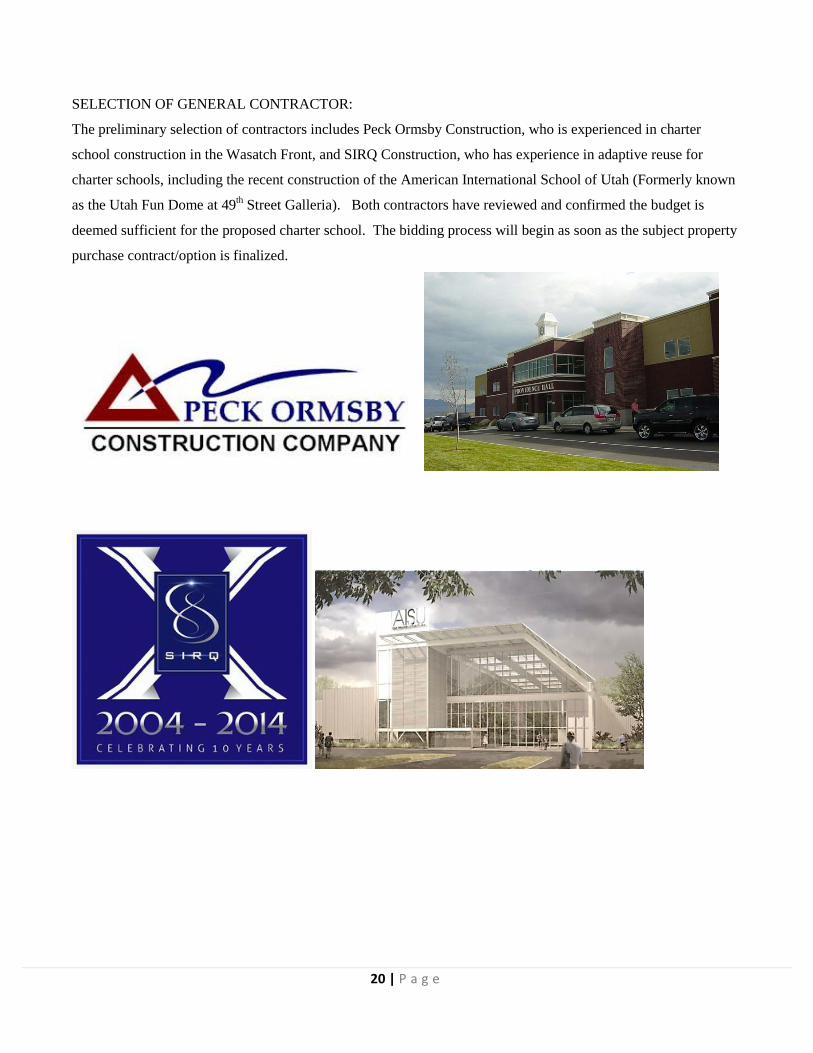
SELECTION OF GENERAL CONTRACTOR:
The preliminary selection of contractors includes Peck Ormsby Construction, who is experienced in charter
school construction in the Wasatch Front, and SIRQ Construction, who has experience in adaptive reuse for
charter schools, including the recent construction of the American International School of Utah (Formerly known
as the Utah Fun Dome at 49th Street Galleria). Both contractors have reviewed and confirmed the budget is
deemed sufficient for the proposed charter school. The bidding process will begin as soon as the subject property
purchase contract/option is finalized.

21 | P a g e
FINANCING:
Debt Financing: Based on information provided by Zions Bank, Bank of Utah and Key Bank, financing terms
on charter school construction loan will be:
• 75% loan to cost ratio
• 65% loan to value ratio
• Interest rate: 90-day Libor + 3.50% with a floor at 4.75%.
• Loan fee of 1.00% of loan amount
A mini-perm loan (one-time closing with construction loan) will be provided at the end of the construction loan
(based on issuance of the certificate of occupancy, as the project is a single tenant build-to-suit project). The
terms for mini-perm loans are:
• 20-year amortization
• 5-year term
• Interest rate: 90-day Libor + 2.75% with a floor at 4.75%.
• Loan fee of 0.50% of loan amount
Capital Structure: Total required equity for the Jordan Arts Academy project is expected to be $2,082,500. The
developer will hold 20% equity and anticipates raising $1,666,000 (80% of total equity) from outside investors.
All paid in equity will earn an 11% preferred return until the initial equity is returned to investors. After the
preferred return is reached, the remaining profits will be split 80/20 with outside investors (limited partners)
receiving 80% of the excess cash flows and us as the developer (general partners) receiving 20% of the excess
cash flows.
Partnership Type Party Name % Ownership
Preferred Return Distribution
$250,000 Deferred Dev. Fee$166,500 Cash
$2,082,500 100%
CAPITAL STRUCTURE
Initial Equity Contribution
General Partners CFH Group, LLC 20% None20% After
Preferred Paid
80% After Preferred Paid
Total Equity
Limited PartnersOutside Cash
Investors $1,666,000 Cash 80% 11.00%

22 | P a g e
DEVELOPER PROFORMA:
The proforma below is based on the presumption of sale in year 5 or year 10. According to several recent
appraisals, the cap rate for a charter schools in Salt Lake Valley is between 8.00% and 8.50% with a downward
trending. An 8.50% cap rate is used as going-in cap rate and exit cap rate in our proforma, as the cap rate for this
asset type has been relatively stable and has not been deeply compressed as multi-family assets in the market.
Site (Land & Existing Bldg) $3,000,000 Loan Amount $6,247,500 Holding Period (Year) 5Hard Costs $4,222,336 Loan to Value 65% Exit Cap Rate 8.50%Soft Costs $1,107,664 Loan to Cost 75% Asset Value at Sale $11,360,991
Total Cost $8,330,000 Interest Rate: Selling Costs 3.00%
Cost Yield (stabilized) 10.50% Construction Loan 4.75% Net Selling Price $11,020,161
Mini-perm Loan 4.75%
Stabilized Lease Income $874,650 Required Equity $2,082,500
Annual Income Escalation 2.00% Amortization (Months) 240 Stabilized Cash on Cash 18.74%
Operating Expenses $0 Annual Debt Service $484,474 Unlevered IRR 15.60%
Stabilized NOI $874,650 DSCR (Year 1) 1.81 x Levered IRR 37.25%
Project Costs
Income/Expenses
Sale
Investment & Return
DebtJordan Arts Academy
Cash Flow Projections Year 0 Year 1 Year 2 Year 3 Year 4 Year 5 Year 6 Year 7 Year 8 Year 9 Year 10 Year 11Gross Base Rental Income $0 $874,650 $892,143 $909,986 $928,186 $946,749 $965,684 $984,998 $1,004,698 $1,024,792 $1,045,288 $1,066,193
Vacancy $0 $0 $0 $0 $0 $0 $0 $0 $0 $0 $0 $0Effective Gross Income $0 $874,650 $892,143 $909,986 $928,186 $946,749 $965,684 $984,998 $1,004,698 $1,024,792 $1,045,288 $1,066,193Less: Operating Expenses $0 $0 $0 $0 $0 $0 $0 $0 $0 $0 $0 $0NOI $0 $874,650 $892,143 $909,986 $928,186 $946,749 $965,684 $984,998 $1,004,698 $1,024,792 $1,045,288 $1,066,193
Acquisition & Site Improv 3,000,000$ Construction Costs 5,330,000$
8,330,000$ Disposition Price $11,360,991Selling Costs ($340,830)Net Selling Price $11,020,161Unlevered Cash Flow ($8,330,000) $874,650 $892,143 $909,986 $928,186 $11,966,910Debt Service/Payoff ($484,474) ($484,474) ($484,474) ($484,474) ($5,674,903)Levered Cash Flow ($2,082,500) $390,176 $407,669 $425,512 $443,712 $6,292,007
Disposition Price $12,543,452Selling Costs ($376,304)Net Selling Price $12,167,148Unlevered Cash Flow ($8,330,000) $874,650 $892,143 $909,986 $928,186 $946,749 $965,684 $984,998 $1,004,698 $1,024,792 $13,212,436Debt Service/Payoff ($484,474) ($484,474) ($484,474) ($484,474) ($484,474) ($484,474) ($484,474) ($484,474) ($484,474) ($4,335,088)Levered Cash Flow ($2,082,500) $390,176 $407,669 $425,512 $443,712 $462,275 $481,210 $500,524 $520,224 $540,318 $8,877,348
Cash on Cash 18.74% 19.58% 20.43% 21.31% 22.20% 23.11% 24.03% 24.98% 25.95%Annual Debt Service at Market Rate $484,474 $484,474 $484,474 $484,474 $484,474 $484,474 $484,474 $484,474 $484,474 $484,474DSCR 1.81 1.84 1.88 1.92 1.95 1.99 2.03 2.07 2.12 2.16Annual Debt Service at Phantom Rate $558,956 $558,956 $558,956 $558,956 $558,956 $558,956 $558,956 $558,956 $558,956 $558,956DS at Phantom Rate 1.56 1.60 1.63 1.66 1.69 1.73 1.76 1.80 1.83 1.87
PROFORMA
The base year rental income is at 10.50% of total project cost, which is a market standard for the rental rate of a
charter school. The first year rental income is projected to be 874,860. There will be no operating expense as the
project is on a true triple net lease.
Initial debt will be in the form of a floating-rate, interest-only construction loan (interest payment has been
included in the construction budget as interest reserve). Upon receipt of Certificate of Occupancy, the
construction loan will be taken out by a mini-perm loan, which has an interest rate priced based on the 90-day
Libor index with 2.75% spread. For the purposes of this proforma, the mini-perm loan is projected to be a fixed-

23 | P a g e
rate at 4.75%, which is the floor interest rate, with 20 year amortization. Anticipating rising interest rates, the
proforma was tested with a phantom rate of 6.50%. With a phantom rate, first year debt service coverage will be
1.56x, which is above bank’s underwriting guideline. With increased interest rate at 6.50%, base year cash on
cash will be 15.16% and the levered IRR at year 5 will remain at an attractive rate of 34.03%.
DEVELOPER’S REVENUE:
The proposed project is a build-to-suit Charter School, which will be leased to Jordan Arts Academy, LLC. The
lease is a 20-year true NNN lease, and the first year lease rate is set to be 10.50% of project cost (200 basis points
above market cap rate), and it will include a 2% annual escalation. The first year lease income is projected to be
$874,650. The final lease income is to be determined, depending on the final project cost. However, first year
lease income is not exceed $939,862 (22% of tenant’s gross annual revenue). According to the industry standards
for schools, the facility rental expense or mortgage expense should not exceed 22% of total school revenue.
The lease will allow the tenant to have the option to purchase the facility after one year into the lease, which is
typical for charter school build-to-suit projects. Most tenants exercise the option to purchase facility after three
years of operations.
It is market standard in a charter school lease that the tenant has a first right option to purchase the property
should the developer decide to sell. The sale price will be determined at market price at the time of sale. It is not a
common to have a pre-determined purchase price in the lease contract.
SENSITIVITY ANALYSIS:
Given that we are in a low-rate environment, further tapering and expected rate increases could result in additional
pressure on investing in real estate (or other yield-sensitive securities). However, investors tend to take a
simplistic view that if interest rates rise, valuations must decrease in order for the property to maintain a similarly
competitive yield. In reality, there a lack of an apparent link between cap rates and interest rates. According to
the historical records, there also have been multiple periods when cap rates actually decreased as interest rates
spiked. Factors such as future cash flows, earnings growth, and economic health have proven to be more relevant
predictors of property values. In fact, higher rates are usually the result of an improving economy, which benefits
landlords.
Certainly, the rising rates warrant a reassessment of the expected returns of the proposed project. The interest rate
sensitivity analysis and capitalization rate sensitivity analysis are conducted as separate scenarios to determine
how projected performance is affected by changes in interest rate or changes in capitalization rate.

24 | P a g e
Interest Rate:
Rising interest rates have been the talk of Wall Street and Main Street. The changes in IRR based on the interest
rate movement are demonstrated in the interest rate sensitivity analysis table below:
• The baseline interest rate is at 4.75% (highlight in yellow)
• If the interest rate jumped to 6.75% in the near future, the10-year IRR is projected to be at 25.45%, which
is still an acceptable rate of return for this asset type.
Capitalization Rate:
The capitalization rate for the charter school asset type has been stable historically. The changes in IRR based
on the interest rate movement are demonstrated in the interest rate sensitivity analysis table below:
• The current capitalization rate for the charter school in this market is estimated between 8% and 8.5%,
based on several recent appraisals.
• Historically, the capitalization rate for this asset type had not gone above 10%.
• As a worst case scenario, if the capitalization rate rises to 10.5%, the 10-year IRR is projected to be at
26.40%, which is only about 2% less than the 10-year IRR generated by the baseline capitalization rate.
2 3 4 5 6 7 8 9 10
4.25% 64 .7 9% 49 .6 9% 42 .4 5% 38 .1 3% 35 .2 4% 33 .1 5% 31 .5 7% 30 .3 2% 29 .3 2%
4.75% 63 .6 3% 48 .6 6% 41 .5 0% 37 .2 4% 34 .3 9% 32 .3 4% 30 .7 8% 29 .5 5% 28 .5 7%
5.25% 62 .4 7% 47 .6 3% 40 .5 4% 36 .3 4% 33 .5 3% 31 .5 1% 29 .9 8% 28 .7 7% 27 .8 0%
5.75% 61 .2 9% 46 .5 8% 39 .5 7% 35 .4 2% 32 .6 6% 30 .6 7% 9 .1 6% 27 .9 8% 27 .0 3%
6.25% 60 .1 1% 45 .5 2% 38 .5 9% 34 .5 0% 31 .7 7% 29 .8 2% 28 .3 4% 27 .1 8% 26 .2 5%
6.75% 58 .9 2% 44 .4 5% 37 .6 0% 33 .5 6% 30 .8 8% 28 .9 5% 27 .5 0% 26 .3 7% 25 .4 5%
Interest Rate Sensitivity
Year(s) Invested
Inte
rest
Rat
e
2 3 4 5 6 7 8 9 10
8.0% 73 .4 2% 53 .8 7% 44 .8 0% 39 .5 3% 36 .0 7% 33 .6 1% 31 .7 7% 30 .3 4% 29 .2 0%
8.5% 63 .6 3% 48 .6 6% 41 .5 0% 37 .2 4% 34 .3 9% 32 .3 4% 30 .7 8% 29 .5 5% 28 .5 7%
9.0% 54 .3 8% 43 .6 8% 38 .3 4% 35 .0 5% 32 .8 0% 31 .1 3% 29 .8 4% 28 .8 2% 27 .9 7%
9.5% 45 .5 6% 38 .8 7% 35 .2 9% 32 .9 5% 31 .2 7% 29 .9 8% 28 .9 6% 28 .1 2% 27 .4 2%
10.0% 37 .1 1% 34 .2 2% 32 .3 3% 30 .9 2% 29 .8 0% 28 .8 9% 28 .1 2% 27 .4 6% 26 .8 9%
10.5% 28 .9 5% 29 .6 8% 29 .4 5% 28 .9 5% 28 .3 9% 27 .8 3% 27 .3 1% 26 .8 3% 26 .4 0%
Year(s) Invested
Cap
Rat
e
Cap Rate Sensitivity

25 | P a g e
TENANT’S REVENUE: On the whole, charter schools are funded much like traditional districts – with taxpayer dollars. Charter schools are
funded on the principle that state funds follow the student. The legislature appropriates funds each year to replace some of
the local property tax revenues that are not available to charter schools. Charter schools may also apply for state and
federal start-up funds and specialized funds if qualifying students are served in approved programs. Based on 2013 school
year average, the annual charter school revenue funded for grades K-8 is $5,973 per student. As a charter school
specializing in arts, the school is eligible for grants and other public funding assistance at an average of $220 per student
per year. Total income to the 700 student school, such as Jordan Arts Academy, is projected at $4,337,200. Based on the
current cost budget, the first year rent charged to Jordan Arts Academy will be $874,650, which will be 20.17% of total
annual revenue.
Grades K-8Average funds per student Standard Public School $5,973
Specialized Art Curriculum $223Combined Revenue $6,196Total Students 700 Total Annual Revenue $4,337,200Annual Rent $874,650Rent Expense/School Income Ratio 20.17%
SCHOOL REVENUE vs. FACILITY EXPENSE
THE STRENGTHS OF THE TENANT:
• The board of directors has been established and developed a professional business plan, complete with
clear policies for academic, facilities, administration, school’s operations, and outside professional
services. Essentially, the school will be operated like a business, knowing that it is competing for
students.
• The school’s location will be within or near a major metropolitan area.
• The school has retained legal counsel and CPA accountant services. The school board and the outside
services will have educational related experience and an arm’s length relationship.
• The school has adopted a curriculum based on rigorous academics and breadth of various types of arts.
• The school will have a sufficient senior administration with significant depth of experience in the
classroom and in administration. The school board and the director’s will have an arm’s length
relationship.
• The school will hire teachers and staff that are competent in their respective specializations, usually with
classroom experience.
Jordan
Academy

26 | P a g e
• The school’s board of directors has an arm’s length relationships with the property developer and school
staff.
• The school board will obtain an outsie management consultant, who will serve several purposes. First, the
outside management achieves operational economies of scale by formalizing school policies, updating
curriculum as needed, and service as a “firewall” between potentially disgruntled parents/student and
school administrators. Second, the outside management reduces staff’s time on administration matters,
permitting greater attention to the needs of the students. Services and fees are scalable depending upon
the needs of the school.
• The school has an initial and on-going marketing program. The school has a professional website that
outlines the school’s administration, school board, curriculum, policies, staff and faculty, hours of
operation, school calendar, enrollment and lottery policies, etc.
MARKET FINANCING - SCHOOLS
The schools prefer to purchase and directly own their properties for several reasons. First, they are usually able to
obtain favorable bond financing that results in a monthly payment less than their lease rate. Second, they are able
to “cap off” their monthly payment, removing facilities payment increases from the escalations within the lease.
Third, the remove the real estate tax payments. Since the properties are owned by the developer at the onset, the
developer passes the payment of real estate and personal property taxes to the school. When those expenses are
contained, the schools usually used those funds to increase teacher pay and benefits and acquire additional
equipment.
BOND FINANCING FOR UTAH CHARTER SCHOOL:
The Charter School Credit Enhancement Program assists qualifying charter schools in obtaining favorable
financing by providing a means of replenishing a qualifying charter school’s debt service reserve fund.
Participation in the program allows schools to obtain bond ratings that are 200-250 bps better than the underlying
rating of the Charter School.
Utah Charter School Finance Authority established criteria for charter schools to be designated as a “qualifying
charter school” for purposes of issuing bonds to purchase its facilities through the municipal bond market. The
basic criteria include:
• In compliance with all chartering requirements
• Must obtain an underlying investment grade rating from Fitch Ratings, Moody’s Investors Service, or
Standard & Poor’s (the State of Utah provides guaranty to qualifying Utah charter schools)
• Must demonstrate a stable financial operating history for at least three years

27 | P a g e
• Minimum enrollment of 400 students or demonstrate a large enrollment waiting list
• Enrollment has been stable or increasing
• Total re-enrollment rate is not less than 80%
• Academic performance must meet chartering standards
• School financial strength must meet financing standards
• The financial strength of individual school council members is NOT required.
EXIT STRATEGY
The primary exit strategy is to sell the project to Jordan Arts Academy in year 5. The lease agreement will allow
the tenant to purchase the facility after year one. However, to be qualified for bond financing, which is the
cheapest and best financing option for the school operators, the schools have to provide 3-year financial
performance. Charter school operators typically purchase their facility between year 3 and year 5 with financing
through the bond market. It is in the best interest of the school to purchase the facility, as the bond financing
provides more affordability of the facility. The non-profit tax exempt status will also allow the tenant to take
advantage of exempting from property tax if the tenant purchases the facility.
The secondary exit is to hold the asset beyond 5 years with refinance from institutional investment funds. Certain
institutional investors, i.e. specialty REITs, are looking to acquire charter school assets. EPR Properties (NYSE:
EPR), one of the specialty REITs in the Utah charter school market, has expressed interest based on the demands
for schools in Jordan School District.

28 | P a g e
CONCLUSION
The proposed project includes the following key elements that bear special mention:
• Greatly Under-served Market: There is rapid student population growth in Jordan School District, but
the District is completely restrained from building more schools for the demand due to voters’ rejection of
tax bond.
• Attractive Yield: The project will provide a cash-on-cash annual yield of/above 18.74% for the
investment. The estimated IRR over a period of 10 years is 28.57%.
• Controllable Exposure: The proposed Project business model has a defined path of key milestone
events that must be sustained for a successful outcome and this allows for a high degree of control over
the overall risk exposure of the opportunity.
• Long-term Lease (Prelease): A 20-year lease to an experienced school operator will be executed prior
to construction.
• Definitive Exit Strategy: The proposed Project has multiple exit strategies. The preferred exit strategy
relies upon a defined path of Bond financing for Utah Charter Schools.
• Experienced Project Team: The proposed Project will be managed at all levels by an experienced team
so the expectation for cost overruns and delays are quite limited in nature and scope.
To arrange to receive additional information, please contact Catherine Harmon at 801.330.1106 (CFH Group, LLC’s corporate office).

29 | P a g e
APPENDIX A
REAL ESTATE PURCHASE OPTION CONTRACT

30 | P a g e

31 | P a g e

32 | P a g e

33 | P a g e

34 | P a g e

35 | P a g e
APPENDIX B
LEASE ABSTRCT
Lessor: CFH Group, LLCLessee: Jordan Arts Academy, LLC
Initial or Current Lease TermCommencement Date*: August 15, 2015Beginning Period for Remaining Term of Lease August 15, 2015Term in Years: 20 yearsRemaining Years: 20 yearsExpiration: August 14, 2035
Lease Renewal Option(s)Remaining Number of Renewal Options: 2Number of Years for Each of the Option Periods: 15 yearsTotal Potential Option Period Years 30 years
Total Anticipated Years Remaining on LeaseTotal Potential Years Remaining on Lease: 50 yearsExpiration of the Lease, Incl. All Anticipated Option Years August 14, 2055
Purchase OptionOption Price: "Fair Market Value" to reflect lease continuationOption Date (Earliest Possible): After one full year of leaseComments: There is also a first right of refusal for the tenant
RentInitial-year Monthly Rent: $72,888Current Monthly Rent: $72,888Escalations Scheduled to Occur Based on: Contract AnniversaryRent Increases: 2%Comments:
Lease Summary
Starting rent is based on 10.50% of construction cost, which is market standard for the asset type and rent will increase at 2% each anniversary. (Constrcution cost is expected to be $8,330,000)

36 | P a g e
APPENDIX C
Building and Playground Rendering

37 | P a g e
APPENDIX D
FLOOR PLAN
38 | P a g e
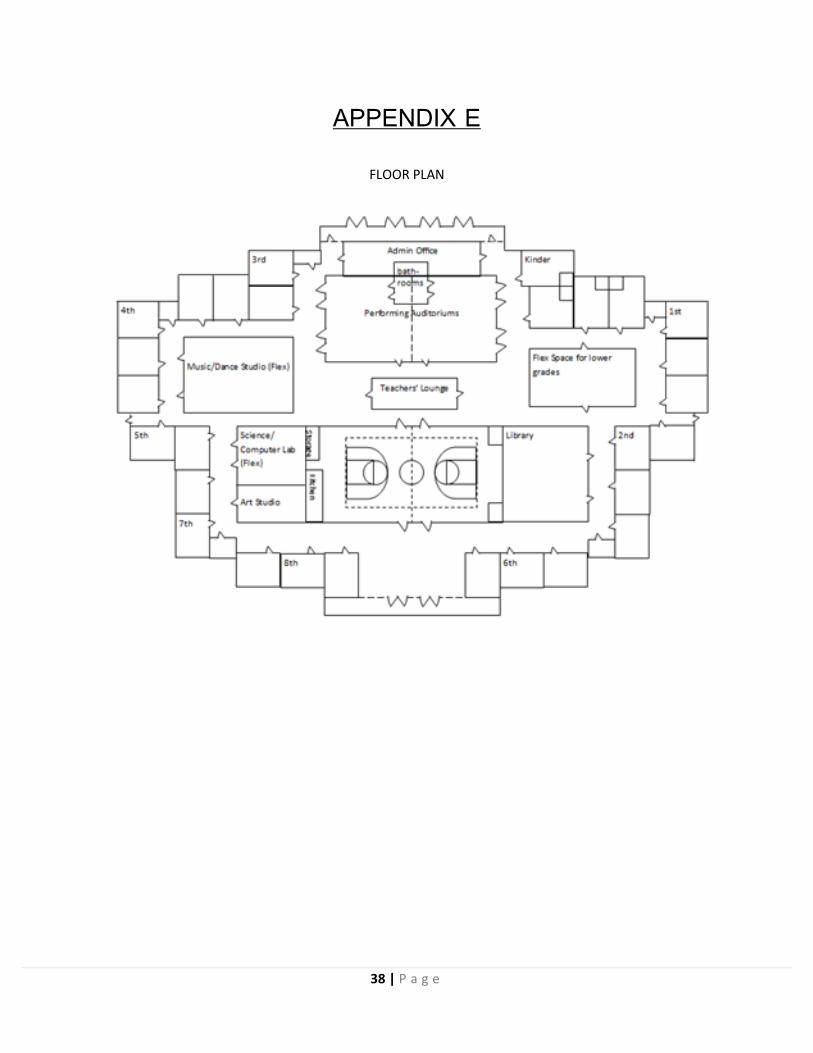
APPENDIX E
FLOOR PLAN