component b3.2. analysis of the current practice in the
TRANSCRIPT

Contract № ENPI/2014/350-889 B3.2 - Report on Software in the air management sector
Europe Aid/135512/DH/SER/BY
"Technical Assistance to Support the Development of Green Economy in Belarus"
Contract № ENPI/2014/350-889
COMPONENT B3.2. Analysis of the current practice
in the European Union related to the software
programs used for air emission assessment
Report on the analysis of different software
programs used in the EU
May 2016
Contract № ENPI/2014/350-889 B3.2 - Report on Software in the air management sector
HUMAN DYNAMICS-IDOM CONSORTIUM
Page 2 of 37
Component B.3.2 - Report on software in the air management sector
Проект: " Report on software in the air management sector "
Номер проекта: ЕNPI/2014/350-889
Страна: Беларусь
Адрес:
Hulla & Co Human Dynamics KG 13
Lothringer Strasse 16
A-1030 Wien
Austria
тел.: +359 2 935 99 80
факс: +359 2 935 99 70
Контактное лицо: Надя Бонева
Подписи:
Дата доклада: 09.06.2016
Авторы доклада: Raquel Navarrete
Проект выполняется консорциумом под
руководством Hulla and Co. Human Dynamics KG
Disclaimer. The content of this report does not reflect the official opinion of the European Union. Responsibility for the
information and views expressed lies entirely with the author(s).

Contract № ENPI/2014/350-889 B3.2 - Report on Software in the air management sector
HUMAN DYNAMICS-IDOM CONSORTIUM
Page 3 of 37
CONTENTS
LIST OF ABBREVIATIONS ............................................................................................................... 5
1 INTRODUCTION. ........................................................................................................................ 6
2 INVENTORY PREPARATION PROCESS. SITUATION IN EUROPE ..................................... 7
2.1 SPAIN .................................................................................................................................................... 7
2.1.1 Introduction ................................................................................................................................ 7
2.1.2 Methods and Data Sources ....................................................................................................... 7
2.1.3 Software ...................................................................................................................................... 8
2.2 BULGARIA.............................................................................................................................................. 8
2.2.1 Introduction ................................................................................................................................ 8
2.2.2 Methods and Data Sources ....................................................................................................... 9
2.2.3 Software ...................................................................................................................................... 9
2.3 PORTUGAL ........................................................................................................................................... 10
2.3.1 Introduction .............................................................................................................................. 10
2.3.2 Methods and Data Sources ..................................................................................................... 10
2.3.3 Software .................................................................................................................................... 13
2.4 DENMARK ............................................................................................................................................ 13
2.4.1 Introduction .............................................................................................................................. 13
2.4.2 Methods and Data Sources ..................................................................................................... 13
2.4.3 Software .................................................................................................................................... 15
2.5 GERMANY ............................................................................................................................................ 15
2.5.1 Introduction .............................................................................................................................. 15
2.5.2 Methods and Data Sources ..................................................................................................... 16
2.5.3 Software .................................................................................................................................... 17
2.6 GEORGIA ............................................................................................................................................. 17
2.6.1 Introduction .............................................................................................................................. 17
2.6.2 Methods and Data Sources ..................................................................................................... 17
2.6.3 Software .................................................................................................................................... 19
2.7 ITALY .................................................................................................................................................. 19
2.7.1 Introduction .............................................................................................................................. 19
2.7.2 Methods and Data Sources ..................................................................................................... 19
2.7.3 Software .................................................................................................................................... 19
3 AIR EMISSION INVENTORY SOFTWARE TOOLS ............................................................... 21
4 AIR DISPERSION SOFTWARE ............................................................................................... 23
4.1 AERMOD .............................................................................................................................................. 24
4.2 THOR................................................................................................................................................... 27
4.3 CHIMERE ............................................................................................................................................. 28
Contract № ENPI/2014/350-889 B3.2 - Report on Software in the air management sector
HUMAN DYNAMICS-IDOM CONSORTIUM
Page 4 of 37
5 AIR MANAGEMENT IN EUROPE ............................................................................................ 29
5.1 AIR MANAGEMENT SOFTWARE .............................................................................................................. 29
5.1.1 UKIAM model — United Kingdom .......................................................................................... 29
5.1.2 Regional integrated assessment tool plus (RIAT+) ............................................................ 30
5.1.3 GAINS ........................................................................................................................................ 34
5.1.4 GEM-E3 macro-economic model ............................................................................................ 34
6 CONCLUSION AND PROPOSAL OF FURTHER ACTIONS ................................................... 36
6.1 CONCLUSIONS ..................................................................................................................................... 36
6.2 PROPOSAL FOR BELARUS ...................................................................................................................... 37

Contract № ENPI/2014/350-889 B3.2 - Report on Software in the air management sector
HUMAN DYNAMICS-IDOM CONSORTIUM
Page 5 of 37
LIST OF ABBREVIATIONS
AELs Associated Emission Levels
BAT Best Available Technique
BDR Baseline Data Report
CA Contracting Authority
CBA Cost–benefit analysis
CLRTAP Convention on Long-range Transboundary Air Pollution
EMEP guidebook EMEP/EEA air pollutant emission inventory guidebook - 2013
ENPI European Neighbourhood and Partnership Instrument
EU European Union
GAINS) Greenhouse gas and Air pollution Interactions and Sinergies
Protocol Gothenburg Protocol
CEIP Centre on Emission Inventories and Projections
ToR Terms of Reference
IIR Informative Inventory Report
CLRTAP Convention on Long-Range Transboundary Air Pollution
EMEP European Monitoring and Evaluation Programme
Contract № ENPI/2014/350-889 B3.2 - Report on Software in the air management sector
HUMAN DYNAMICS-IDOM CONSORTIUM
Page 6 of 37
1 INTRODUCTION.
The aim of the component B is the elaboration of the draft programme of actions to reduce pollutant
emissions until 2030, covered by the Gothenburg Protocol, with the application of an integral emissions
evaluation. In order to facilitate the elaboration of this programme, as well as to support the Beneficiary in
future updates, the component B.3.2 aims to select/compile a software product, adapted for the Republic
of Belarus, to calculate the reduction of main pollutants emissions with cost-benefit analysis of each
pollutant individually and all the main pollutants together, which allows, inter alia, carry out reporting on the
pollutants emissions in the format, provided for by the program EMEP.
As previous stage for the determination of this software, this report pretends showing the current practice
in the European Union related to the software programs used to:
• calculate present and forecast the future emissions to the air
• prepare cost-benefit analysis for emission reduction at different scenarios
• prepare reports on the pollutants emission in the format, provided for by the program EMEP for key
emissions sector.
For the fulfilment of the task, the following information has been taking into account:
• the submissions of the IIR (Informative inventory report) of the parties to the Secretariat of the
Geneva Convention and EMEP Programme INFORMATIVE INVENTORY REPORT 1990-2013.
Considering the section related to the inventory preparation process and methods and data sources.
• Outcomes of the present project
• Publicly available sources of information
• Information obtained through contacts with different stakeholders and third parties.
The report is structured in 5 main sections:
- The first one is related to emission inventory. In this section the way the emission inventory is
developed in 6 countries is explained.
- The second one evaluates three representative air emissions dispersion software.
- The third one is related to Cost-benefit analysis for emission reduction software.
- The fourth section describes how the air quality is managed in some European countries and
software used for this management
- The last section is about findings and proposal for further continuation and successful
implementation on the Activity B.3.2.
Contract № ENPI/2014/350-889 B3.2 - Report on Software in the air management sector
HUMAN DYNAMICS-IDOM CONSORTIUM
Page 7 of 37
2 INVENTORY PREPARATION PROCESS. SITUATION IN EUROPE
2.1 SPAIN
2.1.1 Introduction
The Inventory preparation process is managed by the Inventories Unit of the Spanish National Inventory
System (SEI), together with a technical assistance. The main stages in the elaboration process are:
1) Analysis of the key categories identified in the previous edition of the inventory. This constitutes the
starting point for assigning the priorities for improving the inventory and for maintaining the
remaining activities.
2) Choice of methods for estimating the emissions. This stage includes the initial selection of a category
not previously considered, as well as the revision of the selected methods for those categories where
a methodological change is proposed.
3) Collection of the necessary information for applying the selected methods according to the activity
(activity parameters and variables, algorithms and emission factors, measured or estimated
emissions).
4) Processing of data. This phase involves integrating the base data with the methods for estimating
emissions in order to apply the procedures for calculating these emissions.
5) Preparation of air pollutant emissions report and result tables required.
6) Submission of the results for approval. Once the inventory has been approved, the reports and the
related information –in the format required for each case– are published and sent to the
international bodies through the National Focal Points.
2.1.2 Methods and Data Sources
The emission estimation methods applied in the Inventory depend on the nature of the activity being
considered and the availability of basic data. Based on the availability of information on the emissions
themselves, the estimation methods applied in the preparation of this Inventory can be classified into two
major categories:
I) Methods based on observed emission data. These methods are based on direct observation of the key
variable, i.e. the emission itself. Two types of methods can be distinguished:
a) Continuous measurement.
b) Measurement at regular intervals.
These Methods are mainly used in the Large Point Sources, excluding airports. The required data are
frequently available due to their environmental importance and the size of the activity involved. This
information is collected from the plants themselves through individualized questionnaires previously
elaborated by SEA. (The questionnaires are available if required and could be included as annex).
Specifically, direct measurements have been used for the determination of:
a. SOx: in thermal power plants, oil refineries, sulphuric acid plants, paper pulp plants, municipal and
industrial waste incineration plants.
b. NOx: in thermal power plants, oil refineries, nitric acid plants, paper pulp plants and in urban waste
incineration plants and in industrial waste incineration plants.
c. NMVOC: in thermal power plants (in part: in some plants and in certain years), in integrated iron and
steelworks, municipal waste incineration plants and industrial waste incineration plants.
d. CO: in thermal power plants; oil refineries, integrated iron and steelworks and paper pulp plants;
municipal waste incineration plants and industrial waste incineration plants.
e. NH3 nitric acid manufacturing plants and municipal waste incineration plants.

Contract № ENPI/2014/350-889 B3.2 - Report on Software in the air management sector
HUMAN DYNAMICS-IDOM CONSORTIUM
Page 8 of 37
f. TSP: in thermal power plants, oil refineries, integral iron and steelworks, municipal waste
incinerators, paper pulp and aluminium production.
g. Other pollutants in all those point sources for which it has been possible to collect direct data. (E.g
Coal-fired thermal power plants (1995-1998) for cadmium, mercury and lead, or urban waste
incinerators, mainly with respect to heavy metals and dioxins).
h.
II) Methods based on calculation procedures: this category can be split depending on the procedures:
a. Simple balance of materials. This method has been applied for the estimation of Sulphur dioxide in
combustion facilities where information regarding the amount of sulphur present in the fuel used,
and the retention coefficients for ash and specific parts of the combustion facilities is available. In
installations with de-sulphurisation units where there were available information on emission
abatement techniques, the estimation of potential emissions has been accordingly corrected. This
procedure was also used to estimate lead emissions and other heavy metals in internal combustion
engines in vehicles for road transport and mobile machinery. This has been also the adopted
approach for estimating NMVOC emissions from painting lines at automobile manufacturing plants.
b. Complete balance. This method comprises the determination of all inputs and outputs of different
chemical elements (using data on the types of process and facilities as well as the amounts of
materials and the elements in their composition), although in fact it was not possible to apply it
effectively in the estimation due to its complexity. In any case it has been retained as a reference
method for validating atypical estimates.
c. Methods based on functional statistical models: Modelling-correlation. This method is based on the
results of earlier works into the estimation of functional relationships or correlations between certain
physical and chemical variables and emissions from certain activities. It has the advantage of
providing specific relationships and making it possible to estimate the emissions as if there were
continuous monitoring of the activity. Specifically, it has been applied to estimate emissions from
categories 1A3a Air transport and 1A3b Road transport when functional ratios adjusted by
regression analysis were available.
d. Methods based on emission factors: activity factors and variables. This method has been the most
generally used in preparing the Inventory and has always been considered as the backup option, only
applied when no other more precise option was available to estimate the emissions for an activity.
These default emission factors, given by unit of socio-economic variable, constitute subrogated
information on plants or activities that can be assimilated to those for which estimations are required
in this inventory.
2.1.3 Software
There is not a commercial software for the development of the Spanish National Inventory. The inventory is
developed in an own database based on Oracle. This database is updated every year by means of the
particularities found in the development of each annual inventory.
2.2 BULGARIA
2.2.1 Introduction
Bulgaria’s reporting obligations are being administered by the Ministry of Environment and Water (MOEW).
All activities on preparation of GHGs and air pollutant inventory in Bulgaria are coordinated and managed on
Contract № ENPI/2014/350-889 B3.2 - Report on Software in the air management sector
HUMAN DYNAMICS-IDOM CONSORTIUM
Page 9 of 37
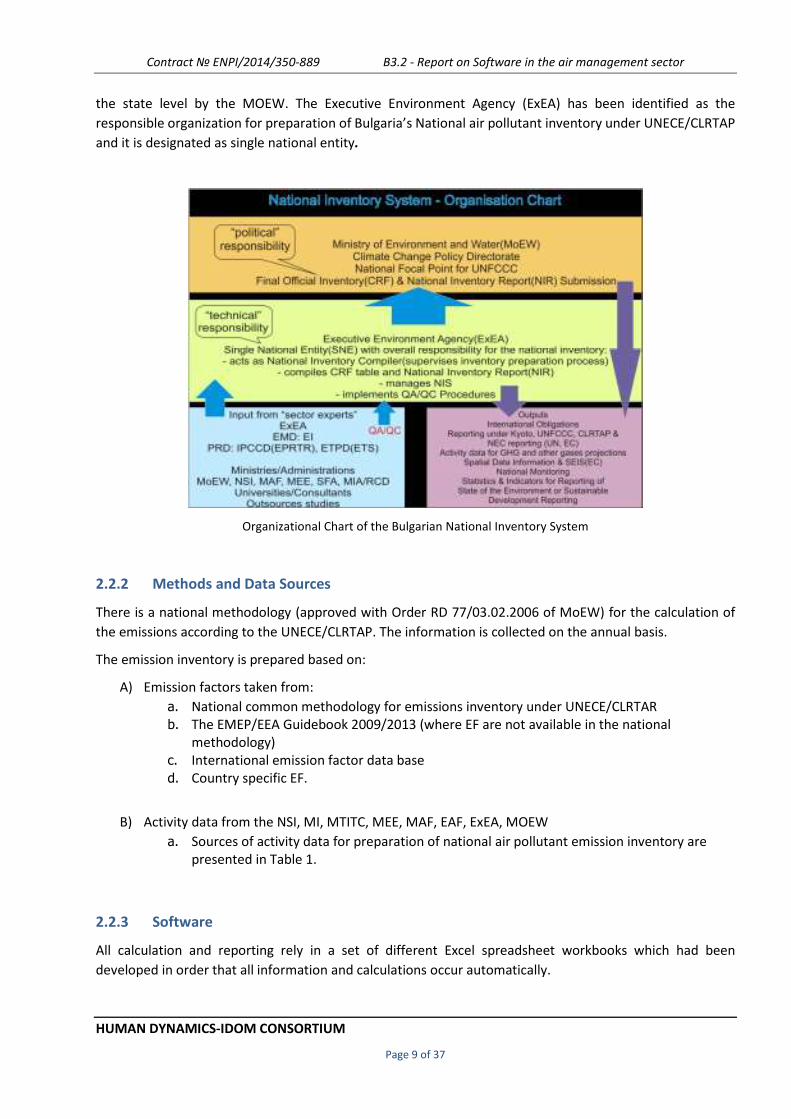
the state level by the MOEW. The Executive Environment Agency (ExEA) has been identified as the
responsible organization for preparation of Bulgaria’s National air pollutant inventory under UNECE/CLRTAP
and it is designated as single national entity.
Organizational Chart of the Bulgarian National Inventory System
2.2.2 Methods and Data Sources
There is a national methodology (approved with Order RD 77/03.02.2006 of MoEW) for the calculation of
the emissions according to the UNECE/CLRTAP. The information is collected on the annual basis.
The emission inventory is prepared based on:
A) Emission factors taken from:
a. National common methodology for emissions inventory under UNECE/CLRTAR b. The EMEP/EEA Guidebook 2009/2013 (where EF are not available in the national
methodology) c. International emission factor data base d. Country specific EF.
B) Activity data from the NSI, MI, MTITC, MEE, MAF, EAF, ExEA, MOEW
a. Sources of activity data for preparation of national air pollutant emission inventory are
presented in Table 1.
2.2.3 Software
All calculation and reporting rely in a set of different Excel spreadsheet workbooks which had been
developed in order that all information and calculations occur automatically.

Contract № ENPI/2014/350-889 B3.2 - Report on Software in the air management sector
HUMAN DYNAMICS-IDOM CONSORTIUM
Page 10 of 37
2.3 PORTUGAL
2.3.1 Introduction
The Portuguese Environmental Agency (APA)/ Ministry for the Environment, Spatial Planning and Energy, is
the Responsible Body for: the overall coordination and updating of the National Inventory of Emissions by
Sources and Removals by Sinks of Air Pollutants (INERPA); the inventory’s approval, after consulting the Focal
Points and the involved entities; and its submission to EC and international bodies to which Portugal is
associated, in the several communication and information formats, thus ensuring compliance with the
adopted requirements and directives.
All the participating organizations are represented in the INERPA’s working group set up to support the
annual production of the national inventories and the fulfilment of the reporting requirements. Each year
the coordinator, organizes a kick off meeting to plan and launch, in coordination with the sectoral focal points
and the involved entities, the work for the following inventory submission(s). Bilateral meetings occur as
necessary as consequence of this meeting aiming at discussing the specific issues related to each sector and
to agree on the actions to be implemented in the framework of INERPA during the inventory compilation
regarding the next submission.
2.3.2 Methods and Data Sources
The emissions calculations is performed by APA. However many other institutions and agencies contribute
to the inventory process, providing activity data, sectoral expert judgement, technical support and
comments. All calculation and reporting rely in a set of different Excel spreadsheet workbooks which had
been developed in order that all information and calculations occur automatically. The structure of the
information system is outlined below.
Electronic System Structure of the estimation and reporting system

Contract № ENPI/2014/350-889 B3.2 - Report on Software in the air management sector
HUMAN DYNAMICS-IDOM CONSORTIUM
Page 11 of 37
The information received from the several data suppliers is stored in its original format (paper or magnetic).
A copy of this information is converted into the working workbooks, where data is further processed, linkage
made and calculations performed, maintaining hence the integrity of the original data sources. The following
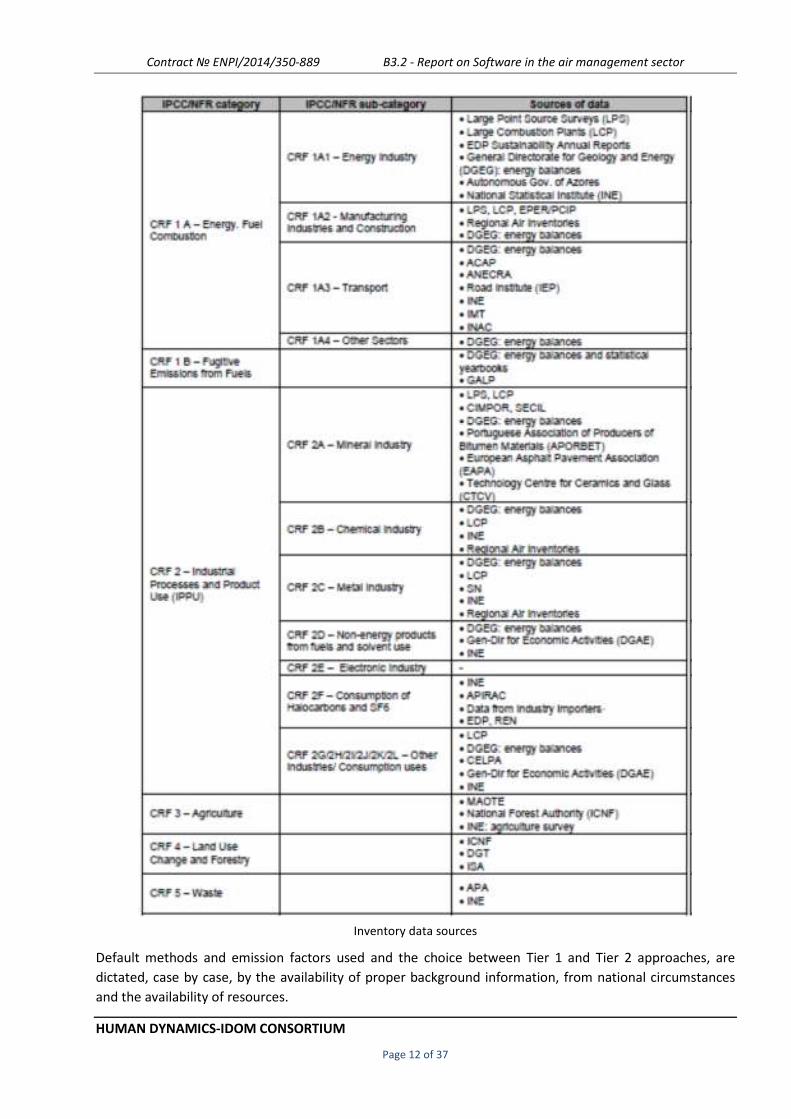
table gives an overview of the institutions and data sources providing data for the compilation of the
Portuguese emission inventories.
Contract № ENPI/2014/350-889 B3.2 - Report on Software in the air management sector
HUMAN DYNAMICS-IDOM CONSORTIUM
Page 12 of 37
Inventory data sources
Default methods and emission factors used and the choice between Tier 1 and Tier 2 approaches, are
dictated, case by case, by the availability of proper background information, from national circumstances
and the availability of resources.
Contract № ENPI/2014/350-889 B3.2 - Report on Software in the air management sector
HUMAN DYNAMICS-IDOM CONSORTIUM
Page 13 of 37
2.3.3 Software
All calculation and reporting rely in a set of different Excel spreadsheet workbooks which had been
developed in order that all information and calculations occur automatically.
2.4 DENMARK
2.4.1 Introduction
DCE (Danish Centre for Environment and Energy, Aarhus University), is responsible for the annual
preparation and submission to the UNECE-LRTAP Convention of the Annual Danish Emissions Report, and
the inventories in the NFR Format in accordance with the guidelines. DCE is contracted by the Ministry of the
Environment and the Ministry of Climate, Energy and Building to complete emission inventories for Denmark.
2.4.2 Methods and Data Sources
The Danish emission inventory for stationary combustion plants is based on the former CORINAIR system.
The CORINAIR calculation principle is to calculate the emissions as activities multiplied by emission factors.
The most consistent emission factors are used, either as national values or default factors proposed by
international guidelines. Information on activities to carry out the inventory is largely based on official
statistics.
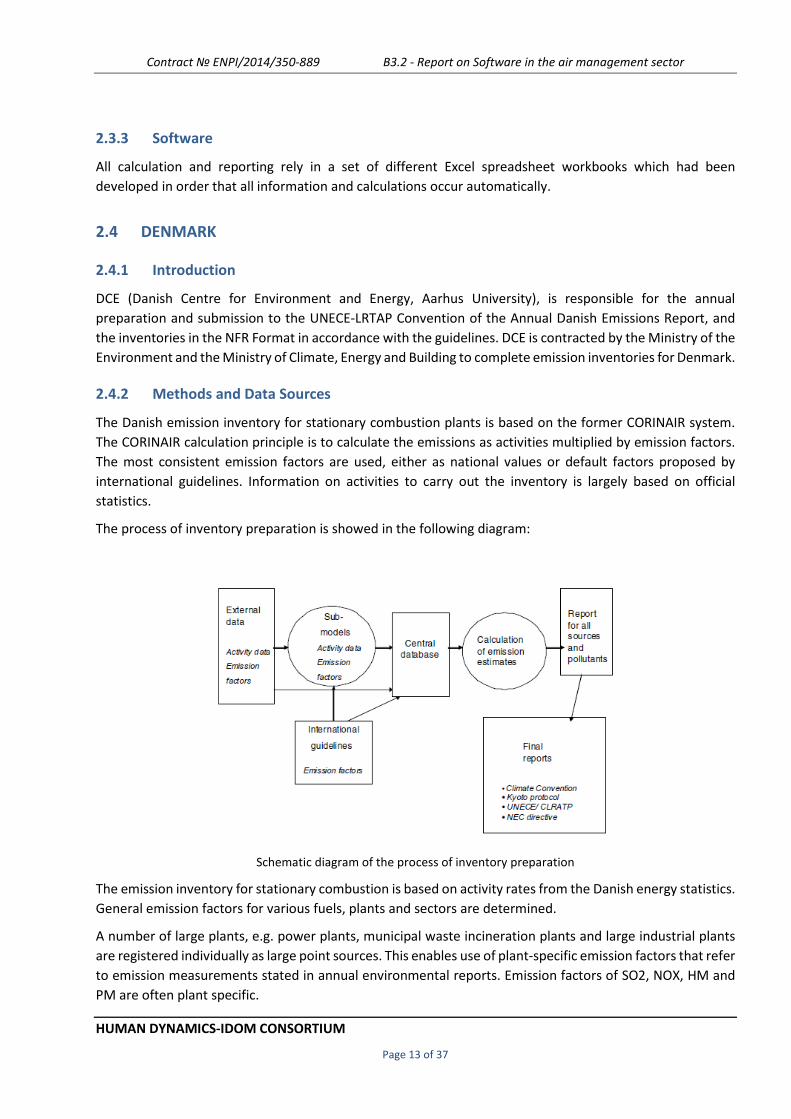
The process of inventory preparation is showed in the following diagram:
Schematic diagram of the process of inventory preparation
The emission inventory for stationary combustion is based on activity rates from the Danish energy statistics.
General emission factors for various fuels, plants and sectors are determined.
A number of large plants, e.g. power plants, municipal waste incineration plants and large industrial plants
are registered individually as large point sources. This enables use of plant-specific emission factors that refer
to emission measurements stated in annual environmental reports. Emission factors of SO2, NOX, HM and
PM are often plant specific.

Contract № ENPI/2014/350-889 B3.2 - Report on Software in the air management sector
HUMAN DYNAMICS-IDOM CONSORTIUM
Page 14 of 37
An internal DCE model with a structure similar to the European COPERT IV emission model (EEA, 2013) is
used to calculate the Danish annual emissions for road traffic.
The Danish agricultural emissions are calculated and managed in a comprehensive model complex called IDA
(Integrated Database model for Agricultural emissions), which is used to calculate both air pollutants
compounds and greenhouse gas related emissions. The livestock production has a great influence on the
Danish agricultural emissions. IDA works with approximately 40 different livestock categories, dependent on
livestock category, weight class and age.
The distribution of emissions in the Danish emission inventory is carried out in databases and in a
geographical information system, GIS. The methodology applied in the part of the distribution carried out in
GIS is described for the Industrial Processes sector as a case, as this distribution is rather simple: the emission
inventory for Industrial Processes covers both point sources and area sources. Emissions from point sources
are allocated to the coordinates for the individual plants included in the Danish inventory system and are not
relevant in relation to the GIS procedure. Emissions from area sources are calculated from production
statistics and the resulting emissions are national totals as allocation of the sources (industrial plants) is not
possible with the available data. Instead a proxy for the distribution is applied, in this case the location of
industrial areas. The map of industrial areas is not reflecting differences in the location for different
industries, but only holds industrial buildings (referred to as the industrial area as the buildings are treated
as areas rather than units). The map is a shape file and the industrial areas are polygons.
The remaining part of the emission distribution for industrial processes is carried out in a database. The share
of the national emissions that should be allocated to each grid cell is calculated as the industrial area of the
cell divided by the total industrial area. The same distribution key is applied for all pollutants.
The Danish high resolution gridded emissions are aggregated on the 50 km x 50 km EMEP grid for reporting
to CLRTAP. The share of each 1 km x 1 km grid cell located in the relevant EMEP grid cells are calculated and
the aggregated emissions are calculated as the weighted sum of emissions in the 1 km grid cells intersecting
each EMEP grid cell being partial or fully part of the Danish Exclusive Economic Zone, EEZ.
National total gridded emissions
Contract № ENPI/2014/350-889 B3.2 - Report on Software in the air management sector
HUMAN DYNAMICS-IDOM CONSORTIUM
Page 15 of 37
2.4.3 Software
The background data (activity data and emission factors) for estimation of the Danish emission inventories
is collected and stored in central databases located at DCE. The databases are in Access format and handled
with software developed by the European Environmental Agency (EEA) and DCE.
As input to the databases, various sub-models are used to estimate and aggregate the background data in
order to fit the format and level in the central databases.
For each submission, databases and additional tools and submodels are frozen together with the resulting
NFR-reporting format. This material is placed on central institutional servers, which are subject to routine
back-up services.
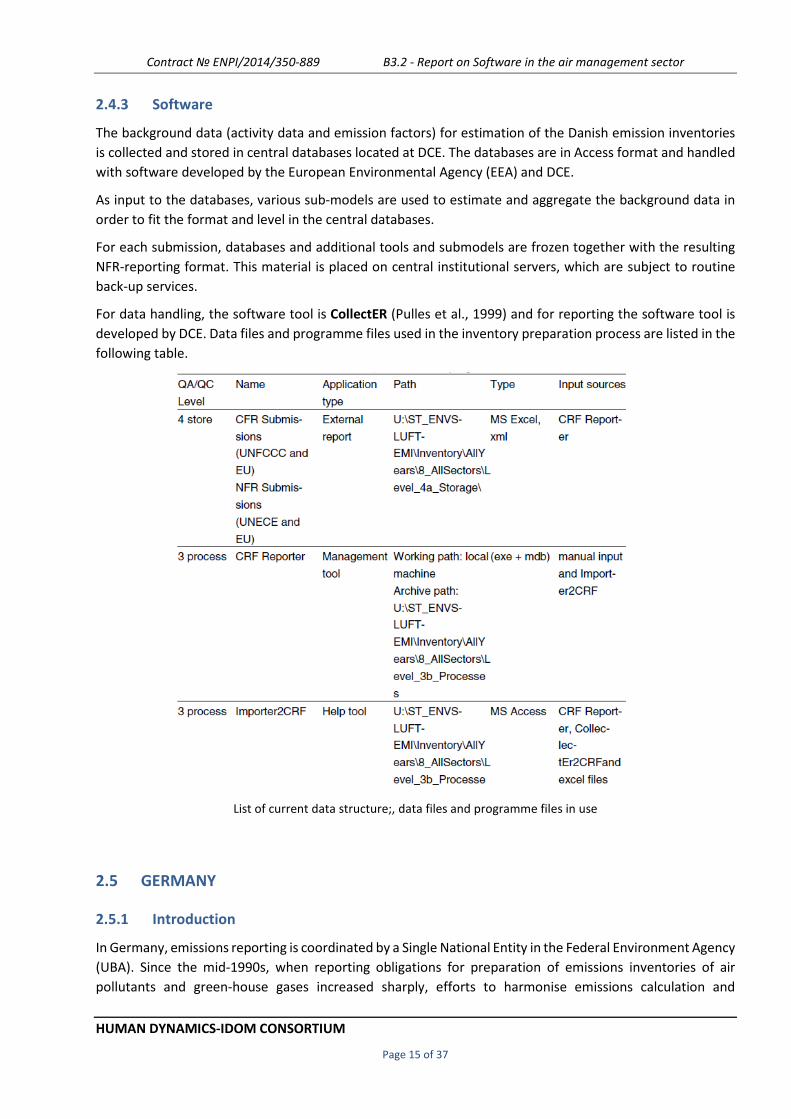
For data handling, the software tool is CollectER (Pulles et al., 1999) and for reporting the software tool is
developed by DCE. Data files and programme files used in the inventory preparation process are listed in the
following table.
List of current data structure;, data files and programme files in use
2.5 GERMANY
2.5.1 Introduction
In Germany, emissions reporting is coordinated by a Single National Entity in the Federal Environment Agency
(UBA). Since the mid-1990s, when reporting obligations for preparation of emissions inventories of air
pollutants and green-house gases increased sharply, efforts to harmonise emissions calculation and

Contract № ENPI/2014/350-889 B3.2 - Report on Software in the air management sector
HUMAN DYNAMICS-IDOM CONSORTIUM
Page 16 of 37
reporting have been intensified. At the same time, requirements from reporting obligations relative to the
UNECE Geneva Convention on Long-range Transboundary Air Pollution and its protocols, to the EU NEC
Directive and to EU plant specific reporting obligations, must be taken into account.
2.5.2 Methods and Data Sources
The methodology followed for the inventory preparation for both, National Inventory Report as submitted
under the UNFCCC an the one used for air pollution emissions is exactly the same. Mainly differences are
related to the use of emission factors. Following figures shows the process for the elaboration of the emission
inventory:
Overview of the emissions-reporting process
In practice many experts are involved in the inventory compilation process, which requires an efficient
organisation. The major advantage of this concept is the provision of additional expertise for quality control
and verifications. The cooperation with the experts, who are responsible for legislation and Best Available
Technology (BAT) ensures a detailed technical knowledge for the inventory compilation process. The
knowledge of abatement technologies and limit values is essential for the evaluation of emission factors.
Since the Federal Environment Agency (UBA) operates several analytical laboratories and monitoring
stations, it's possible to draw on the specialist expertise in order to get a better understanding of
measurements and uncertainties.
As a general rule, Germany uses many country-specific process information and emission factors where
available.
Another factor that is critical to the success of the overall process is selection and review of, and (where
necessary) changes in, data sources, since the quality of results of all downstream processes (data
Contract № ENPI/2014/350-889 B3.2 - Report on Software in the air management sector
HUMAN DYNAMICS-IDOM CONSORTIUM
Page 17 of 37
preparation, calculation, reporting) cannot be better than that of the primary data used. Data sources may
be oriented to the activity data, emission factors or emissions for/of a specific category. In many cases, the
data sources used have been relied on for a number of years. It can become necessary to select new data
sources – for example, as a result of required changes in methods, of the elimination of an existing data
source, of a need for additional data or of findings from quality checks of previously used data sources.
The suitability of a given data source depends on various criteria. These include:
• Long-term availability,
• Institutionalisation of data provision,
• Good documentation,
• Execution of quality assurance and control measures, by the persons/organisations providing
data,
• Identification of uncertainties,
• Representative nature of the data in question, and
• Completeness of the expected data.
In each case, it is vital that the reasons for choosing a particular data source be documented and, where the
data source has significant deficits, that suitable measures for improving the data be planned.
2.5.3 Software
The Federal Environment Agency's Central System on Emissions (CSE) database is the national, central
database for emissions calculation and reporting. It is used for central storage of all information required for
emissions calculation (methods, activity rates, emission factors). The CSE is the main instrument for
documentation and quality assurance at the data level.
2.6 GEORGIA
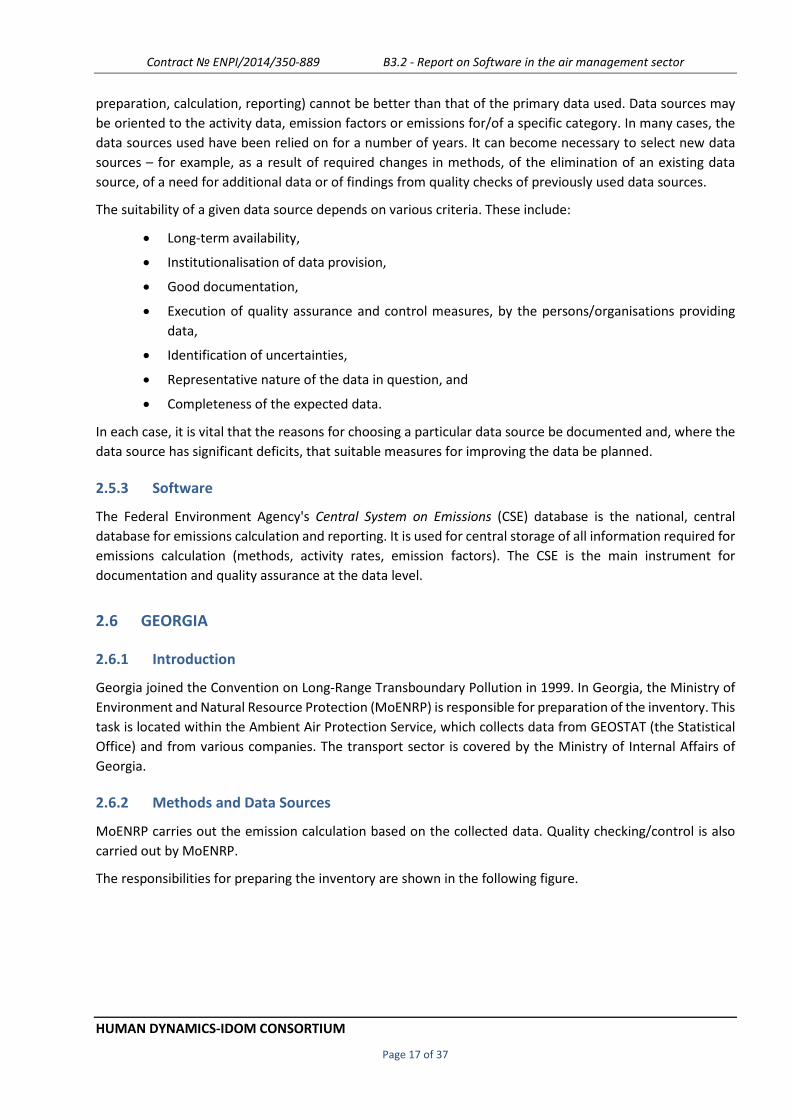
2.6.1 Introduction
Georgia joined the Convention on Long-Range Transboundary Pollution in 1999. In Georgia, the Ministry of
Environment and Natural Resource Protection (MoENRP) is responsible for preparation of the inventory. This
task is located within the Ambient Air Protection Service, which collects data from GEOSTAT (the Statistical
Office) and from various companies. The transport sector is covered by the Ministry of Internal Affairs of
Georgia.
2.6.2 Methods and Data Sources
MoENRP carries out the emission calculation based on the collected data. Quality checking/control is also
carried out by MoENRP.
The responsibilities for preparing the inventory are shown in the following figure.
Contract № ENPI/2014/350-889 B3.2 - Report on Software in the air management sector
HUMAN DYNAMICS-IDOM CONSORTIUM
Page 18 of 37
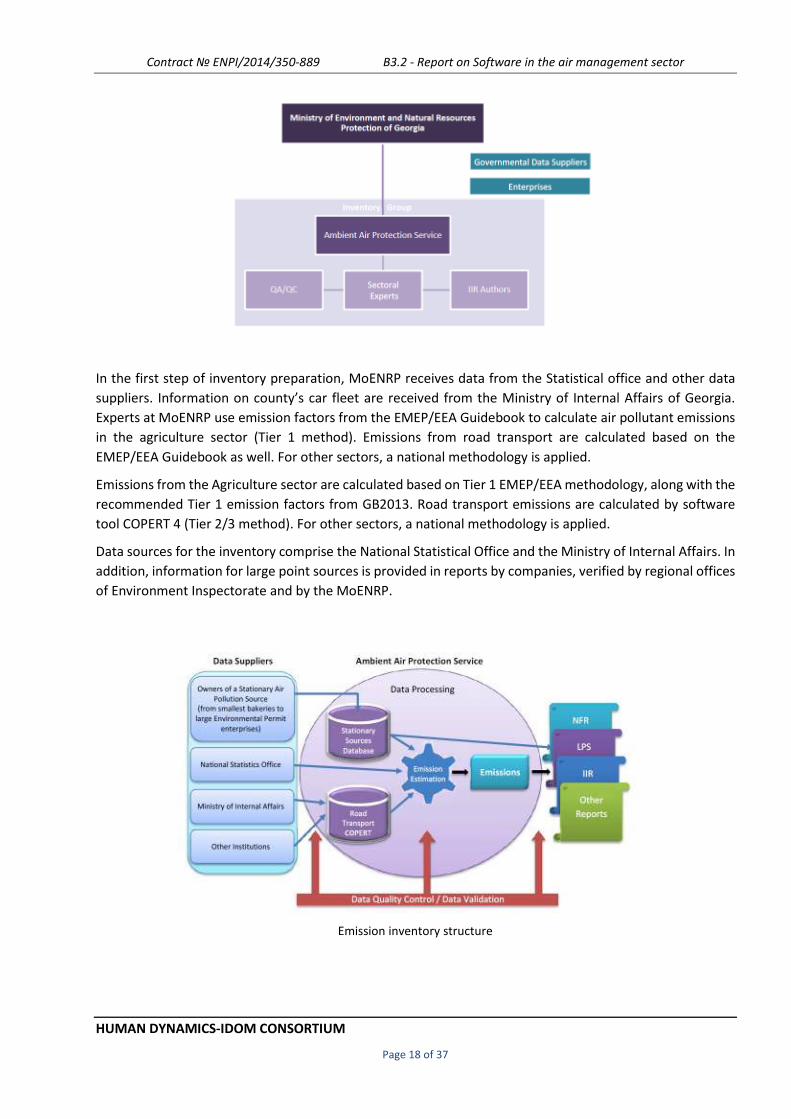
In the first step of inventory preparation, MoENRP receives data from the Statistical office and other data
suppliers. Information on county’s car fleet are received from the Ministry of Internal Affairs of Georgia.
Experts at MoENRP use emission factors from the EMEP/EEA Guidebook to calculate air pollutant emissions
in the agriculture sector (Tier 1 method). Emissions from road transport are calculated based on the
EMEP/EEA Guidebook as well. For other sectors, a national methodology is applied.
Emissions from the Agriculture sector are calculated based on Tier 1 EMEP/EEA methodology, along with the
recommended Tier 1 emission factors from GB2013. Road transport emissions are calculated by software
tool COPERT 4 (Tier 2/3 method). For other sectors, a national methodology is applied.
Data sources for the inventory comprise the National Statistical Office and the Ministry of Internal Affairs. In
addition, information for large point sources is provided in reports by companies, verified by regional offices
of Environment Inspectorate and by the MoENRP.
Emission inventory structure

Contract № ENPI/2014/350-889 B3.2 - Report on Software in the air management sector
HUMAN DYNAMICS-IDOM CONSORTIUM
Page 19 of 37
2.6.3 Software
Activity data and emission factors are stored in Excel files. Data is backed-up and archived at MoENRP
(Ambient Air Protection Service) in different computers and virtual server.
2.7 ITALY
2.7.1 Introduction
The Institute for Environmental Protection and Research (ISPRA) has the overall responsibility for the
emission inventory submission to CLRTAP, as well as to the United Nations Framework Convention on
Climate Change (UNFCCC), and is in charge of all the work related to inventory compilation.
ISPRA has established fruitful cooperation with a number of governmental and research institutions as well
as industrial associations, which helps improving information about some leading categories of the inventory.
Specifically, these activities aim at the improvement of provision and collection of basic data and emission
factors, through plant-specific data, and exchange of information on scientific researches and new sources.
Moreover, when in depth investigation is needed and estimates are affected by a high uncertainty, sectoral
studies are committed to ad hoc research teams or consultants.
2.7.2 Methods and Data Sources
The main basic data needed for the preparation of the national emission inventory are energy statistics,
published by the Ministry of Economic Development (MSE) in the National Energy Balance (BEN), statistics
on industrial and agricultural production, published by the National Institute of Statistics (ISTAT), statistics
on transportation, provided by the Ministry of Transportation (MIT), and data supplied directly by the
relevant professional associations.
Emission factors and methodologies used in the estimation process are consistent with the EMEP/EEA
Guidebook, the IPCC Guidelines and Good Practice Guidance as well as supported by national experiences
and circumstances.
For the industrial sector, emission data collected through the National Pollutant Release and Transfer
Register (PRTR), the Large Combustion Plant (LCP) Directive and in the framework of the European Emissions
Trading Scheme have yielded considerable developments in the inventory of the relevant sectors.
In fact, these data, even if not always directly used, are taken into account as a verification of emission
estimates and improve national emissions factors as well as activity data figures.
For large industrial point sources, emissions are registered individually, when communicated, based upon
detailed information such as fuel consumption.
Other small plants communicate their emissions which are also considered individually.
2.7.3 Software
The inventory is composed by spreadsheets to calculate emission estimates; activity data and emission
factors as well as methodologies are referenced to their data sources.
All the reference material, estimates and calculation sheets, as well as the documentation on scientific
papers and the basic data needed for the inventory compilation, are stored and archived at the Institute for

Contract № ENPI/2014/350-889 B3.2 - Report on Software in the air management sector
HUMAN DYNAMICS-IDOM CONSORTIUM
Page 20 of 37
Environmental Protection and Research. After each reporting cycle, all database files, spreadsheets and
electronic documents are archived as ‘read-only-files’ so that the documentation and estimates could be
traced back during the new year inventory compilation or a review process.

Contract № ENPI/2014/350-889 B3.2 - Report on Software in the air management sector
HUMAN DYNAMICS-IDOM CONSORTIUM
Page 21 of 37
3 AIR EMISSION INVENTORY SOFTWARE TOOLS
As commented in the previous section, only Denmark uses a commercial software for the development of
the inventory. This software is named “CollectER”.
The CollectER emission inventory software tool is developed by European Environment Agency (EEA) and its
European Topic Centre on Air and Climate Change (ETC-ACC) since the year 1998. The objectives of the
software are to facilitate preparation of transparent, consistent, complete, comparable and accurate data
for emissions reporting procedures in accordance with the requirements of international conventions,
protocols and EU legislation. The CollectER tool is designed to help national experts on air emissions to collect
the relevant air emission data for delivery to the European Commission and to international conventions.
CollectER III is an executable programme, running under the Windows operating system, which manages and
compiles an MS Access type of relational database. CollectER III integrates inventory compilation and
inventory reporting into one software tool. This tool uses a tailored database platform to help with emission
inventory compilation. It allows the input of activity data, selection of different emission factors to give
emissions. It also includes point source functionality.
The software can be downloaded free of charge from ETC-ACC’s web site at http://air-
climate.eionet.europa.eu/country_tools/ae/CollectER_III.html
Start data collection. - Activity rates and emission factors have to be collected for the actual inventory year.
Two reporting functions are available in the tool:

Contract № ENPI/2014/350-889 B3.2 - Report on Software in the air management sector
HUMAN DYNAMICS-IDOM CONSORTIUM
Page 22 of 37
o UNECE_LRTAP – allows user generate flat file containing emission data from the Inventory. Flat file
has format as required by UNECE LRTAP (and NECD) reporting. This format is fully compatible with
the latest reporting requirements of UNFCCC in NFR09. Data exported into flat files may be filtered.
o UNFCCC – allows user generate XML files containing emission data and fuels background data that
can be imported into UNFCCC Reporter database file. It is possible export one or all years emission
data or fuel background data into single files.

Contract № ENPI/2014/350-889 B3.2 - Report on Software in the air management sector
HUMAN DYNAMICS-IDOM CONSORTIUM
Page 23 of 37
4 AIR DISPERSION SOFTWARE
Air quality models are complex tools which include detailed representations of the transport, diffusion and
chemical processes taking place in the atmosphere.
Models have become a primary tool for analysis in most air quality assessments mainly for the following
reasons:
• A picture of the air quality in a zone may be obtained - in contrast to the limitations in the spatial
coverage of air quality measurements.
• The relation between air concentrations and the emissions causing these can be made explicitly
and quantitatively by modelling, which is most important for supporting air quality management.
• Models are the only available tool if the impact on air quality of possible future sources or of
alternative future emission scenarios is to be investigated.
Air pollution models can be used in a complementary manner to air quality measurements, with due regard
for the strengths and weaknesses of both analysis techniques. Modelled information is necessarily uncertain
due to deficiencies in our knowledge of emissions and atmospheric processes; this disadvantage may be
largely offset by validation of models with the help of measurements, or by assessing air quality by
combination of information from modelling and measurements. In fact, if a concentration map is to be made
on the basis of measurements, model results provide essential information for interpolation. The use of
interpolation in assessments of air quality measurements alone is to be recommended only if emission
information cannot be made available or if acceptable models cannot be found, and if monitoring data with
sufficient spatial and temporal coverage are available.
The European Topic Centre on Air Pollution and Climate Change Mitigation CM (ETC/ACM) is a consortium
of 14 European organisations with the Netherlands Institute for Public Health and the Environment (RIVM)
as its lead organisation. The centres are part of EIONET (European Environment Information and Observation
Network). This partnership network of the European Environment Agency (EEA) and its member- and
cooperating countries involves approximately 1000 experts and more than 350 national institutions. The
network supports the collection and organisation of data and the development and dissemination of
information concerning Europe’s environment.
The European Topic Centre on Air Quality has prepared a pilot model documentation centre accessible via
the Internet (ETC-AQ home page: http://www.etcaq.rivm.nl; model documentation centre:
http://aix.meng.auth.gr/lhtee/database.html). Here, descriptions of the models, their application areas and
their status with respect to evaluation and validation are to be provided. These air quality models catalogue
and meta information database are set up to provide guidance to model users in the selection of the most
appropriate model for his or her application. The Model Documentation System aims to provide guidance to
any model user in the selection of the most appropriate air quality model for his application. Inclusion of an
air quality model in the system is by no means associated with any form of endorsement for using the
particular model: it helps select the most appropriate by using the specifications submitted by the modellers.
In short, the procedure for modelling involves the following steps:
1) Define the pollutant, and the output quantity to be modelled (concentration fields, or (spatial
maximum) concentrations in streets or near point sources, usually for concentration statistics,
for instance annual average, 98 percentile of hourly values ...)
2) Define the time resolution needed (the averaging time for the concentration)
Contract № ENPI/2014/350-889 B3.2 - Report on Software in the air management sector
HUMAN DYNAMICS-IDOM CONSORTIUM
Page 24 of 37
3) Define the "model output area" for which the model calculations should be made (usually a zone
or agglomeration) and the spatial resolution needed.
4) Define the accuracy in the output quantity that is required
5) Determine the model area (this may extend considerably beyond the output area, particularly in
case of pollutants with long range transport!)
6) Investigate the availability of emission data (in the model area)
7) Investigate the availability meteorological and topographical data (in the model area)
8) Investigate available air quality data (in the model output area)
9) Check available computer resources
10) Select models that are suitable for the pollutant (taking into account its chemistry and
deposition), for the relevant output quantity, with the appropriate resolution in space and time,
within the required accuracy, and for the area under consideration (taking into account its
topography and meteorological characteristics)
11) Consider the computer requirements of the model(s); if these surpass available computer
resources, reconsider model choice.
12) Reconsider the requirements on emission and meteorological data of the model(s) selected and,
if necessary, collect more detailed input data (or reconsider the model choice)
13) Prepare input data
14) Run the model
15) Compare results to available air quality data and critically evaluate. If necessary, re-run model.
16) Map output
Dispersion modelling is a complex process and, as with all models, the results are only as useful as the model
itself and how it is used. Correct interpretation of modelling results against the national environmental
standards and determination of the potential effects of a discharge are as important as accurate modelling
results. The process of air pollution modelling contains four stages (data input, dispersion calculations,
deriving concentrations, and analysis). The accuracy and uncertainty of each stage must be known and
evaluated to ensure a reliable assessment of the significance of any potential adverse effects.
For air quality assessment by modelling, a wide variety of models have been developed, some of which have
been made readily accessible and easy to use by combination with user-friendly software. Others can only
be operated by specialists, or even exclusively by the developers.Following sections include a short
description of three different models: AERMOD, THOR and CHIMERE.
4.1 AERMOD
AERMOD is a ‘near-field, steady-state’ guideline model. It is designed to predict pollutant concentrations
from continuous point, flare, area, line, and volume sources. It uses boundary-layer similarity theory to
define turbulence and dispersion coefficients as a continuum, rather than as a discrete set of stability classes.
Variation of turbulence with height allows a better treatment of dispersion from different release heights.
Also, dispersion coefficients for unstable conditions are non-Gaussian, to represent the high concentrations
that can be observed close to a stack under convective conditions.
AERMOD allows emission sources considered puntual, surface or volumetric type, and is applicable to areas
of both simple and complex topography. AERMOD considers the complex terrain through the concept of

Contract № ENPI/2014/350-889 B3.2 - Report on Software in the air management sector
HUMAN DYNAMICS-IDOM CONSORTIUM
Page 25 of 37
dividing flow path. With this assumption, the plume behavior resulting from topographic effect is an average
offset of two streams: one over the obstacle and another around it.
The dispersion modeling system AERMOD is structured in three different modules, self AERMOD module,
and two modules called AERMAP and AERMET.
AERMET utiliza la información meteorológica y las características del terreno suministradas para calcular los
parámetros necesarios para representar la capa límite planetaria (altura de la capa de mezcla, velocidad de
fricción, etc.) de acuerdo a los requerimientos de AERMOD. Como datos de entrada AERMET acepta datos
de estaciones meteorológicas o datos procedentes del acoplamiento de algún modelo meteorológico.
AERMET crea dos ficheros requeridos por AERMOD, un archivo de información meteorológica en superficie
y un archivo del perfil en altura.
AERMET uses meteorological information and the land cover to calculate the necessary parameters to
represent the planetary boundary layer (height of the mixing layer, friction velocity, etc.) according to the
requirements of AERMOD. As AERMET accepts input data from meteorological stations or link data from a
meteorological model. AERMET creates two files required by AERMOD, meteorological surface file and a
meteorological height profile file.
On the other hand, AERMAP is responsible for processing topography from field data in order to calculate
the coordinates of the receptors and terrain characteristics that may influence local issues in relation to the
dispersion of pollutants. Besides, this module defines the number of discrete receptors where the AERMOD
model will calculate the concentration of pollutants and / or define the coordinates of a Cartesian domain
where AERMOD predict the air pollutant concentration.
AERMOD needs, as input data, the following:
• Meteorological data in the point where the emission sources are located. Specifically it requires
hourly values of wind speed, wind direction, temperature, relative humidity, cloud cover and cloud height.
• Digital terrain model with a specific resolution.

Contract № ENPI/2014/350-889 B3.2 - Report on Software in the air management sector
HUMAN DYNAMICS-IDOM CONSORTIUM
Page 26 of 37
• Receptors / or definition of a Cartesian domain with a specific horizontal resolution.
• Definition of albedo, Bowen ratio and roughness according to land use of the area where the source
is located.
• Location, physical parameters and flow rate of the source. For punctual sources, the data are: stack
diameter and height; temperature and flow rate.
Several National Authorities (p. e Hungarian Ministry on Environment and Water Management and
Hungarian Meteorological Service) decided to promulgate AERMOD as national standard. In Spain and in
Bulgaria, AERMOD has been the model used for modelling the air dispersion emissions included in the
Environmental Impact Assessment.
AERMOD supports regulatory modeling programs. Currently it calculates concentration values, dry, wet and
total deposition rates. It generates gridded vertical profile of potential temperature for use in plume rise
calculations. Effective release height for flare sources is available. Exponential decay of pollutant is taken
into account. Point, volume and area sources are treated. Line sources are handled as volume source.
Contract № ENPI/2014/350-889 B3.2 - Report on Software in the air management sector
HUMAN DYNAMICS-IDOM CONSORTIUM
Page 27 of 37
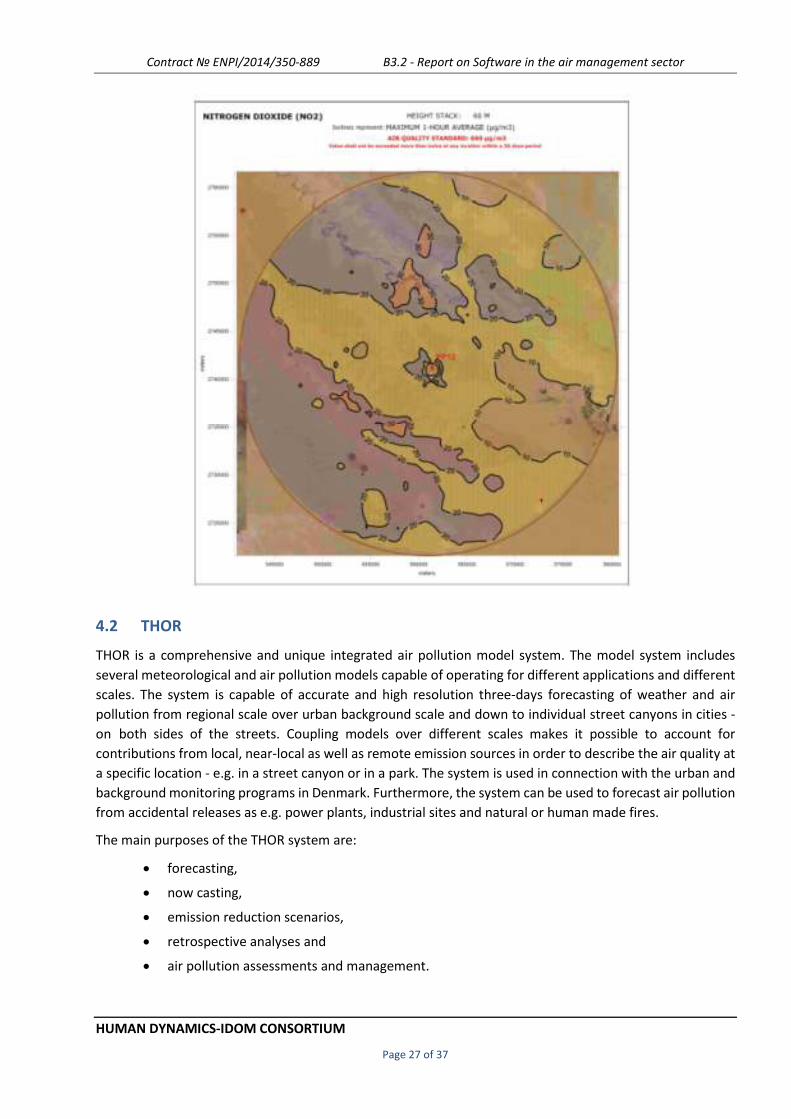
4.2 THOR
THOR is a comprehensive and unique integrated air pollution model system. The model system includes
several meteorological and air pollution models capable of operating for different applications and different
scales. The system is capable of accurate and high resolution three-days forecasting of weather and air
pollution from regional scale over urban background scale and down to individual street canyons in cities -
on both sides of the streets. Coupling models over different scales makes it possible to account for
contributions from local, near-local as well as remote emission sources in order to describe the air quality at
a specific location - e.g. in a street canyon or in a park. The system is used in connection with the urban and
background monitoring programs in Denmark. Furthermore, the system can be used to forecast air pollution
from accidental releases as e.g. power plants, industrial sites and natural or human made fires.
The main purposes of the THOR system are:
• forecasting,
• now casting,
• emission reduction scenarios,
• retrospective analyses and
• air pollution assessments and management.
Contract № ENPI/2014/350-889 B3.2 - Report on Software in the air management sector
HUMAN DYNAMICS-IDOM CONSORTIUM
Page 28 of 37
The system can be used for information and warning of the public in cases of high air pollution levels and for
policy management (e.g. by emission reduction or traffic scenarios) of many different chemical compounds.
The system can be applied operationally for any location all over the world. The system consists of several
different air pollution models - all developed at NERI during the last decades.
Present capabilities of the THOR system include all aspects within forecasting, nowcasting, supplement to
monitoring programs, scenarios, retrospective analyses, assessment and management of air pollution.
4.3 CHIMERE
The CHIMERE atmospheric chemistry-transport model. CHIMERE simulates and predicts the impacts of
different emission control scenarios on air quality (ozone, nitrogen dioxide and particulate matter
concentrations) in Europe at different scales.
The CHIMERE multi-scale model is primarily designed to produce daily forecasts of ozone, aerosols and other
pollutants and make long-term simulations for emission control scenarios. CHIMERE runs over a range of
spatial scales from the regional scale (several thousand kilometers) to the urban scale (100-200 Km) with
resolutions from 1-2 Km to 100 Km. CHIMERE proposes many different options for simulations which make
it also a powerful research tool for testing parameterizations, hypotheses. Its use is relatively simple so long
as input data is correctly provided. It can run with several vertical resolutions, and with a wide range of
complexity. It can run with several chemical mechanisms, simplified or more complete, with or without
aerosols.
CHIMERE is one of the models used in the frame of the French national platform for air quality forecasting
(PREV'AIR). The model is also used in the frame of EMEP through the EURODELTA and CityDelta projects. The
model is also used in Spain along with MM5, to evaluate the air quality in Spain with models. For both ozone
and PM, the model has undergone extensive inter-comparisons on aerosol concentrations at European and
city scales.
CHIMERE runs over a range of spatial scale from the regional scale (several thousand kilometers) to the urban
scale (100-200 Km) with resolutions from 1-2 Km to 100 Km. On this server, documentation and source codes
are proposed for the complete multi-scale model. However most data are valid only for Europe and should
be revisited for applications on other continents.
CHIMERE proposes many different options for simulations which make it also a powerful research tool for
testing parameterizations
The data sources used in CHIMERE are: Meteorological data from WRF, MM5 models, or ECMWF; Emission
data (usually from EMEP); Boundar
The model is freely available with a full documentation at : http://www.lmd.polytechnique.fr/chimere/

Contract № ENPI/2014/350-889 B3.2 - Report on Software in the air management sector
HUMAN DYNAMICS-IDOM CONSORTIUM
Page 29 of 37
5 AIR MANAGEMENT IN EUROPE
5.1 AIR MANAGEMENT SOFTWARE
5.1.1 UKIAM model — United Kingdom
The UKIAM model has been developed to investigate emissions control strategies in the UK that are cost-
effective in maximizing improvement in protection of the environment while helping to comply with the UK's
international commitments on national emission ceilings and air quality legislation.
Protection of the environment includes human health with respect to human exposure and air quality
standards, and protection of natural ecosystems through reducing exceedance of critical loads as the
maximum annual deposition sustainable to avoid adverse effects. It brings together UK data based on the
work of other DEFRA contractors, with emissions data based on the National Atmospheric Emissions
Inventory, source apportionment reflecting the response of concentrations and deposition to changes in UK
emissions based on the FRAME model of CEH, and information on abatement measures on SO2, NOx and
primary PM10 from AMEC Environment & Infrastructure UK, and from the North Wyke Research for NH3
from agriculture as the main NH3 source. The latter are embodied in cost curves, ranking the potential
abatement measures as a series of emission reduction steps for each pollutant and source represented in
UKIAM in order of increasing cost per unit emission reduction. The model can then be used in scenario
analysis mode to examine the effect of selected measures, or in optimization mode selecting measures in
order of cost effectiveness in moving towards targets for environmental protection.
At the urban scale UKIAM has been modified to model NO2 and PM10 in London and other major cities,
using a finer grid resolution and with the road network superimposed. So far this work has been concentrated
mainly on scenarios for transport up to 2020, and the effectiveness of both technical measures aimed at
reducing exhaust emissions, and non-technical measures such as congestion charging that reduce traffic
volumes (and emissions from brakes and tyres as well as exhausts). More work is now needed on non-traffic
emissions, including those due to space heating and energy use.

Contract № ENPI/2014/350-889 B3.2 - Report on Software in the air management sector
HUMAN DYNAMICS-IDOM CONSORTIUM
Page 30 of 37
UKIAM has being extended to consider greenhouse gases as well as air quality pollutants, and investigate
synergies in combined strategies for control. This development parallels corresponding developments in
European scale modelling by IIASA for the European Commission with their new GAINS model, and involves
extending the range of measures considered to include, for example, changes in energy generation as well
as add-on or "end-of-pipe" measures to control specific pollutants. Instead of cost-curves for individual
pollutants, each measure is associated with corresponding effects on the whole range of pollutants and
greenhouse gas emissions from the sources affected, with only a single associated cost. This will enable us
to study the environmental and economic advantages of an integrated approach to air quality issues and
climate change.
5.1.2 Regional integrated assessment tool plus (RIAT+)
RIAT+ is a regional Integrated Assessment Modelling tool developed during the OPERA project (LIFE09
ENV/IT/000092). It has been designed to help regional decision makers to select optimal air pollution
reduction policies that will improve the air quality at minimum costs. To achieve this, the system incorporates
explicitly the specific features of the area of interest with regional input data-set for the:

Contract № ENPI/2014/350-889 B3.2 - Report on Software in the air management sector
HUMAN DYNAMICS-IDOM CONSORTIUM
Page 31 of 37
• precursor emissions of local and surrounding sources
• abatement measures (technical and non-technical/energy) described per activity sector and
technology with information on application rates, emission removal efficiency factor and cost
• the effect of meteorology and prevailing chemical regimes through the use of site specific source-
receptor (S/R) functions
The tool allows two possible decision pathways: scenario analysis and optimization. The main outputs from
RIAT+ are a summary of emission reductions on the domain, a table of the application rates for the different
measures, maps of a set of relevant air quality indexes (AQIs) and, for the optimization pathway, the Pareto
Curve providing the efficient solutions of a specific AQI ranked by costs.
The S/R model is used, internally, to link emissions to an AQI. The S/R model can be as simple as a linear
relationship, or as complex as a chemical transport model. To limit the computational time, RIAT+ currently
uses a nonlinear relations identified by means of Artificial Neural Networks (ANNs), tuned to replicate the
results of a limited set of simulations performed by the users with deterministic air quality model calibrated
of the specific site.
RIAT+ has been already tested and applied in different EU Regions with various aims:
• in Emilia-Romagna Region (IT) in the optimization way to estimate the effectiveness of measures
(both technical and efficiency measures) contained in the AQP
• in Alsace Region (FR) in the optimization way to support the implementation of an action plan like
SRCAE (Regional Scheme on Climate, Air and Energy) identifying the most effective technical and
energy measures
• in Lombardy Region (IT) in scenario mode to estimate the costs and the benefits of both technical
and efficiency measures contained in the AQP
Contract № ENPI/2014/350-889 B3.2 - Report on Software in the air management sector
HUMAN DYNAMICS-IDOM CONSORTIUM
Page 32 of 37
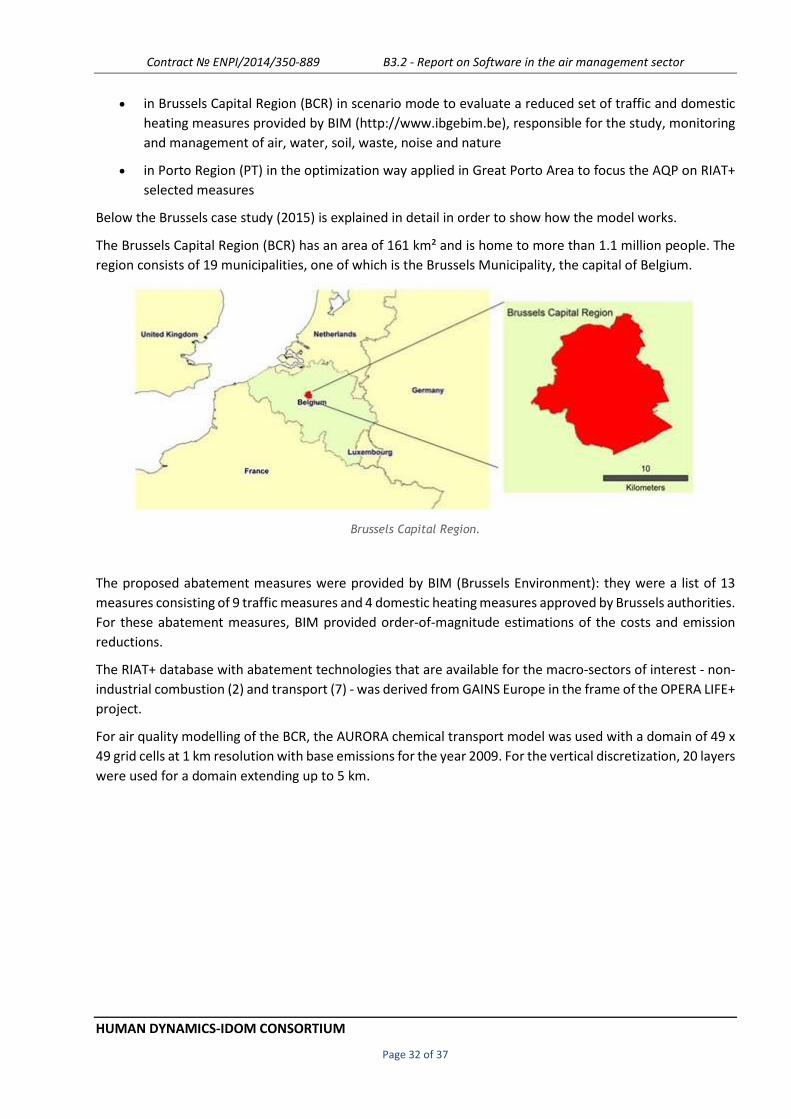
• in Brussels Capital Region (BCR) in scenario mode to evaluate a reduced set of traffic and domestic
heating measures provided by BIM (http://www.ibgebim.be), responsible for the study, monitoring
and management of air, water, soil, waste, noise and nature
• in Porto Region (PT) in the optimization way applied in Great Porto Area to focus the AQP on RIAT+
selected measures
Below the Brussels case study (2015) is explained in detail in order to show how the model works.
The Brussels Capital Region (BCR) has an area of 161 km² and is home to more than 1.1 million people. The
region consists of 19 municipalities, one of which is the Brussels Municipality, the capital of Belgium.
Brussels Capital Region.
The proposed abatement measures were provided by BIM (Brussels Environment): they were a list of 13
measures consisting of 9 traffic measures and 4 domestic heating measures approved by Brussels authorities.
For these abatement measures, BIM provided order-of-magnitude estimations of the costs and emission
reductions.
The RIAT+ database with abatement technologies that are available for the macro-sectors of interest - non-
industrial combustion (2) and transport (7) - was derived from GAINS Europe in the frame of the OPERA LIFE+
project.
For air quality modelling of the BCR, the AURORA chemical transport model was used with a domain of 49 x
49 grid cells at 1 km resolution with base emissions for the year 2009. For the vertical discretization, 20 layers
were used for a domain extending up to 5 km.

Contract № ENPI/2014/350-889 B3.2 - Report on Software in the air management sector
HUMAN DYNAMICS-IDOM CONSORTIUM
Page 33 of 37
Brussels domain simulation.
The results of the 1 km resolution model setup were validated by comparison to the observed values at the
measurement stations inside the model domain. For the model validation, the FAIRMODE methodology
(http://fairmode.jrc.ec.europa.eu/) was adopted.
For the Design of Experiment phase, three levels of emission reduction were distinguished: base case (B),
high emission reductions (H) and low emission reductions (L). In order to determine the emission reduction
scenarios, the three levels B, H, L were combined to produce 14 emission scenarios..
RIAT+ could be also run to look for optimal policies beyond the 2020 Current legislation. As the emission
changes, that can be obtained with the selected set of measures, are limited, unsurprisingly, the
concentration changes are also limited. Following figure 16 shows an example of NO2 concentration changes
due to the emission abatement measures.

Contract № ENPI/2014/350-889 B3.2 - Report on Software in the air management sector
HUMAN DYNAMICS-IDOM CONSORTIUM
Page 34 of 37
NO2 concentration changes traffic&non industrial heating measures.
5.1.3 GAINS
GAINS explores cost-effective multi-pollutant emission control strategies that meet environmental
objectives on air quality impacts (on human health and ecosystems) and greenhouse gases.
It is well known and used broadly by MNREP and their external experts.
5.1.4 GEM-E3 macro-economic model
The GEM-E3 model is a model connected with gains used to model the macro-economic impacts of emission
control strategies for all Member States of the European Union.
GEM-E3 is a model that covers the interactions between the economy, the energy system and the
environment, especially designed to evaluate energy, climate and environmental policies. GEM-E3 can
evaluate consistently the distributional and macro-economic effects of policies for the various economic
sectors and agents across the countries. GEM-E3 is used regularly to provide analytical support to European
Commission services, particularly with regards to the economics of climate change. The model is extensively
used as a tool of policy analysis and impact assessment.
GEM-E3 allows for a consistent comparative analysis of policy scenarios since it ensures that in all scenarios,
the economic system remains in general equilibrium. In addition it incorporates micro-economic
mechanisms and institutional features within a consistent macro-economic framework and avoids the
representation of behaviour in reduced form. Particularly valuable are the insights the model provides
regarding the distributional aspects of long-term structural adjustments.
The model intends, in particular, to analyse the global climate change issue a theme that embraces several
aspects and interactions within the economy, energy and environment systems. To reduce greenhouse gas
emissions it is necessary to achieve substantial gains in energy conservation and in efficiency in electricity
Contract № ENPI/2014/350-889 B3.2 - Report on Software in the air management sector
HUMAN DYNAMICS-IDOM CONSORTIUM
Page 35 of 37
generation, as well as to perform important fuel substitutions throughout the energy system, in favour of
less carbon intensive energy forms.
Moreover, within the context of increasingly competitive markets, new policy issues arise. For example, it is
necessary to give priority to market-oriented policy instruments, such as carbon taxes and pollution permits,
and to consider market-driven structural changes, in order to maximise effectiveness and alleviate
macroeconomic consequences. Re-structuring of economic sectors and re-location of industrial activities
may be also induced by climate change policies. This may have further implications on income distribution,
employment, public finance and the current account.
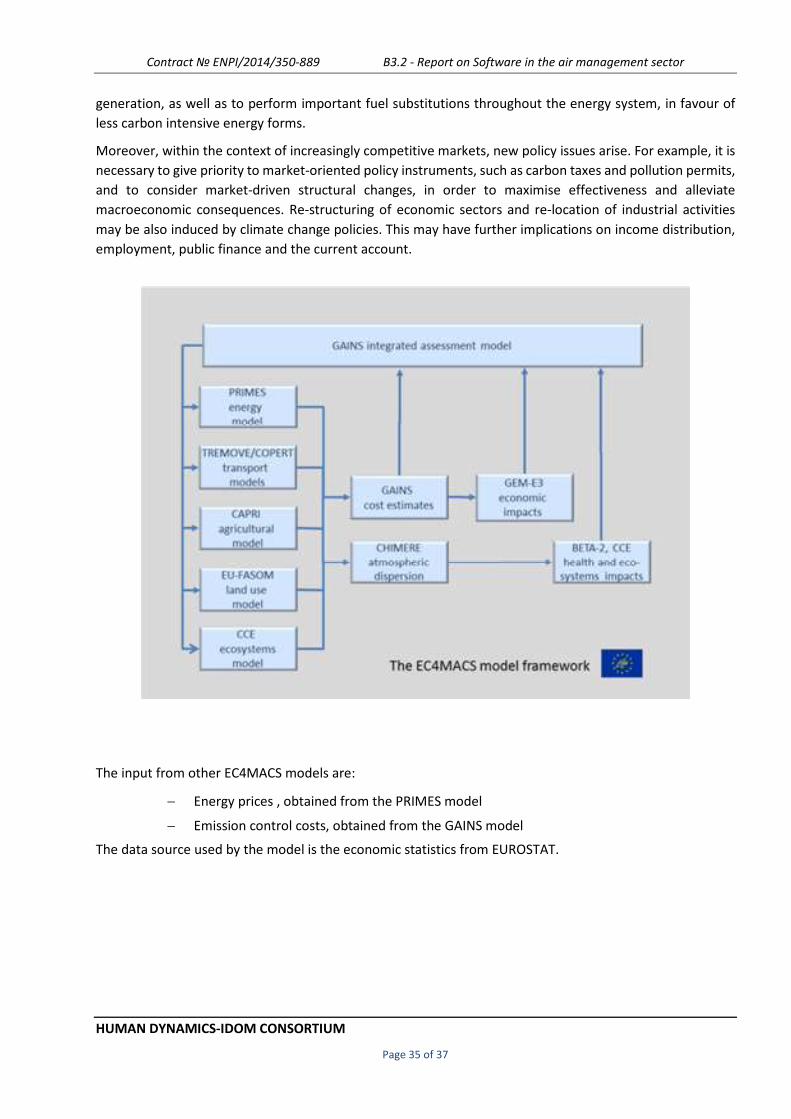
The input from other EC4MACS models are:
− Energy prices , obtained from the PRIMES model
− Emission control costs, obtained from the GAINS model
The data source used by the model is the economic statistics from EUROSTAT.

Contract № ENPI/2014/350-889 B3.2 - Report on Software in the air management sector
HUMAN DYNAMICS-IDOM CONSORTIUM
Page 36 of 37
6 CONCLUSION AND PROPOSAL OF FURTHER ACTIONS
6.1 CONCLUSIONS
• The main stages in the emission inventory preparation has been described for 6 different
countries in Europe. In all cases except one, the inventories are developed in their own database
(based in Oracle, excel, access, …etc.), without the use of a commercial software.
• The NKE has found in Europe a specific software able to carry out reporting on the pollutants
emissions in the EMEP format “Collecter”. It could be a very useful tool for national emission
inventory compilers- particularly for countries which are starting out with their inventory
compilation, and therefore don't already have their own database/data collection system.
However only Denmark uses this tool for supporting the emission inventory. The rest of the
European countries develops their own inventory using their own databases and the results are
adapted depending on the required report.
• The main data sources are national statistics, energy balances, agricultural statistics, etc. or any
other reporting in line with other national/international reporting requirements.
• In most of the countries large combustion plants, e.g. power plants, municipal waste incineration
plants and large industrial plants are registered individually as large point sources. This enables
use of plant-specific emission factors that refer to emission measurements stated in annual
environmental reports.
• Another factor that is critical to the success of the overall process in the emission inventory is
the selection and review of, and (where necessary) changes in, data sources, since the quality of
results of all downstream processes (data preparation, calculation, reporting) cannot be better
than that of the primary data used.
• Further, Member States are encouraged to report their emission inventories on the basis of fuel
sold for the ‘Road transport’ sector, in line with the reporting guidelines (UNECE, 2014a).
Reporting of “fuel sold” is a minimum requirement although a number of countries may choose
to additionally report road transport emissions on the basis of “fuel used” for compliance
checking purposes.
• The best international practice is to have the same team of experts working both on air quality
and greenhouse gases emission inventories.
• The quality of the inventory should be improved by the organization and participation in sector
specific workshops.
• A specific procedure undertaken for improving the inventory regards the establishment of
national expert panels (in particular, in road transport, land use change and forestry and energy
sectors) which involve, on a voluntary basis, different institutions, local agencies and industrial
associations cooperating for improving activity data and emission factors accuracy.
• Focusing on the energy sector and industrial processes, it is important the maintaining of an air
quality emission inventory, not only for the purpose of reporting under the Convention, but also
for:
• formulating national policies and measures,
• for various projection and modelling studies,
• for the assessment of impacts on health, economy and environment, and
Contract № ENPI/2014/350-889 B3.2 - Report on Software in the air management sector
HUMAN DYNAMICS-IDOM CONSORTIUM
Page 37 of 37
• for the evaluation of energy efficiency measures.
• Atmospheric dispersion modelling is an essential tool in air quality management by providing
the link between environmental effects and discharges to air.
• Air dispersion
6.2 PROPOSAL FOR BELARUS
• The Belarus inventory will be continuously amended due to the use of more detailed
methodologies, better access to underlying data and better knowledge, and development of
complementary studies. This is the normal process in Europe. It is not necessary to develop an
specific software for the inventory and reporting.
• In order to improve the emission inventory in Belarus, emission inventory questionnaires should
be used by specific sector in order to report their emissions. Some questionnaires are annexed
to this report to serve as an example.
• Air dispersion models are needed to be used by large companies or specific municipalities in
order to know the current impact of their air emissions.
• Air dispersion models can be used as tool for cost-benefit analysis in order to evaluate the
environmental benefit of a specific measure projected for reducing the emissions to the air.
• GAINS model provides a consistent framework for the analysis of cost-benefits reduction
strategies from air pollution. It is recommended to use GAINS as a tool for assess in a global
perspective the effect of emissions reduction after the implementation of one of the 2000
specific emission control measures and their costs.
• With regards to limited number of sectors simple models (e.g. Excel sheets) could be developed
to easy calculate the expected costs and benefits adherent to certain actions for pollution
reduction. These are fast working tools but their uncertainty is high.
• NKE also recommends following complementary actions.
• Implementation of automated measuring systems in the stationary source emissions, at least
in the large combustion plants.
• Improvement of the air quality network.
• Elaboration of air quality planning. Plans and Programs should be developed for regions
where limit values are exceeded. These plans should include different measures to reduce
emissions from different sectors, e.g. reduce industrial or residential combustion emissions,
introduction of Low Emission Zones ...etc. The plan also should include a cost analysis for
each proposed measure. For the development of these plans, following aspects should be
taken into account:
• Selection of activities and categories that will be considered.
• Identifying the main industries in Belarus
• To determine the air quality areas and to identify the critical emissions areas