composition of organic gas emissions from flaring natural gas · 1980s using engineering judgment...
TRANSCRIPT

AUGUST 18, 2017
FLARING PROFILE
COMPOSITION OF ORGANIC GAS EMISSIONS FROM FLARING NATURAL GAS
1
Tejas Shah, Ramboll Environ (EPA Contractor)

AUGUST 18, 2017
FLARING PROFILE
CO-AUTHORS
• Greg Yarwood - Ramboll Environ
• Alison Eyth - EPA/OAQPS
• Madeleine Strum - EPA/OAQPS
2

AUGUST 18, 2017
FLARING PROFILE
BACKGROUND
• Flares are used to abate venting of natural gas and other combustible gases from oil/gas production wells, hydrocarbon processing plants or refineries as a safety measure and as a means of disposal to reduce environmental impacts
• Natural gas flaring is a common practice in oil/gas exploration, production and processing operations
• Speciation profiles are needed to apportion Total Organic Gas (TOG) emissions from flaring to individual organic gases for air quality modeling
3

AUGUST 18, 2017
FLARING PROFILE
SPECIATE PROFILE 0051
• SPECIATE profile 0051 used for natural gas flaring was developed in the 1980s using engineering judgment
• Note that the weight percent all appear to be rounded to the nearest multiple of 10
• The profile origin is noted as : “Information based on composite survey data, engineering evaluation of literature data”
4
Name Weight %
Methane 20
Ethane 30
Formaldehyde 20
Propane 30

AUGUST 18, 2017
FLARING PROFILE
NEED FOR A NEW FLARING PROFILE BASED ON DATA
• The flare TOG 20% formaldehyde fraction seems high and the source of the original profile could not be found
o Formaldehyde is a photochemically reactive ozone precursor and also a hazardous air pollutant (HAP)
• Small amounts of uncombusted vent gas will escape the flare combustion zone along with products of incomplete combustion
• Need to replace profile 0051 with speciation profiles for natural gas flaring that are based on data
5

AUGUST 18, 2017
FLARING PROFILE
FLARE DESTRUCTION AND REMOVAL EFFICIENCY
• Studies have found that in-service flares can operate at a wide range of Destruction and Removal Efficiency (DRE)
o Steam- or air-assisted, assist rates
o Lower heating value
o Vent gas composition and flow rates
• Small amounts of uncombusted vent gas will escape the flare combustion zone along with products of incomplete combustion
• Useful to have speciation profiles that are appropriate for different ranges of DRE performance
6

AUGUST 18, 2017
FLARING PROFILE
TCEQ FLARE STUDY
• In 2010, TCEQ sponsored a flare study that was conducted by the University of Texas at Austin (UT) at the John Zink test facility in Tulsa, OK https://www.tceq.texas.gov/assets/public/implementation/air/rules/Flare/2010flarestud
y/2010-flare-study-final-report.pdf
• The study provides comprehensive and detailed emissions composition data for two flares operated over ranges of conditions and vent gas composition
• The study is the best available source of information on composition of flare TOG emissions
7

AUGUST 18, 2017
FLARING PROFILE
STRENGTHS AND WEAKNESSES OF TCEQ FLARE STUDY
Strength (for addressing our objective)
➢Measured comprehensive speciation of vent gas and combustion products in flare plumes
➢Measured emissions for a range of DRE
➢ Included measurement data for steam- and air-assisted flares
Weaknesses (for addressing our objective)
➢ Type of flare and the fuel used are not matched to oil and natural gas production
➢ Focused on emissions from industrial flares used in petrochemicals manufacturing
8

AUGUST 18, 2017
FLARING PROFILE
ANALYSIS OF TCEQ FLARE STUDY RESULTS
• Analyzed data for the air assisted flare as being more representative of flares used in oil and natural gas production.
• Report (Table 9-1) provides a detailed list of hydrocarbon emissions found in flare plume of an air-assisted flare burning a propylene/natural gas mixture
• Emissions data are reported as mass per mass of propylene which was converted into weight percent of TOG
9

AUGUST 18, 2017
FLARING PROFILE
LIST OF HYDROCARBONS EMISSIONS IN FLARE PLUME
10
Reference: Allen and Torres, 2011

AUGUST 18, 2017
FLARING PROFILE
ANALYSIS OF HYDROCARBONS EMISSIONS IN FLARE PLUME
• Organic gas weight percent data are plotted against DRE
• Compounds plotted can be classified as unburned vent gas (propylene, methane, ethane) or products of incomplete combustion (the other gases)
• This classification can explain variations in weight percent with DRE
11
0.00%
0.01%
0.10%
1.00%
10.00%
100.00%
70% 75% 80% 85% 90% 95% 100%
Pe
rce
nt
of
TOG
Representative DRE for analysis
Acetylene
Ethylene
Propylene
Butene isomers
Formaldehyde
Acetaldehyde
Propanal
Acrolein
Methanol
Acetone
Propylene Oxide
Methane
Ethane
AUGUST 18, 2017
FLARING PROFILE
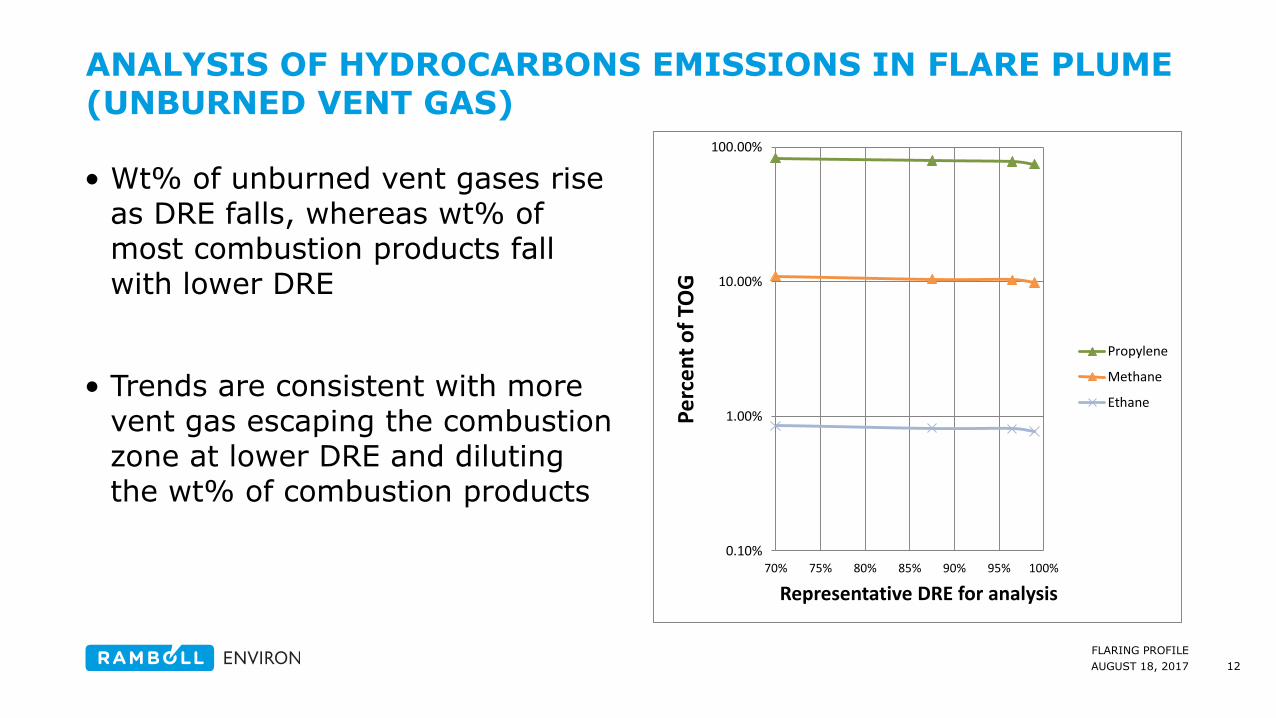
ANALYSIS OF HYDROCARBONS EMISSIONS IN FLARE PLUME(UNBURNED VENT GAS)
• Wt% of unburned vent gases rise as DRE falls, whereas wt% of most combustion products fall with lower DRE
• Trends are consistent with more vent gas escaping the combustion zone at lower DRE and diluting the wt% of combustion products
12
0.10%
1.00%
10.00%
100.00%
70% 75% 80% 85% 90% 95% 100%
Pe
rce
nt
of
TOG
Representative DRE for analysis
Propylene
Methane
Ethane

AUGUST 18, 2017
FLARING PROFILE
ANALYSIS OF HYDROCARBONS EMISSIONS IN FLARE PLUME(PRODUCTS OF INCOMPLETE COMBUSTION)
• Ethylene and acetylene are ubiquitous products of hydrocarbon pyrolysis formed by cracking fuel molecules and by radical reactions in fuel-rich portions of the flame
• Small aldehydes (formaldehyde, acetaldehyde) are ubiquitous products of hydrocarbon oxidation formed in portions of the flame that contain oxygen
13
0.10%
1.00%
10.00%
100.00%
70% 75% 80% 85% 90% 95% 100%
Pe
rce
nt
of
TOG
Representative DRE for analysis
Acetylene
Ethylene
Formaldehyde
Acetaldehyde

AUGUST 18, 2017
FLARING PROFILE
ANALYSIS OF HYDROCARBONS EMISSIONS IN FLARE PLUME
• Butenes show a different dependence on DRE suggesting that they are formed by a unique mechanism such as interaction between propylene from the vent gas and carbene radical (CH2) formed by combustion
• Combustion products containing 3 carbon atoms (acetone, propanal, propylene oxide) are likely to be from propylene which also has 3 carbon atoms
14
0.00%
0.01%
0.10%
1.00%
10.00%
100.00%
70% 75% 80% 85% 90% 95% 100%
Pe
rce
nt
of
TOG
Representative DRE for analysis
Butene isomers
Propanal
Acetone
Propylene Oxide

AUGUST 18, 2017
FLARING PROFILE
COMPOSITION OF INCOMPLETE COMBUSTION USED IN FLARE SPECIATION PROFILES
15
• Assuming that products of incomplete combustion containing 1 or 2 carbon atoms are ubiquitous in hydrocarbon flames, we derive representative composition for products of incomplete combustion
• Composition data in the table are unsuitable for directly speciating flare emissions because they contain no unburned vent gases
CompoundDRE Range
> 0.98 0.95 - 0.98 0.8 - 0.95 < 0.8
Formaldehyde 27% 26% 24% 24%
Methanol 1% 1% 1% 2%
Acetaldehyde 18% 16% 14% 13%
Acetylene 36% 39% 42% 42%
Ethylene 18% 18% 18% 18%
Total 100% 100% 100% 100%

AUGUST 18, 2017
FLARING PROFILE
CONTRIBUTION OF UNBURNED VENT GAS AND INCOMPLETE COMBUSTION
• By summing weight percentages of unburned vent gases and products of incomplete combustion, we obtain relative contributions to total TOG emissions
• Relative contributions of unburned vent gas and products of incomplete combustion provide a basis for developing complete flare speciation profiles
16
Components
DRE Range
> 0.98 0.95 - 0.98 0.8 - 0.95 < 0.8
Unburned vent gas 85% 89% 91% 95%
Products of
incomplete
combustion
15% 11% 9% 5%
Total 100% 100% 100% 100%

AUGUST 18, 2017
FLARING PROFILE
COMPOSITION OF VENT GAS USED IN FLARE SPECIATION PROFILES
• Products of incomplete combustion can be speciated using data in the previous table whereas the unburned vent gas can be speciated using application-specific data such as the produced-gas composition for a particular natural gas play
• This method is illustrated using data from SPECIATE profile 8949 -"Natural Gas Production"
Compound Weight(%)
Methane 69.500
Ethane 11.200
Propane 8.560
Butane 5.710
Pentane 2.850
Hexane 0.412
Benzene 0.088
Toluene 0.078
2,2,4-trimethylpentane 0.116
Ethylbenzene 0.005
Isomers of xylene 0.022
Isomers of hexane 1.480
17

AUGUST 18, 2017
FLARING PROFILE
COMPOSITE NATURAL GAS FLARING PROFILE
• TOG speciation profiles for flaring natural gas are composited from the speciation data for incomplete combustion and vented gas using relative contributions
• The profiles can be used as default speciation for flaring natural gas if the composition of the vented natural gas is unknown
CompoundSPECIATE
ID
DRE Range
> 0.98 0.95 - 0.98 0.8 - 0.95 < 0.8
Weight(%)
Formaldehyde 465 3.910 2.710 2.220 1.250
Methanol 531 0.169 0.126 0.136 0.119
Acetaldehyde 279 2.600 1.720 1.320 0.678
Acetylene 282 5.290 4.100 3.910 2.150
Ethylene 452 2.600 1.860 1.620 0.916
Methane 529 59.300 62.200 63.100 65.900
Ethane 438 9.570 10.000 10.200 10.600
Propane 671 7.320 7.660 7.770 8.130
Butane 592 4.880 5.110 5.180 5.420
Pentane 605 2.440 2.550 2.590 2.710
Hexane 601 0.352 0.369 0.374 0.391
Benzene 302 0.075 0.079 0.080 0.083
Toluene 717 0.067 0.070 0.071 0.074
2,2,4-
trimethylpentane118 0.099 0.104 0.106 0.110
Ethylbenzene 449 0.004 0.004 0.005 0.005
Isomers of xylene 507 0.019 0.020 0.020 0.021
Isomers of hexane 2127 1.260 1.320 1.340 1.400
18

AUGUST 18, 2017
FLARING PROFILE
RATIOS OF FORMALDEHYDE FOR NATURAL GAS FLARING PROFILES
• Formaldehyde content of flare emissions is of specific interest because formaldehyde is photochemically reactive and a HAP
• Formaldehyde/VOC ratios for the profiles range from 5.3% to 12.6% whereas the formaldehyde/TOG ratios range from 1.2% to 3.9%
o Formaldehyde percentages vary with DRE
o Lower DRE reduces formaldehyde percentage
• For comparison, SPECIATE profile 0051 (Flares - Natural Gas) has 40% formaldehyde/VOC and 20% formaldehyde/TOG
19

AUGUST 18, 2017
FLARING PROFILE
REFERENCES
• Allen, D. T. & Torres, V. M. (2011). TCEQ 2010 Flare Study Final Report. Report prepared for the Texas Commission on Environmental Quality. Available at: www.tceq.texas.gov/assets/public/implementation/air/rules/Flare/TCEQ2010FlareStudyDraftFinalReport.pdf
• Torres, V. M., Herndon, S., Kodesh, Z., & Allen, D. T. (2012). Industrial flare performance at low flow conditions. 1. Study overview. Industrial & Engineering Chemistry Research, 51(39), 12559-12568.
20

AUGUST 18, 2017
FLARING PROFILE
THANK YOU
21