comprehensive annual financial report of the j.o. combs unified school district no… ·...
TRANSCRIPT
COMPREHENSIVE ANNUAL FINANCIAL REPORT
OF THE
J.O. COMBS UNIFIED SCHOOL DISTRICT NO. 44
SAN TAN VALLEY, ARIZONA
FOR THE
YEAR ENDED JUNE 30, 2014
Prepared by
Karla Slovitsky Director of Business Services

THIS PAGE BLANK

J.O. COMBS UNIFIED SCHOOL DISTRICT NO. 44 TABLE OF CONTENTS
YEAR ENDED JUNE 30, 2014
INTRODUCTORY SECTION
LETTER OF TRANSMITTAL 1
LIST OF PRINCIPAL OFFICIALS 6
ORGANIZATIONAL CHART 7
ASBO CERTIFICATE OF EXCELLENCE 8
GFOA CERTIFICATE OF EXCELLENCE 9
FINANCIAL SECTION
INDEPENDENT AUDITORS’ REPORT 10
REQUIRED SUPPLEMENTARY INFORMATION
MANAGEMENT’S DISCUSSION AND ANALYSIS 13
BASIC FINANCIAL STATEMENTS
STATEMENT OF NET POSITION 22
STATEMENT OF ACTIVITIES 23
BALANCE SHEET – GOVERNMENTAL FUNDS 24
RECONCILIATION OF THE BALANCE SHEET OF GOVERNMENTAL FUNDS TO THE STATEMENT OF NET POSITION 26
STATEMENT OF REVENUE, EXPENDITURES, AND CHANGE IN FUND BALANCES – GOVERNMENTAL FUNDS 27
RECONCILIATION OF THE STATEMENT OF REVENUE, EXPENDITURES, AND CHANGE IN FUND BALANCES OF GOVERNMENTAL FUNDS TO THE STATEMENT OF ACTIVITIES 29
STATEMENT OF FIDUCIARY ASSETS AND LIABILITIES – FIDUCIARY FUNDS 30
NOTES TO BASIC FINANCIAL STATEMENTS 31
REQUIRED SUPPLEMENTARY INFORMATION
SCHEDULE OF REVENUES, EXPENDITURES, AND CHANGE IN FUND BALANCE – BUDGET AND ACTUAL – GENERAL FUND – BUDGETARY BASIS 49
SCHEDULE OF REVENUES, EXPENDITURES, AND CHANGE IN FUND BALANCE – BUDGET AND ACTUAL – SPECIAL PROJECTS FUND 50
SCHEDULE OF REVENUES, EXPENDITURES, AND CHANGE IN FUND BALANCE – BUDGET AND ACTUAL – OTHER SPECIAL REVENUE FUND 51
NOTE TO REQUIRED SUPPLEMENTARY INFORMATION 52
J.O. COMBS UNIFIED SCHOOL DISTRICT NO. 44 TABLE OF CONTENTS (CONTINUED)
YEAR ENDED JUNE 30, 2014
COMBINING AND INDIVIDUAL FUND STATEMENTS AND SCHEDULES
NONMAJOR GOVERNMENTAL FUNDS
COMBINING BALANCE SHEET 53
COMBINING STATEMENT OF REVENUES, EXPENDITURES, AND CHANGE IN FUND BALANCES 55
SCHEDULE OF REVENUE, EXPENDITURES, AND CHANGE IN FUND BALANCE – BUDGET AND ACTUAL – DEBT SERVICE FUND 57
SCHEDULE OF REVENUE, EXPENDITURES, AND CHANGE IN FUND BALANCE – BUDGET AND ACTUAL – ADJACENT WAYS FUND 58
SCHEDULE OF REVENUE, EXPENDITURES, AND CHANGE IN FUND BALANCE – BUDGET AND ACTUAL – INSTRUCTIONAL IMPROVEMENT FUND 59
SCHEDULE OF REVENUE, EXPENDITURES, AND CHANGE IN FUND BALANCE – BUDGET AND ACTUAL – CLASSROOM SITE FUND 60
SCHEDULE OF REVENUE, EXPENDITURES, AND CHANGE IN FUND BALANCE – BUDGET AND ACTUAL – FOOD SERVICE FUND 61
SCHEDULE OF REVENUE, EXPENDITURES, AND CHANGE IN FUND BALANCE – BUDGET AND ACTUAL – BOND BUILDING FUND 62
SCHEDULE OF REVENUE, EXPENDITURES, AND CHANGE IN FUND BALANCE – BUDGET AND ACTUAL – NEW SCHOOL FACILITIES FUND 63
AGENCY FUNDS
COMBINING STATEMENT OF FIDUCIARY ASSETS AND LIABILITIES 64
COMBINING STATEMENT OF CHANGES IN ASSETS AND LIABILITIES 65
STATISTICAL SECTION (UNAUDITED)
FINANCIAL TRENDS
NET POSITION BY COMPONENT 66
CHANGES IN NET POSITION 67
FUND BALANCES OF GOVERNMENTAL FUNDS 69
CHANGES IN FUND BALANCES OF GOVERNMENTAL FUNDS 70
REVENUE CAPACITY
ASSESSED VALUE AND ESTIMATED ACTUAL VALUE OF TAXABLE PROPERTY 72
PROPERTY TAX RATES – DIRECT AND OVERLAPPING GOVERNMENTS 73
PRINCIPAL PROPERTY TAXPAYERS 74
PROPERTY TAX LEVIES AND COLLECTIONS 75

J.O. COMBS UNIFIED SCHOOL DISTRICT NO. 44 TABLE OF CONTENTS (CONTINUED)
YEAR ENDED JUNE 30, 2014
STATISTICAL SECTION (UNAUDITED)(CONTINUED)
DEBT CAPACITY
RATIO OF OUTSTANDING DEBT BY TYPE 76
RATIOS OF GENERAL BONDED DEBT OUTSTANDING 77
DIRECT AND OVERLAPPING GOVERNMENTAL ACTIVITIES DEBT 78
LEGAL DEBT MARGIN INFORMATION 79
CALCULATION OF LEGAL DEBT MARGIN 80
DEMOGRAPHIC AND ECONOMIC INFORMATION
DEMOGRAPHIC AND ECONOMIC STATISTICS 81
PRINCIPAL EMPLOYERS 82
OPERATING INFORMATION
FULL-TIME EQUIVALENT EMPLOYEES BY FUNCTION 83
OPERATING STATISTICS 84
SCHOOL BUILDING INFORMATION 85

THIS PAGE BLANK

INTRODUCTORY SECTION

THIS PAGE BLANK
(1)
December 17, 2014 Governing Board and Citizens J.O. Combs Unified School District No. 44 301 East Combs Road San Tan Valley, Arizona 85140 State law requires the J.O. Combs Unified School District No. 44 (District) to undergo an annual audit and publish a complete set of financial statements presented in conformity with accounting principles generally accepted in the United States of America and audited in accordance with auditing standards generally accepted in the United States of America by a certified public accounting firm of licensed in the State of Arizona. Pursuant to that requirement, we hereby issue the comprehensive annual financial report of the J.O. Combs Unified School District No. 44 for the fiscal year ended June 30, 2014. The report consists of management’s representations concerning the finances of the District. Consequently, management assumes full responsibility for the completeness and reliability of all of the information presented in this report. To provide a reasonable basis for making these representations, management of the District has established a comprehensive internal control framework that is designed both to protect the District’s assets from loss, theft, or misuse and to compile sufficient reliable information for the preparations of the District’s financial statements in conformity with accounting principles generally accepted in the United States of America. Because the cost of internal controls should not outweigh their benefits, the District’s comprehensive framework of internal controls has been designed to provide reasonable rather than absolute assurance that the financial statements will be free of material misstatement. As management, we assert that, to the best of our knowledge and belief, this financial report is complete and reliable in all material respects. The District's financial statements have been audited by CliftonLarsonAllen LLP, a certified public accounting firm. The goal of the independent audit was to provide reasonable assurance that the financial statements of the District for the fiscal year ended June 30, 2014, are free of material misstatement. The independent audit involved examining, on a test basis, evidence supporting the amounts and disclosures in the financial statements; assessing the accounting principles used and significant estimates made by management; and evaluating the overall financial statement presentation. The independent auditor concluded, based upon the audit, that there was a reasonable basis for rendering an unmodified opinion that the District's financial statements for the fiscal year ended June 30, 2014, are fairly presented in conformity with accounting principles generally accepted in the United States of America. The independent auditor's report is presented as the first component of the financial section of this report.
(2)
The independent audit of the financial statements of the District was part of a broader, federally mandated "Single Audit" as required by the provisions of the Single Audit Act Amendments of 1996 and U.S. Office of Management and Budget Circular A-133, Audits of State, Local Governments and Non-Profits Organizations designed to meet the special needs of federal grantor agencies. The standards governing Single Audit engagements require the independent auditor to report not only on the fair presentation of the financial statements, but also on the District’s internal controls and compliance with legal requirements, with special emphasis on internal controls and legal requirements involving the administration of federal awards. These reports are available in a separately issued Single Audit Reporting Package. Accounting principles generally accepted in the United States of America require that management provide a narrative introduction, overview, and analysis to accompany the basic financial statements in the form of Management's Discussion and Analysis (MD&A). This letter of transmittal is designed to complement the MD&A and should be read in conjunction with it. The District's MD&A can be found immediately following the report of the independent auditors.
PROFILE OF THE DISTRICT
The District is one of 19 public school districts located in Pinal County, Arizona. It provides a program of public education from preschool through grade twelve. The 2013-14 average daily membership was 4275 students which are served in 5 elementary schools, 1 middle school, and 1 high school. The average age of the school buildings is 9 years. The District’s Governing Board is organized under Section 15-321 of the Arizona Revised Statutes (A.R.S.). Management of the District is independent of other state or local governments. The County Treasurer collects taxes for the District, but exercises no control over its expenditures/expense. The membership of the Governing Board consists of five members elected by the public. Under existing statutes, the Governing Board’s duties and powers include, but are not limited to, the acquisition, maintenance and disposition of school property; the development and adoption of a school program; and the establishment, organization and operation of schools. The Board also has broad financial responsibilities, including the approval of the annual budget, and the establishment of a system of accounting and budgetary controls. The financial reporting entity consists of a primary government and its component units. A component unit is a legally separate entity that must be included in the reporting entity in conformity with generally accepted accounting principles. The District is a primary government because it is a special-purpose government that has a separately elected governing body, is legally separate, and is fiscally independent of other state or local governments. Furthermore, there are no components units combined with the District for financial statements presentation purposes, and the District is not included in any other governmental reporting entity. Consequently, the District’s financial statements include only the funds of those organizational entities for which its elected governing board is financially accountable. The District’s major operations include education, student transportation, construction and maintenance of the District facilities, food services, bookstore and athletic functions. The District is located in the northwest portion of Pinal County in an unincorporated area identified as San Tan Valley. The District is bordered to the west by Queen Creek, north by Apache Junction and to the south is the town of Florence. The District encompasses 68 square miles, but schools are located in a 16 mile square area, and are located approximately 45 miles southeast of the city of Phoenix. The District includes both urban and rural populations.

(3)
The annual expenditure budget serves as the foundation for the District’s financial planning and control. The objective of these budgetary controls is to ensure compliance with legal provisions embodied in the annual expenditure budget approved by the District’s Governing Board. The expenditure budget is prepared by fund for all Governmental Funds, and includes function and object code details for the General Fund and some Special Revenue and Capital Projects Funds. The legal level of budgetary control (that is, the level at which expenditures cannot exceed the appropriated amount) is established at the individual fund level for all funds. Funds that are not required to legally adopt a budget may have over expenditures of budgeted funds. The budget for these funds is simply an estimate and does not prevent the District from exceeding the budget as long as the necessary revenue is earned. The District is not required to prepare an annual budget of revenue; therefore, a deficit budgeted fund balance may be presented. However, this does not affect the District’s ability to expend monies.
FACTORS AFFECTING FINANCIAL CONDITION
The information presented in the financial statements is perhaps best understood when it is considered from the broader perspective of the specific environment within which the District operates. Local Economy Pinal County is located in the south-east portion of Arizona and encompasses an area of approximately 5,374 square miles. Founded in 1875, it is the third most populous county in the state and the county seat is located in Florence. Pinal County is located between Arizona’s two largest metropolitan cities, Phoenix and Tucson, and growth has continued to move into the northern parts of the county. The growth in the unincorporated area of San Tan Valley has included the opening of Banner Ironwood Medical Center, which is the second largest employer, only after J.O. Combs Unified School District. According to Banner, over 1000 babies were born during 2012 and in 2013, indicating future growth for both the school district and the community. J.O. Combs Unified School District has an active partnership with Banner Ironwood through a student of the month program as well as support for Combs High School’s Medical Professions program. Additionally, Central Arizona College opened the San Tan Valley Campus during the 2013-14 school year. The San Tan Campus is a full-service campus, offering an array of academic degrees and certificates, career training, and personal enrichment classes in an environment that is both accessible and economical. Partnership programs for the Combs students and community include: Promise of the Future Scholarship, dual-enrollment classes, and early college programs for high school students. The District has experienced significant growth over the past ten years, resulting in the decision to transition from an elementary to a unified school district in 2006. The District opened its first high school in August of 2008 and had its first graduating class in May of 2012. In 2010, the District opened Combs Traditional Academy providing a “Back to Basic” option for families. The opening of this school site also helped to address the growth in the community.
(4)
Long-Term Financial Planning After a student decline in FY 12 at the K-8 level, the District’s ADM for 2013-14 declined by (5%) at the K-8 level but showed a gain of 12% at the 9-12 grade level. As our high school programs continue to expand and residential development begins to take place, the 9-12 ADM is expected to continue to grow. The District’s financial performance has been pressured in recent years as a result of state funding and a dip in K-8 student enrollment. The overall student enrollment was maintained from the year before, primarily as a result of the developing comprehensive high school in the District. In November 2013, the District failed to secure a renewal of the voter-approved tax override for a third time. The final phase down will reduce expenditure for the next fiscal year. Capital funding is becoming a growing concern. Bond funding is unavailable as property tax values have declined which resulted in the District exceeding its Class B bond limit. The construction of the Transportation/Maintenance facility was put on hold. Uses of the remaining bond proceeds are being carefully re-evaluated to ensure that the District maintains its facilities. In August of 2012 Standard & Poor’s rating service affirmed its “A” unenhanced underlying rating on Pinal County Unified School District No. 44 (J.O. Combs) Arizona’s general obligation debt outstanding. The outlook is stable. Certificates of Excellence The Association of School Business Officials (ASBO) offers a Certificate of Excellence in Financial Reporting by School Districts. This award certifies that the annual financial report substantially conforms to the principles and standards of financial reporting as recommended and adopted by the ASBO. J.O. Combs Unified School District was recognized for its high-quality Comprehensive Annual Financial Report for the fiscal year ending 2013. The award confirms the school business office’s commitment to financial accountability and transparency. Recognition through the Certificate of Excellence can help strengthen their presentation for bond issuance statements and promotes a high level of financial reporting. This was the fourth straight year the District has received this award. In addition, for the first time, the Government Finance Officers Association (GFOA) awarded a Certificate of Achievement for Excellence in Financial Reporting to the District, for its Comprehensive Annual Financial Report for the fiscal year ending June 30, 2013. In order to be awarded these certificates, the District published an easily readable and efficiently organized Comprehensive Annual Financial Report. This report satisfied both accounting principles generally accepted in the United States of America and applicable legal requirements. These certificates are valid for a period of one year only. We believe that our current Comprehensive Annual Financial Report continues to meet the programs’ requirements and we are submitting it to ASBO and GFOA to determine its eligibility for the fiscal year 2013-14 certificates.

(5)
Acknowledgements The preparation of this report could not have been accomplished without the entire Business Services staff. We would like to express our appreciation of all members of the Business Services Department for their continued dedication and hard work. Special thanks to CliftonLarsonAllen LLP, for their assistance and the professional manner in which they have accomplished the audit. Moreover, we wish to thank and express our appreciation to all the members of the Governing Board for their interest and support in conducting the financial affairs of the District in a responsible and progressive manner. Sincerely,
Gayle A. Blanchard – Superintendent Karla Slovitsky – Dir. of Bus. Services
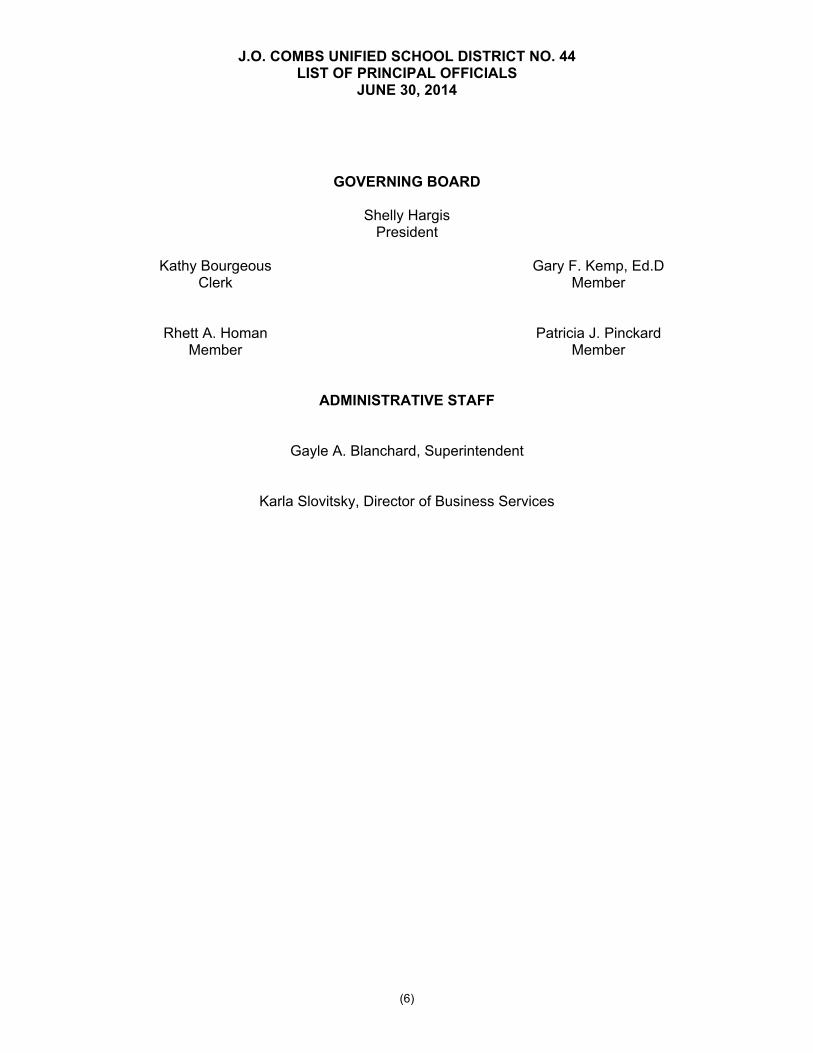
J.O. COMBS UNIFIED SCHOOL DISTRICT NO. 44 LIST OF PRINCIPAL OFFICIALS
JUNE 30, 2014
(6)
GOVERNING BOARD
Shelly Hargis President
Kathy Bourgeous Gary F. Kemp, Ed.D Clerk Member Rhett A. Homan Patricia J. Pinckard Member Member
ADMINISTRATIVE STAFF
Gayle A. Blanchard, Superintendent
Karla Slovitsky, Director of Business Services

J.O. COMBS UNIFIED SCHOOL DISTRICT NO. 44 ORGANIZATIONAL CHART
JUNE 30, 2014
(7)

(8)

(9)

THIS PAGE BLANK

FINANCIAL SECTION

THIS PAGE BLANK

An independent member of Nexia International
(10)
INDEPENDENT AUDITORS’ REPORT Governing Board J.O. Combs Unified School District No. 44 San Tan Valley, Arizona Report on the Financial Statements
We have audited the accompanying financial statements of the governmental activities, each major fund, and the aggregate remaining fund information of J.O. Combs Unified School District No. 44 (District), as of and for the year ended June 30, 2014, and the related notes to the financial statements, which collectively comprise the District’s basic financial statements as listed in the table of contents. Management’s Responsibility for the Financial Statements
Management is responsible for the preparation and fair presentation of these financial statements in accordance with accounting principles generally accepted in the United States of America; this includes the design, implementation, and maintenance of internal control relevant to the preparation and fair presentation of financial statements that are free from material misstatement, whether due to fraud or error. Auditors’ Responsibility
Our responsibility is to express opinions on these financial statements based on our audit. We conducted our audit in accordance with auditing standards generally accepted in the United States of America and the standards applicable to financial audits contained in Government Auditing Standards, issued by the Comptroller General of the United States. Those standards require that we plan and perform the audit to obtain reasonable assurance about whether the financial statements are free from material misstatement. An audit involves performing procedures to obtain audit evidence about the amounts and disclosures in the financial statements. The procedures selected depend on the auditors’ judgment, including the assessment of the risks of material misstatement of the financial statements, whether due to fraud or error. In making those risk assessments, the auditor considers internal control relevant to the District’s preparation and fair presentation of the financial statements in order to design audit procedures that are appropriate in the circumstances, but not for the purpose of expressing an opinion on the effectiveness of the District’s internal control. Accordingly, we express no such opinion. An audit also includes evaluating the appropriateness of accounting policies used and the reasonableness of significant accounting estimates made by management, as well as evaluating the overall presentation of the financial statements. We believe that the audit evidence we have obtained is sufficient and appropriate to provide a basis for our audit opinions.

Governing Board J.O. Combs Unified School District No. 44
(11)
Opinions
In our opinion, the financial statements referred to above present fairly, in all material respects, the respective financial position of the governmental activities, each major fund, and the aggregate remaining fund information of the J.O. Combs Unified School District No. 44 as of June 30, 2014, and the respective changes in financial position thereof for the year then ended in accordance with accounting principles generally accepted in the United States of America. Other Matters
Required Supplementary Information
Accounting principles generally accepted in the United States of America require that the management’s discussion and analysis on pages 13-21 and the budgetary information on pages 49-51, be presented to supplement the basic financial statements. Such information, although not a part of the basic financial statements, is required by the Governmental Accounting Standards Board who considers it to be an essential part of financial reporting for placing the basic financial statements in an appropriate operational, economic, or historical context. We have applied certain limited procedures to the required supplementary information in accordance with auditing standards generally accepted in the United States of America, which consisted of inquiries of management about the methods of preparing the information and comparing the information for consistency with management’s responses to our inquiries, the basic financial statements, and other knowledge we obtained during our audit of the basic financial statements. We do not express an opinion or provide any assurance on the information because the limited procedures do not provide us with sufficient evidence to express an opinion or provide any assurance. Supplementary and Other Information
Our audit was conducted for the purpose of forming opinions on the financial statements that collectively comprise the J.O. Combs Unified School District No. 44’s basic financial statements. The combining and individual nonmajor fund financial statements and schedules and the introductory and statistical sections are presented for purposes of additional analysis and are not a required part of the basic financial statements. The combining and individual nonmajor fund financial statements and schedules are the responsibility of management and were derived from and relates directly to the underlying accounting and other records used to prepare the basic financial statements. Such information has been subjected to the auditing procedures applied in the audit of the basic financial statements and certain additional procedures, including comparing and reconciling such information directly to the underlying accounting and other records used to prepare the basic financial statements or to the basic financial statements themselves, and other additional procedures in accordance with auditing standards generally accepted in the United States of America. In our opinion, the combining and individual nonmajor fund financial statements and schedules are fairly stated, in all material respects, in relation to the basic financial statements as a whole. The introductory and statistical sections have not been subjected to the auditing procedures applied in the audit of the basic financial statements, and accordingly, we do not express an opinion or provide any assurance on them.
Governing Board J.O. Combs Unified School District No. 44
(12)
Other Reporting Required by Government Auditing Standards In accordance with Government Auditing Standards, we have also issued our report dated December 17, 2014, on our consideration of J.O. Combs Unified School District No. 44’s internal control over financial reporting and on our tests of its compliance with certain provisions of laws, regulations, contracts, and grant agreements and other matters. The purpose of that report is to describe the scope of our testing of internal control over financial reporting and compliance and the result of that testing, and not to provide an opinion on internal control over financial reporting or on compliance. That report is an integral part of an audit performed in accordance with Government Auditing Standards in considering J.O. Combs Unified School District No. 44’s internal control over financial reporting and compliance.
Phoenix, Arizona December 17, 2014

THIS PAGE BLANK

REQUIRED SUPPLEMENTARY INFORMATION

THIS PAGE BLANK

J.O. COMBS UNIFIED SCHOOL DISTRICT NO. 44 MANAGEMENT’S DISCUSSION AND ANALYSIS
YEAR ENDED JUNE 30, 2014
(13)
As management of the J.O. Combs Unified School District No. 44 (District), we offer the readers of the District’s financial statements this narrative overview and analysis of the financial activities of the District for the fiscal year ended June 30, 2014. FINANCIAL HIGHLIGHTS
The assets of the District exceeded its liabilities at the close of the most recent fiscal year by $93,040,805 (net position).
The District’s total net position decreased by $511,928. As of the close of the current fiscal year, the District’s governmental funds reported combined
ending fund balances of $16,095,344, an increase of $2,365,860 in comparison with the prior year.
At the end of the current fiscal year, unassigned fund balance for the General Fund was $9,615,077, or 43.3% of total General Fund expenditures.
The District’s total bonded debt decreased by $917,356 (5.3%) during the current fiscal year. This decrease was due to scheduled principal payments on the outstanding bonds.
OVERVIEW OF THE FINANCIAL STATEMENTS
This discussion and analysis is intended to serve as an introduction to the District’s basic financial statements. The District’s basic financial statements are comprised of three components: 1) government-wide financial statements, 2) fund financial statements, and 3) notes to basic financial statements. Government-Wide Financial Statements
The government-wide financial statements are designed to provide readers with a broad overview of the District’s finances, in a manner similar to a private-sector business. The statement of net position presents information on all of the District’s assets and liabilities, with the difference between the two reported as net position. Over time, increases or decreases in net position may serve as useful indicators of whether the financial position of the District is improving or deteriorating. The statement of activities presents information showing how the District’s net position changed during the most recent fiscal year. All changes in net position are reported as soon as the underlying event giving rise to the change occurs, regardless of the timing of related cash flows. Thus, revenues and expenses are reported in this statement for some items that will only result in cash flows in the future fiscal periods (e.g., uncollected taxes and earned but unused vacation leave). The government-wide financial statements present functions of the District that are principally supported by taxes and intergovernmental revenues (governmental activities). The governmental activities of the District are for public education. The government-wide financial statements can be found immediately following this MD&A.
J.O. COMBS UNIFIED SCHOOL DISTRICT NO. 44 MANAGEMENT’S DISCUSSION AND ANALYSIS
YEAR ENDED JUNE 30, 2014
(14)
Fund Financial Statements
A fund is a grouping of related accounts that is used to maintain control over resources that have been segregated for specific activities or objectives. The District, like other state and local governments, uses fund accounting to ensure and demonstrate compliance with finance-related legal requirements. All of the funds of the District can be divided into two categories: governmental funds and fiduciary funds.
Governmental Funds – Governmental funds are used to account for essentially the same functions reported as governmental activities in the government-wide financial statements. However, unlike the government-wide financial statements, governmental fund financial statements focus on near-term inflows and outflows of spendable resources, as well as on balances of spendable resources available at the end of the fiscal year. Such information may be useful in evaluating a government’s near-term financing requirements. Because the focus of governmental funds is narrower than that of the government-wide financial statements, it is useful to compare the information presented for governmental funds with similar information presented for governmental activities in the government-wide financial statements. By doing so, readers may better understand the long-term impact of the government’s near-term financing decisions. Both the governmental fund balance sheet and the governmental fund statement of revenues, expenditures, and changes in fund balances provide a reconciliation to facilitate this comparison between governmental funds and governmental activities. The District maintains eleven individual governmental funds. Information is presented separately in the governmental fund balance sheet and in the governmental fund statement of revenues, expenditures and changes in fund balances for the General Fund, Special Projects Fund, Other Special Revenue Fund, Debt Service Fund, and Adjacent Ways Fund all of which are considered to be major funds. Data from the other six governmental funds are combined into a single, aggregated presentation. An operating budget for expenditures is prepared and adopted by the District each fiscal year for the General, Special Revenue, Debt Service and Capital Projects Funds. Budgetary control is ultimately exercised at the fund level. Budgetary control is maintained through the use of periodic reports that compare actual expenditures against budgeted amounts. The expenditure budget can be revised annually, per Arizona Revised Statutes. The District also maintains an encumbrance accounting system as one technique of maintaining budgetary control. Encumbered amounts lapse at year-end. An annual budget of revenue from all sources is not prepared. As demonstrated by the statements and schedules included in the financial section of this report, the District continues to meet its responsibility for sound financial management. The basic governmental fund financial statements can be found on pages 24 - 29 of this report.

J.O. COMBS UNIFIED SCHOOL DISTRICT NO. 44 MANAGEMENT’S DISCUSSION AND ANALYSIS
YEAR ENDED JUNE 30, 2014
(15)
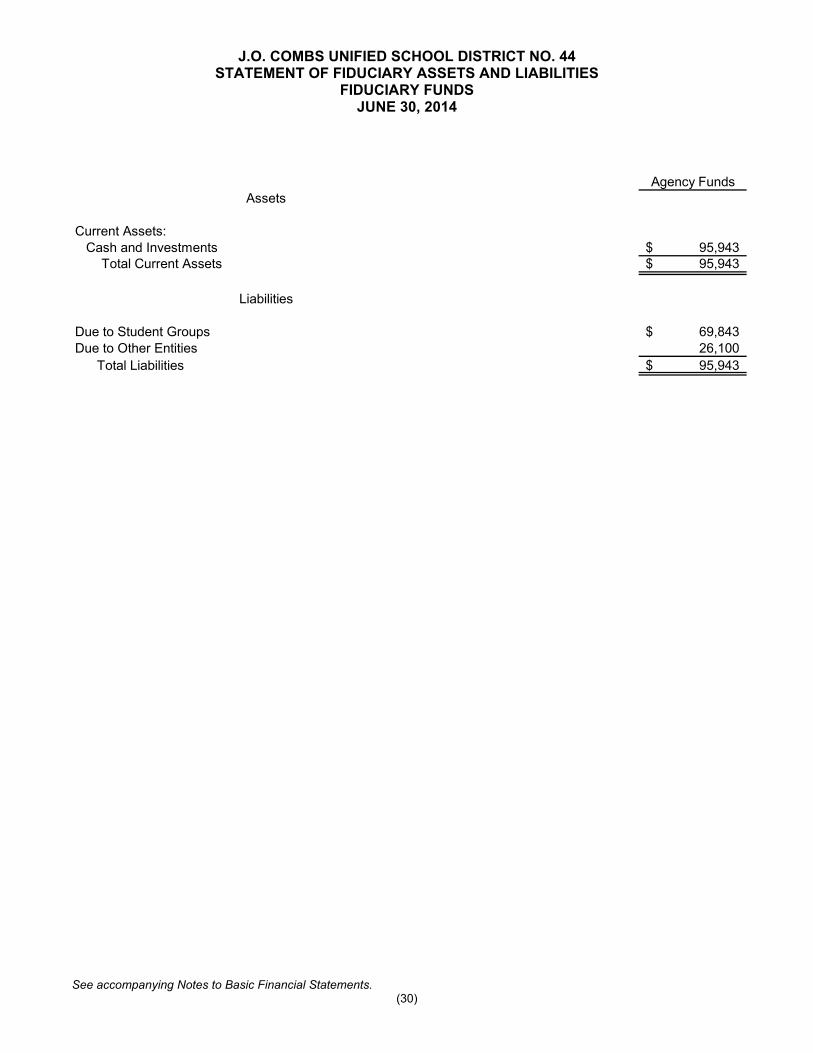
Fiduciary Funds – Fiduciary funds are used to account for resources held for the benefit of parties outside the government. Fiduciary funds are not reflected in the government-wide financial statements because the resources of those funds are not available to support the District’s own programs. The fiduciary fund includes the student activities and insurance funds reported as agency funds. Agency funds are custodial in nature and do not present results of operations or a measurement focus. The basic fiduciary fund financial statement can be found on page 30 of this report.
Notes to Basic Financial Statements
The notes to basic financial statements provide additional information that is essential to a full understanding of the data provided in the government-wide and fund financial statements. The notes to basic financial statements can be found on pages 31 - 48 of this report. Required Supplementary Information Other Than MD&A Governments have the option of presenting budgetary comparison schedules for the General Fund and major Special Revenue Funds as part of the basic financial statements or as required supplementary information other than MD&A. The District has presented the General Fund budgetary comparison schedule and major special revenue funds as required supplementary information other than the MD&A which can be found on pages 49 – 51. Other Information
The combining and individual fund statements and schedules are presented immediately following the notes to basic financial statements. Combining and individual fund statements and schedules can be found on pages 53 - 63 of this report. The statistical section includes selected financial and demographic information, generally presented on a multi-year basis. The statistical section can be found on pages 66 - 86 of this report. Government-Wide Financial Analysis
Net Position
As noted earlier, net position may serve over time as useful indicators of a government’s financial position. In the case of the District, assets exceeded liabilities by $93,040,805 at the close of the most recent fiscal year.
J.O. COMBS UNIFIED SCHOOL DISTRICT NO. 44 MANAGEMENT’S DISCUSSION AND ANALYSIS
YEAR ENDED JUNE 30, 2014
(16)
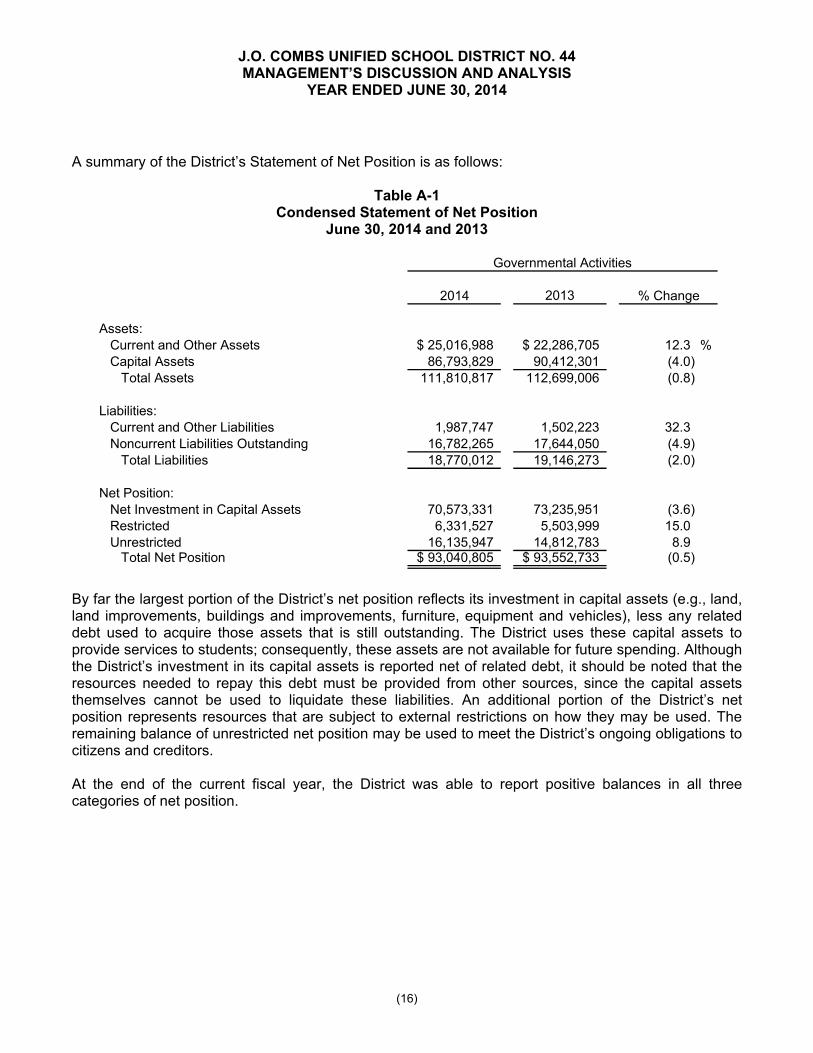
A summary of the District’s Statement of Net Position is as follows:
Table A-1 Condensed Statement of Net Position
June 30, 2014 and 2013
2014 2013
Assets:Current and Other Assets 25,016,988$ 22,286,705$ 12.3 %Capital Assets 86,793,829 90,412,301 (4.0)
Total Assets 111,810,817 112,699,006 (0.8)
Liabilities:Current and Other Liabilities 1,987,747 1,502,223 32.3 Noncurrent Liabilities Outstanding 16,782,265 17,644,050 (4.9)
Total Liabilities 18,770,012 19,146,273 (2.0)
Net Position:Net Investment in Capital Assets 70,573,331 73,235,951 (3.6) Restricted 6,331,527 5,503,999 15.0 Unrestricted 16,135,947 14,812,783 8.9
Total Net Position 93,040,805$ 93,552,733$ (0.5)
% Change
Governmental Activities
By far the largest portion of the District’s net position reflects its investment in capital assets (e.g., land, land improvements, buildings and improvements, furniture, equipment and vehicles), less any related debt used to acquire those assets that is still outstanding. The District uses these capital assets to provide services to students; consequently, these assets are not available for future spending. Although the District’s investment in its capital assets is reported net of related debt, it should be noted that the resources needed to repay this debt must be provided from other sources, since the capital assets themselves cannot be used to liquidate these liabilities. An additional portion of the District’s net position represents resources that are subject to external restrictions on how they may be used. The remaining balance of unrestricted net position may be used to meet the District’s ongoing obligations to citizens and creditors. At the end of the current fiscal year, the District was able to report positive balances in all three categories of net position.

J.O. COMBS UNIFIED SCHOOL DISTRICT NO. 44 MANAGEMENT’S DISCUSSION AND ANALYSIS
YEAR ENDED JUNE 30, 2014
(17)
Changes in Net Position
Overall, net position decreased $511,928 or 0.55%. Key elements of this decrease are as follows:
Table A-2 Changes in Net Position
Years Ended June 30, 2014 and 2013
2014 2013REVENUES
Program Revenues:Charges for Services $ 614,710 $ 672,104 (8.5) %
Operating Grants and Contributions 5,284,639 4,026,374 31.3 Capital Grants and Contributions 192,305 382,615 (49.7)
General Revenues:
Property Taxes 6,641,961 6,874,949 (3.4) Grants and Contributions Not Restricted to Specific Programs
State Equalization and Additional State Aid 16,643,540 16,521,445 0.7 County Equalization 1,178,999 1,183,752 (0.4) Federal Aid Not Restricted 65,161 81,959 (20.5)
Investment Earnings 34,027 27,625 23.2 Other 918,876 837,947 9.7
Total Revenues 31,574,218 30,608,770 3.2
EXPENSESInstruction 17,399,040 15,908,616 9.4 Support Services:
Students 2,666,387 2,734,548 (2.5) Instructional Staff 733,168 780,531 (6.1) General Administration 437,159 414,720 5.4 School Administration 1,299,200 1,314,880 (1.2) Business and Other Support Services 1,579,311 1,610,292 (1.9) Operation and Maintenance of Plant 3,793,268 3,769,561 0.6 Student Transportation 2,034,080 1,815,774 12.0
Operation of Noninstructional Services 1,362,264 1,395,785 (2.4) Interest on Long-Term Debt 782,269 1,083,820 (27.8)
Total Expenses 32,086,146 30,828,527 4.1
CHANGE IN NET POSITION (511,928) (219,757) 133.0
Net Position - Beginning of Year 93,552,733 93,772,490 (0.2) NET POSITION - END OF YEAR $ 93,040,805 $ 93,552,733 (0.5) %
% Change
Governmental Activities
Program revenues made up of charges for services, operating grants and contributions and capital grants and contributions increased from the prior year by $1,010,561. This increase was mainly due to an increase in Title I, Classroom Site, and Vocational Education funding.

J.O. COMBS UNIFIED SCHOOL DISTRICT NO. 44 MANAGEMENT’S DISCUSSION AND ANALYSIS
YEAR ENDED JUNE 30, 2014
(18)
General revenues made up of property taxes, equalization, interest and other revenue decreased from the prior year by $45,113. Expenses of the District increased overall due to increased personnel costs. FINANCIAL ANALYSIS OF THE GOVERNMENT’S FUNDS
As noted earlier, the District uses fund accounting to ensure and demonstrate compliance with finance-related legal requirements. Governmental Funds – The focus of the District’s governmental funds is to provide information on near-term inflows, outflows, and balances of spendable resources. Such information is useful in assessing the District’s financing requirements. In particular, unassigned fund balance may serve as a useful measure of a government’s net resources available for spending at the end of the fiscal year. As of the end of the current fiscal year, the District’s governmental funds reported combined ending fund balances of $16,095,344, an increase of $2,365,860 in comparison with the prior year. Of this amount $9,615,077 constitutes unassigned fund balance, which is available for spending at the government’s discretion. The remainder of fund balance is restricted to indicate that is not available for new spending. At June 30, 2014, fund balances were as follows:
Table A-3 Fund Balances
Increase (Decrease)
Fund Balance From 2012-13
General Fund 9,615,077$ 1,543,932$ Special Projects Fund 7,948 (526) Other Special Revenue Fund 1,960,420 524,213 Debt Service Fund 239,170 8,964 Adjacent Ways Fund 2,179,551 4,895 Nonmajor Governmental Funds 2,093,178 284,382
The General Fund increase of $1,543,932 was due to the District being conservative related to expenditures. The Special Projects Fund decrease of $526 was not significant. The Other Special Revenue Fund increase of $524,213 was due to the District carrying over Community Education and Vocational Education funds. The Debt Service Fund increase of $8,964 was not significant. The Adjacent Ways Fund increase of $4,895 was not significant.

J.O. COMBS UNIFIED SCHOOL DISTRICT NO. 44 MANAGEMENT’S DISCUSSION AND ANALYSIS
YEAR ENDED JUNE 30, 2014
(19)
The Nonmajor Governmental Funds increase of $284,382 was due to the District carrying over Classroom Site Fund monies. GENERAL FUND BUDGETARY HIGHLIGHTS
Differences between the original budget and the final amended budget totaled $7,221. In Arizona, school districts build their original “adopted” budget based on the previous year’s 100th day average daily attendance. The District is allowed to increase or decrease its budget. The District also moved budget capacity between line items due to changes in operations during the year. Actual General Fund expenditures were $760,296 less than budget during the fiscal year. Actual expenditures were within 3.4% of budget. The District’s regular education instruction line item exceeded budget due to employee insurance costs. CAPITAL ASSET AND DEBT ADMINISTRATION
Capital Assets
The District’s investment in capital assets for its governmental activities as of June 30, 2014, amounts to $86,793,829 (net of accumulated depreciation). This investment in capital assets includes construction in progress, land, land improvements, buildings and improvements, and furniture, equipment and vehicles. The net decrease in the District’s investment in capital assets for the current fiscal year was 4.0%. Major capital asset events during the fiscal year included continuing to not move forward with the Maintenance/Transportation facility due to bonding capacity limits and purchases of buses for special education.
Table A-4 Capital Assets (Net)
June 30, 2014 and 2013
2014 2013
Land 1,956,162$ 1,956,162$ Construction in Progress - 1,362,387 Land Improvements 443,182 399,050 Buildings and Improvements 83,001,639 85,002,902 Furniture, Equipment, and Vehicles 1,392,846 1,691,800
Total Capital Assets, Net 86,793,829$ 90,412,301$
Governmental Activities
Additional information on the District’s capital assets can be found in Note 3.A.4. of this report.

J.O. COMBS UNIFIED SCHOOL DISTRICT NO. 44 MANAGEMENT’S DISCUSSION AND ANALYSIS
YEAR ENDED JUNE 30, 2014
(20)
Long-Term Debt
At the end of the current fiscal year, the District had total bonded debt outstanding of $16,338,513. This debt is backed by the full faith and credit of the District.
Table A-5 Outstanding Bonded Debt
June 30, 2014 and 2013
2014 2013
General Obligation Bonds 16,338,513$ 17,255,869$
Governmental Activities
The District’s bonded debt decreased by $917,356 (5.3%) during the current fiscal year. This decrease was due to scheduled principal payments on the outstanding bonds. State statutes limit the amount of total bonded debt a unified school district may issue to 30% of its net secondary assessed valuation and Class B bonded debt (bonds authorized subsequent to December 31, 1999) to the greater of 10% of the net secondary assessed valuation or $1,500 per student. The current debt limitations for the District are $34,273,005 and $11,424,335, respectively. Net bonded debt outstanding (par value of bonds outstanding less funds available in the Debt Service Fund) at June 30, 2014 is $15,870,830. At June 30, 2014 the District’s net Class B bond debt outstanding was $15,870,830 which exceeded the Class B debt limit of $11,424,335. This debt in excess of limit was caused by a significant decline (30%) in assessed property values in the District since the bonds were issued. The District may not issue additional Class B bonded debt until it is within the applicable statutory limits. Additional information on the District’s long-term debt can be found in Notes 3.C. and 3.D. of this report. ECONOMIC FACTORS AND NEXT YEAR’S BUDGETS AND RATES
Additional reduction in funding from state. Expected slight increase in assessed values in the area. Continued suspension of construction of the Maintenance and Transportation facility due to
bonding capacity. Unsuccessful renewal of the 10% Maintenance and Operations override election resulting in the
final budget reduction. All of these factors were considered in preparing the District’s budget for the 2015 fiscal year.

J.O. COMBS UNIFIED SCHOOL DISTRICT NO. 44 MANAGEMENT’S DISCUSSION AND ANALYSIS
YEAR ENDED JUNE 30, 2014
(21)
REQUESTS FOR INFORMATION
This financial report is designed to provide a general overview of the District’s finances for all those with an interest. Questions concerning any of the information provided in this report or requests for additional financial information should be addressed to the J.O. Combs Unified School District No. 44 District Office, Director of Business Services, 301 East Combs Road, San Tan Valley, Arizona, 85140.

THIS PAGE BLANK

BASIC FINANCIAL STATEMENTS

J.O. COMBS UNIFIED SCHOOL DISTRICT NO. 44 STATEMENT OF NET POSITION
JUNE 30, 2014
See accompanying Notes to Basic Financial Statements. (22)
Governmental Activities
ASSETSCash and Investments 9,995,895$ Cash with Paying Agent 1,296,616 Restricted Assets 161,686 Receivables:
Property Taxes 84,689 Intergovernmental 6,612,451
Prepaids 6,865,651 Capital Assets: Non-Depreciable 1,956,162 Depreciable, Net 84,837,667
Total Assets 111,810,817
LIABILITIESAccounts Payable 542,027 Accrued Wages and Benefits 70,105 Accrued Interest 396,616 Intergovernmental Payable 78,999 Matured Debt Principal Payable 900,000
Long-Term Liabilities:Due Within One Year 1,143,599 Due in More Than One Year 15,638,666
Total Liabilities 18,770,012
NET POSITIONNet Investment in Capital Assets 70,573,331 Restricted
Instructional Improvement 305,870 Classroom Site 1,091,545 Federal and State Instructional Programs 7,948 Food Service 319,458 Debt Service 250,487 Capital Projects 2,395,799 Community Programs 957,211 Instructional Aides 9,814 Vocational Education Programs 618,132 Noninstructional Programs 375,263
Unrestricted 16,135,947 Total Net Position 93,040,805$

J.O. COMBS UNIFIED SCHOOL DISTRICT NO. 44 STATEMENT OF ACTIVITIES YEAR ENDED JUNE 30, 2014
See accompanying Notes to Basic Financial Statements. (23)
Net (Expense)
Revenuesand Changes
in Net Position
Functions/Programs ExpensesCharges for
ServicesOperating Grants and Contributions
Capital Grants and
ContributionsGovernmental
ActivitiesPrimary Government:
Governmental Activities:Instruction 17,399,040$ -$ 3,719,343$ 10,569$ (13,669,128)$ Support Services:
Students 2,666,387 - 174,494 173,812 (2,318,081) Instructional Staff 733,168 - 345,585 - (387,583) General Administration 437,159 - 639 - (436,520) School Administration 1,299,200 - 1,140 - (1,298,060) Business and Other Support Services 1,579,311 - 92,268 6,416 (1,480,627) Operation and Maintenance of Plant 3,793,268 - 1,058 - (3,792,210) Student Transportation 2,034,080 - 44,602 1,508 (1,987,970)
Operation of Noninstructional Services 1,362,264 614,710 905,510 - 157,956 Interest on Long-Term Debt 782,269 - - - (782,269)
Total 32,086,146$ 614,710$ 5,284,639$ 192,305$ (25,994,492)
General Revenues:Property Taxes 6,641,961Grants and Contributions Not Restricted to Specific Programs
State Equalization and Additional State Aid 16,643,540County Equalization 1,178,999Federal Aid not Restricted 65,161
Investment Earnings 34,027Other 918,876
Total General Revenues 25,482,564 Change in Net Position (511,928) Net Position - Beginning 93,552,733Net Position - Ending 93,040,805$
Program Revenues

J.O. COMBS UNIFIED SCHOOL DISTRICT NO. 44 BALANCE SHEET
GOVERNMENTAL FUNDS JUNE 30, 2014
See accompanying Notes to Basic Financial Statements. (24)
OtherSpecial Special
General Projects Revenue Debt ServiceAssets
Cash and Investments 3,463,953$ -$ 1,782,964$ 235,318$ Cash with Paying Agent - - - 1,296,616 Restricted Assets - - - - Receivables:
Property Taxes 69,277 - - 15,169 Intergovernmental 5,994,407 263,516 252,027 -
Due from Other Funds 346,691 - - - Total Assets 9,874,328$ 263,516$ 2,034,991$ 1,547,103$
Liabilities, Deferred Inflows, and Fund Balances
Liabilities:Accounts Payable 202,559$ 115,203$ 74,571$ -$ Accrued Wages and Benefits - - - - Accrued Interest - - - 396,616 Due to Other Funds - 140,365 - - Due to Other Governmental Units - - - - Matured Debt Principal Payable - - - 900,000
Total Liabilities 202,559 255,568 74,571 1,296,616
Deferred Inflows of ResourcesUnavailable Revenue 56,692 - - 11,317
Fund Balances:Restricted - 7,948 1,960,420 239,170 Unassigned 9,615,077 - - -
Total Fund Balance 9,615,077 7,948 1,960,420 239,170 Total Liabilities, Deferred Inflows, and Fund Balances 9,874,328$ 263,516$ 2,034,991$ 1,547,103$

(25)
NonmajorAdjacent Governmental
Ways Funds Totals
2,179,545$ 2,334,115$ 9,995,895$ - - 1,296,616 - 161,686 161,686
243 - 84,689
- 102,501 6,612,451 - - 346,691
2,179,788$ 2,598,302$ 18,498,028$
-$ 149,694$ 542,027$ - 70,105 70,105 - - 396,616 - 206,326 346,691 - 78,999 78,999 - - 900,000 - 505,124 2,334,438
237 - 68,246
2,179,551 2,093,178 6,480,267 - - 9,615,077
2,179,551 2,093,178 16,095,344
2,179,788$ 2,598,302$ 18,498,028$

THIS PAGE BLANK

J.O. COMBS UNIFIED SCHOOL DISTRICT NO. 44 RECONCILIATION OF THE BALANCE SHEET OF GOVERNMENTAL
FUNDS TO THE STATEMENT OF NET POSITION JUNE 30, 2014
See accompanying Notes to Basic Financial Statements. (26)
Total Fund Balances for Governmental Funds 16,095,344$
68,246
Governmental Capital Assets 104,106,320Less Accumulated Depreciation (17,312,491) Capital Assets Used in Governmental Activities 86,793,829
6,865,651
General Obligation Bonds (16,110,000) Premium on Bonds (228,513) Capital Leases (42,279) Compensated Absences (401,473)
Total Net Position of Governmental Activities 93,040,805$
Amounts reported for governmental activities in the statement of net position are different because:
Long-term liabilities, including bonds payable, are not due and payable in the current period and, therefore, are not reported in the governmental funds.
Property taxes not collected within 60 days subsequent to fiscal year-end are unavailable in the governmental funds.
Capital assets used in governmental activities are not financial resources and, therefore, are not reported in the governmental funds.
Prepaid rent is not a financial resource and therefore is not reported in the governmental funds.

J.O. COMBS UNIFIED SCHOOL DISTRICT NO. 44 STATEMENT OF REVENUES, EXPENDITURES, AND CHANGE IN FUND BALANCES
GOVERNMENTAL FUNDS YEAR ENDED JUNE 30, 2014
See accompanying Notes to Basic Financial Statements. (27)
OtherSpecial Special
General Projects Revenue Debt Service
Revenues:Property Taxes 4,959,656$ -$ -$ 1,699,554$ Intergovernmental 17,887,700 1,854,283 436,968 - Food Service Sales - - - - Auxiliary Operations 223,567 - - - Contributions and Donations 199,442 - 135,492 - Investment Earnings 18,524 403 2,607 4,112 Other 134,314 377 771,628 -
Total Revenues 23,423,203 1,855,063 1,346,695 1,703,666
Expenditures:Current:
Instruction 11,040,405 1,214,300 407,928 - Support Services:
Students 2,222,603 164,892 7,826 - Instructional Staff 402,204 247,241 6,499 - General Administration 436,555 604 - - School Administration 1,297,151 1,077 799 - Business and Other Support Services 1,380,641 80,984 43,776 - Operations and Maintenance of Plant 3,610,458 1,000 136,040 - Student Transportation 1,620,673 42,148 36,511 -
Operation of Noninstructional Services 83,362 - 183,103 - Debt Service:
Principal Retirement 39,889 - - 900,000 Interest on Long-Term Debt 4,923 - - 794,702
Capital Outlay:Facilities Acquisition 50,095 - - -
Total Expenditures 22,188,959 1,752,246 822,482 1,694,702
Excess (Deficiency) of Revenues Over Expenditures 1,234,244 102,817 524,213 8,964
Other Financing Sources (Uses):Transfers In 309,688 - - - Transfers Out - (103,343) - -
Total Other Financing Sources (Uses) 309,688 (103,343) - -
Net Change in Fund Balances 1,543,932 (526) 524,213 8,964
Fund Balances:Beginning of Year 8,071,145 8,474 1,436,207 230,206 End of Year 9,615,077$ 7,948$ 1,960,420$ 239,170$
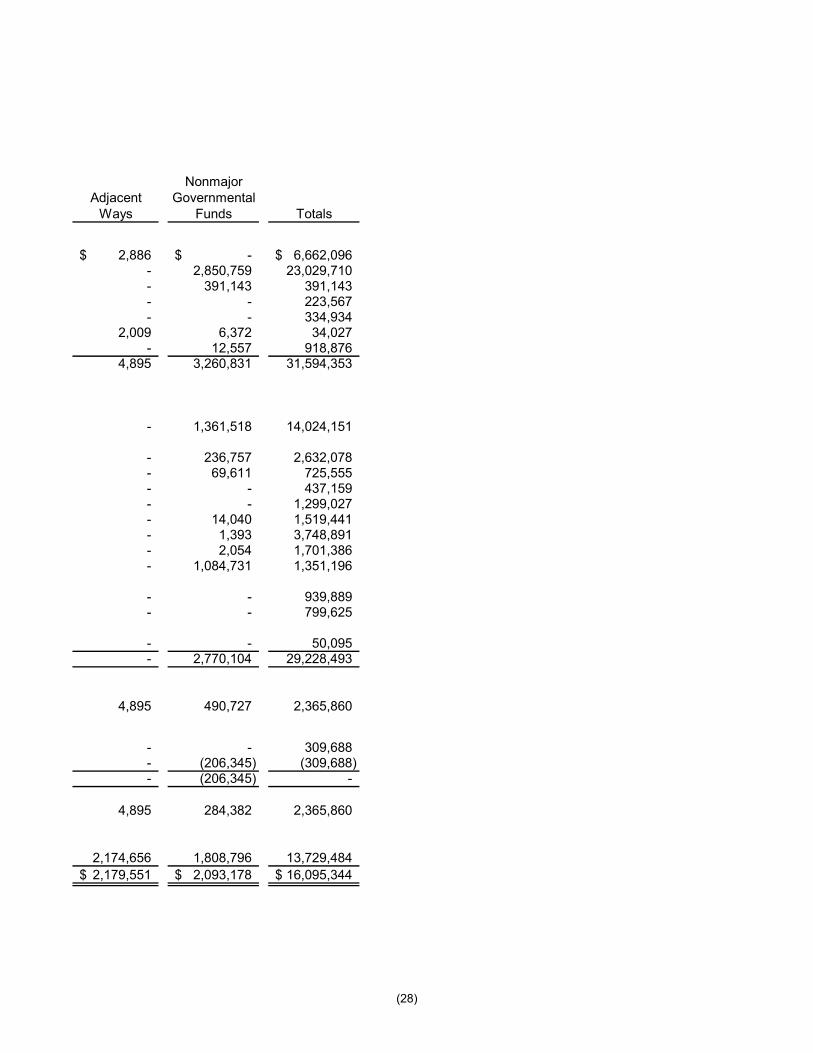
(28)
Nonmajor Adjacent Governmental
Ways Funds Totals
2,886$ -$ 6,662,096$ - 2,850,759 23,029,710 - 391,143 391,143 - - 223,567 - - 334,934
2,009 6,372 34,027 - 12,557 918,876
4,895 3,260,831 31,594,353
- 1,361,518 14,024,151
- 236,757 2,632,078 - 69,611 725,555 - - 437,159 - - 1,299,027 - 14,040 1,519,441 - 1,393 3,748,891 - 2,054 1,701,386 - 1,084,731 1,351,196
- - 939,889 - - 799,625
- - 50,095 - 2,770,104 29,228,493
4,895 490,727 2,365,860
- - 309,688 - (206,345) (309,688) - (206,345) -
4,895 284,382 2,365,860
2,174,656 1,808,796 13,729,484 2,179,551$ 2,093,178$ 16,095,344$

J.O. COMBS UNIFIED SCHOOL DISTRICT NO. 44 RECONCILIATION OF THE STATEMENT OF REVENUES, EXPENDITURES, AND
CHANGE IN FUND BALANCES OF GOVERNMENTAL FUNDS TO THE STATEMENT OF ACTIVITIES
YEAR ENDED JUNE 30, 2014
See accompanying Notes to Basic Financial Statements. (29)
Net Change in Fund Balances-Total Governmental Funds 2,365,860$
Expenditures for Capital Assets 269,614 Less Current Year Depreciation (2,524,307) Excess Depreciation over Capital Expenditures (2,254,693)
(1,363,779)
(100,966)
Property Taxes (20,135)
Principal Payments on Bonds 900,000 Principal Payments on Capital Leases 39,889 Amortization of Premium on Bonds 17,356
Net Increase in Compensated Absences (95,460)
Change in Net Position of Governmental Activities (511,928)$
Some expenses reported in the statement of activities do not require the use of currentfinancial resources and, therefore, are not reported as expenditures in the governmentalfunds.
The issuance of long-term debt (e.g. bonds, leases) provides current financial resources togovernmental funds, while the repayment of the principal of long-term debt consumes thecurrent financial resources of governmental funds. Neither transaction, however, has anyeffect on net position. The issuance of long-term debt increases long-term liabilities on thestatement of net position and the repayment of principal on long-term debt reduces long-termdebt on the statement of net position. Also, governmental funds report the effect of premiums,discounts, and similar items when the debt is first issued, whereas these items are amortizedover the term of the long-term debt in the statement of activities.
Governmental funds report capital outlays as expenditures. However, in the statement of activities the cost of those assets is allocated over their estimated useful lives and reported as depreciation expense.
Prepayment of rent was recorded as expenditure in the fiscal year it was prepaid in thegovernmental funds, however, the prepayment is deferred and allocated over the term of thelease as rental expense in the statement of activities.
Some revenues reported in the governmental funds that did not provide current financialresources in prior years have been recognized previously in the statement of activities and,therefore, are not reported as revenues in the statement of activities.
Amounts reported for governmental activities in the statement of activities are different because:
The statement of activities reports losses arising from the disposal of existing capital assets. Conversely, governmental funds do not report any gain or loss on disposals of capital assets.
J.O. COMBS UNIFIED SCHOOL DISTRICT NO. 44 STATEMENT OF FIDUCIARY ASSETS AND LIABILITIES
FIDUCIARY FUNDS JUNE 30, 2014
See accompanying Notes to Basic Financial Statements. (30)
Agency FundsAssets
Current Assets:Cash and Investments 95,943$
Total Current Assets 95,943$
Liabilities
Due to Student Groups 69,843$ Due to Other Entities 26,100
Total Liabilities 95,943$

THIS PAGE BLANK
NOTES TO BASIC FINANCIAL STATEMENTS
THIS PAGE BLANK

J.O. COMBS UNIFIED SCHOOL DISTRICT NO. 44 NOTES TO BASIC FINANCIAL STATEMENTS
JUNE 30, 2014
(31)
NOTE 1 SUMMARY OF SIGNIFICANT ACCOUNTING POLICIES
The accompanying financial statements of the J.O. Combs Unified School District No. 44 (District) have been prepared in conformity with accounting principles generally accepted in the United States of America applicable to governmental units adopted by the Governmental Accounting Standards Board (GASB). A summary of the District’s more significant accounting policies follows.
A. Reporting Entity
The District is a special purpose government that is governed by a separately elected governing body. It is legally separate from and fiscally independent of other state and local governments. Furthermore, there are no component units combined with the District for financial statement presentation purposes, and it is not included in any other governmental reporting entity. Consequently, the District’s financial statements present only the funds of those organizational entities for which its elected governing board is financially accountable.
B. Government-Wide and Fund Financial Statements The government wide financial statements (i.e., the statement of net position and the statement of activities) report information on all of the nonfiduciary activities of the primary government. The effect of interfund activity has been removed from these statements. Governmental activities, which are normally supported by taxes and intergovernmental revenues are reported separately from business type activities, which rely to a significant extent on fees and charges for support. The District had no business type activities during the fiscal year. The statement of activities demonstrates the degree to which the direct expenses of a given function or segment are offset by program revenues. Direct expenses are those that are clearly identifiable with a specific function or segment. Program revenues include 1) charges to customers or applicants who purchase, use, or directly benefit from goods, services, or privileges provided by a given function or segment and 2) grants and contributions that are restricted to meeting the operational or capital requirements of a particular function or segment. Taxes and other items not properly included among program revenues are reported instead as general revenues. Separate financial statements are provided for governmental funds and fiduciary funds even though the latter are excluded from the government-wide financial statements. Major individual governmental funds are reported as separate columns in the fund financial statements.

J.O. COMBS UNIFIED SCHOOL DISTRICT NO. 44 NOTES TO BASIC FINANCIAL STATEMENTS
JUNE 30, 2014
(32)
NOTE 1 SUMMARY OF SIGNIFICANT ACCOUNTING POLICIES (CONTINUED)
C. Measurement Focus, Basis of Accounting, and Financial Statement Presentation The government-wide are reported using the economic resources measurement focus and the accrual basis of accounting. Revenues are recorded when earned and expenses are recorded when a liability is incurred, regardless of the timing of related cash flows. Property taxes are recognized as revenues in the year for which they are levied. Grants and similar items are recognized as revenue as soon as all eligibility requirements imposed by the provider have been met. Governmental fund financial statements are reported using the current financial resources measurement focus and the modified accrual basis of accounting. Revenues are recognized as soon as they are both measurable and available. Revenues are considered to be available when they are collectible within the current period or soon enough thereafter to pay liabilities of the current period. For this purpose, the District considers revenues to be available if they are collected within 60 days of the end of the current fiscal period. Expenditures generally are recorded when a liability is incurred, as under accrual accounting, except expenditures related to compensated absences and claims and judgments, which are recorded only when payment is due. The fiduciary fund includes only agency funds. Agency funds are custodial in nature and do not present results of operations or a measurement focus. Property taxes, intergovernmental grants and aid, tuition, and interest associated with the current fiscal period are all considered to be susceptible to accrual and so have been recognized as revenues of the current fiscal period. All other revenue items are considered to be measurable and available only when cash is received by the government. The District reports the following major governmental funds: Major Governmental Funds
General Fund
The General Fund is the District’s primary operating fund. It accounts for all resources used to finance District maintenance and operation except those required to be accounted for in other funds. For budget purposes, it is described as the Maintenance and Operation Fund by Arizona Revised Statutes (A.R.S.) and is budgeted within three subsections titled regular education programs, special education programs, and pupil transportation.
Special Projects Fund
The Special Projects Fund is a special revenue fund which accounts for the revenues and expenditures of state and federally funded educational grants.
J.O. COMBS UNIFIED SCHOOL DISTRICT NO. 44 NOTES TO BASIC FINANCIAL STATEMENTS
JUNE 30, 2014
(33)
NOTE 1 SUMMARY OF SIGNIFICANT ACCOUNTING POLICIES (CONTINUED)
C. Measurement Focus, Basis of Accounting, and Financial Statement Presentation (Continued)
Major Governmental Funds (Continued)
Other Special Revenue Fund
The Other Special Revenue Fund is a special revenue fund which accounts for the revenues and expenditures of the following activities or objectives: civic center, community school, extracurricular fee tax credit, fingerprinting, and textbooks.
Debt Service Fund
The Debt Service Fund accounts for resources accumulated and used for the payment of long-term debt principal, interest and related costs.
Adjacent Ways Fund
The Adjacent Ways Fund is a capital projects fund which accounts for transactions relating to resources restricted to finance the improvement of public ways adjacent to school property. Additionally, the District reports the following fund type: Agency Fund
The Agency Funds are custodial in nature and do not present results of operations or a measurement focus and are described as follows:
The Student Activities Fund accounts for monies raised by students to finance student clubs and organizations but held by the District as an agent. The Insurance Fund accounts for monies held to pay insurance premiums of the District and District employees.
As a general rule the effect of interfund activity has been eliminated from the government-wide financial statements.
Amounts reported as program revenues include 1) charges for services, 2) operating grants and contributions, and 3) capital grants and contributions. Internally dedicated resources are reported as general revenues rather than as program revenues. Likewise, general revenues include all taxes. When both restricted and unrestricted resources are available for use for governmental activities, it is the District’s policy to use restricted resources first, then unrestricted resources as they are needed.

J.O. COMBS UNIFIED SCHOOL DISTRICT NO. 44 NOTES TO BASIC FINANCIAL STATEMENTS
JUNE 30, 2014
(34)
NOTE 1 SUMMARY OF SIGNIFICANT ACCOUNTING POLICIES (CONTINUED)
D. Assets, Liabilities, Deferred Inflows of Resources and Net Position or Equity 1. Deposits and Investments
A.R.S. require the District to deposit certain cash with the County Treasurer. That cash is pooled for investment purposes, except for cash in the Bond Building Fund and Debt Service Fund, which is invested separately. As required by statute, interest earned by the Bond Building Fund and Debt Service Fund is recorded in the Debt Service Fund. A.R.S. authorize the District to invest public monies in the State and County Treasurer’s investment pools; U.S. Treasury obligations; specified state and local government bonds; and interest-earning investment contracts such as savings accounts, certificates of deposit, and repurchase agreements in eligible depositories. Statute authorizes the District to deposit monies of Auxiliary Operations and Student Activities in bank accounts. Monies in these funds may also be invested. In addition, statute authorizes the District to maintain various bank accounts such as clearing accounts to temporarily deposit receipts before they are transmitted to the County Treasurer; revolving accounts to pay minor disbursements; and withholdings accounts for taxes, employee insurance programs, and federal savings bonds. Some of these bank accounts may be interest bearing. Statute does not include any requirements for credit risk, concentration of credit risk, interest rate risk, or foreign currency risk. Statute requires collateral for deposits of Bond Building and Debt Service Funds monies in interest bearing savings accounts and certificates of deposit at 101 percent of all deposits not covered by federal depository insurance. The State Board of Deposit provides oversight for the State Treasurer’s pools, and the Local Government Investment Pool Advisory Committee provides consultation and advice to the Treasurer. The fair value of a participant’s position in the pool approximates the value of that participant’s pool shares. No comparable oversight is provided for the County Treasurer’s investment pool, and that pool’s structure does not provide for shares.
2. Receivables Pinal County levies real property taxes on or before the third Monday in August that become due and payable in two equal installments. The first installment is due on the first day of October and becomes delinquent after the first business day of November. The second installment is due on the first day of March of the next year and becomes delinquent after the first business day of May. However, a lien against real and personal property assessed attaches on the first day of January preceding assessment and levy thereof.

J.O. COMBS UNIFIED SCHOOL DISTRICT NO. 44 NOTES TO BASIC FINANCIAL STATEMENTS
JUNE 30, 2014
(35)
NOTE 1 SUMMARY OF SIGNIFICANT ACCOUNTING POLICIES (CONTINUED)
D. Assets, Liabilities, Deferred Inflows of Resources and Net Position or Equity (Continued)
3. Short-Term Interfund Receivables/Payables
During the course of operations, individual funds within the District’s pooled cash accounts may borrow money from the other funds within the pool on a short-term basis. These receivables and payables are classified as “due from other funds” or “due to other funds” on the balance sheet of the fund financial statements and are eliminated in the preparation of the government-wide financial statements.
4. Inventories and Prepaid Rent Inventories are recorded as expenditures at the time of purchase, and because the amounts on hand at June 30, 2014, were immaterial, they are not included in the balance sheet. Certain payments to vendors reflect costs applicable to future accounting periods and are recorded as prepaid items in the government-wide financial statements. In the fund financial statements, these expenditures are recognized using the purchase method in the year the expenditures are made.
5. Restricted Assets Proceeds from the District’s bonds are classified as restricted assets on the statement of net position because their use is limited by the applicable bond covenant.
6. Capital Assets Capital assets, which include land, construction in progress, land improvements, buildings and improvements, furniture, equipment and vehicles are reported in the governmental activities column in the government-wide financial statements. Capital assets are defined by the District as assets with an initial, individual cost of more than $5,000 and an estimated useful life in excess of one year. Capital assets purchased or acquired are carried at historical cost or estimated historical cost. Contributed assets are recorded at fair market value as of the date received. Additions, improvements and other capital outlays that significantly extend the useful life of an asset are capitalized. Other costs incurred for repairs and maintenance are expensed as incurred. Depreciation on all assets is provided on a straight-line basis over the following estimated useful lives:
Land Improvements 10-20 YearsBuildings and Improvements 10-50 YearsFurniture, Equipment and Vehicles 5-20 Years

J.O. COMBS UNIFIED SCHOOL DISTRICT NO. 44 NOTES TO BASIC FINANCIAL STATEMENTS
JUNE 30, 2014
(36)
NOTE 1 SUMMARY OF SIGNIFICANT ACCOUNTING POLICIES (CONTINUED)
D. Assets, Liabilities, Deferred Inflows of Resources and Net Position or Equity (Continued)
7. Compensated Absences
The liability for compensated absences reported in the government-wide statements consists of unpaid, accumulated leave balances. The liability has been calculated using the vesting method, in which leave amounts for both employees who currently are eligible to receive termination payments and other employees who are expected to become eligible in the future to receive such payments upon termination are included. For the governmental funds, the liability related to compensated absences is recorded only when payment is due.
8. Long-Term Obligations In the government-wide financial statements, long-term debt and other long-term obligations are reported as liabilities in the statement of net position. Bond premiums and discounts are amortized over the term of the bonds using the straight line method. Bonds payable are reported net of the applicable bond premium or discount. In the fund financial statements, governmental fund types recognize bond premiums and discounts, as well as bond issuance costs, during the current period. The face amount of debt issued is reported as other financing sources. Premiums received on debt issuances are reported as other financing sources while discounts on debt issuances are reported as other financing uses. Issuance costs, whether or not withheld from the actual debt proceeds received, are reported as debt service expenditures.
9. Deferred Inflows of Resources The deferred inflows of resources reported in the governmental fund financial statements represent resources that are not available to the District as of June 30, 2014 or within 60 days of fiscal year end. The deferred inflows of resources represent a reconciling item between the governmental fund financial statements and the government-wide financial statements.
10. Net Position In the government-wide financial statements, net position are reported in three categories: net investment in capital assets; restricted net position; and unrestricted net position. Net investment in capital assets is separately reported because capital assets make up a significant portion of total net position. Restricted net position account for the portion of net position restricted by parties outside the District. Unrestricted net position is the remaining net position not included in the previous two categories.
J.O. COMBS UNIFIED SCHOOL DISTRICT NO. 44 NOTES TO BASIC FINANCIAL STATEMENTS
JUNE 30, 2014
(37)
NOTE 1 SUMMARY OF SIGNIFICANT ACCOUNTING POLICIES (CONTINUED)
D. Assets, Liabilities, Deferred Inflows of Resources and Net Position or Equity (Continued)
11. Fund Equity
Fund balances of the governmental funds are reported separately within classifications based on a hierarchy of the constraints placed on the use of those resources. The classifications are based on the relative strength of the constraints that control how the specific amounts can be spent. The classifications are nonspendable, restricted, committed, assigned and unassigned fund balance classifications. The nonspendable fund balance classification includes amounts that cannot be spent because they are either not in spendable form such as inventories, or are legally or contractually required to be maintained intact. Restricted fund balances are those that have externally imposed restrictions on their usage by creditors (such as through debt covenants), grantors, contributors, or laws and regulations. The committed fund balances are self-imposed limitations approved by the District’s Governing Board, which is the highest level of decision-making authority within the District. Only the District Governing Board can remove or change the constraints placed on committed fund balances. Assigned fund balances are resources constrained by the District’s intent to be used for specific purposes, but are neither restricted nor committed. The Governing Board has authorized the Director of Business Services to make assignments of resources for a specific purpose.
The unassigned fund balance is the residual classification for the General Fund and includes all spendable amounts not reported in the other classifications. Also, deficits in fund balances of the other governmental funds are reported as unassigned. When an expenditure is incurred that can be paid from either restricted or unrestricted fund balances, it is the District’s policy to use restricted fund balance first. For the disbursement of unrestricted fund balances, it is the District’s policy to use committed amounts first, followed by assigned amounts, and lastly unassigned amounts.

J.O. COMBS UNIFIED SCHOOL DISTRICT NO. 44 NOTES TO BASIC FINANCIAL STATEMENTS
JUNE 30, 2014
(38)
NOTE 2 STEWARDSHIP, COMPLIANCE, AND ACCOUNTABILITY
A. Budgetary Information The District adopts an annual operating budget for expenditures for all governmental fund types on essentially the same modified accrual basis of accounting used to record actual expenditures. (See Notes to the Required Supplementary Information for exceptions) The Governing Board presents a proposed budget to the Superintendent of Public Instruction and County School Superintendent on or by July 5. The Governing Board legally adopts the final budget by July 15, after a public hearing has been held. Once adopted the budget can be increased or decreased only for specific reasons set forth in the A.R.S. All appropriations lapse at year-end. Budgetary control over expenditures is exercised at the fund level. However, the General Fund is budgeted within three subsections (see preceding description of General Fund), any of which may be overexpended with the prior approval of the Governing Board at a public meeting, providing the expenditures for all subsections do not exceed the General Fund’s total budget. A budget of revenue from all sources for the fiscal year is not prepared by the District. No supplementary budgetary appropriations were necessary during the year.
B. Excess of Expenditures Over Appropriations Expenditures exceeded appropriations in the following funds:
Amount ofOverexpenditure
Major Governmental FundsSpecial Projects Fund 68,905$ Debt Service 1,471
Cash was available to meet the overexpenditures above.

J.O. COMBS UNIFIED SCHOOL DISTRICT NO. 44 NOTES TO BASIC FINANCIAL STATEMENTS
JUNE 30, 2014
(39)
NOTE 3 DETAILED NOTES ON ALL FUNDS
A. Assets 1. Deposits and Investments
Deposits and investments at June 30, 2014 consist of the following: Deposits:
Cash in Bank 422,792$ Investments:
Cash on Deposit with County Treasurer 9,830,732 Cash with Paying Agent 1,296,616
Total Deposits and Investments 11,550,140
Less: Restricted Assets (161,686) Less: Cash with Paying Agent (1,296,616) Less: Fiduciary Funds (95,943)
Total Cash and Investments 9,995,895$
Deposits
Custodial credit risk - This is the risk that, in the event of a failure by a counterparty, the District will not be able to recover its deposits or collateralized securities that are in the possession of an outside party. The District does not have a formal policy regarding custodial credit risk. However, at June 30, 2014, the District’s bank balance was $418,241. Of the bank balance, $403,618 was covered by federal depository insurance or collateralized by securities held with the bank and the remaining $14,623 was uninsured. Investments
At June 30, 2014, the District’s investments were reported at fair value. The District’s investments consisted of cash on deposit with the County Treasurer and cash with paying agent. Interest Rate Risk – The District does not have a formal investment policy regarding interest rate risk, however, the District manages its exposure to declines in fair value by limiting the average maturity of its investment portfolio to one year or less. Custodial Credit Risk – For an investment, custodial credit risk is the risk that, in the event of the counterparty’s failure, the District will not be able to recover the value of its investments or collateral securities that are in the possession of an outside party. The District does not have an investment policy with respect to custodial credit risk. The District’s investment in the County Treasurer’s investment pools represents a proportionate interest in those pools’ portfolios; however, the District’s portion is not identified with specific investment and is not subject to custodial credit risk. The cash on deposit with paying agent represents payment of bond principal and interest due July 1 held by the bond trustee at June 30, 2014 and was held by the District’s agent in the District’s name.

J.O. COMBS UNIFIED SCHOOL DISTRICT NO. 44 NOTES TO BASIC FINANCIAL STATEMENTS
JUNE 30, 2014
(40)
NOTE 3 DETAILED NOTES ON ALL FUNDS (CONTINUED)
A. Assets (Continued)
1. Deposits and Investments (Continued) Credit Risk – The District does not have a formal investment policy regarding credit risk. However, the District is prohibited by State law from investing in investments other than State and County Treasurer’s investment pools, U.S. Treasury obligations, specified state and local government bonds and interest-earning investment contracts such as savings accounts, certificates of deposit, and repurchase agreements. The District’s investment in the County Treasurer’s investment pool did not receive a credit quality rating from a national rating agency. Concentration of Credit Risk – The District does not have an investment policy with respect to concentration credit risk. The District’s investments consist only of cash and investments on deposit with County Treasurer and cash with paying agent, as previously discussed.
2. Restricted Assets Restricted assets at June 30, 2014 consisted of the following: General Obligation Bond Proceeds 161,686$
3. Receivables The Pinal County Treasurer is responsible for collecting property taxes for all governmental entities within the County. The County levies the property taxes due to the District in August. Two equal installments, payable in October and March, become delinquent after the first business days in November and May. During the year, the County also levies various personal property taxes that are due the second Monday of the month following receipt of the tax notice and become delinquent 30 days later. A lien assessed against real and personal property attaches on the first day of January preceding the assessment levy. Property taxes are recognized as revenues in the fiscal year they are levied in the government-wide financial statements and represent a reconciling item between the government-wide and fund financial statements. In the fund financial statements, property taxes are recognized as revenues in the fiscal year they are levied and collected or if they are collected within 60 days subsequent to fiscal year-end. Property taxes not collected within 60 days subsequent to fiscal year-end or collected in advance of the fiscal year for which they are levied are reported as unavailable revenues.
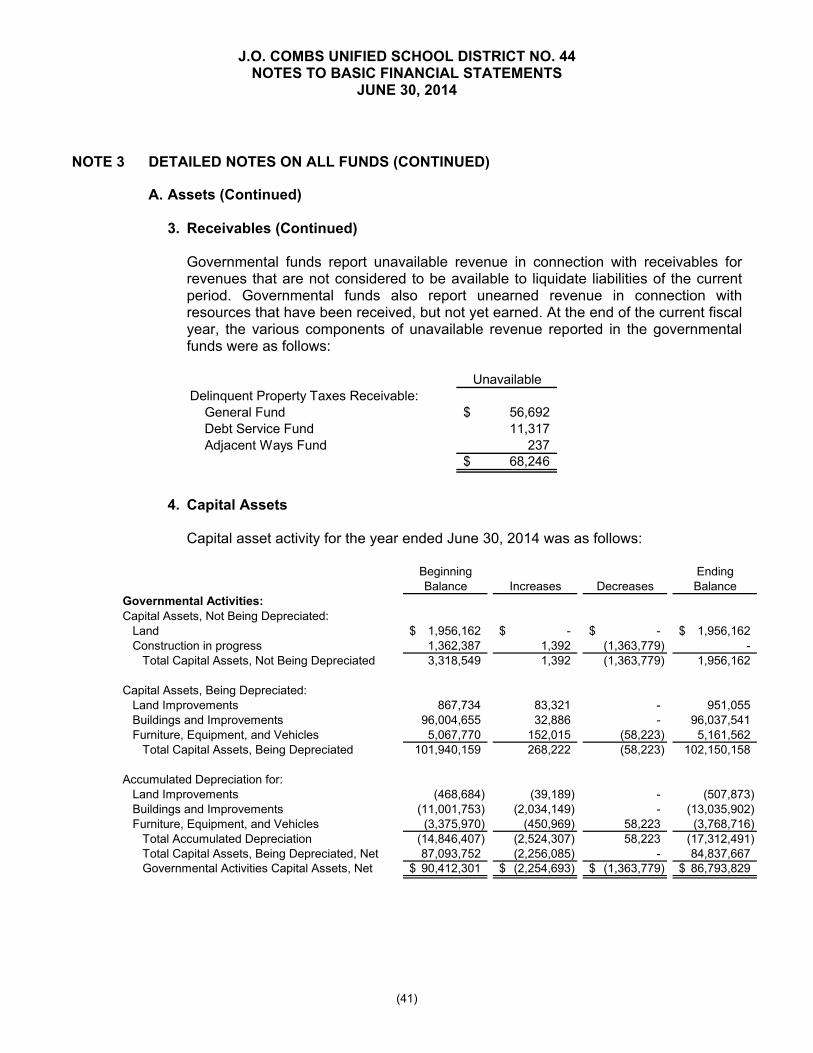
J.O. COMBS UNIFIED SCHOOL DISTRICT NO. 44 NOTES TO BASIC FINANCIAL STATEMENTS
JUNE 30, 2014
(41)
NOTE 3 DETAILED NOTES ON ALL FUNDS (CONTINUED)
A. Assets (Continued)
3. Receivables (Continued) Governmental funds report unavailable revenue in connection with receivables for revenues that are not considered to be available to liquidate liabilities of the current period. Governmental funds also report unearned revenue in connection with resources that have been received, but not yet earned. At the end of the current fiscal year, the various components of unavailable revenue reported in the governmental funds were as follows:
UnavailableDelinquent Property Taxes Receivable: General Fund 56,692$ Debt Service Fund 11,317 Adjacent Ways Fund 237
68,246$
4. Capital Assets
Capital asset activity for the year ended June 30, 2014 was as follows:
Beginning EndingBalance Increases Decreases Balance
Governmental Activities:Capital Assets, Not Being Depreciated:
Land 1,956,162$ -$ -$ 1,956,162$ Construction in progress 1,362,387 1,392 (1,363,779) -
Total Capital Assets, Not Being Depreciated 3,318,549 1,392 (1,363,779) 1,956,162
Capital Assets, Being Depreciated:Land Improvements 867,734 83,321 - 951,055 Buildings and Improvements 96,004,655 32,886 - 96,037,541 Furniture, Equipment, and Vehicles 5,067,770 152,015 (58,223) 5,161,562
Total Capital Assets, Being Depreciated 101,940,159 268,222 (58,223) 102,150,158
Accumulated Depreciation for:Land Improvements (468,684) (39,189) - (507,873) Buildings and Improvements (11,001,753) (2,034,149) - (13,035,902) Furniture, Equipment, and Vehicles (3,375,970) (450,969) 58,223 (3,768,716)
Total Accumulated Depreciation (14,846,407) (2,524,307) 58,223 (17,312,491) Total Capital Assets, Being Depreciated, Net 87,093,752 (2,256,085) - 84,837,667 Governmental Activities Capital Assets, Net 90,412,301$ (2,254,693)$ (1,363,779)$ 86,793,829$
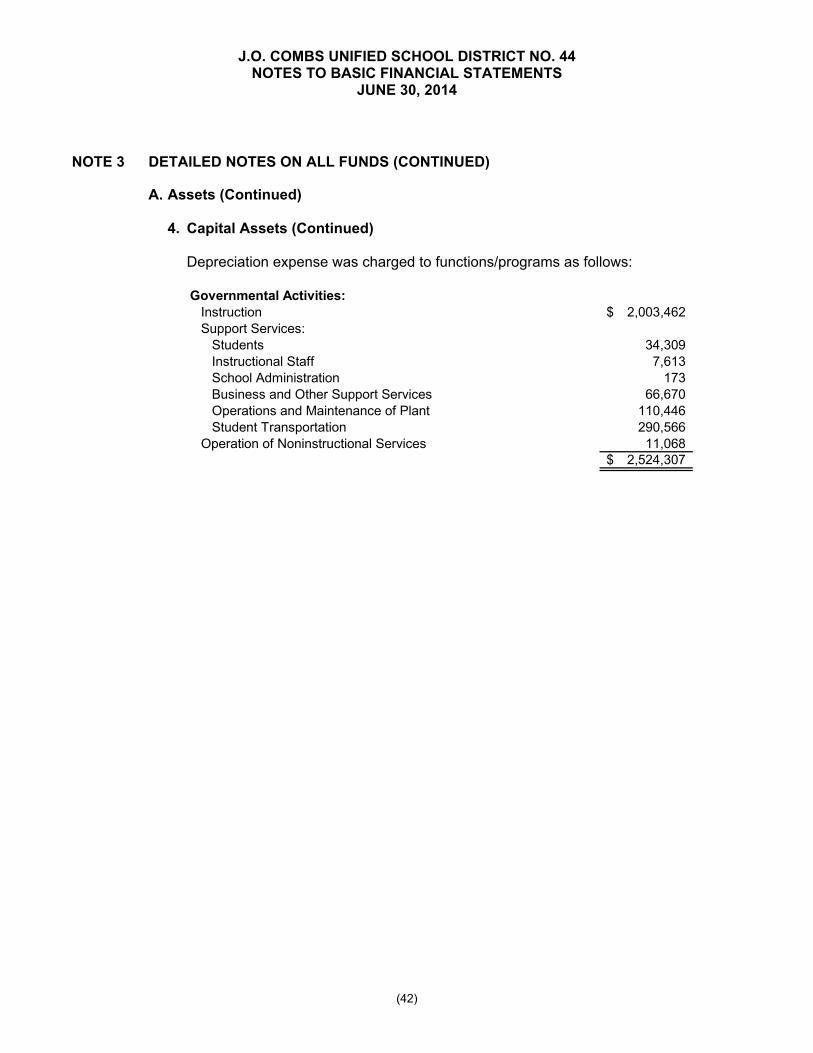
J.O. COMBS UNIFIED SCHOOL DISTRICT NO. 44 NOTES TO BASIC FINANCIAL STATEMENTS
JUNE 30, 2014
(42)
NOTE 3 DETAILED NOTES ON ALL FUNDS (CONTINUED)
A. Assets (Continued)
4. Capital Assets (Continued)
Depreciation expense was charged to functions/programs as follows: Governmental Activities:
Instruction 2,003,462$ Support Services:
Students 34,309 Instructional Staff 7,613 School Administration 173 Business and Other Support Services 66,670 Operations and Maintenance of Plant 110,446 Student Transportation 290,566
Operation of Noninstructional Services 11,068 2,524,307$

J.O. COMBS UNIFIED SCHOOL DISTRICT NO. 44 NOTES TO BASIC FINANCIAL STATEMENTS
JUNE 30, 2014
(43)
NOTE 3 DETAILED NOTES ON ALL FUNDS (CONTINUED)
B. Interfund Receivables, Payables and Transfers As of June 30, 2014, interfund receivables and payables were as follows:
Special NonmajorProjects Governmental
Due To Fund Funds Totals
General Fund 140,365$ 206,326$ 346,691$
Due From
The above interfund receivables and payables are recorded to eliminate deficit cash balances for cash received immediately following the fiscal year end and for indirect cost transfers made immediately following year end. Interfund transfers for the year ended June 30, 2014 consisted of the following:
Special NonmajorProjects Governmental
Transfers To Fund Funds Totals
General Fund 103,343$ 206,345$ 309,688$
Transfers From
Transfers were made to record indirect costs transferred to the indirect cost pool on various federal grants.
C. Obligations Under Leases
Operating Lease
The District leases land from the Arizona State Land Department for a school site under the provisions of a long-term lease agreement classified as an operating lease. The lease was funded by appropriations from the Arizona School Facilities Board (SFB). The operating lease has a remaining noncancelable lease term of 70 years and provides renewal options. Since the entire term of the lease was prepaid, there are no future minimum lease payments for the lease. The annual amortization of prepaid rent is recognized on the statement of activities and the balance of the prepaid rent is recognized on the statement of net position.
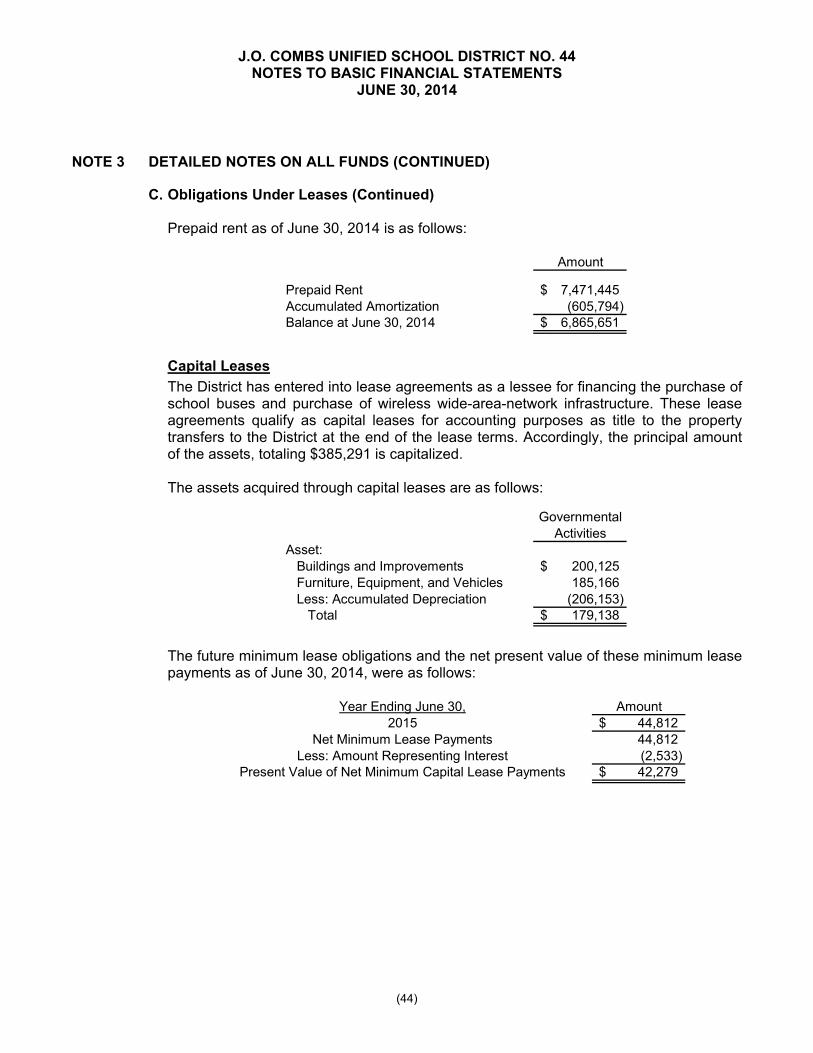
J.O. COMBS UNIFIED SCHOOL DISTRICT NO. 44 NOTES TO BASIC FINANCIAL STATEMENTS
JUNE 30, 2014
(44)
NOTE 3 DETAILED NOTES ON ALL FUNDS (CONTINUED)
C. Obligations Under Leases (Continued) Prepaid rent as of June 30, 2014 is as follows:
Amount
Prepaid Rent 7,471,445$ Accumulated Amortization (605,794) Balance at June 30, 2014 6,865,651$
Capital Leases
The District has entered into lease agreements as a lessee for financing the purchase of school buses and purchase of wireless wide-area-network infrastructure. These lease agreements qualify as capital leases for accounting purposes as title to the property transfers to the District at the end of the lease terms. Accordingly, the principal amount of the assets, totaling $385,291 is capitalized. The assets acquired through capital leases are as follows:
GovernmentalActivities
Asset:Buildings and Improvements 200,125$ Furniture, Equipment, and Vehicles 185,166 Less: Accumulated Depreciation (206,153)
Total 179,138$
The future minimum lease obligations and the net present value of these minimum lease payments as of June 30, 2014, were as follows:
Year Ending June 30, Amount2015 44,812$
Net Minimum Lease Payments 44,812 Less: Amount Representing Interest (2,533)
Present Value of Net Minimum Capital Lease Payments 42,279$
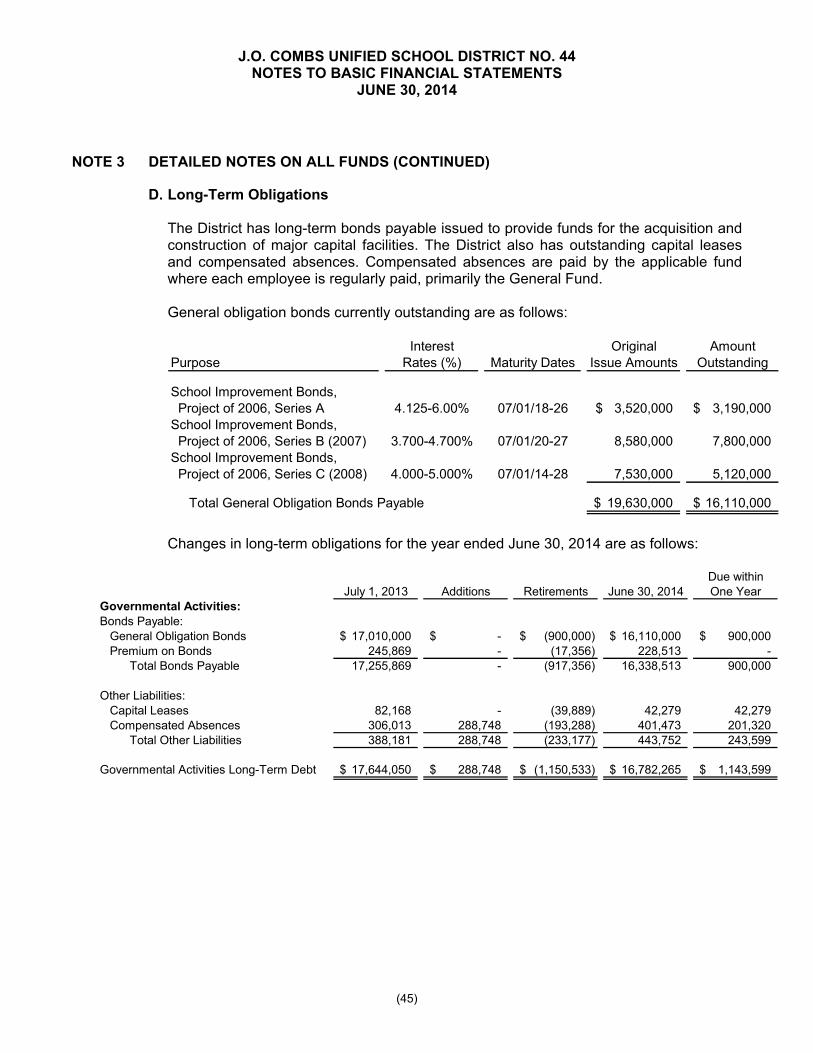
J.O. COMBS UNIFIED SCHOOL DISTRICT NO. 44 NOTES TO BASIC FINANCIAL STATEMENTS
JUNE 30, 2014
(45)
NOTE 3 DETAILED NOTES ON ALL FUNDS (CONTINUED)
D. Long-Term Obligations The District has long-term bonds payable issued to provide funds for the acquisition and construction of major capital facilities. The District also has outstanding capital leases and compensated absences. Compensated absences are paid by the applicable fund where each employee is regularly paid, primarily the General Fund. General obligation bonds currently outstanding are as follows:
Interest Original AmountPurpose Rates (%) Maturity Dates Issue Amounts Outstanding
School Improvement Bonds, Project of 2006, Series A 4.125-6.00% 07/01/18-26 3,520,000$ 3,190,000$ School Improvement Bonds, Project of 2006, Series B (2007) 3.700-4.700% 07/01/20-27 8,580,000 7,800,000 School Improvement Bonds, Project of 2006, Series C (2008) 4.000-5.000% 07/01/14-28 7,530,000 5,120,000
Total General Obligation Bonds Payable 19,630,000$ 16,110,000$
Changes in long-term obligations for the year ended June 30, 2014 are as follows:
Due withinJuly 1, 2013 Additions Retirements June 30, 2014 One Year
Governmental Activities:Bonds Payable:
General Obligation Bonds 17,010,000$ -$ (900,000)$ 16,110,000$ 900,000$ Premium on Bonds 245,869 - (17,356) 228,513 -
Total Bonds Payable 17,255,869 - (917,356) 16,338,513 900,000
Other Liabilities:Capital Leases 82,168 - (39,889) 42,279 42,279 Compensated Absences 306,013 288,748 (193,288) 401,473 201,320
Total Other Liabilities 388,181 288,748 (233,177) 443,752 243,599
Governmental Activities Long-Term Debt 17,644,050$ 288,748$ (1,150,533)$ 16,782,265$ 1,143,599$
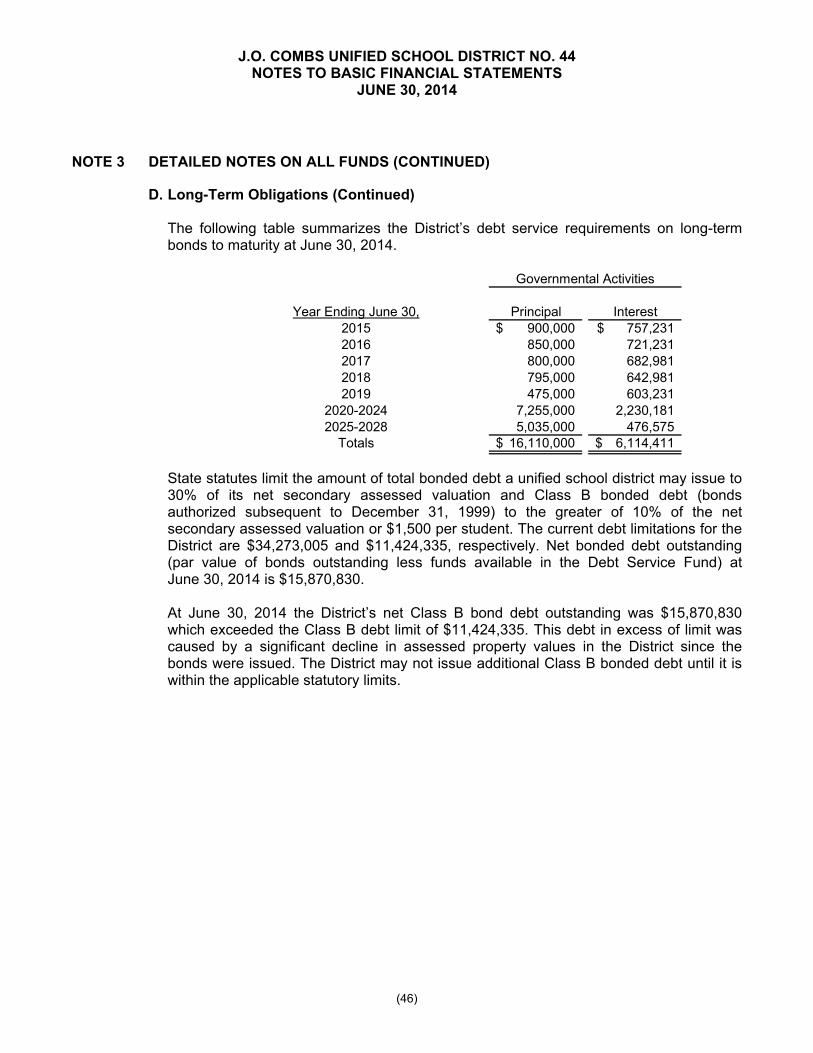
J.O. COMBS UNIFIED SCHOOL DISTRICT NO. 44 NOTES TO BASIC FINANCIAL STATEMENTS
JUNE 30, 2014
(46)
NOTE 3 DETAILED NOTES ON ALL FUNDS (CONTINUED)
D. Long-Term Obligations (Continued) The following table summarizes the District’s debt service requirements on long-term bonds to maturity at June 30, 2014.
Year Ending June 30, Principal Interest2015 900,000$ 757,231$ 2016 850,000 721,231 2017 800,000 682,981 2018 795,000 642,981 2019 475,000 603,231
2020-2024 7,255,000 2,230,181 2025-2028 5,035,000 476,575
Totals 16,110,000$ 6,114,411$
Governmental Activities
State statutes limit the amount of total bonded debt a unified school district may issue to 30% of its net secondary assessed valuation and Class B bonded debt (bonds authorized subsequent to December 31, 1999) to the greater of 10% of the net secondary assessed valuation or $1,500 per student. The current debt limitations for the District are $34,273,005 and $11,424,335, respectively. Net bonded debt outstanding (par value of bonds outstanding less funds available in the Debt Service Fund) at June 30, 2014 is $15,870,830. At June 30, 2014 the District’s net Class B bond debt outstanding was $15,870,830 which exceeded the Class B debt limit of $11,424,335. This debt in excess of limit was caused by a significant decline in assessed property values in the District since the bonds were issued. The District may not issue additional Class B bonded debt until it is within the applicable statutory limits.

J.O. COMBS UNIFIED SCHOOL DISTRICT NO. 44 NOTES TO BASIC FINANCIAL STATEMENTS
JUNE 30, 2014
(47)
NOTE 3 DETAILED NOTES ON ALL FUNDS (CONTINUED)
E. Fund Balance Classification The fund balance classifications of the governmental funds as of June 30, 2014, were as follows:
Special Special Debt Adjacent Nonmajor General Projects Revenue Service Ways Governmental
Fund Fund Fund Fund Fund Funds Totals
RestrictedInstructional Improvement Programs -$ -$ -$ -$ -$ 305,870$ 305,870$ Teacher Compensation Programs - - - - - 1,091,545 1,091,545 Federal and State Instructional Programs - 7,948 - - - - 7,948 Food Services - - - - - 319,458 319,458 Community Programs - - 957,211 - - - 957,211 Instructional Aids - - 9,814 - - - 9,814 Vocational Education Programs - - 618,132 - - - 618,132 Noninstructional Programs - - 375,263 - - - 375,263 Capital Projects - - - - 2,179,551 376,305 2,555,856 Debt Service - - - 239,170 - - 239,170
Total Restricted - 7,948 1,960,420 239,170 2,179,551 2,093,178 6,480,267
Unassigned 9,615,077 - - - - - 9,615,077 Total Fund Balance 9,615,077$ 7,948$ 1,960,420$ 239,170$ 2,179,551$ 2,093,178$ 16,095,344$
NOTE 4 OTHER INFORMATION
A. Risk Management The District is exposed to various risks of loss related to torts; theft of, damage to and destruction of assets; errors and omissions; injuries to employees; and natural disasters. The District's insurance protection is provided by the Arizona School Risk Retention Trust, of which the District is a participating member. The limit for basic coverage is $10 million per occurrence on a claims made basis. Excess coverage is for an additional $10 million per occurrence on a follow form, claims made basis. The Arizona School Risk Retention Trust is structured such that member premiums are based on an actuarial review that will provide adequate reserves to allow the pool to meet its expected financial obligations. The pool has the authority to assess its members additional premiums should reserves and annual premiums be insufficient to meet the pool's obligations. The District is also insured by a commercial insurance carrier for potential worker related accidents. There have been no significant reductions in coverage from the prior year and settled claims for each of the past three fiscal years have not exceeded the insurance coverage amounts.

J.O. COMBS UNIFIED SCHOOL DISTRICT NO. 44 NOTES TO BASIC FINANCIAL STATEMENTS
JUNE 30, 2014
(48)
NOTE 4 OTHER INFORMATION (CONTINUED)
B. Retirement Plans Arizona State Retirement System Plan Description
The District contributes to a cost-sharing, multiple-employer defined benefit pension plan; a cost-sharing, multiple-employer defined benefit health care plan; and a cost-sharing, multiple-employer defined benefit long-term disability plan, all of which are administered by the Arizona State Retirement System. The Arizona State Retirement System (through its Retirement Fund) provides retirement (i.e., pension), death, and survivor benefits; the Health Benefit Supplement Fund provides health insurance premium benefits (i.e., a monthly subsidy); and the Long-Term Disability Fund provides long-term disability benefits. Benefits are established by state statute. The System is governed by the Arizona State Retirement System Board according to the provisions of A.R.S. Title 38, Chapter 5, Article 2. The System issues a comprehensive annual financial report that includes financial statements and required supplementary information. The most recent report may be obtained by writing the System, 3300 North Central Avenue, P.O. Box 33910, Phoenix, AZ 85067-3910 or by calling (602) 240-2000 or (800) 621-3778. Funding Policy
The Arizona State Legislature establishes and may amend active plan members’ and the District’s contribution rates. For the year ended June 30, 2014, active plan members were required by statute to contribute at the actuarially determined rate of 11.54% (11.3% for retirement and 0.24% for long-term disability) of the members’ annual covered payroll and the District was required by statute to contribute at the actuarially determined rate of 11.54% (10.70% for retirement, 0.60% for health insurance premium, and 0.24% for long-term disability) of the members’ annual covered payroll. The District’s contributions for the current and two preceding years, all of which were equal to the required contributions, were as follows:
Health Benefit Long-Term
Retirement Supplement Disability Years Ended June 30, Fund Fund Fund
2014 1,659,033$ 93,030$ 37,212$ 2013 1,568,735 99,481 36,731 2012 1,484,204 90,043 37,518

REQUIRED SUPPLEMENTARY INFORMATION

THIS PAGE BLANK

J.O. COMBS UNIFIED SCHOOL DISTRICT NO. 44 SCHEDULE OF REVENUES, EXPENDITURES, AND CHANGE IN FUND BALANCE
BUDGET AND ACTUAL GENERAL FUND – BUDGETARY BASIS
YEAR ENDED JUNE 30, 2014
(49)
Variance withOriginal Final Actual Final Budget
Revenues:Property Taxes -$ -$ 4,526,410$ 4,526,410$ Intergovernmental - - 17,104,348 17,104,348 Investment Earnings - - 86 86 Other - - 36,783 36,783
Total Revenues - - 21,667,627 21,667,627
Expenditures:Regular Education:
Instruction 7,992,076 8,300,252 8,430,068 (129,816) Support Services - Students 943,662 903,662 849,863 53,799 Support Services - Instructional Staff 486,250 486,375 393,622 92,753 Support Services - General Administration 492,884 492,884 431,108 61,776 Support Services - School Administration 1,435,567 1,325,566 1,297,151 28,415 Support Services - Business and Other 1,206,823 1,066,823 946,501 120,322 Operations and Maintenance of Plant 3,817,011 3,861,598 3,547,133 314,465 Operation of Noninstructional Services 90,572 90,200 78,601 11,599
Total Regular Education 16,464,845 16,527,360 15,974,047 553,313 Special Education:
Instruction 3,052,958 3,045,315 2,799,325 245,990 Support Services - Students 1,409,500 1,347,007 1,294,353 52,654 Support Services - Instructional Staff 5,000 5,400 2,136 3,264
Total Special Education 4,467,458 4,397,722 4,095,814 301,908 Pupil Transportation:
Student Transportation Services 1,424,204 1,424,204 1,519,129 (94,925) Total Expenditures 22,356,507 22,349,286 21,588,990 760,296
Excess (Deficiency) of Revenue Over Expenditures (22,356,507) (22,349,286) 78,637 22,427,923
Other Financing Sources (Uses):Transfers In - - 19 19
Net Change in Fund Balance (22,356,507) (22,349,286) 78,656 22,427,942
Fund BalanceBeginning of Year - - 1,818,720 1,818,720 End of Year (22,356,507)$ (22,349,286)$ 1,897,376$ 24,246,662$
Budgeted Amounts

J.O. COMBS UNIFIED SCHOOL DISTRICT NO. 44 SCHEDULE OF REVENUES, EXPENDITURES, AND CHANGE IN FUND BALANCE
BUDGET AND ACTUAL SPECIAL PROJECTS FUND
YEAR ENDED JUNE 30, 2014
(50)
Variance withOriginal Final Actual Final Budget
RevenuesIntergovernmental -$ -$ 1,854,283$ 1,854,283$ Investment Earnings - - 403 403 Other - - 377 377
Total Revenues - - 1,855,063 1,855,063
ExpendituresInstruction 1,683,341 1,683,341 1,214,300 469,041 Support Services
Students - - 164,892 (164,892) Instructional Staff - - 247,241 (247,241) General Administration - - 604 (604) School Administration - - 1,077 (1,077) Business and Other Support Services - - 80,984 (80,984) Operations and Maintenance of Plant - - 1,000 (1,000) Student Transportation - - 42,148 (42,148)
Total Expenditures 1,683,341 1,683,341 1,752,246 (68,905)
Excess (Deficiency) of RevenuesOver Expenditures (1,683,341) (1,683,341) 102,817 1,786,158
Other Financing Sources (Uses)Transfers Out - - (103,343) (103,343)
Net Change in Fund Balance (1,683,341) (1,683,341) (526) 1,682,815
Fund BalanceBeginning of Year - - 8,474 8,474 End of Year (1,683,341)$ (1,683,341)$ 7,948$ 1,691,289$
Budgeted Amounts
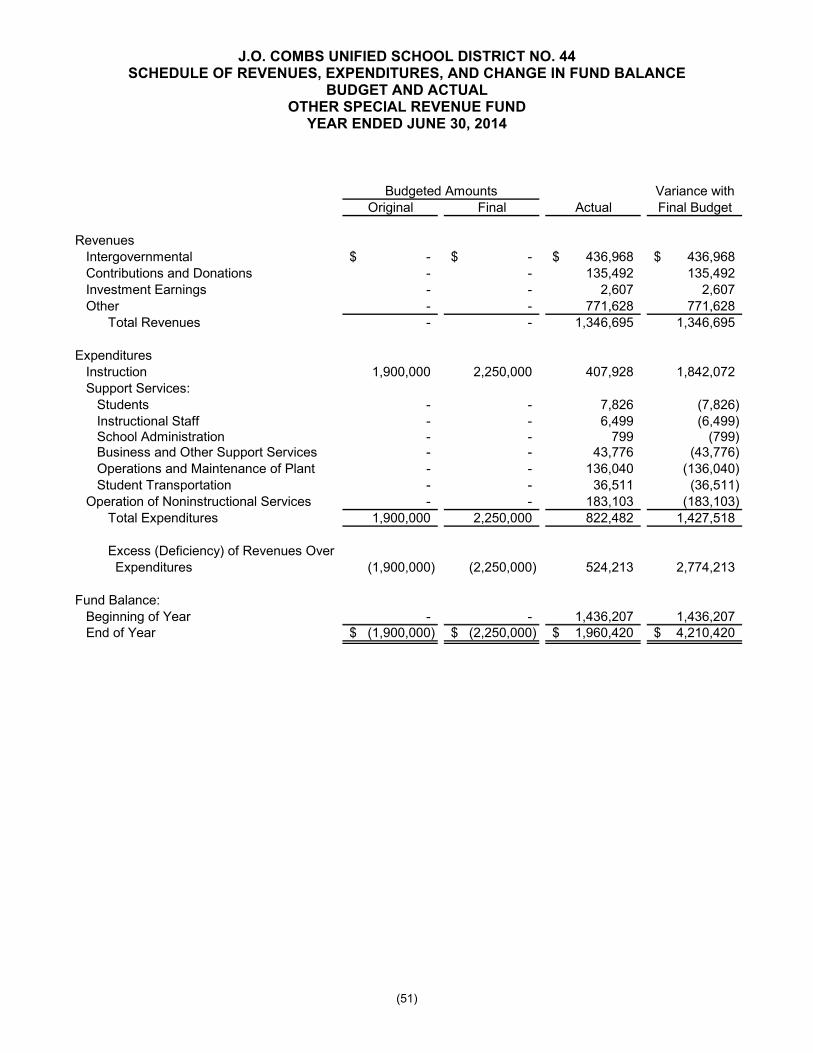
J.O. COMBS UNIFIED SCHOOL DISTRICT NO. 44 SCHEDULE OF REVENUES, EXPENDITURES, AND CHANGE IN FUND BALANCE
BUDGET AND ACTUAL OTHER SPECIAL REVENUE FUND
YEAR ENDED JUNE 30, 2014
(51)
Variance withOriginal Final Actual Final Budget
RevenuesIntergovernmental -$ -$ 436,968$ 436,968$ Contributions and Donations - - 135,492 135,492 Investment Earnings - - 2,607 2,607 Other - - 771,628 771,628
Total Revenues - - 1,346,695 1,346,695
ExpendituresInstruction 1,900,000 2,250,000 407,928 1,842,072 Support Services:
Students - - 7,826 (7,826) Instructional Staff - - 6,499 (6,499) School Administration - - 799 (799) Business and Other Support Services - - 43,776 (43,776) Operations and Maintenance of Plant - - 136,040 (136,040) Student Transportation - - 36,511 (36,511)
Operation of Noninstructional Services - - 183,103 (183,103) Total Expenditures 1,900,000 2,250,000 822,482 1,427,518
Excess (Deficiency) of Revenues Over Expenditures (1,900,000) (2,250,000) 524,213 2,774,213
Fund Balance:Beginning of Year - - 1,436,207 1,436,207 End of Year (1,900,000)$ (2,250,000)$ 1,960,420$ 4,210,420$
Budgeted Amounts

J.O. COMBS UNIFIED SCHOOL DISTRICT NO. 44 NOTE TO REQUIRED SUPPLEMENTARY INFORMATION
YEAR ENDED JUNE 30, 2014
(52)
NOTE 1 BASIS OF ACCOUNTING The District’s adopted budget is prepared on a basis consistent with U.S. generally accepted accounting principles, with the following exceptions:
1) The General Fund as reported in the Statement of Revenues, Expenditures, and Changes in
Fund Balances includes the District’s Maintenance and Operation Fund in addition to several other District funds as required by GASB Statement No. 54, Fund Balance Reporting and Governmental Fund Type Definitions; however, for budgetary purposes, the District prepares a separate Maintenance and Operation Fund budget.
2) Arizona school districts are allowed to analyze budget capacity at year end and are able to charge certain allowable expenditures for the subsequent year against the current year budget during the 60 day encumbrance period.
The following adjustments are necessary to present actual revenues, expenditures, other financing sources and uses, beginning fund balance and ending fund balance on a budgetary basis in order to present only the activity of the District’s Maintenance and Operation Fund for budgetary purposes.
Other
Financing Fund BalanceTotal Total Sources Beginning of Fund Balance
Revenues Expenditures and Uses Year End of Year
Statement of Revenues, Expenditures, and Changes in Fund Balance 23,423,203$ 22,188,959$ 309,688$ 8,071,145$ 9,615,077$
Non Maintenance and Operation ActivityIncluded in General Fund (1,755,576) (1,132,426) (309,669) (5,307,425) (6,240,244)
Items Charged to Budget DuringPrior year Encumbrance Period - - - (945,000) (945,000)
Items Charged to Budget DuringCurrent Year Encumbrance Period - 532,457 - - (532,457)
Budgetary Comparison Schedule - General Fund 21,667,627$ 21,588,990$ 19$ 1,818,720$ 1,897,376$

COMBINING AND INDIVIDUAL FUND STATEMENTS AND SCHEDULES

THIS PAGE BLANK

NONMAJOR GOVERNMENTAL FUNDS
SPECIAL REVENUE FUNDS
Instructional Improvement Fund - accounts for the revenues and expenditures for State apportioned Indian Gaming monies. Classroom Site Fund - accounts for the revenues and expenditures of State apportioned education sales tax monies. Food Service Fund - accounts for the financial operations of preparing and serving regular and incidental meals and snacks in connection with school functions. This is funded primarily through federal grants and charges for meals served.
CAPITAL PROJECTS FUNDS Bond Building Fund - accounts for monies received from District bond issues that are used to acquire sites, construct school buildings, supply school buildings with furniture and apparatus, improve school grounds, and purchase pupil transportation vehicles. Gifts and Donations Fund - accounts for gifts and donations to be expended for capital acquisitions. New School Facilities Fund - accounts for monies received from the School Facilities Board that are used to purchase land, to construct new school buildings, and to pay related architectural and engineering fees.
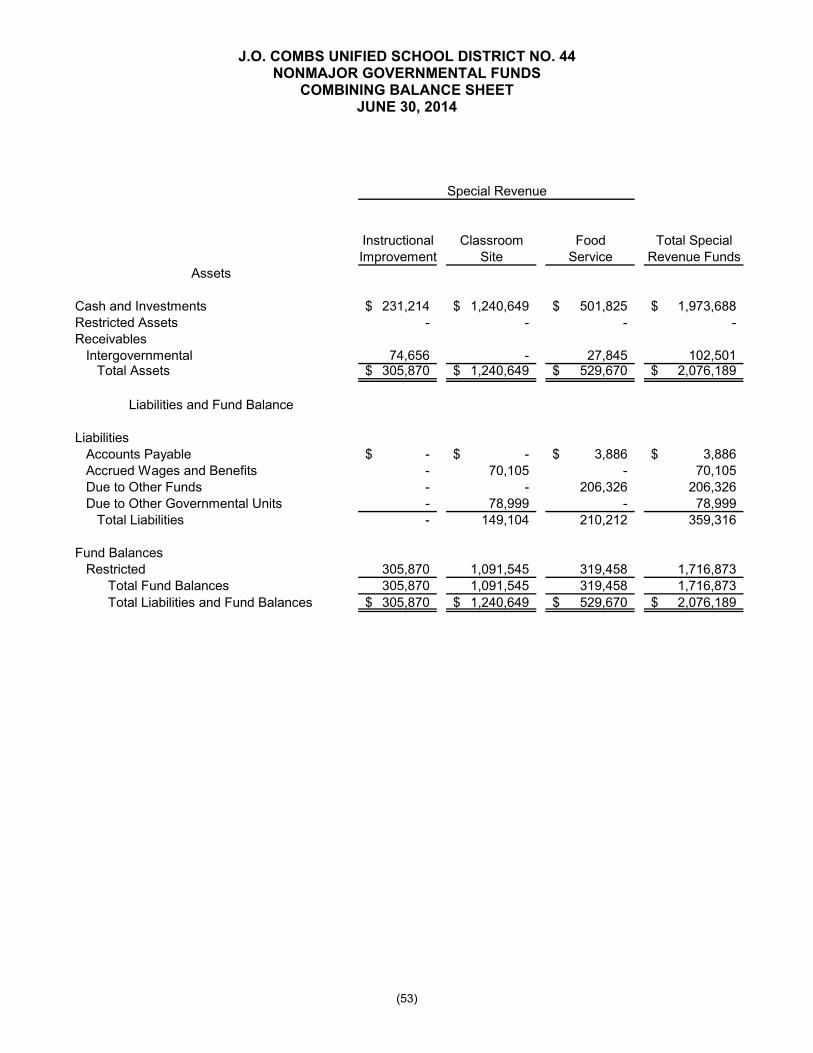
J.O. COMBS UNIFIED SCHOOL DISTRICT NO. 44 NONMAJOR GOVERNMENTAL FUNDS
COMBINING BALANCE SHEET JUNE 30, 2014
(53)
Instructional Classroom Food Total SpecialImprovement Site Service Revenue Funds
Assets
Cash and Investments 231,214$ 1,240,649$ 501,825$ 1,973,688$ Restricted Assets - - - - Receivables
Intergovernmental 74,656 - 27,845 102,501 Total Assets 305,870$ 1,240,649$ 529,670$ 2,076,189$
Liabilities and Fund Balance
LiabilitiesAccounts Payable -$ -$ 3,886$ 3,886$ Accrued Wages and Benefits - 70,105 - 70,105 Due to Other Funds - - 206,326 206,326 Due to Other Governmental Units - 78,999 - 78,999
Total Liabilities - 149,104 210,212 359,316
Fund BalancesRestricted 305,870 1,091,545 319,458 1,716,873
Total Fund Balances 305,870 1,091,545 319,458 1,716,873 Total Liabilities and Fund Balances 305,870$ 1,240,649$ 529,670$ 2,076,189$
Special Revenue

(54)
Total Nonmajor Bond Gifts and New School Total Capital Governmental
Building Donations Facilities Projects Funds Funds
-$ -$ 360,427$ 360,427$ 2,334,115$ 161,686 - - 161,686 161,686
- - - - 102,501 161,686$ -$ 360,427$ 522,113$ 2,598,302$
1,392$ -$ 144,416$ 145,808$ 149,694$ - - - - 70,105 - - - - 206,326 - - - - 78,999
1,392 - 144,416 145,808 505,124
160,294 - 216,011 376,305 2,093,178 160,294 - 216,011 376,305 2,093,178 161,686$ -$ 360,427$ 522,113$ 2,598,302$
Capital Projects

J.O. COMBS UNIFIED SCHOOL DISTRICT NO. 44 NONMAJOR GOVERNMENTAL FUNDS
COMBINING STATEMENT OF REVENUES, EXPENDITURES, AND CHANGE IN FUND BALANCES
YEAR ENDED JUNE 30, 2014
(55)
Instructional Classroom Food Total SpecialImprovement Site Service Revenue Funds
RevenuesIntergovernmental 172,926$ 1,580,018$ 905,510$ 2,658,454$ Food Service Sales - - 391,143 391,143 Investment Earnings 777 3,389 913 5,079 Other - - 12,557 12,557
Total Revenues 173,703 1,583,407 1,310,123 3,067,233
ExpendituresCurrent
Instruction 109,208 1,237,913 - 1,347,121 Support Services
Students - - - - Instructional Staff 37,613 31,998 - 69,611 Business and Other Support Services - 5,301 - 5,301 Operations and Maintenance of Plant - - - - Student Transportation - - - -
Operation of Noninstructional Services - - 1,084,731 1,084,731 Total Expenditures 146,821 1,275,212 1,084,731 2,506,764
Excess (Deficiency) of Revenues OverExpenditures 26,882 308,195 225,392 560,469
Other Financing Sources (Uses)Transfers Out - - (206,326) (206,326)
Total Other Financing Sources (Uses) - - (206,326) (206,326)
Net Change in Fund Balances 26,882 308,195 19,066 354,143
Fund BalancesBeginning of Year 278,988 783,350 300,392 1,362,730 End of Year 305,870$ 1,091,545$ 319,458$ 1,716,873$
Special Revenue

(56)
Total Nonmajor Bond Gifts and New School Total Capital Governmental
Building Donations Facilities Projects Funds Funds
-$ -$ 192,305$ 192,305$ 2,850,759$ - - - - 391,143 - - 1,293 1,293 6,372 - - - - 12,557 - - 193,598 193,598 3,260,831
- - 14,397 14,397 1,361,518
- - 236,757 236,757 236,757 - - - - 69,611 - - 8,739 8,739 14,040
1,393 - - 1,393 1,393 - - 2,054 2,054 2,054 - - - - 1,084,731
1,393 - 261,947 263,340 2,770,104
(1,393) - (68,349) (69,742) 490,727
- (19) - (19) (206,345) - (19) - (19) (206,345)
(1,393) (19) (68,349) (69,761) 284,382
161,687 19 284,360 446,066 1,808,796 160,294$ -$ 216,011$ 376,305$ 2,093,178$
Capital Projects

J.O. COMBS UNIFIED SCHOOL DISTRICT NO. 44 SCHEDULE OF REVENUES, EXPENDITURES AND CHANGE IN FUND BALANCE
BUDGET AND ACTUAL DEBT SERVICE FUND
YEAR ENDED JUNE 30, 2014
(57)
Variance withOriginal Final Actual Final Budget
RevenuesProperty Taxes -$ -$ 1,699,554$ 1,699,554$ Investment Earnings - - 4,112 4,112
Total Revenues - - 1,703,666 1,703,666
ExpendituresDebt Service
Principal Retirement 900,000 900,000 900,000 - Interest on Long-term Debt 793,231 793,231 794,702 (1,471)
Total Expenditures 1,693,231 1,693,231 1,694,702 (1,471)
Excess (Deficiency) of Revenues OverExpenditures (1,693,231) (1,693,231) 8,964 1,702,195
Fund BalanceBeginning of Year - - 230,206 230,206 End of Year (1,693,231)$ (1,693,231)$ 239,170$ 1,932,401$
Budgeted Amounts

J.O. COMBS UNIFIED SCHOOL DISTRICT NO. 44 SCHEDULE OF REVENUES, EXPENDITURES AND CHANGE IN FUND BALANCE
BUDGET AND ACTUAL ADJACENT WAYS FUND
YEAR ENDED JUNE 30, 2014
(58)
Variance withOriginal Final Actual Final Budget
RevenuesProperty Taxes -$ -$ 2,886$ 2,886$ Investment Earnings - - 2,009 2,009
Total Revenues - - 4,895 4,895
ExpendituresCapital Outlay
Facilities Acquisition 2,174,085 2,180,000 - 2,180,000 Total Expenditures 2,174,085 2,180,000 - 2,180,000
Excess (Deficiency) of Revenues OverExpenditures (2,174,085) (2,180,000) 4,895 2,184,895
Fund BalanceBeginning of Year - - 2,174,656 2,174,656 End of Year (2,174,085)$ (2,180,000)$ 2,179,551$ 4,359,551$
Budgeted Amounts
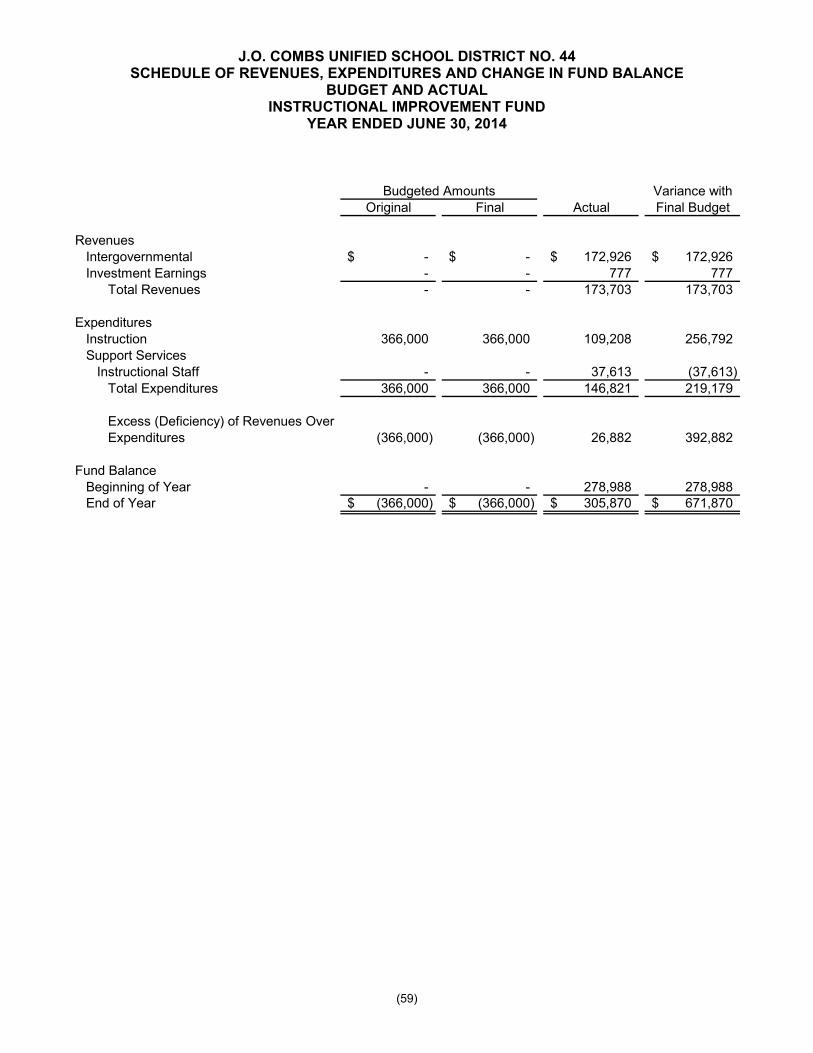
J.O. COMBS UNIFIED SCHOOL DISTRICT NO. 44 SCHEDULE OF REVENUES, EXPENDITURES AND CHANGE IN FUND BALANCE
BUDGET AND ACTUAL INSTRUCTIONAL IMPROVEMENT FUND
YEAR ENDED JUNE 30, 2014
(59)
Variance withOriginal Final Actual Final Budget
RevenuesIntergovernmental -$ -$ 172,926$ 172,926$ Investment Earnings - - 777 777
Total Revenues - - 173,703 173,703
ExpendituresInstruction 366,000 366,000 109,208 256,792 Support Services
Instructional Staff - - 37,613 (37,613) Total Expenditures 366,000 366,000 146,821 219,179
Excess (Deficiency) of Revenues OverExpenditures (366,000) (366,000) 26,882 392,882
Fund BalanceBeginning of Year - - 278,988 278,988 End of Year (366,000)$ (366,000)$ 305,870$ 671,870$
Budgeted Amounts

J.O. COMBS UNIFIED SCHOOL DISTRICT NO. 44 SCHEDULE OF REVENUES, EXPENDITURES AND CHANGE IN FUND BALANCE
BUDGET AND ACTUAL CLASSROOM SITE FUND
YEAR ENDED JUNE 30, 2014
(60)
Variance withOriginal Final Actual Final Budget
RevenuesIntergovernmental -$ -$ 1,580,018$ 1,580,018$ Investment Earnings - - 3,389 3,389
Total Revenues - - 1,583,407 1,583,407
ExpendituresInstruction 2,234,044 2,236,894 1,237,913 998,981 Support Services
Instructional Staff 92,420 103,181 31,998 71,183 Business and Other Support Services - - 5,301 (5,301)
Total Expenditures 2,326,464 2,340,075 1,275,212 1,064,863
Excess (Deficiency) of Revenues OverExpenditures (2,326,464) (2,340,075) 308,195 2,648,270
Fund BalanceBeginning of Year - - 783,350 783,350 End of Year (2,326,464)$ (2,340,075)$ 1,091,545$ 3,431,620$
Budgeted Amounts
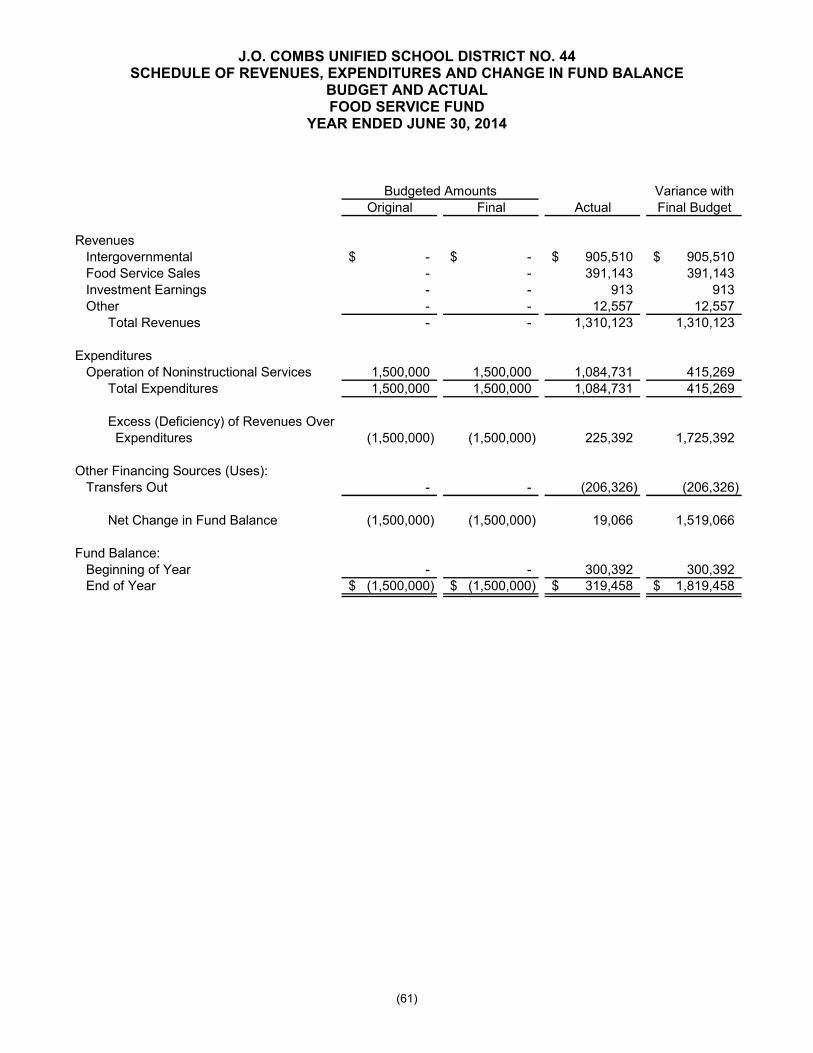
J.O. COMBS UNIFIED SCHOOL DISTRICT NO. 44 SCHEDULE OF REVENUES, EXPENDITURES AND CHANGE IN FUND BALANCE
BUDGET AND ACTUAL FOOD SERVICE FUND
YEAR ENDED JUNE 30, 2014
(61)
Variance withOriginal Final Actual Final Budget
RevenuesIntergovernmental -$ -$ 905,510$ 905,510$ Food Service Sales - - 391,143 391,143 Investment Earnings - - 913 913 Other - - 12,557 12,557
Total Revenues - - 1,310,123 1,310,123
ExpendituresOperation of Noninstructional Services 1,500,000 1,500,000 1,084,731 415,269
Total Expenditures 1,500,000 1,500,000 1,084,731 415,269
Excess (Deficiency) of Revenues Over Expenditures (1,500,000) (1,500,000) 225,392 1,725,392
Other Financing Sources (Uses):Transfers Out - - (206,326) (206,326)
Net Change in Fund Balance (1,500,000) (1,500,000) 19,066 1,519,066
Fund Balance:Beginning of Year - - 300,392 300,392 End of Year (1,500,000)$ (1,500,000)$ 319,458$ 1,819,458$
Budgeted Amounts

J.O. COMBS UNIFIED SCHOOL DISTRICT NO. 44 SCHEDULE OF REVENUES, EXPENDITURES AND CHANGE IN FUND BALANCE
BUDGET AND ACTUAL BOND BUILDING FUND
YEAR ENDED JUNE 30, 2014
(62)
Variance withOriginal Final Actual Final Budget
ExpendituresSupport Services
Operations and Maintenance of Plant -$ -$ 1,393$ (1,393)$ Capital Outlay
Facilities Acquisition 165,988 165,988 - 165,988 Total Expenditures 165,988 165,988 1,393 164,595
Excess (Deficiency) of Revenue OverExpenditures (165,988) (165,988) (1,393) 164,595
Fund BalanceBeginning of Year - - 161,687 161,687 End of Year (165,988)$ (165,988)$ 160,294$ 326,282$
Budgeted Amounts

J.O. COMBS UNIFIED SCHOOL DISTRICT NO. 44 SCHEDULE OF REVENUES, EXPENDITURES AND CHANGE IN FUND BALANCE
BUDGET AND ACTUAL NEW SCHOOL FACILITIES FUND
YEAR ENDED JUNE 30, 2014
(63)
Variance withOriginal Final Actual Final Budget
RevenuesIntergovernmental -$ -$ 192,305$ 192,305$ Investment Earnings - - 1,293 1,293
Total Revenues - - 193,598 193,598
ExpendituresInstruction - - 14,397 (14,397) Support Services
Students 478,923 478,923 236,757 242,166 Business and Other Support Services - - 8,739 (8,739) Student Transportation - - 2,054 (2,054)
Total Expenditures 478,923 478,923 261,947 216,976
Excess (Deficiency) of Revenues OverExpenditures (478,923) (478,923) (68,349) 410,574
Fund BalanceBeginning of Year - - 284,360 284,360 End of Year (478,923)$ (478,923)$ 216,011$ 694,934$
Budgeted Amounts

AGENCY FUNDS
Student Activities Fund - accounts for monies raised by students to finance student clubs and organizations but held by the District as an agency. Insurance Fund - accounts for monies held to pay insurance premiums of the District and District employees.

THIS PAGE BLANK

J.O. COMBS UNIFIED SCHOOL DISTRICT NO. 44 AGENCY FUNDS
COMBINING STATEMENT OF FIDUCIARY ASSETS AND LIABILITIES JUNE 30, 2014
(64)
Student Activities Insurance TotalsAssets
Current AssetsCash and Investments 69,843$ 26,100$ 95,943$
LiabilitiesDue to Student Groups 69,843$ -$ 69,843$ Due to Other Entities - 26,100 26,100
Total Liabilities 69,843$ 26,100$ 95,943$
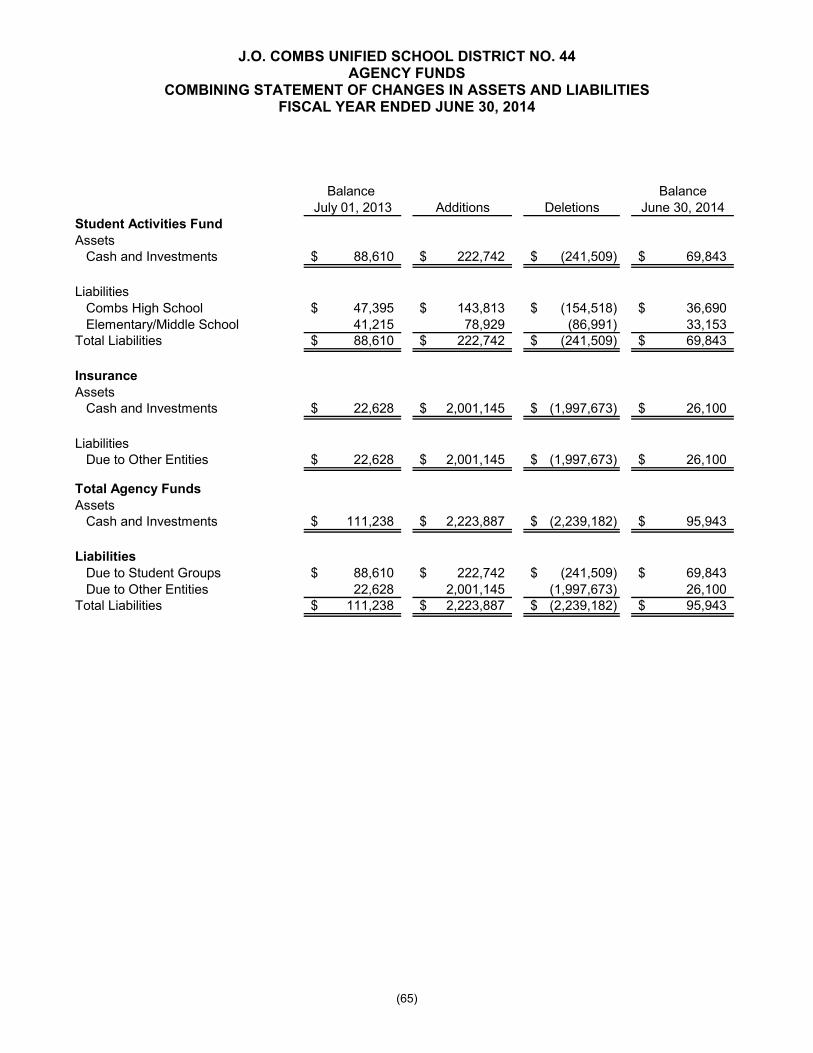
J.O. COMBS UNIFIED SCHOOL DISTRICT NO. 44 AGENCY FUNDS
COMBINING STATEMENT OF CHANGES IN ASSETS AND LIABILITIES FISCAL YEAR ENDED JUNE 30, 2014
(65)
Balance BalanceJuly 01, 2013 Additions Deletions June 30, 2014
Student Activities FundAssets
Cash and Investments 88,610$ 222,742$ (241,509)$ 69,843$
LiabilitiesCombs High School 47,395$ 143,813$ (154,518)$ 36,690$ Elementary/Middle School 41,215 78,929 (86,991) 33,153
Total Liabilities 88,610$ 222,742$ (241,509)$ 69,843$
InsuranceAssets
Cash and Investments 22,628$ 2,001,145$ (1,997,673)$ 26,100$
LiabilitiesDue to Other Entities 22,628$ 2,001,145$ (1,997,673)$ 26,100$
Total Agency FundsAssets
Cash and Investments 111,238$ 2,223,887$ (2,239,182)$ 95,943$
LiabilitiesDue to Student Groups 88,610$ 222,742$ (241,509)$ 69,843$ Due to Other Entities 22,628 2,001,145 (1,997,673) 26,100
Total Liabilities 111,238$ 2,223,887$ (2,239,182)$ 95,943$

STATISTICAL SECTION (UNAUDITED)
This section of the J.O. Combs Unified School District No. 44's comprehensive annual financial report presents detailed information as a context for understanding what the information in the financial statements, note disclosures, and required supplementary information says about the government's overall financial health. Financial Trends
These schedules contain trend information to help the reader understand how the government's financial performance and well-being have changed over time.
Revenue Capacity
These schedules contain information to help the reader assess the government's most significant local revenue source, the property tax.
Debt Capacity
These schedules present information to help the reader assess the affordability of the government's current levels of outstanding debt and the government's ability to issue additional debt in the future.
Demographic and Economic Information
These schedules offer demographic and economic indicators to help the reader understand the environment within which the government's financial activities take place.
Operating Information
These schedules contain service and infrastructure data to help the reader understand how the information in the government's financial report relates to the services the government provides and the activities it performs.
See the table of contents for page numbers of the schedules that encompass the above sections.

THIS PAGE BLANK

J.O. COMBS UNIFIED SCHOOL DISTRICT NO. 44 NET POSITION BY COMPONENT
LAST NINE FISCAL YEARS (ACCRUAL BASIS OF ACCOUNTING)
(UNAUDITED)
(66)
Governmental activitiesNet Investment in capital assets $ 20,846,659 $ 39,010,909 $ 67,674,970 $ 77,961,158 $ 77,488,114 $ 77,230,510 $ 75,230,510 $ 73,235,951 $ 70,573,331 Restricted 1,545,559 2,695,614 4,518,046 5,526,495 6,530,810 3,974,094 5,269,564 5,503,999 6,331,527 Unrestricted 425,882 1,063,452 10,444,233 9,253,326 10,588,144 13,276,112 13,272,416 14,812,783 16,135,947
Total governmental activities net position 22,818,100$ 42,769,975$ 82,637,249$ 92,740,979$ 94,607,068$ 94,480,716$ 93,772,490$ 93,552,733$ 93,040,805$
Source: District's Business Services Department.Note: Information prior to fiscal year 2005-06 was not available.
2013
Fiscal Year
2007 2011 20142008 2009 2010 20122006

J.O. COMBS UNIFIED SCHOOL DISTRICT NO. 44 CHANGE IN NET POSITION LAST NINE FISCAL YEARS
(ACCRUAL BASIS OF ACCOUNTING) (UNAUDITED)
(67)
ExpensesGovernmental activities:
Instruction $ 10,497,423 $ 12,937,406 $ 18,338,885 $ 21,506,926 $ 16,918,781 $ 15,715,448 $ 15,423,485 $ 15,908,616 $ 17,399,040 Support services:
Students 347,752 427,428 1,312,991 1,733,782 2,273,983 2,168,281 2,421,165 2,734,548 2,666,387 Instructional staff 429,127 608,162 762,527 1,339,249 562,584 499,416 379,936 780,531 733,168 General administration 233,102 335,951 403,307 315,208 572,550 445,087 477,250 414,720 437,159 School administration 590,950 731,864 1,072,669 1,770,223 1,219,769 1,452,019 1,473,185 1,314,880 1,299,200 Business and other support services 586,308 945,630 1,374,743 2,165,397 1,437,209 1,260,660 1,464,055 1,610,292 1,579,311 Operation and maintenance of plant 1,016,175 1,375,082 2,446,755 2,915,969 3,575,154 3,834,051 3,821,093 3,769,561 3,793,268 Student transportation 643,194 1,386,996 1,359,651 1,689,881 1,675,611 1,761,649 1,866,180 1,815,774 2,034,080
Operation of noninstructional services 422,668 594,802 811,969 1,255,318 1,421,921 1,370,068 1,275,820 1,395,785 1,362,264 Interest on long-term debt 973 129,144 650,393 900,598 911,606 845,165 808,070 1,083,820 782,269
Total governmental activities 14,767,672 19,472,465 28,533,890 35,592,551 30,569,168 29,351,844 29,410,239 30,828,527 32,086,146
Program RevenuesGovernmental activities:
Charges for services:Operation of noninstructional services 257,191 305,676 418,138 529,810 674,388 698,786 690,969 672,104 614,710
Operating grants and contributions 1,492,659 1,886,473 2,528,344 2,642,372 5,926,578 3,602,854 3,390,765 4,026,374 5,284,639 Capital grants and contributions 4,096,745 19,909,767 31,070,191 15,018,048 607,624 553,738 197,154 382,615 192,305
Total governmental activities program revenues $ 5,846,595 $ 22,101,916 $ 34,016,673 $ 18,190,230 $ 7,208,590 $ 4,855,378 $ 4,278,888 $ 5,081,093 $ 6,091,654
(Continued)
Fiscal Year
2011 201420122006 20132007 2008 2009 2010

(68)
Net (expense)/revenueGovernmental activities $ (8,921,077) $ 2,629,451 $ 5,482,783 $(17,402,321) $(23,360,578) $ (24,496,466) $ (25,131,351) $ (25,747,434) $ (25,994,492)
General Revenues and Other Changes in Net PositionGovernmental activities:
Property taxes 1,454,043 1,454,043 2,789,863 7,288,301 9,937,711 6,180,583 6,846,289 6,874,949 6,641,961 Unrestricted grants and contributions 10,835,667 10,835,667 14,037,098 18,614,547 16,895,493 17,367,979 16,804,490 17,787,156 17,887,700 Investment earnings 91,367 91,367 298,020 642,715 343,912 68,478 37,070 27,625 34,027 Other 301,700 301,700 197,443 367,483 328,935 753,074 735,276 837,947 918,876
Extraordinary gain - - - 7,471,445 - - - - - Total governmental activities: 12,682,777 12,682,777 17,322,424 34,384,491 27,506,051 24,370,114 24,423,125 25,527,677 25,482,564
Change in Net PositionGovernmental activities $ 3,761,700 $ 15,312,228 $ 22,805,207 $ 16,982,170 $ 4,145,473 $ (126,352) $ (708,226) $ (219,757) $ (511,928)
Source: District's Business Services Department.Note: Information prior to fiscal year 2005-06 was not available.
Fiscal Year
2011 201420122006 20132007(Concluded) 2008 2009 2010

THIS PAGE BLANK

J.O. COMBS UNIFIED SCHOOL DISTRICT NO. 44 FUND BALANCES OF GOVERNMENTAL FUNDS
LAST NINE FISCAL YEARS (MODIFIED ACCRUAL BASIS OF ACCOUNTING)
(UNAUDITED)
(69)
General FundReserved $ - $ - $ - $ - $ - $ - $ - $ - $ - Unreserved 614,511 1,580,932 2,780,419 (136,372) 1,893,647 - - - - Unassigned - - - - - 5,843,128 6,059,998 8,071,145 9,615,077
Total General Fund 614,511$ 1,580,932$ 2,780,419$ (136,372)$ 1,893,647$ 5,843,128$ 6,059,998$ 8,071,145$ 9,615,077$
All other governmental fundsReserved $ - $ - $ - $ - $ - $ - $ - $ - $ - Unreserved, reported in:
Special revenue funds 1,188,466 1,959,887 2,921,385 2,577,051 2,864,836 - - - - Debt service funds - 10,015 357,459 362,792 218,720 - - - - Capital projects funds 2,837,848 3,951,512 2,259,547 5,578,109 5,166,254 - - - -
Restricted - - - - - 4,960,767 6,049,778 5,658,339 6,480,267 Total all other governmental funds $ 4,026,314 $ 5,921,414 $ 5,538,391 $ 8,517,952 $ 8,249,810 $ 4,960,767 $ 6,049,778 $ 5,658,339 $ 6,480,267
Source: District's Business Services Department.Note 1: Information prior to fiscal year 2005-06 was not available.Note 2: The District implemented GASB statement 54 in fiscal year 2010-11 which amended the fund balance classifications.
201420122006 2013
Fiscal Year
2007 2008 2009 2010 2011

J.O. COMBS UNIFIED SCHOOL DISTRICT NO. 44 CHANGES IN FUND BALANCES OF GOVERNMENTAL FUNDS
LAST NINE FISCAL YEARS (MODIFIED ACCRUAL BASIS OF ACCOUNTING)
(UNAUDITED)
(70)
RevenuesProperty taxes $ 1,438,428 $ 2,749,508 $ 7,092,816 $ 9,867,392 $ 7,390,644 $ 6,227,340 $ 6,978,843 $ 6,858,097 $ 6,662,096 Intergovernmental
Federal aid and grants 589,986 591,687 901,406 1,164,697 4,636,056 2,648,917 1,877,956 2,372,084 2,802,333 State aid and grants 14,990,417 34,742,158 50,906,844 33,236,379 17,994,725 17,901,715 17,181,786 18,244,848 18,611,410 County aid and grants 384,564 8,968 176 - 969,130 931,224 940,655 1,183,752 1,178,999 Local aid and grants - - - - - - 153,187 194,996 436,968
Food services sales 257,066 305,676 385,702 476,980 488,360 480,893 430,927 431,682 391,143 Auxiliary operations - - 31,028 52,830 186,028 217,893 260,042 240,422 223,567 Contributions and donations 460,104 490,525 404,656 154,837 227,519 117,020 195,178 244,112 334,934 Investment earnings 91,367 298,020 642,715 343,912 138,018 68,478 37,070 27,625 34,027 Other 301,825 197,443 368,891 328,935 420,614 753,074 735,276 837,947 918,876 Total revenues 18,513,757 39,383,985 60,734,234 45,625,962 32,451,094 29,346,554 28,790,920 30,635,565 31,594,353
ExpendituresCurrentInstruction 10,478,013 12,481,858 14,533,708 19,442,348 14,817,586 13,453,479 12,939,877 13,713,258 14,024,151 Support services:
Students 329,361 410,620 1,294,600 1,713,057 2,227,581 2,121,915 2,383,488 2,700,239 2,632,078 Instructional staff 427,075 601,184 754,914 1,331,636 554,971 491,803 372,323 772,918 725,555 General administration 195,579 260,241 364,931 270,163 513,673 386,210 435,661 414,720 437,159 School administration 590,000 732,017 1,070,397 1,767,951 1,217,682 1,450,063 1,471,229 1,307,278 1,299,027 Business and other 583,334 941,721 1,357,502 2,190,623 1,415,818 1,480,576 1,446,633 1,540,858 1,519,441 Operation/maintenance of plant 1,002,865 1,359,338 2,432,175 2,991,339 3,590,649 3,809,232 3,795,429 3,671,483 3,748,891 Student transportation 616,152 1,900,301 1,125,539 2,450,282 1,363,677 1,468,869 1,595,817 1,548,130 1,701,386
Operation of noninstructional services 418,906 588,291 799,269 1,257,093 1,409,122 1,359,536 1,270,336 1,384,718 1,351,196 Capital outlay
Facilities acquisition/construction 3,608,529 20,756,238 42,832,183 17,867,620 1,158,222 664,285 458,635 713,645 50,095 Debt service
Principal 11,691 312,031 1,296,033 2,415,037 1,477,362 1,323,837 476,270 430,211 939,889 Interest and fiscal charges 973 129,144 661,440 917,954 942,874 876,436 839,341 818,399 799,625 Bond issuance costs 149,642 86,577 127,422 209,703 - - - - -
Total expenditures 18,412,120 40,559,561 68,650,113 54,824,806 30,689,217 28,886,241 27,485,039 29,015,857 29,228,493
Fiscal Year
(Continued)
2010 2011 201420122006 20132007 2008 2009

(71)
Excess of revenuesover (under) expenditures
Other financing sources (uses)Issuance of long-term debt - 3,520,000 8,580,000 8,880,000 - - - - - Premium on Issuance of long -term debt - 65,159 152,343 181,854 - - - - - Issuance of capital leases 2,945,000 451,938 - 199,760 - 200,125 - - - Transfers in 67,155 102,153 85,783 137,500 187,113 218,981 276,283 356,192 309,688 Transfers out (67,155) (102,153) (85,783) (137,500) (187,113) (218,981) (276,283) (356,192) (309,688)Total other financing sources (uses) 2,945,000 4,037,097 8,732,343 9,261,614 - 200,125 - - -
Net change in fund balances $ 3,046,637 $ 2,861,521 $ 816,464 $ 62,770 $ 1,761,877 $ 660,438 $ 1,305,881 $ 1,619,708 $ 2,365,860
Debt service as a percentage of 1.16% 2.84% 7.69% 10.72% 8.97% 7.85% 4.83% 4.41% 6.01%noncapital expenditures
Source: District's Business Services Department.Note: Information prior to fiscal year 2005-06 was not available.
$ 101,637 $ 1,305,881
2007
$ (1,175,576)
2014
$ (7,915,879) $ (9,198,844) $ 1,761,877 $ 460,313 $ 2,365,860
2012 2013
$ 1,619,708
Fiscal Year
(Concluded) 2008 2009 2010 20112006

J.O. COMBS UNIFIED SCHOOL DISTRICT NO. 44 ASSESSED VALUE AND ESTIMATED ACTUAL VALUE OF TAXABLE PROPERTY
LAST NINE FISCAL YEARS (UNAUDITED)
(72)
Residential Property
Agricultural and Commercial
Property Total Assessed Less: Total TaxableTotal Direct
Value Value Value Exemptions Assessed Value Tax Rate
2006 $ 32,019,541 $ 10,548,138 $ 42,567,679 $ 2,554,061 $ 40,013,618 6.172 $ 343,186,623 11.66%2007 57,866,162 17,072,856 74,939,018 4,524,477 70,414,541 6.042 675,580,107 10.42%2008 96,816,602 31,894,113 128,710,715 7,677,154 121,033,561 9.900 1,153,238,673 10.50%2009 155,801,260 44,216,592 200,017,852 10,224,226 189,793,626 7.498 1,816,760,451 10.45%2010 150,507,619 45,411,921 195,919,540 13,208,732 182,710,808 5.127 1,761,499,864 10.37%2011 108,686,692 40,015,194 148,701,886 13,985,526 134,716,360 4.275 1,305,055,088 10.32%2012 91,190,341 42,798,616 133,988,957 13,595,022 120,393,935 6.747 1,143,244,184 10.53%2013 93,550,396 42,175,804 135,726,200 18,895,936 116,830,264 6.667 1,169,170,912 9.99%2014 92,734,959 41,356,275 134,091,234 19,847,884 114,243,350 6.503 1,165,924,256 9.80%
Source: Arizona Department of Revenue.Note: Information prior to fiscal year 2005-06 was not available.
Fiscal Year
Estimated Actual Value
Assessed Value as a
Percentage of Actual Value

J.O. COMBS UNIFIED SCHOOL DISTRICT NO. 44 PROPERTY TAX RATES
DIRECT AND OVERLAPPING GOVERNMENTS LAST NINE FISCAL YEARS
(UNAUDITED)
(73)
Fiscal GeneralYear Purposes
2006 4.6439 1.5278 - 6.1717 4.5863 - 2007 4.6446 1.3970 - 6.0416 4.4366 - 2008 5.4080 2.8516 1.6401 9.8997 4.1442 1.9500 2009 4.1495 1.9112 1.4370 7.4977 3.5614 1.9500 2010 3.5106 0.4551 1.1615 5.1272 3.3575 1.9500 2011 2.8649 0.5064 0.9032 4.2745 3.9999 1.9500 2012 5.1495 0.7792 0.8184 6.7471 3.9990 1.9500 2013 4.9545 0.6388 1.0739 6.6672 3.7999 1.9500 2014 4.5707 0.5657 1.3663 6.5027 3.7999 1.9500
Source: Pinal County Assessor's OfficeNote: Information prior to fiscal year 2005-06 was not available.
District Direct Rates Overlapping Rates
Capital Purposes
Debt Purposes Total Pinal County
Town of Queen Creek

J.O. COMBS UNIFIED SCHOOL DISTRICT NO. 44 PRINCIPAL PROPERTY TAXPAYERS
2013 AND NINE YEARS PRIOR (UNAUDITED)
(74)
Taxpayer
Taxable Assessed
Value Rank
Taxable Assessed
Value Rank
Trilogy Johnson Farms Construction LLC $ 1,818,107 1 1.56 %
H2O Inc./Johnson Utilities LLC 1,625,903 2 1.39 $ 257,465 1 1.29 %
The Club at Encanterra LLC 1,567,780 3 1.34
Smith's Food & Drug Centers Inc. 1,341,600 4 1.15
Johnson Utilities Inc. LLC (Sewer) 989,552 5 0.85
Relo Queen Creek LLC 946,410 6 0.81
CR Dayton VIII LLC 742,049 7 0.64
Ironwood Commercial LLC 673,346 8 0.58
Barclay Holdings XXXIV LLC 629,252 9 0.54
Ironwood Commercial LLC 552,298 10 0.47
QC Pecan Ranch LLC 223,899 2 1.12
Cemex Inc. 209,595 3 1.05
Queen Creek XVIII LLC 173,858 4 0.87
Qwest Corporation 148,850 5 0.74
Donohue Pship II LLP 142,321 6 0.71
Verizon Wireless Inc 123,639 7 0.62
Mkg Properties LLC 115,561 8 0.58
Queen Creek Acres LLC 112,608 9 0.56
Centex Homes 103,014 10 0.52
Totals 10,886,297$ 9.33 % 1,610,810$ 8.06 %
Source: The Pinal County Treasurer.
* Latest available information.
2013* 2004
Percentage of Taxable
Assessed Value
Percentage of Taxable
Assessed Value

J.O. COMBS UNIFIED SCHOOL DISTRICT NO. 44 PROPERTY TAX LEVIES AND COLLECTIONS
LAST NINE FISCAL YEARS (UNAUDITED)
(75)
Taxes Levied Current Percent of Collections inFiscal for the Tax Current Taxes Subsequent Percentage of Year Fiscal Year Collections Collected Years Total to Date Levy
2006 $ 1,305,540 $ 1,258,113 96.37% $ 47,427 $ 1,305,540 100.00%
2007 2,520,872 2,405,233 95.41% 115,639 2,520,872 100.00%
2008 6,788,293 6,449,728 95.01% 338,554 6,788,282 100.00%
2009 9,474,261 9,048,679 95.51% 425,561 9,474,240 100.00%
2010 6,944,856 6,722,356 96.80% 221,537 6,943,893 99.99%
2011 5,657,188 5,422,166 95.85% 231,581 5,653,747 99.94%
2012 6,122,367 6,009,127 98.15% 111,549 6,120,676 99.97%
2013 6,149,773 6,026,958 98.00% 121,352 6,148,310 99.98%
2014 5,893,371 5,812,086 98.62% - 5,812,086 98.62%
Source: The Pinal County Treasurer.Note: Information prior to fiscal year 2005-06 was not available.
Current Collections Collections to Date
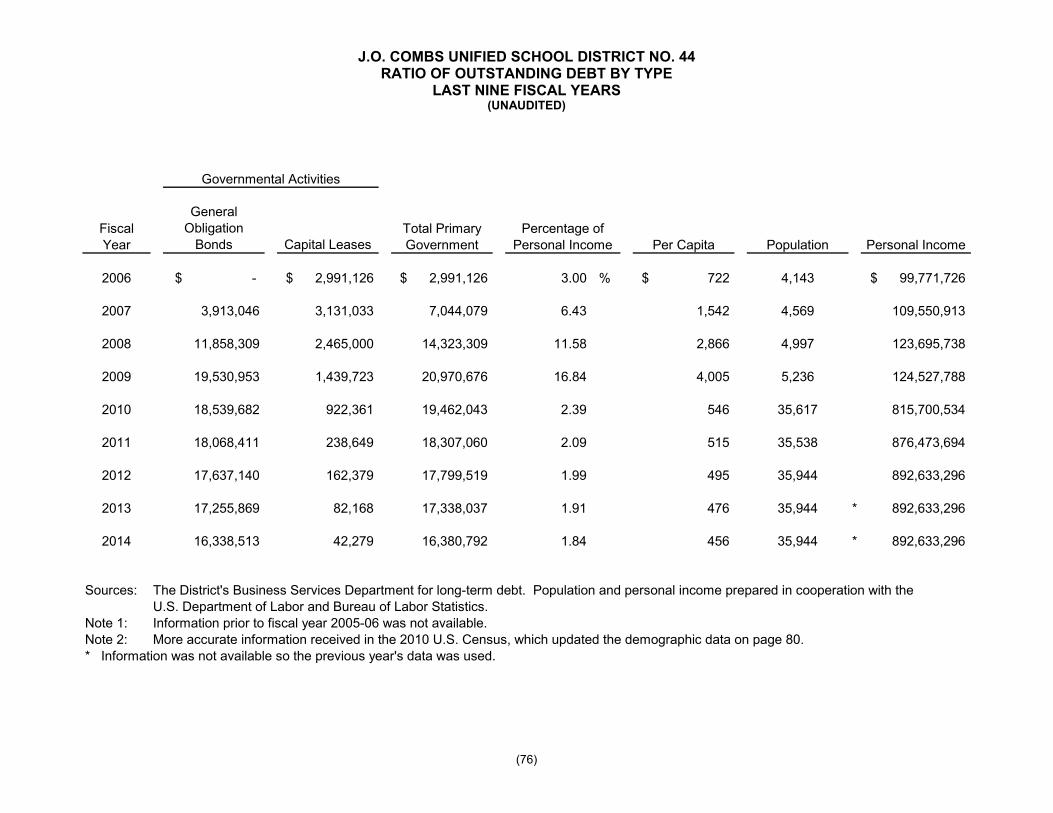
J.O. COMBS UNIFIED SCHOOL DISTRICT NO. 44 RATIO OF OUTSTANDING DEBT BY TYPE
LAST NINE FISCAL YEARS (UNAUDITED)
(76)
General Obligation
Bonds Capital Leases
2006 $ - $ 2,991,126 $ 2,991,126 3.00 % $ 722 4,143 $ 99,771,726
2007 3,913,046 3,131,033 7,044,079 6.43 1,542 4,569 109,550,913
2008 11,858,309 2,465,000 14,323,309 11.58 2,866 4,997 123,695,738
2009 19,530,953 1,439,723 20,970,676 16.84 4,005 5,236 124,527,788
2010 18,539,682 922,361 19,462,043 2.39 546 35,617 815,700,534
2011 18,068,411 238,649 18,307,060 2.09 515 35,538 876,473,694
2012 17,637,140 162,379 17,799,519 1.99 495 35,944 892,633,296
2013 17,255,869 82,168 17,338,037 1.91 476 35,944 * 892,633,296
2014 16,338,513 42,279 16,380,792 1.84 456 35,944 * 892,633,296
Sources: The District's Business Services Department for long-term debt. Population and personal income prepared in cooperation with the U.S. Department of Labor and Bureau of Labor Statistics.
Note 1: Information prior to fiscal year 2005-06 was not available.Note 2: More accurate information received in the 2010 U.S. Census, which updated the demographic data on page 80.* Information was not available so the previous year's data was used.
Personal Income
Governmental Activities
Fiscal Year
Total Primary Government
Percentage of Personal Income Per Capita Population

J.O. COMBS UNIFIED SCHOOL DISTRICT NO. 44 RATIO OF GENERAL BONDED DEBT OUTSTANDING
LAST NINE FISCAL YEARS (UNAUDITED)
(77)
FiscalYear Per Capita
2006 $ - $ - $ - $ 722 $ 40,013,618 0.00%2007 3,913,046 (10,015) 3,903,031 1,542 70,414,541 5.54%2008 11,858,309 (357,459) 11,500,850 2,866 121,033,561 9.50%2009 19,530,953 (362,792) 19,168,161 4,005 189,793,626 10.10%2010 18,539,682 (218,720) 18,320,962 546 182,710,808 10.03%2011 18,068,411 (253,629) 17,814,782 515 134,716,360 13.22%2012 17,637,140 (162,379) 17,474,761 495 120,393,935 14.51%2013 17,255,869 (230,206) 17,025,663 476 116,830,264 14.36%2014 16,338,513 (239,170) 16,099,343 456 114,243,350 14.09%
Sources: The District's Business Services Department and Arizona Department of Revenue.Note 1: Information prior to fiscal year 2005-06 was not available.Note 2: The District did not have any general obligation bonded debt in fiscal year 2005-06.
General Obligation
Bonds
Less: Amounts Available in
Debt Service Fund
Net General Obligation
Bonded DebtTotal Taxable
Assessed Value
Percentage of Total Taxable
Assessed Value

J.O. COMBS UNIFIED SCHOOL DISTRICT NO. 44 DIRECT AND OVERLAPPING GOVERNMENTAL ACTIVITIES DEBT
JUNE 30, 2014 (UNAUDITED)
(78)
Governmental UnitOutstanding
Debt
Estimated Percentage
Applicable (1)
Estimated Share of
Overlapping Debt
Debt repaid with property taxesState of Arizona $ - 21.00% $ - Pinal County - 5.30% - Pinal County Community College District 88,680,000 5.30% 4,703,833 Town of Queen Creek - 4.00% -
Subtotal, overlapping debt 4,703,833
J.O. Combs Unified School District No. 44 direct debt 16,380,792
Total direct and overlapping debt $ 21,084,625
(1)
Source: Office of the Pinal County Assessor.
Proportion applicable to the J.O. Combs Unified School District is computed on the ratio of secondary assessed valuation for 2013-14.

J.O. COMBS UNIFIED SCHOOL DISTRICT NO. 44 LEGAL DEBT MARGIN INFORMATION
LAST NINE FISCAL YEARS (UNAUDITED)
(79)
Total debt limit $ 12,004,085 $ 21,124,362 $ 36,310,068 $ 56,938,088 $ 54,813,242 $ 40,414,908 $ 36,118,181 $ 35,049,079 $ 34,273,005
Total applicable to limit - 3,509,985 11,112,541 18,797,208 17,981,280 17,506,371 17,304,113 16,779,794 15,870,830
Legal debt margin $ 12,004,085 $ 17,614,377 $ 25,197,527 $ 38,140,880 $ 36,831,962 $ 22,908,537 $ 18,814,068 $ 18,269,285 $ 18,402,175
Total net debt applicable to the limit as a percentage of the debt limit 0.00% 16.62% 30.60% 33.01% 32.80% 43.32% 47.91% 47.88% 46.31%
Class B debt limit $ 4,001,362 $ 7,041,454 $ 12,103,356 $ 18,979,363 $ 18,271,081 $ 13,471,636 $ 12,039,394 $ 11,683,026 $ 11,424,335
Total applicable to limit - 3,509,985 11,112,541 18,797,208 17,981,280 17,506,371 17,304,113 16,779,794 15,870,830
Legal debt margin $ 4,001,362 $ 3,531,469 $ 990,815 $ 182,155 $ 289,801 $ (4,034,735) $ (5,264,719) $ (5,096,768) $ (4,446,495)
Total net debt applicable to the limit as a percentage of the debt limit 0.00% 49.85% 91.81% 99.04% 98.41% 129.95% 143.73% 143.63% 138.92%
Source: The District's Business Services DepartmentNote 1: Information prior to fiscal year 2005-06 was not available.Note 2: The District's assessed value has decreased, which caused it exceed the Class B Debt Limit.
201420122006 2013
Fiscal Year
2007 2008 2009 2010 2011

J.O. COMBS UNIFIED SCHOOL DISTRICT NO. 44 CALCULATION OF LEGAL DEBT MARGIN
JUNE 30, 2014 (UNAUDITED)
(80)
Net secondary assessed value $ 114,243,350
Legal debt margin:
Debt limitation - 30% of assessed value $ 34,273,005
Amount of debt applicable to debt limit:Class A General Obligation and Refunding Bonds Outstanding $ - Class B General Obligation and Refunding Bonds Outstanding 16,110,000 Less: Assets in Debt Service Fund available for payment of principal (239,170)
Total amount of debt applicable to debt limit 15,870,830
Legal debt margin $ 18,402,175
Class B legal debt margin
Debt limit - the greater of 10% of the net secondary assessed valuation or $1,500 per student (ADM)
10% of net secondary assessed valuation $ 11,424,335 $1,500 per student (ADM) 6,411,000
Amount of debt applicable to debt limit:Class B General Obligation and Refunding Bonds Outstanding 16,110,000 Less: Assets in Debt Service Fund available for payment of principal (239,170)
Total amount of debt applicable to debt limit 15,870,830
Class B legal debt margin $ (4,446,495)
Source: Pinal County Assessor's Office
Note 2: The District's assessed value has decreased, which caused it to exceed the Class B Debt Limit.
Note 1: State statutes limit the total amount of bonded debt for a unified school district to 30% of the netsecondary assessed valuation of the District. In addition, Class B bonded debt is limited to the greater of 10% ofthe net secondary assessed valuation of the District or $1,500 per student for a unified school district.

J.O. COMBS UNIFIED SCHOOL DISTRICT NO. 44 DEMOGRAPHIC AND ECONOMIC STATISTICS
LAST NINE FISCAL YEARS (UNAUDITED)
(81)
Fiscal Year
2006 4,143 $ 99,771,726 $ 24,082 4.80%2007 4,569 109,550,913 23,977 4.50%2008 4,997 123,695,738 24,754 7.10%2009 5,236 124,527,788 23,783 11.40%2010 35,617 815,700,534 22,902 11.70%2011 35,538 876,473,694 24,663 10.30%2012 35,944 892,633,296 24,834 8.80%2013 35,944 * 892,633,296 * 24,834 * 9.10%2014 35,944 * 892,633,296 * 24,834 * 8.60%
Note 1: Information prior to fiscal year 2005-06 was not available.
Note 2: More accurate information was received in the 2010 U.S. Census.
* Information for 2013 and 2014 was not available so previous year's data was used.
Population Personal Income
Per Capita Personal Income
Pinal County Unemployment
Rate
Source: U.S. Census Bureau, Small Area Income and Poverty Estimates, Regional EconomicInformation System, Bureau of Economic Analysis, U.S. Department of Commerce and U.S.Department of Labor, Bureau of Labor Statistics and State of Arizona, Department ofCommerce, Research Administration, CES/LAUS Unit.
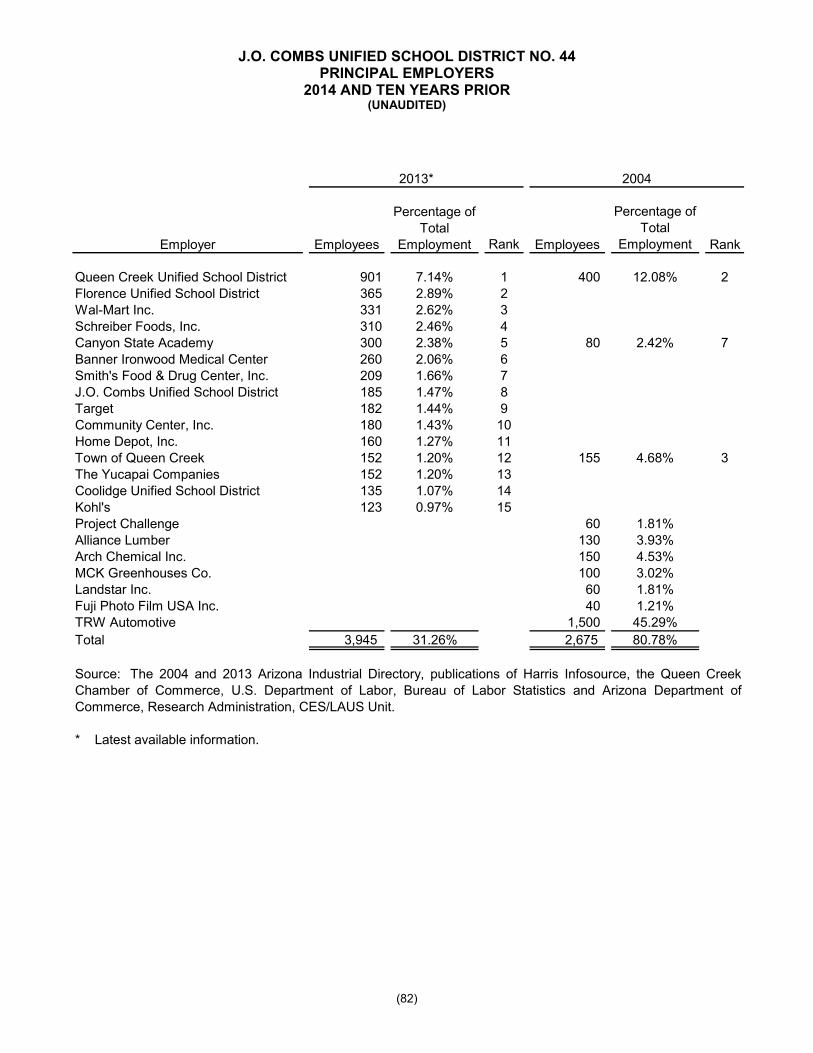
J.O. COMBS UNIFIED SCHOOL DISTRICT NO. 44 PRINCIPAL EMPLOYERS
2014 AND TEN YEARS PRIOR (UNAUDITED)
(82)
Rank
Percentage of Total
Employment Rank
Queen Creek Unified School District 901 7.14% 1 400 12.08% 2Florence Unified School District 365 2.89% 2Wal-Mart Inc. 331 2.62% 3Schreiber Foods, Inc. 310 2.46% 4Canyon State Academy 300 2.38% 5 80 2.42% 7Banner Ironwood Medical Center 260 2.06% 6Smith's Food & Drug Center, Inc. 209 1.66% 7J.O. Combs Unified School District 185 1.47% 8Target 182 1.44% 9Community Center, Inc. 180 1.43% 10Home Depot, Inc. 160 1.27% 11Town of Queen Creek 152 1.20% 12 155 4.68% 3The Yucapai Companies 152 1.20% 13Coolidge Unified School District 135 1.07% 14Kohl's 123 0.97% 15Project Challenge 60 1.81%Alliance Lumber 130 3.93%Arch Chemical Inc. 150 4.53%MCK Greenhouses Co. 100 3.02%Landstar Inc. 60 1.81%Fuji Photo Film USA Inc. 40 1.21%TRW Automotive 1,500 45.29%Total 3,945 31.26% 2,675 80.78%
* Latest available information.
Source: The 2004 and 2013 Arizona Industrial Directory, publications of Harris Infosource, the Queen CreekChamber of Commerce, U.S. Department of Labor, Bureau of Labor Statistics and Arizona Department ofCommerce, Research Administration, CES/LAUS Unit.
Employer Employees
Percentage of Total
Employment Employees
2013* 2004

J.O. COMBS UNIFIED SCHOOL DISTRICT NO. 44 FULL-TIME EQUIVALENT EMPLOYEES BY FUNCTION
LAST NINE FISCAL YEARS (UNAUDITED)
(83)
SupervisoryInstructional administrators 1 1 1 1 - - - - - Noninstructional administrators 3 5 5 8 8 8 8 8 8 Consultants/supervisors of instruction 3 2 6 7 6 6 1 1 1 Principals 3 5 5 5 6 7 7 7 7 Assistant principals 3 3 5 6 7 5 7 3 3
Total Supervisory 13 16 22 27 27 26 23 19 19
InstructionClassroom teachers 102 129 159 209 214 224 211 217 213 Aids 29 25 44 45 50 64 76 77 72
Total instruction 131 154 203 254 264 288 287 294 285
Student ServicesGuidance counselors - 1 2 3 7 7 8 6 8 Psychologist - - 2 2 3 3 7 5 8 Librarians 7 5 10 10 7 7 8 7 7 Other professionals (noninstructional) 4 4 5 6 7 7 7 9 9 Technicians 2 3 4 4 5 6 6 6 6
Total student services 13 13 23 25 29 30 36 33 38
Support and AdministrationSupervisors 1 1 2 3 3 3 4 3 4 Clerical/secretarial 17 18 35 25 29 26 27 30 30 Service workers 66 77 132 122 126 128 118 124 124
Total support and administration 84 96 169 150 158 157 149 157 158 Total 241 279 417 456 478 501 495 503 500
Source: Arizona Department of Education SDER Report.Note: Information prior to fiscal year 2005-06 was not available.
20122006 2014
Full-Time Equivalent Employees
2007Function 2011 20132008 2009 2010

THIS PAGE BLANK

J.O. COMBS UNIFIED SCHOOL DISTRICT NO. 44 OPERATING STATISTICS
LAST NINE FISCAL YEARS (UNAUDITED)
(84)
CostOperating Total Per Percentage Teaching Pupil-Teacher
Expenditures Expenditures Pupil Change Staff Ratio
2006 2,232 14,641,285$ 6,560$ Note % 18,412,120$ 8,249$ Note % 102.00 21.88 33.45 %2007 2,899 19,275,571 6,649 1.36 40,559,561 13,991 69.60 129.00 22.47 33.872008 3,681 23,733,035 6,447 (3.03) 68,650,113 18,650 33.30 159.00 23.15 37.172009 4,143 33,414,492 8,065 25.09 54,824,806 13,233 (29.04) 209.00 19.82 44.272010 4,214 27,110,759 6,433 (20.23) 30,689,217 7,283 (44.97) 214.00 19.69 44.812011 4,027 26,021,683 6,462 0.44 28,886,241 7,173 (1.50) 199.00 20.24 47.812012 4,123 25,710,793 6,236 (3.50) 27,485,039 6,666 (7.07) 211.00 19.54 43.492013 4,290 27,053,602 6,306 1.13 29,015,857 6,764 1.46 217.00 19.77 43.492014 4,274 27,438,884 6,420 2.95 29,228,493 6,839 2.59 213.00 20.07 43.60
Source: Data for Operating Expenditures is Total Expenditures less Debt Service and Facilities Acquisition and Construction.Note: Information prior to fiscal year 2005-06 was not available.
Percentage of Students
Receiving Free or Reduced Meals
Fiscal Year Enrollment Cost per Pupil
PercentageChange

J.O. COMBS UNIFIED SCHOOL DISTRICT NO. 44 SCHOOL BUILDING INFORMATION
LAST NINE FISCAL YEARS (UNAUDITED)
(85)
Elementary Schools
Name: Combs Traditional AcademyYr. Built 2000
Sq. Feet N/A N/A N/A N/A N/A 26,000 26,000 26,000 26,000Enrollment N/A N/A N/A N/A N/A 141 134 183 231
Name: Ellsworth ElementaryYr. Built 2007
Sq. Feet N/A 65,000 65,000 65,000 65,000 65,000 65,000 65,000 65,000Enrollment N/A 865 856 873 715 631 643 739 674
Name: Jack W. Harmon ElementaryYr. Built 2005
Sq. Feet 67,500 67,500 67,500 67,500 67,500 67,500 67,500 67,500 67,500Enrollment 866 1050 830 823 726 614 616 700 586
Name: Ranch ElementaryYr. Built 2008
Sq. Feet N/A N/A N/A 67,500 67,500 67,500 67,500 67,500 67,500Enrollment N/A N/A N/A 605 491 500 522 617 599
Name: Kathryn Sue Simonton ElementaryYr. Built 2003
Sq. Feet 69,234 69,234 69,234 69,234 69,234 69,234 69,234 69,234 69,234Enrollment 782 945 691 677 603 502 506 581 571
2006 20112008 2009 2013
Fiscal Year
201420122007 2010
(continued)
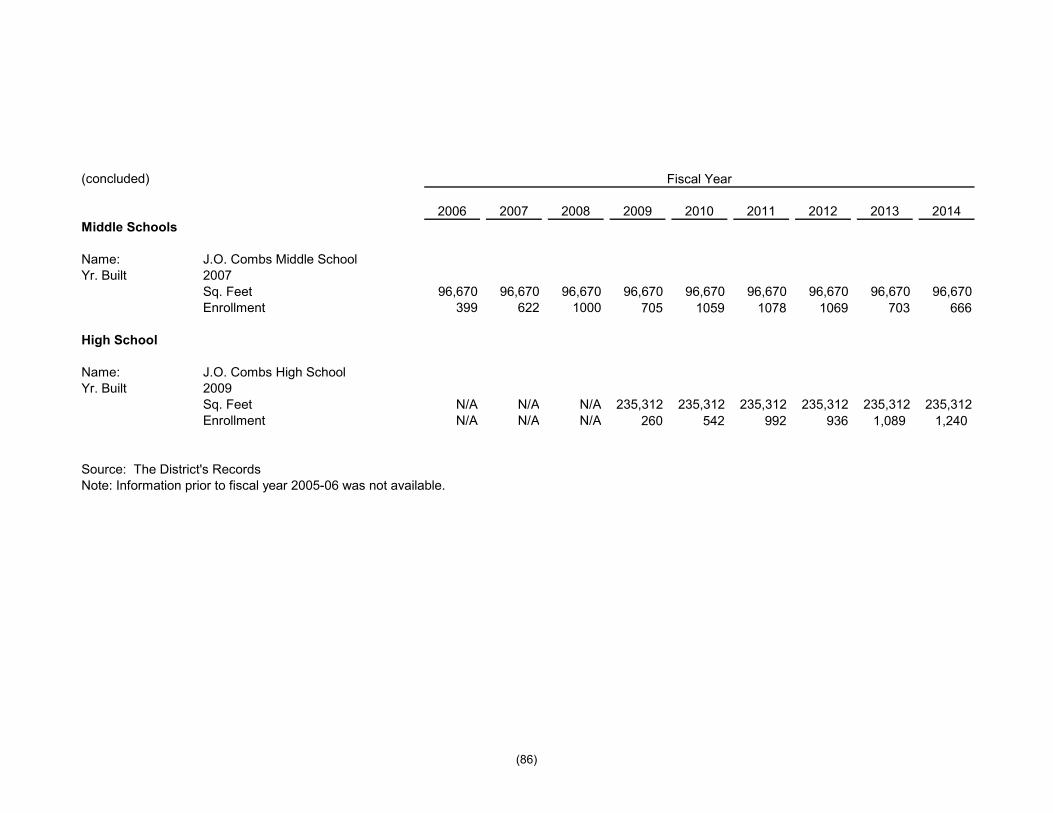
(86)
(concluded)
Middle Schools
Name: J.O. Combs Middle SchoolYr. Built 2007
Sq. Feet 96,670 96,670 96,670 96,670 96,670 96,670 96,670 96,670 96,670Enrollment 399 622 1000 705 1059 1078 1069 703 666
High School
Name: J.O. Combs High SchoolYr. Built 2009
Sq. Feet N/A N/A N/A 235,312 235,312 235,312 235,312 235,312 235,312Enrollment N/A N/A N/A 260 542 992 936 1,089 1,240
Source: The District's RecordsNote: Information prior to fiscal year 2005-06 was not available.
20132008 2009
Fiscal Year
2011 20142006 2010 20122007

THIS PAGE BLANK