comprehensive annual financial ... - sedona fire district · according to sedona chamber of...
TRANSCRIPT

Sedona Fire District 2860 Southwest Drive, Sedona, Arizona, 86336
Sedona Fire District
2860 Southwest Drive
Sedona, AZ 86336
Sedona Fire District COMPREHENSIVE ANNUAL FINANCIAL REPORT
Fiscal Year Ended June 30, 2019

Sedona Fire District 2860 Southwest Drive, Sedona, Arizona, 86336
Sedona Fire District 2860 Southwest Drive, Sedona, Arizona, 86336
SEDONA FIRE DISTRICT
Comprehensive Annual Financial Report
Fiscal Year Ended June 30, 2019 Prepared by:
The James Vincent Group

Sedona Fire District 2860 Southwest Drive, Sedona, Arizona, 86336
Sedona Fire District 2860 Southwest Drive, Sedona, Arizona, 86336
Table of Contents
Page Introductory Section
Letter of Transmittal ............................................................................................................... i-vii
Elected and Appointed Officials ............................................................................................. viii Certificate of Achievement for Excellence in Financial Reporting ........................................... ix
Financial Section
Independent Auditor’s Report ................................................................................................. 1-3
Required Supplementary Information - Management’s Discussion and Analysis ........ 4-10
Basic Financial Statements
Government-wide Financial Statements Statement of Net Position ....................................................................................................... 11
Statement of Activities ...........................................................................................................12
Fund Financial Statements Balance Sheets - Governmental Funds ...................................................................................13
Reconciliation of the Governmental Funds Balance Sheets
to the Government-wide Statement of Net Position ............................................................14
Statements of Revenues, Expenditures, and Changes in Fund Balances - Governmental Funds ................................................................................15
Reconciliation of the Statements of Revenues, Expenditures and Changes in
Fund Balances of Governmental Funds to the Statement of Activities ...............................16
Notes to Financial Statements ........................................................................................... 17-37
Required Supplementary Information Budgetary Comparison Schedule - General Fund ..................................................................38
Notes to Budgetary Comparison Schedule .............................................................................39

Sedona Fire District 2860 Southwest Drive, Sedona, Arizona, 86336
Sedona Fire District 2860 Southwest Drive, Sedona, Arizona, 86336
Schedule of the District’s Proportionate Share of Net Pension Liability – Cost-Sharing Plans ..............................................................................................................40
Schedule of Changes in the District’s Net Pension/OPEB Liability and Related Ratios – Agent Plans ................................................................................. 41-42
Schedule of District Pension/OPEB Contributions ................................................................43
Notes to Plan Schedules ................................................................................................... 44-45 Statistical Section
Statistical Section Schedules .....................................................................................................46
Condensed Summary of Net Position .......................................................................................47
Changes in Net Position ............................................................................................................48
Fund Balances of Governmental Funds ....................................................................................49
Statement of Changes in Fund Balance - Governmental Funds ................................................50
Assessed and Estimated Actual Value of Taxable Property ......................................................51
Property Tax Rates – All Direct Overlapping Governments .....................................................52
Principal Property Tax Payers ...................................................................................................53
Property Tax Levies and Collections .........................................................................................54
Ratios of General Bonded Debt Outstanding ............................................................................55
Direct and Overlapping Government Activities Debt ...............................................................56
Legal Debt Margin Information ................................................................................................57
Demographic and Economic Statistics ......................................................................................58
Principal Employers ..................................................................................................................59
Operating Indicators by Function ..............................................................................................60
Full-Time Equivalent Employees by Function ..........................................................................61
Capital Asset Statistics by Function ..........................................................................................62

Sedona Fire District 2860 Southwest Drive, Sedona, Arizona, 86336
Sedona Fire District 2860 Southwest Drive, Sedona, Arizona, 86336
Introductory Section

Sedona Fire District 2860 Southwest Drive, Sedona, Arizona, 86336
Sedona Fire District i 2860 Southwest Drive, Sedona, Arizona, 86336
January 9, 2020 To the Honorable Members of the Board and Citizens of Sedona Fire District: The following is the Comprehensive Annual Financial Report (CAFR) of Sedona Fire District (SFD) for the fiscal year ending June 30, 2019. The Government of Finance Officers Association (GFOA) established the Certificate of Achievement for Excellence in Financial Reporting Program (CAFR Program) to encourage local governments to go beyond the minimum reporting requirements of generally accepted accounting principles. In this endeavor GFOA recognizes the agencies that prepare comprehensive annual financial reports that evidence the spirit of transparency and full disclosure. These goals are perfectly aligned with the goals of Sedona Fire District. Arizona Revised Statutes §48-253 and 48-805(9) require that all special districts with annual budgets in excess of $1,000,000 publish within 240 days of the close of their fiscal year a complete set of financial statements presented in conformance with generally accepted accounting principles (GAAP) and audited in accordance with generally accepted auditing standards by a firm of licensed certified public accountants. This report is published to fulfill that requirement for the fiscal year ended June 30, 2019. This CAFR report is intended to meet and exceed all legal reporting requirements that are borne by this jurisdiction. Management assumes full responsibility for the completeness and reliability of the information contained in this report, based upon a comprehensive framework of internal control established for this purpose. Because the cost of internal control should not exceed anticipated benefits, the objective is to provide reasonable, rather than absolute, assurance that the financial statements are free of material misstatements. As management, we assert that, to the best of our knowledge and belief, this financial report is complete and reliable in all material respects. Walker and Armstrong, a certified public accounting firm, has issued an unmodified (“clean”) opinion on the Sedona Fire District (SFD) financial statements for the year ended June 30, 2019. The independent auditor’s report is located at the front of the financial section of this report. Management’s discussion and analysis (MD&A) immediately follows the independent auditor’s report and provides a narrative introduction, overview, and analysis of the basic financial statements. MD&A complements this letter of transmittal and should be read in conjunction with it.

Sedona Fire District 2860 Southwest Drive, Sedona, Arizona, 86336
Sedona Fire District ii 2860 Southwest Drive, Sedona, Arizona, 86336
District Profile
The Sedona-Oak Creek Volunteer Fire Department was officially created on April 7, 1957 as a volunteer fire company serving Coconino County residents with 14 volunteers, a secretary-treasurer, and one fire truck called the “Turtle”. In October of 1960 the Red Rock Fire District was formed for Yavapai County and a mutual aid agreement provided coverage for all of Sedona. The District received its first ambulance as a donation from the Business and Professional Women’s Club of Sedona (BPW) in March of 1963, creating the Volunteer Firemen’s Rescue Unit which would eventually become the Emergency Medical Services (EMS) Division. Through the years, the District became EMT certified, managed dispatch services for the region, and grew to be the professional organization delivering first class emergency response services it is today. Sedona Fire District provides all hazard emergency services from five fire stations staffed 24/7/365 by seventy-five fulltime firefighters. All suppression personnel are dual trained in structural/wildland firefighting and certified EMTs or Paramedics. The Fire Chief, who is hired by the Board, oversees the district operations with the support of 4 executive leaders and 17 support staff that report directly to the Chief. Recognized by the State of Arizona as a special taxing district, Sedona Fire District operates under Arizona Revised Statutes (ARS) Title 48, Chapter 5. The District is a community service organization funded through limited assessed value property taxes. It is governed by a five-member non-partisan Board elected at large and who serve staggered four-year terms. The Board is comprised of a Board Chair and four Board Members, including a Board Clerk. The Board establishes policy, sets tax rates, and approves the annual budget which serves as the foundation for financial planning and control. The budget is prepared by fund, function, and object but is approved at the fund level. The Board hires, and has authority over, a Fire Chief who is charged with managing day-to-day operations of the District.

Sedona Fire District 2860 Southwest Drive, Sedona, Arizona, 86336
Sedona Fire District iii 2860 Southwest Drive, Sedona, Arizona, 86336
A current organization chart follows:
SFD maintains cooperative agreements with area partners to provide a higher level of service for the community and has developed alternative revenue sources including ambulance transportation, ambulance billing, cell tower rental, and wildland fire response that have reduced the burden on the primary revenue source (property taxes) and has helped provide this higher level of service. The District will respond to any emergency situation that threatens life, safety, or property. The fire district, through a regional communication center, will dispatch the closest available unit(s) with appropriate capabilities to control the emergency or provide the service. Timely response and effective management of medical, rescue, and fire control situations represent the most immediate priorities of the fire district.
Sedona Fire District 2860 Southwest Drive, Sedona, Arizona, 86336
Sedona Fire District iv 2860 Southwest Drive, Sedona, Arizona, 86336
SFD also responds to various non-emergency situations that are not routinely handled by other agencies or providers. SFD community risk reduction specialist conducts wellness checks, home safety surveys, medication reconciliation, and assists community members with managing healthcare resources. SFD community risk reduction strategies are based on the premise that we can proactively attempt to safely and effectively address our customer’s needs and meet the goals of our mission before someone must access the 911 system.
About the Area
The Sedona Fire District provides emergency services for an area spanning 274 square miles (168 fire and 274 medical), covering the City of Sedona (which is 19 square miles), the Village of Oak Creek, Oak Creek Canyon and multiple additional areas within the region. Located within Yavapai and Coconino County, the City of Sedona is one of the state’s most visited areas. As a popular place to both live and visit, the District has grown to serve an estimated 19,000 full time residents, and approximately 3 million tourists per year. The tourism industry is vital to the health of Sedona’s economy. According to industry reports, tourism in Sedona generates $600.0 million in economic activity each year. The median age of the area’s population is 58.3 and the majority of residents live in Yavapai County. SFD provides fire suppression/prevention, emergency medical services (EMS), wildland firefighting, special rescue operations, and public educational programs (courses in CPR, first aid, etc.). In order to provide these services and respond during emergencies, the District utilizes five strategically placed fire stations with 24/7 firefighters, EMS, and support personnel. Each year, the District answers roughly 4,500 calls.

Sedona Fire District 2860 Southwest Drive, Sedona, Arizona, 86336
Sedona Fire District v 2860 Southwest Drive, Sedona, Arizona, 86336
A snapshot of SFD demographics and service levels includes: District Size 168 square miles
Ambulance Transport Service Area 274 square miles Full-time Resident Population 19,000 Part-time, Seasonal Population 3,000,000 annually
Stations 5 Fire and Rescue Service Staffing 75
Administrative and Support 21
Budget Overview
The District budgets in accordance with the requirements of state law. The general fund is budgeted on the modified accrual basis of accounting.
Sedona Fire District 2860 Southwest Drive, Sedona, Arizona, 86336
Sedona Fire District vi 2860 Southwest Drive, Sedona, Arizona, 86336
The Board adopts the general fund budget prior to July 1st, the beginning of the fiscal year of the District. Throughout the budget process the Board reviews the budgeted expenses at the fund, function, and object level. Although the Board reviews the budget at the fund, function, and object level, the budget is approved at the fund level and sets the level by which actual expenditures should not exceed budgeted expenditures. The legal level of budgetary control is at the fund level. The Board only approves a general fund budget and is not required to adopt a formal budget for the Capital fund. However, transfers between funds require Board authorization. Budgeted expenditures lapse at year-end and may not be carried over to subsequent years. Local Economy and Outlook
Tourism and recreation are major contributors to the local economy which continues to grow according to Sedona Chamber of Commerce reports. In fact, much of the commercial activity in the area can be directly tied to the tourism industry, and based on tourism activity reports for the region, about two-thirds of the City of Sedona’s sales tax revenues are generated by visitors. This is consistent throughout the region. The demand for goods and services related to tourism results in the construction of and demand for commercial buildings (retail, office, hotels, etc.). This same tourism activity influences residential property demand and values. This economic activity is taxed and then covers the cost of local needs, including basic government and fire district resources. District management and staff are working proactively and cooperatively with other agencies, surrounding fire districts, and regional planning groups to ensure continued ability to serve the ever-changing population it serves. Long-term financial planning and major initiatives
Leadership is continually assessing the long-term financial sustainability of the District through analysis of current and projected revenues and expenses. The projections are tailored to examine the District’s ability to absorb operating costs due to changes in the economy, service demands, and capital improvements. When projecting revenue, the District analyzes past performance, state trends, and economic models. Expenditure projections include inflators based on local and industry wide historical trends as well as district specific trends. Long term financial sustainability is a critical aspect to the District’s planning and helps to ensure the District will continue to provide the highest level of service to the community it serves. The District has developed a comprehensive ten-year capital improvement plan. The capital improvement plan will sustain and enhance emergency response infrastructure by maintaining and replacing aging facilities and capital assets. This capital improvement plan forecasts the life

Sedona Fire District 2860 Southwest Drive, Sedona, Arizona, 86336
Sedona Fire District vii 2860 Southwest Drive, Sedona, Arizona, 86336
expectancy and replacement and/or maintenance costs for each of the District’s long-term assets, as well as define the funding levels needed over each of the ten years.
Relevant Financial Policies
SFD has adopted a comprehensive set of financial policies. The policies are continually evaluated for their effectiveness and how they keep the Governing Board and staff focused on increased internal controls, reporting, and long-term sustainability. The policies implemented have been effective in protecting the District and its focus on maintaining service levels while also providing long term sustainability and success.
Awards and Acknowledgements
Government Finance Officers Association of the United States and Canada (GFOA) awarded a Certificate of Achievement for Excellence in Financial Reporting to Sedona Fire District for its comprehensive annual financial report for the fiscal year ended June 30, 2018. This was the first year that Sedona Fire District has achieved this prestigious award. To be awarded a Certificate of Achievement, a government must publish easily readable and efficiently organized comprehensive annual financial report. This report must satisfy both generally accepted accounting principles and applicable legal requirements. A Certificate of Achievement is valid for a period of one year. We believe that our current comprehensive annual financial report continues to meet the Certificate of Achievement Program’s requirements and we are submitting it to GFOA to determine its eligibility for another certificate. We would like to express our sincere gratitude to the personnel of the finance department who assisted and contributed to the preparation of this report. Appreciation is also extended to Members of the Board, the managers, employees, and citizens of the District whose continued support is vital to the financial health of Sedona Fire District.
Respectfully submitted,
Jon Trautwein The James Vincent Group Fire Chief Finance Director

Sedona Fire District 2860 Southwest Drive, Sedona, Arizona, 86336
Sedona Fire District viii 2860 Southwest Drive, Sedona, Arizona, 86336
Sedona Fire District List of Elected and Appointed Officials June 30, 2019
Elected Board Members
Term Expires
Board Chair Dave Soto December 31 2020
Board Clerk Corrie Cooperman December 31 2020
Board Member Eugene McCarthy December 31 2022
Board Member Al Comello December 31 2022
Board Member Joy Michelle Moore December 31 2022
Regular meetings of the Fire District’s Governing Board are held on the third Tuesday of every
month at Sedona Fire Station #1 located at 2860 Southwest Drive, Sedona, Arizona at 4:30pm.
Notices and Agendas of such meetings are posted at Sedona Fire Station #1 located at 2860
Southwest Drive, Sedona, Arizona and www.sedonafire.org .
Administrative Offices
2860 Southwest Drive, Sedona, Arizona, 86336
Fire Chief/Administrator
Chief Jon Trautwein
Finance Director
The James Vincent Group
Legal Counsel
Boyle, Pecharich, Cline, Whittington & Stallings, P.L.L.C.

ix

Sedona Fire District 2860 Southwest Drive, Sedona, Arizona, 86336
Financial Section

Sedona Fire District 2860 Southwest Drive, Sedona, Arizona, 86336
Independent Auditors’ Report on Financial Statements

Walker & Armstrong LLP • 3838 N. Central Ave., Suite 1700 • Phoenix, Arizona 85012 • 602.230.1040
www.wa-cpas.com
1
Independent Auditor’s Report Board of Directors Sedona Fire District Sedona, Arizona We have audited the accompanying financial statements of the governmental activities, each major fund, and the aggregate remaining fund information of Sedona Fire District (the District), as of and for the year ended June 30, 2019, and the related notes to the financial statements, which collectively comprise the District’s basic financial statements as listed in the table of contents.
Management’s Responsibility for the Financial Statements
Management is responsible for the preparation and fair presentation of these financial statements in accordance with accounting principles generally accepted in the United States of America; this includes the design, implementation, and maintenance of internal control relevant to the preparation and fair presentation of financial statements that are free from material misstatement, whether due to fraud or error.
Auditor’s Responsibility
Our responsibility is to express opinions on these financial statements based on our audit. We conducted our audit in accordance with auditing standards generally accepted in the United States of America and the standards applicable to financial audits contained in Government Auditing Standards, issued by the Comptroller General of the United States. Those standards require that we plan and perform the audit to obtain reasonable assurance about whether the financial statements are free from material misstatement.
An audit involves performing procedures to obtain audit evidence about the amounts and disclosures in the financial statements. The procedures selected depend on the auditor’s judgment, including the assessment of the risks of material misstatement of the financial statements, whether due to fraud or error. In making those risk assessments, the auditor considers internal control relevant to the entity’s preparation and fair presentation of the financial statements in order to design audit procedures that are appropriate in the circumstances, but not for the purpose of expressing an opinion on the effectiveness of the entity’s internal control. Accordingly, we express no such opinion. An audit also includes evaluating the appropriateness of accounting policies used and the reasonableness of significant accounting estimates made by management, as well as evaluating the overall presentation of the financial statements.
We believe that the audit evidence we have obtained is sufficient and appropriate to provide a basis for our audit opinions.

2
Opinions
In our opinion, the financial statements referred to above present fairly, in all material respects, the respective financial position of the governmental activities, each major fund, and the aggregate remaining fund information of the District as of June 30, 2019, and the respective changes in financial position for the year then ended in accordance with accounting principles generally accepted in the United States of America.
Other Matters
Required Supplementary Information
Accounting principles generally accepted in the United States of America require that the management’s discussion and analysis on pages 4 through 10, the budgetary comparison information on pages 38 through 39, the schedule of the District’s proportionate share of net pension liability – cost-sharing plans on page 40, the schedule of changes in the District’s net pension/OPEB liability and related ratios – agent plans on pages 41-42, the schedule of District pension/OPEB contributions on page 43 and the notes to pension/OPEB plan schedules on pages 44-45, be presented to supplement the basic financial statements. Such information, although not a part of the basic financial statements, is required by the Governmental Accounting Standards Board, who considers it to be an essential part of financial reporting for placing the basic financial statements in an appropriate operational, economic, or historical context. We have applied certain limited procedures to the required supplementary information in accordance with auditing standards generally accepted in the United States of America, which consisted of inquiries of management about the methods of preparing the information and comparing the information for consistency with management’s responses to our inquiries, the basic financial statements, and other knowledge we obtained during our audit of the basic financial statements. We do not express an opinion or provide any assurance on the information because the limited procedures do not provide us with sufficient evidence to express an opinion or provide any assurance.
Other Information
Our audit was conducted for the purpose of forming opinions on the financial statements that collectively comprise the District’s basic financial statements. The introductory and the statistical sections are presented for purposes of additional analysis and are not a required part of the basic financial statements.
The introductory and statistical sections have not been subjected to the auditing procedures applied in the audit of the basic financial statements and, accordingly, we do not express an opinion or provide any assurance on them.

3
Other Reporting Required by Government Auditing Standards
In accordance with Government Auditing Standards, we have also issued our report dated January 9, 2020, on our consideration of the District’s internal control over financial reporting and on our tests of its compliance with certain provisions of laws, regulations, contracts, and grant agreements and other matters. The purpose of that report is solely to describe the scope of our testing of internal control over financial reporting and compliance and the results of that testing, and not to provide an opinion on the effectiveness of the District’s internal control over financial reporting or on compliance. That report is an integral part of an audit performed in accordance with Government Auditing Standards in considering the District’s internal control over financial reporting and compliance.
Phoenix, Arizona January 9, 2020

Sedona Fire District 2860 Southwest Drive, Sedona, Arizona, 86336
MANAGEMENT’S DISCUSSION AND ANALYSIS

Sedona Fire District Management’s Discussion and Analysis
Year Ended June 30, 2019 ______________________________________________________________________________
4
As management of Sedona Fire District (the “District”), we offer readers of the District’s financial statements this narrative overview and analysis of the financial activities of the District for the fiscal year ended June 30, 2019. We encourage readers to consider the information presented here in conjunction with District’s financial statements, which begin on page 11. Financial Highlights The assets and deferred outflows of resources of the District exceeded its liabilities and
deferred inflows of resources at the close of the most recent fiscal year by $1,576,720. Of this amount, $10,274,303 is invested in capital assets, net of related debt, resulting in a deficit net position of $8,697,583. The deficit is largely attributable to reporting the cumulative net pension/OPEB liability.
During the year, the District’s total net position increased by $18,063.
As of the close of the current fiscal year, the District’s governmental funds reported combined ending fund balances of $8,979,819, an increase of $2,090,323 from the prior year.
At the end of the current fiscal year, unassigned fund balance for the general fund was $2,000,000 or 11.6 percent of the 2019 fiscal year's total budgeted operating expenditures.
Overview of the Financial Statements This discussion and analysis is intended to serve as an introduction to the District’s basic financial statements which are comprised of three components: (1) government-wide financial statements, (2) fund financial statements and (3) notes to the financial statements. This report also contains required supplementary information in addition to the basic financial statements themselves. Government-wide Financial Statements The government-wide financial statements are designed to provide readers with a broad overview of the District’s finances, in a manner similar to a private-sector business. The statement of net position presents information on all of the District’s assets and liabilities, with the difference between the two reported as net position. Over time, increases or decreases in net position may serve as a useful indicator of whether the financial position of the District is improving or deteriorating. The statement of activities presents information showing how the government’s net position changed during the most recent fiscal year. All changes in net position are reported as soon as the underlying event giving rise to the change occurs, regardless of the timing of related cash flows. Thus, revenues and expenses are reported in this statement for some items that will only result in cash flows in future fiscal periods (e.g., uncollected taxes, uncollected non-district fire revenues, earned but unused vacation leave).

Management’s Discussion and Analysis – Continued
______________________________________________________________________________
5
Government-wide Financial Statements - Continued The government–wide financial statements can be found on pages 11-12 of this report. Fund Financial Statements A fund is a grouping of related accounts that is used to maintain control over resources that have been segregated for specific activities or objectives. The District, like other state and local governments, uses fund accounting to ensure and demonstrate compliance with finance-related legal requirements. Governmental Funds Governmental funds are used to account for essentially the same functions reported as governmental activities in the government-wide financial statements. However, unlike the government-wide financial statements, governmental fund financial statements focus on near-term inflows and outflows of spendable resources, as well as on balances of spendable resources available at the end of the fiscal year. Such information may be useful in evaluating a government’s near-term financing requirements. Because the focus of governmental funds is narrower than that of the government-wide financial statements, it is useful to compare the information presented for governmental funds with similar information presented for governmental activities in the government-wide financial statements. By doing so, readers may better understand the long-term impact of the government’s near-term financing decisions. Both the governmental fund balance sheets and the governmental fund statements of revenues, expenditures and changes in fund balances provide a reconciliation to facilitate this comparison between governmental funds and governmental activities. The District maintains three (3) individual governmental funds. Information is presented separately in the governmental fund balance sheets and in the governmental fund statements of revenues, expenditures, and changes in fund balances for the general fund, capital projects fund and special projects fund, which are considered to be major funds. The District adopts an annual appropriated budget for its general fund. Budgetary comparison statements have been provided for this fund to demonstrate compliance with the budget. The basic governmental fund financial statements can be found on pages 13-16 of this report. Notes to Basic Financial Statements The notes provide additional information that is essential to a full understanding of the data provided in the government-wide and fund financial statements. The notes to the financial statements can be found on pages 17-37 of this report.

Management’s Discussion and Analysis – Continued
______________________________________________________________________________
6
Government-wide Financial Statements - Continued Other Information A budgetary comparison schedule for the general fund is presented immediately following the notes to the financial statements. This schedule and notes can be found on pages 38 and 39 of this report. In addition, funding information related to the District’s participation in retirement plans can be found on pages 40 through 45 of this report. Government-wide Financial Analysis As noted previously, net position may serve over time as a useful indicator of a government’s financial position. In the case of Sedona Fire District, assets and deferred outflows of resources exceeded liabilities and deferred inflows of resources by $1,576,720 at the close of the most recent fiscal year. The largest portion of the District’s net position reflects its investment in capital assets (e.g., land and improvements, buildings and improvements, furniture, vehicles, and equipment); less any related debt still outstanding used to acquire those assets. The District uses these capital assets to provide services to citizens; consequently, these assets are not available for future spending. Although the District’s investment in its capital assets is reported net of related debt, it should be noted that the resources needed to repay this debt must be provided from other sources since the capital assets themselves cannot be used to liquidate these liabilities. After consideration of the net investment in capital assets, there is a remaining deficit in net position of $8,697,583, which is a decrease from the prior year of $344,907. The following page contains a comparative analysis between the current and the prior fiscal year for the government-wide statements.

Management’s Discussion and Analysis – Continued
______________________________________________________________________________
7
Government-wide Financial Analysis – Continued
Condensed Statement of Net Position
Governmental Activities
2019 2018 Assets: Current and other assets $ 9,986,696 $ 7,901,916 Capital assets 11,310,829 11,963,867 Total assets 21,297,525 19,865,783
Deferred outflows of resources related to pensions/OPEB:
7,948,463
9,080,650
Liabilities: Current and other liabilities 785,766 762,754 Long-term liabilities 25,729,407 26,180,441 Total liabilities 26,515,173 26,943,195
Deferred inflows of resources related to pensions/OPEB:
1,154,095
444,581
Net position: Net investment in capital assets 10,274,303 10,601,147 Deficit ( 8,697,583) ( 9,042,490) Total net position $ 1,576,720 $ 1,558,657
During 2019, current assets increased by $2,084,780 primarily due to an increase in cash and investments of $2,179,944 offset by a decrease in accounts receivable of $36,018 and a decrease in prepaid items of $41,156. Capital assets decreased by $653,038 primarily due to capital outlay of $213,285 offset by depreciation expense of $866,323. At June 30, 2019 and 2018, the District’s unrestricted net deficit is $8,697,583 and $9,042,490 respectively.
Governmental Activities
Governmental activities net position increased by $18,063. Key elements of this increase are reported on the following page.

Management’s Discussion and Analysis – Continued
______________________________________________________________________________
8
Government-wide Financial Analysis – Continued
Condensed Statement of Activities
Governmental Activities
2019 2018
Revenues: Program revenue: Charges for services $ 3,251,501 $ 3,366,345
General revenues: Property taxes 14,165,985 13,693,634 Fire district assistance tax 364,331 335,932 Investment earnings 108,453 62,066 Other 115,248 117,912 Total revenues 18,005,518 17,575,889
Expenses: Public safety – fire protection/ emergency medical services (EMS) 17,987,455 17,407,355 Total expenses 17,987,455 17,407,355
Increase in net position 18,063 168,534
Net position, beginning of year 1,558,657 1,390,123
Net position, ending of year $ 1,576,720 $ 1,558,657
Overall revenues increased by $429,629 and expenses increased by $580,100. Property tax revenue increased by $472,351 due to a levy increase from 2.5418 for the year ended June 30, 2018 to 2.5454 for the year ended June 30, 2019.
Expenses increased by $580,100 primarily due to an increase in salary and wages of $599,664, an increase in employee benefits of $257,002 and an increase in training and related expenses of $168,185, offset by a decrease in materials and supplies of $189,727, a decrease in professional services of $227,895, and a decrease in other expenses of $96,500.
Financial Analysis of the Governmental Funds
As noted previously, the District uses fund accounting to ensure and demonstrate compliance with finance-related legal requirements.
The focus of the District’s governmental funds is to provide information on near-term inflows, outflows, and balances of spendable resources. Such information is useful in assessing the District’s financing requirements. In particular, unassigned fund balance may serve as a useful measure of a government’s net resources available for spending at the end of the fiscal year.

Management’s Discussion and Analysis – Continued
______________________________________________________________________________
9
Financial Analysis of the Governmental Funds - Continued
At the end of the current fiscal year, the District’s governmental funds reported combined ending fund balances of $8,979,819, an increase of $2,090,323 in comparison with the prior year’s increase of $1,158,400.
Overall revenues increased by $526,314. Property taxes increased by $437,418 and ambulance fees increased by $156,456 which was offset by a decrease in non-district fire revenues of $214,604. Overall expenditures decreased by $347,439 which was caused primarily by a decrease in salaries and wages of $102,654, a decrease in materials and supplies of $189,727, a decrease in professional services of $214,192, and a decrease in capital outlay of $327,588. The decreased amounts were offset by increases in employee benefits of $373,930 and an increase of training and related expenses of $168,185. In addition, during fiscal year 2019, there were proceeds from capital leases totaling $58,170 while in 2018.
Of the total combined governmental fund balance of $8,979,819, the amount committed by the Board totaled $6,881,201. The remaining amount is comprised of nonspendable fund balance totaling $98,618 and unassigned fund balance of $2,000,000, which is available for future spending.
The general fund is the chief operating fund of the District. At the end of the current fiscal year, spendable fund balance of the general fund was $8,547,845. As a measure of the general fund’s liquidity, it may be useful to compare spendable fund balance to total fund balance. Spendable fund balance represents 98.9% of total general fund balance of $8,646,463. The capital projects fund accounts for the accumulation of financial resources allocated for the acquisition or construction of significant capital assets. As of June 30, 2019, the ending fund balance in the capital projects fund was $333,356. The District's Governing Board has determined that cash and investments available in the general fund as of the fiscal year ended June 30, 2019, net of encumbrances, totaling $6.5 million could be transferred into the capital projects fund and committed to future capital development. This transfer is contingent on the cash receipts from property tax revenues in the first half of the next fiscal year. The special projects fund is a special revenue fund established for the collection and disbursement of funds for specified programs such as wildland firefighting. These funds are contributed by state organizations as reimbursement of expenditures. As of June 30, 2019, the ending fund balance in the special revenue fund was transferred to the general fund, and the fund will be dissolved in future years. Budgetary Highlights During the 2019 fiscal year, there were no modifications to the originally adopted budget. Total revenues were $1,189,318 greater than budgeted revenues while total expenditures were $1,324,506 less than budgeted expenditures. The positive expenditure variance resulted primarily from unspent reserves and less telecommunication expenditures than budgeted.

Management’s Discussion and Analysis – Continued
______________________________________________________________________________
10
Capital Asset and Debt Administration Capital assets – The District’s capital assets as of June 30, 2019, total $11,310,829 (net of accumulated depreciation). These capital assets include land, improvements other than buildings, buildings and improvements, furniture and equipment and vehicles. Outlays for capital assets during 2019 were $213,285 which consisted primarily of vehicles and furniture and equipment. Additional information on the District’s capital assets can be found in Note 5 to the financial statements on page 23. Long-term liabilities – At the end of the current fiscal year, the District had total long-term liabilities of $25,729,407 which was comprised of the net pension/OPEB liability of $23,172,183, various capital lease obligations totaling $1,036,527 and compensated absences payable of $1,520,697. Additional information on the District’s long-term debt can be found in Notes 6 and 7 to the financial statements on page 24. Economic Factors and Next Year’s Budgets and Rates The District expects assessed values to increase by over 3.72 percent during 2020 while the mill rate levy will decrease from 2.5454 in 2019 to 2.4531 during 2020 to cover budget expenditures of $17,290,812. Requests for Information This financial report is designed to provide a general overview of the District’s finances for all those with an interest. Questions concerning any of the information provided in this report or requests for additional financial information should be addressed to Sedona Fire District, Finance Division, 2860 Southwest Drive, Sedona, AZ 86336.

GovernmentalActivities
AssetsCash and investments 8,931,281$ Receivables:
Property taxes 197,925 Ambulance billings 583,127 Accounts 36,888 Intergovernmental 138,857
Prepaid items 98,618 Capital assets, not being depreciated 2,134,768 Capital assets, being depreciated, net 9,176,061
Total assets 21,297,525
Deferred outflows of resourcesDeferred outflows related to pensions/OPEB 7,948,463
Total deferred outflows of resources 7,948,463
LiabilitiesAccounts payable 116,307 Accrued payroll and related 669,459 Noncurrent liabilities:
Due within one year 438,760 Due in more than one year 25,290,647
Total liabilities 26,515,173
Deferred inflows of resourcesDeferred inflows related to pensions/OPEB 1,154,095
Total deferred inflows of resources 1,154,095
Net positionNet investment in capital assets 10,274,303 Deficit (8,697,583)
Total net position 1,576,720$
Sedona Fire DistrictStatement of Net Position
June 30, 2019
The accompanying notes are an integral part of these basic financial statements.
11

GovernmentalActivities
Program expenses:Public safety-fire protection and
emergency medical services:Salaries and wages 8,223,034$ Employee benefits 6,734,347 Depreciation 866,323 Materials and supplies 434,680 Dispatch fees 287,762 Professional services 272,106 Utilities and communications 251,163 Repairs and maintenance 362,420 Training and related 385,408 Insurance 112,891 Other 17,873 Interest 39,448
Total program expenses 17,987,455
Program revenues:Charges for services 3,251,501
Total program revenues 3,251,501
Net program expense 14,735,954
General revenues:Taxes:
Real and personal property taxes 14,165,985 Fire district assistance tax 364,331
Investment earnings 108,453 Other 115,248
Total general revenues 14,754,017
Change in net position 18,063
Net position, July 1, 2018 1,558,657
Net position, June 30, 2019 1,576,720$
Sedona Fire DistrictStatement of Activities
Year Ended June 30, 2019
The accompanying notes are anintegral part of these basic financial statements.
12

TotalCapital Special Governmental
General Projects Projects FundsAssets:
Cash and investments 8,560,881$ 370,400$ -$ 8,931,281$ Receivables (net of allowance
for uncollectibles):Property taxes 197,925 - - 197,925 Ambulance billings 583,127 - - 583,127 Accounts 36,888 - - 36,888 Intergovernmental 138,857 - - 138,857
Due from other funds 37,044 - - 37,044 Prepaid items 98,618 - - 98,618
Total assets 9,653,340$ 370,400$ -$ 10,023,740$
Liabilities:Accounts payable 116,307$ -$ -$ 116,307$ Due to other funds - 37,044 - 37,044 Accrued payroll and related 669,459 - - 669,459
Total liabilities 785,766 37,044 - 822,810
Deferred inflows of resources:Unavailable revenues 221,111 - - 221,111
Total deferred inflows of resources 221,111 - - 221,111
Fund balances:Nonspendable - prepaid items 98,618 - - 98,618 Committed 6,547,845 333,356 - 6,881,201 Unassigned 2,000,000 - - 2,000,000
Total fund balances 8,646,463 333,356 - 8,979,819
Total liabilities, deferred inflows of resources and fund balances 9,653,340$ 370,400$ -$ 10,023,740$
Major Funds
Sedona Fire DistrictBalance Sheets -
Governmental FundsJune 30, 2019
The accompanying notes are an integral part of these basic financial statements.
13

Total fund balances 8,979,819$
Amounts reported for governmental activities in the statement of net position are different because:
Capital assets used in governmental activities are not financialresources and, therefore, are not reported in the funds
Capital assets 23,055,387$ Less: accumulated depreciation (11,744,558) 11,310,829
Some receivables are not available to pay for current-period expenditures and, therefore, are reported as unearned revenue in the funds 221,111
Long-term liabilities are not due and payable in the current periodand, therefore, are not reported as a liability in the funds (25,729,407)
Deferred outflows and inflows of resources related to pensions/OPEBare applicable to future reporting periods and, therefore, are notreported in the funds 6,794,368
Net position of governmental activities 1,576,720$
Sedona Fire DistrictReconciliation of the Governmental Funds Balance Sheets
to the Government-wide Statement of Net PositionJune 30, 2019
The accompanying notes are an integral part of these basic financial statements.
14
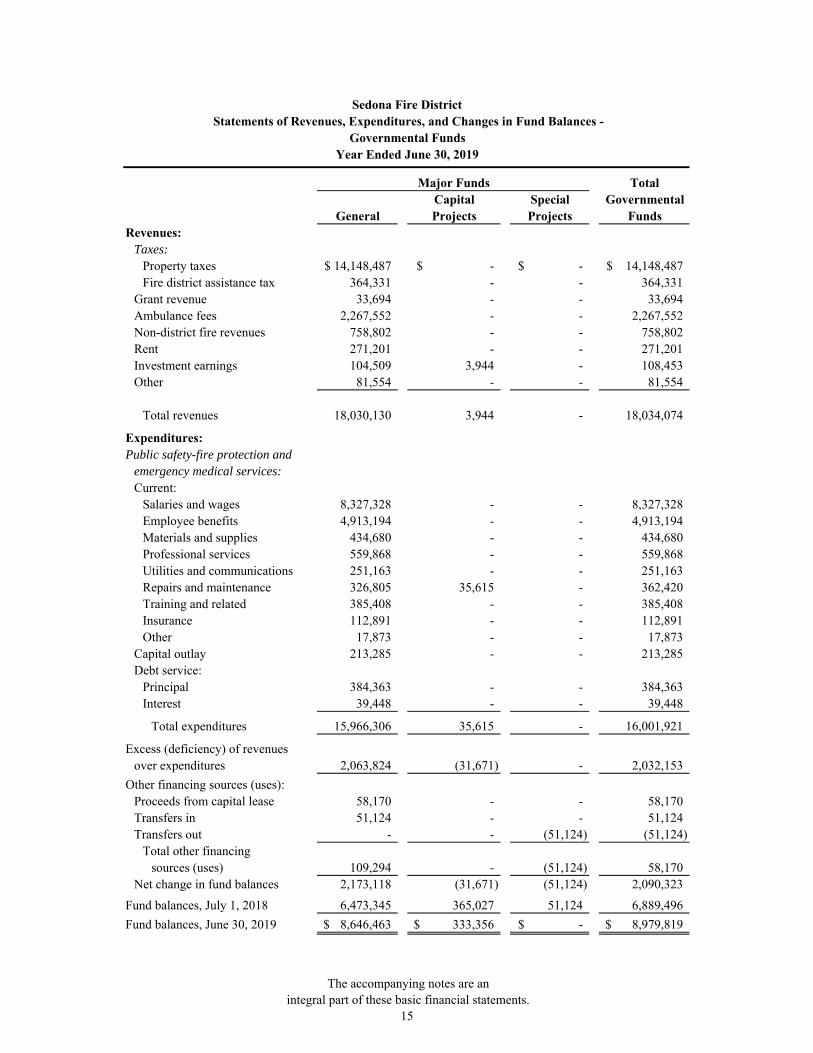
TotalCapital Special Governmental
General Projects Projects FundsRevenues:
Taxes:Property taxes 14,148,487$ -$ -$ 14,148,487$ Fire district assistance tax 364,331 - - 364,331
Grant revenue 33,694 - - 33,694 Ambulance fees 2,267,552 - - 2,267,552 Non-district fire revenues 758,802 - - 758,802 Rent 271,201 - - 271,201 Investment earnings 104,509 3,944 - 108,453 Other 81,554 - - 81,554
Total revenues 18,030,130 3,944 - 18,034,074
Expenditures:Public safety-fire protection and
emergency medical services:Current:
Salaries and wages 8,327,328 - - 8,327,328 Employee benefits 4,913,194 - - 4,913,194 Materials and supplies 434,680 - - 434,680 Professional services 559,868 - - 559,868 Utilities and communications 251,163 - - 251,163 Repairs and maintenance 326,805 35,615 - 362,420 Training and related 385,408 - - 385,408 Insurance 112,891 - - 112,891 Other 17,873 - - 17,873
Capital outlay 213,285 - - 213,285 Debt service:
Principal 384,363 - - 384,363 Interest 39,448 - - 39,448
Total expenditures 15,966,306 35,615 - 16,001,921
Excess (deficiency) of revenuesover expenditures 2,063,824 (31,671) - 2,032,153
Other financing sources (uses):Proceeds from capital lease 58,170 - - 58,170 Transfers in 51,124 - - 51,124 Transfers out - - (51,124) (51,124)
Total other financing sources (uses) 109,294 - (51,124) 58,170
Net change in fund balances 2,173,118 (31,671) (51,124) 2,090,323
Fund balances, July 1, 2018 6,473,345 365,027 51,124 6,889,496
Fund balances, June 30, 2019 8,646,463$ 333,356$ -$ 8,979,819$
Sedona Fire DistrictStatements of Revenues, Expenditures, and Changes in Fund Balances -
Governmental FundsYear Ended June 30, 2019
Major Funds
The accompanying notes are an integral part of these basic financial statements.
15
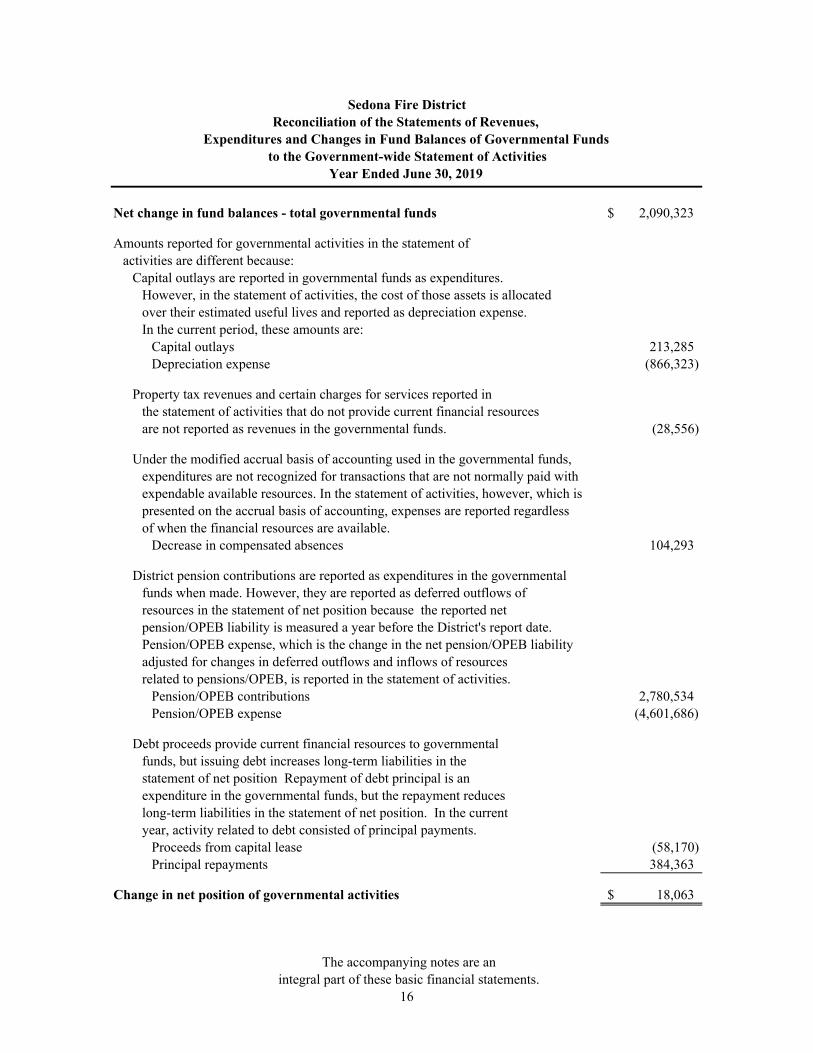
Net change in fund balances - total governmental funds 2,090,323$
Amounts reported for governmental activities in the statement of activities are different because:
Capital outlays are reported in governmental funds as expenditures.However, in the statement of activities, the cost of those assets is allocatedover their estimated useful lives and reported as depreciation expense.In the current period, these amounts are:
Capital outlays 213,285 Depreciation expense (866,323)
Property tax revenues and certain charges for services reported in the statement of activities that do not provide current financial resourcesare not reported as revenues in the governmental funds. (28,556)
Under the modified accrual basis of accounting used in the governmental funds,expenditures are not recognized for transactions that are not normally paid withexpendable available resources. In the statement of activities, however, which ispresented on the accrual basis of accounting, expenses are reported regardlessof when the financial resources are available.
Decrease in compensated absences 104,293
District pension contributions are reported as expenditures in the governmentalfunds when made. However, they are reported as deferred outflows ofresources in the statement of net position because the reported netpension/OPEB liability is measured a year before the District's report date.Pension/OPEB expense, which is the change in the net pension/OPEB liabilityadjusted for changes in deferred outflows and inflows of resourcesrelated to pensions/OPEB, is reported in the statement of activities.
Pension/OPEB contributions 2,780,534 Pension/OPEB expense (4,601,686)
Debt proceeds provide current financial resources to governmentalfunds, but issuing debt increases long-term liabilities in the statement of net position Repayment of debt principal is anexpenditure in the governmental funds, but the repayment reduceslong-term liabilities in the statement of net position. In the currentyear, activity related to debt consisted of principal payments.
Proceeds from capital lease (58,170) Principal repayments 384,363
Change in net position of governmental activities 18,063$
to the Government-wide Statement of ActivitiesYear Ended June 30, 2019
Sedona Fire DistrictReconciliation of the Statements of Revenues,
Expenditures and Changes in Fund Balances of Governmental Funds
The accompanying notes are an integral part of these basic financial statements.
16
Sedona Fire District
Notes to Financial Statements Year Ended June 30, 2019
______________________________________________________________________________
17
Note 1 – Summary of Significant Accounting Policies The accounting policies of Sedona Fire District (the “District”) conform to generally accepted accounting principles applicable to governmental units adopted by the Governmental Accounting Standards Board (GASB).
A. Reporting Entity
The District provides fire protection and emergency medical services to citizens living within the Sedona, Village of Oak Creek and Oak Creek Canyon, Arizona areas. The District is a special-purpose government governed by a separately elected governing body and is legally separate and fiscally independent of other state or local governments. Furthermore, there are no component units combined with the District for financial statement presentation purposes, nor is the District combined with another reporting entity.
B. Basis of Presentation
The basic financial statements include both government-wide and fund financial statements. The government-wide financial statements focus on the District as a whole, while the fund financial statements focus on major funds. Each presentation provides valuable information that can be analyzed and compared between years and between entities to enhance the usefulness of the information.
Government-wide financial statements – These statements include a statement of net position and a statement of activities. These statements report the financial activities of the overall District.
A statement of activities presents a comparison between direct expenses and program revenues for each function of the District’s governmental activities. Direct expenses are those that are specifically associated with a program or function and, therefore, are clearly identifiable to a particular function.
Program revenues include charges to customers for ambulance services provided.
Revenues not classified as program revenues, including internally dedicated resources and all taxes, are reported as general revenue.
Generally, the effect of interfund activity has been eliminated from the government-wide financial statements to minimize the double counting of internal activities. However, charges for interfund services provided and used are not eliminated if the prices approximate their external exchange values.

Notes to Financial Statements – Continued
______________________________________________________________________________
18
Note 1 – Summary of Significant Accounting Policies - Continued
Fund financial statements – provide information about the District’s funds. The emphasis of fund financial statements is on major governmental funds, each displayed in a separate column. All remaining governmental funds are aggregated and reported as nonmajor funds.
The District reports the following major governmental funds:
The general fund is the District’s primary operating fund which accounts for all financial resources except those required to be accounted for in another fund.
The capital projects fund is used to account for activities related to the acquisition or construction of significant capital assets.
The special projects fund is used to account for activities related to wildland firefighting. During the year ended June 30, 2019, management changed the reporting of the wildland firefighting activities. These revenues and expenses are reported in the general fund and the remaining assets were transferred to the general fund.
C. Basis of Accounting
The government-wide financial statements are presented using the economic resources measurement focus and the accrual basis of accounting. Revenues are recorded when earned and expenses are recorded at the time liabilities are incurred, regardless of when the related cash flows take place. Property taxes are recognized as revenue in the year they are levied.
Governmental funds in the fund financial statements are reported using the current financial resources measurement focus and the modified accrual basis of accounting. Under this method, revenues are recognized when measurable and available. The District considers all revenues reported in the governmental funds to be available if the revenues are collected within 60 days after year-end. Expenditures are recorded when the related fund liability is incurred, except for principal and interest on general long-term debt, claims and judgments, and compensated absences, which are recognized as expenditures to the extent they are due and payable.
General capital asset acquisitions are reported as expenditures in governmental funds. Proceeds of general long-term debt and acquisitions under capital lease agreements are reported as other financing sources.
Taxes, leases, and investment income associated with the current fiscal period are all considered to be susceptible to accrual and have been recognized as revenues of the current fiscal period. All other revenue items are considered to be measureable and available only when cash is received by the government.
Fund balance classifications - Fund balances of the governmental funds are reported separately within classifications based on a hierarchy of the constraints placed on the use of those resources. The classifications are based on the relative strength of the constraints that control how the specific amounts can be spent. The classifications are nonspendable, restricted, and unrestricted (which includes committed, assigned, and unassigned fund balance classifications).

Notes to Financial Statements – Continued
______________________________________________________________________________
19
Note 1 – Summary of Significant Accounting Policies - Continued The nonspendable fund balance classification includes amounts that cannot be expended because they are either not in spendable form, such as prepaid items, or are legally or contractually required to be maintained intact. Restricted fund balances are those that have externally imposed restrictions on their usage by creditors, such as through debt covenants, grantors, contributors, or laws and regulations. The unrestricted fund balance category is comprised of committed, assigned, and unassigned resources. Committed fund balances are self-imposed limitations approved by the District’s Board of Directors, which is the highest level of decision-making authority within the District. The constraints placed on committed fund balances can only be removed or changed by the Board of Directors through a formal resolution. Assigned fund balances are resources constrained by the District’s intent to be used for specific purposes, but are neither restricted nor committed. The Board of Directors has authorized the fire chief to make assignments of resources for special purposes. The unassigned fund balance is the residual classification for the general fund and includes all spendable amounts not reported in the other classifications. Deficits in fund balances of the other governmental funds are reported as unassigned. When an expenditure is incurred that can be paid from either restricted or unrestricted fund balances, it is the District’s policy to use restricted fund balance first. For the disbursement of unrestricted fund balances, it is the District’s policy to use committed amounts first, followed by assigned amounts, and lastly unassigned amounts. Cash and investments – Nonparticipating interest-earning investment contracts are stated at cost. Money market investments and participating interest-earning investment contracts with a remaining maturity of one year or less at the time of purchase are stated at amortized cost. All other investments are stated at fair value. Investment earnings are composed of interest and net changes in the fair value of applicable investments. Prepaid items – Prepaid items are accounted for using the purchase method in the governmental fund financial statements. Under this method, expenditures are reported at the time of purchase and unexpended amounts at year-end are reported on the balance sheet as prepaid items for informational purposes only and are offset by a fund balance reserve to indicate that they do not constitute “available spendable resources.” In the government-wide financial statements, prepaid purchases are recorded as assets when the goods or services are purchased and are expensed over the period consumed.
Notes to Financial Statements – Continued
______________________________________________________________________________
20
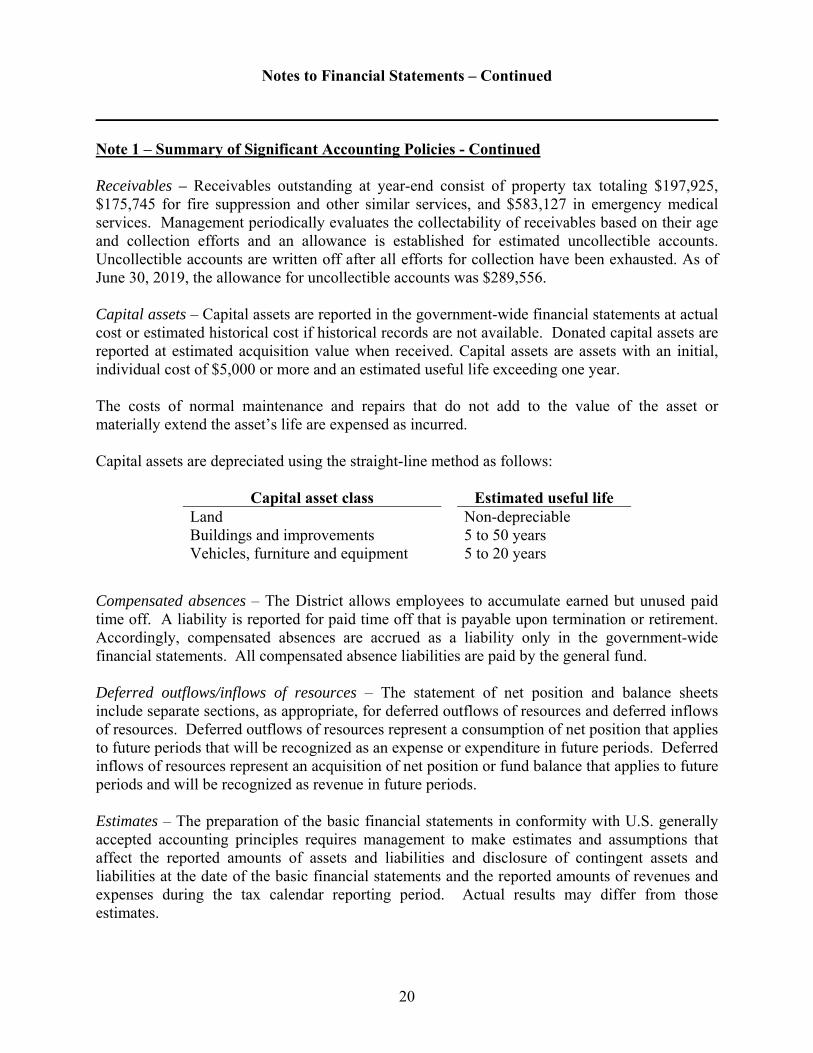
Note 1 – Summary of Significant Accounting Policies - Continued Receivables – Receivables outstanding at year-end consist of property tax totaling $197,925, $175,745 for fire suppression and other similar services, and $583,127 in emergency medical services. Management periodically evaluates the collectability of receivables based on their age and collection efforts and an allowance is established for estimated uncollectible accounts. Uncollectible accounts are written off after all efforts for collection have been exhausted. As of June 30, 2019, the allowance for uncollectible accounts was $289,556. Capital assets – Capital assets are reported in the government-wide financial statements at actual cost or estimated historical cost if historical records are not available. Donated capital assets are reported at estimated acquisition value when received. Capital assets are assets with an initial, individual cost of $5,000 or more and an estimated useful life exceeding one year. The costs of normal maintenance and repairs that do not add to the value of the asset or materially extend the asset’s life are expensed as incurred. Capital assets are depreciated using the straight-line method as follows:
Capital asset class Estimated useful life Land Non-depreciable Buildings and improvements 5 to 50 years Vehicles, furniture and equipment 5 to 20 years
Compensated absences – The District allows employees to accumulate earned but unused paid time off. A liability is reported for paid time off that is payable upon termination or retirement. Accordingly, compensated absences are accrued as a liability only in the government-wide financial statements. All compensated absence liabilities are paid by the general fund. Deferred outflows/inflows of resources – The statement of net position and balance sheets include separate sections, as appropriate, for deferred outflows of resources and deferred inflows of resources. Deferred outflows of resources represent a consumption of net position that applies to future periods that will be recognized as an expense or expenditure in future periods. Deferred inflows of resources represent an acquisition of net position or fund balance that applies to future periods and will be recognized as revenue in future periods. Estimates – The preparation of the basic financial statements in conformity with U.S. generally accepted accounting principles requires management to make estimates and assumptions that affect the reported amounts of assets and liabilities and disclosure of contingent assets and liabilities at the date of the basic financial statements and the reported amounts of revenues and expenses during the tax calendar reporting period. Actual results may differ from those estimates.

Notes to Financial Statements – Continued
______________________________________________________________________________
21
Note 1 – Summary of Significant Accounting Policies - Continued Property tax calendar - The District levies real and personal property taxes on or before the third Monday in August, that become due and payable in two equal installments. The first installment is due on the first day of October and becomes delinquent after the first business day of November. The second installment is due on the first day of March of the next year and becomes delinquent after the first business day of May. A lien against real and personal property assessed attaches on the first day of January preceding assessment and levy thereof. Note 2 – Stabilization Arrangements The District established a reserve by resolution that is maintained in the general fund. The reserved balance is a minimum of $2,000,000. Any changes to the reserve must be approved by the Board of Directors. The reserved fund balance is intended to be used as fiscal stabilization to offset operating revenue shortfalls due to economic downturns, and to serve as operating capital (cash flow) to pay expenses between July 1 and mid-October when first half taxes (primary District revenue source) are received to avoid excessive borrowing and interest on borrowed money in order to pay ongoing expenses. Any fund balance over and above this operational requirement may be used to fund one-time supplemental funding, capital improvement projects or retirement of debt service and may be transferred to the capital projects fund. As of June 30, 2019, the general fund committed fund balance was $6,547,845 which may be transferred to the capital projects fund in fiscal year 2020.
Note 3 – Cash and Investments
Arizona Revised Statutes authorize the District to invest public monies in the State or County Treasurers’ investment pools; interest-bearing savings accounts, certificates of deposit, and repurchase agreements in eligible depositories; bonds or other obligations of the United States government that are guaranteed as to principal and interest by the United States government; and bonds of the state of Arizona counties, cities, towns, school districts, and special districts as specified by statute.
The District utilizes Yavapai County as its repository for cash and allows their pool to invest its funds; accordingly, the District does not have its own formal investment policy with respect to credit risk, custodial credit risk, concentration of credit risk, interest rate risk, or foreign currency risk for investments.
Cash on Hand and Deposits – At June 30, 2019, the carrying amount of the total cash in bank was $990,972 and the bank balance was $487,327 of which all are insured or collateralized.

Notes to Financial Statements – Continued
______________________________________________________________________________
22
Note 3 – Cash and Investments - Continued
Investments – The District’s investments at June 30, 2019 are categorized within the fair value hierarchy established by generally accepted accounting principles. The hierarchy is based on the valuation inputs used to measure the fair value of the asset.
Level 1 inputs are quoted prices in active markets for identical assets Level 2 inputs are significant other observable inputs Level 3 inputs are significant unobservable inputs
The District’s investments at June 30, 2019, were as follows:
Investment Type Amount Yavapai County Treasurer’s investment pool $ 7,881,152 Coconino County Treasurer’s investment pool 59,157
$ 7,940,309
Yavapai and Coconino County Treasurers’ investment pools are not registered with the Securities and Exchange Commission and there is no regulatory oversight of their operations. However, the majority of Yavapai County’s investment pool is invested in the State of Arizona’s local government investment pool which is regulated by the State Board of Investment. The pools’ structure does not provide for shares, and the counties have not provided or obtained any legally binding guarantees to support the value of the participants' investments. Participants in the pool are not required to categorize the value of shares in accordance with the fair value hierarchy.
Credit risk - At June 30, 2019, all of the District's investments were invested in the Yavapai and Coconino County investment pools which are not rated by rating agencies.
Custodial credit risk – For an investment, custodial credit risk is the risk that, in the event of the counterparty’s failure, the District will not be able to recover the value of its investments or collateral securities that are in the possession of an outside party. External investment pools are not exposed to custodial credit risk because their existence is not evidenced by securities that exist in physical or book entry form.
Interest rate risk – At June 30, 2019, the District’s investments can be withdrawn from the pools at will and therefore, are not subject to a significant amount of interest rate risk.
Foreign currency risk – The District does not have a formal investment policy with respect to foreign currency risk because state statutes do not allow for foreign investments.
Notes to Financial Statements – Continued
______________________________________________________________________________
23
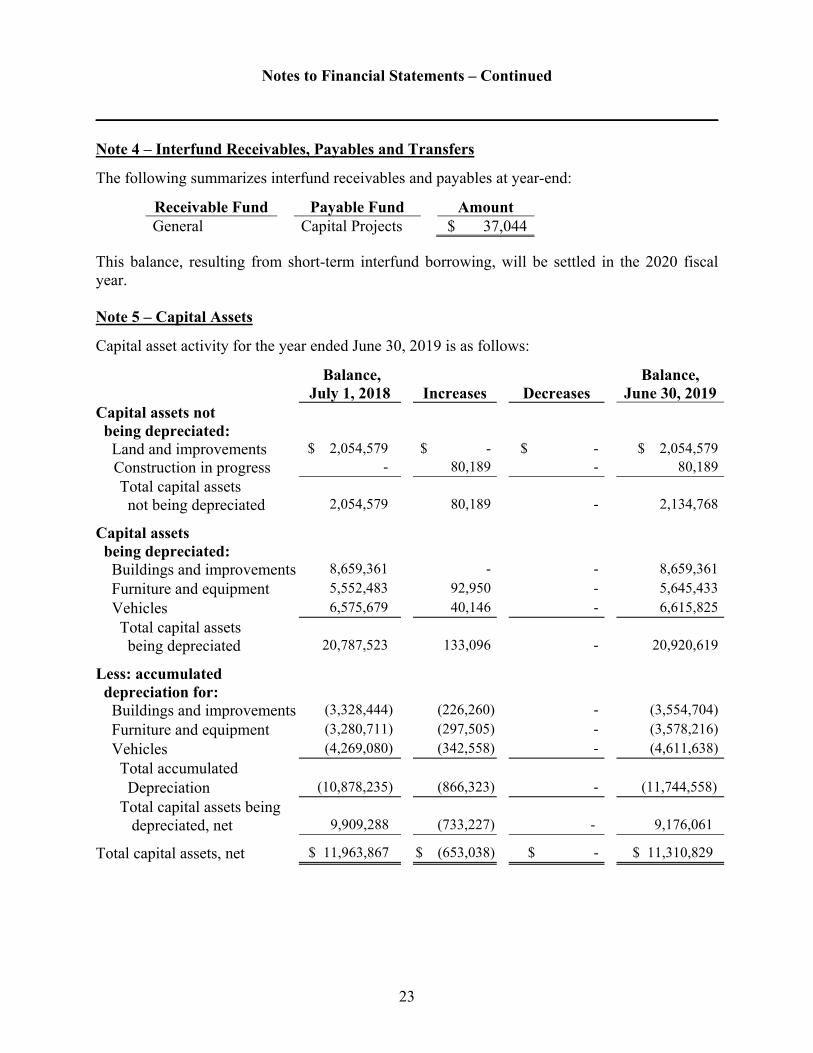
Note 4 – Interfund Receivables, Payables and Transfers
The following summarizes interfund receivables and payables at year-end:
Receivable Fund Payable Fund Amount General Capital Projects $ 37,044
This balance, resulting from short-term interfund borrowing, will be settled in the 2020 fiscal year. Note 5 – Capital Assets
Capital asset activity for the year ended June 30, 2019 is as follows:
Balance, July 1, 2018
Increases
Decreases
Balance, June 30, 2019
Capital assets not being depreciated: Land and improvements $ 2,054,579 $ - $ - $ 2,054,579
Construction in progress - 80,189 - 80,189
Total capital assets not being depreciated 2,054,579 80,189 - 2,134,768
Capital assets being depreciated: Buildings and improvements 8,659,361 - - 8,659,361
Furniture and equipment 5,552,483 92,950 - 5,645,433
Vehicles 6,575,679 40,146 - 6,615,825
Total capital assets being depreciated 20,787,523 133,096 - 20,920,619
Less: accumulated depreciation for: Buildings and improvements (3,328,444) (226,260) - (3,554,704)
Furniture and equipment (3,280,711) (297,505) - (3,578,216)
Vehicles (4,269,080) (342,558) - (4,611,638)
Total accumulated
Depreciation (10,878,235) (866,323) - (11,744,558)
Total capital assets being depreciated, net 9,909,288 (733,227) - 9,176,061
Total capital assets, net $ 11,963,867 $ (653,038) $ - $ 11,310,829

Notes to Financial Statements – Continued
______________________________________________________________________________
24
Note 6 – Changes in Long-Term Liabilities A summary of the changes in long-term liabilities for the year ended June 30, 2019 follows: Balance
July 1, 2018 Additions Reductions Balance
June 30, 2019 Due Within
1 Year
Compensated absences
$ 1,624,990
$ 1,520,697
$ 1,624,990
$ 1,520,697
$ 185,860
Obligations under capital leases
1,362,720
58,170 384,363
1,036,527
252,900
Net pension/OPEB liability 23,192,731 - 20,548 23,172,183 -
Total $ 26,180,441 $ 1,578,867 $ 2,029,901 $ 25,729,407 $ 438,760 Note 7 – Capital Leases The District has acquired a building and equipment under the provisions of various long-term lease agreements with payments maturing over terms ranging from May 2022 to June 2023. The terms of these leases include an annual interest rate of 2.9% and 3.125%, respectively. Amortization of the leases is included in depreciation expense. At June 30, 2019, the assets acquired through capital leases are as follows:
Buildings and improvements $ 2,618,414 Equipment 480,811 Less: accumulated depreciation ( 405,082) Carrying value $ 2,694,143
The future minimum lease payments under these leases, together with the present value of the net minimum lease payments as of June 30, 2019 are as follows:
Year ending June 30,
2020 $ 279,683 2021 279,683 2022 277,988 2023 259,503
Total minimum lease payments 1,096,857 Less: amount representing interest ( 60,330)
Present value of minimum lease payments $ 1,036,527

Notes to Financial Statements – Continued
______________________________________________________________________________
25
Note 8 – Risk Management
The District is exposed to various risks of loss related to torts; theft of, damage to, and destruction of assets; errors and omissions; injuries to employees, and natural disasters. The District carries commercial insurance for all such risks of loss, including workers’ compensation and employees’ health and accident insurance. Settled claims resulting from these risks have not exceeded commercial insurance coverage in any of the past three fiscal years.
Note 9 – Operating Leases
The District leases office equipment under various operating lease agreements. The lease expiration dates range between September 2019 and February 2021. The total lease payments for the year ended June 30, 2019 were $17,251. The future minimum operating lease payments are as follows:
Year ending June 30 Governmental
Activities
2020 $ 6,120 2021 2,279 Total $ 8,399
Note 10 – Net Revenue
The District provides emergency medical and ambulance transportation services (both emergent and non-emergent interfacility transports), within the same geographic region as it provides fire prevention and suppression services. Charges for such emergency medical and transportation services are recognized as service revenues. Net revenue is reported at the estimated net realizable amounts from patients, third-party payers, and others for services rendered, including estimated retroactive adjustments under reimbursement allowances with third-party payers, provisions for bad debt and uncompensated care.
The difference between customary charges and the contractually established rates is accounted for as a contractual adjustment. The District's customary charges, contractual adjustments, provision for bad debts and uncompensated services for the year ended June 30, 2019 are reported in the fund financial statements as follows:
Gross ambulance service revenues $ 4,494,031 Contractual adjustments and
uncompensated services
( 2,272,533)
Net ambulance service revenue $ 2,221,498
The net ambulance service revenue is reported in charges for services revenues in the financial statements. The District relies on payments from third-party payers, such as Medicare and commercial insurance carriers, to support the emergency medical services provided. Should these payers not cover the entire amount of the services rendered, such differences are adjusted as uncompensated services with the remaining amounts necessary to support the program being subsidized with property tax revenues.

Notes to Financial Statements – Continued
______________________________________________________________________________
26
Note 11 – Line of Credit
The District has an available line of credit totaling $1,500,000 with the Yavapai County Treasurer which is secured by the District’s property taxes. At June 30, 2019, there was no outstanding balance on this line. During fiscal year 2019, the District did not utilize the line of credit.
Note 12 – Retirement Pension and Other Postemployment Benefit Plans
The District and employees contribute to four retirement plans. These plans are a 457(b) defined contribution pension plan, a 501(c)(9) Post-Employment Health Plan, the Arizona State Retirement System (ASRS) and the Public Safety Personnel Retirement System (PSPRS). Benefits for non-public safety personnel are established based on contributions to the plan. For public safety personnel, state statute regulates retirement, death, long-term disability and survivor insurance premium benefits.
At June 30, 2019, the District reported the following aggregate amounts related to pension and other post-employment benefits (OPEB) for all plans to which it contributes:
Net pension and OPEB liability $ 23,172,183Deferred outflows of resources 7,948,463Deferred inflows of resources 1,154,095Pension and OPEB expense 4,601,686
The County’s accrued payroll and employee benefits includes $304,380 of outstanding pension and OPEB contribution amounts payable to all plans for the year ended June 30, 2019. The ASRS pension, PSPRS pension and OPEB plans are described below. The ASRS OPEB plans are combined with the pension plans and not separately described due to their relative insignificance to the District’s financial statements.
A. Retirement Plan – 457(b)
The District has a 457(b) defined contribution pension plan covering all of its eligible employees. In a defined contribution plan, benefits depend solely on amounts contributed to the plan plus investment earnings. Employees may contribute up to 100% of their eligible salary up to the maximum amount allowed by the Internal Revenue Code (IRC). For the year ended June 30, 2019, the employees’ contributions were $485,599.
B. Voluntary Employee Beneficiary Association – 501(c)(9)
The District has a Post-Employment Health Plan (PEHP) which is an employee benefit plan (IRC 501(c)(9)) designed to allow the employer and employees to invest money for the payment of post-employment qualified medical expenses for employees.
All full-time employees begin participation in the PEHP plan after one year of service and contribute 1% of income into a mandatory group that is matched by the District. If an employee is eligible, they may enroll into one of the three optional groups (“Sunset”, “Retirement” or “Tenured”) in place of one of the mandatory groups. The District’s match is 1% for all groups.
For the year ended June 30, 2019, the District’s contributions to the plan were $79,463 and the employees’ contributions were $119,047.

Notes to Financial Statements – Continued
______________________________________________________________________________
27
Note 12 – Retirement Pension and Other Postemployment Benefit Plans - Continued
C. Arizona State Retirement System
Plan description — District employees not covered by PSPRS participate in the Arizona State Retirement System (ASRS). The ASRS administers a cost-sharing multiple-employer defined benefit pension plan, a cost-sharing multiple-employer defined benefit health insurance premium benefit (OPEB) plan, and a cost-sharing multiple-employer defined benefit long-term disability (OPEB) plan. The Arizona State Retirement System Board governs the ASRS according to the provisions of A.R.S. Title 38, Chapter 5, Articles 2 and 2.1. The ASRS issues a publicly available financial report that includes its financial statements and required supplementary information. The report is available on its website at www.azasrs.gov. Benefits provided — The ASRS provides retirement, health insurance premium supplement, long-term disability, and survivor benefits. State statute establishes benefit terms. Retirement benefits are calculated on the basis of age, average monthly compensation, and service credit as follows:
Retirement Initial Membership Date ASRS Before July 1, 2011 On or after July 1, 2011
Years of service and age required to receive benefit
Sum of years and age equals 80 10 years, age 62 5 years, age 50* any years, age 65
30 years, age 55 25 years, age 60 10 years, age 62 5 years, age 50* any years, age 65
Final average salary is based on Highest 36 consecutive months of last 120 months
Highest 60 consecutive months of last 120 months
Benefit percent per year of service 2.1% to 2.3% 2.1% to 2.3%
*With actuarially reduced benefits. The plan participants are not eligible for cost-of-living adjustments because they began participation after September 13, 2013. Survivor benefits are payable upon a member’s death. For retired members, the retirement benefit option chosen determines the survivor benefit. For all other members, the beneficiary is entitled to the member’s account balance that includes the member’s contributions and employer’s contributions, plus interest earned. Health insurance premium benefits are available to retired or disabled members with 5 years of credited service. The benefits are payable only with respect to allowable health insurance premiums for which the member is responsible. For members with 10 or more years of service, benefits range from $100 per month to $260 per month depending on the age of the member and dependents. For members with 5 to 9 years of service, the benefits are the same dollar amounts as above multiplied by a vesting fraction based on completed years of service.

Notes to Financial Statements – Continued
______________________________________________________________________________
28
Note 12 – Retirement Pension and Other Postemployment Benefit Plans - Continued
Active members are eligible for a monthly long-term disability benefit equal to two-thirds of monthly earnings. Members receiving benefits continue to earn service credit up to their normal retirement dates. Members with long-term disability commencement dates after June 30, 1999, are limited to 30 years of service or the service on record as of the effective disability date if their service is greater than 30 years. Contributions — In accordance with state statutes, annual actuarial valuations determine active member and employer contribution requirements. The combined active member and employer contribution rates are expected to finance the costs of benefits employees earn during the year, with an additional amount to finance any unfunded accrued liability. For the year ended June 30, 2019, statute required active ASRS members to contribute at the actuarially determined rate of 11.80 percent (11.64 percent for retirement and 0.16 percent for long-term disability) of the members’ annual covered payroll, and statute required the District to contribute at the actuarially determined rate of 11.80 percent (11.18 percent for retirement, 0.46 percent for health insurance premium benefit, and 0.16 percent for long-term disability) of the active members’ annual covered payroll. The District’s contributions to the pension, health insurance premium benefit, and long-term disability plans for the year ended June 30, 2019 were $119,080. During fiscal year 2019, the District paid for ASRS pension contributions from the general fund. Liability — At June 30, 2019, the District reported a liability of $1,586,101 for its proportionate share of the ASRS’ net pension liability. The net liability was measured as of June 30, 2018. The total liability used to calculate the net liability was determined using updated procedures to roll forward the total liability from an actuarial valuation as of June 30, 2017, to the measurement date of June 30, 2018. The total liabilities as of June 30, 2018, reflect changes in actuarial assumptions based on the results of an actuarial experience study for the 5-year period ended June 30, 2016, including decreasing the discount rate from 8 percent to 7.5 percent, changing the projected salary increases from 3–6.75 percent to 2.7–7.2 percent, decreasing the inflation rate from 3 percent to 2.3 percent, and changing the mortality rates. The District’s proportion of the net pension asset or liability was based on the District’s actual contributions to the plan relative to the total of all participating employers’ contributions for the year ended June 30, 2018. The District’s proportion measured as of June 30, 2018 was .01136 percent, a decrease of .0005 percent from June 30, 2017. Expense - For the year ended June 30, 2019, the District recognized pension expense for ASRS of $584,954.

Notes to Financial Statements – Continued
______________________________________________________________________________
29
Note 12 – Retirement Pension and Other Postemployment Benefit Plans - Continued
Deferred outflows/inflows of resources - At June 30, 2019, the District reported deferred outflows of resources and deferred inflows of resources related to pensions from the following sources:
Deferred Outflows of Resources
Deferred Inflows of Resources
Differences between expected and actual experience $ 43,799 $ 12,583
Changes of assumptions or other inputs 51,255 140,472 Net difference between projected and actual
earnings on plan investments - 47,005 Changes in proportion and differences between
District contributions and proportionate share of contributions 339,359 55,898
District contributions subsequent to the measurement date 119,080 -
Total $ 553,493 $ 255,958
The amount reported as deferred outflows of resources related to ASRS pensions resulting from District contributions subsequent to the measurement date will be recognized as an increase of the net asset or a reduction of the net liability in the year ending June 30, 2020. Other amounts reported as deferred outflows of resources and deferred inflows of resources related to pensions will be recognized in pension expense as follows:
Year ending June 30,
2020 $ 278,055 2021 ( 24,481)2022 ( 59,429)2023 ( 16,791)2024 717
Thereafter 384
Actuarial assumptions — The significant actuarial assumption used to measure the total pension liability are as follows:
Actuarial valuation date June 30, 2017 Actuarial roll forward date June 30, 2018 Actuarial cost method Entry age normal Investment rate of return 7.5% Projected salary increases 2.7 – 7.2% Inflation 2.3% Permanent benefit increase Included Mortality rates 2017 SRA Scale U-MP
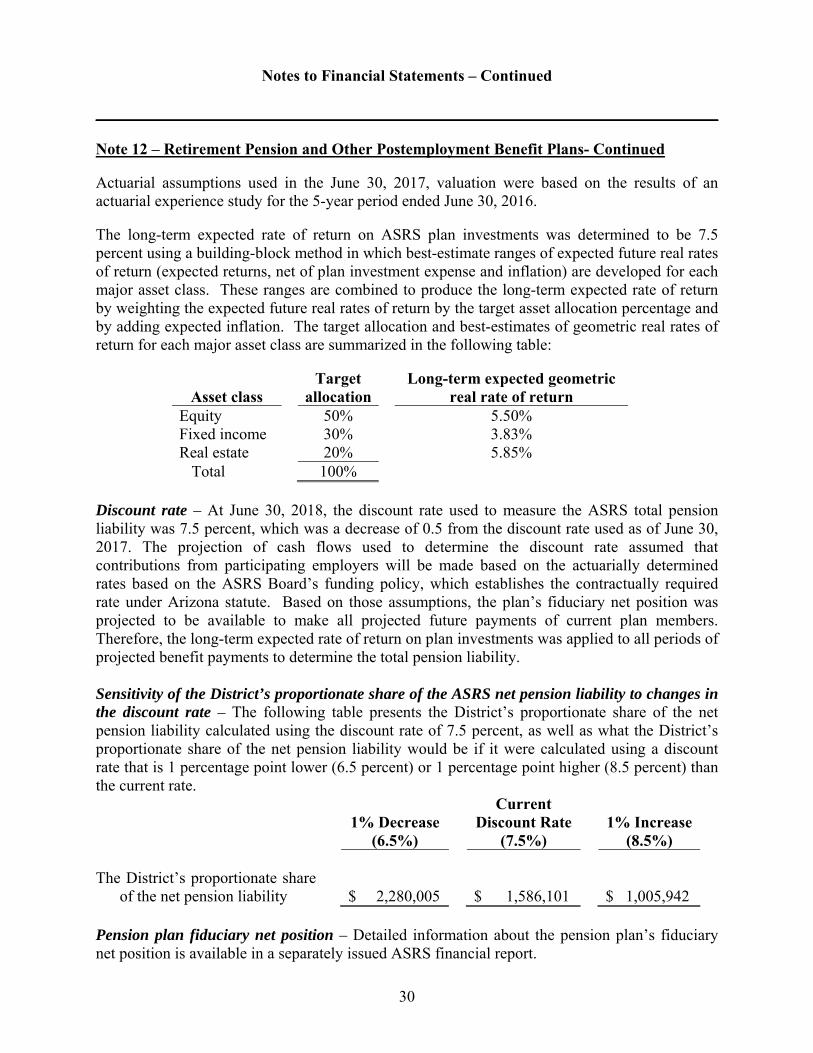
Notes to Financial Statements – Continued
______________________________________________________________________________
30
Note 12 – Retirement Pension and Other Postemployment Benefit Plans- Continued Actuarial assumptions used in the June 30, 2017, valuation were based on the results of an actuarial experience study for the 5-year period ended June 30, 2016. The long-term expected rate of return on ASRS plan investments was determined to be 7.5 percent using a building-block method in which best-estimate ranges of expected future real rates of return (expected returns, net of plan investment expense and inflation) are developed for each major asset class. These ranges are combined to produce the long-term expected rate of return by weighting the expected future real rates of return by the target asset allocation percentage and by adding expected inflation. The target allocation and best-estimates of geometric real rates of return for each major asset class are summarized in the following table:
Asset class Target
allocation Long-term expected geometric
real rate of return Equity 50% 5.50% Fixed income 30% 3.83% Real estate 20% 5.85%
Total 100% Discount rate – At June 30, 2018, the discount rate used to measure the ASRS total pension liability was 7.5 percent, which was a decrease of 0.5 from the discount rate used as of June 30, 2017. The projection of cash flows used to determine the discount rate assumed that contributions from participating employers will be made based on the actuarially determined rates based on the ASRS Board’s funding policy, which establishes the contractually required rate under Arizona statute. Based on those assumptions, the plan’s fiduciary net position was projected to be available to make all projected future payments of current plan members. Therefore, the long-term expected rate of return on plan investments was applied to all periods of projected benefit payments to determine the total pension liability. Sensitivity of the District’s proportionate share of the ASRS net pension liability to changes in the discount rate – The following table presents the District’s proportionate share of the net pension liability calculated using the discount rate of 7.5 percent, as well as what the District’s proportionate share of the net pension liability would be if it were calculated using a discount rate that is 1 percentage point lower (6.5 percent) or 1 percentage point higher (8.5 percent) than the current rate.
1% Decrease (6.5%)
Current Discount Rate
(7.5%) 1% Increase
(8.5%) The District’s proportionate share
of the net pension liability
$ 2,280,005 $ 1,586,101 $ 1,005,942 Pension plan fiduciary net position – Detailed information about the pension plan’s fiduciary net position is available in a separately issued ASRS financial report.

Notes to Financial Statements – Continued
______________________________________________________________________________
31
Note 12 – Retirement Pension and Other Postemployment Benefit Plans- Continued
D. Public Safety Personnel Retirement System
Plan Description – The District has entered into a Joinder Agreement with the Arizona State Public Safety Personnel Retirement System (PSPRS) or employees who became members on or after July 1, 2017, may participate in the Public Safety Personnel Defined Contribution Retirement Plan (PSPDCRP). The PSPRS administers an agent and cost sharing multiple-employer defined benefit pension plan and an agent and cost sharing multiple-employer defined benefit health insurance premium benefit (OPEB) plan, to cover all full-time personnel engaged in fire suppression activities and/or fire support. A nine-member board known as the Board of Trustees and the participating local boards govern the PSPRS according to the provisions of A.R.S Title 38, Chapter 5, Article 4. Employees who were PSPRS members before July 1, 2017, participate in the agent plans, and those who became PSPRS members on or after July 1, 2017, participate in the cost-sharing plans (PSPRS Tier 3 Risk Pool) which are not further disclosed because of their relative insignificance to the District’s financial statements. The PSPRS issues a publicly available financial report that includes their financial statements and required supplementary information of PSPRS. The reports are available on the PSPRS website at www.psprs.com.
Benefits Provided - The PSPRS provides retirement, health insurance premium supplement, disability, and survivor benefits. State statute establishes benefit terms. Retirement, disability, and survivor benefits are calculated on the basis of age, average monthly compensation, and service credit as follows:
Initial membership date
Before January 1, 2012 On or after January 1, 2012
and before July 1, 2017 Retirement and Disability
Years of service and age required to receive benefit
20 years of service, any age 15 years of service, age 62
25 years of service or 15 years of credited service, age 52.5
Final average salary is based on Highest 36 consecutive months of last 20 years
Highest 60 consecutive months of last 20 years
Benefit percent: Normal Retirement 50% less 2.0% for each year of credited
service less than 20 years OR plus 2.0% to 2.5% for each year of credited service
over 20 years, not to exceed 80%
1.5% to 2.5% per year of credited service, not to exceed 80%
Accidental Disability Retirement 50% or normal retirement, whichever is greater
Catastrophic Disability Retirement 90% for the first 60 months then reduced to either 62.5% or normal retirement, whichever is greater
Ordinary Disability Retirement Normal retirement calculated with actual years of credited service or 20 years of credited service, whichever is greater, multiplied by years of credited service (not
to exceed 20 years) divided by 20 Survivor Benefit
Retired Members 80% to 100% of retired member’s pension benefit
Active Members 80% to 100% of accidental disability retirement benefit or 100% of average monthly compensation if death
was the result of injuries received on the job

Notes to Financial Statements – Continued
______________________________________________________________________________
32
Note 12 – Retirement Pension and Other Postemployment Benefit Plans- Continued Retirement and survivor benefits are subject to automatic cost-of-living adjustments based on inflation. PSPRS also provides temporary disability benefits of 50 percent of the member’s compensation for up to 12 months. Health insurance premium benefits are available to retired or disabled members with 5 years of credited service. The benefits are payable only with respect to allowable health insurance premiums for which the member is responsible. Benefits range from $100 per month to $260 per month depending on the age of the member and dependents. Employees covered by benefit terms – At June 30, 2019, the following employees were covered by the agent plan’s benefit terms:
Pension Health Inactive employees or beneficiaries currently receiving benefits 25
25
Inactive employees entitled to but not yet receiving benefits 10
-
Active employees 74 74
Total 109 99 Contributions – State statues establish the pension contribution requirements for active PSPRS employees. In accordance with state statutes, annual actuarial valuations determine employer contribution requirements for PSPRS pension and health insurance premium benefits. The combined active member and employer contribution rates are expected to finance costs of benefits employees earn during the year, with an additional amount to finance any unfunded accrued liability. The District is required to contribute at an actuarially determined rate. Contribution rates for the year ended June 30, 2019 are indicated below. Rates are a percentage of active members’ annual covered payroll. The rate for the year ended June 30, 2018, was 35.83% for the pension plan and 0.55% for the health insurance premium benefit for the District portion and 7.65% - 9.94% for the employee portion. Total pension contributions made during the year were $2,621,218, and the total health insurance premium benefit contributions were $40,236. During fiscal year 2019, the District paid for PSPRS and OPEB contributions from the general fund. Liability – At June 30, 2019, the District reported liabilities and of $21,259,357 and $326,725 for pension and health insurance premium benefit, respectively. The net assets and liabilities were measured as of June 30, 2018, and the total liability used to calculate the net asset or liability was determined by an actuarial valuation as of that date.

Notes to Financial Statements – Continued
______________________________________________________________________________
33
Note 12 – Retirement Pension and Other Postemployment Benefit Plans- Continued
Actuarial assumptions - The significant actuarial assumptions used to measure the total pension/OPEB liability are as follows:
Actuarial valuation date June 30, 2018 Actuarial cost method Entry age normal Investment rate of return 7.4% Wage inflation 3.5% for pensions/NA for OPEB Price inflation 2.5% for pensions/NA for OPEB Cost-of-living adjustment Included for pensions/NA for OPEB Mortality rates RP – 2014 tables using MP-2016 improvement scale
with adjustments to match current experience Healthcare cost trend rate Not applicable
Actuarial assumptions used in the June 30, 2018 valuation were based on the results of an actual experience study for the 5-year period ended June 30, 2016.
The long-term expected rate of return on PSPRS pension plan investments was determined to be 7.4 percent using a building-block method in which best-estimate ranges of expected future real rates of return (expected returns, net of plan investment expenses and inflation) are developed for each major asset class. The target allocation and best estimates of geometric real rates of return for each major asset class are summarized in the following table:
Long-term expected
Asset class Target
allocation geometric real rate of
return
Short term investments 2% 0.25% Risk parity 4% 5.00% Fixed income 5% 1.25% Real assets 9% 4.52% GTS 12% 3.96% Private credit 16% 6.75% Real estate 10% 3.75% Private equity 12% 5.83% Non-U.S. equity 14% 8.70% U.S. equity 16% 7.60%
Total 100%
Discount rates – At June 30, 2018, the discount rate used to measure the PSPRS total pension/OPEB liabilities was 7.4 percent, which was the same as the discount rate used as of June 30, 2017. The projection of cash flows used to determine the PSPRS discount rate assumed that plan member contributions will be made at the current contribution rate and that employer contributions will be made at rates equal to the difference between the actuarially determined contribution rate and the member rate. Based on those assumptions, the plan’s fiduciary net position was projected to be available to make all projected future benefit payments of current plan members. Therefore, the long-term expected rate of return on plan investments was applied to all periods of projected benefit payments to determine the total pension/OPEB liability.

Notes to Financial Statements – Continued
______________________________________________________________________________
34
Note 12 – Retirement Pension and Other Postemployment Benefits Plan- Continued
Changes in the Net Pension/OPEB Liability
Pension Increase (Decrease)
Total Pension Liability (a)
Plan Fiduciary Net Position (b)
Net Pension
Liability (a) – (b)
Balances at June 30, 2018 $ 43,572,602 $ 22,528,912 $ 21,043,690
Changes for the current year: Service cost 1,513,340 - 1,513,340Interest on the total pension liability
3,227,907 - 3,227,907
Changes of benefit terms - - -Differences between expected
and actual experience in the measurement of the liability
( 732,633) - ( 732,633)Change of assumptions or other
inputs
- - -Net investment income - 1,573,197 ( 1,573,197)Contributions – employer - 1,657,931 ( 1,657,931)Contributions – employee - 586,204 ( 586,204)Benefit payments ( 1,417,806) ( 1,417,806) -Administrative expense - ( 24,644) 24,644Other changes - 259 ( 259)
Net changes 2,590,808 2,375,141 215,667
Balances at June 30, 2019 $ 46,163,410 $ 24,904,053 $ 21,259,357
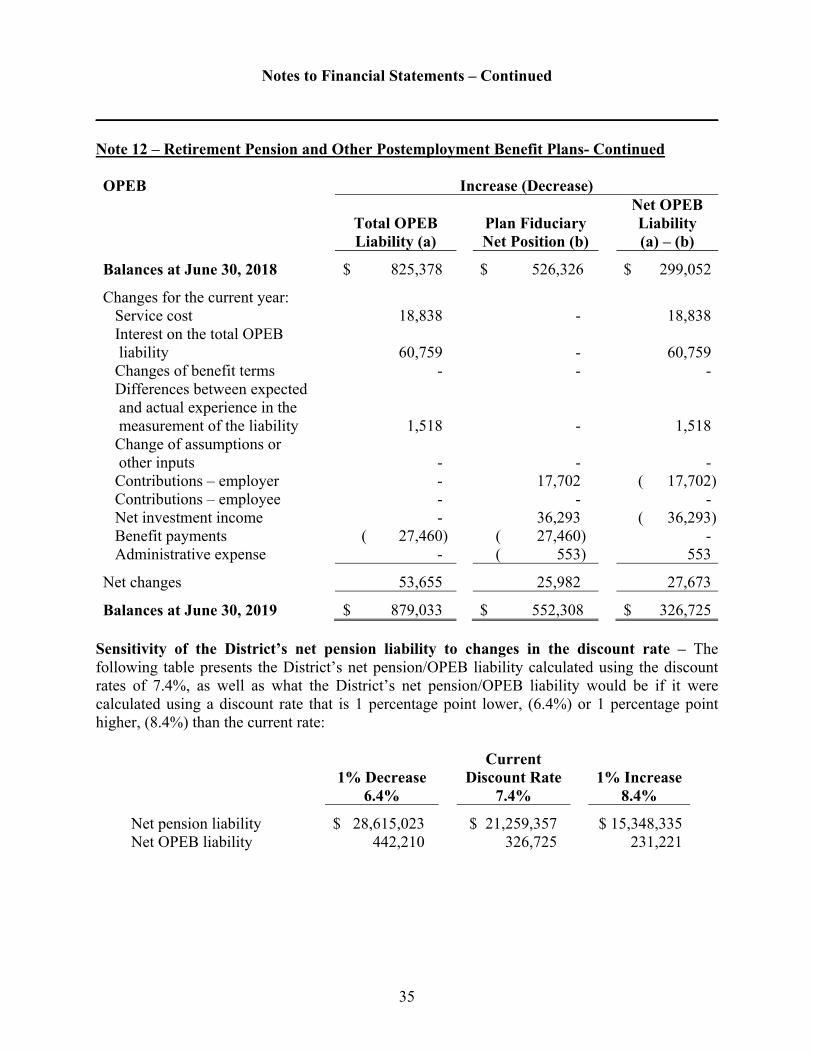
Notes to Financial Statements – Continued
______________________________________________________________________________
35
Note 12 – Retirement Pension and Other Postemployment Benefit Plans- Continued
OPEB Increase (Decrease)
Total OPEB Liability (a)
Plan Fiduciary Net Position (b)
Net OPEB Liability (a) – (b)
Balances at June 30, 2018 $ 825,378 $ 526,326 $ 299,052
Changes for the current year: Service cost 18,838 - 18,838Interest on the total OPEB liability
60,759 - 60,759
Changes of benefit terms - - -Differences between expected and actual experience in the measurement of the liability
1,518 - 1,518Change of assumptions or other inputs
- - -
Contributions – employer - 17,702 ( 17,702)Contributions – employee - - -Net investment income - 36,293 ( 36,293)Benefit payments ( 27,460) ( 27,460) -Administrative expense - ( 553) 553
Net changes 53,655 25,982 27,673
Balances at June 30, 2019 $ 879,033 $ 552,308 $ 326,725 Sensitivity of the District’s net pension liability to changes in the discount rate – The following table presents the District’s net pension/OPEB liability calculated using the discount rates of 7.4%, as well as what the District’s net pension/OPEB liability would be if it were calculated using a discount rate that is 1 percentage point lower, (6.4%) or 1 percentage point higher, (8.4%) than the current rate:
1% Decrease
6.4%
Current Discount Rate
7.4%
1% Increase
8.4%
Net pension liability $ 28,615,023 $ 21,259,357 $ 15,348,335Net OPEB liability 442,210 326,725 231,221

Notes to Financial Statements – Continued
______________________________________________________________________________
36
Note 12 – Retirement Pension and Other Postemployment Benefit Plans- Continued Plan fiduciary net position – Detailed information about the plan’s fiduciary net position is available in the separately issued PSPRS financial report.
Expense - For the year ended June 30, 2019, the District recognized pension expense of $3,957,076 and OPEB expense of $59,656.
Deferred outflows/inflows of resources - At June 30, 2019, the District reported deferred outflows of resources and deferred inflows of resources related to pension and OPEB from the following sources:
Pension
Health insurance premium benefit
Deferred outflows ofresources
Deferred inflows of resources
Deferred outflows of resources
Deferred inflows of resources
Differences between expected and actual experience $1,458,344 $ 875,015 $ 8,049
$ -
Changes of assumptions or other inputs 2,978,420 - -
13,057
Net difference between projected and actual earnings on plan investments 288,703 - -
10,065District contributions subsequent
to the measurement date 2,621,218 - 40,236
- Total $7,346,685 $ 875,015 $ 48,285
$ 23,122
The amounts reported as deferred outflows of resources related to pensions and OPEB resulting from contributions subsequent to the measurement date will be recognized as a reduction of the net pension liability in the year ending June 30, 2020. Other amounts reported as deferred outflows of resources and deferred inflows of resources related to pensions and OPEB will be recognized as expenses as follows:
Year Ending June 30,
Pension
Health
2020 $ 929,613 $ ( 4,283) 2021 782,711 ( 4,283) 2022 509,055 ( 4,284) 2023 677,188 ( 323) 2024 515,181 ( 777)
Thereafter 436,704 ( 1,123)

Notes to Financial Statements – Continued
______________________________________________________________________________
37
Note 13 - Commitments
On July 1, 2017, the District entered into a two-year agreement for dispatching services with the option to renew for three additional one-year terms subject to annual rate negotiations. The District has the ability to terminate the agreement with 180 days written notice. Fees for fiscal year 2019 were $287,762.

Variance withOriginal Final Budget-
and Final Actual PositiveBudget Amounts (Negative)
Revenues:Taxes:
Property taxes 14,034,693$ 14,148,487$ 113,794$ Fire district assistance tax 374,893 364,331 (10,562)
Grant revenue - 33,694 33,694 Ambulance fees 2,015,000 2,267,552 252,552 Non-district fire revenues 100,000 758,802 658,802 Rent 191,324 271,201 79,877 Investment earnings 25,000 104,509 79,509 Other 99,902 81,554 (18,348)
Total revenues 16,840,812 18,030,130 1,189,318
Expenditures:Department:Current:
Fire chief 363,332 358,719 4,613 Fire board 98,175 86,181 11,994 Pension 2,750 - 2,750 Community risk management 456,092 454,531 1,561 Fleet 307,762 333,371 (25,609) Human resources 461,629 444,111 17,518 Administration 297,123 295,720 1,403 Finance 183,954 151,556 32,398 Ambulance billing 151,580 156,186 (4,606) Ambulance 97,300 22,556 74,744 Telecommunications 1,092,902 722,319 370,583 Assistant chief/operations 529,443 404,803 124,640 Operations, wages and benefits 9,939,302 10,004,180 (64,878) Emergency operations center 3,591 - 3,591 Helicopter operations 12,677 3,503 9,174 Training 327,054 333,102 (6,048) Facilities 430,386 205,831 224,555 Wildland fire program 63,205 467,799 (404,594) Logistics 99,406 87,213 12,193 CISM/wellness 40,669 40,352 317 Hazardous materials 10,716 2,299 8,417 Swiftwater rescue 38,516 21,007 17,509 Rope/tower rescue 77,036 81,978 (4,942) Emergency medical service 468,187 566,812 (98,625) GIS 113,150 106,381 6,769
Non-operating budget 1,624,875 615,796 1,009,079 Total expenditures 17,290,812 15,966,306 1,324,506
Excess of revenues (under) over expenditures (450,000) 2,063,824 2,513,824
Other financing sources:Proceeds from capital lease - 58,170 58,170 Transfers in 450,000 51,124 (398,876)
Total other financing sources 450,000 109,294 (340,706)
Change in fund balance - 2,173,118 2,173,118
Fund balance, July 1, 2018 - 6,473,345 6,473,345
Fund balance, June 30, 2019 -$ 8,646,463$ 8,646,463$
Sedona Fire DistrictRequired Supplementary Information
Year Ended June 30, 2019
Budgetary Comparison ScheduleGeneral Fund
See accompanying notes to budgetary comparison schedule.
38
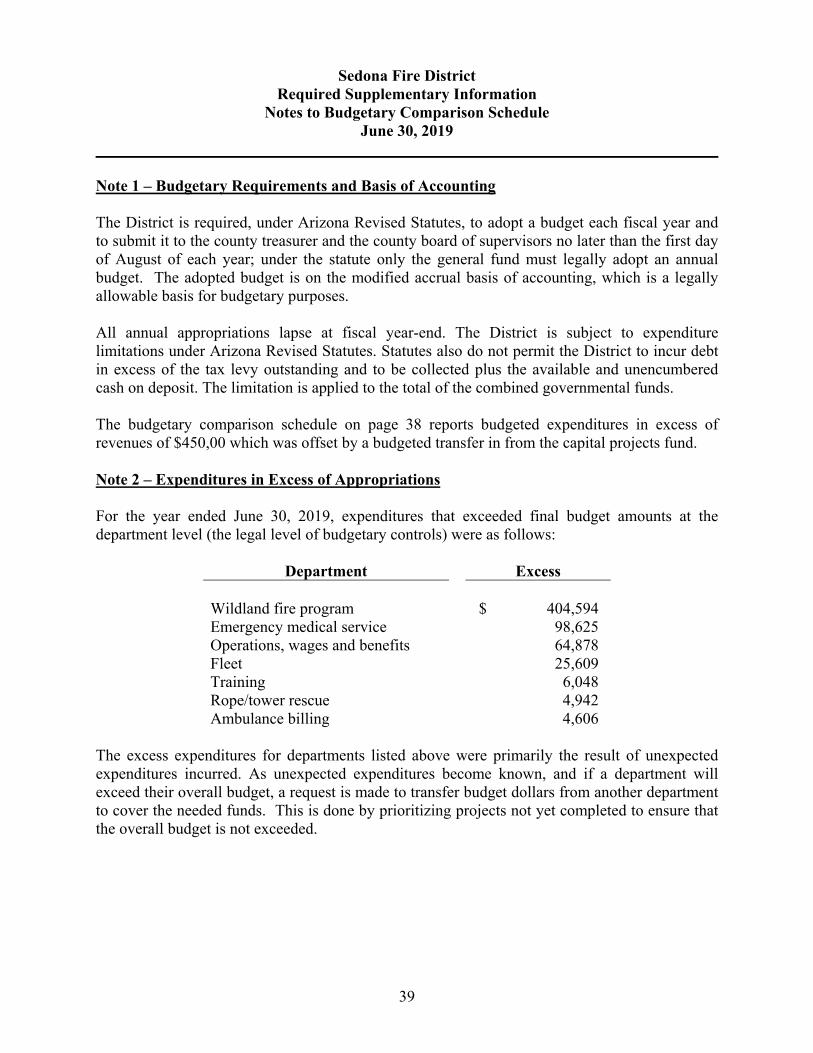
Sedona Fire District
Required Supplementary Information Notes to Budgetary Comparison Schedule
June 30, 2019 ______________________________________________________________________________
39
Note 1 – Budgetary Requirements and Basis of Accounting The District is required, under Arizona Revised Statutes, to adopt a budget each fiscal year and to submit it to the county treasurer and the county board of supervisors no later than the first day of August of each year; under the statute only the general fund must legally adopt an annual budget. The adopted budget is on the modified accrual basis of accounting, which is a legally allowable basis for budgetary purposes. All annual appropriations lapse at fiscal year-end. The District is subject to expenditure limitations under Arizona Revised Statutes. Statutes also do not permit the District to incur debt in excess of the tax levy outstanding and to be collected plus the available and unencumbered cash on deposit. The limitation is applied to the total of the combined governmental funds. The budgetary comparison schedule on page 38 reports budgeted expenditures in excess of revenues of $450,00 which was offset by a budgeted transfer in from the capital projects fund. Note 2 – Expenditures in Excess of Appropriations For the year ended June 30, 2019, expenditures that exceeded final budget amounts at the department level (the legal level of budgetary controls) were as follows:
Department Excess Wildland fire program $ 404,594 Emergency medical service 98,625 Operations, wages and benefits 64,878 Fleet 25,609 Training 6,048 Rope/tower rescue 4,942 Ambulance billing 4,606
The excess expenditures for departments listed above were primarily the result of unexpected expenditures incurred. As unexpected expenditures become known, and if a department will exceed their overall budget, a request is made to transfer budget dollars from another department to cover the needed funds. This is done by prioritizing projects not yet completed to ensure that the overall budget is not exceeded.
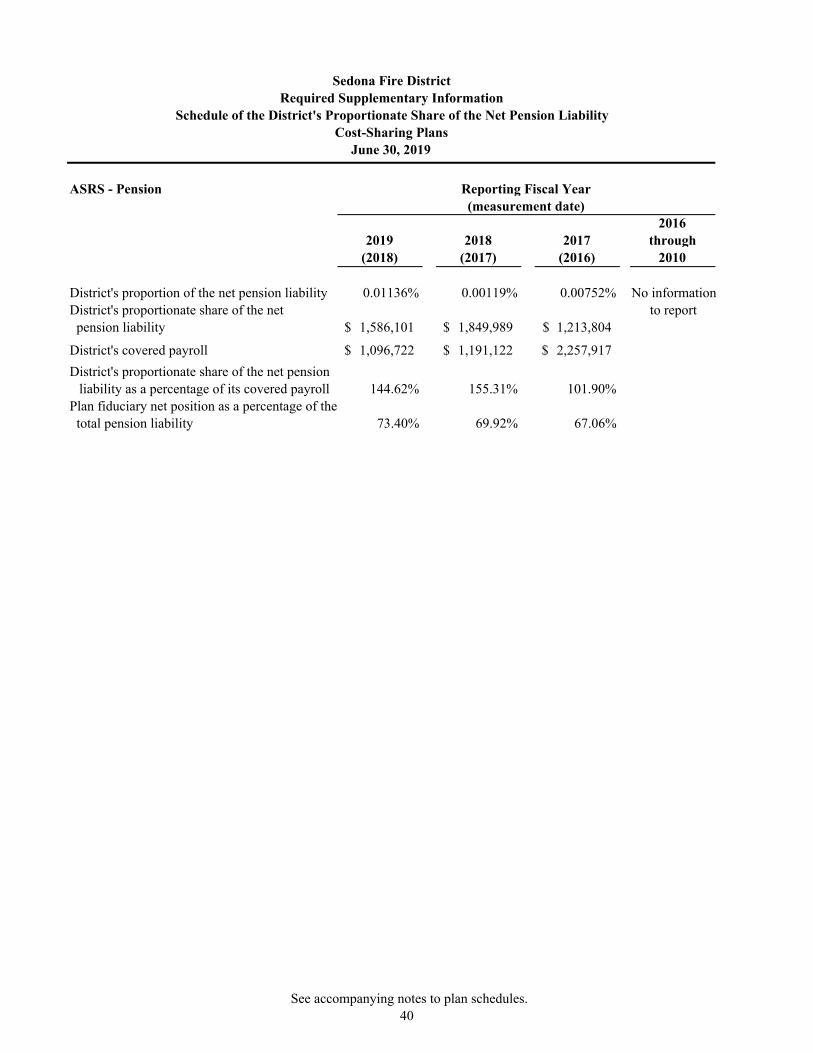
ASRS - Pension
2019 (2018)
2018 (2017)
2017 (2016)
2016 through
2010
District's proportion of the net pension liability 0.01136% 0.00119% 0.00752% No informationDistrict's proportionate share of the net to report pension liability 1,586,101$ 1,849,989$ 1,213,804$
District's covered payroll 1,096,722$ 1,191,122$ 2,257,917$
District's proportionate share of the net pension liability as a percentage of its covered payroll 144.62% 155.31% 101.90%
Plan fiduciary net position as a percentage of the total pension liability 73.40% 69.92% 67.06%
(measurement date)
Cost-Sharing Plans
Reporting Fiscal Year
Sedona Fire DistrictRequired Supplementary Information
Schedule of the District's Proportionate Share of the Net Pension Liability
June 30, 2019
See accompanying notes to plan schedules. 40
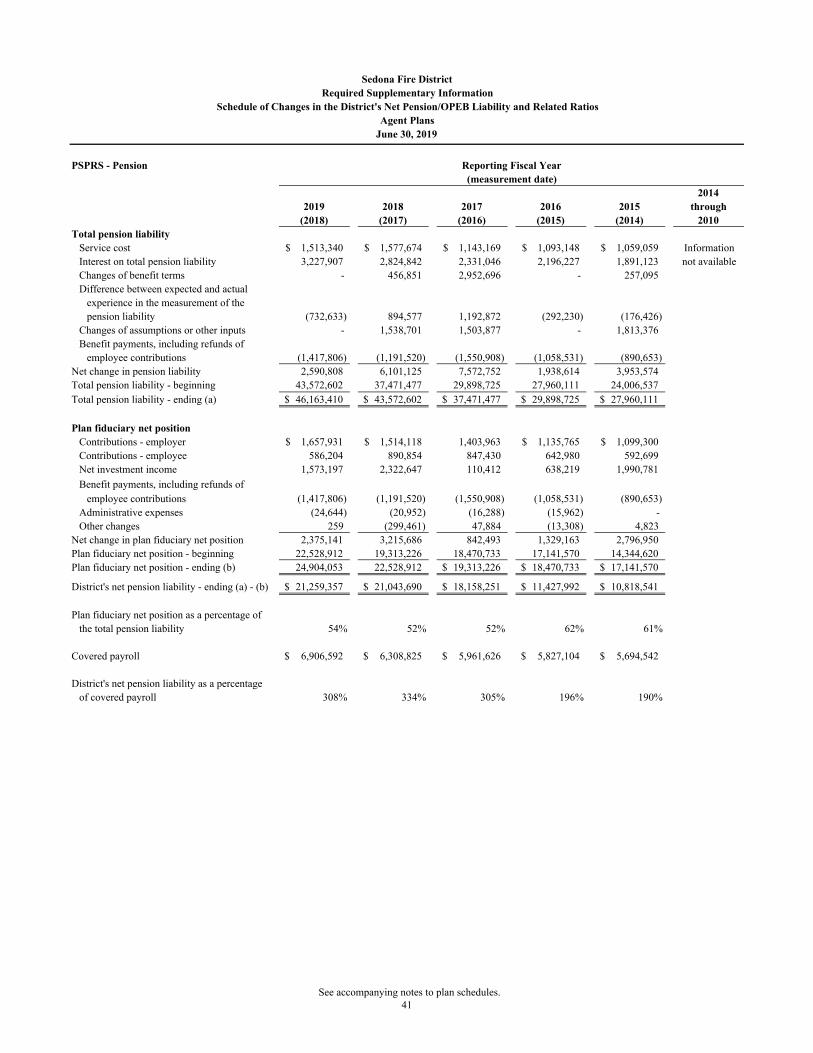
PSPRS - Pension
20142019 2018 2017 2016 2015 through
(2018) (2017) (2016) (2015) (2014) 2010Total pension liability
Service cost 1,513,340$ 1,577,674$ 1,143,169$ 1,093,148$ 1,059,059$ InformationInterest on total pension liability 3,227,907 2,824,842 2,331,046 2,196,227 1,891,123 not availableChanges of benefit terms - 456,851 2,952,696 - 257,095 Difference between expected and actual
experience in the measurement of the pension liability (732,633) 894,577 1,192,872 (292,230) (176,426)
Changes of assumptions or other inputs - 1,538,701 1,503,877 - 1,813,376 Benefit payments, including refunds of
employee contributions (1,417,806) (1,191,520) (1,550,908) (1,058,531) (890,653) Net change in pension liability 2,590,808 6,101,125 7,572,752 1,938,614 3,953,574 Total pension liability - beginning 43,572,602 37,471,477 29,898,725 27,960,111 24,006,537 Total pension liability - ending (a) 46,163,410$ 43,572,602$ 37,471,477$ 29,898,725$ 27,960,111$
Plan fiduciary net positionContributions - employer 1,657,931$ 1,514,118$ 1,403,963 1,135,765$ 1,099,300$ Contributions - employee 586,204 890,854 847,430 642,980 592,699 Net investment income 1,573,197 2,322,647 110,412 638,219 1,990,781
Benefit payments, including refunds ofemployee contributions (1,417,806) (1,191,520) (1,550,908) (1,058,531) (890,653)
Administrative expenses (24,644) (20,952) (16,288) (15,962) - Other changes 259 (299,461) 47,884 (13,308) 4,823
Net change in plan fiduciary net position 2,375,141 3,215,686 842,493 1,329,163 2,796,950 Plan fiduciary net position - beginning 22,528,912 19,313,226 18,470,733 17,141,570 14,344,620 Plan fiduciary net position - ending (b) 24,904,053 22,528,912 19,313,226$ 18,470,733$ 17,141,570$
District's net pension liability - ending (a) - (b) 21,259,357$ 21,043,690$ 18,158,251$ 11,427,992$ 10,818,541$
Plan fiduciary net position as a percentage ofthe total pension liability 54% 52% 52% 62% 61%
Covered payroll 6,906,592$ 6,308,825$ 5,961,626$ 5,827,104$ 5,694,542$
District's net pension liability as a percentageof covered payroll 308% 334% 305% 196% 190%
Reporting Fiscal Year(measurement date)
Agent Plans
Sedona Fire DistrictRequired Supplementary Information
Schedule of Changes in the District's Net Pension/OPEB Liability and Related Ratios
June 30, 2019
See accompanying notes to plan schedules.41

PSPRS - Health
20172019 2018 through
(2018) (2017) 2010Total OPEB liability
Service cost 18,838$ 19,349$ InformationInterest on total OPEB liability 60,759 58,005 not availableChanges of benefit terms - 5,829 Difference between expected and actual
experience in the measurement of the OPEB liability 1,518 8,790
Changes of assumptions or other inputs - (17,065) Benefit payments, including refunds of
employee contributions (27,460) (26,505) Net change in OPEB liability 53,655 48,403 Total OPEB liability - beginning 825,378 776,975 Total OPEB liability - ending (a) 879,033$ 825,378$
Plan fiduciary net positionContributions - employer 17,702$ 37,790$ Net investment income 36,293 54,768 Benefit payments, including refunds of
employee contributions (27,460) (26,505) Administrative expenses (553) (483)
Net change in plan fiduciary net position 25,982 65,570 Plan fiduciary net position - beginning 526,326 460,756 Plan fiduciary net position - ending (b) 552,308 526,326
District's net OPEB liability - ending (a) - (b) 326,725$ 299,052$
Plan fiduciary net position as a percentage ofthe total OPEB liability 62.83% 63.77%
Covered payroll 6,906,592$ 6,308,825$
District's net OPEB liability as a percentageof covered payroll 4.73% 4.74%
Reporting Fiscal Year(measurement date)
Sedona Fire DistrictRequired Supplementary Information
Schedule of Changes in the District's Net Pension/OPEB Liability and Related RatiosAgent Plans - Continued
June 30, 2019
See accompanying notes to plan schedules.42
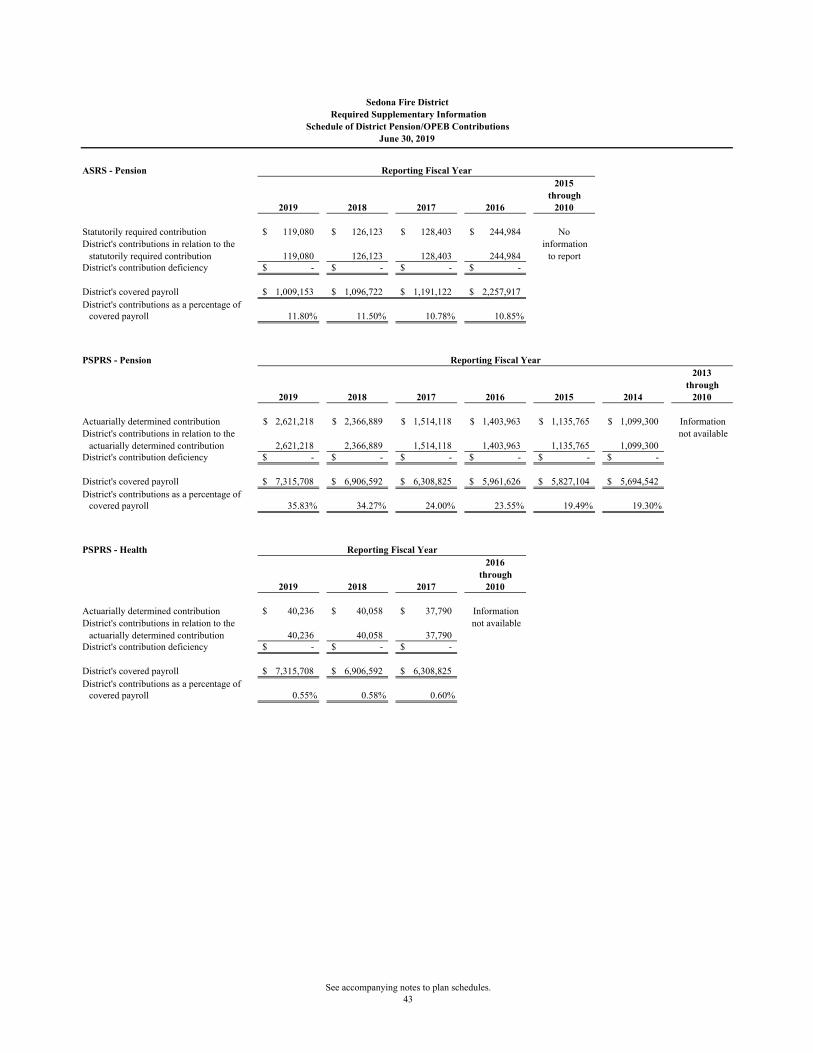
ASRS - Pension
2019 2018 2017 2016
2015 through
2010
Statutorily required contribution 119,080$ 126,123$ 128,403$ 244,984$ NoDistrict's contributions in relation to the information
statutorily required contribution 119,080 126,123 128,403 244,984 to reportDistrict's contribution deficiency -$ -$ -$ -$
District's covered payroll 1,009,153$ 1,096,722$ 1,191,122$ 2,257,917$ District's contributions as a percentage of
covered payroll 11.80% 11.50% 10.78% 10.85%
PSPRS - Pension
2019 2018 2017 2016 2015 2014
2013 through
2010
Actuarially determined contribution 2,621,218$ 2,366,889$ 1,514,118$ 1,403,963$ 1,135,765$ 1,099,300$ InformationDistrict's contributions in relation to the not available
actuarially determined contribution 2,621,218 2,366,889 1,514,118 1,403,963 1,135,765 1,099,300 District's contribution deficiency -$ -$ -$ -$ -$ -$
District's covered payroll 7,315,708$ 6,906,592$ 6,308,825$ 5,961,626$ 5,827,104$ 5,694,542$ District's contributions as a percentage of
covered payroll 35.83% 34.27% 24.00% 23.55% 19.49% 19.30%
PSPRS - Health
2019 2018 2017
2016 through
2010
Actuarially determined contribution 40,236$ 40,058$ 37,790$ InformationDistrict's contributions in relation to the not available
actuarially determined contribution 40,236 40,058 37,790 District's contribution deficiency -$ -$ -$
District's covered payroll 7,315,708$ 6,906,592$ 6,308,825$ District's contributions as a percentage of
covered payroll 0.55% 0.58% 0.60%
Reporting Fiscal Year
Reporting Fiscal Year
Sedona Fire DistrictRequired Supplementary Information
Schedule of District Pension/OPEB ContributionsJune 30, 2019
Reporting Fiscal Year
See accompanying notes to plan schedules. 43

Sedona Fire District
Required Supplementary Information Notes to Plan Schedules
June 30, 2019 ______________________________________________________________________________
44
Note 1 – Actuarially Determined Contribution Rates Actuarial determined contribution rates for PSPRS are calculated as of June 30 two years prior to the end of the fiscal year in which contributions are made. The actuarial methods and assumptions used to establish the contribution requirements are as follows:
Actuarial cost method Entry age normal Amortization method Level percent-of-pay, closed
Remaining amortization period as of the 2017 actuarial valuation
21 years for unfunded actuarial accrued liability, 20 years for excess
Asset valuation method 7-year smoothed market value; 80%/120% corridor Actuarial assumptions:
Investment rate of return In the 2017 actuarial valuation, the investment rate of return was decreased from 7.5% to 7.4%. In the 2016 actuarial valuation, the investment rate of return was decreased from 7.85% to 7. 5%. In the 2013 actuarial valuation, the investment rate of return was decreased from 8.0% to 7.85%.
Projected salary increases In the 2017 actuarial valuation, projected salary increases were decreased from 4.0%-8.0% to 3.5% - 7.5%. In the 2014 actuarial valuation, projected salary increases were decreased from 4.5% – 8.5% to 4% – 8%
Wage growth In the 2017 actuarial valuation, wage growth was decreased from 4% to 3.5%. In the 2014 actuarial valuation, wage growth was decreased from 4.5% to 4%. In the 2013 actuarial valuation, wage growth was decreased from 5% to 4.5%.
Retirement age Experience-based table of rates that is specific to the type of eligibility condition. Last updated for the 2012 valuation pursuant to an experience study of the period July 1, 2006 - June 30, 2011.
Mortality In the 2017 actuarial valuation, changed to RP-2014 tables, with 75% of MP-2016 fully generational projections scales. RP-2000 mortality table (adjusted by 105% for both males and females)

Notes to Plan Schedules – Continued
______________________________________________________________________________
45
Note 2 – Factors That Affect Trends Arizona courts have ruled that provisions of a 2011 law that changed the mechanism for funding permanent pension benefit increases and increased employee pension contribution rates were unconstitutional or a breach of contract because those provisions apply to individuals who were members as of the law’s effective date. As a result, PSPRS changed benefit terms to reflect the prior mechanism for funding permanent benefit increases for those members and revised actuarial assumptions to explicitly value future permanent benefit increases. PSPRS also reduced those members’ employee contribution rates. These changes are reflected in the plans’ pension liabilities for fiscal year 2015 (measurement date 2014) for members who were retired as of the law’s effective date and fiscal year 2018 (measurement date 2017) for members who retired or will retire after the law’s effective date. These changes also increased the PSPRS required pension contributions beginning in fiscal year 2016 for members who were retired as of the law’s effective date. These changes increased the PSPRS required contributions beginning in fiscal year 2019 for members who retired or will retire after the law’s effective date. Also, the District refunded excess employee contributions to PSPRS members. PSPRS allowed the District to reduce its actual employer contributions for the refund amounts. As a result, the District’s pension contributions were less than the actuarially or statutorily determined contributions for 2018 and 2019.

Sedona Fire District 2860 Southwest Drive, Sedona, Arizona, 86336
Statistical Section

Sedona Fire District 2860 Southwest Drive, Sedona, Arizona, 86336
46
Statistical Section This part of the comprehensive annual financial report of the District presents detailed information as a context for understanding what the information in the financial statements, note disclosures, and required supplementary information says about the government's overall financial health of the District. This section contains the following tables and information:
Financial Trends – These schedules contain trend information to help the reader understand how the financial performance and well-being of the District have changed over time.
Revenue Capacity - These schedules contain information to help the reader assess the most significant local revenue source of the District – the property tax.
Debt Capacity ‐ These schedules present information to help the reader assess the affordability of the current levels of outstanding debt of the District and its ability to issue additional debt in the future.
Demographic and Economic Information - These schedules offer demographic and economic indicators to help the reader understand the environment within which the financial activities of the District take place.
Operating Information - These schedules contain service and infrastructure data to help the reader understand how the information in the financial report of the District relates to the services the District provides and the activities it performs.
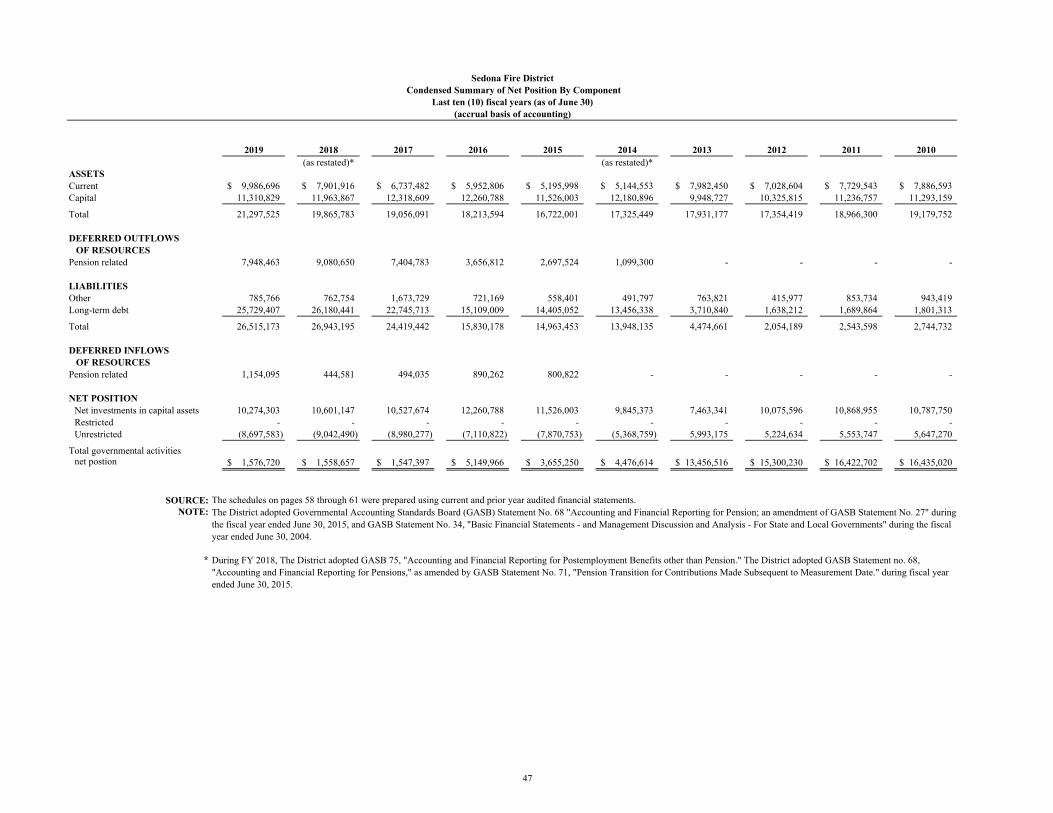
2019 2018 2017 2016 2015 2014 2013 2012 2011 2010(as restated)* (as restated)*
ASSETSCurrent 9,986,696$ 7,901,916$ 6,737,482$ 5,952,806$ 5,195,998$ 5,144,553$ 7,982,450$ 7,028,604$ 7,729,543$ 7,886,593$ Capital 11,310,829 11,963,867 12,318,609 12,260,788 11,526,003 12,180,896 9,948,727 10,325,815 11,236,757 11,293,159
Total 21,297,525 19,865,783 19,056,091 18,213,594 16,722,001 17,325,449 17,931,177 17,354,419 18,966,300 19,179,752
DEFERRED OUTFLOWS OF RESOURCESPension related 7,948,463 9,080,650 7,404,783 3,656,812 2,697,524 1,099,300 - - - -
LIABILITIESOther 785,766 762,754 1,673,729 721,169 558,401 491,797 763,821 415,977 853,734 943,419 Long-term debt 25,729,407 26,180,441 22,745,713 15,109,009 14,405,052 13,456,338 3,710,840 1,638,212 1,689,864 1,801,313
Total 26,515,173 26,943,195 24,419,442 15,830,178 14,963,453 13,948,135 4,474,661 2,054,189 2,543,598 2,744,732
DEFERRED INFLOWS OF RESOURCESPension related 1,154,095 444,581 494,035 890,262 800,822 - - - - -
NET POSITIONNet investments in capital assets 10,274,303 10,601,147 10,527,674 12,260,788 11,526,003 9,845,373 7,463,341 10,075,596 10,868,955 10,787,750 Restricted - - - - - - - - - - Unrestricted (8,697,583) (9,042,490) (8,980,277) (7,110,822) (7,870,753) (5,368,759) 5,993,175 5,224,634 5,553,747 5,647,270
Total governmental activitiesnet postion 1,576,720$ 1,558,657$ 1,547,397$ 5,149,966$ 3,655,250$ 4,476,614$ 13,456,516$ 15,300,230$ 16,422,702$ 16,435,020$
SOURCE:NOTE:
*
The schedules on pages 58 through 61 were prepared using current and prior year audited financial statements.The District adopted Governmental Accounting Standards Board (GASB) Statement No. 68 "Accounting and Financial Reporting for Pension; an amendment of GASB Statement No. 27" during the fiscal year ended June 30, 2015, and GASB Statement No. 34, "Basic Financial Statements - and Management Discussion and Analysis - For State and Local Governments" during the fiscal year ended June 30, 2004.
During FY 2018, The District adopted GASB 75, "Accounting and Financial Reporting for Postemployment Benefits other than Pension." The District adopted GASB Statement no. 68, "Accounting and Financial Reporting for Pensions," as amended by GASB Statement No. 71, "Pension Transition for Contributions Made Subsequent to Measurement Date." during fiscal year ended June 30, 2015.
Sedona Fire DistrictCondensed Summary of Net Position By Component
Last ten (10) fiscal years (as of June 30)(accrual basis of accounting)
47
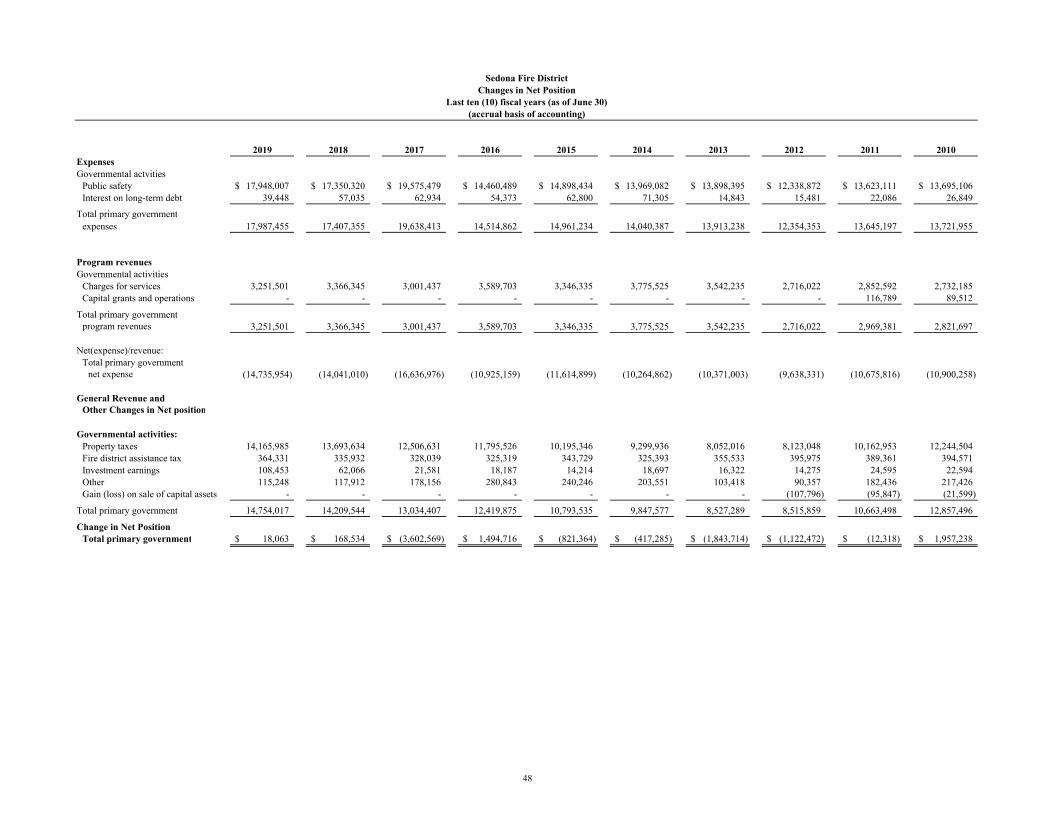
2019 2018 2017 2016 2015 2014 2013 2012 2011 2010ExpensesGovernmental actvities
Public safety 17,948,007$ 17,350,320$ 19,575,479$ 14,460,489$ 14,898,434$ 13,969,082$ 13,898,395$ 12,338,872$ 13,623,111$ 13,695,106$ Interest on long-term debt 39,448 57,035 62,934 54,373 62,800 71,305 14,843 15,481 22,086 26,849
Total primary governmentexpenses 17,987,455 17,407,355 19,638,413 14,514,862 14,961,234 14,040,387 13,913,238 12,354,353 13,645,197 13,721,955
Program revenuesGovernmental activities
Charges for services 3,251,501 3,366,345 3,001,437 3,589,703 3,346,335 3,775,525 3,542,235 2,716,022 2,852,592 2,732,185 Capital grants and operations - - - - - - - - 116,789 89,512
Total primary government program revenues 3,251,501 3,366,345 3,001,437 3,589,703 3,346,335 3,775,525 3,542,235 2,716,022 2,969,381 2,821,697
Net(expense)/revenue:Total primary government
net expense (14,735,954) (14,041,010) (16,636,976) (10,925,159) (11,614,899) (10,264,862) (10,371,003) (9,638,331) (10,675,816) (10,900,258)
General Revenue and Other Changes in Net position
Governmental activities:Property taxes 14,165,985 13,693,634 12,506,631 11,795,526 10,195,346 9,299,936 8,052,016 8,123,048 10,162,953 12,244,504 Fire district assistance tax 364,331 335,932 328,039 325,319 343,729 325,393 355,533 395,975 389,361 394,571 Investment earnings 108,453 62,066 21,581 18,187 14,214 18,697 16,322 14,275 24,595 22,594 Other 115,248 117,912 178,156 280,843 240,246 203,551 103,418 90,357 182,436 217,426 Gain (loss) on sale of capital assets - - - - - - - (107,796) (95,847) (21,599)
Total primary government 14,754,017 14,209,544 13,034,407 12,419,875 10,793,535 9,847,577 8,527,289 8,515,859 10,663,498 12,857,496
Change in Net PositionTotal primary government 18,063$ 168,534$ (3,602,569)$ 1,494,716$ (821,364)$ (417,285)$ (1,843,714)$ (1,122,472)$ (12,318)$ 1,957,238$
Sedona Fire DistrictChanges in Net Position
Last ten (10) fiscal years (as of June 30)(accrual basis of accounting)
48
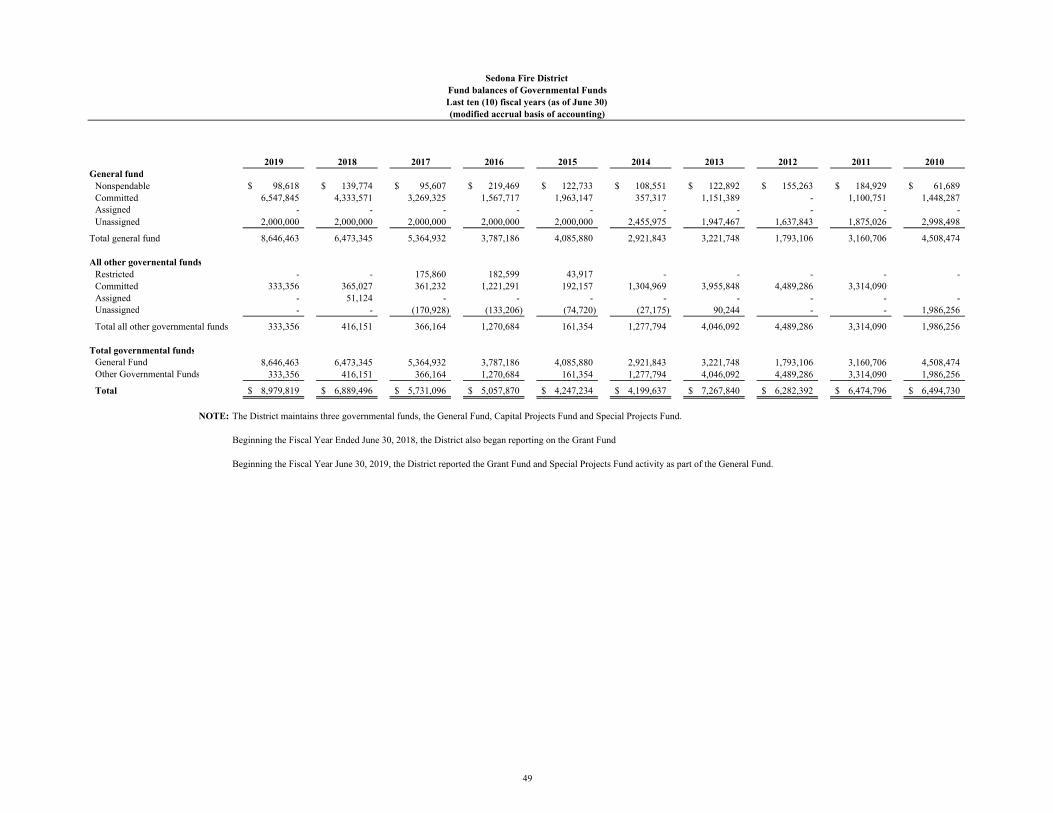
2019 2018 2017 2016 2015 2014 2013 2012 2011 2010General fund
Nonspendable 98,618$ 139,774$ 95,607$ 219,469$ 122,733$ 108,551$ 122,892$ 155,263$ 184,929$ 61,689$ Committed 6,547,845 4,333,571 3,269,325 1,567,717 1,963,147 357,317 1,151,389 - 1,100,751 1,448,287 Assigned - - - - - - - - - - Unassigned 2,000,000 2,000,000 2,000,000 2,000,000 2,000,000 2,455,975 1,947,467 1,637,843 1,875,026 2,998,498
Total general fund 8,646,463 6,473,345 5,364,932 3,787,186 4,085,880 2,921,843 3,221,748 1,793,106 3,160,706 4,508,474
All other governental fundsRestricted - - 175,860 182,599 43,917 - - - - - Committed 333,356 365,027 361,232 1,221,291 192,157 1,304,969 3,955,848 4,489,286 3,314,090 Assigned - 51,124 - - - - - - - - Unassigned - - (170,928) (133,206) (74,720) (27,175) 90,244 - - 1,986,256
Total all other governmental funds 333,356 416,151 366,164 1,270,684 161,354 1,277,794 4,046,092 4,489,286 3,314,090 1,986,256
Total governmental fundsGeneral Fund 8,646,463 6,473,345 5,364,932 3,787,186 4,085,880 2,921,843 3,221,748 1,793,106 3,160,706 4,508,474 Other Governmental Funds 333,356 416,151 366,164 1,270,684 161,354 1,277,794 4,046,092 4,489,286 3,314,090 1,986,256
Total 8,979,819$ 6,889,496$ 5,731,096$ 5,057,870$ 4,247,234$ 4,199,637$ 7,267,840$ 6,282,392$ 6,474,796$ 6,494,730$
NOTE: The District maintains three governmental funds, the General Fund, Capital Projects Fund and Special Projects Fund.
Beginning the Fiscal Year Ended June 30, 2018, the District also began reporting on the Grant Fund
Beginning the Fiscal Year June 30, 2019, the District reported the Grant Fund and Special Projects Fund activity as part of the General Fund.
Sedona Fire DistrictFund balances of Governmental FundsLast ten (10) fiscal years (as of June 30)(modified accrual basis of accounting)
49
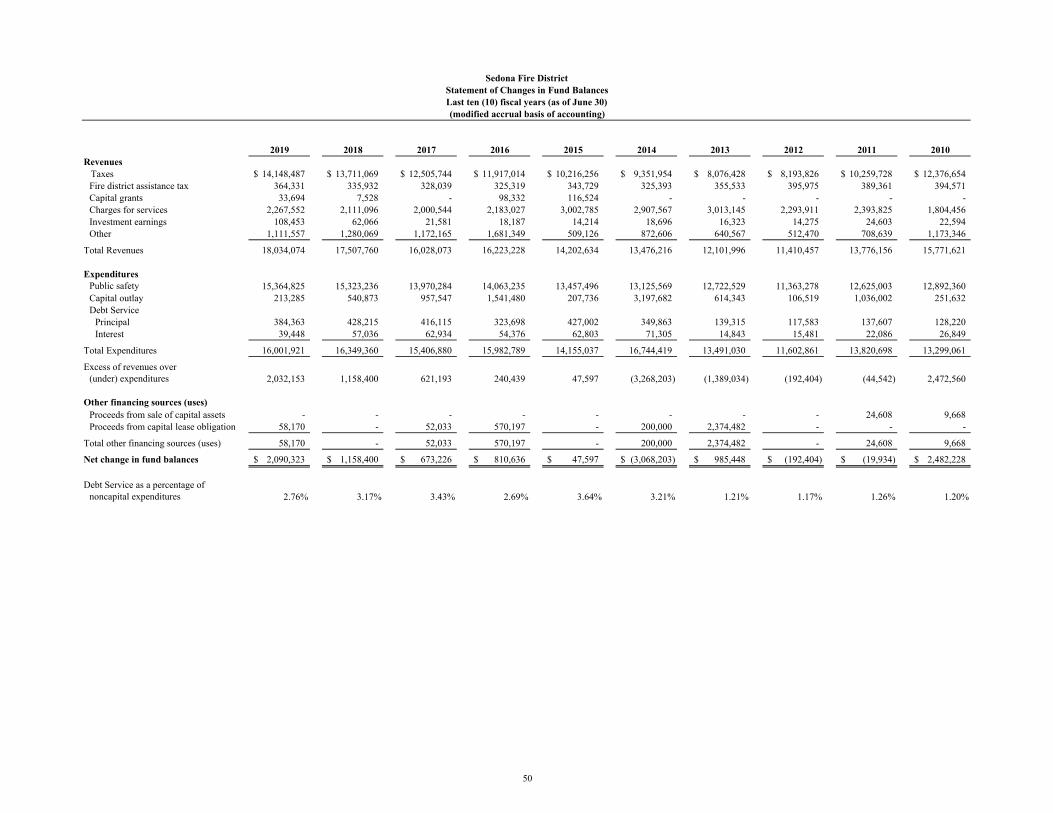
2019 2018 2017 2016 2015 2014 2013 2012 2011 2010Revenues Taxes 14,148,487$ 13,711,069$ 12,505,744$ 11,917,014$ 10,216,256$ 9,351,954$ 8,076,428$ 8,193,826$ 10,259,728$ 12,376,654$
Fire district assistance tax 364,331 335,932 328,039 325,319 343,729 325,393 355,533 395,975 389,361 394,571 Capital grants 33,694 7,528 - 98,332 116,524 - - - - - Charges for services 2,267,552 2,111,096 2,000,544 2,183,027 3,002,785 2,907,567 3,013,145 2,293,911 2,393,825 1,804,456 Investment earnings 108,453 62,066 21,581 18,187 14,214 18,696 16,323 14,275 24,603 22,594 Other 1,111,557 1,280,069 1,172,165 1,681,349 509,126 872,606 640,567 512,470 708,639 1,173,346
Total Revenues 18,034,074 17,507,760 16,028,073 16,223,228 14,202,634 13,476,216 12,101,996 11,410,457 13,776,156 15,771,621
ExpendituresPublic safety 15,364,825 15,323,236 13,970,284 14,063,235 13,457,496 13,125,569 12,722,529 11,363,278 12,625,003 12,892,360 Capital outlay 213,285 540,873 957,547 1,541,480 207,736 3,197,682 614,343 106,519 1,036,002 251,632 Debt Service
Principal 384,363 428,215 416,115 323,698 427,002 349,863 139,315 117,583 137,607 128,220 Interest 39,448 57,036 62,934 54,376 62,803 71,305 14,843 15,481 22,086 26,849
Total Expenditures 16,001,921 16,349,360 15,406,880 15,982,789 14,155,037 16,744,419 13,491,030 11,602,861 13,820,698 13,299,061
Excess of revenues over(under) expenditures 2,032,153 1,158,400 621,193 240,439 47,597 (3,268,203) (1,389,034) (192,404) (44,542) 2,472,560
Other financing sources (uses)Proceeds from sale of capital assets - - - - - - - - 24,608 9,668 Proceeds from capital lease obligation 58,170 - 52,033 570,197 - 200,000 2,374,482 - - -
Total other financing sources (uses) 58,170 - 52,033 570,197 - 200,000 2,374,482 - 24,608 9,668
Net change in fund balances 2,090,323$ 1,158,400$ 673,226$ 810,636$ 47,597$ (3,068,203)$ 985,448$ (192,404)$ (19,934)$ 2,482,228$
Debt Service as a percentage ofnoncapital expenditures 2.76% 3.17% 3.43% 2.69% 3.64% 3.21% 1.21% 1.17% 1.26% 1.20%
Sedona Fire DistrictStatement of Changes in Fund BalancesLast ten (10) fiscal years (as of June 30)(modified accrual basis of accounting)
50
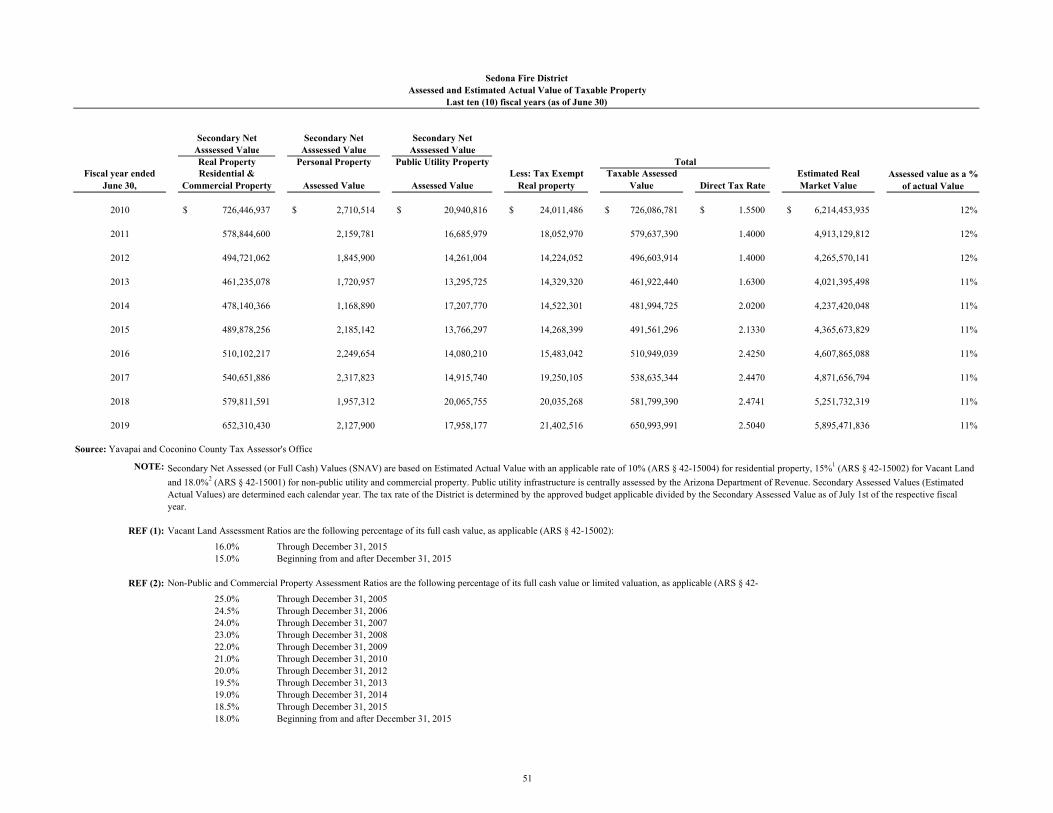
Secondary Net Secondary Net Secondary NetAsssessed Value Asssessed Value Asssessed ValueReal Property Personal Property Public Utility Property
Fiscal year endedJune 30,
Residential &Commercial Property Assessed Value Assessed Value
Less: Tax Exempt Real property
Taxable Assessed Value Direct Tax Rate
Estimated Real Market Value
2010 726,446,937$ 2,710,514$ 20,940,816$ 24,011,486$ 726,086,781$ 1.5500$ 6,214,453,935$ 12%
2011 578,844,600 2,159,781 16,685,979 18,052,970 579,637,390 1.4000 4,913,129,812 12%
2012 494,721,062 1,845,900 14,261,004 14,224,052 496,603,914 1.4000 4,265,570,141 12%
2013 461,235,078 1,720,957 13,295,725 14,329,320 461,922,440 1.6300 4,021,395,498 11%
2014 478,140,366 1,168,890 17,207,770 14,522,301 481,994,725 2.0200 4,237,420,048 11%
2015 489,878,256 2,185,142 13,766,297 14,268,399 491,561,296 2.1330 4,365,673,829 11%
2016 510,102,217 2,249,654 14,080,210 15,483,042 510,949,039 2.4250 4,607,865,088 11%
2017 540,651,886 2,317,823 14,915,740 19,250,105 538,635,344 2.4470 4,871,656,794 11%
2018 579,811,591 1,957,312 20,065,755 20,035,268 581,799,390 2.4741 5,251,732,319 11%
2019 652,310,430 2,127,900 17,958,177 21,402,516 650,993,991 2.5040 5,895,471,836 11%
Source: Yavapai and Coconino County Tax Assessor's Office
NOTE:
REF (1):
16.0%15.0%
REF (2):
25.0%24.5%24.0%23.0%22.0%21.0%20.0%19.5%19.0%18.5%18.0% Beginning from and after December 31, 2015
Through December 31, 2010Through December 31, 2012Through December 31, 2013Through December 31, 2014Through December 31, 2015
Through December 31, 2005Through December 31, 2006Through December 31, 2007Through December 31, 2008Through December 31, 2009
Secondary Net Assessed (or Full Cash) Values (SNAV) are based on Estimated Actual Value with an applicable rate of 10% (ARS § 42-15004) for residential property, 15%1 (ARS § 42-15002) for Vacant Land
and 18.0%2 (ARS § 42-15001) for non-public utility and commercial property. Public utility infrastructure is centrally assessed by the Arizona Department of Revenue. Secondary Assessed Values (Estimated Actual Values) are determined each calendar year. The tax rate of the District is determined by the approved budget applicable divided by the Secondary Assessed Value as of July 1st of the respective fiscal year.
Vacant Land Assessment Ratios are the following percentage of its full cash value, as applicable (ARS § 42-15002):
Through December 31, 2015Beginning from and after December 31, 2015
Non-Public and Commercial Property Assessment Ratios are the following percentage of its full cash value or limited valuation, as applicable (ARS § 42-
TotalAssessed value as a %
of actual Value
Sedona Fire DistrictAssessed and Estimated Actual Value of Taxable Property
Last ten (10) fiscal years (as of June 30)
51

DirectFiscal year ended
June 30,Sedona Fire
District Yavapai CountyCoconino County
School Equalization
Cottonwood Oak School District
Sedona Oak School District
Beaver Creek School District
Community College
Total Direct andoverlapping rates
2010 1.5500$ 2.7398$ 0.3973$ 0.3306$ 2.9118$ 1.2714$ 2.7423$ 0.3369$ 12.2801$
2011 1.4000 2.9134 0.3953 0.3564 2.9477 0.9671 2.8685 0.3352 12.1836
2012 1.4000 3.2838 0.4303 0.4259 3.7810 1.7689 3.5434 0.3649 14.9982
2013 1.6300 3.7868 0.4480 0.4717 4.0483 1.4144 3.7985 0.3875 15.9852
2014 2.0200 4.2672 0.5466 0.5123 4.1354 2.0619 4.8725 0.4636 18.8795
2015 2.1330 4.3275 0.5466 0.5123 4.3664 2.2260 4.6128 0.4788 19.2034
2016 2.4250 4.3092 0.5646 0.5089 4.6103 2.1256 4.7125 0.4864 19.7425
2017 2.4470 4.2476 0.5788 0.5010 4.1014 2.1914 4.6894 0.4909 19.2475
2018 2.4741 4.0113 0.5678 0.4875 4.0552 2.0085 4.3284 0.4816 18.4144
2019 2.5040 4.1601 0.5413 0.4566 4.1601 1.9305 4.1655 0.4592 18.3773
Source: Yavapai and Coconino County Tax Assessor
NOTE:
REF (1):
Property Tax Rates - All Direct and Overlapping GovernmentsSedona Fire District
Arizona Revised Statute Title 48 limits the District's direct rate to a maximum of $3.25 1 per $100 of Secondary Net Assessed Value (SNAV). Additionally, changes in statute during the 2009 Legislative Session established further limits which impacted the maximum yearly increase in the tax levy (in dollars) for special districts in Arizona. This amount is based on a calculation which established a "base year" for special districts. The annual levy may not exceed the base year tax levy (2008 tax year), with consideration for new additions to the valuation base, plus 8% per year from the base year, in the aggregate.
During the 2012 50th legislature, Second Regular Session house Bill #2184 was passed providing for a temporary override under the heading of "County fire district assistance tax; levy limit 2012 through 2014". This temporary override allows fire districts that have experienced a combined net assessed valuation decline of twenty-five percent or more beginning with the 2008 valuation year, notwithstanding the tax rate limit established pursuant to section 48-807, subsection F, Arizona Revised Statutes, may adopt a tax rate not to exceed $3.75, provided the proceeds do not exceed the total levy received in the prior fiscal year. Furthermore, the increased tax rate shall not be used to fund salary increases or increase the number of full-time positions within the fire district. Fire Districts utilizing this override shall not call for an override election pursuant to section 48-807, subsection G, Arizona Revised Statutes.
Overlapping Rates
Last ten (10) fiscal years (as of June 30)
52

Taxpayer Type of Business Assessed Value% of Total
Assessed Value
ARIZONA PUBLIC SERVICE COMPANY Utility 8,258,682$ 1.27%NEW ENCHANTMENT LLC Recreation 6,308,717 0.97%HTS-CHC (SEDONA) LLC Church 5,618,192 0.86%90 RIDGE TRAIL DRIVE SEDONA Recreation 4,581,656 0.70%SEDONA VACATION CLUB Recreation 3,142,741 0.48%DIAMONDROCK AZ LA OWNER Recreation 2,790,824 0.43%POCO DIABLO RESORT LLC Recreation 2,479,451 0.38%SEDONA HOSPITALITY GROUP Hospitality 2,393,795 0.37%SEDONA ROUGE LLC Recreation 2,348,907 0.36%SIGNATURE RESORTS Recreation 1,992,979 0.31%
39,915,944$ 6.13%
Total Assessed Value 650,993,991$
Taxpayer Type of Business Assessed Value% of Total
Assessed Value
ARIZONA PUBLIC SERVICE COMPANY Utility 8,041,706$ 1.11%NEW ENCHANTMENT LLC Recreation 7,377,994 1.02%HTS-CHC (SEDONA) LLC Church 5,646,371 0.78%MASSACHUSETTS MUTUAL LIFE Insurance 4,554,206 0.63%POCO DIABLO RESORT LLC Recreation 3,423,255 0.47%ILX ACQUISITION INC Recreation 3,409,645 0.47%L'AUBERGE ORCHARDS LLC Recreation 3,265,384 0.45%AMARA RESORT SPE LLC Recreation 2,980,773 0.41%TLAQ PARTNERS LLC Recreation 2,499,488 0.34%RAMS SHOPPING CENTER LLC Retail 2,372,036 0.33%
43,570,858$ 6.00%
Total Assessed Value 726,086,781$
Source: Yavapai and Coconino County Assessor
June 30, 2019
June 30, 2010
Sedona Fire DistrictPrincipal Property TaxpayersCurrent and Nine Years Ago
53

Fiscal year endedJune 30,
Original Property Tax
LevyTax Roll
CorrectionsProperty Tax
Levy (Adjusted) Amount % of Levy
Collections in Subsequent
Years Amount % of Levy
2010 12,450,679$ (9,793)$ 12,440,886$ 11,968,142$ 96.20% 453,086$ [1] 12,421,228$ 99.84%
2011 10,164,437 (18,571) 10,145,866 9,873,294 97.31% 266,180 [1] 10,139,474 99.94%
2012 8,094,341 (15,203) 8,079,138 7,819,660 96.79% 244,666 8,064,326 99.82%
2013 8,061,882 (4,628) 8,057,254 7,872,135 97.70% 174,465 8,046,600 99.87%
2014 9,334,409 (15,510) 9,318,899 9,158,865 98.28% 153,495 9,312,360 99.93%
2015 10,219,722 (2,452) 10,217,270 10,042,492 98.29% 170,300 10,212,792 99.96%
2016 11,923,256 (5,090) 11,918,166 11,722,392 98.36% 193,868 11,916,260 99.98%
2017 12,519,018 (11,918) 12,507,100 12,221,265 97.71% 285,247 12,506,512 100.00%
2018 13,695,785 (1,472) 13,694,313 13,504,763 98.62% 144,887 13,649,650 99.67%
2019 13,970,502 2,133 13,972,635 13,797,552 98.75% 75,488 [2] 13,873,040 99.29%
Source: Yavapai and Coconino County Treasurer
[1] Subsequent period collections for Coconino County are not available for this time period.
[2] This amount represents collections through August 31, 2019
Collected within the Fiscal Year of Levy
Sedona Fire DistrictProperty Tax Levies and Collections
Last ten (10) fiscal years (as of June 30)
54
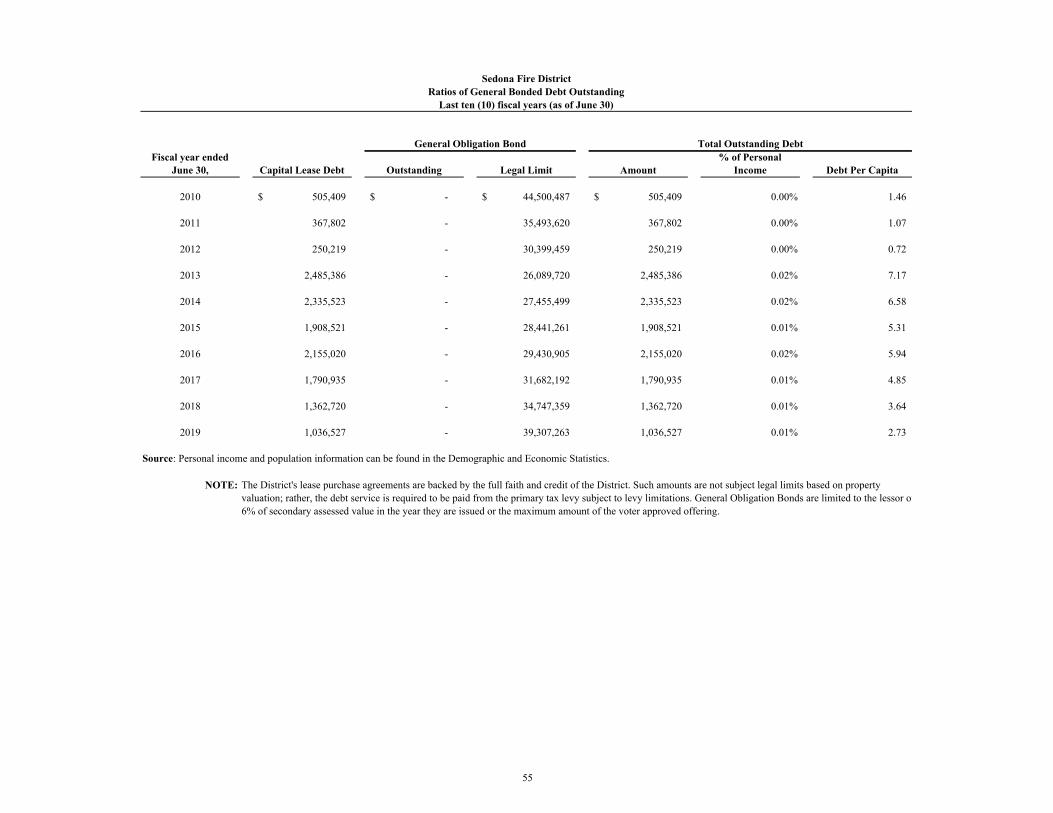
Fiscal year endedJune 30, Capital Lease Debt Outstanding Legal Limit Amount
% of Personal Income Debt Per Capita
2010 505,409$ -$ 44,500,487$ 505,409$ 0.00% 1.46
2011 367,802 - 35,493,620 367,802 0.00% 1.07
2012 250,219 - 30,399,459 250,219 0.00% 0.72
2013 2,485,386 - 26,089,720 2,485,386 0.02% 7.17
2014 2,335,523 - 27,455,499 2,335,523 0.02% 6.58
2015 1,908,521 - 28,441,261 1,908,521 0.01% 5.31
2016 2,155,020 - 29,430,905 2,155,020 0.02% 5.94
2017 1,790,935 - 31,682,192 1,790,935 0.01% 4.85
2018 1,362,720 - 34,747,359 1,362,720 0.01% 3.64
2019 1,036,527 - 39,307,263 1,036,527 0.01% 2.73
Source: Personal income and population information can be found in the Demographic and Economic Statistics.
NOTE: The District's lease purchase agreements are backed by the full faith and credit of the District. Such amounts are not subject legal limits based on property valuation; rather, the debt service is required to be paid from the primary tax levy subject to levy limitations. General Obligation Bonds are limited to the lessor of6% of secondary assessed value in the year they are issued or the maximum amount of the voter approved offering.
General Obligation Bond Total Outstanding Debt
Sedona Fire DistrictRatios of General Bonded Debt Outstanding
Last ten (10) fiscal years (as of June 30)
55

Governmental UnitDebt Outstanding at
June 30, 2018*Estimated Percentage
ApplicableEstimated Share of Overlapping Debt
Debt repaid with property taxes:Yavapai County 17,065,890$ 100.00% 17,065,890$ Coconino County 8,084 100.00% 8,084 Cottonwood Oak School District 13,975,000 100.00% 13,975,000 Sedona Oak School District 58,190,000 100.00% 58,190,000 Coconino Community College 2,120,000 100.00% 2,120,000
Subtotal, overlapping debt 91,358,974 Sedona Fire District 1,036,527
Total Direct and overlapping debt 92,395,501$
Source: Arizona Department of Administration
* Outstanding debt as of June 30, 2018 is the most recent information available.
Note: Overlapping governments are those that coincide, at least in part, with the geographical boundries of the District. This Schedule estiamtes the portion of the outstanding debt of those overlapping governments that is borne by the residents and business of the District. The process recognizes that, when considering the District's ability to issue and repay long-term debt, the entire debt burden borne by the residents and businesses should be taken into account. However, this does not imply that every taxpayer is a resident, and therefore responsible for repaying the debt, of each overlapping government.
Sedona Fire DistrictDirect and Overlapping Governmental Activities Debt
56

2019 2018 2017 2016 2015 2014 2013 2012 2011 2010
Assessed Value 672,396,507$ 601,834,658$ 557,885,449$ 526,432,081$ 505,829,695$ 496,517,026$ 476,251,760$ 510,827,966$ 597,690,360$ 750,098,267$
Debt limit rate 6% 6% 6% 6% 6% 6% 6% 6% 6% 6%
Debt Limit 40,343,790 36,110,079 33,473,127 31,585,925 30,349,782 29,791,022 28,575,106 30,649,678 35,861,422 45,005,896 Less lease obligations (1,036,527) (1,362,720) (1,790,935) (2,155,020) (1,908,521) (2,335,523) (2,485,386) (250,219) (367,802) (505,409)
Legal debt margin 39,307,263$ 34,747,359$ 31,682,192$ 29,430,905$ 28,441,261$ 27,455,499$ 26,089,720$ 30,399,459$ 35,493,620$ 44,500,487$
Total net debt applicable to thelimit as a percentage of debt limit 2.57% 3.77% 5.35% 6.82% 6.29% 7.84% 8.70% 0.82% 1.03% 1.12%
Sedona Fire DistrictLegal Debt Margin Information
Last ten (10) fiscal years (as of June 30)
57
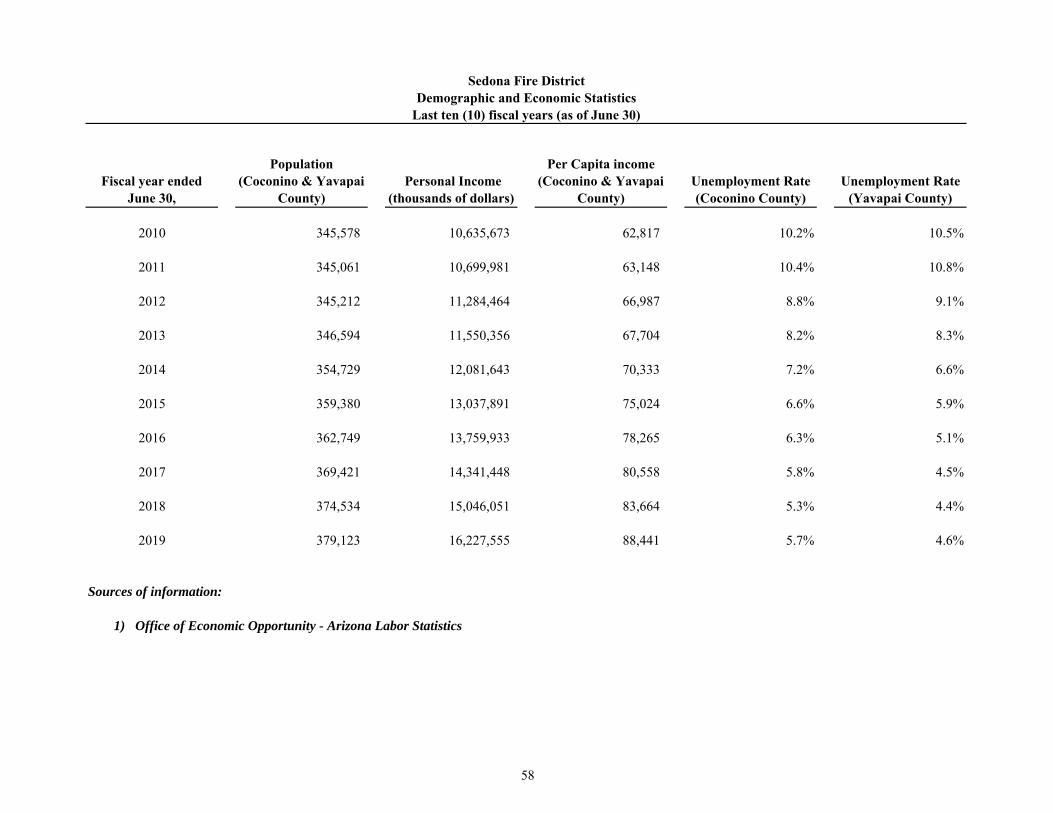
Fiscal year endedJune 30,
Population(Coconino & Yavapai
County) Personal Income
(thousands of dollars)
Per Capita income(Coconino & Yavapai
County)Unemployment Rate(Coconino County)
Unemployment Rate(Yavapai County)
2010 345,578 10,635,673 62,817 10.2% 10.5%
2011 345,061 10,699,981 63,148 10.4% 10.8%
2012 345,212 11,284,464 66,987 8.8% 9.1%
2013 346,594 11,550,356 67,704 8.2% 8.3%
2014 354,729 12,081,643 70,333 7.2% 6.6%
2015 359,380 13,037,891 75,024 6.6% 5.9%
2016 362,749 13,759,933 78,265 6.3% 5.1%
2017 369,421 14,341,448 80,558 5.8% 4.5%
2018 374,534 15,046,051 83,664 5.3% 4.4%
2019 379,123 16,227,555 88,441 5.7% 4.6%
Sources of information:
1) Office of Economic Opportunity - Arizona Labor Statistics
Sedona Fire DistrictDemographic and Economic Statistics
Last ten (10) fiscal years (as of June 30)
58

Employer Employees Rank Employees Rank
Enchantment Resorts 567 1 383 2 Diamond Resorts 301 2 - L'Auberge De Sedona Resort 241 3 180 5 Hilton Resort & Spa 198 4 193 4 Pink Jeep Tours 169 5 125 7 Sedona/Oak Creek School District 155 6 180 6 City of Sedona 105 7 100 8 Amara Resort 100 8 - Sedona Center Properties 97 9 - Kachina Point Rehabilitation Hospital 85 10 - Sunterra Resorts - 400 1 Los Abrigados - 275 3 Radisson Resort - 99 9 Sedona Rouge - 98 10
Total 2,018 2,033
Source: Estimate of various employers and sources
Sedona Fire DistrictPrincipal Employers
Current and Nine Years Ago
June 30, 2019 June 30, 2010
59

Function 2019 2018 2017 2016 2015 2014 2013 2012 2011 2010
Public SafetyEmergency medical service calls 3,047 3,146 2,981 3,234 3,115 2,835 2,655 2,731 2,713 2,776 Fire responses 63 95 65 59 51 72 77 88 85 85 Other resonses - including hazardous
materials, mutual aid, public service 797 847 854 819 781 744 770 807 798 595 Miscellaneous - including false alarms,
good intent 480 424 389 353 406 392 320 277 355 348
Total Incidents 4,387 4,512 4,289 4,465 4,353 4,043 3,822 3,903 3,951 3,804
Source: Various District departments
Sedona Fire DistrictOperating Indicators by Function
Last ten fiscal years
60

Function 2019 2018 2017 2016 2015 2014 2013 2012 2011 2010
Public SafetyFire and rescue service 75 80 76 73 75 79 78 69 70 73 Fire Prevention 2 3 2 1 2 2 2 1 2 3 Administrative and support 16 15 15 17 25 25 27 30 31 38
Total 93 98 93 91 102 106 106 100 103 113
Source: District HR department
Sedona Fire DistrictFull-Time Equivalent Employees by Function
Last ten fiscal years
61

Function 2019 2018 2017 2016 2015 2014 2013 2012 2011 2010
Public SafetyStations 8 8 8 8 8 8 8 8 8 8 Equipment:
Engines 7 7 7 7 7 7 7 7 7 7 Ladder Trucks 1 1 1 1 1 1 1 1 1 1 Brush rigs 3 3 3 3 3 3 3 3 3 3 Rescue units 1 1 1 1 1 1 1 1 1 1 Tenders 3 3 3 3 3 3 3 3 3 4 Squad/support units 1 1 1 1 1 1 1 1 1 1
Source: District logistics department
Sedona Fire DistrictCapital Asset Statistics by Function
Last ten fiscal years
62