comprehensive business review
TRANSCRIPT

Unforgettable Business Learning
ComprehensiveBusiness ReviewConcepts and Caseswith Capstone® Business Simulation

ComprehensiveBusiness ReviewConcepts and Caseswith Capstone® Business Simulation
Unforgettable Business Learning

Copyright © 2019 by Capsim Management Simulations, Inc.Edited by Wendy Guest.All rights reserved. No part of this publication may be reproduced, distributed, or transmitted in any form or by any means, including photocopying, recording, or other electronic or mechanical methods, without the prior written permission of the publisher, except in the case of brief quotations embodied in critical reviews and certain other noncommercial uses permitted by copyright law. For permission requests, write to the publisher, addressed “Attention: Content Manager,” at the address below.
All trademarks, service marks, registered trademarks, and registered service marks are the property of their respective owners and are used herein for identification purposes only.
Capsim Management Simulations, Inc., 55 East Monroe, Suite 3210Chicago, Illinois 60603+1(312) 477-7200www.capsim.com
Table of ContentsChapter 1Overview: What Is a Business? ...................................................................................................................................5
Chapter 2Marketing: How Do We Identify, Entice, and Add Value for Customers? ................................................ 13
Chapter 3Production: How Does a Business Create Goods and Services to Sell? ................................................. 23
Chapter 4Accounting: How Do We Keep Track of the Money? ...................................................................................... 32
Chapter 5Finance: How Do We Raise Funds, Reward Shareholders, and Manage Our Assets? .......................43
Chapter 6Strategy: Strategy and the Strategic Management Process ........................................................................ 59
Chapter 7Strategy: Evaluating the Internal and External Business Environment ................................................... 76
Chapter 8Strategy: Cost Leadership and Differentiation .................................................................................................. 88
Chapter 9Ethics: Doing It Right—Social Responsibility and Ethical Decision-Making ..........................................99
Chapter 10Selling Your Company and Making Brilliant Business Presentations ......................................................... 111
Index ..............................................................................................................119
Part 2 Case Stories Application in Capstone versus Real-World Application ......... 123
Why Is Purchasing Capacity More Expensive Than Running a Second Shift? ....................................124
What Impact Does Reliability Have on My Material Costs? ........................................................................ 125
Why Does the Age Change Based on My Product Revisions? ..................................................................126
How Can I Capitalize on Situations with Unmet Demand? ........................................................................ 127
Why Does It Cost More per Unit to Add a Second Shift? ............................................................................128
Why Is It Best to Fund Major Investments with Long-Term Financing? .................................................129

How Can We Build a Perfect Product That Is Profitable? ........................................................................... 130
Why Does Automation Increase My R&D Cycle Time? ..................................................................................131
Why Are My Sales Lower Than the Competition Even with a Higher Customer Satisfaction Score? .......... 132
Why Can’t I Revise My Product in R&D? .............................................................................................................133
Part 3Mini Case Studies .................................................................................................. 134
Introduction ...................................................................................................................................................................135
Strategy: Low Cost versus Legacy—Definitions Get Cloudy ......................................................................136
R&D: Wearables Offer Lessons for NPIs .............................................................................................................138
Marketing: Dollar Shave Club’s Big Draw for ...................................................................................................139
Unilever—the Brand ....................................................................................................................................................139
Production: Can Tesla Achieve Economies of Scale and Keep Its Promise? .........................................141
Finance: Why the Rules Are the Rules ................................................................................................................143
Part 4Concepts and Context: Capstone beyond the Numbers ................................. 145
Capstone Case Study 1: We’re Moving! .............................................................................................................. 146
Capstone Case Study 2: Give Me a High-End Product .................................................................................148
Capstone Case Study 3: Porter’s Five Forces .................................................................................................. 150
Capstone Case Study 4: Bring in the Bots ......................................................................................................... 152
Capstone Case Study 5: Surviving a Downturn ...............................................................................................154
Part 5Projects for Capstone Teams Created by William J. Ritchie, PhD ................. 155
TOP MANAGEMENT TEAM FORMATION
Introduction ...................................................................................................................................................................156
Project 1 ........................................................................................................................................................................... 157
Project 2 ..........................................................................................................................................................................158
Project 3 ..........................................................................................................................................................................159
Project 4 ......................................................................................................................................................................... 160

Project 5 ..........................................................................................................................................................................162
Project 6 ..........................................................................................................................................................................163
Project 7 ......................................................................................................................................................................... 164
Project 8 ..........................................................................................................................................................................165
ENVIRONMENTAL SCANNING
Project 9 ..........................................................................................................................................................................167
Project 10 ........................................................................................................................................................................168
Project 11 ..........................................................................................................................................................................169
STRATEGY FORMULATION
Project 12 .........................................................................................................................................................................170
Project 13 .......................................................................................................................................................................... 171
Project 14 ......................................................................................................................................................................... 173
Project 15 ......................................................................................................................................................................... 175
STRATEGY IMPLEMENTATION
Project 16 ......................................................................................................................................................................... 177
Project 17 .........................................................................................................................................................................178
Project 18 .........................................................................................................................................................................184
EVALUATION AND CONTROL
Project 19 .........................................................................................................................................................................187
Project 20 .......................................................................................................................................................................188
Project 21 ........................................................................................................................................................................ 190
Project 22 .........................................................................................................................................................................191
PRESENTATION EVALUATION FORMS
Appendix A ....................................................................................................................................................................192
Appendix B .....................................................................................................................................................................193
Appendix C ................................................................................................................................................................... 194


Introduction • 1
Introduction
Most entrepreneurs learn business this way: they get started, they work, and they learn through trial and error. Capstone® Business Simulation takes the same approach: it teaches business through the experience of managing a
business.
Over the past century or so, the study of business has defined, analyzed, labeled, and theorized all the elements that make businesses successful. Business education has helped millions of people manage their businesses better. But every business is a hands-on enterprise. Business Basics with Capstone Business Simulation is a primer to help you work with the concepts of business theory while you explore how to apply them in practice. If there were a single true theory of business success, then every person who started a business and followed the theory would be able to create a profitable and sustainable enterprise. Unfortunately, it’s not that simple. Business requires the practical application of people, skills, ideas, and money, and it requires some trial and error before you succeed. Second, it is in that process of trial and error that mastery develops. If you want to master the basics of business, rather than learn only the theory, this program is for you.
Capstone is your chance to work with key managerial functions like marketing, production, and finance but, more importantly, to experience the interactions between those functions inside the business and also the interrelationships between the business, its markets, and its external stakeholders.
It starts with an idea . . .
Every business starts with the three basic resources it needs to function and compete: ideas, people, and money. In the business world, these resources are configured and reconfigured over and over again to satisfy the needs and wants of the market.
Sometimes businesses are based on a brilliant idea that completely changes how we do something—look at how smartphones revolutionized the way we find, manage, and communicate information. Sometimes businesses find a new way to make us want more of what we already have—like new clothes for this season’s fashion trends. Some businesses continually improve on a basic product—whether it’s cars, light bulbs, fabricated steel, or dishwasher detergent. Sometimes we’re sold emotions—by the entertainment industry, for example—or services, like haircuts or gym memberships. Whatever the business, it begins with an idea.
. . . add some good management
Of course, individual brilliance, great ideas, even revolutionary technologies are only parts of the equation. The real art of business is getting the basic resources—ideas, people, and money—to work together as a growing, functional operation. Building a business requires recognizing and managing the network of interrelationships inherent in getting your product to market at a profit.
Within the endless possibilities of business, there are standard elements and practices—like accounting to keep track of the money, marketing to get people to buy, and production to put your product or service into the customers’ hands. These maintain the company’s legal, financial, practical, and ethical balance and have to be managed.
The roots of the word manage come from the Latin word manus agere (to lead by hand) or mansionem agere (to run the house for the owner). The dictionary defines management as “the person or persons controlling and directing the affairs of a business or institution.” It is the people who have their hands on the controls of the organization. In Capstone Business Simulation, you will get your hands on some critical management tools and begin to build your skills using them. These tools include accounting statements, forecasts, market data, and more—all applied to the task of creating and managing a successful enterprise.
The forms that businesses take might be limitless, but the essence of how to run a company remains the same. The company you will run in this course designs, builds, and sells electronic sensors, but our goal is not to learn about sensors; it’s to build the skills you need to effectively manage a business—any business organization.
. . . and develop mastery.
The good news is that brilliant and successful businesspeople—whether it’s Mukesh Ambani, Bill Gates, Rupert Murdoch, or Mark Zuckerberg—were not born with a “business success” gene. The bad news is that like all successful businesspeople, they devoted thousands and thousands of hours to their goals—trying and failing, learning from mistakes, and trying again. While many of us have the right attributes to be successful in business, not all of us are willing to invest the time. To become expert in any field, we need to engage in what’s sometimes called deep practice.
Simulations and Deep Practice
Simulations are designed to offer focused opportunities for deep practice, which is why they are often more effective than passive tools such as textbooks, videos, or lectures.
Think of “deep practice” as different from “ordinary practice.” Commuters who drive to school or work might accumulate thousands of hours of driving, but it doesn’t make them expert drivers. The key to deep practice is self-awareness, or paying attention to what you are doing well and not so well. This is so important to learning that scientists have a specific term for it—“metacognition,” or thinking about the way you think and learn.
Deep practice has the following characteristics:• It is intentional. You are consciously seeking improvement as you practice.
• It is at the limits of your present capability.
• You fail. Often. If you didn’t, you wouldn’t be at the limits of your capability. You try again.
• You are seeking incremental improvement in each practice session, not breakthroughs.
• You are practicing the right things, not the wrong things. This often requires a coach.
• You have a feedback system in place, one that tells you when you are right and when you are wrong.
Simulations work because they are hands-on experiences that mimic the real world. Well-designed simulations, such as Capstone, present you with problems at the limits of your capabilities, offer positive and negative feedback, and have a “coach” so you can work your brain in a way that builds your business skills. Throughout the training, you’ll witness incremental improvements in yourself over time.
Here’s a list of “dos and don’ts” to help you use the simulation to develop your business acumen, just as you might use the gym to build muscle.
Dos:• Feedback is critically important to deep practice. The simulation delivers it via your online interface and in your reports.
Both positive feedback and negative feedback are important. When the results come in, compare your expectations with the actual results. Why were you right? Why were you wrong? This applies when your results are both better than expected and worse than expected.
• Focus on your portion of the company’s decisions in each round. In sports, a player may spend a day of practice on only one skill. The same principle applies to business acumen and management skills.

Introduction • 3
• Add a new skill in each round such as pricing for products, sales forecasting, production analysis, financial modeling, and so forth.
• Practice old skills as well as the new skill.
• Use your coaches. These include your instructor, of course, but also the automated coaches that produce the end of round report available on your interface. If you encounter something you don’t understand, the answer is probably in the online support system or you can contact [email protected].
Don’ts:• Don’t treat failure as a bad thing—it’s valuable, and it means that you’re practicing at the limits of your ability. Olympic
ice skaters might fall 20,000 times on their way to a gold medal. The skaters practice at their limits, focusing on the movements that make them fall because failure is feedback. An emergency loan, a stock-out, a capacity shortage—simulations are designed to highlight these mistakes; but what matters is the questions you follow up with, like “What led to that failure?” and “How can I avoid it in the future?”
• Do the work yourself. Don’t seek help from past or present students. That would be like going to the gym to watch other people work out.
• Don’t be concerned about the confusion you feel at the beginning of the simulation. Of course you’re confused—you’ve never run a multimillion dollar company before! Trust the process. The confusion will fade.
• Don’t focus on your mistakes. Learn and move on, or the angst might block your growth. Hard as it is to accept, if you’re not looking bad, you are not growing.
So let’s begin.
The best way to learn is to try, fail, try again, and be persistent! Our hope
is that you’ll find this a fun learning experience that will motivate you to
continue to develop your business management skills.


Chapter 1: Overview: What Is a Business? • 5
Chapter 1Overview: What Is a Business?LEARNING GOALS
After reading this chapter you will be able to:• Define what a business represents and why businesses exist.
• Define essential business concepts, including products, services, profits, and stakeholders.
• Describe the major functions of business.
• Discuss the role of management in business success.
• Differentiate between performance effectiveness and efficiency.
• Describe the enterprise system and how it relates to business.
• Differentiate between internal and external stakeholders.
• Discuss key market concepts such as specialization, uncertainty, and risk.
• Compare and contrast economic and opportunity costs.
• Describe the differences between financial and managerial accounting.
What Is a Business?
A business can be defined as any organization that provides products, services, or both to individual consumers or to other organizations. The essential role of a business is to create products or offer services that satisfy customer needs
or wants. Whether creating smartphones or offering home delivery of groceries, businesses could not exist without someone desiring their products or services.
Let us start with some basic definitions of essential concepts:• Product: A good that has tangible characteristics and that provides satisfaction or benefits (e.g., an automobile).
• Service: An activity that has intangible characteristics and that provides satisfaction or benefits (e.g., a mechanic performing automotive repair).
• Profit: The basic goal of most businesses. Profit is the difference between what it costs to make and sell a product or service and what the customer pays for it.
• Stakeholders: Groups of people who have a vested interest (a “stake”) in the actions a business might take. There are four major groups of stakeholders: (1) owners, (2) employees, (3) customers, and (4) society. The specific interests of each of these stakeholder groups may sometimes conflict with each other.
To summarize, a business sells products or services with the specific goal of making a profit and in the process has an impact on various stakeholders.
Business, however, is much more interesting than its definitions. As described in the introduction, every business requires three basic resources—people, ideas, and money—that are configured and reconfigured over and over again to satisfy the
6 • Comprehensive Business Review Concepts and Cases with Capstone® Business Simulation
needs and wants of customers. In this process, there may be winners and losers, cheaters, heroes, hard work, laughter, and tears. The theory of business may be straightforward, but the experience of business is an exciting, ever-changing story, as you will discover in the Capstone Business Simulation. Let’s look at the way businesses deploy their three important resources.
Business Functions and Functioning
Each business must employ people to entice customers, produce its products or services, organize workflow, plan to fund or pay for its operations, and more. Whatever type of business it is, the work that has to be done will typically fall into four basic “business functions.”
Marketing is all the activities designed to provide the goods and services that satisfy customers. These activities include market research, development of products, pricing, promotion, and distribution.
Production refers to the activities and processes used in making products or delivering services. These activities involve designing the production processes (investments in facilities and equipment) and the efficient management and operation of these processes.
Accounting is the process that tracks, summarizes, and analyzes a company’s financial position.
Finance refers to the activities concerned with funding a company and using resources effectively.
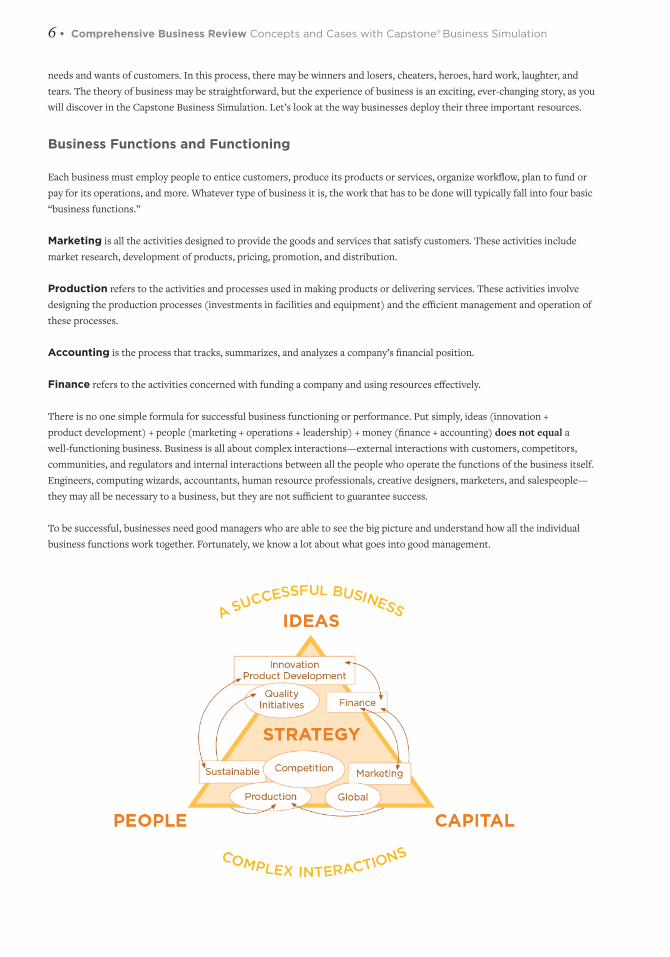
There is no one simple formula for successful business functioning or performance. Put simply, ideas (innovation + product development) + people (marketing + operations + leadership) + money (finance + accounting) does not equal a well-functioning business. Business is all about complex interactions—external interactions with customers, competitors, communities, and regulators and internal interactions between all the people who operate the functions of the business itself. Engineers, computing wizards, accountants, human resource professionals, creative designers, marketers, and salespeople—they may all be necessary to a business, but they are not sufficient to guarantee success.
To be successful, businesses need good managers who are able to see the big picture and understand how all the individual business functions work together. Fortunately, we know a lot about what goes into good management.
Chapter 1: Overview: What Is a Business? • 7
Managing a Business
As we discussed earlier, without customers a business would not be sustainable. This fact also applies to managers—without managers a business would wither and die. Successful management requires individuals who juggle the trade-offs and compromises necessary to keep a complex business moving along a clear strategic track. These individuals must also display intellectual flexibility to adjust to changing customer demands and be able to harness the impact of creative abrasion that results from dealing with various business stakeholders who often have colliding agendas that must be met in the drive for success, profitability, and sustainability.When we say “success,” however, what do we really mean? One useful way to think about success in management is that it entails the two Es of performance: effectiveness and efficiency. Performance effectiveness means doing the right thing. Performance efficiency means doing things right.
Being effective involves committing to a course of action that allows you to accomplish your goals. It is a measure of how appropriately and successfully your actions achieve your goal. Being efficient refers to employing the right processes to achieve the goal. Efficiency is measured by comparing the resources invested with the outcomes achieved.
Decisions that shape the marketing, production, and financial functions of a business are often made in environments that are specialized, complex, uncertain, and risky. Managing these functions requires planning, organizing, leading, and controlling all the important variables.
Planning: Determining what the organization needs to do and how to get it done.
Organizing: Arranging the organization’s resources and activities in such a way as to make it possible to accomplish the plan.
Leading: Implementing the plan, including guiding and motivating employees to work toward accomplishing the necessary tasks.
Controlling: Measuring and comparing performance to expectations established in the planning process and adjusting either the performance or the plan.
Regardless of the business functions or the types of managerial decisions to be made, effective and efficient management cannot be achieved without leadership. At higher levels of responsibility, people who may be referred to as chief executives or senior managers fill leadership roles. Of course, the more people, functions, and processes a company has, the more its senior management will need to align and coordinate management activities. You will have the opportunity to experience a plethora of management challenges in your simulated company, particularly if you are operating in a team where each team member, depending on his or her business function, will pursue different interests.
The Big Picture: The Enterprise System
Now that we’ve discussed some basics about business, business functions, and management, let’s look a little closer at the economic forces that impact business functioning.
Businesses operate within an overall economic system. To understand how, you need to know three key terms:
Market: A mechanism that facilitates the exchange of goods and services between buyers and sellers.Demand: The quantity of goods and services that consumers are willing to buy at different prices.Supply: The quantity of goods and services that businesses are willing to provide at those prices.
The terms of a sales transaction, or the quantity of goods traded and the trading price, are determined by the supply of and demand for any particular good or service. Economic systems are typically, but not always, embedded in a framework of activities that are carried out by mostly democratically elected representatives (the government) of a society within its geographic boundaries. Activities that serve society by fulfilling basic needs (e.g., roads, defense, security) or needs that

8 • Comprehensive Business Review Concepts and Cases with Capstone® Business Simulation
no other business can serve (e.g., judicial branches) are performed by public enterprises. Unlike public enterprises, the simulated company you will run in the Capstone simulation is a private enterprise. In private enterprise systems, individual citizens (rather than governments) own and operate the majority of businesses. Private enterprise systems require four essential conditions:
1. Private property
2. Freedom of choice
3. The right to keep profits
4. An environment where fair competition can occur
The theory underlying the private enterprise system is that competition among businesses will produce an efficient allocation of resources across the economy. Goods and services are desired where they produce the greatest benefit or are used most productively. Throughout this economic process, pressure is exerted from several areas. For example, there is pressure to lower prices and pressure to innovate through technological and procedural improvements.
When businesses compete in a private enterprise system, value is created for consumers. Customers are offered additional choices because businesses are motivated to innovate often through technological advancements to improve their offerings and make them more attractive. Innovation of processes, products, and services also motivates businesses to price their offerings attractively to position themselves for future and sustainable success.
Internal and External Stakeholders
Within an economic system are various groups with a stake in the way businesses operate. Earlier, we referred to these different groups as business stakeholders. All businesses will have stakeholders from the four categories we discussed. One way to categorize stakeholders is as internal or external to a business.
The key internal stakeholders are owners (stockholders/shareholders), who derive economic benefits when the business makes a profit and whose investments lose value when it doesn’t, and employees, who also derive economic benefits through wages but can experience additional benefits (training and experience) or disadvantages (exposure to toxins/accidents). The key external stakeholders are customers, who want the best product or service for the lowest possible price, and society at large that may be benefited (more jobs for more people leading to more tax revenue) or disadvantaged (toxic waste in the water system/market failures).
The private enterprise system needs laws to make corrections when markets do not produce outcomes desirable for the people who live in a society. The laws are set by governments elected to act on behalf of the whole society—and they are designed to protectall stakeholders according to a mutual sense of justice. In this sense, governments establish rules for the overall economic system designed to balance the needs of the society with the drivers of profit.
All areas of law or regulation that influence business practice contribute to our shared definition of fairness. Examples include establishing standards of conduct in negotiating contracts with a company’s buyers or suppliers, providing information (advertising) to consumers, providing information to potential investors, and negotiating with employees or their representatives.
To summarize, we have an overall economic system based on privately owned businesses, regulated to ensure the rights of all stakeholders are protected, and fueled by transactions between buyers and sellers in various markets. Next, let’s look at the notion of a market.
Chapter 1: Overview: What Is a Business? • 9
Markets—the Engine That Keeps It All Running
A market, according to our definition, is a mechanism that facilitates the exchange of goods and services between buyers and sellers. From cavemen trading stone tools for bison meat to the NASDAQ (an electronic market for buyers and sellers of stock), informal and formal markets have existed as long as human demand has been able to find a source of supply.
Some terms you’ll come across in relation to markets are specialization, uncertainty, and risk.
In an economic context, specialization is a measure of how broadly or narrowly the range of activities performed by a business is defined. A bicycle shop, for example, is a more specialized retail store than Walmart because the bicycle shop focuses on a narrow and deep range of products. Specialization creates an opportunity for greater efficiency and increased productivity. The division of tasks that comes with specialization introduces a need for coordination of those specialized tasks. These different levels of specialization and different kinds of coordinating mechanisms create a complex economic environment.
Specialization and Complexity – How Does That Look? It is a Sunday morning, and you decide to enjoy breakfast at a local café. Your need
is specialized and so is the café business serving breakfast. But think about the
complexity of the separate activities in different types of industries and markets that
have to be precisely coordinated to provide your breakfast experience: agriculture
(growing the tomatoes, collecting the eggs), transport (moving everything from
supplier to wholesaler to your table), grocery wholesaling (from the napkins to the
ketchup), construction (the building you are sitting in), furniture (the chair you are
sitting in), food service (cooks, kitchen hands, waitstaff), banking (lending money to
all of the other industries to keep them operating), entertainment (the music playing
in the background), and so forth. It’s a complex web of markets matching supply with
demand.
Markets are also characterized by uncertainty and risk. Uncertainty is not knowing an exact outcome or not being able to predict the exact consequences of a choice in a decision situation. The greater the uncertainty, the less you can know about the results of a particular choice. Decision-makers must work to reduce uncertainty by compiling as much relevant information as possible about a decision situation. Risk is also associated with the consequences of choice; therefore, risk is a measure of the significance of those decisions.
Uncertainty and Risk—How Does That Look? Think about tossing a coin. You cannot consistently predict when you flip a coin
whether it will land with the “head” or the “tail” side up. Not knowing which side will
land facing up is a form of uncertainty. Place a bet with a friend about which side will
land facing up, and the amount of the bet is a measure of the risk. If you bet 20 cents,
then the risk associated with the bet is small. If you are in the same economic position
and bet $100,000, then the risk associated with the bet is enormous.
Decision Making—the Critical Skill
When planning, organizing, operating, and controlling a company, decisions are constantly made, and the quality of those decisions determines, to a large extent, whether and how the company will achieve its goals. In today’s world of work, teams make the vast majority of strategic, high-impact decisions. These teams can range from product development teams and quality control teams to top management teams comprised of executives from each business function.
10 • Comprehensive Business Review Concepts and Cases with Capstone® Business Simulation
The process of defining problems and opportunities that merit attention, generating and evaluating alternative courses of action, and committing to the action that is most likely to produce the optimal result is one way to describe the decision-making process.
Decision-making also involves comparing the economic and opportunity rewards (benefits) and sacrifices (costs) involved in a course of action and committing to the one that best meets your goals. The objective is to make the parties involved “better off” than they were before the transaction took place. Typically, good decisions are commitments that help you accomplish your goals in whatever way you define them. Business decisions primarily focus on gaining economic rewards, which means there is an assumption that we only engage in transactions that offer the potential to improve our “position.” When we choose a course of action, it requires a sacrifice to obtain the reward. In economic terms, this sacrifice is called a “cost.” When evaluating alternative choices, a decision-maker considers two kinds of costs: the economic cost and the opportunity cost.
• An economic cost is the money spent implementing the decision.
• An opportunity cost is the cost of what you gave up doing when you committed to the chosen course of action.
Assessing opportunity costs is important to determine the true cost of any decision. Opportunity costs can measure anything that is of value. An opportunity cost is not the sum of the available alternatives, but rather the benefit of the best single alternative.If there is no explicit accounting or monetary cost attached to a course of action, ignoring opportunity costs may create an illusion that the benefits cost nothing at all, turning them into a hidden cost associated with that action. The opportunity cost of a company’s decision to build a new plant on vacant land the company owns, for example, is the loss of the land for another purpose, such as using it to build a facility to be leased to another business or to have access to the cash that could have been generated from selling the land. Only one set of choices is possible. Only one set of benefits is attainable.
Opportunity Cost – How Does That Look? Consider being offered two jobs. One offers $10,000 more in base salary but few
prospects for promotion. The other offers less money but has more opportunities
for promotion and future training. You have two choices: take the higher paying job
or the lower paying job. The economic cost of taking the second job is $10,000. The
opportunity cost of taking the first job is the chance for promotion, future training,
and higher pay in the future. In the long run, opportunity costs are often more
important than economic costs, but economic costs are generally easier to determine
than opportunity costs.
Accounting – Keeping Track of Financial Outcomes
Every business keeps track of its financial health through accounting. Accounting is a set of rules applied to a company’s financial records that allows owners and managers to monitor, analyze, and plan the finances of the business. In short, accounting deals with the business resource of “money,” which we discussed at the beginning of this chapter.
Whatever business you are in, the stakeholders in your business—and that, as we know, might be owners and shareholders, potential buyers, customers, or even the government’s tax office—need to have a consistent frame of reference for assessing the financial health of your company. That consistent frame of reference is the company’s financial reports. To understand the financial reports, however, we need to understand some of the basic principles that underpin the rules and principles of accounting.
There are two major types of accounting: financial accounting and management accounting.
Chapter 1: Overview: What Is a Business? • 11
Financial accounting produces the balance sheets, income statements, and cash flow statements that ensure external stakeholders can access the information they need. These stakeholders are usually people and groups outside the company who need accounting information to decide whether or not to engage in some activity with the company. This might include individual investors; stockbrokers and financial analysts who offer investment assistance; consultants; bankers; suppliers; labor unions; customers; local, state, and federal governments; and governments of foreign countries in which the company does business.
Management Accounting provides vital information about a company to internal users. Because it is for internal use, it does not have to conform to the restrictions of outside regulation and can be expressed in whatever way is most useful for managers. Information can be reported in dollars, units, hours worked, products manufactured, number of defective products, or the quantity of contracts signed. The job of a management accountant is to produce information that is relevant to specific segments of the company’s products, tasks, plants, or activities. The goal of that information is to enable managers to make more informed and effective decisions.
The reports a management accountant produces might forecast revenues, predict costs of planned activities, and provide analysis based on those forecasts. By describing how alternative actions might affect the company’s profit and solvency, forecasts and analyses help managers plan.
We’ll talk in greater detail about financial accounting and reports such as income statements, cash flow statements, and balance sheets in Chapters 4 and 5. More details will be provided on managerial accounting, including budgets, cost analysis, and management reporting in Chapters 2 and 3, which cover marketing and production.

12 • Comprehensive Business Review Concepts and Cases with Capstone® Business Simulation
Chapter Review Questions
Business Basics
1. What are the four main business stakeholder groups?
2. What are the primary functions of business?
3. What are the four major activities involved in managing a business?
4. What is the difference between performance effectiveness and performance efficiency?
The Private Enterprise System
5. How would you define supply?
6. How would you define demand?
7. How would you define a market?
8. What are the four conditions that must exist for the free enterprise system to exist?
9. What are the implications of the relationship between supply and demand?
10. What are the differences between internal and external stakeholders?
11. What is specialization?
12. How would you illustrate the concept of “uncertainty”?
13. How would you illustrate the concept of “risk”?
Decision-Making
14. What is the difference between an economic cost and an opportunity cost?
15. What is the main purpose of the accounting function of a business?
16. What are the differences between financial and managerial accounting?

Chapter 2 Marketing: How Do We Identify, Entice, and Add Value for Customers? • 13
Chapter 2Marketing: How Do We Identify, Entice, and Add Value for Customers?LEARNING GOALS
After reading this chapter you will be able to:
• Describe the role of a marketing manager.
• Describe the key activities of marketing research.
• Discuss the seven steps of information gathering for market research.
• Define and differentiate the 4Ps of marketing.
• Discuss the importance of market segmentation.
• Describe the purposes and goals of marketing strategy.
• Define “diminishing returns” and discuss why it matters to marketing.
• Compare and contrast the concepts of risk, ambiguity, and conformance with regard to marketing.
Overview of Marketing Basics
No matter how good a firm is at offering its products and services, it has to strive for constant improvement because satisfying the customer is a never-ending process. From buying a bottle of shampoo or ordering a cup of coffee to
choosing a healthcare provider or setting up a retirement plan, the abundance of choice in the market makes decision-making increasingly complex for consumers. The same is true for customers in business-to-business markets, like the electronic sensor market.For any company, understanding the relationship its customers have with the company and its product and how these relationships develop or deteriorate over time is critical to the long-term profitability and sustainability of the firm.
Today’s customers have access to a wealth of information, as well as many choices in the marketplace. Acquiring and retaining customers can, therefore, be challenging. But a satisfied and/or loyal customer—a “captured” customer—is, in simple economic terms, an asset that yields future cash flows and contributes to a firm’s future growth.
Without unlimited resources, it is impossible for any firm to excel in every aspect of its product—that is, to provide the highest quality, fastest delivery, and widest variety at the lowest price. Therefore, firms must make trade-offs on the basis of what they do best, what their competitors are offering, and what criteria they think matter most to their customers. Managers often struggle to determine the “best” configuration of product-service offerings that will appeal to their chosen target markets and to potential customers.
The Marketing Manager’s Role
Ideally, all company activities should satisfy customer needs. The role of a marketing manager is to focus the company’s efforts on identifying, satisfying, and following up on its customers’ needs—all at a profit. The marketing manager has to understand how to:

14 • Comprehensive Business Review Concepts and Cases with Capstone® Business Simulation
• Clearly define, describe, and forecast the needs of the customers by using data (market research),
• Determine how to select specific markets and satisfy customer needs through balancing products, services, and benefits (marketing mix), and
• Analyze its competitive advantages, plans, and actions (marketing strategy).
Market Research
A successful marketing manager cannot afford to implement best-practice initiatives for all possible product offerings to ensure the company can be “everything to everybody.” Nor can they use “spray and pray” tactics until they find the most popular product that will stick. With limited resources available, a marketing manager’s first step is to view the business from a customer’s perspective.
Most marketing managers combine the customer perspective with their sense of the market that comes from experience. However, experience is not always a good thing. Experience may include information acquired over a number of years that has become outdated and is no longer timely or relevant to today’s decisions. Sometimes industry folklore—stories repeated often but without a firm factual foundation—can create misleading impressions that may lead an organization in the wrong direction. Timely market research, to ensure you have an up-to-date understanding of your market and customers, helps keep decision-making on track.
Organizing Information
Any research assignment is a systematic gathering, recording, and analyzing of data related to a subject or problem you would like to understand. In particular, market research is simply an orderly and objective way of learning about the group of people who buy from you or who are most likely to do so.
Market research is not a perfect science because it deals with people and their constantly changing likes, dislikes, and behaviors—all potentially affected by hundreds of influences. It is an attempt to learn about markets scientifically and to gather facts and opinions in an orderly and objective way. Market research seeks to find out how things are, not how you think they are or would like them to be, and can define what specific products or services people want to buy, rather than focus on what you want to sell them.
Market research answers the questions every business must ask to succeed, such as:• Who are my customers and potential customers?
• What kind of people are they?
• Where do they live?
• Can and will they buy from my business?
• Am I offering the kinds of goods or services they want at the best place, at the best time, and in the right amounts?
• Are my prices consistent with buyers’ opinions of the product’s value?
• Are my promotional programs working by creating awareness in the marketplace?
• Are my sales programs working to create accessibility for my product through the distribution channels?
• What do customers think of my business?
• How do our value propositions (a product or a service that creates value for the customer) compare with those of our competitors?
Chapter 2 Marketing: How Do We Identify, Entice, and Add Value for Customers? • 15
• Are there specific reasons customers would make the decision to purchase from our business rather than from competitors?
Information Gathering
We often engage in information gathering to allow us to systematically organize knowledge. It ensures that such knowledge and information is timely and meaningful. Sound information gathering provides what you need to:
• Identify problems and potential problems in your current market that you can solve in a unique manner,
• Acquire facts about your market to develop a strategy and implement action plans,
• Make better decisions and correct problems as needed,
• Reduce implementation risks, and
• Discover unknown opportunities.
Many managers conduct informal research every day. In their daily managerial duties, they check returned items to see if there is a pattern of dissatisfaction. They meet a former customer and ask why they have not been in lately. They look at a competitor’s ad to see what they are charging for the same products. These activities help provide a framework that enables managers to objectively evaluate the meaning of the information they gather about their business.
A more formal information gathering or research process may include the following seven steps:1. Defining the problem or opportunity.
2. Assessing available information.
3. Reviewing internal records and files and interviewing employees.
4. Collecting outside data (primary research).
5. Organizing and interpreting data.
6. Making a decision and taking action.
7. Assessing the results of the action.
Defining the problem or opportunity: Defining the problem or assessing the opportunity is the first step of the research process. This process is often overlooked, yet it is the most important step. You have to be able to see beyond the symptoms of a problem to get at its cause. Labeling the problem as “a decline in sales” is not defining a cause but identifying a symptom.
You must establish an outline of the problem that includes causes that can be objectively measured and tested. Look at your list of possible causes frequently while you are gathering your facts, but do not let it get in the way of the facts. To define your problem, list every possible influence that may have caused it. For example, if sales have declined, ask yourself:
• Have your customers changed?
• Have customer tastes changed?
• Have customers’ buying habits changed?
• Do our services still meet our customers’ needs?
• Is our product still relevant?

16 • Comprehensive Business Review Concepts and Cases with Capstone® Business Simulation
Assessing available information: Once you have formally defined your problem, assess the information that is immediately available. You may already have all the information you need to determine if your hypothesis is correct, and solutions to the problem may have become obvious in the process of defining it. Stop there. You have reached a point of diminishing returns (we’ll talk about this term in depth a little later). You will be wasting time and money if you do further marketing research that doesn’t offer additional insight.
If you are uncertain whether you need additional information, weigh the cost of more information against its usefulness. This presents a dilemma similar to guessing, in advance, what return you will receive on your advertising dollar. You do not know what return you will get, or even if you will get a return. The best you can do is to balance that uncertainty against the cost of gathering more data to make a more informed decision.
Available Information—How Does That Look? Imagine you sell tires. You might guess that sales of new cars 3 years ago would have
a strong effect on present retail sales of tires. To test this idea, you might compare
new car sales of 6 years ago with replacement tire sales from 3 years ago. What if
you discovered that new tire sales 3 years ago were 10% of the new car sales 3 years
before that? Repeating this exercise for previous years reveals that in each case, tire
sales were about 10% of new car sales made 3 years before. You could then logically
conclude that the total market for replacement tire sales in your area this year should
be about 10% of new car sales in your locality 3 years ago.
Begin by “thinking cheap and staying as close to home as possible.” Before considering anything elaborate such as market surveys or field experiments, explore your own records and files. Look at sales records, complaints, receipts, and any other records that can help you better understand where your customers live and work, what they buy, and how they buy.
Naturally, the more localized the figures you find from published sources, the better. For instance, there may be a national decline in new housing starts, but if you sell new appliances in an area in which new housing is booming, you need to base your estimate of market potential on local, not national, conditions. Newspapers and local radio and television stations may be able to help you find this information.
Keep in mind that there are many sources of published material and much of it is free. You can find it online, in libraries, in newspapers, in magazines, and in trade and general business publications. Trade associations and government agencies are also rich sources of information.
Interviewing employees: When you have finished reviewing the available information in your records, turn to that other valuable internal source of customer information—your employees. Employees may be the best source of information about customer likes and dislikes. They hear customers’ complaints about your products or services, they are aware of what customers are looking for but you are not offering, and they can probably supply good customer profiles from their day-to-day contacts whether it’s face-to-face, on the phone, or online.
Beyond search engines—gathering primary information: Once you have exhausted the basic sources for information about your market, the next step is to collect information not commonly available in published form. Primary research is the collection of original data. Primary research can be as simple as asking customers or suppliers how they feel about your store or service firm or as complex as the surveys conducted by sophisticated professional marketing research firms. Primary research includes among its tools direct mail questionnaires, telephone or on-the-street surveys, experiments, panel studies, test marketing, behavior observation, and more.
It is critical to ask the right questions and to avoid creating a bias in the responses. If the questions are not carefully crafted, people may answer the way they think they are expected to answer, rather than telling you how they really feel about your product, service, or business.

Chapter 2 Marketing: How Do We Identify, Entice, and Add Value for Customers? • 17
Interpreting data: After collecting the data, you must organize it into meaningful information. Go back to your definition of the problem, compare it with your findings, and prioritize and rank the data.
• What marketing strategies are suggested?
• How can they be accomplished?
• How are they different from what I am doing now?
• What current activities should be increased?
• What current activities must I drop or decrease in order to devote adequate resources to new strategies?
Making decisions and taking action: Prioritize each possible tactic from the standpoint of determining the:• Immediate goal to be achieved,
• Cost to implement,
• Time to accomplish, and
• Measurement of success.
If your market research suggests ten possible strategies, select two or three that appear to have the greatest potential impact or are most easily achievable and begin there. For each strategy, develop tactics, which may include:
• Staff responsibilities,
• Necessary steps,
• Budget allocations,
• Timelines with deadlines for accomplishing strategic steps, and
• Progress measurements.
Based on this information, make a final decision on the strategies and go to work on the tactics.
Assessing the results of the action: Analyze your progress against success measures. If adjustments are appropriate, make them. At the conclusion of the time you have allotted for accomplishing your goal, take a hard look at the results.
• Did you achieve your goal?
• Should the decision be renewed on a larger scale?
If you are disappointed in the results, determine why the plan went awry.
The Possibilities Revealed
Market research should also identify trends that may affect sales and profitability levels in the future. Population shifts, legal developments, and the local economic situation should be monitored to enable early identification of problems and opportunities. Competitor activity should also be monitored; for example, competitors may be entering or leaving the market. To provide competitive insight, it is also very useful to understand the strategies your competitors have chosen.
Good information about the market is critical. Research provides knowledge that can disclose problems, and a lack of knowledge can easily be remedied through research. The success of any business is based on its ability to build an increasing pool of satisfied customers. Customers buy something because they believe they will be “better off,” in some way, as a result of the transaction. It is critical, therefore, that every business works out exactly who its customers are and how to create value for them. That is the role of marketing.

18 • Comprehensive Business Review Concepts and Cases with Capstone® Business Simulation
The Marketing Mix
The 4Ps of Marketing
Marketing defines your actions for competing in the marketplace. At the simplest level, a high-end vehicle manufacturer such as Rolls-Royce spends its marketing budget enticing high-net-worth individuals, while the value marketing programs of a manufacturer such as Hyundai appeal to a much broader audience. Rolls-Royce and Hyundai do not compete in the same market “segment,” which means their customers are looking for cars but different types of cars. Their marketing programs, therefore, are very different. Hyundai, however, competes with KIA and Suzuki in the same small-vehicle market segment. All three are competing for the same customers, so their challenge is to design marketing programs that make them stand out from the others—to differentiate their offering in the market.
Traditionally, marketing covers the 4Ps of product, price, promotion, and place, and the way a company configures these elements is the marketing mix.
Product
What are you selling, and how can you manipulate it to deliver better value for your customers? Does the business concentrate on a narrow product line, developing highly specialized products or services? Does it offer different versions of its products or services to different types of customers? Adjustments to the offerings—through research and development, revised designs, new packaging, etc.—are a key part of the marketing mix.
Price
Price and pricing policies are vital to business revenues. Each product or service must be priced to satisfy customers and deliver on the company’s profit target. But pricing also includes determining a credit policy: do you allow your customer to pay for the product after they receive it, or do they need to pay for it when they receive it? The timing of payment by customers will have an impact on the cash available to the business at any given time.
Promotion
No business can expect customers to just stumble across their offering and buy. Each business needs to create awareness for the value proposition they are offering. This can be done by taking advantage of resources such as the internet, advertising campaigns, sales efforts, special financing deals, or any other creative promotional or sales activities the company can imagine and implement. The cost of these activities, however, also has to be factored into the price of the products or services.
Place, or Distribution Channel
The way you get your product or service into your customers’ hands or lives is equally important. Businesses need to make their value propositions accessible. A manufacturer might work through established distributors or agents, for example, to get its products to the right place. A retailer has to consider cost versus traffic flow for its store—a high-traffic location will have higher rent, but a low-cost, low-traffic location will require more expenditure on promotions to bring people in. Online retail requires search engine optimization. Making the product accessible is critical to the marketing mix.
Place might be as simple as displaying products that are often bought on an impulse, such as flavored popcorn, candy, or magazines, in a highly visible spot in a high-traffic area of a store (checkout line) or as complex as developing an internet-based marketing plan to reach customers anywhere around the world.

Chapter 2 Marketing: How Do We Identify, Entice, and Add Value for Customers? • 19
There are more than four Ps to great marketing campaigns, however. One of them is precision—identifying precisely who your customers are and what they want. Preparation is another—doing the careful research and design work to satisfy your customers’ needs. And what about pizzazz—getting customers excited about choosing your value proposition over a competitor’s? Just like business itself, marketing is much more interesting than its basic definition.
Service is another way that an organization can increase perceived value and differentiate itself from competitors offering similar or identical products. Whether it’s a free massage when you sign up for personal training, a luxury car dealer offering roadside service, or a mass-market retail store with greeters to help customers find what they need quickly, service enhancements are increasingly important in the mix.
Because the resources available for marketing in any organization will be limited, concentrating the company’s marketing efforts on one or a few key market segments—or target marketing—is one way to use resources efficiently. Markets can be segmented in several ways:Geographic: Focusing on understanding the needs of customers in a particular geographical area.Demographic: Focusing on the attributes of the market based upon gender, age, income, education, or other measurable factors.Psychographic: Identifying and promoting to people most likely to buy the product based on lifestyle and behaviors. This may be based on interests, fears, behaviors, or actions that can be categorized into groups (e.g., young health-conscious professionals, retired couples on fixed incomes, families with new babies).
Target marketing enables you to identify, access, communicate with, and sell to those who are most likely to purchase your products.
Marketing Strategy
A company’s marketing strategy has one goal: to deliver value to customers while making a profit. Business incorporates many trade-offs—balancing one need or demand with another—and this is the most important: delivering just enough value to the customer at a price that allows the business to meet its profit target. The profit target will depend on the type of business. Some businesses focus on selling a relatively small number of products but make a large profit on each one (e.g., aircraft engines), while others focus on selling huge volumes for a smaller profit on each (e.g., canned soda).
Setting a marketing strategy involves identifying customer groups, or target markets, that your business can serve better than your competitors and tailoring your product offerings, prices, distribution, promotional efforts, and services toward that particular market segment.
Ideally, the marketing strategy should address unmet customer needs that represent adequate potential size and profitability.A good marketing strategy recognizes that a business cannot be all things to all people and must analyze its market and its own capabilities in delivering value. By focusing on a target market that your business can serve best, you increase the effectiveness of marketing activities and provide a better return on the marketing budget.
Marketing strategy is most successful when the company overall has a “marketing orientation.” A marketing orientation requires managers to constantly gather information about their customers’ needs through research, to share that information throughout the firm, and to use it to help build long-term relationships between the organization and its customers.
After marketing program decisions are made, owners and managers need to evaluate the results of their decisions. Standards of performance need to be set so results can be evaluated against them. Sound data on industry norms and past performance provides the basis for comparisons against present performance. Owners and managers need to audit their company’s performance on a periodic basis, at least quarterly.

20 • Comprehensive Business Review Concepts and Cases with Capstone® Business Simulation
Spending more on marketing programs is not always better. The law of diminishing return states that investing additional resources may initially increase productivity, but after a certain point, spending more will result in a lower return per dollar invested. The concept of diminishing returns, or the rate of diminishing returns, states that adding additional investment beyond a certain threshold will not add proportional returns. Spending money beyond this point does not yield as much as the amount spent prior to that point.
Diminishing returns may also be associated with other aspects of business, such as hiring too many employees and investing in additional plant and equipment that isn’t used efficiently.
Marketing Reality
Irrespective of up or down economic cycles, today’s business environment is more competitive than at any other time in recent history. To a certain extent, companies can reengineer, restructure, and cut costs but, at the heart of the business, must be a sustainable and profitable business model that nurtures growth. Creating a sustainable and profitable business model can prove to be even more difficult than creating a product itself. Many “dot bomb” businesses were able to produce a product but unable to back it up with a profitable business model.
In such a competitive business environment, managers must have a clear understanding of customer needs and their firm’s own capabilities to grow revenue within the constraints of sustainability and profitability. While evaluating various possible market alternatives, managers typically refrain from implementing revolutionary changes in their product or service offerings and instead engage in evolutionary market moves. This makes sense as it is always easier to modify the “core engine” of a product or service offering by adding one or many “engine variants” rather than introducing a “new core engine” that might capture new markets. With limited resources at their disposal, it is imperative that managers understand the complexities of product or service “drivers” that truly reflect evolving customer needs and competitive activity, so their decisions return the most “bang for the buck.”
In other words, to create, capture, and maintain demand for their product and service offerings, businesses have to perform a balancing act between the external environment (changing customer demands) and the internal environment (the firm’s given operational challenges) to maximize growth opportunities. It requires carefully calibrating the company’s responses and approach to the following issues:
Ambiguity: What do our customers really want? Companies lacking a clear understanding of customer choices often take a shotgun approach, hoping that at least one of their offerings will succeed. Unfortunately, this approach is neither efficient nor profitable for most firms. Markets are often flooded with products and services that offer relatively little added value to customers and weaken the seller’s bottom line.
50%
40%
30%
20%
10%
0%$0 $500,000 $1,000,000 $1,500,000 $2,000,000 $3,000,000$2,500,000

Chapter 2 Marketing: How Do We Identify, Entice, and Add Value for Customers? • 21
Risk: Will our envisioned offerings be successful? Managers face complex choices when deciding which product-service bundles to offer. Potential product-service drivers (e.g., price or specific product-service features) can have several variants, and managers often use experience, benchmarking analysis, or gut feel to decide what will be attractive to customers. On the one hand, such “informed guessing” might spur new and innovative ideas; on the other hand, it might also lead to depleted profits and chaos.
Conformance: Can we deliver what we promised? Although it is important for companies to understand market value drivers, they must also support customer preferences and align them with effective operations management. Even if firms succeed in identifying and delivering attractive product-service packages, their efforts may prove futile unless they can efficiently deliver on their promises under resource constraints.
In summary, the key questions to determine marketing performance include:• Do the products and services the company is offering provide value to customers?
• Are existing and potential customers aware of the products and services available from the company?
• Is it easy for the customer to purchase what he or she wants and at a competitive price?
• Do the employees make sure the customers’ needs are truly satisfied and leave them with the feeling that they would enjoy coming back?
The Sales Forecast
How will you know how much of your product to produce if you cannot make a reasonable prediction about how much you will sell? One of the most critical aspects of marketing management is to create a sales forecast to predict how many units of a product will sell in the future.
The sales forecast process often begins by assessing how the total market will perform in a given period—1 year, for example. From there, using all relevant information, you attempt to assess your performance and what market share your company will realize from that total forecast. This requires speculating on your competitors’ performance as well. Forecasting sales is a challenging task because of the multiple variables involved in the process:
• What will the overall economic climate be?
• Will consumers make decisions on the same basis they have in the past?
• At what level will our competitors perform?
• Will existing competitors introduce new products, and if so, when?
• Will there be new competitors, or will existing competitors drop out of the market?
• At what price can we sell our products given the many alternative product choices available?
Answering these questions provides insight for making better decisions for production schedules and allocating resources to attract new customers or retain existing customers. You will have the opportunity to practice sales forecasting and build skills in this area several times during the business simulation experience.
However, keep this in mind:
What customers prefer is of interest, but what really matters is what customers choose!

22 • Comprehensive Business Review Concepts and Cases with Capstone® Business Simulation
Chapter Review Questions
1. What are the three key responsibilities of a marketing manager?
2. What are the major components of marketing research?
3. What steps should you follow to collect information for marketing research?
4. What are the 4Ps?
5. What are some other important factors beyond the 4Ps?
6. How can one “segment” the market? Why is segmentation important?
7. What is marketing strategy?
8. When dealing with “marketing reality,” what are the three questions that need to be addressed?
9. Why would a company need to forecast sales?
For more information, check out the additional video link below.
Forecasting: http://capsim.com/go/v/forecasting

Chapter 3 Production: How Does a Business Create Goods and Services to Sell? • 23
Chapter 3Production: How Does a Business Create Goods and Services to Sell?LEARNING GOALS
After reading this chapter you will be able to:• Differentiate between operations and production.
• Describe the purpose of production schedules.
• Discuss the importance of inventory control.
• Describe an economy of scale.
• Discuss the five components of supply chain management.
• Discuss why it is important to manage quality.
• Describe how to measure productivity.
• Define the accounting equation.
• Discuss the typical types of managerial accounting reports.
• Describe how to calculate contribution margins and why these are valuable.
Production Basics
The story so far . . .
We know that a business exists to make a profit by offering goods and services that satisfy customer needs in a marketplace. We know that there are many types of markets—physical and virtual. We have discovered how to define
customer needs and how important it is to promote our products and to make them accessible to customers.
Now let’s talk about production: creating something to sell at a cost and level of quality that allows the company to satisfy customer needs and make a profit.
Production is a process that uses resources such as cash, labor, and raw materials to create a value proposition that is attractive to a particular market.
If “profit” is the answer to “Why does a business exist?” and “marketing” holds the answers to “Who does the business sell to?” then “production” is the answer to the “how,” “what,” and “when” questions about business.
Let’s begin with an overview of production management. A production process can be defined as: any activity that increases the similarity between the pattern of demand for goods and the quantity, form, and distribution of these goods to the marketplace.

24 • Comprehensive Business Review Concepts and Cases with Capstone® Business Simulation
Inputs to Outputs
Production is the act of making products that will be traded or sold commercially based on decisions about what goods to produce, how to produce them, the costs to produce them, and how to optimize the mix of resource inputs used in their production.Production information is combined with market information such as demand to determine the quantity of products to produce and sell at an optimal price point.
A business needs a production process whether it provides products or services. The production process involves planning, procuring goods or expertise to produce the product or service, and assigning and organizing tasks to get the products or services to the market. It is important to differentiate “production” from “operations” in the business context.Operations describes the full range of management activities that enable a company to be profitable and sustainable.Production involves the actual process of creating goods and services.
Production can take the form of mass production, where a large number of standard products are created in a traditional assembly line process. It can be a very specialized process with individual or small quantities of a good being created, or it might involve running the logistics necessary to deliver a service efficiently. Inputs, therefore, can be raw materials like steel and chemicals; human inputs like specialized computer programmers, designers, or engineers; and money from a few thousand dollars to start a home crafts business to millions of dollars for sophisticated manufacturing equipment. The concepts are the same for every type of business.
Core Functions in Production Management
Production management seeks to develop an efficient, relatively low-cost, and high-quality production process for creating specific products and services. Good production management is important if business goals, for both manufacturing and service-oriented companies, are to be met. The profit and value of each company is determined, to some extent, by its production management process.
The primary resources that firms use for the production process include:Human resources: Employees and their skills as applied to the production process.Raw materials: The cost of all the goods needed to create the products or services.Capacity: The annual production capabilities of the facilities, technology, machinery, and equipment.
Each of these resources costs money. Employees need to be paid, materials have to be purchased, and there are buildings, production facilities, and computer systems that require time and money to be maintained for ongoing production. The objective of production management is to use these resources in the most efficient manner possible. This will enable the organization to take advantage of higher production levels by producing more units at a lower cost per unit.
Whatever the business is selling, its production process is the conversion of inputs (skills and raw materials) into outputs (goods or services) as efficiently as possible. The process can include sourcing, manufacturing, storing, shipping, packaging, and more. Because it is based on a flow concept (the steps have to flow in a logical order to get the product or service ready for sale), production is measured as a “rate of output per period of time.”
In any manufacturing environment—and your Capstone Business Simulation models a manufacturing business—it is the production manager who has responsibility for scheduling the production sequence, type of product to be produced, and the volume of production. The three elements of management we discussed in Chapter 1—planning, organizing, and controlling— are clearly necessary for production management. Following are some key concepts you will need to understand, along with some of the functions performed in the production department of your simulated company.
Scheduling Production
A master production schedule determines when the products will be produced and in what quantities. Dates must be met, specified quantities must be produced on time, and costs controlled to ensure this process goes smoothly and meets

Chapter 3 Production: How Does a Business Create Goods and Services to Sell? • 25
commitments. One tool to help with this process is a PERTchart. PERT stands for “Program Evaluation and Review Technique.” This is a graphical representation that tracks production events and their time frames from start to finish. A PERT chart maps out the production process, which can help to identify problems before the process even begins.
Inventory Control
As goods are produced, they also need to be managed. Inventory control is the process of efficiently managing inventory. It is important to have enough products to sell, but not to have too many products unnecessarily sitting in the warehouse tying up cash. An efficient inventory control system minimizes the costs associated with inventory.
Companies must also manage inventory while it is in the process of being built. This is described as work-in-process inventory, or products that are only partially completed but have required an investment of resources. Products cannot be sold until they are complete, and monitoring the status of products still in production is important.
Another cost directly associated with inventory is carrying cost. Carrying cost is the cost of maintaining completed products. Inventory ties up space, cash, and human resources. A popular method for reducing carrying costs is the just-in-time (JIT) inventory system. This system is based on having just enough products on hand to satisfy consumer demand. Product should always be available without overstocking on what might be needed for the future.
The JIT system is often associated with a materials requirement planning system that ensures materials are available when needed. A materials requirement planning system, or MRP, helps determine when the materials to produce the product are needed to meet production deadlines. As a firm develops a forecast of the demand for its products, it determines the time at which the materials need to arrive at the production site to meet the anticipated market demand.
Economies of Scale
An economy of scale occurs when the cost of each good produced decreases as the volume produced increases. This reduction in cost per unit occurs because the initial investment of capital is shared with an increasing number of units of output. Variable costs (those that change with the number of goods produced) and fixed costs (costs that do not change regardless of volume) are monitored throughout this process. As output increases, fixed costs remain the same and variable costs on a per-unit basis decline.
Economies of scale are particularly critical in industries with high fixed costs such as manufacturing. With an initial fixed investment in machinery, one worker, or unit of production, begins to work on the machine to produce a certain number of
Start End
SI
SII
SIII SIII
SIV
SV
3
6 9
12 12
15 27
9 9
12 13
20 20
20 20
30 30
Task
1
Task 2
Task
3
Task 4
Task 5
Task 6
Task 7
Task 8
Task 9
6
9
10
3
12
10
8
8
12

26 • Comprehensive Business Review Concepts and Cases with Capstone® Business Simulation
goods. If a second worker is added to the production line, he or she is able to produce an additional number of goods without significantly adding to the factory’s cost of operation. If the number of goods produced grows significantly faster than the plant’s cost of operation, the cost of producing each additional unit is less than that of the unit before and an economy of scale occurs. This is one important reason why businesses always want to grow: Growth means you can reap the efficiency rewards offered by economies of scale.
Economies of Scale – How Does That Look? You are setting up a small business in your local area and need business cards.
The cost to print 50 business cards is $25, which is 50 cents per card. However, if
you were to place an order for 500 business cards, the total cost is $50, reducing the
cost to 10 cents per card. The more business cards printed in each print “run,” the
lower the cost per individual business card. The cost for the printing company is in
setting the job up; the small additional cost in ink and paper to run a larger print run is
marginal, so the cost per unit comes down.
Supply Chain Management
The collection of partners—manufacturer, wholesaler, distributor, retailer, and online sales site—is referred to as the “supply chain.” Efforts to improve the relationship between a company and its suppliers are referred to as supply chain management (SCM). The objective of SCM is to manage the connections between different businesses in the supply chain in order to enhance efficiencies and reduce costs.
Supply chain management involves these five basic componentsPlan: The strategic plan to manage all of the resources needed to meet customer demand for your product or service.Source: The selection of the supplies that will deliver goods and services (e.g., suppliers that can offer parts faster and/or cheaper).Make: The manufacturing step involving scheduling, testing, packaging, and preparing for delivery.Deliver: The logistics and timing of getting products and/or services through the relevant channels to the customer.Return: The “soft” link in the chain that supports customers who are returning products or have had problems with their product/service experience.
Quality Control and Total Quality Management
Quality is the degree to which a product or service meets the company’s internal or external standards and satisfies customer expectations. Quality control is the process of testing to ensure the product or service meets the organization’s standards before it is sold. Techniques to monitor quality may include sampling, monitoring customer/user complaints, and planning to correct deficiencies.
National or international authorities often set standards in business. The International Organization for Standardization (ISO), founded in 1947 and made up of representatives from many national standards organizations, sets international quality standards. The ISO 9000 family of standards was designed to help organizations ensure that they can meet the needs of customers and other stakeholders. The ISO 9000 standards are focused on a company’s quality management systems. Certification requires a company to meet all of the requirements and pass a series of audits from independent certifiers. The benefits of compliance include internal management efficiencies—quantified by substantial research—and access to new business from companies that will work only with ISO-certified suppliers.
Companies are often required to adhere to standards set by national agencies or industry associations. In the US, for example, standards agencies include the Food and Drug Administration (FDA) and the Consumer Products Safety Council (CPSC). The standards imposed by these entities affect design, performance, durability, safety, and many other attributes relating to performance and function. Quality is also used as a competitive advantage to provide “perceived excellence” compared with other choices in the market.

Chapter 3 Production: How Does a Business Create Goods and Services to Sell? • 27
Several techniques are used to improve quality within an organization. Quality circles are small groups of employees who meet regularly to attempt to identify and solve problems involved in quality improvement. A more formalized process is the concept of Total Quality Management (TQM).
Total quality management is the process of monitoring and improving the quality of products and services produced. This concept is primarily based on the work of W. Edwards Deming, an American statistician, professor, author, lecturer, and consultant. He is perhaps best known for his work in Japan. Beginning in 1950, Deming taught top management in Japan how to improve design and service, product quality, testing, and sales through the application of statistics and other methodologies. Deming offered 14 key principles to managers for transforming business effectiveness in his book Out of the Crisis. Although Deming does not use the term in his book, Deming is credited with launching the Total Quality Management movement. His work followed these objectives:
• To provide managers and other employees with the education and training necessary to excel in their jobs,
• To encourage employees to take responsibility and to provide leadership, and
• To encourage all employees to search to improve the production process.
Many firms create teams of employees to assess quality and to offer suggestions for improvement. This creates a form of cross-functional teamwork in which employees with different jobs, responsibilities, and perspectives work together to improve the production process through enhanced quality.
Benchmarking
The process called benchmarking is another quality improvement technique. Benchmarking describes a method of evaluating performance by comparing it with another specified level achieved by another entity. Often, benchmarking involves studying highly successful companies in other industries. For example, Ford Motor Company in the US studied and used the customer service performance levels of the American clothing company Eddie Bauer to improve its customer relations process. Benchmarking may also be used in conjunction with a TQM process.
Technology
Many production processes have been automated, and robotics is a significant factor in manufacturing throughout the world. Machines and robotic equipment reduce the labor required in the production process. Good planning is required to make certain that the automation process, often requiring a substantial up-front investment in equipment, accomplishes the desired goals. This involves a thorough assessment of the required costs, savings, and benefits that may be realized and the degree of “fit” within the organization and production process.
For example, automation is expensive and as you raise automation levels, it becomes more difficult for new product designs to be created and produced quickly. However, increasing automation carries the benefit of decreasing the labor costs associated with production.
Improving Productivity
Productivity is the ratio of output to inputs in production and is a measure of the efficiency of production. A common measure of productivity is dollars of output per hour worked. Production faces the standard challenges of increasing labor, material, and opportunity costs. It also must address the impact of uncertain world events, technological change, and the global labor market.
28 • Comprehensive Business Review Concepts and Cases with Capstone® Business Simulation
Interrelationship between Production and Accounting
Accounting, as we discussed in Chapter 1, is the process that tracks, summarizes, and analyzes a company’s financial position. Accounting provides information in a standard format so that stakeholders have a consistent frame of reference for assessing the company’s financial health. Recall that we discussed two types of accounting.
Financial accounting produces three key financial reports (balance sheet, income statement, and cash flow statement). These three reports ensure that external stakeholders can access the information they need. External stakeholders might include investors and bankers; stockbrokers and financial analysts who offer investment assistance; suppliers; labor unions; customers; local, state, and federal governments; and governments of foreign countries in which the company does business. Managerial accounting provides vital information about a company to internal users. Because it is for internal use, it does not have to conform to the restrictions of outside regulation and can be expressed in whatever way is most useful for managers. Information can be reported in dollars, units, hours worked, products manufactured, numbers of defective products, or the quantity of contracts signed. The overall purpose of this information is to enable managers to make more informed and effective decisions.
There is another key difference between financial accounting and management accounting—financial accounting is always historical; it records past transactions in and through the company. Managerial accounting, however, is often forward-looking, using historical information to predict future outcomes and set expectations. For example, the reports a management accountant produces might forecast revenues, predict costs of planned activities, budget the amount of money the company will spend on various activities, and provide analysis based on that information. By describing how alternative actions might affect the company’s profit and solvency, the information and analysis helps managers plan for the future.
Because managerial accounting pertains specifically to improving internal decision-making, it has particular relevance to a company’s production-related activities. So it is important to introduce you to some basic accounting concepts related to managerial accounting. We will look carefully at the reports related to financial accounting (balance sheet, income statement, and cash flow) in Chapters 4 and 5.
The Accounting Equation and Managerial Accounting
Two key elements of the production function (those that you will practice in Capstone) are increasing and reducing the capacity of production lines based on the sales forecasts for various products and maintaining or increasing automation based on the technological advancement of products and how quickly the company can get them to market. The production department, therefore, builds up assets (production equipment) and accrues liabilities (loans to buy the equipment).
In reality, a production department is doing much more than dealing with assets and liabilities. It is managing staff, equipment, productivity, quality control, software, and so forth, but all that the accounting department of the company is interested in is the way all these activities can be distilled into numbers that conform to accounting rules.
The accounting equation, which can be applied to every business, is
Assets = Liabilities + Equity
In a corporation, “equity” means the money the owners have invested in it. As the accounting equation dictates, the equity must always be equal to the value of the company’s assets minus the value of its liabilities.

Chapter 3 Production: How Does a Business Create Goods and Services to Sell? • 29
The Accounting Equation – How Does That Look? You accidentally spill a complete can of soda onto your laptop—a disaster because
you are in the midst of a busy semester and need your computer! Luckily you have
everything backed up in the cloud. Someone offers you an almost-new computer—
just the model you want—for $1,200 in cash. But you don’t have the cash. A good
friend is willing to lend you $500. So you use that plus $700 from your savings and
buy the computer. In terms of the accounting equation, your assets are now $1,200,
your liabilities $500, and your equity $700.
$1,200 (Assets) = $500 (Liabilities) + $700 (Equity)
Companies typically use managerial accounting reports that fall into two broad categories:
Budget reports: Budgeting is the process of quantifying managers’ plans and showing the impact of those plans on the company’s operating activities (and remember, the goal of operations is to make a profit). Managers present this information in a budget (a “forecast”). Once the planned activities have occurred, managers can evaluate the results of the operating activities against the budget to make sure that the actual operations of the various parts of the company achieved the goals established in the plans. For example, a company might report a budget showing how many units of product it plans to sell during the first three months of the year. When actual sales have been made, managers will compare the results of these sales with the budget to determine if their forecasts were “on target,” and if not, they will investigate the discrepancy. Budgets are powerful planning and control devices.
Cost analysis reports: Cost analysis is the process of defining the costs of specific products or activities within a company.A manager will use a cost analysis to decide whether to stop or to continue making a specific product. The cost analysis shows a product’s contribution to profitability at different levels of sales. Assigning (or defining) costs to products and activities is a complex activity. Every decision-maker in the company has to be familiar with the way relevant costs are assigned in order to make appropriate decisions. Consistency in this reporting process is critical to ensure the information is accurate and understood by a company’s various decision-makers.
Management accounting reports, therefore, are produced to help managers monitor and evaluate the company’s operations in order to determine whether its planned goals are being achieved. They can also highlight specific “variances,” or differences, from plans, indicating where corrections to operations can be made if necessary.
Contribution Margin—a Key to Profitability
Contribution margin is the amount of money left over from the sale of your product after you have paid all the costs of producing that product. This money “contributes” to the running of the business.
Contribution margin = Price – Variable costs
Calculating the contribution margin from each product line a company produces is a critical element of cost analysis. In the Capstone Business Simulation, contribution margin is one of the key measures for success in your business, demonstrating how important this managerial accounting calculation is to your company’s success.
The equation above can help you work out how you might manipulate the contribution margin by increasing or reducing the price and the variable costs of your products. When we say “costs”—as discussed earlier—we usually refer to either variable costs or to fixed costs. Costs that differ depending on how many products you produce are called “variable” costs (if you are producing a lot, you’ll need more raw material and more labor; so your costs will be higher). Costs that don’t change no matter how much you produce are called “fixed” costs (whether you build one product or a million products, you’ll still have to pay the rent, the corporate office expenses, and other bills). The contribution margin represents the amount of money that is left over, after your products have been made and sold, to contribute to paying your fixed costs. The higher the contribution
30 • Comprehensive Business Review Concepts and Cases with Capstone® Business Simulation
margin, the more profitable the business can be.
Actively monitoring the contribution margins of your various products helps ensure your Capstone company is profitable and competitive. In the simulation, there are several ways to improve your contribution margin, but each comes with trade-offs. For example, you can:
Raise prices: But fewer people will purchase at a higher price.Lower material costs: Although you may make your product less attractive because it could be bigger, slower, or less reliable.Reduce labor costs: Increasing automation will cost money and can increase the length of time needed to update your products.Economies of scale: Reduce the cost of each individual product as the volume produced increases.

Chapter 3 Production: How Does a Business Create Goods and Services to Sell? • 31
Chapter Review Questions
Production Basics
1. What is the difference between production and operations?
2. What are the primary resources used in the production process?
3. What does “economies of scale” mean, and why is that concept relevant in the production process?
4. What benefits does TQM offer an organization?
5. What does benchmarking accomplish?
6. How does supply chain management impact the production process?
7. What are the potential benefits of effectively managing quality control?
Linking Production to Accounting
8. Who relies on accounting information?
9. What is the accounting equation?
10. What is cost analysis?
11. What are some ways to increase your contribution margin?
For more information, check out the additional video link below.
Putting Assets to Work: http://capsim.com/go/v/assets

32 • Comprehensive Business Review Concepts and Cases with Capstone® Business Simulation
Chapter 4Accounting: How Do We Keep Track of the Money?LEARNING GOALS
After reading this chapter you will be able to:
• Describe the three categories of cash in a cash flow statement.
• Discuss the types of activities that add or subtract cash flow from operating activities.
• Define working capital and the working capital cycle.
• Discuss the importance of managing the working capital cycle.
• Differentiate between production cycle, accounts payable lags, and accounts receivable lags.
• Calculate accounts receivable.
• Discuss the importance of a credit policy for a company’s cash flow.
• Discuss the importance of managing inventory for a company’s cash flow.
• Calculate inventory turnover rates, inventory turnover days, and ideal inventory.
• Describe the kind of information found on a company’s income statement.
Accounting Basics
Cash Is King
We have discussed why we use accounting—to summarize and report on a company’s financial position—and the difference between managerial accounting (to provide information for internal stakeholders) and financial
accounting (to provide information for external stakeholders).
In practice, there are three key financial statements that provide financial accounting information about a company: cash flow statements, income statements, and balance sheets. Together they provide information that managers use to make better decisions in all areas. Analyzing your competitors’ financial statements will provide intelligence on their operation, and the better you know your competition, the better prepared you are to compete. In this chapter, we focus on cash flow statements and income statements. In Chapter 5, we turn to balance sheets.
We know that one goal of business is to make a profit—it’s a critical point that has been made several times. Here is another critical point: Profit does not equal cash. Profit, as discussed in Chapter 1, is the difference between what it costs to make and sell a product and what the customer pays for it. Profit does not equal cash for several reasons.
First, cash is moving in and out of the business constantly and depends a lot on timing: When did you pay your suppliers? Have your customers paid you yet? When is the interest payment due on your loans? How much money is tied up in products you haven’t sold yet?

Chapter 4 Accounting: How Do We Keep Track of the Money? • 33
Second, the numbers on the income statement (which is the accounting statement that shows whether or not you are making a profit) are entered according to standard accounting rules in order to maintain consistency, not necessarily to reflect the reality of where the cash in the business is tied up at any given point.Third, as a consequence of the above, it is possible for a company to be showing a profit on its income statement but become bankrupt because it has completely run out of cash to keep the operation running.
To really understand it all, we will start with the cash flow statement because that’s your go-to statement to ensure you have the cash to operate your business in every round of the simulation.
If Cash Is King, What Happens When You Spend It All? When a company is out of the cash it needs to continue its day-to-day operations,
the company is bankrupt. In your Capstone Business Simulation—if you make a
few poor decisions—you could find yourself bankrupt at some stage. In the spirit
of “all experience is good experience,” it’s certainly better to learn the hard lessons
of running out of cash in a simulation rather than in the real world! If we let you go
bankrupt and drop out of the game, however, you lose the opportunity to learn a
hundred other useful lessons about business.
So, if you go bankrupt, we save you with an emergency loan. If your company
becomes insolvent, the loan will kick in immediately to allow you to continue your
operations. That’s the good news. The bad news is that the money comes at a very
high interest rate: 7.5% above your current short-term debt rate. So, there will still be
some pain, but you will be able to stay in the game and turn your company around.
Underlying Principles in Accounting – Rules That Keep the Information Manageable To understand the financial reports, we need to understand two of the basic principles
that underpin the rules of accounting.
The reports you’ll work with during your business simulation adhere to Generally
Accepted Accounting Principles (GAAP). GAAP accounting is a set of rules used to
generate financial reports. These rules look back at a time period, typically 1 year,
and are used to produce reports based on the principles of historical cost accrual
accounting. These principles have two key elements: historical cost and the matching
principle.
Historical cost requires the company to record the original price paid for an asset
and then to write off part of the value of that asset each year according to a fixed
schedule of depreciation. For example, if a company buys a laptop computer for
$2,000, the company will list the laptop as an asset worth $2,000. The next year, the
company will report a lower value for the same laptop. That’s the way the financial
records describe the fact that the laptop—like most assets the company owns—is
getting older and wearing out.
If the depreciation schedule is a straight 5 years (i.e., 20% per year), a $2,000 laptop

34 • Comprehensive Business Review Concepts and Cases with Capstone® Business Simulation
will be reported worth $1,600 the following year and $1,200 the year after that.
The matching principle says a business must match all revenue to the costs
associated with generating that revenue at the same time. At the time you sell a
product, you put into your books the cost of the materials and the labor required to
produce it.
It does not matter if you bought the materials some time before the product was sold
or that you’ve already paid your workers for their labor; you can only report the cost
of those inputs at the time you make the sale. This is important because it helps you
to match up what you earn from a product, or from a service, with what you spent.
That way, you can figure out if you are making a profit.
Accounting helps keep track of a business’s finances, but it doesn’t represent exactly
what is happening day-to-day. If the numbers tried to perfectly represent reality, they
would be messy, unmanageable, and inconsistent. The accounting rules are simply the
accepted, legal way of capturing all the action in a business in an orderly fashion.
The Cash Flow Statement
It is important to keep track of the cash moving through your business so you can be sure that you’ll have enough to continue to run the company’s operations. It is the cash flow statement that identifies how much cash is actually available for use in a given period. Good business managers update their cash flow statements regularly to keep a consistent eye on their available cash reserves.
The cash flow statement records how your cash position has changed between the present and the last period you measured. In general, financial accounting reports strive for consistency, based on standards or guidelines. For example, the InternationalAccounting Standards Committee works to unify accounting rules around the world, as many countries have their own accounting standards and associated agencies. In the US, for example, it is the Finance and Accounting Standards Board, or FASB, which sets the GAAP rules.
Under the FASB guidelines, there are three categories of cash in a cash flow statement. The statement shows:Cash from operating activities: Your day-to-day business activities.Cash from investing activities: Selling or buying plant and equipment, for example.Cash from financing activities: From stock transactions, loan repayments, etc. Let’s take each of these cash categories one at a time.
Cash from Operating Activities
Cash from operating activities traces money from the sale of a company’s goods and services. To get a number for cash from operating activities, you start with your net profit and then adjust it by eliminating everything that does not represent cash.First you back out noncash items like depreciation. Put simply, depreciation is a reduction in the value of an asset with the passage of time. Depreciation is a consistent way of expressing wear and tear on the things the company owns.
The next step in calculating cash from operating activities is to look at changes (between reporting periods) in the assets and liabilities that impact cash flow and accounts such as inventory or accounts payable. The up or down change in these accounts is recorded in the cash flow statement as either a use of cash (which means your cash goes down) or a source of
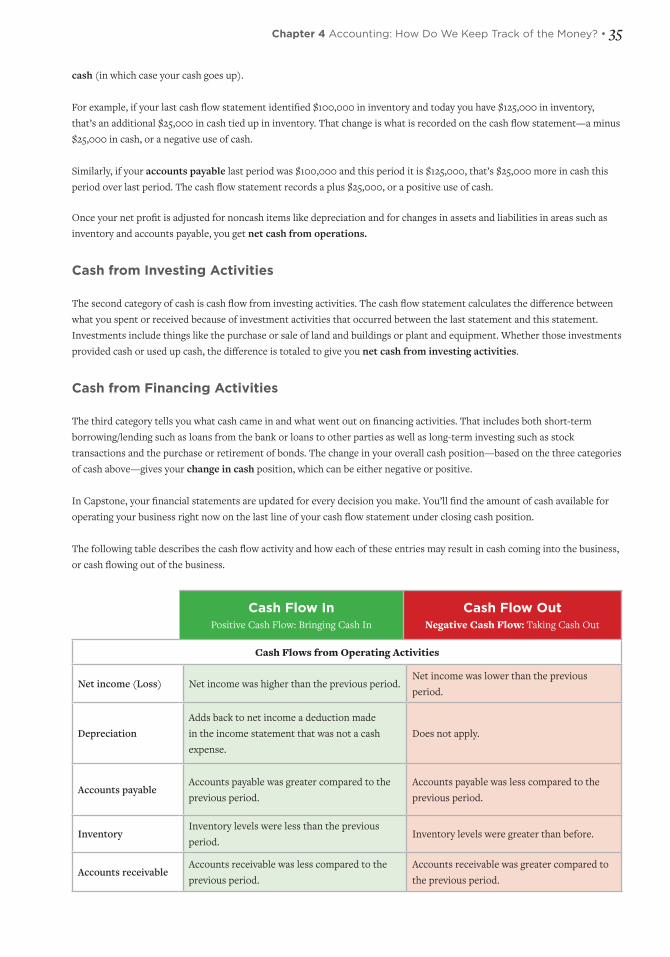
Chapter 4 Accounting: How Do We Keep Track of the Money? • 35
cash (in which case your cash goes up).
For example, if your last cash flow statement identified $100,000 in inventory and today you have $125,000 in inventory, that’s an additional $25,000 in cash tied up in inventory. That change is what is recorded on the cash flow statement—a minus $25,000 in cash, or a negative use of cash.
Similarly, if your accounts payable last period was $100,000 and this period it is $125,000, that’s $25,000 more in cash this period over last period. The cash flow statement records a plus $25,000, or a positive use of cash.
Once your net profit is adjusted for noncash items like depreciation and for changes in assets and liabilities in areas such as inventory and accounts payable, you get net cash from operations.
Cash from Investing Activities
The second category of cash is cash flow from investing activities. The cash flow statement calculates the difference between what you spent or received because of investment activities that occurred between the last statement and this statement. Investments include things like the purchase or sale of land and buildings or plant and equipment. Whether those investments provided cash or used up cash, the difference is totaled to give you net cash from investing activities.
Cash from Financing Activities
The third category tells you what cash came in and what went out on financing activities. That includes both short-term borrowing/lending such as loans from the bank or loans to other parties as well as long-term investing such as stock transactions and the purchase or retirement of bonds. The change in your overall cash position—based on the three categories of cash above—gives your change in cash position, which can be either negative or positive.
In Capstone, your financial statements are updated for every decision you make. You’ll find the amount of cash available for operating your business right now on the last line of your cash flow statement under closing cash position.
The following table describes the cash flow activity and how each of these entries may result in cash coming into the business, or cash flowing out of the business.
Cash Flow InPositive Cash Flow: Bringing Cash In
Cash Flow OutNegative Cash Flow: Taking Cash Out
Cash Flows from Operating Activities
Net income (Loss) Net income was higher than the previous period.Net income was lower than the previous period.
DepreciationAdds back to net income a deduction made in the income statement that was not a cash expense.
Does not apply.
Accounts payableAccounts payable was greater compared to the previous period.
Accounts payable was less compared to the previous period.
InventoryInventory levels were less than the previous period.
Inventory levels were greater than before.
Accounts receivableAccounts receivable was less compared to the previous period.
Accounts receivable was greater compared to the previous period.

36 • Comprehensive Business Review Concepts and Cases with Capstone® Business Simulation
Now that we have discussed the three categories of cash found on cash flow statements and outlined the types of activities that add or subtract from a company’s overall cash flow, let’s take a closer look at factors that specifically influence cash from operating activities. We will discuss the factors that influence Cash from Investing Activities and Cash from Financing Activities in Chapter 5.
Cash and the Working Capital Cycle
A company turns cash into products or services and then turns these products or services back into cash through sales. At any time, a company will have bills to pay (accounts payable) and customers who owe money (accounts receivable). And while the cash is flowing in and out of the business, managers have to ensure there is enough available at any time to ensure the business can continue to operate and to meet its obligations. Working capital is the cash that is available to run day-to-day business operations.
Working capital management is concerned with day-to-day operations rather than with long-term business decisions. In general, long-term financing needs—such as buying a new plant—are best met through long-term sources of capital such as retained earnings, sale of stock, and the sale of long-term debt obligations (bonds). Working capital management policies address short-term problems and opportunities—“short term” meaning issues that generally occur within 1 year.
At its core, working capital management requires that business leaders effectively manage what is known as the “working capital cycle.” The working capital cycle—also called the cash flow cycle—is a concept based on the time cash is tied up (e.g., in raw materials) and therefore unavailable for other uses by the business. Effectively managing working capital involves overseeing the working capital cycle to get the time lag between accounts payable and accounts receivable down to a minimum. This requires attention to a company’s accounts receivable, inventories, accounts payable, and short-term bank loans. We will look at these one by one.
Working Capital Cycle: The Importance of Time and Timing
The working capital cycle includes all the activity that occurs between the time cash is spent producing a product and the time that payment is made on the product’s sale. Therefore, the first step in the working capital cycle is when the company orders and receives the raw material, generating an “‘account payable.” The final step is when you receive the money owed to you from the sale of the product on credit—when the “account receivable” is paid off.
The working capital cycle is the length of time between the payment of the payables and the collection of receivables. During the cycle, some of the company’s funds are unavailable for other purposes. Short-term financing may be needed to sustain business activities during the cycle, and because there is always a cost to such financing—interest to be paid, for example—a goal of any business should be to minimize the cycle time.
To achieve that goal, three terms must be clearly understood:1. Production cycle refers to the length of time from the purchase of raw materials through the production of the
goods or service and to the sale of the finished product.
2. Accounts Payable (A/P) lag is the time between the purchase of raw materials on credit and the cash payments made for the resulting accounts payable.
3. Accounts Receivable (A/R) lag is the time between the sale of the final product on credit and collection of cash payments for the accounts receivable.
Let’s look at examples with different payable and receivable time lags. In both examples, assume it takes 40 days after an order is received to process the raw material into finished product—this means the production cycle is 40 days.
Chapter 4 Accounting: How Do We Keep Track of the Money? • 37
30-Day A/P lag: In one example, the accounts payable lag is 30 days and the accounts receivable lag is 45 days. Your company receives the materials and starts to process them. Within 30 days after receiving the materials, you have to pay your supplier (A/P lag); 40 days after receiving the materials, you have inventory to sell. For 10 days, then, your cash is tied up in inventory that is not available for sale. If you deliver it to your customer on the 14th day of the production cycle, your customer has 45 more days to pay for it. On that day, your cash has been tied up in inventory for a total of 55 days (10 days before inventory was ready for sale and 45 days after).
45-Day A/P Lag: A second example has the accounts payable lag at 45 days and the accounts receivable lag at 30 days. Your company receives the materials and starts to process them. Within 40 days after receiving the materials, you have inventory to sell. Within 45 days after receiving the material, you have to pay your supplier (A/P lag). For 5 days, you have inventory available for sale with none of your own cash tied up. If you deliver it to your customer on the 40th day of the production cycle, your customer has 30 more days to pay for it. On that day, your cash has been tied up in inventory for a total of only 25 days. (You didn’t have to pay your supplier for 5 of the 30 days after delivery.)
To recap, the working capital cycle represents the time in which working capital is “tied up.” If business managers can shorten the cycle, there will be less need for external financing, which means smaller interest payments and higher profits.
Managing Accounts Receivable and Accounts Payable
We have seen how A/P and A/R lags can affect cash flow and that there is a need for a policy that balances the company’s need for readily available cash, the need to offer credit to customers, and the need to pay suppliers.
One way a business can attract customers and increase sales is to “sell on credit”—to allow the customer to have the product before paying for it. However, there are costs to extending credit. Selling product without receiving cash generates an accounts receivable. You are “loaning” your customer the money to buy your product. Normally a loan generates some value, usually an interest payment. An accounts receivable “loan” usually generates value through increased sales, not a cash interest payment. The total dollar amount of receivables is cash that is “tied up” and thus unavailable for other uses. This amount is determined by the volume of sales and the average length of time between a sale and receipt of the full cash payment:
Accounts receivable = Credit sales per day x Length of collection period
For example, if a business has credit sales of $1,000 per day and allows 20 days for payment, it has a total of $1,000 x 20 or $20,000 invested in receivables at any given time. Any changes in the volume of sales or the length of the collection period will change the receivable position.
A credit policy refers to the decisions made about how to grant, monitor, and collect the cash for outstanding accounts receivable. Four factors must be considered in establishing an effective credit policy:
1. Creditworthiness standards—Can your customers pay you back?
2. Credit period—How long do they have to pay?
3. Collection policy—What will you do if they do not pay?
4. Early payment discount—Do you give them a discount if they pay early?
Purchasing equipment and raw materials represents a large portion of total operating expenses. A small manufacturing firm may spend in excess of 70% of total sales purchasing raw materials and converting them into finished goods (Cost of Goods Sold or COGS is 70% of sales and gross margin is 30%). In this type of business, accounts payable becomes an important source of financing in the short term. In essence, you are borrowing the use of the materials from your suppliers to create products. When you sell the products, you will have the required cash to pay back your suppliers.
38 • Comprehensive Business Review Concepts and Cases with Capstone® Business Simulation
As we covered earlier, however, the amount of time you can use the materials “on credit” is the A/P lag. As your accounts payable gets larger, your suppliers become reluctant to provide more materials, and if you don’t have materials, you can’t produce products. Managing prompt payments of accounts and keeping repayment cycles as short as possible make the company an attractive customer.
Managing Inventory
Because a company’s profitability depends on its ability to sell its products, it must have enough inventory to meet demand. So the same important question we discussed in the marketing section (Chapter 2) remains—how much inventory is needed? The answer begins with the sales forecast, but because the sales forecast depends on many factors outside the control of a business, inventory management is challenging. Holding inventory levels at less than what is needed will cost the company in lost sales. Holding inventory in excess of what is needed will also cost the company because of storage and insurance costs. In addition, as we discussed earlier, holding inventory ties up cash so that it cannot be used for other purposes. We need sufficient inventory to cover our expected sales, but we may also want to prepare for potential sales increases by holding some level of “safety stock.” The amount of safety stock is determined by comparing the cost of maintaining the additional inventory to the cost of potential sales losses due to not having adequate levels of inventory.
The following ratios are used to determine the optimal amount of each product to keep in inventory:
Inventory turnover rate = Cost of goods sold / Inventory
Inventory turnover days = Number of days in a period / Inventory turnover rate
Ideal inventory = Cost of goods sold/ Industry average turnover rate
For example, last year your business sold goods that cost $100,000 and your average inventory for the year was worth $10,000. The inventory turnover rate for last year was $100,000 / $10,000, or 10 times. Furthermore, the company’s inventory turnover days were 360 days/10, or 36 days. These numbers indicate that during the past year, your inventory turned over 10 times and, on average, it took 36 days to sell the entire inventory. When compared with industry averages, the relative strength of your inventory management is revealed. A low inventory turnover rate could indicate overstocking, whereas high inventory turnover days can represent slow sales.
If the average industry turnover rate is 12 times, the ideal inventory levels for your company for the year should have been $100,000 / 12 = $8,333.
This figure may be used as a guideline for determining inventory levels during the current year.
The total costs associated with inventory include the time value of capital tied up in inventories; storage and handling expenses; and insurance, taxes, and costs relating to obsolete inventory. These costs are generally referred to as the inventory carrying costs. These carrying costs increase as inventory levels rise.
Inventory and Bankruptcy One of the major reasons Capstone companies go bankrupt is because they hold too
much inventory. Sales forecasts were not met, and the companies’ warehouses are
full of stock that is tying up cash—leaving nothing left to run daily operations. Pay
close attention to honing your forecasting skills and improving them with every round
of the simulation as you become more comfortable with the calculations and more
attuned to your competitors’ strategies.
Chapter 4 Accounting: How Do We Keep Track of the Money? • 39
The Income Statement
The income statement records all the company’s revenues and expenses, compares them, and calculates the difference between them. The difference between your revenues and expenses is your profit—or loss—for the period. If you want to know whether a business is making a profit on its goods and services, simply look at the income statement, also called a profit and loss statement.
One way to think of the income statement is as a movie of what’s happening in the business. It shows all the activities related to getting your products and services into your customers’ hands—from the purchase of raw materials all the way through to delivery.
Here is how a traditional income statement is organized:The first line is your total sales for the period, or net sales/revenue. It is net revenue because it reports how much the company has received, after discounts or other allowances you gave your customers have been deducted, from the total (gross) sales number.
From that number, net revenue, we deduct the Cost of Goods Sold (COGS). The cost of goods sold is just as it sounds—a tally of all the costs associated with the production of the goods and services you provide. That number gives us a gross profit, which is also called gross margin.Gross margin is simply the net sales minus all of the direct costs of making your products or services—costs that include materials and labor plus depreciation on the plant and equipment you use.
Moving down the income statement, we get to Selling and General Administration Expenses, or SG&A. That accounts for all the administrative costs of doing business, such as marketing, salaries for your staff at headquarters, insurance policies, legal advice, and more.
The next line, non-operating items, includes miscellaneous expenses that must be accounted for but are not part of the company’s regular business activities. Let’s say, for example, a computer company sells a building it doesn’t need. The profit or loss from the sale is recorded in this section so it does not distort the picture we’re building of the core operations of the business.
Once all of the expenses and non-operating items have been accounted for, we get down to Earnings Before Interest and Tax, or EBIT. What comes next is the interest we paid our lenders on money borrowed and the taxes we pay various governments for the privilege of doing business.
After those two final costs are deducted, we get to net profit (also called earnings).
Your Capstone Income Statement
In the simulation, we use a variation of the traditional income statement that allows us to calculate a contribution margin rather than a gross margin. This is often called a “period and variable costs layout.” It provides information about each product’s contribution margin, which—as we discussed in Chapter 3—represents the fraction of the sale price that contributes to offsetting the fixed costs of the business.
As explained earlier, a business has two classes of expenses—period or fixed costs and variable costs. Variable costs vary with sales volume in the business—with the number of goods or services you sell. Take material costs, for example. If you’re selling more products, you are spending more on materials to make the products. Or look at labor. If you’re making more products, you are spending more on labor either by increasing the size of your workforce or by paying your existing workers overtime.
Fixed costs, however, stay the same, within a fairly large range, no matter how much or how little operational activity takes place during the year. They are fixed for that period.

40 • Comprehensive Business Review Concepts and Cases with Capstone® Business Simulation
These are often called your “overhead.” Fixed costs include research and development, interest payments and depreciation, and office expenses like rent and electricity. Whether you sell one product or a thousand products, the fixed costs still have to be paid.
In a traditional income statement, remember, we deducted all of the fixed and variable costs from the net revenue to give a gross margin. In a period and variable costs income statement, we first deduct just the variable costs to give a contribution margin, and then we deduct the fixed costs. By calculating the contribution margin, you discover how much income from each product line is left over, after production costs are taken out, to contribute to your fixed costs.
In your Capstone income statement, under each product name, the first line is net sales. Then we deduct the variable costs first—labor, materials, and inventory carrying costs—which gives us the contribution margin.
Next, we deduct the fixed costs—depreciation and the SG&A costs—which gives us a net margin.
The benefit of separating period and variable costs is that it helps us, as managers, to focus on the variable costs of production and to develop tactics to minimize them. The higher the contribution margin—the more money left from each sale to pay for overhead and go into profit—the better your bottom line will be.
The following chart will help you understand the various lines of the income statement.
Income Statement
RevenueFunds that come into the company from the sale of goods or services. These can be sales that are in cash or on credit.
Variable CostsCosts that vary with the level of activity—the more products you make, the greater the total cost.
Material costsThe cost of the materials (raw material and component parts) that were used in the products you sold.
Labor costs The cost of the labor (human resources) used to produce the products sold.
Inventory carrying costsThe costs (warehousing, insurance, etc.) of having inventory available for sale but not yet sold.
Total Variable Costs Cost of Goods Sold (COGS)
This is the cost of making the products sold.
Contribution MarginThe difference between the revenue brought in by sales and the cost of making the products for sale. This difference is what is left over to cover fixed costs and, finally, to generate a profit.
Period CostsThose costs that are fixed over a period of time. These do not vary with the level of activity.
DepreciationThis figure recognizes the amount of value that operating a business “uses up” in the plant (factory) and equipment.
Research and Development (R&D)The investment the company makes in developing new products or improving existing ones.
Marketing expenseThe investment the company makes in advertising, selling, and distributing products.
Administrative expense The cost of running a business, legal expenses, accounting services, etc.
Total Period Costs The costs of operating your business over a period of time.

Chapter 4 Accounting: How Do We Keep Track of the Money? • 41
Earnings Before Interest and Taxes (EBIT), or Net Margin
Revenues minus variable costs (contribution margin) minus period costs.
Interest expenseThe fee you pay to use other people’s cash. This is the expense of your financing strategy.
Taxes The revenue you pay to the government as a citizen of a society.
Net IncomeRevenues minus variable costs minus period costs minus interest expenses and taxes. This is synonymous with profit, earnings, “return,” and “bottom line.” Creating net income for its owners is the reason a business exists.
Recognition of Transactions
As soon as an agreement is made between a company and its customers or suppliers, the transaction has to be recognized on the books. In other words, it is recorded when it occurs and not when the cash is exchanged. Often a company’s income statement might show a company is profitable, but still the company runs out of cash. This may happen in the growth phase when the company is investing in its growth yet does not have the cash available to pay its debts because it still has products in development that are not ready for sale.
All of these occurrences are captured in the company’s financial statements according to the rules that underpin accounting such as historical cost and the matching principle. The key message from this chapter is this: It is critical for a company to manage its cash flow first and then to focus on managing its profitability over the long term. Run out of cash, and there is no long term.

42 • Comprehensive Business Review Concepts and Cases with Capstone® Business Simulation
Chapter Review Questions
Cash and the Cash Flow Statement
5. Describe the difference between profit and cash.
6. What are the differences between cash from operating activities, cash from investing activities, and cash from financing activities?
7. What is depreciation, and what does it do to cash flow?
Cash and the Working Capital Cycle
8. Why is it important to understand working capital?
9. How does working capital relate to the cash flow statement?
10. What is the working capital cycle, and why does it matter?
11. What might be the ramifications, financially and from a marketing perspective, of increasing the accounts receivable lag time?
12. What are the trade-offs of selling products on credit?
13. What is the inventory turnover rate, and how is it measured?
The Income Statement
14. What is the benefit of separating period and variable costs on the income statement?
15. What does a contribution margin represent?
16. What is the relationship between revenue and net income on the income statement?

Chapter 5 Finance: How Do We Raise Funds, Reward Shareholders, and Manage Our Assets? • 43
Chapter 5Finance: How Do We Raise Funds, Reward Shareholders, and Manage Our Assets?LEARNING GOALS
After reading this chapter you will be able to:• Discuss the importance of a financing strategy to a company’s performance.
• Define the role of risk with regard to investment decisions.
• Differentiate between the two types of transactions used to gain access to additional funds.
• Describe the similarities and differences between loans and bonds.
• Describe how the bond market impacts bond value.
• Discuss how to evaluate the quality of bonds.
• Differentiate between common stock and preferred stock.
• Discuss why a company would choose to pay dividends.
• Describe the purpose of the balance sheet.
• Discuss the kind of information found on the balance sheet.
• Differentiate between assets and liabilities.
Cash Does Not Equal Net Profit
In Chapter 4, we took a good look at money moving through the business, how we keep track of cash on a cash flow statement, and how to keep an eye on profit with the income statement. We also looked at some of the accounting rules
that businesses are required to follow when they report their results to external stakeholders.
A point that has been made several times is that cash does not equal profit. All the net profit number in the income statement shows is whether the “movie” of your business is going to have a happy ending or not. That is, if your products and services are making an overall profit.
All the decisions managers make in running a business either cost the company money or make the company money. If the company brings in more money than it pays out, then management is running a profitable business! It sounds simple, but as you already know, making money involves many individual decisions in different areas of the business, and all of these decisions need to be coordinated.
How Much Cash Does a Business Need?
The important question for managers is “How much cash does the business need?” Managers must be sure they have enough cash available to cover the company’s day-to-day transactions, and that is called the transaction balance. However, they may want to keep some extra cash on hand to take advantage of special bargains (e.g., a supplier’s clearance sale of raw materials), to take advantage of discounts offered by suppliers for early payment of your bills (accounts payable), or as a precaution against emergencies (any unexpected expense). The cash held for such purposes is called the speculative cash balance.
44 • Comprehensive Business Review Concepts and Cases with Capstone® Business Simulation
There are many advantages to having enough cash on hand and many problems when you don’t have enough. Cash, however, does not work for you. Cash does not earn an explicit return. If you have too much cash on hand, you are not using your assets effectively and your cash is not being used in the most productive manner.
Answering “how much is enough” is a critical management skill. As an alternative to holding large cash balances, many companies hold part of their liquid funds in short-term marketable securities. These instruments earn interest and can be very easily converted to cash. In the US, for example, there are several types of short-term marketable securities such as: Treasury Bills (T-Bills), short-term loans secured by the US Government with a denomination of at least $10,000 and that mature in less than 1 year. Sold at a discount, the buyer pays an amount less than the face value of the T-Bill but still receives the full amount when the bill matures. Commercial paper is an unsecured loan to a large corporation with good and well-established credit ratings. These loans usually mature between 15 and 45 days (but it can be anywhere from 1 to 270 days). Certificates of deposit (CDs) are popular short-term instruments issued by commercial banks. CDs are issued in denominations up to $100,000 and may be traded in the secondary market. The Federal Deposit Insurance Corporation (FDIC) insures CDs.
Financing Your Capstone Company In Capstone—just as in the real world—if you don’t have enough cash or don’t bring
in enough revenue from the products or services you sell, if you have too much
money tied up in unsold inventory, or if you don’t supplement your sales income with
borrowing to cover your investments, you may become bankrupt.
The simulation ensures that a bankruptcy doesn’t put you out of the game, but the
emergency loan that will see your company through comes at an interest rate of 7.5%
above your current rate.
To ensure you don’t run out of cash, you need to do two things in every round of
the game: manage your cash flow and decide how to fund your investments. In
the previous chapter, we discussed managing your cash flow from operations. In
this chapter, we turn our discussion to managing your cash from investment and
financing activities.
Capstone gives you the opportunity to manage your investments and finance in
a variety of ways. You will need to answer important questions. What’s the best
financing option for the investments you want to make? Short-term loans? Bonds?
Do we increase or decrease stockholdings? Do we pay our shareholders a dividend
this year?
The Finance screen in the simulation shows that you need to make decisions in
four areas:
Current debt (short-term loans—how much will you borrow?)
Bonds (long-term loans—will you maintain them or pay them off?)
Stock (should you issue more or buy some back?)
Dividend policy (do you share profits with your owners this year?)

Chapter 5 Finance: How Do We Raise Funds, Reward Shareholders, and Manage Our Assets? • 45
Investment Financing: Getting Cash to Grow Your Business
Growing companies need money to fuel their growth. They need money to develop new products, to buy new equipment, to launch new promotion campaigns, and to take advantage of opportunities in the market as they emerge.Individuals or organizations that might provide money to allow you to grow your business want something from you. It is an economic transaction that follows the rules of all economic transactions; people will only participate if they are made better off through the transaction.
There are basically two kinds of transactions that allow you to get access to additional funds: (1) taking on debt (loans or bonds) and (2) taking on new owners (stockholders). Both of these transactions have one thing in common: they provide cash to help the business thrive. In all other ways, however, they are quite different. Before we get into the details of these types of transactions, however, it is important to discuss the concept of “risk” because it underlies all investment and financing activities.
Risk
Put simply, risk is the possibility of losing some or all of an investment. In other words, risk represents the chance that an investment’s actual return will be different than what is expected. For example, if you have money to invest, it represents wealth that you have created in the past and not yet consumed. You could use that wealth to buy tools that would allow you to create something of value that you could take to the market. This investment in yourself would give you a greater ability to create wealth in the future. However, if you are not going to use it yourself, you still want to put it to work. You want that money to work for you as hard as it can, 24 hours a day. One way to do that is let others use your money to create wealth that will come back to you in some form.
If you are a person who has money to invest, what do you want out of the transaction? You want the highest return you can get for your money, and you want to be sure that you do not lose your money. The degree of certainty (or uncertainty) that you will get your money back is the risk. In a market system, you have a lot of choices about how to put your money to work.
You might be attached to your money and only want it to work in a safe and secure environment. If that is what you want, you only “rent” your money to people who are going to use it conservatively. Maybe you rent it to the government, which can guarantee its safe return. The problem is that everything else being equal (which it isn’t), there are a lot of people willing to put their money out for a safe use. When there is a lot of money competing to be put to safe use, it is easy for those “safe users” (e.g., electric utilities or governments) to get the use of that money cheaply. For the person investing the money, therefore, the “return” is expected to be low.
On the other hand, you might be willing to risk your money in the hope of high returns by giving it to someone who will use it in a venture that just might not work out economically, but, if it does, will provide a very high return. That’s your risk. For instance, you might put your money to work in a biotech firm. They always need more money to create useful mutant biological stuff. The problem is that at this point, a low percentage of biotech projects work out. The ones that do work out, however, can make huge amounts of money. To rent your money or attract interest, they have to offer you a high return on those funds. The common rule is:
The higher the risk, the greater the expected return.
Now that we have discussed the concept of risk and introduced the broad ways a company can gain access to cash (taking on debt and/or new owners), let’s turn our attention to the accounting instrument used to record a company’s financing activities—the balance sheet.
46 • Comprehensive Business Review Concepts and Cases with Capstone® Business Simulation
The Balance Sheet: Documenting Assets and Liabilities
In Chapter 4, we called the income statement a financial “movie” that shows how money moves through the business over time. The balance sheet, in contrast, is a financial snapshot of the assets and liabilities of the business at any one point in time. It’s a “freeze frame,” giving you the exact financial position of a company’s assets and liabilities at a certain point in its history. Keep in mind that the difference between all assets minus all liabilities is the value of the company that is retained for its shareholders—the equity.
Financial Snapshot
A balance sheet snapshot of a business can be produced at any time, for shareholders or for potential buyers for example, but is always produced for shareholders at the close of the financial year. The financial (or fiscal) year for most companies in the US ends on December 31, but in other parts of the world, the financial year may end on June 30. It really doesn’t matter when a financial year starts or ends as long as it covers 12 months.
A business, of course, is dynamic and thus changes not just day-to-day but, in many cases, hour-by-hour. Because of this, it’s important to remember that the balance sheet represents just one point in time and, like the other financial statements, is a way of presenting a company’s financial information in a uniform way.
There are three parts to the balance sheet. On one side are the company’s assets (what you own). On the other side are liabilities (what you owe) plus the owners’ equity in the business. Owners’ equity is known by several names such as Stockholders’ Equity, Shareholders’ Equity, and Net Worth.
Whatever you call it, owners’ equity means the same thing—it is what is left over after you deduct what you owe (your liabilities) from what you own (your assets). Put the opposite way, if you add your owners’ equity to your liabilities on one side of the balance sheet, you’ll get a figure equal to the value of your assets on the other side, because the balance sheet always balances.
There are two categories of assets on the asset side of the balance sheet, and they are current assets and long-term assets.
Current assets are things that can be converted into cash in less than a year, such as cash itself, accounts receivable, and inventory.
Long-term or fixed assets are things in which your company has a long-term investment, such as land and buildings or plant and equipment.
On the other side, liabilities are also divided into two categories: current liabilities and long-term liabilities. Current liabilities are debts you have to pay within a year (such as accounts payable), accrued expenses (expenses you owe but have not yet paid), and short-term debt (such as a loan you took out to cover your working expenses). Long-term liabilities are debts that you have more than 1 year to pay, such as mortgages or bonds.
Owners’ equity also has two major accounts—common stock and retained earnings. Common stock is the value of the company stock owned by shareholders. Retained earnings represent the profits the company chooses to reinvest, rather than pay out as a dividend.
Balance Sheet “Infrastructure”
Sometimes you’ll hear people talk about the “infrastructure” on a company’s balance sheet. That refers to how the assets of the business are supported—whether they are funded more by liabilities or debt or more by owner’s equity.
If the liabilities portion of the balance sheet is really high, that means most of your assets are financed through debt. In that case, the owners’ equity portion will be quite low. In this case, the company would find its investors and debt holders asking serious questions about why the management of the company is getting so deeply into debt. If debt gets too high, it threatens
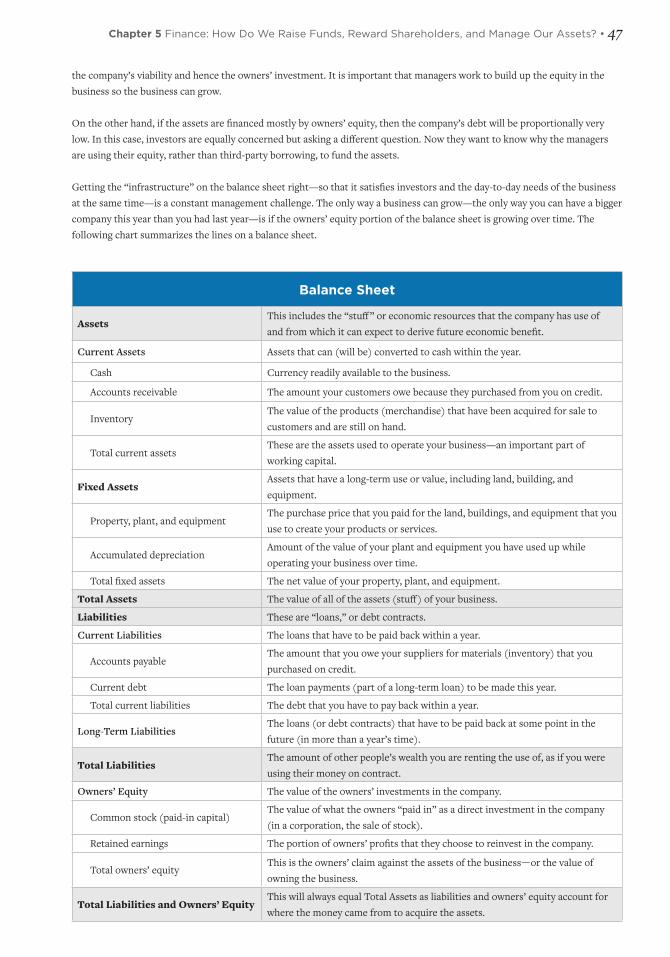
Chapter 5 Finance: How Do We Raise Funds, Reward Shareholders, and Manage Our Assets? • 47
the company’s viability and hence the owners’ investment. It is important that managers work to build up the equity in the business so the business can grow.
On the other hand, if the assets are financed mostly by owners’ equity, then the company’s debt will be proportionally very low. In this case, investors are equally concerned but asking a different question. Now they want to know why the managers are using their equity, rather than third-party borrowing, to fund the assets.
Getting the “infrastructure” on the balance sheet right—so that it satisfies investors and the day-to-day needs of the business at the same time—is a constant management challenge. The only way a business can grow—the only way you can have a bigger company this year than you had last year—is if the owners’ equity portion of the balance sheet is growing over time. The following chart summarizes the lines on a balance sheet.
Balance Sheet
AssetsThis includes the “stuff” or economic resources that the company has use of and from which it can expect to derive future economic benefit.
Current Assets Assets that can (will be) converted to cash within the year.
Cash Currency readily available to the business.
Accounts receivable The amount your customers owe because they purchased from you on credit.
InventoryThe value of the products (merchandise) that have been acquired for sale to customers and are still on hand.
Total current assetsThese are the assets used to operate your business—an important part of working capital.
Fixed AssetsAssets that have a long-term use or value, including land, building, and equipment.
Property, plant, and equipmentThe purchase price that you paid for the land, buildings, and equipment that you use to create your products or services.
Accumulated depreciationAmount of the value of your plant and equipment you have used up while operating your business over time.
Total fixed assets The net value of your property, plant, and equipment.
Total Assets The value of all of the assets (stuff) of your business.
Liabilities These are “loans,” or debt contracts.
Current Liabilities The loans that have to be paid back within a year.
Accounts payableThe amount that you owe your suppliers for materials (inventory) that you purchased on credit.
Current debt The loan payments (part of a long-term loan) to be made this year.
Total current liabilities The debt that you have to pay back within a year.
Long-Term LiabilitiesThe loans (or debt contracts) that have to be paid back at some point in the future (in more than a year’s time).
Total LiabilitiesThe amount of other people’s wealth you are renting the use of, as if you were using their money on contract.
Owners’ Equity The value of the owners’ investments in the company.
Common stock (paid-in capital)The value of what the owners “paid in” as a direct investment in the company (in a corporation, the sale of stock).
Retained earnings The portion of owners’ profits that they choose to reinvest in the company.
Total owners’ equityThis is the owners’ claim against the assets of the business—or the value of owning the business.
Total Liabilities and Owners’ EquityThis will always equal Total Assets as liabilities and owners’ equity account for where the money came from to acquire the assets.
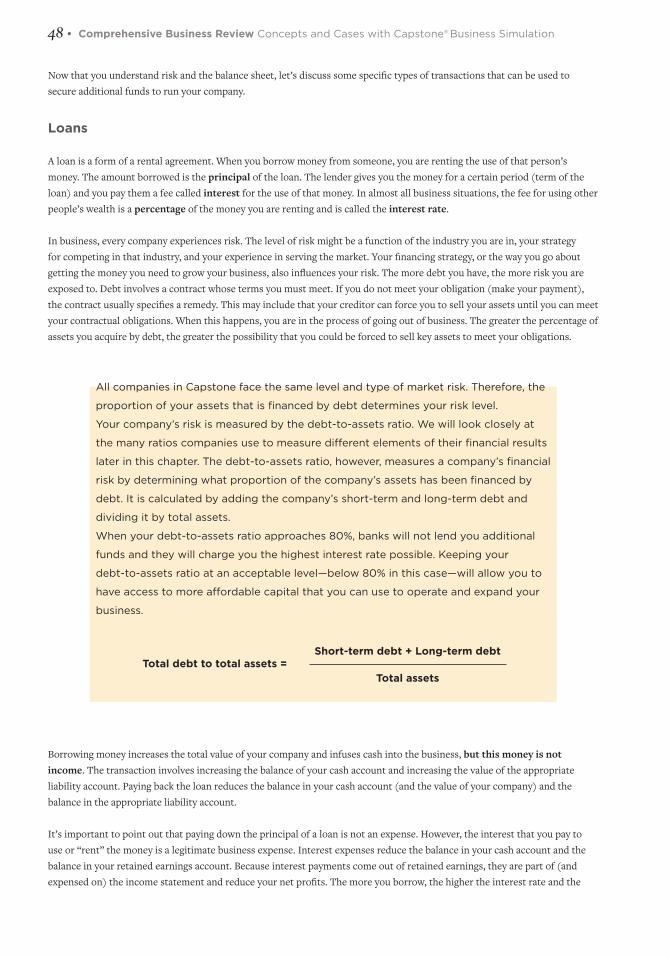
48 • Comprehensive Business Review Concepts and Cases with Capstone® Business Simulation
Now that you understand risk and the balance sheet, let’s discuss some specific types of transactions that can be used to secure additional funds to run your company.
Loans
A loan is a form of a rental agreement. When you borrow money from someone, you are renting the use of that person’s money. The amount borrowed is the principal of the loan. The lender gives you the money for a certain period (term of the loan) and you pay them a fee called interest for the use of that money. In almost all business situations, the fee for using other people’s wealth is a percentage of the money you are renting and is called the interest rate.
In business, every company experiences risk. The level of risk might be a function of the industry you are in, your strategy for competing in that industry, and your experience in serving the market. Your financing strategy, or the way you go about getting the money you need to grow your business, also influences your risk. The more debt you have, the more risk you are exposed to. Debt involves a contract whose terms you must meet. If you do not meet your obligation (make your payment), the contract usually specifies a remedy. This may include that your creditor can force you to sell your assets until you can meet your contractual obligations. When this happens, you are in the process of going out of business. The greater the percentage of assets you acquire by debt, the greater the possibility that you could be forced to sell key assets to meet your obligations.
All companies in Capstone face the same level and type of market risk. Therefore, the
proportion of your assets that is financed by debt determines your risk level.
Your company’s risk is measured by the debt-to-assets ratio. We will look closely at
the many ratios companies use to measure different elements of their financial results
later in this chapter. The debt-to-assets ratio, however, measures a company’s financial
risk by determining what proportion of the company’s assets has been financed by
debt. It is calculated by adding the company’s short-term and long-term debt and
dividing it by total assets.
When your debt-to-assets ratio approaches 80%, banks will not lend you additional
funds and they will charge you the highest interest rate possible. Keeping your
debt-to-assets ratio at an acceptable level—below 80% in this case—will allow you to
have access to more affordable capital that you can use to operate and expand your
business.
Borrowing money increases the total value of your company and infuses cash into the business, but this money is not income. The transaction involves increasing the balance of your cash account and increasing the value of the appropriate liability account. Paying back the loan reduces the balance in your cash account (and the value of your company) and the balance in the appropriate liability account.
It’s important to point out that paying down the principal of a loan is not an expense. However, the interest that you pay to use or “rent” the money is a legitimate business expense. Interest expenses reduce the balance in your cash account and the balance in your retained earnings account. Because interest payments come out of retained earnings, they are part of (and expensed on) the income statement and reduce your net profits. The more you borrow, the higher the interest rate and the
Total debt to total assets =Short-term debt + Long-term debt
Total assets

Chapter 5 Finance: How Do We Raise Funds, Reward Shareholders, and Manage Our Assets? • 49
higher the interest payment. Additional payments against the principal reduce both the principal amount due and the interest payments.
Short-Term Bank Loans
Short-term loans are loans that need to be paid back within a year. Banks will lend funds to a business over the short term if they feel the business has a reasonable risk profile. Whether it is a savings bank or a commercial bank, the most important point to keep in mind when dealing with a bank is that bankers seek to avoid risk. Their primary concern is always the safety of their funds. Therefore, the company will not only need to fill out an application, but also provide documentation of financial history (past balance sheets and income statements) and submit a business plan to assess future potential financial success. This information allows the bank to assess risk.
Bonds and the Bond Market
A bond is a form of long-term financing. When you borrow money from a bank, you sign a debt contract to use the bank’s money for a certain period of time and to pay a specific rate of interest. You might have to pledge specific assets as security, or collateral, for the loan. If you miss payments, the bank can force you to sell those assets and use that money to retire the loan.
Companies and government entities can develop a similar debt contract, but instead of borrowing money from a bank, they can borrow money directly from investors. These debt contracts are called bonds. Bonds are referred to as securities because they represent secured (or asset-based) claims for the investors. Stocks are another type of security. These are secured or asset-based claims against the company. Both stocks and bonds are traded in securities markets.
The debt contract is called an “indenture” and contains the critical information of a loan including answers to these questions:
• Who is borrowing the money?
• How much money is being borrowed?
• For what period of time?
• At what rate of interest?
• How and when is the loan going to be paid off?
• How will the loan amount be secured?
When you borrow money from a bank, you provide information in the loan application that helps the bank determine how likely you are to meet the terms of the contract. The bank uses this assessment to determine whether or not to loan you the money and how high an interest rate they should charge. The higher the risk of nonpayment, the higher the interest rate you have to pay.
It is impractical for every investor who might want to buy a bond to assess the risk of the company (or government entity) that is issuing the bond. Instead, a few well-established companies, such as Moody’s and Standard & Poor’s, will assess the company and the bond issue and assign it a risk rating. The ratings range from AAA, which is excellent, to D, which indicates the organization presents an exceptionally high level of risk.
Bond ratings progress from a rating of “excellent” to “very poor” in the order indicated in the table below.

50 • Comprehensive Business Review Concepts and Cases with Capstone® Business Simulation
Excellent Low RiskAAAAAA
BBBBBB
CCCCCC
DDDDDD
Very Poor High Risk
The lower the bond rating, the higher the interest rate the issuing company will have to pay in order to attract investors. Companies get very concerned when their bond rating is degraded. It communicates a negative message to the financial community and to the market in general.
In the US, a company that wants to issue a new bond has to get permission from the Securities and Exchange Commission. The company then typically goes through an investment bank. An investment bank is a financial institution that specializes in issuing and reselling new securities such as stocks and bonds.
The company’s financial managers and the investment bankers evaluate the reasons for the bond issue (what the money will be used for), the length of the loan, how much money they want, and how much interest they expect to pay. The investment bank then works to market the new bond issue. They contact big investors—such as banks, insurance companies, and pension funds—to determine the willingness of the market to buy the bonds and to create a distribution network for the bond issue. The investment bank also underwrites (buys) a significant portion of the bond issue. This first sale of the newly issued security takes place in the primary securities market.
Because bonds are a secured claim, investors who own them can buy and sell them to other investors. These transactions occur in the secondary securities markets (or exchanges) or the “bond market.” In the bond market, the bond (debt contract) can trade above or below the face value of the bond. In general, bond prices move in the opposite direction of interest rates—as interest rates fall, bond prices go up, and as interest rates rise, bond prices drop.
A bond is an investment whose return is specified in the debt contract. Consider a very simple example: A $1,000 bond that pays 10% interest per year for 5 years.
As an investor, you view investments as shown below:
Years “Bond A”Year 1 $100
Year 2 $100
Year 3 $100
Year 4 $100
Year 5 $100 + $1,000
Total $1,500
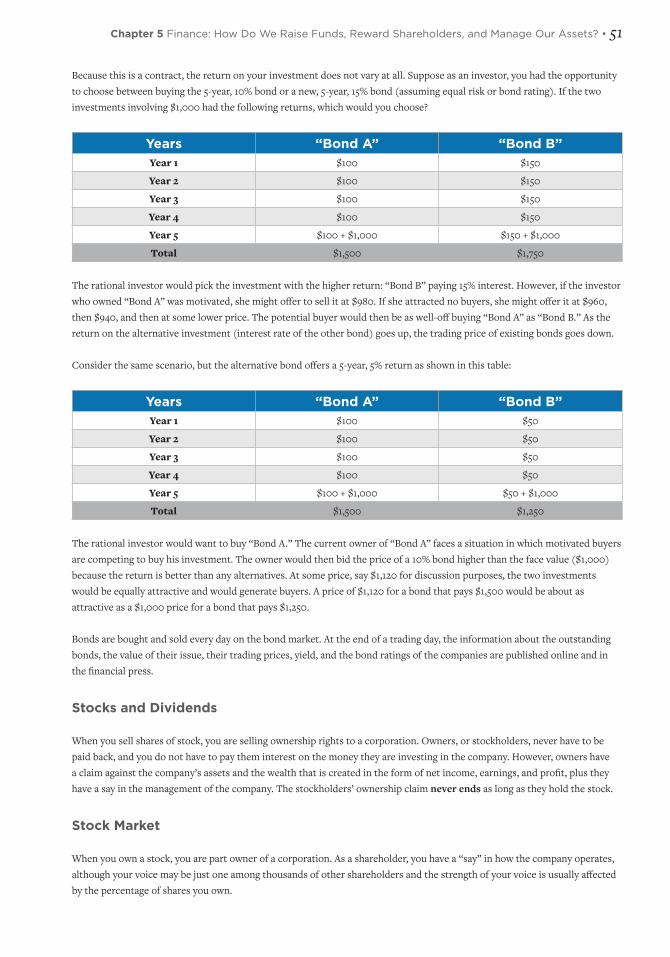
Chapter 5 Finance: How Do We Raise Funds, Reward Shareholders, and Manage Our Assets? • 51
Because this is a contract, the return on your investment does not vary at all. Suppose as an investor, you had the opportunity to choose between buying the 5-year, 10% bond or a new, 5-year, 15% bond (assuming equal risk or bond rating). If the two investments involving $1,000 had the following returns, which would you choose?
Years “Bond A” “Bond B”Year 1 $100 $150
Year 2 $100 $150
Year 3 $100 $150
Year 4 $100 $150
Year 5 $100 + $1,000 $150 + $1,000
Total $1,500 $1,750
The rational investor would pick the investment with the higher return: “Bond B” paying 15% interest. However, if the investor who owned “Bond A” was motivated, she might offer to sell it at $980. If she attracted no buyers, she might offer it at $960, then $940, and then at some lower price. The potential buyer would then be as well-off buying “Bond A” as “Bond B.” As the return on the alternative investment (interest rate of the other bond) goes up, the trading price of existing bonds goes down.
Consider the same scenario, but the alternative bond offers a 5-year, 5% return as shown in this table:
Years “Bond A” “Bond B”Year 1 $100 $50
Year 2 $100 $50
Year 3 $100 $50
Year 4 $100 $50
Year 5 $100 + $1,000 $50 + $1,000
Total $1,500 $1,250
The rational investor would want to buy “Bond A.” The current owner of “Bond A” faces a situation in which motivated buyers are competing to buy his investment. The owner would then bid the price of a 10% bond higher than the face value ($1,000) because the return is better than any alternatives. At some price, say $1,120 for discussion purposes, the two investments would be equally attractive and would generate buyers. A price of $1,120 for a bond that pays $1,500 would be about as attractive as a $1,000 price for a bond that pays $1,250.
Bonds are bought and sold every day on the bond market. At the end of a trading day, the information about the outstanding bonds, the value of their issue, their trading prices, yield, and the bond ratings of the companies are published online and in the financial press.
Stocks and Dividends
When you sell shares of stock, you are selling ownership rights to a corporation. Owners, or stockholders, never have to be paid back, and you do not have to pay them interest on the money they are investing in the company. However, owners have a claim against the company’s assets and the wealth that is created in the form of net income, earnings, and profit, plus they have a say in the management of the company. The stockholders’ ownership claim never ends as long as they hold the stock.
Stock Market
When you own a stock, you are part owner of a corporation. As a shareholder, you have a “say” in how the company operates, although your voice may be just one among thousands of other shareholders and the strength of your voice is usually affected by the percentage of shares you own.
52 • Comprehensive Business Review Concepts and Cases with Capstone® Business Simulation
Companies initially issue stock to raise capital to run their businesses, often motivated by the fact that they need more money. A corporation sells shares to investors in an organized fashion called a public offering, the first of which is its Initial Public Offering, or IPO. After the company’s IPO, investors are free to sell their shares and buy more, but not from the company directly. Instead, shares are traded on organized stock markets like the New York, London, or Hong Kong Stock Exchanges.A company can issue common stock or preferred stock. Common stock represents a simple share of ownership and each common stock share has one vote to cast when electing the corporation’s board of directors. If the company were to go bankrupt, the corporation would have no financial liability to common shareholders, and those shares may become worthless.
Preferred stock, a form of stock that is traded at a far lower volume than common stock, does have privileges. Preferred shareholders, often those having some kind of history or relationship with the company, may receive higher dividends and have the first claim to assets if the company goes bankrupt.
Shares of stock are traditionally represented by a piece of paper called a stock certificate. Since shares of stock trade electronically, you may never actually see a physical certificate for the shares that you own. The brokerage holds the shares on your behalf in what is known as a “street name,” which is nothing more than a method of bookkeeping and has no effect on your ownership of the stock. Owning shares in street name is much more efficient and convenient, especially when it is time to sell the stock.
Like a bond, stocks are secured investments. They have a claim against the assets of the company. The company sells new shares of stock to potential owners through the primary securities market in a process similar to the way new bond issues are sold. The company meets with an investment banker who reviews the business strategy and specific plans for the money that is to be raised. The investment bank underwrites (or buys), markets, and distributes the new shares. Under-writers charge commission and make money by holding some shares until the price per share rises.
Again, once stock has been issued, owners can buy from and sell to others on the secondary securities markets (exchanges) or stock markets around the world. The company itself receives no cash for shares that are sold in the secondary markets, and every corporation wants to see its stock price increase for the benefit of its shareholders and the financial reputation of the corporation.
If you are a potential investor, you have choices about which company’s shares you might want to purchase. You want to invest your money in a company that is going to create as much wealth for you as possible.
There are two ways in which owning stock increases your wealth: when the value of your shares increases as the stock price goes up and when the company distributes to owners some of the profits it has created in the form of cash payments called dividends.
Paying Dividends
When a company creates profit, the profit belongs to the owners. There are only two things that can happen with that profit: it can be kept in the company as retained earnings or it can be distributed to the owners in the form of a cash disbursement or payment. If it is paid out to the owners, it reduces the amount of cash on hand.

Chapter 5 Finance: How Do We Raise Funds, Reward Shareholders, and Manage Our Assets? • 53
Dividends should be paid from the profits of the business. When you are managing
your Capstone company, it is generally not a good idea to pay dividends in a year
in which you are borrowing money. Owners and the market for potential owners
interpret this as borrowing money to pay the dividend. The owners give the managers
of the company their money to grow their wealth, not for the managers to take out
loans in their name. Owners do not like managers to hold “excessive” cash balances. It
is the owners’ money, and they expect those funds to create more wealth. Cash does
not earn any significant return. Owners think that if you do not have a productive use
for their cash, you should give it back to them by paying a dividend. A “productive
use” is to invest it in new products, make facility improvements, or take other actions
that will put that cash to work for the business.
Value and Stock Claims
Interactions between buyers and sellers determine stock price. A potential buyer might consider three things in determining how much to pay for stock in a particular company:
1. The value of the stock‘s claim against the assets of the company.
2. How much profit the company makes per share of stock.
3. How much of that profit is distributed to owners (as a dividend).
The value of this claim is determined by dividing the total owners’ equity from the balance sheet by the number of shares outstanding. For instance, if the value of the owners’ claim is $100 million and there are 2 million shares of stock issued and outstanding, then each share has a claim against the assets of the company worth $50. This is called the book value of the stock.
There are two ways to increase book value:1. Increase the value of total owners’ equity.
2. Reduce the number of shares outstanding by buying back stock.
The easiest way to increase owners’ equity is to make a profit to reinvest, or retain, in the company. That increases the value of the “retained earnings” account. If you sell more shares to increase the value of the common stock account, you have increased the value of total owners’ equity, but you have also increased the number of shares you have to divide it by, in order to get book value. In general, current owners would prefer that you borrow money to grow the company, if you can afford the interest payments, rather than dilute the value of their claim.

54 • Comprehensive Business Review Concepts and Cases with Capstone® Business Simulation
Cash Flow from Investing and Financing Activities in Capstone In Chapter 4, we looked in detail at the first category of cash on the cash flow
statement, cash flows from operating activities, including depreciation, accounts
payable, and receivable, and inventory. The two other categories of cash—from
investing and financing—are linked to the issues we have discussed above.
The second category of cash, cash flow from investing activities, includes the changes
in plant and equipment we discussed in Chapter 3—such as adding capacity and
increasing automation levels or selling off your unused production capacity.
The third category tells you what cash came in and what went out on financing
activities. That includes both short-term borrowing such as loans, and long-term
investing such as share transactions and the purchase or retirement of bonds.
Your Capstone simulation updates your financial statements every time you make
a decision. Now that you understand the balance sheet, you can use it plus the
cash flow statement to discover exactly how much cash is available for operating
your business right now. Just take the change in cash position from your cash flow
statement and add it to the cash line on your balance sheet.
Here’s an example. If your balance sheet showed $10 million in cash on December 31
last year and your cash flow statement shows a change in cash position of -$3 million
today, you have $7 million left in cash to run the business today.
Recap: Cash Flows, Financials, and Company Performance
Now is a good time for a quick recap of what we have covered. In Chapter 4, we introduced the three types of financial reports used to summarize a company’s financial standing, focusing on the cash flow statement and the income statement. In this chapter, we reviewed the ways a company can gain access to additional cash to run its operations and to grow its business and focused on the balance sheet. All three financial statements provide important information for your decision-making as a manager:
• The cash flow statement helps keep track of cash and ensure you always have enough on hand to keep business operations running smoothly.
• The income statement shows where you are (or are not) making a profit and, therefore, which parts of the business require more attention.
• The balance sheet demonstrates the way you—as a manager of a business—are working on the owners’ investment in the business.
Chapter 5 Finance: How Do We Raise Funds, Reward Shareholders, and Manage Our Assets? • 55
Financial Ratios
One way to measure whether you are operating a sustainable and profitable company is to keep a close eye on measures called financial ratios. These are terms you may have heard during discussions about business and include:
• Return on equity (ROE)
• Return on assets (ROA)
• Return on sales (ROS)
• Asset Turnover
The ratios mentioned above are all “profitability ratios” because they compare various numbers (e.g., sales or assets) with the profit the company is generating. However, you can also measure success using “market ratios” such as overall market share or market capitalization that demonstrate how well the company is performing in the marketplace compared with its competitors.
Profitability Ratios
We know that a business exists to make a profit; so, profit is a very clear measure of success. However, what represents a “good” profit result or a “bad” profit result is a function of the type of business you are in. We balance other elements—such as sales or assets—against the profit number to give more information about the quality of the result for the business we are measuring.
In accounting, the word “return” means the company’s profit compared with another element of the company’s financial results. Below are the key profitability ratios and how to read them.
Return on equity
Profits
Equity Return on equity (ROE) compares the equity that the owners of the business have tied up in the business with its profit.
You’ll remember from our focus on the balance sheet that owners’ equity or net worth is common stock plus retained earnings—the accumulation of net profits over the years that were not paid back to the owners in dividends. To assess the return on that equity, we take net profit for the year and divide it by shareholders’ equity to get return on equity.
Return on assets
Profits
Assets
Return on assets (ROA) gives us a different perspective on the company’s returns in relation to its assets. ROA is a way of looking at the stewardship of the company. It compares profit with the total assets of the business. We have a value for our assets—that is, how much we have tied up in the business. ROA tells us how much profit the managers of the business—the stewards of those assets—are able to make on those assets.
We calculate ROA by taking net profit and dividing it by the assets on the balance sheet. ROA is a vital measure for assessing the health of asset-heavy businesses with lots of money tied up in plant and equipment, raw materials, and inventory.
ROA is an excellent measure of both the effectiveness and efficiency of the operations side of the business. A high ratio indicates good utilization of company resources.
56 • Comprehensive Business Review Concepts and Cases with Capstone® Business Simulation
Return on sales
Profits
Sales Return on sales (ROS) compares profit with sales. ROS looks at the revenue or the sales dollars we’ve generated from our products and services to see what percentage of that goes all the way to the bottom line into net profit.
Think of ROS as an efficiency measure. It answers this question: Of every dollar that comes into the business, how many cents does the business get to keep? What percentage of your sales ends up in net profit?
For example, if the total sales for a business is $2 million and the profit is $200,000, we divide $200,000 into $2 million for an ROS of 10%, meaning 10 cents in every dollar is profit.
Is 10% ROS a good result or a poor result? That all depends on the type of industry and the type of company we are looking at. In a commodity business—like a supermarket, for example—ROS will be low because only a few cents from each item makes it into profit. These businesses focus on large volume sales, not profits on individual items to drive their profits. A 4% ROS for a supermarket, then, would be excellent. However, for a company in high tech electronics where volumes are low but the company makes a high margin on every sale, 4% would be a dismal ROS.
Asset turnover
Sales
Assets Asset turnover compares sales with the company’s assets. Asset turnover doesn’t look directly at profit, but it implies something about profit. It is a measure of how effectively we’ve used our assets in generating revenue.
Asset turnover is calculated by taking sales for a given period divided by the asset base on the balance sheet. How often can your sales match the value of your assets in that period? How often can you make your assets earn their keep or how often have you “turned over” the value of your assets?
If, for example, you have assets of $1 million and your sales during the year are $1.5 million, then your asset turnover is 1.5, $1.5 million divided by $1 million.
Market Ratios
Market ratios assess a company’s health according to its stock price and other relationships in the stock market. These ratios, of course, are only relevant for publicly traded corporations, such as your Capstone company.
Earnings per shareLet’s start with earnings per share (EPS). EPS is reported for a publicly traded corporation every quarter and is viewed as a critical number in terms of assessing the value of a company’s stock.
EPS is calculated by taking net profit for the quarter or year in question and dividing it by the number of shares outstanding—or the number of shares held in the marketplace. Predictions over whether EPS will be up or down—higher or lower than estimated—have a great deal of immediate impact on stock price.
In some ways, that impact is misleading. Companies that show a profit can still become bankrupt if they don’t manage their cash flow, and EPS ignores how much cash a company has, or does not have, to run its operations.

Chapter 5 Finance: How Do We Raise Funds, Reward Shareholders, and Manage Our Assets? • 57
As a qualifier, then, analysts and businesspeople will often discuss the “quality of earnings” to suggest their confidence that the profits reflected in the EPS will turn into cash. In this way, they are of higher quality than virtual or imagined profits created by accounting tricks.
Price to earningsThe next market ratio is the price to earnings (P to E) ratio. P to E is calculated by taking the stock price at a given point in time and dividing it by earnings per share. This usually results in a large positive number. For example, the stock price might be 10 times the earnings per share or 20 times the earnings per share. This number is often referred to as the “multiple” instead of the P to E ratio—simply because it’s a multiple of EPS.
Managers will often discuss the relative size of their P to E ratio, at times bemoaning the fact that it’s too low: “Our stock price should be worth more than 10 times our earnings per share!” Unfortunately, while that may be the managers’ assessment, it’s not the market’s assessment.
On the other hand, sometimes you’ll hear analysts say that the P to E multiple is too high, suggesting overvaluation of stock on the market. A correction usually follows.
Dividend yieldWhen a company pays a dividend, that dividend is often compared to the trading value of the stock price in the stock market in a ratio called the dividend yield. Dividend yield is calculated as the dividend divided by the stock price.
The dividend yield is the percentage of returns generated compared with the stock price. This is similar to the interest on your bank account. When you assess that interest, you compare it with the capital tied up in the account. The dividend yield tells you what your “interest” is on the money you have tied up in a stock.
In Chapter 6, we will look at some other ways to assess a company’s performance and the importance of aligning all the decisions that are made about how to run the business with the company’s overall strategy.

58 • Comprehensive Business Review Concepts and Cases with Capstone® Business Simulation
Chapter Review Questions
3. How does a company’s financing strategy impact its operations and performance?
4. What is risk, and how does it affect decisions about investment?
5. What is the primary difference between financing through loans versus stock?
6. What is a loan, and how do interest rates affect a company that takes out a loan?
7. In what ways are bonds different than loans?
8. How can we tell the difference in the quality of different bonds?
9. How are common stocks different from preferred stocks? Why would a company offer preferred stocks?
10. Why would a company choose to pay dividends?
11. What is the purpose of the balance sheet?
12. What is the difference between assets and liabilities?
13. What are the accounts that make up shareholders’ equity on the balance sheet?
14. What are the main profitability ratios?
15. What are the main market ratios?
For more information, check out the additional videos link below.
Financial Ratios: http://capsim.com/go/v/ratios
Financial Structure: http://capsim.com/go/v/structure
Chapter 6 Strategy: Strategy and the Strategic Management Process • 59
Chapter 6Strategy: Strategy and the Strategic Management ProcessLEARNING GOALS
After reading this chapter you will be able to:• Define strategy in the context of a business and describe its importance.
• Explain the five stages of the strategic management process.
• Define competitive advantage and explain how it can be created.
• Explain Porter’s Value Chain Analysis.
• Discuss benchmarking as a way to measure competitive advantage.
• Describe the use of a Balanced Scorecard to measure a company’s success.
• Discuss the role of ethics in strategy.
• Explain Mintzberg’s Five P’s of strategy.
• Discuss the five different strategies of a company.
• Compare and contrast intended and emergent strategies.
What Is a Strategy?
What comes to your mind when you hear the word “strategy”? Perhaps the term makes you think of a plan of action to accomplish a certain goal or to win against opponents in your favorite video game. The word strategy is derived from
the Greek word stratiyeia, which is a combination of the Greek words stratos meaning army and ago that connotes guiding, moving, or leading.
The goal of an army is to win a battle. The strategy required to win the battle comprises such factors as deciding where to operate from, when and how soldiers are going to be deployed, and how to use instruments of battle such as cannons and tanks. Regardless of the number of soldiers or material available to an army, a good strategy can be vital in winning a battle. George Washington’s badly outnumbered and poorly trained army was able to defeat the British in America’s war for independence largely because of Washington’s mastery of military strategy.
Strategy is important in the context of business as well. Just as generals draft strategies to win battles, company leaders design strategies to marshal resources, develop innovative products, penetrate chosen markets, and generate profits in the face of worldwide competition.
In business, a strategy can be defined as a blueprint that a company’s leaders use to make decisions regarding the allocation of resources, hiring and employee development, markets to enter and exit, and more. A strategy enables a company to bridge the gap between where it is and where it wants to be. A good strategy takes into consideration the uncertainties that the organization is likely to face and the possible strategies or competitive behaviors of business rivals, all the while keeping certain goals in mind. A good strategy also takes into account the impact on and the reactions of customers, suppliers, employees, and other stakeholders of a business.

60 • Comprehensive Business Review Concepts and Cases with Capstone® Business Simulation
The key components that need to be considered while formulating a strategy for a business are the following:• Which industry and markets to enter
• What products to develop
• How to use resources efficiently and effectively
• How to sustain product value over the long term
• How to generate profits in competitive markets
In this chapter, we’ll look at the importance of strategy in business, the strategic management process, how strategies sometimes conflict with ethics, and a few different types of strategies.
Goals, strategies, and plans—what’s the difference?
Suppose your goal is to set up a restaurant that serves an exotic cuisine. How you go about setting up the restaurant—or achieving the goal—would be your strategy. For example, deciding the target consumer market, the kind of chefs to hire, the obstacles you’re likely to face, and the targeted level of profits are part of your strategy. Your plans would be zooming in to define specific tasks that can be implemented on a daily, monthly, or annual basis. Plans include marketing plans, financial plans, and so on.
Why Is Strategy Important?
You may wonder why a company needs to have a clearly defined strategy. Suppose a company developed an innovative product a few years ago. Due to patent expiration or competition from other companies, a flood of similar products may make yesterday’s competitive advantage a distinct disadvantage in the current competitive environment. For example, Blackberry devices were “must have” products when they were introduced in the early 2000s. A Blackberry device enabled people for the first time to send and receive emails on the same device that served as a mobile phone. A Blackberry device was ubiquitous in business and launched a revolution in mobile communications. However, Blackberry devices are today seen as quaint relics of a bygone era where mobile devices were primarily used for email and voice communication. Blackberry became complacent with its dominant market position and failed to anticipate the smartphone revolution that made its flagship product obsolete.
Following are the ways in which a clearly defined strategy may help a business succeed in the present and into the future:• Coping with uncertainty: It is impossible to predict all of the future contingencies that will affect a business and
it’s difficult to eliminate the risks posed by these unpredictable factors. Having a strategy in place helps a business prepare for the future and to maintain its course in the midst of turbulence and ambiguity.
• Establishing a long-term perspective: A strategy is generally designed to fulfill long-term goals. For example, some Asian companies establish 30- and even 100-year strategies. These strategies are usually framed along the lines of providing high-quality goods or services in the industry, offering unrivaled customer service, or becoming a world leader. To fulfill these goals, a company would have to continuously evolve to stay ahead of its competitors. For example, Shufu Li, CEO of the Chinese car maker Geely, has a 30-year strategy where his goal is “to see Geely vehicles driven all over the world.”
• Forecasting customer and competitor behavior: Fulfilling goals entails having an edge over competitors to build a product that satisfies customers more than any other similar product. For this, a company has to be effective. That is, the company has to figure out the best thing to do. It also has to be efficient, meaning that it has to do the best thing in the best way. Having a well-defined strategy that factors in customer and competitor behaviors helps all the stakeholders in a company take a unified approach to fulfilling its goals.

Chapter 6 Strategy: Strategy and the Strategic Management Process • 61
The Strategic Management Process
Strategic management helps a business customize its products and offerings to the target markets and ensures that it’s staying on track to achieve its goals. The strategic management process involves the entire set of activities from setting goals to strategy formulation, implementation, and evaluation. The strategic management process is an ongoing set of activities that can be broken down into five stages:
1. Goal setting: The purpose of setting clear goals is to clarify a company’s vision and lay down practical steps to work toward fulfilling the vision. A company’s vision is an aspirational description of what the leaders of the company want to accomplish. It is a company’s ultimate goal and outlines the company’s core activities but is typically far broader than the available resources and competencies that the company possesses. If well understood and executed, it allows the company to reach the desired market leader position. The vision underpins the company’s mission, which reflects the corporate values and fundamental beliefs a company has adopted. In communicating the company’s mission to employees, customers, and other stakeholders, a company clearly defines its corporate responsibilities Based on the vision and the mission of the company, detailed and realistic short-term and long-term goals are defined and ways to fulfill these goals are identified. A company needs firm goals so it can monitor the success of the tactics it chooses to implement its strategy. This is typically, but not always, done on a yearly basis as a company sets annual goals, monitors progress toward those goals, and then at the end of the year evaluates whether or not the goals have been met. For any goal to be most effective and useful, it should have the following “SMART” characteristic S —Specific (clearly described and detailed M—Measurable (includes aspects that can be assessed) A —Achievable (challenging, but attainable) R —Relevant (important to the chosen strategy) T —Time-bound (linked to a certain deadline and milestones)
2. Environmental analysis: After setting goals, a company needs to appraise its internal and external environment. To do so, the company has to gather the maximum amount of information that’s relevant to accomplishing the set goals. The information collected is analyzed with the objective of recognizing the needs of the business in order to achieve sustainable growth. The company has to identify the direction of growth and also initiatives to lead the business along that direction. At this stage, a SWOT analysis, details of which you will learn in the next chapter, is often done. Internal factors that affect a company can be classified into strengths (S) and weaknesses (W). External factors that affect a company can be classified into opportunities (O) and threats (T).
3. Strategy formulation: After conducting an analysis of the internal and external environment, a company has to formulate the best course of action to realize its goals and vision. It has to decide how to procure the required resources and prioritize the challenges and obstacles the company is likely to face in order of their importance to the company’s success. Strategies are generally formulated at three different levels:
• Business-level strategy: This strategy outlines how a product of a business will compete within a market or an industry segment. For example, a Volkswagen is sold in different countries at different prices. That’s one product being sold in different markets using different strategies. Business-level strategies are the narrowest among the three and help define specific actions that can be implemented to fulfill goals and the larger vision of a business.
• Corporate-level strategy: At the corporate level, senior executives choose the markets to enter at the national level, the target customer segments, and the products to sell in each market. Mergers and acquisitions are guided by strategies at this level.
• Global/International strategy: Strategies at the global level answer questions such as which new global markets to enter and how to penetrate the markets. It also answers questions as to how far product diversification should be carried out.
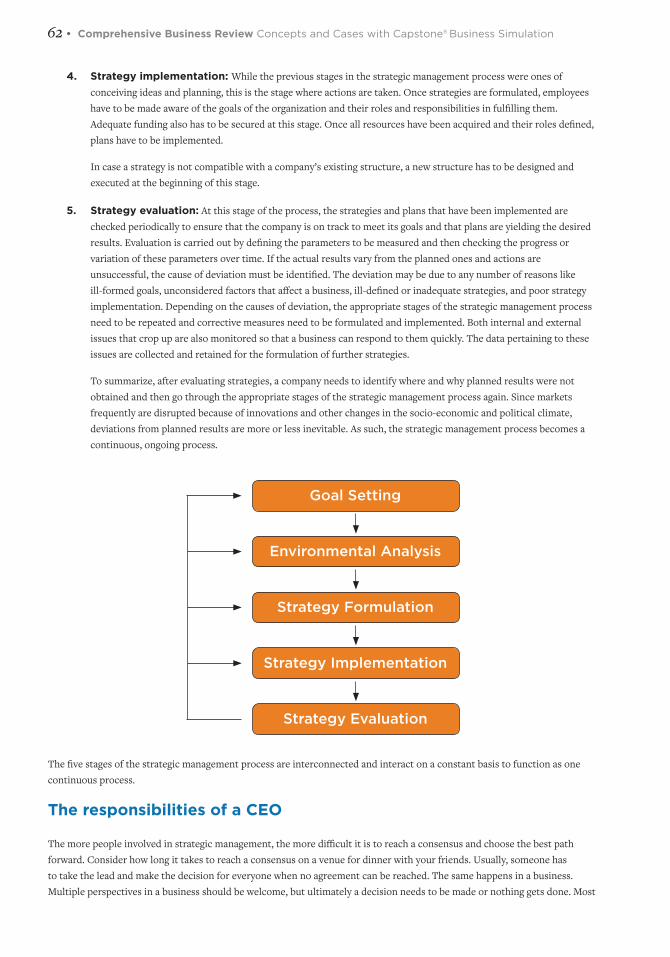
62 • Comprehensive Business Review Concepts and Cases with Capstone® Business Simulation
4. Strategy implementation: While the previous stages in the strategic management process were ones of conceiving ideas and planning, this is the stage where actions are taken. Once strategies are formulated, employees have to be made aware of the goals of the organization and their roles and responsibilities in fulfilling them. Adequate funding also has to be secured at this stage. Once all resources have been acquired and their roles defined, plans have to be implemented. In case a strategy is not compatible with a company’s existing structure, a new structure has to be designed and executed at the beginning of this stage.
5. Strategy evaluation: At this stage of the process, the strategies and plans that have been implemented are checked periodically to ensure that the company is on track to meet its goals and that plans are yielding the desired results. Evaluation is carried out by defining the parameters to be measured and then checking the progress or variation of these parameters over time. If the actual results vary from the planned ones and actions are unsuccessful, the cause of deviation must be identified. The deviation may be due to any number of reasons like ill-formed goals, unconsidered factors that affect a business, ill-defined or inadequate strategies, and poor strategy implementation. Depending on the causes of deviation, the appropriate stages of the strategic management process need to be repeated and corrective measures need to be formulated and implemented. Both internal and external issues that crop up are also monitored so that a business can respond to them quickly. The data pertaining to these issues are collected and retained for the formulation of further strategies. To summarize, after evaluating strategies, a company needs to identify where and why planned results were not obtained and then go through the appropriate stages of the strategic management process again. Since markets frequently are disrupted because of innovations and other changes in the socio-economic and political climate, deviations from planned results are more or less inevitable. As such, the strategic management process becomes a continuous, ongoing process.
The five stages of the strategic management process are interconnected and interact on a constant basis to function as one continuous process.
The responsibilities of a CEO
The more people involved in strategic management, the more difficult it is to reach a consensus and choose the best path forward. Consider how long it takes to reach a consensus on a venue for dinner with your friends. Usually, someone has to take the lead and make the decision for everyone when no agreement can be reached. The same happens in a business. Multiple perspectives in a business should be welcome, but ultimately a decision needs to be made or nothing gets done. Most
Goal Setting
Environmental Analysis
Strategy Implementation
Strategy Formulation
Strategy Evaluation

Chapter 6 Strategy: Strategy and the Strategic Management Process • 63
businesses invest ultimate decision-making authority in the Chief Executive Officer (CEO). Though we often hear only about the stellar compensation and golden parachutes that CEOs receive, CEOs must make complex, difficult, and far-reaching decisions often on a daily basis to maintain a continuously growing, profitable, and sustainable company. With respect to strategy, the CEO has four basic responsibilities:
Planning: A CEO is required to understand the interrelationships of all business functions, such as marketing, product development, production, finance, and human resources. This collection of business activities is often referred to as the “value chain”. It is the chain of activities that businesses undertake to deliver products and services to customers in a profitable manner. The CEO must develop and implement plans that keep these various activities aligned with the company’s strategy.
Business models: The term “business model” simply means the way the business makes money. It is critical to an organization that its CEO understands the attributes of the business that affect profitability. This includes revenue streams, the internal cost structure, the tax environment, and the effect of innovation on development of future revenue opportunities. Companies can generate revenue in a variety of ways, and there are many different techniques for controlling costs. CEOs must find the right mix of revenue generation and cost controls (which is the firm’s “business model”) to maximize the returns of the company now, and over the long term.
Competitive advantage: Competitive advantage refers to something a business does that affords it a current and sustainable advantage over others in the industry. Before a CEO commits a company to a specific path, it is crucial to identify the available resources and assess the impact of different market factors in the industry on business performance. The better the company’s capabilities and the bigger the gap between its own and its competitors’ capabilities, the better the chances the company will succeed in implementing its mission.
Strategic choice: Whenever we make decisions that have multi-year, lasting impacts on a firm’s operations, they should be well planned. We refer to these critical firm-level decisions as strategic choices. Once the CEO of a firm has analyzed the topics and issues outlined above, he or she makes strategic choices, choosing the direction and setting the operating agenda. Management expert Jim Collins makes the point: “It’s not doing many things well but doing one thing better than anyone else in the world that leads to success.”
Creating competitive advantage
Whenever a company has an advantage in the marketplace over other similar companies, the company is said to have a “competitive advantage.” All the biggest companies in an industry thrive because they have created unique competitive advantages. A university may be considered the best in a region because of the faculty, infrastructural facilities, or placement opportunities available to the students. Some supermarkets thrive because of their prime location. KFC has Colonel Sanders’ secret fried chicken recipe and over time, it has also gained economies of scale. Amazon has an exhaustive product collection, great customer service, and consequently, brand name recognition, which helps it stay ahead of its competitors. What lends Berkshire Hathaway its competitive advantage is Warren Buffet’s proven investment strategy, which is unique and, despite myriad books on Buffet and his investing strategy, difficult for others to copy.
When planning for competitive advantage, however, it is important to distinguish between operational effectiveness and strategic positioning.
Operational effectiveness means performing similar activities better than your rivals. From an operational effectiveness standpoint, a challenger will benchmark and attempt to outperform the dominant company following a similar value proposition. Benchmarking is used by most firms to understand how other companies perform certain activities, and then develop comparative metrics to measure their own performance. A value proposition is simply the way a company appeals to its customers. Porter writes, “Operational effectiveness includes but is not limited to efficiency. It refers to any number of practices that allow a company to better utilize its inputs by, for example, reducing defects in products or developing better products faster.
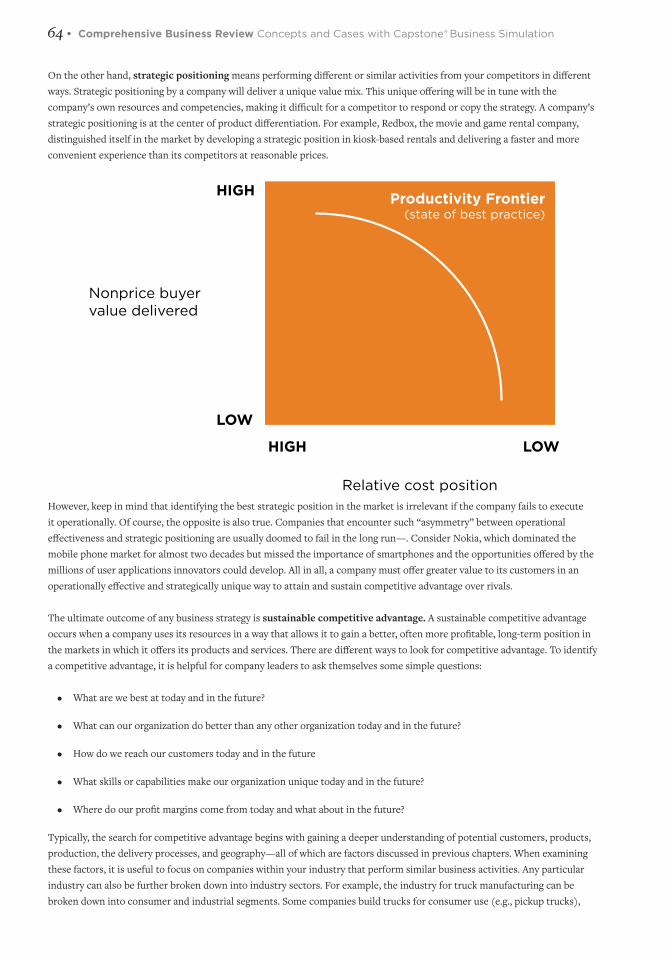
64 • Comprehensive Business Review Concepts and Cases with Capstone® Business Simulation
On the other hand, strategic positioning means performing different or similar activities from your competitors in different ways. Strategic positioning by a company will deliver a unique value mix. This unique offering will be in tune with the company’s own resources and competencies, making it difficult for a competitor to respond or copy the strategy. A company’s strategic positioning is at the center of product differentiation. For example, Redbox, the movie and game rental company, distinguished itself in the market by developing a strategic position in kiosk-based rentals and delivering a faster and more convenient experience than its competitors at reasonable prices.
However, keep in mind that identifying the best strategic position in the market is irrelevant if the company fails to execute it operationally. Of course, the opposite is also true. Companies that encounter such “asymmetry” between operational effectiveness and strategic positioning are usually doomed to fail in the long run—. Consider Nokia, which dominated the mobile phone market for almost two decades but missed the importance of smartphones and the opportunities offered by the millions of user applications innovators could develop. All in all, a company must offer greater value to its customers in an operationally effective and strategically unique way to attain and sustain competitive advantage over rivals.
The ultimate outcome of any business strategy is sustainable competitive advantage. A sustainable competitive advantage occurs when a company uses its resources in a way that allows it to gain a better, often more profitable, long-term position in the markets in which it offers its products and services. There are different ways to look for competitive advantage. To identify a competitive advantage, it is helpful for company leaders to ask themselves some simple questions:
• What are we best at today and in the future?
• What can our organization do better than any other organization today and in the future?
• How do we reach our customers today and in the future
• What skills or capabilities make our organization unique today and in the future?
• Where do our profit margins come from today and what about in the future?
Typically, the search for competitive advantage begins with gaining a deeper understanding of potential customers, products, production, the delivery processes, and geography—all of which are factors discussed in previous chapters. When examining these factors, it is useful to focus on companies within your industry that perform similar business activities. Any particular industry can also be further broken down into industry sectors. For example, the industry for truck manufacturing can be broken down into consumer and industrial segments. Some companies build trucks for consumer use (e.g., pickup trucks),
Relative cost position
Productivity Frontier(state of best practice)
Nonprice buyervalue delivered
HIGH
HIGH
LOW
LOW
Chapter 6 Strategy: Strategy and the Strategic Management Process • 65
others build trucks primarily for heavy industrial applications (e.g., dump trucks). Identifying the industry in which a company is competing allows leaders to understand the strengths and limitations that a company might have in terms of its successes (profits) and failures (losses), current market position, and of course, the resulting competitive advantage.
Sustainable competitive advantage ultimately stems from the effective and alignment of the firm’s resources to create value for customers now and into the future. These resources include all its financial, technological, and human resources. According to the resource-based view of the firm, the extent to which any of these resources can result in competitive advantage will differ depending on three characteristics:
Is the resource rare? Meaning that it is unique in the marketplace—you have it and no other companies (or very few) do.
Is the resource not easily imitated? Meaning that it is not easily copied or replicated by others.
Is the resource non-substitutable? Meaning that something else cannot be used or substituted in its place; e.g., machines substituting for people or an outsourced company providing manufacturing capacity.
The resource-based view of the firm has a long history of application. Many company leaders have been trained in its analytic techniques that are focused on leveraging firm resources for long term advantage. Another common framework for creating long-term competitive advantage focuses on the activities that make up a company. This approach was developed by Harvard’s Michael Porter and is widely known as the Value Chain Analysis.
Porter’s Value Chain Analysis
Michael Porter first explained the concept of a value chain in his 1985 best-selling book Competitive Advantage: Creating and Sustaining Superior Performance. A product’s value chain is composed of the collection of activities undertaken by the company to create and deliver a valuable product in its target market. Each activity in a value chain adds varying amounts of value to a product. Porter’s Value Chain presents a holistic approach to adding value via all the processes in an organization. Analyzing the value chain of a company helps it identify the activities that contribute to its competitive advantage and the activities that don’t contribute much or even lead to losses.
With the overarching goal being delivering maximum value at the least cost, Porter’s Value Chain Analysis provides a systematic way of identifying ways to create sustainable competitive advantage. Porter’s approach involves segmenting the activities of a firm into five primary activities and four support activities, and then determining whether each activity can provide a cost or product differentiation advantage to the firm.
The five primary activities in Porter’s value chain are the following:1. Inbound Logistics: The processes involving the purchase, transport, and storage of raw materials or
intermediate goods from suppliers to manufacturing plants and warehouses are part of inbound logistics. Product value can be enhanced at this step by buying high-quality raw materials and/or by optimizing logistics costs. For example, a supermarket can ensure fresh stocks of fruits and vegetables by analyzing its daily and seasonal sales and stocking only those items that customers want during different times of year.
2. Operations: All the activities involved in transforming the inputs procured into finished goods are part of operations. Product value may be added at this step by using highly skilled workers, adopting the most efficient technology, and/or improving the production process.
3. Outbound Logistics: Every activity related to the collection, storage, transportation, and distribution of the finished goods to the end users is part of outbound logistics. More value can be added to the value chain at this stage by identifying ways to cut storage and shipping costs and also by identifying more efficient ways to deliver the products to customers.
4. Marketing and Sales: This set of activities includes everything that a company may use to persuade potential

66 • Comprehensive Business Review Concepts and Cases with Capstone® Business Simulation
customers that its products are better than other comparable products in the market. Product offers and discounts, effective advertising, sales pitches tailored to the target market, proper sales channel selection, all add value at this stage. The endorsement of Nike by some of the biggest names in sports, including LeBron James, Serena Williams, and Cristiano Ronaldo, has given a massive boost to its worldwide brand image.
5. Service: This is the final set of activities in a value chain and includes all the activities that create a good post-sale customer experience. These activities affect the word of mouth publicity of products. Customers often buy products, even those that are priced above others in the market, if they know they’ll receive timely support in the event of something being amiss with the product. A good example is that of Bose sound systems. Though highly priced, customers rave about their experience with Bose products being instantly replaced and upgraded, often at little or no cost.
A company can create a competitive advantage in any of the five primary activities. Porter also identified secondary or support activities that boost the efficiency of one or more of the primary activities.
The four secondary activities include the following: 1. Procurement: All activities involving timely purchase of raw materials and intermediate goods at the best
prices are part of procurement. Effective management of suppliers and working on supplier relationships via the procurement activity can boost the value of inbound logistics.
2. Human Resource Management: The activities that involve the development of a company’s workforce, from recruitment and training to adequate compensation and fringe benefits, are part of human resource management. Finding and training the most suitable people for specific roles will go a long way in adding value to the company. Depending on the department the people are hired for, it can boost the value of any of the primary activities.
3. Technology Development: The activities involving product or service development by using reasonably priced and efficient technology are part of technological development. A company will have to strike a balance between using technology and keeping costs low. For example, many companies today use Salesforce.com to automate their customer relationship management function. Salesforce.com offers a software-as-a-service (SAAS) product that makes sales teams and customer support teams more effective and efficient.
4. Firm Infrastructure: Activities such as accounting, public relations, financial management, administrative activities, legal management, etc. are necessary for a company to maintain its operations. Value can be added at this stage by working on managerial skillsets of different department heads in a company.
Porter’s Value Chain
⎧ ⎜⎨ ⎜⎩
⎧ ⎜ ⎜ ⎜ ⎜ ⎜ ⎨ ⎜ ⎜ ⎜ ⎜ ⎜ ⎩
Primary Activities
Firm Infrastructure
Human Resource Management
Technology Development
Procurement
InboundLogistics
OutboundLogistics
Marketingand Sales Service
Margin
Margin
Operations
Sup
po
rt A
ctiv
itie
s

Chapter 6 Strategy: Strategy and the Strategic Management Process • 67
The value chains of all the firms and suppliers in an industry form an industrial value chain. After products are manufactured, they go through the value chains of distributors before finally reaching the customers. All the value chains together form a value system. To create sustainable competitive advantage, a company has to perform thorough research and understand all the components of the value system it’s a part of.
Once this research and value chain analysis are complete, companies have to identify the activities that can add more value and make appropriate investments to create a competitive advantage. In the new digital era, the value chain of a company can be strengthened substantially by leveraging different kinds of software that ease logistics, aid procurement, and streamline the management of human resources.
Measuring competitive advantage
Identifying and measuring a company’s competitive advantage helps it focus on them to establish itself as a dominant market player. The benefits of having a competitive advantage are sustained or growing profits and market share. The most common way of measuring competitive advantage is benchmarking—comparing your company’s business performance indicators with those of your rivals and looking for unique selling points. Benchmarking is not a one-time activity. Continuous benchmarking provides a snapshot of how a company is performing at a particular time and also how quickly its rivals’ performances are changing.
A company’s strategy will determine which activities to benchmark. For example, a discount retailer like Walmart doesn’t measure its success using the same benchmarks as a luxury retailer like Chanel. They are in the same industry (retailing) but are very different businesses using very different business strategies.
In the real world of business, companies select their own, key benchmarks based on their unique company strategy and/or important industry benchmarks. Sometimes, benchmarking involves studying highly successful companies in other industries. For example, the Ford Motor Company studied and used the customer service performance levels of the American clothing company Eddie Bauer to improve its customer relations process.
There are two types of benchmarking:
Metric benchmarking: This involves settling on several important quantitative variables, often referred to as key performance indicators or KPIs. Companies then track their performance on these KPIs over time and compare how they fare against the companies against whom they have chosen to benchmark themselves.
The most important benchmark metrics are generally market share and profits. Other important benchmarks may be related to the product such as cost of production and product quality or financial performance such as turnover rate, rate of return on investments, etc.
As there are potentially an infinite number of metrics, the choice of what to measure depends on how a company wants to achieve competitive advantage. In other words, choosing the indicators of performance and setting the standards of performance depend on a company’s goals and strategies.
Process benchmarking: Knowing how your company is performing is only half of benchmarking. Recognizing how to achieve goals forms the other half. Process benchmarking involves identifying processes important to the company, analyzing them, and comparing them against the standards that are aligned with company goals or other top-performing companies. Improvements in the different stages of the production process and efficiency by learning from others are the goals of process benchmarking. The process benchmarks of companies may include speed, efficiency, and quality of various production processes as well as technology benchmarks such as the speed of services. Process benchmarking also includes measuring customer experience, employee satisfaction, corporate culture, and brand awareness. While process benchmarking helps a company understand how it’s performing in its target market, it also helps the company understand the reasons for the KPI values and to identify ways to improve them.
After a company’s competitive advantages are identified and quantified, it needs to come up with an action plan to reach the performance standards it has set for itself.

68 • Comprehensive Business Review Concepts and Cases with Capstone® Business Simulation
The Balanced Scorecard
To deliver a big picture view of whether or not your Capstone company is meeting its targets, the simulation provides a Balanced Scorecard. More than a grouping of financial measures, the Balanced Scorecard is a strategic assessment tool that can accurately portray a business or business unit’s overall strategic progress on a daily, weekly, monthly and annual basis.
The Balanced Scorecard asks managers to consider their business from four different perspectives. The critical point is that all four perspectives are equally important in measuring success—they balance. Only one perspective measures financial metrics, demonstrating that focusing on financial performance is not enough to ensure an organization’s success.The four perspectives (or “quadrants” of the scorecard) are the following:
1. The Customer2. Internal Business 3. Learning & Growth4. Financial
The Balanced Scorecard
Customer Perspective. The customer perspective asks the question, “How well are we satisfying our customers’ needs?” Robert Kaplan, one of the originators of the Balanced Scorecard, says customers’ concerns can be broken down into four areas:
• Quality• Time• Performance• Service
Within each of these areas, there are many sub-elements. Take “time” for example. A customer might be concerned with the
Customer“To achieve our
vision, how shouldwe appear to our
customers?”
Internal BusinessProcesses
“To satisfy our shareholders and customers, what
business processes must we excel at?”
Learning and Growth“To achieve our vision,how will we sustain our
ability to changeand improve?”
Financial“To succeed financially, how should we appearto our shareholders?”
Visionand
Strategy

Chapter 6 Strategy: Strategy and the Strategic Management Process • 69
amount of time a manufacturer takes to introduce new designs. One of the goals in this perspective is to be perceived as the most innovative supplier to the industry. Clearly then, new product introduction cycle time is a vital statistic. Innovators don’t strive to be seen as low-cost leaders, for example, because low cost is inconsistent with an innovator’s goals.
In Capstone, your score in this quadrant looks at measures such as customer awareness, customer accessibility, customer satisfaction and your company’s market share.
Internal Business Perspective. The internal business perspective asks the question, “What do we need to correct within our own business to ensure that we deliver the value propositions the market needs and expects?”
For example, a manufacturer that sets its strategy to be the low-price leader in the marketplace needs to focus very carefully on driving down all internal costs for making and selling products. To meet this goal, the manufacturer needs to incur lower labor and material costs than its competitors. Even marketing costs have to be reduced. Questions about the internal business perspective need to be uncompromising. Company leaders must ask: What do we want to be best in the world at, and what do we have to do to get there?
In Capstone, the Balanced Scorecard rating in this quadrant includes measures such as your contribution margin, plant utilization levels, and days of working capital.
Learning and Growth Perspective. Nothing in business is static; the innovation and learning perspective asks, “How do we develop and grow in order to continue to create value?” In 1903, Joseph Schumpeter, an economist, said companies need to engage in “creative destruction” to succeed. He was referring to the need for corporations to be willing to pull apart their existing processes and systems, reconfigure them, and then move forward with new, different, and more highly developed value propositions as the markets in which they operate change. The more rapidly markets change, the more important this reinvention is. Businesses that cannot “creatively destroy” will inevitably give way to businesses that can.
Financial Perspective. In this perspective, the question is, “How is our strategy and tactical execution translating into profitability and economic viability?” Some might feel there is no need to review financial measures because by carefully watching the other measures of the Balanced Scorecard, financial success will naturally follow. This may be true in some cases, but it is not always true. For example, low cost companies might watch their cash position all but evaporate if there are not enough buyers for their products—no matter how efficiently the products are produced. Therefore, the financial perspective asks two distinct questions:
1. Are we making a profit in the activities in which we are engaged and, therefore, growing the company/increasing shareholder value?
2. Do we have the appropriate levels of cash to operate both in the short term and the long term?
In Capstone, you’ll watch a few key financial measures—profit and stock price—each round via your dashboard. The Capstone Courier provides a wide range of financial results on both your own, and your competitors’ companies.
The need to incorporate ethics into strategy
Strategy dictates how a company carries out its operations. Strategic choices made by a company often will have ethical consequences. Most companies aspire to be perceived as ethical. The dictionary defines the word “ethics” as “the discipline dealing with what is good and bad and with moral duty and obligation.” Not just individuals, but entire companies are expected to be ethical and to make ethical decisions. To make ethical decisions necessitates that companies develop ethical guidelines or principles to guide actions in the complex global business environment. It is important to incorporate ethics into company strategy to ensure that every facet of the company is aligned with the values of the company. A company adhering to a code of ethics has been shown to result in higher levels of goodwill, low regulation costs, high employee satisfaction, low attrition rates, and more customers.
70 • Comprehensive Business Review Concepts and Cases with Capstone® Business Simulation
Ethical issues arise in the interactions between a company and its stakeholders, including shareholders, customers, vendors, and employees. They may also arise where the work environment, environmental issues, product safety, bribes, and employee rights protection are concerned.
The ethical issues that a business faces can be broadly categorized as arising in the following four decision areas:
Decisions made for personal gain: On occasion, individuals with authority within organizations get tempted to use their business contacts, influence, and company resources for their own gains. Corruption is the term we use to refer to such instances where individuals use their positions of power to get what they want, rather than what the company or the stakeholders want. When individuals abuse their power and influence for personal gain, and the abuse is discovered and reported in the media, companies can suffer long-term reputational damage. Volkswagen, for example, was discovered to have lied about the emissions of their diesel-powered vehicles. When the fraud was revealed, individuals at the highest levels originally denied the allegations. Eventually, even the company CEO Martin Winterkorn lost his job over the handling of this scandal. That’s why every company should ideally incorporate ethics into its strategy so that all its employees are prohibited from using business resources for personal gains and are held accountable for their actions.
Decisions that lead to a negative social impact: All companies have unwritten responsibilities to society, such as environmental stewardship, community relationships, and local, national, and international citizenship. A business strategy may require a company to find the most cost-efficient way to manufacture and distribute its products. However, such interests of the company may conflict with the interests of society, and consequently, taint the brand image of the company. For example, a company may source labor and other materials from developing countries where resources are cheap. But if the laborers are forced to work in poor working environments on low pay, the negative social impact on the company’s name would be damaging. Apple has been accused of sourcing labor in China that reportedly is subject to excruciating productivity requirements and abysmal work environments. Apple responded to these allegations by becoming more careful in the overseas vendors it selects and in monitoring their labor conditions.
Decisions that influence public interest: Companies can expand and take over the resources of a large region within a country so that they become extremely powerful. The decisions of such companies may be in the public and economic interest of one nation but might hurt the interests of another. To avoid this, companies should analyze the potential impact of their strategies not just on the region in which they operate, but also on the nation and other nations where there may be an impact. Many large automobile companies sell products around the world. Different nations have different requirements regarding fuel efficiency, emission standards, safety standards, and others. These companies must ensure their products meet and even exceed the varying standards around the world.
Decisions that have an environmental impact: The actions of all businesses these days have varying degrees of impact on the environment. Some of these actions result in environmental pollution and others are associated with the exploitation and depletion of natural resources. Such negative environmental impact can be mitigated through regulatory compliance, setting and adopting standards shared by companies in the same industrial sector, conducting research, and adopting health and safety measures. Large multinational oil companies, for example, have changed their operating strategies enormously over the years. Occidental Petroleum, for example, has had operations in South America for many years. Practices that at one time might have been acceptable, such as environmental damages, are no longer acceptable as global awareness of environmental issues has increased. Occidental has adapted its oil production and transmission strategies to accommodate these evolving concerns.
To tackle such ethical decisions, there are four elements that senior executives can consider when strategizing:
A code of ethics: This should lay down the values upheld by the company with regard to all the people who influence or are influenced by the company. The code of ethics of a company often evolves as the company grows over time and the management of a large number of people becomes difficult.
Ethical training: Simply laying down a code of ethics does not ensure that all employees will abide by it. Training sessions are necessary to equip employees with the knowledge to deal with conflicts and other complex ethical issues. Training should impress upon employees the ethical consequences and repercussions of their choices, teach them to integrate ethical decision making into their daily work life, and thus, aid in building a strong ethical work culture.

Chapter 6 Strategy: Strategy and the Strategic Management Process • 71
Ethics officers: Now and then, ethical dilemmas arise that cannot be resolved using a code of ethics and ethical training. Therefore, companies often employ an ethics officer to aid employees in determining the most ethical way to deal with complex dilemmas. An ethics officer can also use such situations to improve the company’s ethical strategy and further develop its code of ethics.
Confidential reporting systems: Vocalizing certain ethical issues may leave employees vulnerable. Such ethical issues need to be dealt with in a sensitive manner. Organizations should have confidential reporting systems to allow employees to report their issues anonymously.
Ethical values must be embedded into organizational strategy, business models, and the decision-making processes of organizations. Organizational policies that have strong ethical foundations will add value to a company, while the lack thereof can lead to economic, social, environmental, and reputational damage.
Mintzberg’s Five P’s of Strategy
An organization’s strategy can be regarded as an asset to itself. A good strategy must point to a unique way of producing a good or service that a company’s rivals have a hard time recreating. So, an evolving strategy is critical to the survival and establishment of a company in a market.
However, a solid understanding of the concept of a strategy eludes most company leaders and therefore, leads to poor strategy formulation. To give more rigor to the definition of strategy, Henry Mintzberg recognized five characteristics of strategy or five different approaches to defining strategy, popularly known as Mintzberg’s Five P’s of Strategy, which bear the name of Henry Mintzberg, one of the leading organizational theorists of the 20th Century. Any one of these approaches alone would be insufficient to master the concept of strategy, but all of them together impart a holistic understanding.
Incorporating Ethicsinto Strategy
ConfidentialReportingSystems
Code ofEthics
EthicsOfficers
EthicalTraining
72 • Comprehensive Business Review Concepts and Cases with Capstone® Business Simulation
Mintzberg’s Five P’s of Strategy are the following:
Strategy as a Plan: This is what most people often think of when they hear the term ‘strategy’—a plan to take a company forward. A strategic plan has two essential features: It is developed in advance of its implementation, and it is developed with deliberation. Strategic plans include deciding the products to sell and the method of production, storage, distribution, and retailing. For example, Levi Strauss & Co., despite being an American brand, has its cloth manufacturing plants located in China, Bangladesh, Vietnam, and Mexico, where labor is cheap.
Often, however, a business faces unexpected changes in its environment that deters its plans. The changes can be in the form of behavioral changes in customers, competitors, suppliers, etc. At such times, strategy becomes less about a fixed plan and more about adapting to changing circumstances. Therefore, strategy is a broader concept and we need to think of it in the following ways as well.
Strategy as a Ploy: Competition can never be ignored in business operations. So, while developing a strategic plan, firms also need to think of how to disrupt or outperform the competition. A strategy must be designed so that the firm stays a step or more ahead of its competition. According to Mintzberg, an organization gaining competitive advantage by plotting to discourage, disrupt, influence, or even deter a rivaling organization is following a strategy.
Strategy as a Pattern: There are often consistent patterns in the actions of a firm. It is important to notice the pattern of actions that have led to a firm’s success and then integrate it into strategy to leverage it for the future. Google’s strategy to meet competitive challenges has been aggressive innovation from the start. It had humble beginnings like other search engines such as Yahoo! and Bing. However, Google didn’t stop at search engine optimization. It encouraged its employees, called Googlers, to devote time to pet projects and run beta tests on consumers as well. In this manner, over the years, Google has integrated other offerings such as Google Drive, Google Maps, AdSense, Google Translate, etc. into its search engine to provide an unmatchable consumer experience and sustainable profits.
Strategy as a Position: Strategy also centers on the position a company wants to stake out within an industry and target market. Companies differentiate themselves by developing products and services that provide value to underserved customers, or new value to customers that switch from competing products. In this regard, a company must decide both where and how it wants to compete, and also where it does not want to compete.
Deciding what the company doesn’t want to do is just as important to strategy as deciding what it wants to do. Brands like Gucci and Prada carve out their profit margins by catering to a small group of high-end customers, while H&M and Target carve theirs by manufacturing cheaper products with a greater market reach. General Motors manufactures Chevrolet, Buick, and Cadillac, targeting three different markets segments.
Strategy as a Perspective: A business is often led by a few individuals united through a common perspective. This common perspective plays a key role in the decisions and plans that the business drafts and executes. It shapes how the business views its competitive landscape. For example, some organizations are innovators and develop new products, while others view their business landscape as stable and only work on offering add-ons to their existing products. A large part of a successful strategy is recognizing your perspective on your business landscape so that all the decisions you make are geared to a common end. For example, in 1994, at a time when the internet was being used largely as a medium of communication, Jeff Bezos saw it as a channel for selling books. Thus, Amazon was conceived. Today, Amazon has diversified into selling a variety of consumer products and has been referred to as “the everything store.”
To summarize, strategy is to an organization what personality is to an individual. The personality of an individual determines how he or she sees the world and responds to it. Personality also largely determines actions and reactions, lends consistency to actions, and determines the role or position of the individual in a group. As you can see, all the facets of strategy, like individual personality, are interconnected and function as a whole.

Chapter 6 Strategy: Strategy and the Strategic Management Process • 73
Mintzberg’s 5 P’s of Strategy
Next, we’ll learn of the different kinds of strategy a company can pursue.
Different kinds of strategy
A company usually starts out with a founding strategy but may face unforeseen challenges as it grows. The initial strategies adopted by the company to achieve its goals may not be enough to cope with the new challenges. To deal with this, Mintzberg and Waters defined five different kinds of strategies:
• Intended strategy: An intended strategy is a strategy that is conceived and developed by a firm’s senior executives as a means to achieve its stated goals. This deliberate form of strategy is referred to as an intended strategy. An intended strategy is formulated in a formal manner using traditional models and tools such as SWOT (strengths, weaknesses, opportunities, threats) analysis, the PESTLE framework, and Porter’s 5 Forces. We’ll explore these analytic frameworks in more detail in the next chapter. An example of an intended strategy can be found in the story of ESPN: When Scott and Don Rasmussen were fired from the New England Whalers hockey team, they envisioned a cable television network dedicated entirely to sports programming. The intended strategy was to focus only on sports events in Connecticut.
• Deliberate strategy: The part of an intended strategy that a company actually pursues and sees through to realization is called a deliberate strategy. Deliberate strategies are marked by a keen attention to the details of business operations.
• Unrealized strategy: Mintzberg and Waters suggested that only about 10–30 percent of an intended strategy is actually pursued. An unrealized strategy is one that was intended or planned but was never seen through to realization. The reason for which a strategy may be abandoned is most often changes in the external environment. There may be economic or political climate changes, consumer preference changes, exchange rate fluctuations, etc. Occasionally, the unrealized strategy may have been based on assumptions that were invalid.
Ploy
PositionPerspective
PatternPlan
Strategy

74 • Comprehensive Business Review Concepts and Cases with Capstone® Business Simulation
• Emergent strategy: In response to unforeseen challenges and unexpected opportunities, businesses develop emergent strategies. Economic instability, technological innovations, turnover of key people in the business, etc. are unpredictable, and tactics for dealing with such changes often have to be adopted quickly and with little deliberation. Such adaptations to changing conditions are called emergent strategies. Emergent strategies are usually developed and implemented within business units and not at the corporate level. These strategies are necessary to adapt to changes in a business’s external environment. Many business theorists prefer an emergent strategy over an intended strategy for its flexibility. Emergent strategies are viewed as a method of learning while operating. Returning to the example of ESPN, as the network became successful, ESPN expanded beyond the local softball games and demolition derbies in Connecticut that were first broadcast. Today, ESPN is a global powerhouse with programming that runs the gamut from professional sports to local events.
• Realized strategy: A realized strategy is the strategy that is ultimately executed and is a product of deliberate and emergent strategies. In the case of ESPN, it is now billed as the worldwide leader in sports, owning several ESPN affiliates as well as production of ESPN magazines, ESPN radio, and broadcasting for ABC.
Depending on the industry a company operates in, the company’s realized strategy may be composed of deliberate and emergent strategies in varying proportions. For example, SiriusXM Satellite Radio is the biggest satellite radio broadcasting company in the United States. Facing scant competition, it would require little deviation from its intended strategy. On the other hand, Popeye’s (a fast-food, chicken franchise) faces competition from KFC and McDonald’s, and its sales is dependent on changing consumer tastes. So, Popeye’s has to deploy more emergent strategies than SiriusXM does as Popeye’s operates in a more competitive market environment.
Intended Strategy
Deliberate Strategy
Unrealized Strategy
Emergent S
trategy
Realized Strategy
Every company must have a clearly defined intended strategy. However, complete adherence to an intended strategy is impossible because of unpredictable changes in a business environment. Therefore, it is important to draft an emergent strategy whenever necessary.

Chapter 6 Strategy: Strategy and the Strategic Management Process • 75
Intended Strategy Emergent Strategy
It is planned, but only a part of it usually gets implemented
All of it it implemented
It is influenced by specific business goals and objectives.
It is formulated in response to changes in the external business environment.
It is supported by traditional planning tools and methods like SWOT analysis, the PESTLE framework, and Porter’s 5 forces.
It is not restricted by traditional planning tools and methods.
It is the result of a formal strategic planning process and is included in a formal business plan.
It involves thinking on one’s feet to formulate strategic and tactical ideas.
It implements a top-down approach to management.
It implements a bottom-up approach to management.
You may be tempted to conclude that intended strategies are formulated only at the start of business operations. To the contrary, intended strategies are any strategies that are planned but not yet executed, and they may be planned at any stage of operation of a business. When a company has been operating in a market for a long time, its current strategies tend to inform its future strategies. This implies that realized strategies, over time, have an impact on planned or intended strategies as well.
For more information, check out the additional videos link below.
What is strategy?:http://capsim.com/go/v/strategy
Strategy and Long-Term Direction: http://capsim.com/go/v/strategy2
Competitive Advantage:http://capsim.com/go/v/advantage
Balanced Scorecard:http://capsim.com/go/v/scorecard

76 • Comprehensive Business Review Concepts and Cases with Capstone® Business Simulation
Chapter 7Strategy: Evaluating the Internal and External Business EnvironmentLEARNING GOALS
After reading this chapter you will be able to:• Explain the importance of the business environment in formulating strategy.
• Describe the two components of the external environment: macroenvironment and the competitive environment.
• Discuss the PESTLE framework as a tool for analyzing the macroenvironment.
• Describe Porter’s five forces that drive competition in an industry.
• Describe three reasons analyzing strategic groups is important.
• Explain the structure-conduct-performance model of an industry.
• Distinguish between competitive parity and competitive advantage.
• Describe the factors that comprise the internal environment.
• Describe the two assumptions of the resource-based view of the firm.
• Explain the characteristics of key strategic resources using the VRIO framework.
• Apply the VRIO framework in creating sustainable advantage.
• Explain how a SWOT analysis informs business strategy.
• Discuss five challenges that may arise during strategy implementation.
Why the Business Environment Matters
The key aim of formulating a strategy is to position an organization in a way that it can best exploit opportunities and avoid or mitigate threats. To this end, analyzing the business environment that influences the organization’s outcomes is
of vital importance. In this chapter, we learn the different parts of a business environment and tools to analyze each of them to come up with the most suitable strategy.
The context in which a strategy is formulated can be divided into the external environment and the internal environment. The external environment comprises all the external factors that can affect the business, while the internal environment comprises all the factors within the business that can shape its success or failure. For example, political turmoil, competitive challenges, changes in customer preferences, etc., are external factors that would affect a business. Internal factors include such things as employee morale, cash position, and core competencies, etc.
The external business environment is always dynamic. Some changes can be predicted based on past and current data, some can be anticipated but may not materialize, and some events are completely unpredictable. All of these changes present both threats and opportunities depending on the nature of the business and how it has positioned itself. For example, a hurricane would leave a lot of houses damaged and the construction industry would be presented with numerous business opportunities. On the
Chapter 7 Strategy: Evaluating the Internal and External Business Environment • 77
other hand, businesses that sell luxury items such as expensive cars or vacation packages, would probably see a drop in business as people recover from the hurricane. Therefore, it is important for a business to anticipate changes, and be prepared to exploit opportunities and control threats if they arrive. Another reason to study the external environment is because it provides resources that a business needs. It could not survive without the support of the social and economic environment. For example, Sears was at one time a thriving and nearly essential retailer in the United States. Its catalog enabled people in remote parts of the country to gain access to goods that helped them farm the land, build businesses, and raise families. In 2019, Sears reached the brink of total collapse and may not survive. How does this happen? How can a once thriving, nearly essential, business collapse? Often, the reason is that the business failed to keep pace with and adapt itself to changing social conditions.
Yet another reason to keep a close watch on environmental changes is that they may affect strategic decisions and organization goals adversely. For example, a recession may be looming, new competitors may enter the market, or there may be a major acquisition by a competitor that provides it with substantial market power. Strategic decisions such as launching a new product, opening a new outlet, where to locate it, etc. should be made with the business environment firmly in mind.
Now, let’s examine the external and internal business environment in turn.
The External Business Environment
The external business environment can be divided into two parts: the general environment (or the macroenvironment) and the industry (or the competitive environment). The general environment includes all macroeconomic factors, including socio-political, economic, technological and others, that can affect business operations and output. An organization generally has very limited influence on these factors.
The industry is comprised of all the organizations that sell similar goods or services as the business organization under concern. An organization can both influence and be influenced by the industry it’s in depending on the concentration of market power in the industry.
Evaluating the General Environment: PESTLE Framework
The general environment is composed of six macro-environmental factors: PoliticalEconomicSocialTechnologicalLegalEnvironmental
Commonly abbreviated as PESTLE (or PESTEL), each of these factors interact with an organization to influence business outcomes, to a greater or lesser degree. Using the framework while researching entry into new markets gives a good idea of all the potential opportunities and threats the business may face. Also, monitoring each of these factors on a regular basis helps management re-evaluate strategic decisions if necessary.
Political: The political aspect of the general business environment is concerned with how government decisions affect a business. There are tax and tariff policies, government stability, regulations, fiscal policy, etc. that would affect demand and supply conditions for a business. For example, WhatsApp and other services that enable voice communication over the internet are banned by the government of the United Arab Emirates (UAE) in order to allow local telecommunication providers to capture domestic customers.
Economic: Economic factors that influence an organization include interest rates, unemployment rate, inflation rates and the general growth rate of the economy. The 2008 mortgage crisis in the US that led to a recession saw rising unemployment rates and tightening of credit markets. The market for housing was adversely affected as demand fell drastically. With less

78 • Comprehensive Business Review Concepts and Cases with Capstone® Business Simulation
money in their pockets, people avoided buying nonessential items such as automobiles and TVs and turned to cheaper stores such as Walmart for necessities. The Federal Reserve Bank’s decisions on interest rates also creates opportunities for some businesses and poses threats for others.Social: Cultural and demographic factors have a tremendous impact on the business environment. For example, the flavors of Nestle products differ in most countries in line with local tastes. In Japan, there are Wasabi-flavored Kit Kats and in India, Masala-flavored Maggi. Rising health consciousness world-wide has prompted many people to consume organic food. Social trends in clothing, cosmetics, and food also change over time and with age distribution. Korean pop culture has spiked an interest in Korean cosmetic products among Americans as well.
Technological: Technological changes have disrupted nearly every industry conceivable in the last three decades. Laptops and cell phones have made the internet accessible to anyone and has led to revolutions in marketing. The numerous applications that are available on iStore and Google Play Store have replaced many physical objects. For example, musical instruments can now be tuned using applications instead of tuners, train or flight tickets can be booked without counters, and to-do lists and reminders can be set on phones. Technology in other fields have also proved disruptive. Instant film cameras have been replaced by digital cameras, print media is being largely replaced by digital media, and taxis have been displaced by ride sharing services like Uber and Lyft to name just a few of the disruptive changes from new technologies. For any business to evolve, understanding, integrating, and leveraging new technologies is imperative.
Environmental: Over the course of the last half century, businesses have increasingly been pressured to be stewards of the natural environment. Many companies today recognize the societal goodwill that can be gained by being environmentally conscious. In addition, government regulations concerning industrial waste, pollution, and responsibility for environmental damages have placed additional pressure on companies. There is little doubt that environmental friendliness is an asset for most businesses today, and concern about the environment is likely to continue. For example, many today are concerned that the earth’s changing climate may in part be caused by human activities, especially business activities. As such, many companies are responding to calls to reduce their carbon emissions, improve the energy efficiency of their buildings, and other things.
Legal: Legal factors include various laws such as those pertaining to health and safety standards, discrimination, consumer protection, and employment. Laws regarding environmental regulations also exist. All of these legal factors influence industries and firms, their cost structures, and demand for products. For example, after the 2008 recession, the Congress passed the Dodd-Frank Act, which posed increased controls over the banking sector.
PESTLE Framework
Political
Technological
Environmental Economic
Legal Social
GeneralEnvironment

Chapter 7 Strategy: Evaluating the Internal and External Business Environment • 79
Evaluating the Industry: Porter’s Five Forces
The second part of the external environment for a business is the industry in which it competes. In his ground-breaking work in the 1980s, Michael Porter developed a framework for evaluating the driving forces of competition within an industry. In his analysis Porter identified five factors that naturally act together:
1. Threat of new entrants to a market
2. Bargaining power of suppliers
3. Bargaining power of customers
4. Threat of substitute products
5. Degree of competitive rivalry
Depending on the characteristics of the industry, each of the factors may be more or less important.
It is often helpful to first evaluate the degree of competitive rivalry. In particular, firms need to determine the nature of the rivalry, which reflects the intensity of competition in the industry. This allows companies to choose the most effective strategy. Rivalry depends on many factors, but the following seven factors are critical:
Factor Impact
Number of competitorsCompetitive rivalry will be higher the more competitors are in the market.
Market size and future growthCompetition will be most intense when markets decline or stagnate.
Product differentiation and customer loyaltyThe greater the customer loyalty and/or the higher the product differentiation the less intense the competition.
Availability of substitutesIf customers can choose among substitutes or similar alternatives the intensity of competition will increase.
Capacity utilizationAny existence of excess capacity will increase the intensity of competition.
Cost structure
Intensity of rivalry will increase if companies’ fixed costs are a relatively high percentage of their total costs because profits will depend primarily on manufacturing output.
Exit barriers
If there are no purchasers for companies that attempt to exit the industry or it is difficult to sell their assets, intensity of competition will stay at least constant.
It is important to understand how a barrier to entry for a potential entrant can affect business strategy. New entrants can appear in a sub-segment of a market. For example, a competitor may begin to focus on either the low-tech or high-tech end of the market. In addition, any new product offerings or entry by a competitor into a market segment can increase the level of rivalry among the competitors. Finally, companies that are already in an industry or sub-segment of the market hold stronger positions if the barriers to entry are higher and vice versa. Below are some examples of barriers to entry you might want to consider.
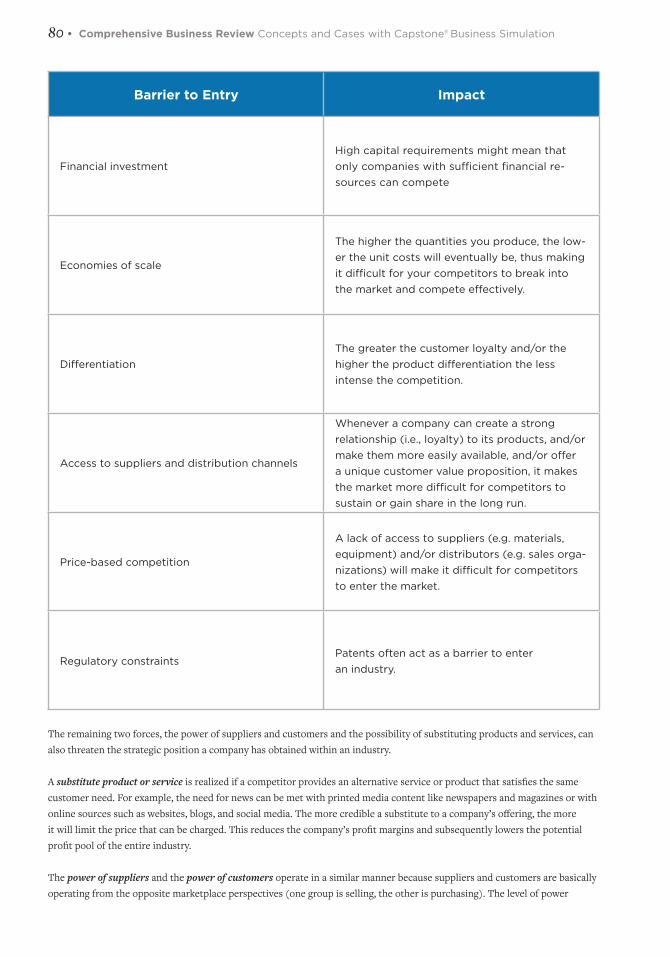
80 • Comprehensive Business Review Concepts and Cases with Capstone® Business Simulation
Barrier to Entry Impact
Financial investmentHigh capital requirements might mean that only companies with sufficient financial re-sources can compete
Economies of scale
The higher the quantities you produce, the low-er the unit costs will eventually be, thus making it difficult for your competitors to break into the market and compete effectively.
DifferentiationThe greater the customer loyalty and/or the higher the product differentiation the less intense the competition.
Access to suppliers and distribution channels
Whenever a company can create a strong relationship (i.e., loyalty) to its products, and/or make them more easily available, and/or offer a unique customer value proposition, it makes the market more difficult for competitors to sustain or gain share in the long run.
Price-based competition
A lack of access to suppliers (e.g. materials, equipment) and/or distributors (e.g. sales orga-nizations) will make it difficult for competitors to enter the market.
Regulatory constraintsPatents often act as a barrier to enter an industry.
The remaining two forces, the power of suppliers and customers and the possibility of substituting products and services, can also threaten the strategic position a company has obtained within an industry.
A substitute product or service is realized if a competitor provides an alternative service or product that satisfies the same customer need. For example, the need for news can be met with printed media content like newspapers and magazines or with online sources such as websites, blogs, and social media. The more credible a substitute to a company’s offering, the more it will limit the price that can be charged. This reduces the company’s profit margins and subsequently lowers the potential profit pool of the entire industry.
The power of suppliers and the power of customers operate in a similar manner because suppliers and customers are basically operating from the opposite marketplace perspectives (one group is selling, the other is purchasing). The level of power

Chapter 7 Strategy: Evaluating the Internal and External Business Environment • 81
suppliers and customers have follows some general rules. First, both are typically more powerful when there are only a few of them. Second, their power further increases when supply is limited or when a single customer purchases a significant portion of an industry’s output. Third, power is high when customers and suppliers are reluctant to switch to a competitor. This is the case when customers have a high degree of loyalty, often established through brand, availability, and accessibility.
Porter’s Five Forces
Industry Competitors
Rivalry among existing firms
PotentialEntrants
PotentialEntrants
Suppliers BuyersBargaining Power
of SuppliersBargaining Power
of Buyers
Threat of New Entrants
Threat of Substitute Products
or Service
All in all, the various forces a company faces in an industry will encourage management to add as much value as possible to the products and services a customer is willing to pay for. Thus, most companies have developed sophisticated tools to help understand where potential value can be added to their core processes and support activities (the value chain), in order to differentiate themselves from competitors.
Strategic Groups Within an Industry
A strategic group is a set of competing firms in an industry that have similar characteristics. The firms in a particular strategic group differ from other firms in the industry in important ways. Consider the hospitality industry. Not all hotels offer the same amenities or offer rooms at the same price range. The hotels that do offer rooms in a similar price range with more or less the same amenities are considered to be part of the same strategic group. For example, at the low end of the price range, hotels such as Red Roof Inn, Springfield Suites, and others compete against one another. They don’t compete against high-end, higher-priced hotels such as the Ritz Carlton, Hyatt Regency, and others.
Analyzing the firms that operate in the same strategic group is important for three reasons:• Firms in the same strategic group are rivals. When strategizing, they should be taken into consideration as they are
highly likely to be affected by a firm’s actions and may employ counter strategies, and vice versa. For example, all the fast food restaurants in a specific geographic region would be part of the same strategic group. They compete with each other and have to consider the implications of their own and others’ actions on one another. However, they don’t have to consider how any of their strategies would affect a fine dining restaurant, or vice versa.
82 • Comprehensive Business Review Concepts and Cases with Capstone® Business Simulation
• Ideas can be borrowed from firms in the same strategic group to improve a firm’s situation. This is true of borrowing ideas from similar strategic groups in different areas or countries as well.
• Understanding all that each of the firms in a strategic group have to offer, a firm may be able to discover a way to outperform them in some aspect and gain a competitive advantage. Firms may be able to find untapped opportunities in the industry.
The Structure-Conduct-Performance Model
The basics of the structure-conduct-performance (SCP) model was first published by the economists Joan Robinson and Edward Chamberlain in 1933. It was further developed by Joe S. Bain in 1959 to offer an explanation for firm performance through its conduct that was influenced by market structure.
The SCP model posits that market structure affects the conduct of firms, which in turn influences market performance.
Structure: A market structure depends on factors that determine the level of competitiveness. These factors include buyer and seller concentration, the size and number of competitors, barriers to entry, and the degree of product differentiation.
Conduct: The behavior of firms is referred to as conduct. Elements of conduct include advertising, research and development, and pricing strategies.
Performance: The success of the industry in providing consumer benefits is referred to as performance. For example, profitability and profit margin are used as indicators of performance.
This model is foundational to industrial organization economics and is consistent with the positional view of strategy. The SCP model suggests two hypotheses:
1. Efficient structure hypothesis: When there’s competition among firms, they often try to increase profits by lowering their costs of production, reducing prices, and expanding their market share. As a firm attempts to lower its cost structure, it grows more efficient, which directly impacts performance.
2. Structure performance hypothesis: Concentration of market power encourages firm collusion. When there’s more market concentration, there will be less competition.
The SCP framework treats market structure as exogenous. This means that the characteristics of a market’s structure influences firm conduct and consequently, performance. It is exogenous in that the factors driving performance are not internal, or endogenous, to the firm. The SCP model has therefore been criticized for being deterministic, as if firms have no control of their destiny.
In reality, there also are feedback effects so that firm conduct affects market structure. Moreover, external factors such as government interventions or environmental regulations can also affect market conditions and consequently, market structure, conduct and performance.
Therefore, today, the SCP model is used for objectives different from what it was originally intended. Rather than trying to increase competition in markets, strategists use the model to find and analyze market imperfections in order to exploit opportunities for competitive advantage.
Now, we turn our attention to the second part of a business environment, the internal environment.
Chapter 7 Strategy: Evaluating the Internal and External Business Environment • 83
The Internal Environment
As discussed at the beginning of this chapter, the internal environment comprises all the factors within a business that can shape its success or failure. An organization’s vision and mission statements, its organizational hierarchy that determines information flows, organizational culture, climate, and resources all influence and determine the internal environment.
The purpose of having vision and mission statements were discussed in the previous chapter. Let’s take a brief look at the other factors:
Organizational hierarchy: The hierarchy of an organization is depicted when all the employees are organized in order of authority, from CEOs to employees at the lowest level.
Organizational culture: Just as people have personalities, organizations have cultures that define how employees behave, and how they should behave. The values that it upholds, exemplary people in the company, informal networking amongst employees, and the non-work-related activities that encourage bonding determine an organization’s culture.
Organizational climate: Employee morale and the overall vibe at the workplace are part of organizational climate. It is a by-product of organizational culture.
Resources: The monetary resources, people, office infrastructure and facilities, supplies, machinery, and other equipment comprise an organization’s resources.
Competitive Parity
A firm is said to be at competitive parity when it has achieved standard or average results in relation to other firms in the same industry. In contrast, a firm is said to have a competitive advantage when it has achieved results that are above average.
Sometimes, competitive parity is a result of being unable to outperform competition. At other times, it may be a deliberate strategy in some business units of a single business. For example, Adidas and Nike have a competitive advantage in the sale of sports shoes and clothing. However, for water bottles, apparel, and other ancillary products they have deliberately chosen to be at competitive parity. This may be to gather some additional revenue and also to build a one-stop shopping solution for all sport-related equipment. However, developing business units other than sports shoes and clothing when there are other firms that specialize in those particular units may prove to be a costly affair and not worth the time, money, and effort.
The Resource-Based View of the Firm
While all of the factors that make up a firm’s internal environment is important, its resources often play a critical role in the firm’s success.
The resource-based view of the firm (RBV) is a managerial framework used by strategists to identify the key resources a firm can exploit to gain a sustainable competitive advantage. The key insight of this view is that some resources are more important than others and exploiting them would yield competitive advantage. Such resources fulfill the following characteristics—Valuable, Rare, Inimitable, and Non-substitutable. The characteristics are commonly abbreviated as VRIN.
Valuable means the resources can be leveraged to create value for customers that leads to firm profits. Rare means the resource is not easily obtainable by competitors or would-be competitors, Inimitable means that the resource is not easily imitated. Non-substitutable means that there is no obvious resource that can substitute. Firms that leverage resources with these characteristics are able to develop sustainable competitive advantage.
All resources can be broadly divided into tangible and intangible ones. Tangible resources are physical assets such as machinery, land, buildings, etc. Most tangible resources can be bought and sold easily in a market so that they lend little to no competitive advantage in the long run. Intangible resources include intellectual resources, property rights, copyrights, patents, brand value, etc. Intangible resources are mostly difficult to imitate and, unique ones tend to be the main source of competitive advantage.

84 • Comprehensive Business Review Concepts and Cases with Capstone® Business Simulation
The RBV has two critical assumptions regarding the nature of resources owned by a firm:1. Heterogeneity: The bundle of resources—the capabilities, skills, and other resources –owned by firms have to
differ from one other. If the amount and mix of resources owned by firms were similar, they would not all be able to employ the best strategy to compete with one another. Other firms would simply imitate the strategy of the best-performing firm, ultimately leading perfect or near-perfect competition.
Apple and Samsung are two firms that operate in the cell phone industry. However, they have different resources: Samsung has low-cost labor, and Apple has brand value and an ability to design a user-friendly interface. This enables them to employ different pricing strategies and dominate different segments of the same industry.
2. Immobility: Resources are also assumed to immovable from firm to firm, at least in the short run. Because of this, firms cannot imitate the same strategies using the same resources within a short period of time. Intangible resources such as brand value and patents are generally immobile.
Strategists using the resource-based view should ideally frame a strategy that best exploits important resources, while keeping in mind external opportunities and threats as well. Barney and other theorists who have played a major role in contributing to the existing literature on the RBV have pointed out that determining the causal relationship between the sources of competitive advantage and effective strategy is difficult. Therefore, substantial effort must be expended by firm leaders to recognize and classify resources. They must also invest in training employees so that they are prepared to maintain and nurture important resources. Proponents of the RBV argue that it is easier to exploit a firm’s existing resources in a new way in response to external opportunities than it is to acquire new resources to do the same thing.
The VRIO Framework and its Application
In 1991, Jay Barney, one of the major contributors to the resource-based view combined the I and N in VRIN into one characteristic and added another one: organization. The VRIO framework subsumes the axioms laid down by the resource-based view, and is as follows:
Valuable: If a resource enables a firm to defend against threats or exploit opportunities it is considered valuable. Resources that increase perceived customer value through differentiation or low prices are also considered valuable. Resources that are valuable without fulfilling any of the other characteristics yield competitive parity. Although mere competitive parity is not desirable, no valuable resource should be neglected by a firm. It is also important to pay attention to other elements in the internal and external environment because changing environmental conditions may deteriorate the value of some resources.
Rare: Resources whose availability are restricted to one or a handful of firms are said to be rare. Resources that are both valuable and rare can yield a temporary competitive advantage
Inimitable: Imitation of a resource can be done in two ways—direct imitation or substituting by using a comparable resource. If other firms cannot buy, imitate, or substitute a resource, it is said to be inimitable. There are three reasons why resources can be hard to imitate:
1. Social complexity: Such resources are based on a company’s networking relationships and culture. If these are unique and difficult for other firms to imitate, these social factors constitute hart-to-imitate resources
2. Causal ambiguity: Resources whose causal link to competitive advantage are difficult to trace can be a source of competitive advantage. Most firms have multiple causal factors that underlie their performance, including talent, technology, innovation, intellectual property and many other factors. If it is not possible to single the primary cause of a firm’s success, others may never be able to copy that success.
3. Historical conditions: Resources that developed over a period of time (for example, fossil fuel and diamonds) are difficult to imitate or substitute. Such resources are functions of continuous innovation and organizational learning. Competitors who try to duplicate such resources may not have developed the fine-tuned expertise that is necessary to develop, nurture, and exploit such resources.

Chapter 7 Strategy: Evaluating the Internal and External Business Environment • 85
Organized: Organization refers to the organization of management structure, processes, policies, and systems and aligning the organizational culture to fully extract the value of valuable, rare, and inimitable resources. When such resources are organized to extract their value, they can yield a sustainable competitive advantage.
VRIO Framework
Using the VRIO framework to organize a firm’s resources can be done in the following manner:
Step 1: Identify the valuable, rare, and inimitable resources.
Since intangible assets are more likely to confer a sustained competitive advantage, they should be examined first. Porter’s value chain analysis, which we learned about in the previous chapter, can be used to identify the most important activities or processes that can yield a competitive advantage.
Step 2: Organize the firm to exploit VRIO resources.
In this step, firms must exploit resources to their maximum potential. Competitive firms live on the frontier of their industry, continuously seeking opportunities to exploit the resources they control to create new value for existing and new customers. For example, Jeff Bezos, CEO of Amazon, regularly communicates to the companies thousands of employees and millions of shareholders that, at Amazon “it is always day one”. This message is intended to motivate all stakeholders to maintain an attitude that innovation and continuous improvement are key to Amazon’s sustainable competitive advantage.
Step 3: Protect and review the identified resources constantly.
In order to use identified key resources, firm leaders have to be aware of their existence and capabilities. Firm strategy should be built around key resources either to lower costs or differentiate the firm from competitors. Then key resources should be made expensive to imitate. As long as other firms can’t imitate a strategic resource, it is likely to remain rare.
Is itValuable?
Is itRare?
Is itInimitable?
Is itOrganized?
Yes
NoCompetitive disadvantage
Competitive parity
Temporary competitive advantage
Temporary competitive advantage
Sustained competitive advantage
No
No
No
Yes
Yes
Yes
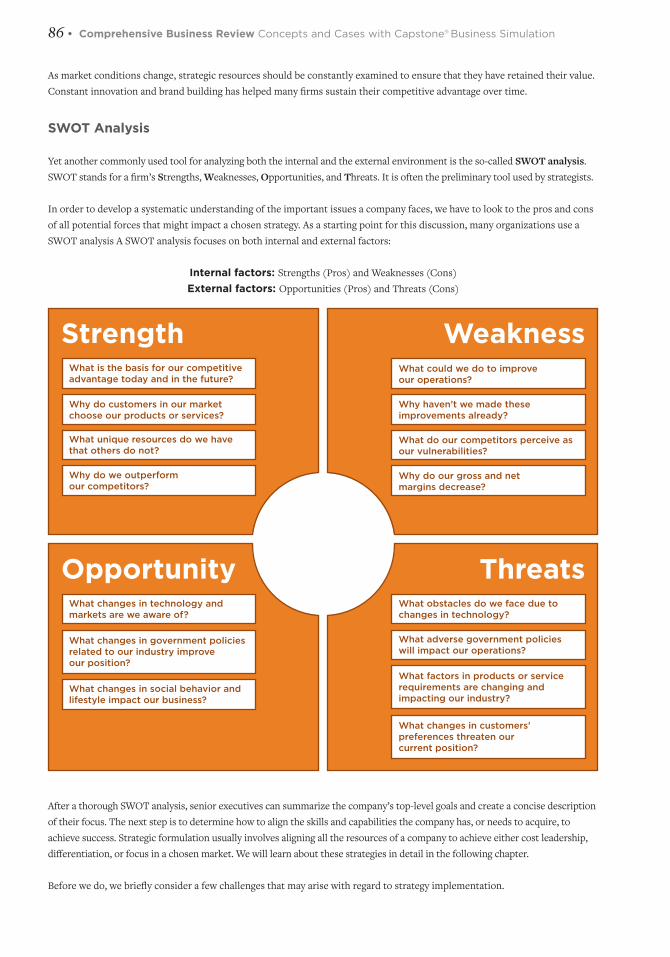
86 • Comprehensive Business Review Concepts and Cases with Capstone® Business Simulation
As market conditions change, strategic resources should be constantly examined to ensure that they have retained their value. Constant innovation and brand building has helped many firms sustain their competitive advantage over time.
SWOT Analysis
Yet another commonly used tool for analyzing both the internal and the external environment is the so-called SWOT analysis. SWOT stands for a firm’s Strengths, Weaknesses, Opportunities, and Threats. It is often the preliminary tool used by strategists.
In order to develop a systematic understanding of the important issues a company faces, we have to look to the pros and cons of all potential forces that might impact a chosen strategy. As a starting point for this discussion, many organizations use a SWOT analysis A SWOT analysis focuses on both internal and external factors:
Internal factors: Strengths (Pros) and Weaknesses (Cons)External factors: Opportunities (Pros) and Threats (Cons)
After a thorough SWOT analysis, senior executives can summarize the company’s top-level goals and create a concise description of their focus. The next step is to determine how to align the skills and capabilities the company has, or needs to acquire, to achieve success. Strategic formulation usually involves aligning all the resources of a company to achieve either cost leadership, differentiation, or focus in a chosen market. We will learn about these strategies in detail in the following chapter.
Before we do, we briefly consider a few challenges that may arise with regard to strategy implementation.
StrengthWhat is the basis for our competitiveadvantage today and in the future?
Why do customers in our marketchoose our products or services?
What unique resources do we havethat others do not?
Why do we outperformour competitors?
OpportunityWhat changes in technology andmarkets are we aware of?
What changes in government policiesrelated to our industry improveour position?
What changes in social behavior andlifestyle impact our business?
WeaknessWhat could we do to improveour operations?
Why haven’t we made theseimprovements already?
What do our competitors perceive asour vulnerabilities?
Why do our gross and netmargins decrease?
ThreatsWhat obstacles do we face due tochanges in technology?
What adverse government policieswill impact our operations?
What factors in products or servicerequirements are changing andimpacting our industry?
What changes in customers’ preferences threaten our current position?

Chapter 7 Strategy: Evaluating the Internal and External Business Environment • 87
Challenges to Strategy Implementation
The most likely roadblocks to implementing the best strategy are as follows:• Incorrect timing: How many books do you know that became famous only posthumously? Similarly, implementing
a good strategy at the wrong time can prove detrimental to a business’s success. For example, Webvan was an online grocer that promised to deliver groceries directly to the home. The company has become renowned for its massive valuation and ultimate failure during the infamous dot-com crash of the early 2000’s. Since then, other firms such as Instacart learned from Webvans mistakes and have begun to carve a competitive advantage in the challenging grocery-delivery industry.
• Ineffective training: It is of critical importance to train employees how to use strategic resources to help the firm develop and maintain sustainable competitive advantage.
• Lack of resources: Although this is a problem usually faced by small companies, even big companies with substantial cash will occasionally suffer resource constraints. No firm is above the laws of market competition and so it is nearly inevitable that all firms will, from time to time, suffer from resource constraints. Strong firms recognize this possibility and plan to retain sufficient cash and other resource reserves to persevere through challenging times.
• Ineffective communication: Aligning team members to work together towards a certain set of goals is difficult without a collaborative setting and effective communication systems in place.
• Resistance to change: The greater the change, the greater is likely to be the resistance to it. This is especially true if employee responsibilities have to be changed or organizational structure has to change in some way. To ensure that employees are not half-hearted about their contributions, it is important to make them see and share the vision and mission. They have to be convinced that the work they do is important and beneficial to others, the company, and ultimately, to themselves.
Keep these challenges in mind while planning and implementing strategies as outlined in the next chapter.
For more information, check out the additional videos link below.
Internal and External Assessment: http://capsim.com/go/v/assess
Porter’s Five Forces:http://capsim.com/go/v/porter
Situation Analysis:http://capsim.com/go/v/situation
Competitor Analysis:http://capsim.com/go/v/analysis
88 • Comprehensive Business Review Concepts and Cases with Capstone® Business Simulation
Chapter 8Strategy: Cost Leadership and DifferentiationLEARNING GOALS
After reading this chapter you will be able to:• Discuss business-level strategies.
• Recognize the four generic business-level strategies identified by Michael Porter.
• Describe the cost leadership strategy and how it creates value for a company.
• Discuss ways in which a company can pursue a cost leadership strategy to achieve sustainable competitive advantage.
• Discuss the advantages and disadvantages of pursuing a cost leadership strategy.
• Describe the differentiation strategy and how it creates value for a company.
• Discuss ways in which a company can pursue a differentiation strategy and achieve sustainable competitive advantage.
• Describe the three factors that a company should consider when implementing a differentiation strategy.
• Discuss the advantages and disadvantages of pursuing a differentiation strategy.
• Describe focus strategies and their advantages and disadvantages.
• Explain how companies can implement both cost leadership and product differentiation as a best cost strategy.
• Explain the steps in choosing the right generic strategy.
• Explain how the Boston Consulting Group (BCG) Matrix can be used to categorize business units and formulate different strategies for each category.
• Discuss strategies that can be used to limit or restrict competition.
Business-level Strategies
Recall our discussion of business-level strategy in previous chapters. Business-level strategy outlines how a company’s products will compete within a market. This may seem simple but is quite complex in reality because there is an endless number of ways to compete. Many companies develop and implement strategy based on a framework developed by Harvard’s Michael Porter. According to Porter, a business-level strategy has two dimensions:
1. The source of competitive advantage: Whether a company intends to gain advantage over its rivals by keeping its costs low or through unique product offerings.
2. The scope of operations: Whether a company seeks a narrow customer segment or a broad customer base.

Chapter 8 Strategy: Cost Leadership and Differentiation • 89
A company may choose any of the two types of competitive advantage—low costs or product differentiation in terms of features valued by customers. The company may also choose whether it wants to serve a narrow or broad market. Depending on the company’s choice along these two dimensions, there are four generic business-level strategies:
1. Cost leadership2. Differentiation3. Focused cost leadership4. Focused differentiation
These generic strategies can be applied to any company in any industry. Ideally, a company should stick to one generic strategy and avoid competing in markets where other generic strategies work better.
Companies that employ either a cost leadership or focused cost leadership strategy endeavor to produce their products and services at the lowest possible cost, given a certain product quality. The companies that employ a differentiation or focused differentiation strategy attempt to come up with unique products or unique product features that would allow them to charge a premium price. Those firms that are able to manufacture products with unique features at a low cost are said to be following a “best-cost strategy”. Firms that aren’t able to manufacture at a low cost or offer unique products are said to be “stuck in the middle” where they face harsh competition.
Let’s look at each of the four generic strategies in turn.
Cost Leadership
A company embracing a cost leadership strategy maintains a market presence in a well-defined “niche” (a specific market segment) or operates broadly across all segments of the market. Such a company gains competitive advantage by keeping R&D, production, material, and labor costs to a minimum. Lower costs enable the company to compete on the basis of price and volume. Consequently, the prices of their products and services will typically be below the industry average. For example, Walmart has widespread appeal within its target market by promising and delivering “everyday low prices”. People who shop at Walmart are generally price conscious buyers. They are operating on a budget that is better suited to the low prices offered by Walmart as opposed to higher price retailers such as Neiman Marcus.
Some companies begin in the low end of the market and gradually develop other products for less price conscious buyers. Volkswagen is a good example. The company started out with a very affordable car (the “Beetle”) intended to be widely available. In fact, the name “Volkswagen” means the “people’s car.” Today, Volkswagen manufactures many higher-end cars such as Audi, Porsche, Bentley, Lamborghini, Bugatti, and many others.
Cost Differentiation
N
arro
w
Bro
ad
Cost leadership
Focused cost leadership
Differentiation
Focused differentiation
Source of Competitive Advantage
Sco
pe
of
Op
erat
ions

90 • Comprehensive Business Review Concepts and Cases with Capstone® Business Simulation
Cost leadership vs. price leadership—is there a difference?
There are two ways in which a company with a low-cost structure can make profits. One way is through cost leadership—produce goods and services at the lowest possible cost in the industry and still charge average prices. This will lead to a large profit margin on each unit sold. The volume of sales need not be high for such a company to make large profits. The second way is through price leadership—to sell the goods at the lowest prices. This may lead to narrow profit margin on each unit but a large volume of sales and large overall profits.
Sustaining Competitive Advantage Through Cost LeadershipRecall our discussion of competitive advantage in earlier chapters. We mentioned that competitive advantage can be created through some combination of operational effectiveness and strategic positioning. Porter’s value chain analysis can be used to identify the stages at which cost effectiveness and thus, operational effectiveness can be achieved. Operational effectiveness is central to becoming a cost leader in any industry.
Ways in which cost effectiveness can be achieved include, but are not limited to, the following:
• Identify the activities that have a relatively greater role in adding to cost, identify their cost drivers, and determine whether the activities are efficient or not.
• Use direct suppliers and build a long-term relationship with them that enables efficiencies and drives down costs.
• Locate close to suppliers and markets to reduce delivery and other logistic costs.
• Build an efficient plant scale and minimize manufacturing costs and strive for economies of scale.
• Reduce labor costs and increase labor productivity.
• Analyze the timing of asset purchases and their maturity period.
• Automate as much as possible to lower chances of human errors and reduce labor input.
• Choose low cost transport carriers.
• Use high-volume shipping to lower transport costs.
• Build an extensive warehouse network to reduce distribution costs.
• Price products so as to generate optimal sales volume.
• Maintain a small but specialized workforce.
• Ensure a good customer experience to build long-term relationships.
• Remove product features that add little or no value to the core offering.
• Build an extensive service coverage area and hire product support experts to reduce costs of customer support.
• Have as few layers of management as possible to reduce overhead costs.
• Lay down consistent human resource management policies to reduce turnover costs.
• Organize frequent training programs to improve productivity.
As noted above, one of the best examples of a company that employs a cost leadership strategy is Walmart. It has the largest customer base in North America, spanning people from all demographic and ethnic groups. In recent years, however, Walmart has been facing stiff competition from Amazon and other online retailers. Walmart has been responding by focusing aggressively on lowering everyday prices through investments in e-commerce, curbside parcel pickup, and other innovations.
There are some characteristics that are common in cost leaders. To cut costs, they strive for greater efficiency at each step of

Chapter 8 Strategy: Cost Leadership and Differentiation • 91
the value chain. They spend very little on research and development, market research, and advertising. Though Walmart spent around $2.3 billion on advertising in 2013, it was a tiny fraction of its total sales.
Another way to achieve cost efficiency is through economies of scale. Economies of scale occur when the cost of each good produced decreases as the volume produced increases. This reduction in cost per unit occurs because the initial investment of capital is shared with an increasing number of units of output. Large companies, such as Walmart, have significant market power and so they demand price concessions from their suppliers. Lower costs enable Walmart to sell products at lower prices. In Walmart’s defense, it also lends considerable aid to suppliers in finding ways to cut their costs as well.
Advantages and Disadvantages of Cost LeadershipEvery strategy has its own advantages and disadvantages. Because cost leaders are highly efficient in production, they can withstand price competition from other firms in the industry. When price wars happen, the winners are protected from rivals as the latter squander their money in an attempt to offer the lowest price. For example, Amazon has emerged the winner in price wars because of its focus on operational effectiveness that has enabled it to thrive on thinner profit margins than its smaller competitors. Thin profit margins also make it difficult for new entrants to enter the marketplace.
However, when a company is overly focused on price, it may lose track of evolving consumer tastes and preferences. Its emphasis on efficiency may make it ill-placed to adapt to changes that may be required. Another disadvantage of the cost leadership strategy is that if the perceived quality of products is really low, the business may suffer. Because profit margins are slim with this strategy, large volumes of sales are required to make large revenues.
Advantages Disadvantages
Can withstand price competition from other firms
Can lose track of changes in consumer tastes and preferences
Market entry difficult for new firms due to thin profit margins
Business may suffer if perceived quality of product is low
Large market share and high profits Large sales volumes required to make profits
Some companies may find it easy to sell products at low prices and thus gain a competitive advantage in the market. However, they also need to be capable of sustaining the relatively low prices over a long period of time. If there is a dominant firm in the market, it may undercut a new-entrant company’s prices to retain its market position, effectively undercutting its strategic approach. So, unless a company can sustain its low prices, it may want to select a different strategy or a blend of strategies.
Next, let’s take a look at differentiation as a strategy.
Differentiation
With this generic strategy, companies seek to provide customers a different, and often unique, experience in order to differentiate their products or services. Sometimes the experience is considered a differentiator in and of itself. Other times the differentiating factor could be derived from unique technology. Of course, a combination of both can be used as well. For example, think about a car.
A car in its simplest form is just a mode of transportation to get you from point A to B. However, the experience that a Rolls-Royce seeks to provide is much different than a Ferrari, or a Volkswagen, or a Ford for that matter. People who shop for Rolls Royce vehicles are in the market for a product that offers them value that the other brands do not provide. Rolls Royce caters to this market by differentiating its offerings in constantly evolving and unique ways. For example, its latest offering, the Cullinan, is a sport utility vehicle priced at around $400,000. One of the unique features of this vehicle is a one-of-a-kind tailgate seating platform designed to enable owners to watch polo matches (or soccer matches) from the back of their car.

92 • Comprehensive Business Review Concepts and Cases with Capstone® Business Simulation
Instead of focusing on new designs of a given product in a particular market segment, another differentiation strategy can be accomplished by maintaining a presence in every segment of the market. For example, the French luxury goods manufacturer LVMH provides champagne and wine as well as fashion products to the market. The Italian fashion design conglomerate, Armani, offers furniture and hotel services. Some companies execute such strategies by focusing on broader product categories across market segments, like Nike (shoes and apparel) or Sony (electronics).
Any company that wishes to follow a differentiation strategy must consider three factors:1. Product attributes: The product must be distinguished by any or all of the following: excellent designs, novelty,
usability, customizability, ease of use, quality, trendiness, and many others. Consequently, companies that choose a differentiation strategy normally develop a highly skilled R&D function that keeps designs fresh and exciting. Products will keep pace with market changes by offering improved features, such as size and performance (e.g., smaller, faster smartphones). Even when costs are managed well, companies pursuing a differentiation strategy will often end up with a price above industry average and thus need to closely link production capacity to a higher market demand.
2. Customer needs and wants: All goods and services satisfy some human desire. Identifying and understanding the desires can be the basis for differentiating products and representing them as more attractive than similar products in the market. Marketing plays a key role in this aspect of differentiation. It can identify a previously unperceived new customer want or market segment. Marketing helps a company reduce the competition it faces, gain more market power and so, make greater-than-average profits.
3. Core competencies and capabilities of the company: What a company is capable of accomplishing determines its market position.
Sustaining Competitive Advantage Through Differentiation
Strategic positioning is key to achieving competitive advantage through differentiation. Again, Porter’s value chain analysis can be used to identify ways in which this can be achieved:
• Superior raw materials and other inputs
• Enhanced product appearance
• Extended life cycle of the product
• Wide, customized range of products
• Manufacturing systems that allow variations of the product
• Highly efficient delivery systems that minimize input and output damage
• Brand building activities
Product Attributes
Differentiation Customer Needsand Wants
Core Competenciesand Capabilities of
the Company

Chapter 8 Strategy: Cost Leadership and Differentiation • 93
• Raising of purchase convenience
• Provision of the right information to aid customers in selection
• Extensive, targeted advertising
• Fast, reliable, and high quality after-sales services
• Innovative and unique product features
• Investment in technology that allows the production of highly differentiated goods and services
• High quality replacement parts
Examples of companies that use product differentiation strategies abound. • Barbie dolls, ever since they grew wildly popular, have been constantly evolving to reflect current trends in female
tastes and fashion. Since 2004, Mattel has also been releasing Barbie movies to further set it apart from other dolls in the market.
• Starbucks uses Clover coffee machines that brew high quality coffee and it trains its baristas to make multiple combinations of customized coffee within 3-5 minutes of a customer walking in.
• Nike touches emotional chords with its branding efforts through the iconic “swoosh” and the slogan, “Just do it”. Moreover, its intensive research and development efforts leading to continuous product innovation and its increased brand appeal through celebrities advertising it has further set it apart from its competitors.
Note how all of these companies have employed more than one tactic for differentiation.
Advantages and Disadvantages of Differentiation
An advantage of differentiation over cost leadership is that the nuances of the strategy are far more difficult to imitate as products tend to be unique. Patents and copyrights also often play a huge role in ensuring products stay differentiated. Dropbox, in addition to its simplicity of use, has a patent on how a number of people can share and synchronize file and folders across a network. Over time, differentiated products generally gain brand loyalty that ensures the company stays afloat for a long time. Well-known brands can charge price premiums for their products.
On the other hand, following a differentiation strategy has its disadvantages too. Price-sensitive buyers shun high-end products and so, such a strategy may not work as well in developing countries. Cheaper product imitations also eat into a brand’s market share. This is best exemplified in China where manufacturing plants abound and imitations of Apple, Nike and almost any famous brand emerge from.
Advantages Disadvantages
Product nuances difficult to imitate or protected by patents and copyrights
Price-sensitive buyers may shun it
Brand loyalty ensures that the company stays afloat for a long time
The brand’s market share may diminish due to cheaper product imitations
94 • Comprehensive Business Review Concepts and Cases with Capstone® Business Simulation
Focus Strategies
So far, we have discussed the generic strategies of cost leadership and differentiation. Because these two generic strategies appeal to customers in general they are regarded as “broad” strategies. Narrower generic strategies that appeal only to customers in a target market can also be designed. Such strategies are referred to as focus strategies. While focus strategies and broad strategies have much in common, there are a few things that differ. Below we examine two focus strategies: focused cost leadership and focused differentiation.
Focused Cost Leadership
A company with a focused cost leadership strategy engages in price competition within a narrow target market. It exploits variations in price in different market segments. It does not necessarily charge the lowest price across broad market segments as does Walmart. Rather, the focused cost leadership approach seeks to be a low-price provider only in specific market segments.
Since a business often offers a variety of products to customers, it may focus its cost minimization efforts on a particular product in a particular market segment. The product on which the business focuses its efforts depends on a number of factors, including the degree of competition the product faces. Another factor in the decision about which product to apply the focused low-cost strategy to concerns its production. Companies that offer multiple products often also have different means for producing those products. For example, major automobile manufacturers often outsource much of their production to less costly foreign companies. Auto companies that use this approach may be able to compete with lower prices for those products in the domestic consumer markets. This would not be a broad strategy, but rather one that is focused only on those outsource manufactured products and only in the markets to which they cater.For example, Ford Motor Company produces its popular Fusion automobile in Mexico. The Fusion competes on price with other models, such as the Chevy Impala and the Honda Civic. Ford doesn’t mind competing on price in this market because it makes most of its money selling the large pickup trucks, which are predominately manufactured in the United States.
Focused Differentiation
A company is said to be following a focused differentiation strategy if it offers products with unique features that cater to the specific needs of a narrow target market. Focused differentiation strategies are often employed by large companies to sell a select few products. This is because it is generally impossible to promote all of their products in the same manner. Therefore, marketing is generally focused on select products or in select markets, where a price premium can be charged. However, the company’s other products may also witness increased sales as the company’s brand gains in status. Focused differentiation may be based factors such as:
• Demographic or societal preferences based on age or certain attitudes adopted by a group of people
• Emotional elements based on known stimuli, often culture-related
• Psychological elements based on common aspirations, fears, and hopes
• Aesthetic elements based on the latest trends and fads
Advantages and Disadvantages of Focus Strategies
With a focused cost leadership strategy, a company charges either average or relatively low prices and makes little or no profit. Firms tend to trade off these lower profit margins for increased brand recognition and market share. With a focused differentiation strategy, a company can charge price premiums and make substantial profits. Firms using this approach must commit resources to research and development to ensure their innovation is market leading, resulting in products that consumers crave.
Another advantage of focused strategies is that firms that follow them develop greater expertise regarding the products they offer. For example, in the market for DSLR cameras, different people may have different requirements depending on their
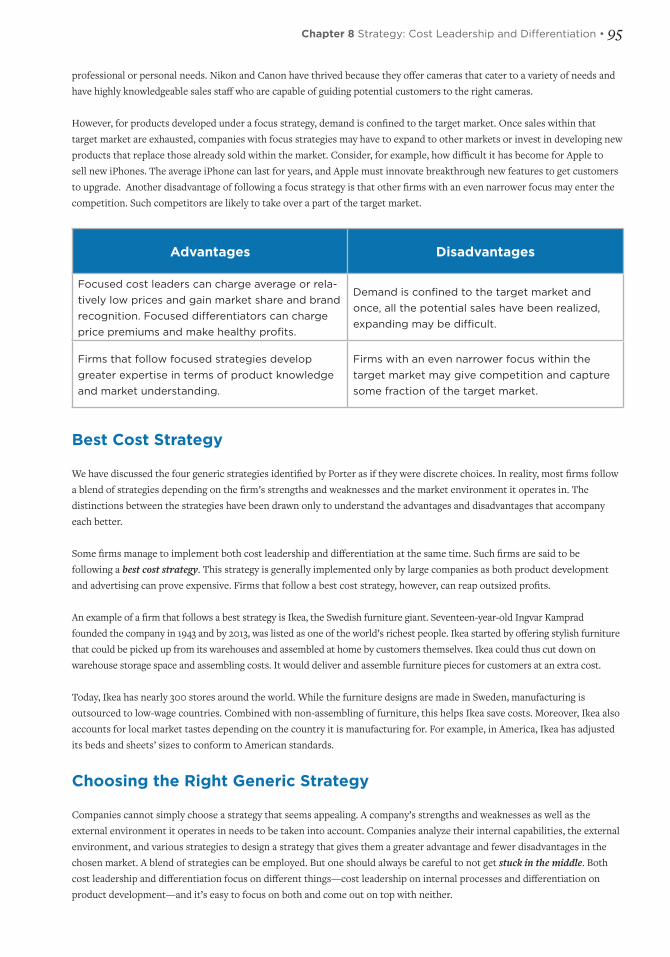
Chapter 8 Strategy: Cost Leadership and Differentiation • 95
professional or personal needs. Nikon and Canon have thrived because they offer cameras that cater to a variety of needs and have highly knowledgeable sales staff who are capable of guiding potential customers to the right cameras.
However, for products developed under a focus strategy, demand is confined to the target market. Once sales within that target market are exhausted, companies with focus strategies may have to expand to other markets or invest in developing new products that replace those already sold within the market. Consider, for example, how difficult it has become for Apple to sell new iPhones. The average iPhone can last for years, and Apple must innovate breakthrough new features to get customers to upgrade. Another disadvantage of following a focus strategy is that other firms with an even narrower focus may enter the competition. Such competitors are likely to take over a part of the target market.
Advantages Disadvantages
Focused cost leaders can charge average or rela-tively low prices and gain market share and brand recognition. Focused differentiators can charge price premiums and make healthy profits.
Demand is confined to the target market and once, all the potential sales have been realized, expanding may be difficult.
Firms that follow focused strategies develop greater expertise in terms of product knowledge and market understanding.
Firms with an even narrower focus within the target market may give competition and capture some fraction of the target market.
Best Cost Strategy
We have discussed the four generic strategies identified by Porter as if they were discrete choices. In reality, most firms follow a blend of strategies depending on the firm’s strengths and weaknesses and the market environment it operates in. The distinctions between the strategies have been drawn only to understand the advantages and disadvantages that accompany each better.
Some firms manage to implement both cost leadership and differentiation at the same time. Such firms are said to be following a best cost strategy. This strategy is generally implemented only by large companies as both product development and advertising can prove expensive. Firms that follow a best cost strategy, however, can reap outsized profits.
An example of a firm that follows a best strategy is Ikea, the Swedish furniture giant. Seventeen-year-old Ingvar Kamprad founded the company in 1943 and by 2013, was listed as one of the world’s richest people. Ikea started by offering stylish furniture that could be picked up from its warehouses and assembled at home by customers themselves. Ikea could thus cut down on warehouse storage space and assembling costs. It would deliver and assemble furniture pieces for customers at an extra cost.
Today, Ikea has nearly 300 stores around the world. While the furniture designs are made in Sweden, manufacturing is outsourced to low-wage countries. Combined with non-assembling of furniture, this helps Ikea save costs. Moreover, Ikea also accounts for local market tastes depending on the country it is manufacturing for. For example, in America, Ikea has adjusted its beds and sheets’ sizes to conform to American standards.
Choosing the Right Generic Strategy
Companies cannot simply choose a strategy that seems appealing. A company’s strengths and weaknesses as well as the external environment it operates in needs to be taken into account. Companies analyze their internal capabilities, the external environment, and various strategies to design a strategy that gives them a greater advantage and fewer disadvantages in the chosen market. A blend of strategies can be employed. But one should always be careful to not get stuck in the middle. Both cost leadership and differentiation focus on different things—cost leadership on internal processes and differentiation on product development—and it’s easy to focus on both and come out on top with neither.

96 • Comprehensive Business Review Concepts and Cases with Capstone® Business Simulation
There are several strategic analysis tools that firms can deploy to determine an appropriate strategy.
As discussed in the previous chapter, a good way for companies to develop an understanding of their capacities and the complexities of their environment is to undertake a SWOT analysis. Recall that SWOT is an acronym for Strengths, Weaknesses, Opportunities, and Threats. Analyzing these things helps companies determine both internal strengths and weaknesses, and external opportunities and threats. SWOT analyses should be conducted with broad participation, including surveys of employees, customers, shareholders, and others. Of course, companies should proceed deliberatively but also with speed, as competitors are also interested in gaining advantages. Firms should avoid “paralysis by analysis”, but not avoid gathering data and making informed decisions.
Another technique discussed in a previous chapter is the so-called PESTLE analysis. PESTLE is an acronym for Political, Economic, Social, Technological, Legal, and Environmental variables and forces impacting a company and its ability to compete. In addition to the business forces impacting a company and analyzed via a SWOT analysis, a PESTLE analysis helps a company understand and cope with social and political forces.
Another framework for analyzing a firm and its potential strategies focuses on internal business units and is based on research from the world-renowned Boston Consulting Group. We explore that framework next.
BCG Matrix
In this context, it is helpful to discuss one of the tools that the Boston Consulting Group developed to evaluate the strategic position of various products in a business portfolio and their potential. Named the BCG Matrix, it categorizes a business portfolio into four categories based on competitive position and industry attractiveness. Competitive position is measured by relative market share, and industry attractiveness is measured by the growth rate of the industry.
Relative market share: A higher relative market share generally points to a cost advantage over competitors and leads to higher returns due to economies of scale, the experience curve, and a high volume of sales. Relative market share determines how much cash is generated as revenue.
Market growth rate: A market that is growing rapidly would require a large amount of investment in assets to increase capacity and thus leads to cash consumption. Therefore, business units that operate in rapid growth industries are worth investing in only if they are expected to grow enough to generate substantial returns. Based on these two dimensions, there are four quadrants into which business units or products are classified:
1. Dogs: Dogs have relatively low market share and operate in industries with a low growth rate. Dogs are generally not worth investing in as they generate low or negative returns. However, a thorough analysis of dogs is recommended before deciding to divest. They may be capable of generating low profits for a long period of time and so may act as a line of defense should market conditions for other business units look dim.
2. Cash cows: With a relatively high market share in a low growth industry, cash cows are the most profitable business units or products. They generate a lot of cash with little investment. Cash cows should be “milked” to gain as much profits as possible. The profits can be used to pay out dividends, invest in stars and question marks, fund research and development, etc. Because they operate in a low growth market, the profit stream tends to be steady and the net present value of cash cows can be calculated with reasonable accuracy.
3. Stars: Stars have relatively high market share in high growth industries. Therefore, they consume as well as generate a lot of cash, in effect, mostly netting out profits. If a star can maintain its market share long enough until the industry matures and its growth rate slows down, it will become a cash cow. However, if the star operates in a fast-changing industry where innovation is common, it may end up becoming a dog instead. Market penetration and product development are important strategies for stars.

Chapter 8 Strategy: Cost Leadership and Differentiation • 97
4. Question marks: Often called “problem child”, a question mark has relatively low market share in high growth industries. As a result, there is heavy net cash consumption. However, question marks may have the potential to gain market share and become stars, and eventually cash cows. Therefore, investing in them requires extremely careful consideration since if they struggle to gain market share, they may end up becoming dogs.
The BCG matrix is useful for determining the current and future profitability of various business units. However, due to the simplicity of the BCG matrix model, its use has declined. There are factors other than market growth rate and relative market share that determine industry attractiveness and competitive position, respectively. Still, the BCG matrix can be used as a starting point to consider all of business units and discuss the extent of available resources to be invested in each of them. It can be used as a guideline for investment but should not be used solely to determine the strategy or bundle of strategies a business should follow. The other tools discussed in the previous chapter (SWOT analysis, PESTLE analysis, Porter’s five forces, etc.) should be used to evaluate business strengths, weaknesses and the external environment, and the insights drawn from these analyses should be combined with management judgment to design appropriate strategies and tactics.
Restrictive Strategies
All strategies exploit one thing: market imperfections. Under perfect competition, there is no way for any single firm to control prices. Therefore, competitive advantage is always created by exploiting market imperfections to create and maintain barriers of various kinds and thus control product prices. Barriers may include natural barriers (such as control over resources unique to an area), monopoly knowledge of a product or process, brand value, patents and copyrights, etc. Competitors may also be removed by aggressive tactics such as takeovers and mergers.
In the spirit of limiting competition, here are some other strategies that may be followed by companies:
Acquisitions and mergers: This can be done if the competing enterprise threatens to hold some sort of competitive advantage.
?Question Marks
Dogs
Stars
$Cash Cows
Relative Market Share
Mar
ket
Gro
wth
Rat
e

98 • Comprehensive Business Review Concepts and Cases with Capstone® Business Simulation
There are a few considerations when deciding whether to acquire a company or merge with it:
• Finances: Does the acquiring firm have sufficient capital, or can it arrange enough to acquire the company?
• Unwillingness of the company to be acquired: Are any of the key stakeholders or the senior managers of the company opposed to the merger? Steve Jobs recognized the value of Dropbox while it was still in its nascent stages and offered a massive sum of money for the takeover, but Drew Houston, the founder or Dropbox, turned him down at the time. Now, Dropbox is still a better product than Apple’s cloud storage services. Turning down the takeover turned out to be a loss to Apple and a good strategy for Dropbox.
• Antitrust laws: The government may want to restrict market power to keep the prices affordable for the public and thereby, it may seek to prevent collisions and mergers.
Impressing upon customers a large quality gap between your products and other products: There is a substantial overlap between this strategy and a product differentiation strategy. It may require extensive advertising and thus, a large amount of financial resources. This strategy may also force competitors to engage in defensive advertising.
Driving competitors out of business: There are two ways in which this can be accomplished—through predatory pricing or through control of a key input. Predatory pricing involves reducing prices substantially and holding them there long enough to gain a large market share. This strategy also requires having financial resources in excess of what competitors hold. However, it takes shorter time to achieve victory with this strategy than it does with aggressive advertising.
Persuading the government to implement favorable policies: There are a number of ways in which this strategy can be implemented depending on the product, firm, and industry. For products that already have patents, their validity can be extended. In the case of foreign companies making products at a cheaper rate, quotas and tariffs can be imposed. In the case of the airlines industry, the number of airline operators can be limited.
The main purpose of all the above-mentioned strategies is to restrict competition. In summary, competitive advantage can be achieved by following any of or a blend of Porter’s generic strategies or the strategy of restricting competition. The strategies may be broad or narrow in scope. Choosing a strategy always results in making tough choices about who a company wants to be, who it wants to serve, and how this will be accomplished. This also means there will be trade-offs, advantages, and disadvantages in any strategy. The best strategy for your company, in the end, may be unique to your company, and it is worth spending some time on formulating it in order to succeed.
For more information, check out the additional videos link below.
Basic Strategies:http://capsim.com/go/v/basic
International Strategy:http://capsim.com/go/v/international
Generic Strategies:http://capsim.com/go/v/generic

Chapter 9 Ethics: Doing It Right—Social Responsibility and Ethical Decision-Making • 99
Chapter 9Ethics: Doing It Right—Social Responsibility and Ethical Decision-MakingLEARNING GOALS
After reading this chapter you will be able to:
• Define what represents an ethical issue.
• Describe the ethical decision-making process.
• Define social responsibility.
• Compare and contrast concepts such as triple bottom line and corporate philanthropy.
• Discuss the four steps of the ethical decision-making process.
• Describe the five major approaches (theories) of business ethics.
• Differentiate between primary and secondary stakeholders.
• Apply the ethical decision-making process to business situations.
The Broader Context of Business
Business, by its very nature, cannot operate in a vacuum. Instead, business requires constant interaction with a wide range of stakeholders, and each of these stakeholders is impacted by the actions the business takes. As we
discussed in Chapter 1, business stakeholders are both internal (e.g., owners and employees) and external (e.g., suppliers, bankers, customers, etc.). And every day, while businesses are operating within their commercial, physical, and community environments, their activities are constrained by laws, regulations, and, in some cases, culture. Within that web of interactions and restrictions, however, there are gray areas—areas where human behaviors, lack of clarity, and conflicting rules and expectations can lead to problems that need to be solved not by financial or managerial logic but by ethical reasoning. This is the domain of business ethics.
An awareness of ethical principles in general helps to determine the standards of behavior that guide us in our daily life. These principles shape our relationships at home, at work, and within our chosen profession, our community, and society at large. Such considerations are at the heart of how we structure our organizations—our schools, our businesses, our community and nonprofit groups, and our places of worship, as well as our governments, the laws we enact, and the systems we provide to our citizens such as healthcare, energy, transportation, and taxation.
We make ethical decisions every day, often without thinking about them—whether to slide through a stop sign when we don’t notice any traffic, whether to cheat ( just a little) on expense reports or taxes, whether to download music we didn’t pay for, or even how we deal with a coworker or classmate who doesn’t contribute their share of the work.
Ethical principles also come into play in nearly every decision we make when running a business. The difficult part, however, is being able to first recognize the “ethics” in a given decision and then to follow a thought process that more fully informs the decisions we ultimately make. The main goal of this module is to help paint a clearer picture of business ethics, why they matter, and what we can do to improve our ethical decision-making skills.
100 • Comprehensive Business Review Concepts and Cases with Capstone® Business Simulation
Business Ethics Basics
To understand the broad implications of business ethics, we should start by defining a few terms. Put simply, an ethical issue is one where a person’s actions, when freely performed, may either harm or benefit others or both. Therefore, ethical decision-making is the process through which you determine what course of actions you will take. This process necessarily involves making choices while considering the possible consequences of those choices for the business and its stakeholders.
A decision is deemed ethical when it is both legal and morally acceptable to the larger community and is based upon careful consideration of the facts. Sometimes what is legally acceptable in a business context may not be considered morally acceptable to the broader community. In these and many other circumstances, the application of ethical decision-making is critical to avoid adverse consequences either to stakeholders or to the business itself. We will return to a discussion of the ethical decision-making process later in this chapter.
Ethical practice relies on rational thought to inform us how we ought to act in such matters as fulfilling our obligations and duties, being compassionate and fair, respecting the rights of others, and contributing to the greater good of society. It is important to point out that simply believing that you are an ethical person is no guarantee that others will view you this way. In fact, it is the actions we take (our behaviors) that are most often what is ultimately judged to be ethical or unethical.
Business is essential for a prosperous society, and we rely on businesses to act ethically by not putting their own interests above those of the society at large. In other words, we need those who lead businesses to consider the impact of their activities on the rest of us. Business ethics, however, aren’t just relevant to chief executives who make major decisions. Ethical issues come up at every level of business. Start work in any type of business at all and you are likely to encounter job-related ethical conflict.
But No One’s Going to Notice . . . Ethical breaches can lead to blatantly illegal activities that destroy businesses,
families, fortunes, and more. The seeds of unethical behavior, however, can seem
insignificant, even acceptable because “everybody does it” or “no one will even
notice.” Some examples are sneaking food out from the restaurant you work for, a
boss promising the employees a day off to reward them for additional work and then
not following through, someone taking credit for another person’s work, doing a
fake online review of a friend’s business, calling in sick to go to the beach, sliding a
personal purchase into a business expense account, and copying a piece of software
from work onto your home computer. How many more examples can you list from
your imagination or your experience?
Ethics and Social Responsibility
Business ethics operate on two levels. At the individual level, decisions with ethical considerations need to be made in all areas of business. The company as a whole, however, also bears a social responsibility. After all, it is society at large that makes the operations of any business possible.
The pressures on organizations to act in responsible and ethical ways come from a variety of stakeholders, including a firm’s customers, employees, industry groups, etc. Laws and regulations also frame the types of actions seen as acceptable in a given society. However, as we have said, compliance with the law is often not the same thing as acting in a responsible or ethical manner. One way to view business ethics is as a part of the pyramid of social responsibility.

Chapter 9 Ethics: Doing It Right—Social Responsibility and Ethical Decision-Making • 101
Social responsibility is an ethical or ideological theory stating that an organization or individual has an obligation to society at large. Sometimes this is referred to as the “social contract” between business and society and includes the informal expectations that the public holds for business practices.
In its simplest form, social responsibility in business involves four steps that begin at the base on the pyramid:1. Be profitable (required)
2. Obey the law (required)
3. Be ethical (expected)
4. Be a good corporate citizen (desired)
Triple Bottom Line
Pressure to act in a more socially responsible way has led many businesses to focus on more than just profits and to adopt a broader view of business success. This viewpoint has been called the triple bottom line (TBL) and involves businesses evaluating success in terms of financial, environmental, and social performance—sometimes referred to as a focus on “people, planet, and profits.”
Corporate Philanthropy
Efforts to increase social responsibility also can be found in corporate philanthropic activities as companies seek to improve the communities and societies in which they reside and operate.
Be a
good
corporate
citizen
Be ethical.
Obligation to do
what is right and fair.
Avoid harm.
Obey the law.
Law is society’s codification
of right and wrong.
Be profitable.
The foundation upon which
all others rest.
PhilanthropicResponsibilities
EthicalResponsibilities
LegalResponsibilities
EconomicResponsibilities

102 • Comprehensive Business Review Concepts and Cases with Capstone® Business Simulation
A recent report from the Committee Encouraging Corporate Philanthropy in New York, an international forum of CEOs and Chairpersons, said 84% of corporate executives believe that “society now expects businesses to take a much more active role in environment, social, and political issues” than ever before. The report, based on research by McKinsey and Company, notes:
“Successful philanthropy today is not simply writing checks to the local charity. Philanthropic pursuits are becoming an important way for most corporations to communicate with stakeholders, gauge their interests and satisfy their elevated expectations. By choosing the right philanthropic programs—those that yield social benefits and address stakeholder interests, companies can build a good corporate reputation. And a good reputation is both a source of tangible value and a reservoir of good will to be tapped if a company runs into trouble.”
The report concludes that the most successful philanthropic programs are those that are operated using the principles of sound management applied elsewhere in the company: a clear strategy, good teamwork (harnessing the talents and capacities of a variety of people), and constant, ongoing measurement against goals or standards. “By treating ‘giving’ as a business unit,” the CECP report says, “the philanthropy team is empowered to contribute to the wealth of the company just as the rest of the business does.”
Not Just a Few Bad Apples
Of course, we more often hear about organizations that fail to act ethically and responsibly. These tend to be the situations that make the news headlines and rightly so considering the costly consequences of many ethical breaches. Engineers at Thiokol had safety concerns about the cold weather performance of a space shuttle part—the O-ring—but did not ensure that this information was communicated to key officials. The Space Shuttle Challenger exploded on launch on a cold morning in 1986, killing all seven crew members.
BP’s Deepwater Horizon oil rig continued drilling even though its blowout preventer was defective, faulty software was causing rig systems to crash, emergency alarms were disabled, and a relatively inexpensive acoustic trigger (which could have shut down a damaged well) was not installed. Eleven BP employees were killed, 17 more were injured, and nearly 5 million barrels of oil leaked into the Gulf of Mexico.
News Corp. executives were caught in a phone-hacking scandal that was thought to involve eavesdropping on politicians, celebrities, and members of the Royal Family but was later discovered to include private citizens—including victims of crime and the relatives of soldiers killed in action. The scandal, including accusations of police bribery and improper influence, led to the closure of the News of the World newspaper after 168 years.
The failure of American International Group in 2008, due to under-collateralizing one of its credit products, had a devastating effect on the world economy, precipitating a global financial crisis. These and other sensational business stories involved unethical business behavior that eventually affected thousands.
These examples certainly point out that the consequences for acting unethically or irresponsibly can be severe and long-lasting for organizations. Yet organizations don’t make decisions, people do. It was individuals in these organizations who decided on the particular courses of action that ultimately led to negative outcomes.
To be clear, this does not mean that poor decisions are the result of one or two unethical employees (the so–called “bad apples”), which is the common explanation given in these situations. Nor does this mean that corporate work environments have little influence on ethical decision-making. To the contrary, an organization’s culture—the social aspects of its work environment—can have an effect on the way people think and act, especially in regard to ethics and social responsibility. For example, the seeds of an ethical crisis often go unrecognized. A series of small, even unrelated, decisions can culminate in “the
Chapter 9 Ethics: Doing It Right—Social Responsibility and Ethical Decision-Making • 103
perfect storm.” A person who is normally honest and virtuous in his or her personal life may justify unethical behavior at work as “just business” or as “the way things are done around here.” Perhaps that person put personal success and the financial security of his or her family before his or her responsibility to society at large or he or she felt compelled to act against their better judgment because of pressure from an authority figure, a corrupt organizational culture, or one that offered no clear expectations about how to act.
What doesn’t make the news, but is more common, is this type of scenario:
A mid-level advertising executive pressures a new hire to “fudge” a routine advertising
spending report provided to its client, a brand manager of skin care products with
a large pharmaceutical company. The executive suggests, “It’s just the way it’s done
around here.” Against better judgment, the new hire complies and numbers are
massaged to misrepresent the agency’s spending of client funds. The client’s brand
manager detects the fraud and notifies the entire corporate chain of command,
sparking a crisis of confidence between the client and the advertising agency.
When the situation is reviewed at the agency’s senior level, whose job and career will be on the line in an effort to appease the client and save the business relationship? The account supervisor with years of experience in the skin care market or the most recent addition to the account team? Developing an ethical consciousness might have helped the young recruit in this example. However, and this is part of the paradox of business ethics, it might not have had any impact on the outcome for the individual. Acting ethically and refusing to fudge the numbers may have led to the same result. The new recruit might have lost his job for not being a good “fit” for the position. The client might have fired the agency for poor results. The only guaranteed reward for ethical actions is the knowledge that everyone acted ethically.
With some understanding of basic ethical principles and training in how to approach ethical problems, we can be less vulnerable to undue or untoward pressure in the workplace and better able to help shape a company’s ability to be a good corporate citizen. Understanding how to use ethical decision-making tools may be as important in business as understanding the disciplines of marketing, finance, and operations.
Ethical Decision-Making Process
Trying to engage in an ethical decision-making process presents several challenges. The first challenge is that many problems do not scream “Look at me! I’m an ethical issue!” That is, ethical dilemmas are not always clear-cut cases of “right versus wrong.” In fact, many ethical dilemmas involve situations that are “right versus right,” where choices entail deciding on truth versus loyalty, short-term versus long-term effects, or individual versus community. A second challenge is that ethical decision-making requires effort, perhaps even more effort than we typically give to other decisions. A third challenge is that ethical decision-making requires that we avoid our natural tendency to make snap judgments or use quick solutions.
To help meet these challenges, it is important to follow a deliberate and systematic process. Generally speaking, there are four steps to the ethical decision-making process:
1. Investigate the ethical issues
2. Identify the primary stakeholders
3. Increase the number of alternative courses of action
4. Inspect the consequences of the alternatives
104 • Comprehensive Business Review Concepts and Cases with Capstone® Business Simulation
While proceeding through the steps above may take more time and effort, there are several benefits. A multistep process encourages discussion with others and may uncover additional viewpoints as well as reveal how these viewpoints are similar or different. It allows fair evaluation of conflicting perspectives, each of which may involve what appears to be “good” or “right” reasons. By considering multiple courses of action, decision-makers may reject a proposed action as inappropriate, even if it was originally widely supported. A multifaceted evaluation can highlight which option may be the best choice and can build consensus regarding that decision, particularly as key decision-makers consider public reaction to their choice. Finally, a multistep process provides a structure to use to evaluate the decision after action has been taken and to determine what practical knowledge the situation provided.
Now, let’s walk through each of these steps in more detail.
Step 1: Investigate the Ethical Issues
The first step in the ethical decision-making process is to gather relevant information about the situation and to use that information to identify the ethical issues involved. This means you need to collect the facts and define the ethical dilemma or problem that you face.
Relevant information can be revealed by asking questions such as:• What are the potential legal issues? What laws or regulations are related to the situation?
• Has the organization faced this situation before? If so, what actions were taken previously and why?
• Who has the final authority to make a decision?
• Are there organizational rules, policies, or regulations that govern the decision?
Once you’ve gathered all the relevant facts, it is time to use those facts to define the ethical issues involved in the situation. At the broadest level, there are several categories of ethical problems that help identify ethical issues. For example, does the situation present a case of bribery, an abuse of resources, a conflict of interest, or a form of discrimination? These ethical problems can occur in any function of business.

Chapter 9 Ethics: Doing It Right—Social Responsibility and Ethical Decision-Making • 105
Some Examples of Ethical Breaches Common to Business Functions
Accounting andfinance
Compensation issues, such as excessive payments made to senior executives.
“Creative” accounting, misleading financial analysis, or reporting.
Bribery, kickbacks, and facilitation payments, which, while perhaps beneficial for the short-term interests of a company, can be anticompetitive or offensive to societal values.
Marketing andsales
Price fixing, price discrimination, and price skimming.
Attack ads, subliminal messages, sex in advertising, and products regarded as immoral or harmful.
Specific marketing strategies such as green washing, bait-and-switch, shill, viral marketing, spam, pyramid schemes, and planned obsolescence.
Unethical marketing to children, such as marketing in schools.
Production and operations
Defective, addictive, and inherently dangerous products such as tobacco, alcohol, weapons, motor vehicles, chemicals, and drugs.
New technologies and their potential impacts on health (e.g., genetically modified food, mobile phone radiation, etc.).
Impact of production processes on the natural environment.
Product testing ethics: animal rights and animal testing or use of economically disadvantaged groups (such as students) as test participants.
Human resources
Discrimination on the basis of age, gender, race, religion, disabilities, weight, or attractiveness.
Issues affecting employee privacy, such as workplace surveillance and drug testing.
Occupational safety and health.
A useful tactic for exploring the ethics of a situation is to apply different ethical theories or perspectives. The value of applying different perspectives is that it forces you to see the problem from multiple viewpoints, which is absolutely essential to the ethical decision-making process. Doing this helps reveal aspects of the problem that you might not have considered and can often suggest the best way to carry out a decision.
There are many specific ethical theories or perspectives that can be applied. However, the majority of these fall into five general approaches:

106 • Comprehensive Business Review Concepts and Cases with Capstone® Business Simulation
Utilitarian: This approach assesses a possible action in terms of its consequences or outcomes. For a company, that is the net benefits and costs to all individual stakeholders. The goal of this approach is to achieve the greatest good for the greatest number while creating the least amount of harm or preventing the greatest amount of suffering. In a business context, a utilitarian approach might rely on a statistical analysis of probable outcomes, a classic costs/benefits assessment, or consideration of the marginal utility (the added value) of a consequence for various stakeholders in the group.
Individual rights: This approach focuses on respect for human dignity, which comes from our ability to choose freely how we live our lives and our moral right to consider others to be free, equal, and rational people, and to respect their choices. The goal of this approach is to avoid actions that infringe on the rights of others. In a business context, an individual rights approach might rely on determining whether an action would infringe on the rights of an employee (or other stakeholders) and/or whether an action meets the moral obligation for equality of treatment across all people. Some common examples of rights include right to privacy, right to be compensated for work (i.e., right to not be subject to slavery), and the right to have fair and safe employment.
Fairness: This approach focuses on the fair and equitable distribution of good and harm and/or the social benefits and social costs across the spectrum of society. The goal of this approach is to treat everyone equally; if there is unequal treatment it must have a just cause (i.e., a “fair reason”). In a business context, a fairness approach might rely on first identifying any differences in treatment or outcomes across various stakeholders. Then, each difference is examined for its legitimacy. For example, paying employees at different salary levels would be “fair” if these differences were based on job performance and “unfair” if they were based on being “liked by the boss.”
Common good: This approach regards all individuals as part of a larger community that shares certain common conditions and institutions upon which our welfare depends. The goal of this approach is to ensure and enhance benefits of an action for the society as a whole. Unlike the utilitarian approach that weighs the net balance of goodness and harm for a group of individuals, the common good approach asks whether an action benefits or erodes a specific element of the common good for the entire society (e.g., public safety, a just legal system, healthy ecosystem, and so forth). Determining what is deemed in the “common good” can vary across countries because of different cultural or societal values. In a business context, a common good approach might rely on determining whether or not a business practice is in line with what is valued and accepted in the society (or country) within which the business operates.
Virtue: This approach focuses on individual character traits and requires us to ask whether a given action is reflective of the kind of person we are or want to be. In a business context, the virtue approach would involve asking oneself if a certain action reflects the kind of employee or leader one would like to be or asking whether or not the action is what a person with high levels of integrity, honesty, compassion, and so forth would do.
It is important to note that there is no one best theory or approach to take. They each have their strengths and weaknesses. Again, the purpose of examining a situation through multiple ethical approaches is to ensure that the facts you have collected are considered from a variety of perspectives. Doing so is the only way to ensure that you have fully investigated the ethical issues involved and that you understand the real choices at hand.
Step 2: Identify Primary Stakeholders
The second step in the ethical decision-making process is to understand who could be affected by your decision—that is, the various stakeholders impacted, which can include individuals, groups, and/or organizations. This is important for ethical decision-making because it allows you to take on the different perspectives of each stakeholder (“walk in their shoes” or “see it from their side”). Although a variety of stakeholders (often all stakeholders) are likely to be affected by a decision, it is generally more useful to focus on identifying the primary stakeholders who could be affected. Primary stakeholders are those parties that could be directly impacted by a decision. In the context of business, primary stakeholders will often be you, your boss, your customers, your colleagues, and your employees. After identifying the primary stakeholders, turn your attention to secondary stakeholders, those who could be indirectly affected by a decision. Finally, list the obligations you have to each group of stakeholders. Such obligations include job requirements, responsibilities to others, and others’ expectations of you.

Chapter 9 Ethics: Doing It Right—Social Responsibility and Ethical Decision-Making • 107
Step 3: Increase the Number of Alternative Courses of Action
The third step in the ethical decision-making process is to expand the solution set to three or more alternatives. As we noted earlier, ethical dilemmas are especially challenging because they often involve situations that present “right versus right” choices (rather than “right versus wrong”). In these situations, what typically happens is that we generate only two courses of action and, to make matters more difficult, these choices are frequently “either/or” in nature. A rule of thumb in ethical decision-making is that if your thought process revolves around only two options, you’re much less likely to make a good decision. Therefore, the primary purpose of this step is to think creatively and generate as many courses of actions as possible. When stuck on only two choices in an “either/or” scenario, a useful tactic is to focus on a course of action that lies in the middle—a compromise. This tactic often helps to spur ideas for other alternatives.
The final step of the ethical decision-making process involves determining and inspecting the consequences of each alternative course of action generated in Step 3. To begin this step, it is important to not only focus on the different options you’ve generated but also the various stakeholders that would be impacted and how they would be impacted by each option.
One pitfall to be avoided in this step is listing out all possible consequences without regard to their probability of occurrence. In other words, it’s more effective to focus on consequences that are reasonably likely to occur versus those of very low probability. In addition, it is important to consider both short-term and long-term consequences. Once reasonable consequences have been determined for each course of action, you can then examine each by considering factors such as fairness, feasibility, risks involved, costs/benefits, respecting or violating individuals’ rights, and so forth.
Once you’ve arrived at a choice and decided upon a course of action, there are several final “checks” or “tests” you might want to consider. These will help you determine if you’ve made a choice that you can “live with.”
• The “Wall Street Journal” test—How would I feel if my decision made front- page news in the Wall Street Journal?
• The “Parent” test—Would I be proud to tell my mother or father about my decision?
• The “Personal Gain” test—What have I gained in this situation? Did the chance for personal benefits get in the way of my thinking?
• The “Platinum Rule” test—Am I treating others the way they would like to be treated?
Putting It to the Test: Ethical Decision-Making Processes
Let’s return to our example of the assistant account executive at the advertising agency and examine how we can use the ethical decision-making process to examine the situation. Recall that a mid-level advertising executive pressures a new hire to “fudge” a routine financial report provided to its client, a brand manager of skin care products with a large pharmaceutical company. The executive suggests, “It’s just the way it’s done around here.” The new hire complies, and the numbers are massaged to misrepresent the agency’s spending of client funds.
Step 1: Investigate Ethical IssuesWhat exactly is the assistant account executive being asked to do? He is being asked to falsify a financial report and misrepresent the agency’s spending of client funds. Based on its client contract, the agency has a fiduciary responsibility to accurately report the use of client funds. Not doing so invites a lawsuit as well as considerable harm to its reputation that could result in the loss of other client relationships, which would erode profitability. Should this occur, those on the account team will not fare well.
Does the assistant account executive know all the facts he needs to know to make an informed decision? Yes and no. He should not need any additional information to know that falsifying a financial report is not a wise choice. However, understanding why the shortfall has occurred might enable him to see what other options are available to him besides the one

108 • Comprehensive Business Review Concepts and Cases with Capstone® Business Simulation
his account supervisor is suggesting. Did the agency go over budget on a location shoot because it rained or because necessary production costs were simply underestimated—circumstances that could be addressed with the brand manager? Did the financial discrepancy occur at a higher accounting level and the account supervisor had not yet resolved it? Were the funds embezzled?
Have the facts been reviewed with those who could offer good advice? No, so the assistant account executive still has the opportunity to ask more questions to his account supervisor, her boss, the managing account supervisor, the account director, or the director of human resources, as well as those on the creative side who could potentially explain production spending issues.
From a utilitarian perspective, is there a net benefit to falsifying the report? Possibly in the short term, the account supervisor’s happiness will be maximized but not that of any of the other stakeholders. In the long run, even her marginal utility would not be greater than for the others unless she can quickly resolve the discrepancy because her job would be at risk. The likelihood that the budget shortfall would go unnoticed for long is not high, and the costs of discovery far outweigh the benefits.
Would the action respect the rights of others? No, the assistant account executive is being asked to do something against his better judgment, which undermines his sense of free choice and self-esteem. The brand manager has the right to expect that the agency will honor its contractual agreement with his company by adequately fulfilling their fiduciary responsibilities. Is there a good reason to make an exception and falsify the report on just one occasion? The risks and costs of discovery are too high. Would the account supervisor be pleased if the production team on the creative side falsified the financial report submitted to her? No, probably not.
Does the action represent a fair distribution of benefits and harms? No, the action could potentially put the profitability of the entire agency at risk, and there is no justification for spending client funds without accountability.
Would the action ultimately safeguard the common good? No, it would undermine the expectation that business partners operate with trust and in good faith, which is at the very core of fair trade and commerce.
Would a virtuous person falsify a financial report? Would doing so in this instance be in accordance with the kind of person the assistant account executive aspires to be? No, the assistant account executive would be falsifying the report against his better judgment, and it would be an embarrassment to the agency should it come to light.
Step 2: Identify Primary Stakeholders Who are the primary stakeholders in this situation? The primary stakeholders are those directly affected by the course of action the account executive might take. These would include the assistant account executive himself, his boss, and the client. Other people affected include secondary stakeholders, such as the immediate members of the account team and senior management, as well as the agency’s partners or shareholders and all of the agency’s employees.
Step 3: Increase Alternative Courses of ActionDid the assistant account executive generate multiple options for action? It doesn’t appear so. The assistant account executive seems to have fallen prey to an “either/or” choice—either comply with the request to “fudge” the numbers or risk being viewed as “not a team player.” There are a number of alternative courses of action that could be taken. In fact, if the assistant account executive had gathered all the relevant information (as mentioned in Step 1 above), other actions might have been revealed. For example, he could have discussed the causes of running over budget, explored other ways to recoup the unbudgeted costs, explained the overrun to the client and explored ways to defray the costs, and so forth.

Chapter 9 Ethics: Doing It Right—Social Responsibility and Ethical Decision-Making • 109
Step 4: Inspect the Consequences of the AlternativesWere the reasonable consequences of the possible actions explored? No. Even for the “either/or” options, the assistant account executive does not seem to have explored possible consequences. For example, in the short term, the account supervisor will not have to account for some misappropriation of client funds that occurred before the assistant account executive joined the agency and that may allow time to remedy the situation. If the numbers are falsified, the assistant account executive will prove he is a “team player” and will initially secure his job. The brand manager will be unaware that there is a budget shortfall because he has not been apprised of the prior excessive spending. In addition, the assistant account executive did not perform any final “checks” on the chosen action, which could have further informed the choice—for instance, asking questions such as “What have I gained from fudging the numbers?” “What did the client lose?” and “Am I treating the client the way they would like to be treated?”
110 • Comprehensive Business Review Concepts and Cases with Capstone® Business Simulation
Chapter Review Questions
5. What makes a problem or situation an ethical issue?
6. How are business ethics and social responsibility related?
7. What is the triple bottom line?
8. What are the four steps in the ethical decision-making process?
9. What are some examples of ethical breaches common to business?
10. What is the primary focus of each of the five approaches to (theories of) business ethics?
11. What is the difference between primary and secondary stakeholders?
12. When faced with an ethical issue, what are some ways we can increase the number of alternative courses of action?
13. What are some “tests” we can consider to weigh the consequences of our actions?
For more information, check out the additional video links below.
Human Resource: http://capsim.com/go/v/hr
TQM: http://capsim.com/go/v/tqm

Chapter 10 Selling Your Company and Making Brilliant Business Presentations • 111
Chapter 10Selling Your Company and Making Brilliant Business PresentationsLEARNING GOALS
After reading this chapter you will be able to:
• Describe the key elements of an effective presentation.
• Discuss how the rule of three helps to frame a presentation.
• Describe how to make a presentation more memorable and understandable.
• Apply the four steps to effectively practice a presentation.
• Discuss why valuation is important to business.
• Compare and contrast tangible and intangible assets.
• Define and describe the meaning and importance of EBIT for valuing a company.
Communication and Valuation: Two Final Skills
In the introduction, we learned that business is ideas and people and money configured and reconfigured in infinitely different ways to satisfy customers’ needs and make a profit.
We have considered managerial skills, decision-making, and financial skills and have worked on the coordination and alignment of resources and the selection of tactics to achieve a goal.
We have also discussed important stakeholders, both internal and external to a business, and looked at how businesses operate in the broader economic and social environment.
When it is time to present your outcomes to peers inside and outside the enterprise, there are two more issues we need to cover. First, we need to discuss one of the most critical management skills you will need to develop—delivering strong presentations. A company’s results may come down to numbers, but numbers don’t tell the whole story and a strong, well-prepared presentation is your opportunity to provide context.
Second, we will look at how to put a value on a company when it is time to sell. Different stakeholders, inside and outside of a company, have different perspectives on the value represented by that company. Its ultimate valuation, therefore, is also more than a simple number like the book value of the company’s assets. You may be surprised to learn that good communication can also play a role in a company’s valuation and in the sale process.
FIT for a Great Presentation
Part of the process of valuing a company often involves making presentations to employees, customers, suppliers, bankers, and the business community in general. Commonly, we refer to this process as a roadshow. However, it is not only when it’s time to value and perhaps even sell a company that strong, persuasive presentations are critical. Whether you are trying to secure a contract with a major new customer, to convince your colleagues of a new approach or idea, or to present your annual

112 • Comprehensive Business Review Concepts and Cases with Capstone® Business Simulation
results to shareholders, an understanding of the basics of good business communication is vital.
To complete your business simulation experience with Capstone, you may be asked to prepare either a:
Shareholder presentation: To convince your shareholders of your excellent stewardship of their company, or a
Capital market presentation: To sell your company to investors who can capture and leverage additional opportunities for the company or to your competitors who have identified additional synergies with their own companies.
You have spent several simulated years getting your company to this point, and whether you are happy with your results or feel there is more work to do, you should have plenty to say about what you tried to achieve.
The presentation is like a playoff final for a sports team. And just as a sports team must be game or match “fit,” as a business person you need to get FIT for your presentation. Doing so requires you to follow three essential steps:
1. Frame the message
2. Illustrate your points
3. Train for your delivery
Presentation skills are not just nice to have in business. With so many ideas and so much information competing for attention via so many communication technologies, the ability to make a persuasive personal presentation is an essential management skill—particularly in leadership roles.
You do not, however, have to be a polished performer or a born showman to deliver an excellent presentation. With careful thought and preparation, anyone can deliver a convincing presentation. Presenting is a behavior, after all, and all behavior can be learned and improved with practice.
According to Chris Anderson, a curator for TED Talks:
“I’m convinced that giving a good talk is highly coachable. In a matter of hours, a speaker’s content and delivery can be transformed from muddled to mesmerizing.”
It does not require an expert coach to make that transformation—just some careful attention to the basics. Now let’s take a closer look at each component in the FIT model.
Frame the Message: The Rule of Three and Being Concise
Steve Jobs, Apple’s late CEO, was renowned for turning product launches into major news events with perfectly rehearsed and carefully pitched multimedia presentations. Jobs spent hours, and sometimes days and weeks, working on his script, choreographing the content and the visuals and honing his message to its most essential elements.
Most of Jobs’s presentations were divided into three parts, because the “rule of three” is a basic principle of successful communication. In her book The Presentation Genius of Steve Jobs, Carmine Gallo of Business Week reports:
“The number three is a powerful concept in writing. Playwrights know that three is more dramatic than two; comedians know that three is funnier than four; and Steve Jobs knew that three is more memorable than six or eight. Even if he had 20 points to make, Jobs knew that the audience was only capable of holding three or four of them in short term memory. Better that they remember three than forget everything.”

Chapter 10 Selling Your Company and Making Brilliant Business Presentations • 113
So the idea here is to frame your presentation in three key parts. For example, the framework might be:
• Problem, Solution, and Call to Action for a sales presentation.
• Overview (key points you are going to make), Exposition (illustrating the key points), and Summary (repeating key points again) for an educational presentation.
• Achievements (major achievements for the period), Challenges (problems management is facing), and Goals for the future for a presentation to shareholders.
Once you have a broad three-point framework, distill the key points you want to make to one short sentence each. Use the notion of an “elevator speech”—you need to be able to make your pitch in the time it would take for a short elevator ride. Alternatively, you could think of it as being able to distill your points into the 140 characters of a tweet.
“Steve Jobs created a single-sentence description for every product,” Gallo says. “These headlines helped the audience categorize the new product and were always concise enough to fit in a 140-character Twitter post. For example, when Jobs introduced the MacBook Air in January 2008, he said that it is simply ‘The world’s thinnest notebook.’ That one short sentence spoke volumes.”
Making your key points concise and precise takes effort—perhaps even more time than writing out your entire presentation. As Blaise Pascal famously told a correspondent, “The present letter is a very long one, simply because I had no leisure to make it shorter.”
Illustrate It: Making a Comprehensible and Memorable Presentation
There are three ways to enhance your presentation’s message by making it easier to understand and remember, and a presentation must be both understandable and memorable in order to be convincing enough to influence others.
Tell stories and contextualize: Data or numbers do not communicate well in a presentation, but word pictures do. People love stories. Stories stick in the mind. Your key points literally become “sticky” because they are attached to a story that has an emotional impact on the audience. This doesn’t mean that stories are a replacement for data or evidence of your company’s value, but simply that without a good story people are unlikely to be energized by the case you’re trying to make.
The same is true if you are using visual aids for your presentation, such as presentation slides. Slides with lots of information distract the audience from the speaker and the points being made. Simple visuals that add meaning to your key points are all you need. When Steve Jobs launched “the world’s thinnest notebook,” for example, he used a photo of the computer slipping into a manila office envelope. No need for the technical specifications of the product or comparisons with other products—no need for additional information at all.
As Walt Disney said:
“Of all our inventions for mass communication, pictures still speak the most universally understood language.”
When you do need to present data or numbers, it’s crucial to recognize that context matters—numbers by themselves rarely communicate. Therefore, try to give your audience some kind of analogy or context for the numbers you are presenting.

114 • Comprehensive Business Review Concepts and Cases with Capstone® Business Simulation
For example, in news reports, you often hear or read analogies such as “the line of people was as long as five football fields” or “the flood covered an area the size of Manhattan” or “the loss was equal to the GDP of Fiji.” Journalists are taught to put numbers into context so people can grasp them. This is a valuable tactic for effective communication of technical details, research results, and numerical information.In the context of your Capstone simulation for example, a profit of $7 million may be an exceptional result if the competition is very tough. In a simulation where most of the companies failed to make a profit, however, a profit of $30 million to the winning company might be less impressive. Whatever the number—good or bad—try to give it context.
Remember WIIFM: Before you write your presentation, put yourself in the shoes of a typical member of your audience. You are sitting out there, listening to someone talk, and your major concern is: What’s In It For Me? (WIIFM). You wouldn’t be in the audience unless you were expecting to benefit from the presentation. And, if you are in the audience under duress (“My boss made me come”), the speaker will have to work even harder to convince you of what’s in it for you! Focus on benefits, tell success stories, and build a clear picture of why your key points are important using images and anecdotes. Try to make your message personal and relevant to your audience.
…And KIS: In all the elements of your presentation—structure, language, stories, and visual aids—the most important rule overall is to Keep It Simple.
If you have complex research data or technical information to present, consider distributing it as a handout. If your presentation can convince the audience of the importance of your information, they will eagerly seek out the background material later. (A note on handouts: If you provide your audience with material in advance of your talk, they will read it instead of focusing on your presentation. Time your distribution of handouts carefully.)
Train for Delivery: Perfect Practice Makes Perfect Performance
If a seasoned professional such as Steve Jobs put months into the preparation of his presentations, the rest of us should at least put a little effort into training for ours! Practice is the secret to every successful presentation.
How to best practice for an upcoming presentation? A few tips include:
Write it: Write out your presentation in full and, if you have time, memorize it. If not, distill the key points to cards and use them to keep you on track.
Read it: Read your draft out loud several times to ensure the words flow; then practice in front of an audience of colleagues, friends, family—anyone who can give you honest feedback.
Time it: It is important to know how long you will be speaking to ensure your message will fit into the surrounding agenda. Audiences—not to mention program organizers—loathe presenters who go on and on.
Repeat it: The science of learning talks about the concept of overlearning, which refers to practicing beyond mastery (i.e., practicing your presentation until you are effective and then practicing a few more times). The benefit here is that your presentation can become automatic.
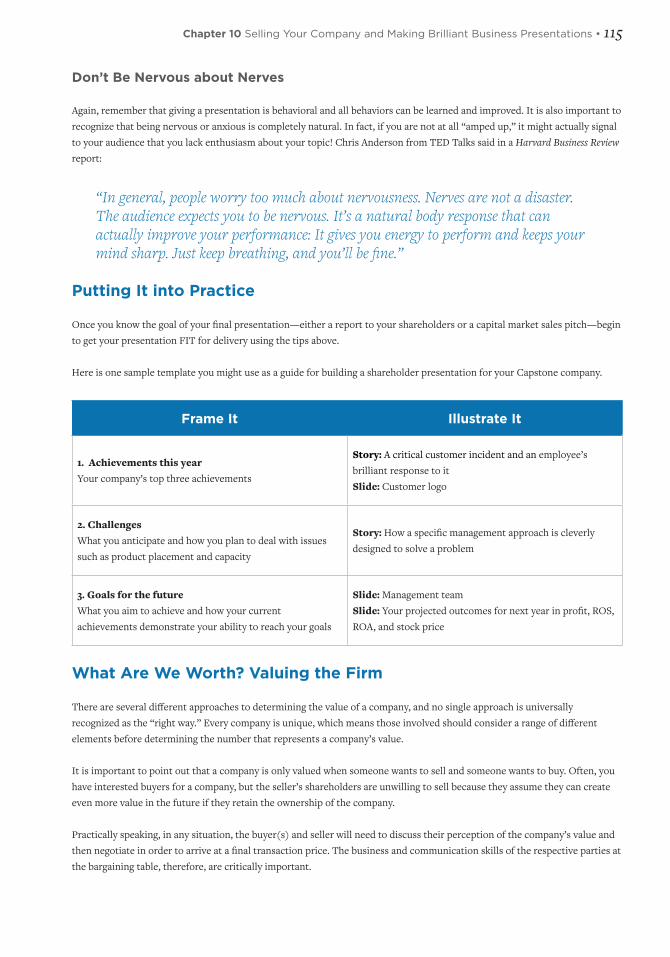
Chapter 10 Selling Your Company and Making Brilliant Business Presentations • 115
Don’t Be Nervous about Nerves
Again, remember that giving a presentation is behavioral and all behaviors can be learned and improved. It is also important to recognize that being nervous or anxious is completely natural. In fact, if you are not at all “amped up,” it might actually signal to your audience that you lack enthusiasm about your topic! Chris Anderson from TED Talks said in a Harvard Business Review report:
“In general, people worry too much about nervousness. Nerves are not a disaster. The audience expects you to be nervous. It’s a natural body response that can actually improve your performance: It gives you energy to perform and keeps your mind sharp. Just keep breathing, and you’ll be fine.”
Putting It into Practice
Once you know the goal of your final presentation—either a report to your shareholders or a capital market sales pitch—begin to get your presentation FIT for delivery using the tips above.
Here is one sample template you might use as a guide for building a shareholder presentation for your Capstone company.
Frame It Illustrate It
1. Achievements this yearYour company’s top three achievements
Story: A critical customer incident and an employee’s brilliant response to itSlide: Customer logo
2. ChallengesWhat you anticipate and how you plan to deal with issues such as product placement and capacity
Story: How a specific management approach is cleverly designed to solve a problem
3. Goals for the futureWhat you aim to achieve and how your current achievements demonstrate your ability to reach your goals
Slide: Management teamSlide: Your projected outcomes for next year in profit, ROS, ROA, and stock price
What Are We Worth? Valuing the Firm
There are several different approaches to determining the value of a company, and no single approach is universally recognized as the “right way.” Every company is unique, which means those involved should consider a range of different elements before determining the number that represents a company’s value.
It is important to point out that a company is only valued when someone wants to sell and someone wants to buy. Often, you have interested buyers for a company, but the seller’s shareholders are unwilling to sell because they assume they can create even more value in the future if they retain the ownership of the company.
Practically speaking, in any situation, the buyer(s) and seller will need to discuss their perception of the company’s value and then negotiate in order to arrive at a final transaction price. The business and communication skills of the respective parties at the bargaining table, therefore, are critically important.
116 • Comprehensive Business Review Concepts and Cases with Capstone® Business Simulation
The most straightforward part of the valuation is “book value,” which, as we discussed in Chapter 5, is the value of the company’s assets on the balance sheet. Book value is calculated as owners’ equity divided by the number of shares outstanding. These are the company’s tangible assets.
However, what about the strong brand the company has created? The customer loyalty it has built? The efficient and well-trained workforce? Its intellectual property? These are all integral to the company’s success, but they are not assets on the balance sheet and are referred to as “intangible assets.” The amount paid by the acquiring company over book value is referred to as “goodwill.”
As mentioned, there are several ways to value a firm. A publicly traded company such as your Capstone company has a market value called “market capitalization,” which is calculated as stock price multiplied by the number of shares outstanding. As we also know, the transaction value of the company—what the buyer pays for it—may be greater than or less than the capital market value. We know there is a price paid for intangible assets or goodwill, but value can be influenced by other pressures as well, including speculation on internal or external challenges, expectations for future growth, or media buzz that stimulates interest and excitement (or the opposite) for a company.
Common valuation approaches include calculations of Economic Value Added (EVA), Discounted Cash Flow (DCF), Free Cash Flow, and the very simple Public Market Value, which looks at what other, similar companies are being sold for in the current market environment.
One of the most often used calculations for valuation, however, involves Earnings Before Interest and Taxes, or EBIT. We will expand on this concept because it will be useful if you are developing a capital market presentation for your Capstone company.
EBIT estimates the current operational profitability of the company for the current period. In this way, EBIT reflects all of a company’s profits before taking into account interest payments and income taxes. Analysts take this profitability measure and multiply it by a certain value to estimate the company’s total value. Clearly, the big question is what value should be used as a multiplier?
For companies being purchased for their absolute value, the multiplier will be lower than for a company being purchased because it is a “strategic fit” with the organization making the purchase. For example, if your Capstone company was being purchased by an organization that had no presence in electronics production and saw your company as a good generator of cash, they might only pay a multiple between 4 and 8. However, if the purchaser saw your company as an excellent fit with their current sensor/electronics portfolio, they might pay anywhere between 10 and 12 times your EBIT. For example, a possible multiplier for the Andrews company shown in the table below can be estimated by dividing the market value (market capitalization) by the EBIT. This results in a multiplier of 10 ($360 million / $36 million = 10).
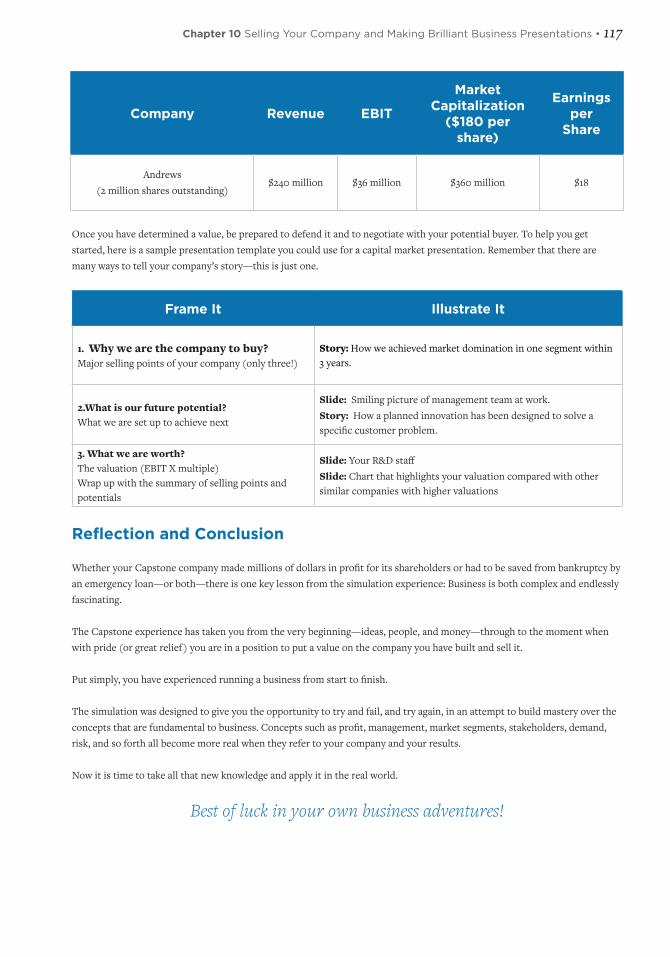
Chapter 10 Selling Your Company and Making Brilliant Business Presentations • 117
Company Revenue EBIT
Market Capitalization
($180 per share)
Earnings per
Share
Andrews(2 million shares outstanding)
$240 million $36 million $360 million $18
Once you have determined a value, be prepared to defend it and to negotiate with your potential buyer. To help you get started, here is a sample presentation template you could use for a capital market presentation. Remember that there are many ways to tell your company’s story—this is just one.
Frame It Illustrate It
1. Why we are the company to buy?Major selling points of your company (only three!)
Story: How we achieved market domination in one segment within 3 years.
2.What is our future potential?What we are set up to achieve next
Slide: Smiling picture of management team at work.Story: How a planned innovation has been designed to solve a specific customer problem.
3. What we are worth?The valuation (EBIT X multiple)Wrap up with the summary of selling points and potentials
Slide: Your R&D staffSlide: Chart that highlights your valuation compared with other similar companies with higher valuations
Reflection and Conclusion
Whether your Capstone company made millions of dollars in profit for its shareholders or had to be saved from bankruptcy by an emergency loan—or both—there is one key lesson from the simulation experience: Business is both complex and endlessly fascinating.
The Capstone experience has taken you from the very beginning—ideas, people, and money—through to the moment when with pride (or great relief) you are in a position to put a value on the company you have built and sell it.
Put simply, you have experienced running a business from start to finish.
The simulation was designed to give you the opportunity to try and fail, and try again, in an attempt to build mastery over the concepts that are fundamental to business. Concepts such as profit, management, market segments, stakeholders, demand, risk, and so forth all become more real when they refer to your company and your results.
Now it is time to take all that new knowledge and apply it in the real world.
Best of luck in your own business adventures!

118 • Comprehensive Business Review Concepts and Cases with Capstone® Business Simulation
Chapter Review Questions
Presentation Basics
1. What does it mean to be “FIT” for a presentation?
2. How does the rule of three apply to presentations? Provide an example.
3. What are some ways to make a presentation memorable and understandable?
4. How can we improve an audience’s understanding of numerical information?
5. What are the four steps of effective presentation practice?
Valuation
6. Why is valuation important to business?
7. What is the difference between tangible and intangible assets?
8. What is “goodwill”?
9. What is EBIT? How does it affect valuation?

Index • 119
IndexAaccounting, 1, 5, 9, 27, 30–34, 36, 40, 53, 104 financial, 10, 27, 31accounting equation, 22, 27–28, 30accounting rules, 27, 32–33, 42accounts, 31, 33–38, 41–42, 45–46, 52, 56–57, 107–8 business expense, 99 company’s, 35 liability, 47Accounts Payable, 34–36, 46Accounts Receivable, 34–36account supervisor, 102, 107–8activities investing, 33–34, 41, 52 operating, 28, 31, 33–35, 41, 52agency, 102, 106–8American clothing company Eddie Bauer, 26A/P, 35–36A/P Lag, 36–37Apple, 111A/R, 35–36assets, 12, 27–28, 30, 32–33, 42–48, 50–55, 78, 115assets and liabilities, 27, 33–34, 42, 45, 57asset turnover, 55Audi, 88automation, increasing, 26–27, 29
BBalanced Scorecard, 67–68balance sheet, 10, 27, 31, 42, 44–48, 52–55, 57, 115 company’s, 45behaviors, 13, 18, 98–99, 111, 114Bentley, 88bond a, 49–50bond issue, 48–49bonds, 35, 42–45, 48–51, 57brand manager, 102, 106–8budget, 10, 27–28, 107business, 1–2, 4–11, 13–19, 22–29, 31–40, 42, 44–48, 51–54, 56, 66–68, 98–103, 105–6, 109–11, 114, 116–17business activities, 33 regular, 38business acumen, 2
business cards, 25business context, 23, 99, 105–6business decisions, 9 long-term, 35businesses focus, 18, 54business ethics, 98–99, 102, 109business functions, 5–6, 8, 103–4business goals, 23business management skills, 3business managers, 36business operations, 35, 53business people, successful, 2business performance, 62business resources, 9business simulation experience, 20, 111business stakeholders, 6, 98business strategy, 51, 63, 66business success, 1, 4, 100business unit, 67, 101buyers, 7–8, 13, 43, 50, 52, 68, 114–15
Ccapabilities, 2, 18–19, 62–63, 85Capstone, 1–2, 7, 27, 34, 43, 47, 68, 111Capstone Business Simulation, 1, 5, 23, 28, 32, 113Capstone company, 29, 37, 43, 51, 55, 67, 114–16carrying costs, 24, 37, 39cash, 9, 17, 22, 24, 28, 31–37, 39–46, 51–53, 55, 68, 115 categories of, 31, 33–35, 52 equal, 31 influence, 35cash account, 47–48cash flow, 27, 33–36, 40–41, 43, 52–53, 55 company’s, 31cash flow statement, 10, 27, 31–35, 41–42, 52–53cash payments, 35–36, 51cash position, change in, 34, 52–53CEO (Chief Executive Officer), 62, 101Chief Executive Officer. See CEOchoices, strategic, 62client, 102, 106–8client funds, 102, 106, 108COGS. See Cost of Goods Soldcommunity, 5, 98–100, 102, 105company, 1–2, 5–6, 8–10, 12–13, 17–25, 27–28, 31–33, 35–40, 42–57, 59–60,
62–66, 78–80, 99–101, 110–11, 113–16 insurance, 49 outsourced, 64 profitable, 53 successful, 26 traded, 115 winning, 113company activities, 12company money, 42company’s assets, 27, 45, 47, 50, 55, 110, 115company’s decisions, 2, 9competition, 7, 31, 78, 113competitive advantage, 25, 58, 63–64, 88competitors, 5, 12–14, 16, 18, 20, 31, 37, 53, 62, 68, 78–80, 111consequences, 8, 99, 101–2, 105–6, 108–9Consumer Products Safety Council (CPSC), 25context, 110, 112–13contribution margin, 22, 28–30, 38–41, 68corporation, 27, 46, 50–51, 68, 101cost analysis, 10, 28, 30cost leadership, 88, 92Cost of Goods Sold (COGS), 36–39costs, 4, 9, 15–17, 19, 22–25, 28–29, 31, 33, 35–39, 42, 91, 105, 107 economic, 9, 11 historical, 32, 40 material, 38–39, 68credit, 35–36, 39, 41, 46customer accessibility, 68customer demand, 25customer demands, changing, 6, 19customer loyalty, 78, 115customer perspective, 13, 67customers, 1, 4–7, 9–10, 12–20, 22, 25, 27, 31, 35–36, 38, 40, 46, 67–68, 78–80, 110 potential, 12–13, 20, 63
DDCF (Discounted Cash Flow), 115debt, 40, 44–47debt contracts, 46, 48–49decisions, 6, 8–9, 13–14, 16, 18, 20, 22, 28, 32, 34, 36, 42–43, 56–57, 98–99, 101–6 effective, 10, 27 final, 16

120 • Comprehensive Business Review Concepts and Cases with Capstone® Business Simulation
informed, 15, 107 investment, 42 major, 99degree, 25–26, 44, 78delivery, 25, 36, 38, 111, 113–14depreciation, 32–34, 38–39, 41, 46, 52differences, 4, 11, 28, 30–31, 34, 38–39, 41–42, 45, 57, 105, 109, 117differentiation, 92Discounted Cash Flow (DCF), 115discounts, 36, 38, 42–43dividends, 42–43, 45, 50–52, 54, 56–57
Eearnings, 38, 40, 50, 55, 115–16Earnings Before Interest and Taxes. See EBITEBIT (Earnings Before Interest and Taxes), 38, 40, 110, 115–17Economic Value Added (EVA), 115economies, 7, 22, 24–25, 29efficiency, 4, 6, 8, 25–26, 54employees, 4, 6–7, 15, 19–20, 23, 26, 60, 98–99, 105–6, 110, 114enterprise, 1, 110 private, 7 successful, 1 sustainable, 1enterprises, public, 7EPS, 55equipment, 5, 19, 23, 26–27, 33–34, 36, 38–39, 45–46, 52, 54, 79 manufacturing, 23 new, 44 robotic, 26equity, 27–28, 45–47, 52, 54 owner’s, 45 return on, 54equity account, 47equity portion, 46ethical consciousness, 102ethical decision, 98–99, 101–6, 109ethical dilemmas, 102–3, 106ethical issues, 98–99, 102–3, 105, 109Ethical practice, 99ethical principles, 98 basic, 102ethical reasoning, 98ethics, 98, 101, 104 testing, 104EVA (Economic Value Added), 115executives, 8, 101 chief, 6, 99
corporate, 101 senior, 85, 104expenses, 38, 40, 45, 48experience, 1, 5–7, 13, 32, 47, 90, 99, 102
Ffactors, 26, 35–37, 63, 78, 106FASB, 33financial reports, 9, 27, 32, 53, 106–7financial statements, 31, 34, 40, 45, 52–53financing activities, 33–34, 41, 43–44, 52fit, 26, 102, 110–13, 117fixed costs, 24, 28–29, 38–39, 78forces, 47–48, 79–80, 104forces of competition, 78Ford Motor Company, 26forecasts, 1, 10, 12, 24, 28framework, 6, 14, 112 three-point, 112funds, 5, 39, 42–44, 46–48, 50–52, 54, 107
GGAAP accounting, 32GAAP rules, 33GDP, 113goals, 2, 4, 6, 8–10, 12, 16, 18, 26, 28, 35, 60, 68, 105, 110, 114goods, 6–7, 13, 22–24, 35, 37–39 company’s, 33 creating, 23 finished, 36 offering, 22 procuring, 23 sold, 37goods and services, 5, 7, 22, 24–26, 28, 38 exchange of, 6, 8 quantity of, 6goods sold, cost of, 37–39governments, 6–7, 38, 40, 44, 98Gross Margin, 36, 38–39Gross Profit, 38
HHong Kong Stock Exchanges, 51human resources, 23–24, 39, 64, 104, 107, 109Hyundai, 17
Iincome statement, 10, 27, 31–32, 34, 38–39, 41–42, 45, 48, 53
company’s, 31, 40individuals, 6, 44, 101, 105industry, 8, 24, 26, 47, 54, 66, 68, 78–80information, available, 14–15intangible assets, 110, 115, 117interest payments, 31, 36, 39, 48, 52interest rates, 43, 47–50, 57Internal Business Processes, 67inventory, 24, 33–37, 39, 43, 45–46, 52, 54inventory control, 22, 24inventory levels, 34, 37inventory management, 37inventory turnover days, company’s, 37investment bank, 49investments, 5, 7, 19, 24, 34, 39, 43–44, 46, 49–50, 53, 57investors, 27, 46, 48–51, 111IPO, 51ISO, 25
JJIT, 24jobs, 7, 9–10, 25–26, 102, 107–8, 111–12
KKaplan, Robert, 67KIA, 17
Llabor, 22, 26, 28, 33, 38–39Lamborghini, 88land, 8–9, 34, 45–46liabilities, 27–28, 33–34, 42, 45–47, 57loans, 27, 31–32, 34, 36, 42–49, 51–52, 57Long-Term Liabilities, 45–46Lower costs, 23, 88Lower Material Costs, 29
Mmanagement, 1, 4, 6, 10, 23, 42, 46, 50, 80, 116 constant, 46 efficient, 5–6 good, 1, 5 sound, 101 supply chain, 22, 25management approach, 114management challenges, 6management skills, 2 critical, 43, 110management team, 114, 116managerial accounting, 4, 10–11, 27, 31managers, 6, 9–10, 12, 14, 18–20, 26–28,
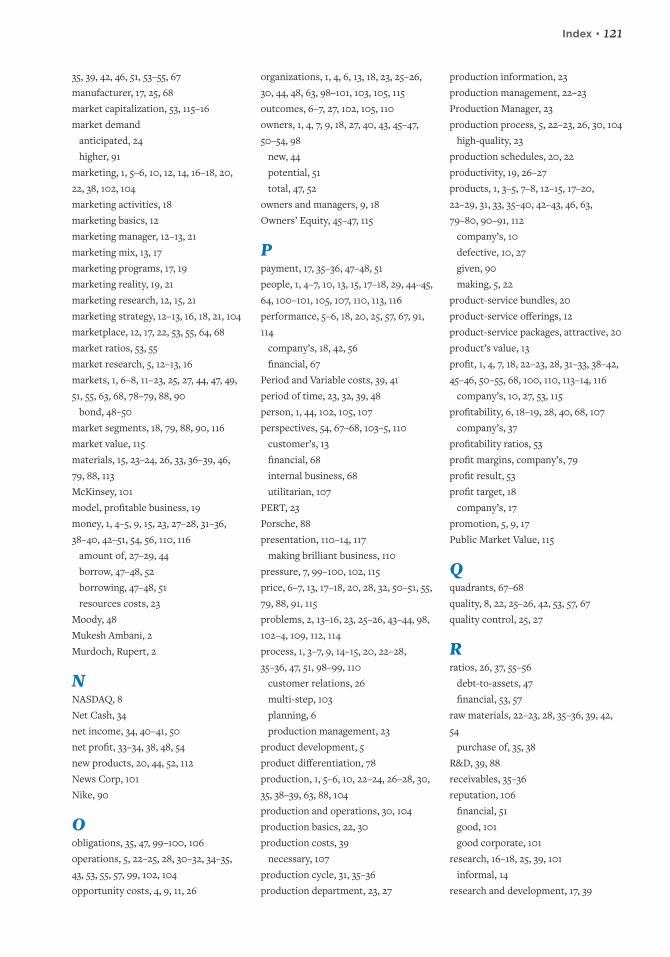
Index • 121
35, 39, 42, 46, 51, 53–55, 67manufacturer, 17, 25, 68market capitalization, 53, 115–16market demand anticipated, 24 higher, 91marketing, 1, 5–6, 10, 12, 14, 16–18, 20, 22, 38, 102, 104marketing activities, 18marketing basics, 12marketing manager, 12–13, 21marketing mix, 13, 17marketing programs, 17, 19marketing reality, 19, 21marketing research, 12, 15, 21marketing strategy, 12–13, 16, 18, 21, 104marketplace, 12, 17, 22, 53, 55, 64, 68market ratios, 53, 55market research, 5, 12–13, 16markets, 1, 6–8, 11–23, 25, 27, 44, 47, 49, 51, 55, 63, 68, 78–79, 88, 90 bond, 48–50market segments, 18, 79, 88, 90, 116market value, 115materials, 15, 23–24, 26, 33, 36–39, 46, 79, 88, 113McKinsey, 101model, profitable business, 19money, 1, 4–5, 9, 15, 23, 27–28, 31–36, 38–40, 42–51, 54, 56, 110, 116 amount of, 27–29, 44 borrow, 47–48, 52 borrowing, 47–48, 51 resources costs, 23Moody, 48Mukesh Ambani, 2Murdoch, Rupert, 2
NNASDAQ, 8Net Cash, 34net income, 34, 40–41, 50net profit, 33–34, 38, 48, 54new products, 20, 44, 52, 112News Corp, 101Nike, 90
Oobligations, 35, 47, 99–100, 106operations, 5, 22–25, 28, 30–32, 34–35, 43, 53, 55, 57, 99, 102, 104opportunity costs, 4, 9, 11, 26
organizations, 1, 4, 6, 13, 18, 23, 25–26, 30, 44, 48, 63, 98–101, 103, 105, 115outcomes, 6–7, 27, 102, 105, 110owners, 1, 4, 7, 9, 18, 27, 40, 43, 45–47, 50–54, 98 new, 44 potential, 51 total, 47, 52owners and managers, 9, 18Owners’ Equity, 45–47, 115
Ppayment, 17, 35–36, 47–48, 51people, 1, 4–7, 10, 13, 15, 17–18, 29, 44–45, 64, 100–101, 105, 107, 110, 113, 116performance, 5–6, 18, 20, 25, 57, 67, 91, 114 company’s, 18, 42, 56 financial, 67Period and Variable costs, 39, 41period of time, 23, 32, 39, 48person, 1, 44, 102, 105, 107perspectives, 54, 67–68, 103–5, 110 customer’s, 13 financial, 68 internal business, 68 utilitarian, 107PERT, 23Porsche, 88presentation, 110–14, 117 making brilliant business, 110pressure, 7, 99–100, 102, 115price, 6–7, 13, 17–18, 20, 28, 32, 50–51, 55, 79, 88, 91, 115problems, 2, 13–16, 23, 25–26, 43–44, 98, 102–4, 109, 112, 114process, 1, 3–7, 9, 14–15, 20, 22–28, 35–36, 47, 51, 98–99, 110 customer relations, 26 multi-step, 103 planning, 6 production management, 23product development, 5product differentiation, 78production, 1, 5–6, 10, 22–24, 26–28, 30, 35, 38–39, 63, 88, 104production and operations, 30, 104production basics, 22, 30production costs, 39 necessary, 107production cycle, 31, 35–36production department, 23, 27
production information, 23production management, 22–23Production Manager, 23production process, 5, 22–23, 26, 30, 104 high-quality, 23production schedules, 20, 22productivity, 19, 26–27products, 1, 3–5, 7–8, 12–15, 17–20, 22–29, 31, 33, 35–40, 42–43, 46, 63, 79–80, 90–91, 112 company’s, 10 defective, 10, 27 given, 90 making, 5, 22product-service bundles, 20product-service offerings, 12product-service packages, attractive, 20product’s value, 13profit, 1, 4, 7, 18, 22–23, 28, 31–33, 38–42, 45–46, 50–55, 68, 100, 110, 113–14, 116 company’s, 10, 27, 53, 115profitability, 6, 18–19, 28, 40, 68, 107 company’s, 37profitability ratios, 53profit margins, company’s, 79profit result, 53profit target, 18 company’s, 17promotion, 5, 9, 17Public Market Value, 115
Qquadrants, 67–68quality, 8, 22, 25–26, 42, 53, 57, 67quality control, 25, 27
Rratios, 26, 37, 55–56 debt-to-assets, 47 financial, 53, 57raw materials, 22–23, 28, 35–36, 39, 42, 54 purchase of, 35, 38R&D, 39, 88receivables, 35–36reputation, 106 financial, 51 good, 101 good corporate, 101research, 16–18, 25, 39, 101 informal, 14research and development, 17, 39

122 • Comprehensive Business Review Concepts and Cases with Capstone® Business Simulation
resources, 1, 6–7, 16–19, 22–25, 63–64, 103, 110 allocating, 20 available, 60 basic, 1, 4 economic, 46 financial, 79 important, 5 limited, 13, 19 organization’s, 6 primary, 23, 30retained earnings, 35, 45–46, 48, 51, 54return on assets, 54Return on Sales. See ROSrevenue, 19, 33, 38–40, 43, 54, 116reward shareholders, 42, 44, 46, 48, 50, 52, 54risk, 4, 8, 11–12, 20, 42, 44, 47–48, 57, 106–7, 116rivalry, 78–79ROA, 54, 114ROE, 54Rolls-Royce, 17, 90ROS (Return on Sales), 54, 114
Ssales, 14–16, 23, 26, 28, 33–36, 38–40, 46, 53–55, 104 product’s, 35 return on, 54 volume of, 36, 38sales forecasts, 20, 27, 37SCM. See supply chain managementservice offerings, 19services, 1, 4–8, 12–15, 17–20, 22–26, 28, 33, 35, 38–39, 42–43, 46, 54, 63, 67, 79–80shareholders, 9, 43, 45, 50–51, 54, 107, 110–12, 114, 116shares, 18, 50–52, 55, 79, 98, 105, 115–16 company’s, 51shares of stock, 50–52simulation, 2–3, 7, 29, 32, 37–38, 43, 67, 113, 116situations, 50, 101–9, 114skills, 1–3, 20, 23, 63, 85social responsibility and ethical decision, 98society, 4, 6–7, 40, 98–102, 105Sony, 90specialization, 4, 8, 11stakeholder groups, main business, 11stakeholders, 4, 7, 9–10, 25, 27, 60,
98–99, 101, 105–7, 110, 116 external, 1, 4, 7, 10–11, 27, 31, 42 primary, 102, 105–7 secondary, 98, 106–7, 109standards, 25, 33, 98, 101stock, 8, 37, 43, 48–52, 55–57 common, 42, 45–46, 51, 54, 57 preferred, 42, 51, 57stock market, 50–51, 55–56stock price, 51–52, 55–56, 68, 114–15strategy, 14, 16, 37, 47, 56, 58, 60, 64, 66, 68, 90, 97suppliers, 7–8, 10, 15, 25, 27, 31, 36–37, 40, 42, 46, 78–79, 98, 110supply chain management (SCM), 22, 25, 30sustainability, 6, 12, 19Suzuki, 17SWOT analysis, 85
Ttactics, 16, 39, 60, 104, 106, 110, 113taxes, 37–38, 40, 98TED, 114TED Talks, 111Thiokol, 101Threat of new entrants, 78Threat of substitute products, 78time value, 37total assets, 46–47, 54Total Quality Management. See TQMTQM (Total Quality Management), 25–26, 30
Uuncertainty, 4, 8, 11, 15, 44uncertainty and risk, 8
Vvaluation, 110, 115–17value book, 52, 110, 115 company’s, 112, 114Value Chain, 80value propositions, 13, 17–18, 22, 68 unique customer, 79variable costs, 24, 28, 38–39, 41Volkswagen, 88, 90
WWall Street Journal, 106Wal-Mart, 8
Walt Disney, 112wealth, 12, 44, 50–51, 101 people’s, 46–47W. Edwards Deming, 26working capital, 31, 35–36, 41, 46, 68working capital cycle, 31, 35–36, 41

Case Stories Application in Capstone versus Real-World Application • 123
Part 2
Case Stories Application in Capstone versus Real-World Application

124 • Comprehensive Business Review Concepts and Cases with Capstone® Business Simulation
Capacity represents the space in a manufacturing plant that allows a company to produce units of their product(s). Adding capacity is equivalent to buying additional space in your facility, which brings long-term benefits but is also a costly investment. In Capstone, companies can run two different shifts over the course of the day. You can imagine one shift starting in the morning and another in the evening, which allows companies to produce two units of their product for each unit of capacity.
Each day, employees working the second shift receive 50% higher wages, which increases the company’s labor costs by 50%. However, companies have already paid for all period costs, or the overhead to keep your plant running, so any units produced during a second shift will receive a free ride on fixed expenses. After factoring in the upfront cost of purchasing capacity and the cost of running a second shift without the burden of period costs, it is generally most cost effective to run a second shift.
Why Is Purchasing Capacity More Expensive Than Running a Second Shift?
In the following article, supply and demand issues impacting the oil industry are discussed. One company, Pioneer Natural Resources, needed to adjust its well
design while drilling for oil, which substantially raised the company’s period costs. In this instance, the cost required to find a new well and purchase equipment to set up a new oil rig outweighed the $400,000 cost to change the well design. As the change in well design increased the drilling time by five days, it will likely employ a second shift of workers in order to keep up with the market demand.
Application in
Real-World Application

Case Stories Application in Capstone versus Real-World Application • 125
As part of the customer buying criteria, the reliability of each product is represented in hours. The higher a product’s reliability, the longer the product will last. The reliability of each product is directly correlated to the product’s material costs. The reliability rating for existing products can be adjusted to have a longer or shorter shelf life.
Specifically, each 1,000 hours of reliability adds $0.30 to the material cost. Positioning a product’s reliability outside of the range in the customer buying criteria will decrease demand. Each 1,000 hours of reliability that is above or below the primary segment’s range on the customer buying criteria will decrease demand for those customers by 10%.
In this article, the use of leather seats in vehicles is considered. As a durable material, leather has remained a staple for interior car design. Despite this, the article notes, “The problem with leather, for those whose budgets lean more toward non-premium beer than Champagne, is that it can add thousands of dollars to the sticker price.”
As the article discusses, leather is more durable and therefore an appealing feature in high-end vehicles. However, suppling premium materials that last comes at a price causing these features to be more prevalent in high-end brands. The lesson? Consider the customer you are trying to appeal to when determining your product’s reliability.
Real-World Application
What Impact Does Reliability Have on My Material Costs?
Application in
Customer Buying Criteria
Performance Segment
MTBF 22,000-27,000 43%
Ideal Position Pfmn 9.4; Size 16.0 29%
Price $25.00-$35.00 19%
Age 1 year 9%
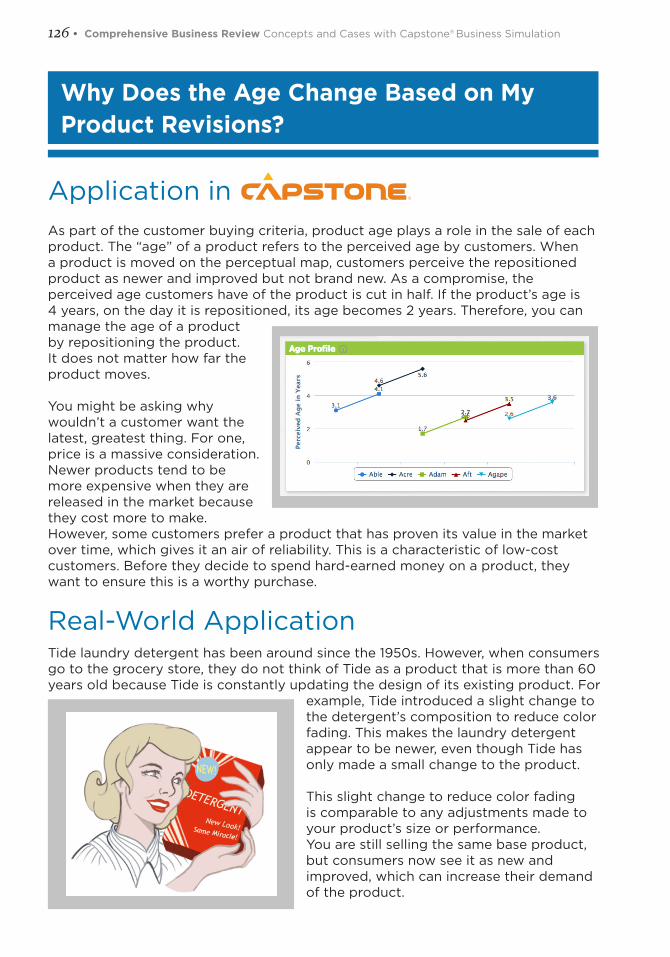
126 • Comprehensive Business Review Concepts and Cases with Capstone® Business Simulation
Real-World ApplicationTide laundry detergent has been around since the 1950s. However, when consumers go to the grocery store, they do not think of Tide as a product that is more than 60 years old because Tide is constantly updating the design of its existing product. For
example, Tide introduced a slight change to the detergent’s composition to reduce color fading. This makes the laundry detergent appear to be newer, even though Tide has only made a small change to the product.
This slight change to reduce color fading is comparable to any adjustments made to your product’s size or performance.You are still selling the same base product, but consumers now see it as new and improved, which can increase their demand of the product.
As part of the customer buying criteria, product age plays a role in the sale of each product. The “age” of a product refers to the perceived age by customers. When a product is moved on the perceptual map, customers perceive the repositioned product as newer and improved but not brand new. As a compromise, the perceived age customers have of the product is cut in half. If the product’s age is 4 years, on the day it is repositioned, its age becomes 2 years. Therefore, you can manage the age of a product by repositioning the product. It does not matter how far the product moves.
You might be asking why wouldn’t a customer want the latest, greatest thing. For one, price is a massive consideration. Newer products tend to be more expensive when they are released in the market because they cost more to make. However, some customers prefer a product that has proven its value in the market over time, which gives it an air of reliability. This is a characteristic of low-cost customers. Before they decide to spend hard-earned money on a product, they want to ensure this is a worthy purchase.
Why Does the Age Change Based on My Product Revisions?
Application in

Case Stories Application in Capstone versus Real-World Application • 127
What happens when a product generates high demand but does not have enough capacity to meet demand? Unfortunately for the company in question, this leads to a stock-out where the company runs out of inventory for the product. The company will lose sales that should have been its, but, even worse, customers hungry to buy the product will now turn to competitors’ products. Because companies produce on a monthly schedule, stock-outs can occur in any given month. If each company in the industry is short on supply during any month, a seller’s market emerges. In a seller’s market, total demand cannot be met, so sellers have the freedom to make different marketing decisions.
How can you be sure of a seller’s market? You can’t, unless you are certain that industry capacity, including a second shift, cannot meet demand for the
segment. In a seller’s market, there are a few things a company can do to reduce demand while remaining profitable: increasing prices and reducing marketing budgets. Companies can increase prices outside of the regular segment range because there is unmet demand regardless. No company can meet the needs of the entire segment, so anyone can raise prices to maximize profit on each unit sold. Additionally, they can reduce their spending on promotions and sales because customers will demand the products regardless.
In the following article, luxury fashion retailer Hermes is discussed. As Hermes handbags require specific high-grade leather, production is a timely process leading to a low supply. Marissa N. Stempien, the fashion editor of JustLuxe.com said, “The Birkin is an extraordinarily well-made bag. Each one is handmade by trained craftsmen and can take over 18 hours to make, and that number can be doubled if working on exceptional pieces such as those accessorized with diamonds.” When supply is low and demand high, prices skyrocket in response.
Like situations when you don’t have enough capacity to meet demand, Hermes is limited in the number of handbags they can produce. To offset the opportunity cost associated with this issue, Hermes handbags have a much higher retail value. This will drive down demand (to ensure they can supply enough) and drive up its profits.
How Can I Capitalize on Situations with Unmet Demand?
Application in
Real-World Application

128 • Comprehensive Business Review Concepts and Cases with Capstone® Business Simulation
Each production line’s capacity is listed as first shift capacity, which is the number of units, in thousands, that can be produced each year by running a single eight-hour shift. In Capstone, companies can run two different shifts over the course of the day. You can imagine one shift starting in the morning and another in the evening, which allows companies to produce two units of their product for each unit of capacity.
If companies need to increase production, they can choose to schedule a second shift. Second shift workers arrive at the end of the first shift and work a full eight-hour shift. Each day, employees working the second shift receive 50% higher wages, which increases the company’s labor costs by 50% and requires it to use more employees to cover the shift.
For employers, hiring and retaining employees that work beyond the standard nine-to-five job can be a difficult task. One way to offset this and make the second shift more appealing is through offering pay premiums.
According to SHRM.org, “Organizations with 24/7/365 operations face the challenge of recruiting and staffing employees to work beyond standard day shifts. An effective practice used by many US employers is using shift differentials—pay premiums to compensate employees for working shifts other than regular weekday hours.”
Shift differentials can also be referred to as shift premiums. As second shift hours are typically worked between 3 p.m. and 8 a.m., the shift premiums are used to attract employees to work these irregular hours.
Real-World Application
Why Does It Cost More per Unit to Add a Second Shift?
Application in

Case Stories Application in Capstone versus Real-World Application • 129
Long-term assets, such as plant capacity and automation, provide benefits to your company for years to come, but often not in the short term. In the simulation, changes to capacity and automation take 1 year to implement, so the benefits are not seen in the calendar year. As the benefit will increase each year, investments into long-term assets should be funded by something that can also be paid off over time, such as long-term debt and/or stock issues.
Long-term debt is issued as a 10-year note. Companies taking out a 10-year note are only required to pay off interest on a yearly basis until the full payment is due, 10 years later. Issuing stock allows you to raise capital by selling shares to the public. These shares are not required to be repurchased, but they can be through the stock retire option. As both options supply your company with cash and do not require that cash to be returned the following year (as you would see with current
debt), they are the ideal way to raise capital for an asset that will not give an immediate benefit.
In the real world, purchasing physical assets like plant capacity and automation (seen as PP&E on financial statements) are referred to as a capital expenditure (or CAPEX). As Investopedia explains, “If an expense is a capital expenditure, it needs to be capitalized. This requires the company to spread the cost of the expenditure (the fixed cost) over the useful life of the asset.”
Capital expenditures are closely evaluated by shareholders to ensure there is enough distributed cash flow. In the following Seeking Alpha article, the cash flow of Teva is discussed. As capital expenditures increased for the company, their free cash flow fell, causing them to cut dividends. If Teva had raised capital, rather than relying on cash from operating, they may have still been able to offer the dividend.
Real-World Application
Why Is It Best to Fund Major Investments with Long-Term Financing?
Application in
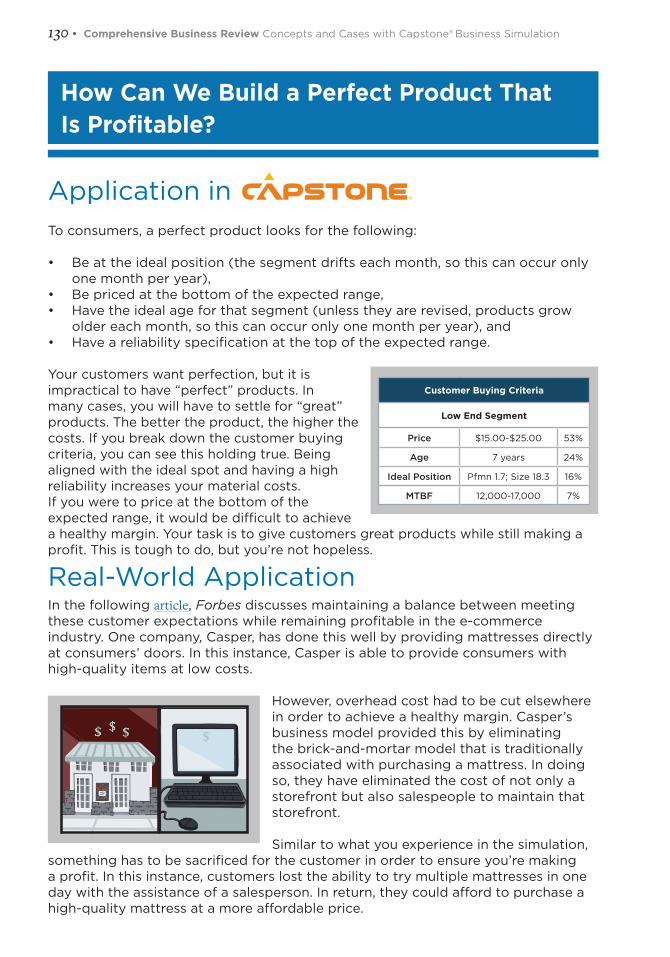
130 • Comprehensive Business Review Concepts and Cases with Capstone® Business Simulation
To consumers, a perfect product looks for the following:
• Be at the ideal position (the segment drifts each month, so this can occur only one month per year),
• Be priced at the bottom of the expected range,• Have the ideal age for that segment (unless they are revised, products grow
older each month, so this can occur only one month per year), and• Have a reliability specification at the top of the expected range.
Your customers want perfection, but it is impractical to have “perfect” products. In many cases, you will have to settle for “great” products. The better the product, the higher the costs. If you break down the customer buying criteria, you can see this holding true. Being aligned with the ideal spot and having a high reliability increases your material costs.If you were to price at the bottom of the expected range, it would be difficult to achieve a healthy margin. Your task is to give customers great products while still making a profit. This is tough to do, but you’re not hopeless.
Real-World ApplicationIn the following article, Forbes discusses maintaining a balance between meeting these customer expectations while remaining profitable in the e-commerce industry. One company, Casper, has done this well by providing mattresses directly at consumers’ doors. In this instance, Casper is able to provide consumers with high-quality items at low costs.
However, overhead cost had to be cut elsewhere in order to achieve a healthy margin. Casper’s business model provided this by eliminating the brick-and-mortar model that is traditionally associated with purchasing a mattress. In doing so, they have eliminated the cost of not only a storefront but also salespeople to maintain that storefront.
Similar to what you experience in the simulation, something has to be sacrificed for the customer in order to ensure you’re making a profit. In this instance, customers lost the ability to try multiple mattresses in one day with the assistance of a salesperson. In return, they could afford to purchase a high-quality mattress at a more affordable price.
How Can We Build a Perfect Product That Is Profitable?
Application in
Customer Buying Criteria
Low End Segment
Price $15.00-$25.00 53%
Age 7 years 24%
Ideal Position Pfmn 1.7; Size 18.3 16%
MTBF 12,000-17,000 7%

Case Stories Application in Capstone versus Real-World Application • 131
As you raise automation, it becomes increasingly difficult for R&D to reposition products at short distances on the perceptual map. For example, a project that moves a product 1.0 point on the map takes significantly longer at an automation level of 8.0 than at 5.0. But why?
When you decide to increase your plant’s automation, you are essentially retooling machines to speed up and improve the building process. Out the door goes
some of the workers needed to build the product, and in comes new machinery that does the same work faster and more reliably. With that new machinery comes changes to how products are made. To ensure products are created without defects, R&D designers must consider how to integrate the product’s design into the new machinery, which takes additional time as the machinery becomes more complex.
In the following article, the evolution of automation is discussed. General Motors is praised for their visionary approach to automation in the 1980s. While they were one of the first in the automotive industry to capitalize on automation, the initial impact of automation was not strictly positive. Relative to their competitors, like Toyota, their market share slipped. The article answers, “What went wrong? GM failed to account for the indirect labor costs, operators and technicians needed to transition to automation.”
The transition to automate a production plant was not accounted for. Imagine this: The robotics that put an engine together must consider the weight and specifications for each component that makes up the engine. If one of these components is changed slightly, the calculation that the robotics use to piece the engine together will need to be recalibrated.
Real-World Application
Why Does Automation Increase My R&D Cycle Time?
Application in
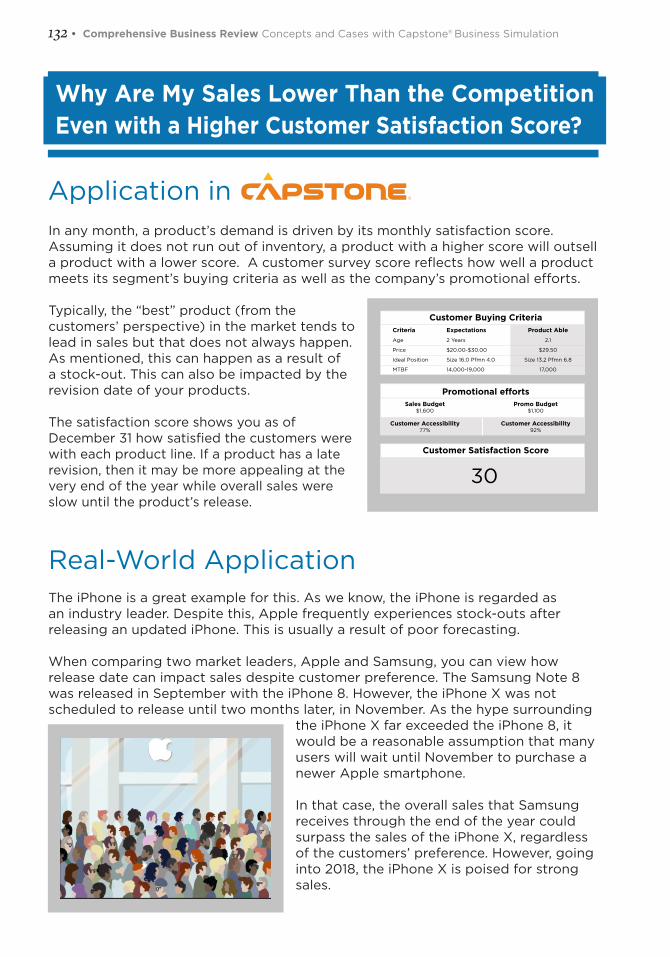
132 • Comprehensive Business Review Concepts and Cases with Capstone® Business Simulation
In any month, a product’s demand is driven by its monthly satisfaction score. Assuming it does not run out of inventory, a product with a higher score will outsell a product with a lower score. A customer survey score reflects how well a product meets its segment’s buying criteria as well as the company’s promotional efforts.
Typically, the “best” product (from the customers’ perspective) in the market tends to lead in sales but that does not always happen. As mentioned, this can happen as a result of a stock-out. This can also be impacted by the revision date of your products.
The satisfaction score shows you as of December 31 how satisfied the customers were with each product line. If a product has a late revision, then it may be more appealing at the very end of the year while overall sales were slow until the product’s release.
The iPhone is a great example for this. As we know, the iPhone is regarded as an industry leader. Despite this, Apple frequently experiences stock-outs after releasing an updated iPhone. This is usually a result of poor forecasting.
When comparing two market leaders, Apple and Samsung, you can view how release date can impact sales despite customer preference. The Samsung Note 8was released in September with the iPhone 8. However, the iPhone X was not scheduled to release until two months later, in November. As the hype surrounding
the iPhone X far exceeded the iPhone 8, it would be a reasonable assumption that many users will wait until November to purchase a newer Apple smartphone.
In that case, the overall sales that Samsung receives through the end of the year could surpass the sales of the iPhone X, regardless of the customers’ preference. However, going into 2018, the iPhone X is poised for strong sales.
Real-World Application
Customer Satisfaction Score
Customer Buying Criteria
Promotional efforts
30
Product Able
2.1
$29.50
Size 13.2 Pfmn 6.8
17,000
Criteria
Age
Price
Ideal Position
MTBF
Expectations
2 Years
$20.00-$30.00
Size 16.0 Pfmn 4.0
14,000-19,000
Promo Budget$1,100
Customer Accessibility92%
Sales Budget$1,600
Customer Accessibility77%
Why Are My Sales Lower Than the Competition Even with a Higher Customer Satisfaction Score?
Application in
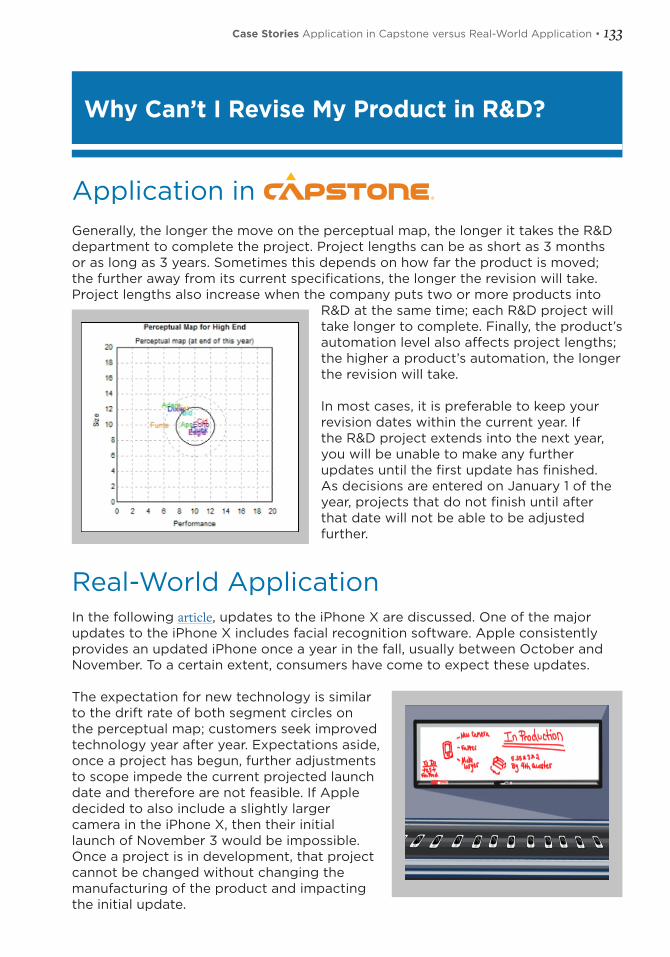
Case Stories Application in Capstone versus Real-World Application • 133
Generally, the longer the move on the perceptual map, the longer it takes the R&D department to complete the project. Project lengths can be as short as 3 months or as long as 3 years. Sometimes this depends on how far the product is moved; the further away from its current specifications, the longer the revision will take. Project lengths also increase when the company puts two or more products into
R&D at the same time; each R&D project will take longer to complete. Finally, the product’s automation level also affects project lengths; the higher a product’s automation, the longer the revision will take.
In most cases, it is preferable to keep your revision dates within the current year. If the R&D project extends into the next year, you will be unable to make any further updates until the first update has finished. As decisions are entered on January 1 of the year, projects that do not finish until after that date will not be able to be adjusted further.
In the following article, updates to the iPhone X are discussed. One of the major updates to the iPhone X includes facial recognition software. Apple consistently provides an updated iPhone once a year in the fall, usually between October and November. To a certain extent, consumers have come to expect these updates.
The expectation for new technology is similar to the drift rate of both segment circles on the perceptual map; customers seek improved technology year after year. Expectations aside, once a project has begun, further adjustments to scope impede the current projected launch date and therefore are not feasible. If Apple decided to also include a slightly larger camera in the iPhone X, then their initial launch of November 3 would be impossible. Once a project is in development, that project cannot be changed without changing the manufacturing of the product and impacting the initial update.
Real-World Application
Why Can’t I Revise My Product in R&D?
Application in

134 • Comprehensive Business Review Concepts and Cases with Capstone® Business Simulation
Part 3
Mini Case Studies
Mini Case Studies • 135
IntroductionCapsim has developed five “mini case studies,” based on current business news stories, in order to help expand classroom discussion on relevant business issues tied to Capstone.
By demonstrating how decisions and outcomes in the simulation mirror management in the real world, we can deeply anchor an understanding of key business principles through the entire simulation experience.
What’s in This PackageThe cases are:
• Strategy: Selecting and adhering to a strategy—how low-cost carriers changed the profit model in the air travel industry.
• Research & Development: New product introductions—lessons from the wearables market (this also talks about the importance of electronic sensors, the product students develop in Capstone).
• Marketing: The 4Ps—how Dollar Shave Club successfully translated the 4Ps into digital marketing campaigns and a stellar valuation.
• Production: The importance of resource planning—Tesla’s plan to mass produce affordable electric cars.
• Finance: Why accounting rules matter—an organic food supplier suffers from accounting irregularities.
136 • Comprehensive Business Review Concepts and Cases with Capstone® Business Simulation
Strategy: Low Cost versus Legacy—Definitions Get CloudyEasyJet—the British-born low-cost airline that launched in the mid-90s with the slogan “flights as cheap as a pair of jeans”—announced record profits of £686 million in 2015. That was 18% above its previous year’s results and its fifth record profit in a row. Southwest Airlines, the US low-cost airline that started it all in the 1970s with hostesses in orange hot pants and white go-go boots, also finished 2015 with record profits of $620 million. It was Southwest’s 43rd consecutive year of posting a profit.
While these low-cost carriers (LCCs) are making profits, legacy airlines are struggling to cut costs and increase margins. Low fuel costs have helped the legacy airlines’ bottom line in recent years, but profitability has been far more variable than for LCCs.
Disrupting the MarketLow-cost airlines disrupted the traditional air travel market, changing the concept of a domestic flight from a luxury to a commodity. They focused on short-haul flights, leaving the costly long-haul flights to the legacy carriers. As the low-cost carrier market has matured, however, the gap between low cost and legacy airlines services has narrowed significantly. In recent years, legacy airlines have watched their markets erode and they cut costs and services in an attempt to match the competition. Meanwhile, the no-frills airlines have become successful and begun to introduce a few fancy ruffles, if not fully fledged frills like assigned seats and perks for business passengers. The LCC sector took off in new markets as well. According to the Center for Asia Pacific Aviation, the region’s LCC fleet increased 50% from 2013 to 2015 in Southeast Asia, from 400 to 600 aircraft. AirAsia, the leading Asian LCC based in Malaysia, was voted World’s Best Low-Cost Airline at the Oscars of the aviation industry, the Skytrax Awards, for the eighth year in a row in July 2016.
While these low-cost carriers (LCCs) are making profits, legacy airlines are struggling to cut costs and increase margins.
New Profit ModelLow-cost carriers developed a new profit model for air travel. They cut costs in a myriad of ways. Specifically, they cut fleet costs by using one type of aircraft with minimal additions (seats on Ireland’s Ryanair planes, for example, did not recline or have seat back pockets to reduce weight and maintenance costs). They hedged gas price contracts to smooth their fuel costs. They cut labor costs by hiring less experienced staff at lower pay grades. According to The Economist, one Indian low-cost carrier hires only female flight attendants because they are on average 10–15 kg lighter than men. Such parsimony pays off. Fuel accounts for a third of an airline’s costs and every kilogram thus shed removes $100 from an aircraft’s annual fuel bill.
Many Ways to CutLCCs cut passenger amenities to the bone, offering no in-flight entertainment and charging for each service, including food, beverage, luggage, pillows, and blankets—even debating the merits of charging for bathroom use. They cut airport fees by ensuring planes spent less time on the ground, using secondary airports instead of major hubs and avoiding jetways that attract high usage fees. The result was an ability to cut prices—sometimes to as low as zero (excluding taxes and charges)—with simple fare structures such as one-way fares priced at half return fares and seat prices that increase as flights fill up. For some time, all that cutting allowed the LCCs to offer what European guide book publisher and media personality Rick Steves called “remarkable, it-must-be-a-typo deals.”
Mini Case Studies • 137
Major Shake-Ups, and More to ComeThe shake-up has led to several dramatic shifts. Delta and Northwest Airlines have merged. Legacy airlines like Lufthansa have acquired their own LCCs (Eurowings). United failed in building a low-cost brand (Ted). Over time, the price gap has even slightly closed between low cost and legacy airlines. Analysis by The Economist in May 2013 showed it cost a typical legacy carrier 2.5 cents more to move one seat through the air for 1 km (0.6 miles) than it cost a low-cost carrier—but that was down from a 3.6-cent premium in 2006:
“The cost gap between traditional and budget airlines has fallen by an average of 30% in six years, partly because legacy airlines have abandoned old differentiators like free baggage and inflight catering on short-haul flights.”
For customers, the price of a flight has dropped more than 20% since 1995. Customers are winning; for airline shareholders, the story is less clear. Airline stocks are down an average of more than –15% in mid-2016, “and if you include all of 2015 the average is worse than –20,” according to Forbes.com.
With cost cutting being the only game in town for airlines, further innovation in the industry is likely. Suggestions like containerizing passengers and crew in portable cabin pods that are loaded into the plane in minutes is one suggestion. Whatever technologies are employed, however, the overall impact of the LCCs means the search for lower costs will continue until the next big disruption in the industry.

138 • Comprehensive Business Review Concepts and Cases with Capstone® Business Simulation
R&D: Wearables Offer Lessons for NPIsFrom the earliest wristwatch to the latest fitness trackers, we’ve been refining and expanding the functionality of wearable devices.
According to market research firm eMarketer, 39.5 million US adults 18 and over used wearable devices in 2015, including smartwatches and fitness trackers, an increase of 57.7% over 2014. Researchers say this growth will continue through 2016 and beyond, with 81.7 million adults using wearables by 2018.
Technology Meets Other ObsessionsThe rapid advance of mobile phone and electronic sensor technologies plus the convergence of affluence and self-obsession (reflected in the “quantified self” market) has spawned the new electronics market for “wearables”—devices that track our movements, fitness, vital signs, whereabouts, and a range of other data.
Pebble launched the first commercially successful smartwatch with a record-breaking Kickstarter crowdfunding campaign in 2012. Nike and Apple collaborated on the early Nike+iPod fitness tracking device. While Maxwell Smart’s shoe phone made him an early adopter of wearables, sensors and computers are now embedded not just in shoes but in clothing as well. Shoes and shirts can change color—for fashion—or have more serious functions such as the work shirt, promoted by insurer AIG, that traces workers’ movements in an attempt to cut work-site accidents.
Using Our HeadsTechnology is also increasingly using our heads: “The head is fast becoming a piece of premium human real estate for technology companies,” claims weareable.com. Clunky strap-on cranial cameras developed in the 1980s have become sleek eyewear that not only take pictures but also provide information—or create alternative realities. The first Google Glass headsets however—devices that put a computer right in front of your eyes and sold for $1,500—failed in the market. As wearable.com says, “An hour with Glass was enough to make you realize two things: The first is that it is an amazing glimpse into the future of technology and the way we augment connected data and the real world.
However, the second is that you will never want to wear Google Glass again.” Google will release its second attempt in 2016.
Just as Google found with its glasses, gain for wearable technology suppliers isn’t made without pain. Fossil’s Wrist PDA, launched in 2002, lasted only 3 years. In February 2014, FitBit’s Force device faced a total withdrawal after thousands of buyers developed skin rashes. Jawbone (the industrial design company that brought us sleek, in-ear Bluetooth devices) launched its fitness-tracking device, Up, in late 2011 but had to withdraw it soon after because of technical problems. Nike+ took advantage of Up’s withdrawal to promote its FuelBand in early 2012. In 2013, FuelBand faced a class action suit by consumers based around the efficacy of its data, and in 2014, Nike discontinued the product.
Innovation and the Bottom LineThe bottom line is that what’s technologically possible isn’t always what customers want or are willing to buy in large enough numbers to make the venture profitable.
Wearables all require electronic sensors that are becoming more and more sophisticated. Apple CEO Tim Cook told the All Things Digital Conference back in May 2013 that the problems to be solved in building wearable electronics were not trivial—but they would be good news for the sensor industry: “The whole sensor field is going to explode,” Cook said. “It’s already exploding. It’s a little all over the place right now, but with the arc of time, it will become clearer I think.”
According to Dynosense, digital health monitoring products manufacturer, “Advances are being made in the sensor space every day at the intersection of technology and the body, and the possibilities are open ended.” It’s the intersection of those possibilities with profits that electronics companies are trying to maximize.

Mini Case Studies • 139
Marketing: Dollar Shave Club’s Big Draw for Unilever—the BrandUnilever, the multinational consumer products company, paid $1 billion for the Californian start-up Dollar Shave Club in mid-2016. The price was five times the forecasted earnings of the company. Analysts suggested many reasons for the big offer. Unilever had to absorb a market disruptor. It wanted to ensure competitors Procter & Gamble (Gillette) and Edgewell Personal Care (Schick) didn’t buy Dollar Shave first. It needed to fill out its personal care products portfolio, but the major attraction of Dollar Shave Club was its brand. The company took a swipe at the big names in men’s grooming products by creating an instant brand through creative, digital marketing.
Building a Brand in Record TimeAs Bloomberg reported, “The key to Dollar Shave Club’s appeal is not so much its online prowess but the fact that it built a powerful brand in four years.” As Forbes magazine reported in 2013, the company’s first year, “The company’s millions are dwarfed by those earned by Gillette or Schick, but its deft understanding of marketing’s 4Ps (product, price, place, and promotion) showed that big-name consumer brands are vulnerable.”
Dollar Shave Club’s initial value proposition, razor blades home delivered on monthly subscription, kicked off with an online ad that went viral. “Our Blades Are F***ing Great” immediately won a raft of advertising awards and first year sales for the company were $4 million. The video has had more than 23.5 million views.
By 2014, sales had soared to $65 million and in 2015 topped $120 million. Fortune calls the company “a social marketing as well as an entrepreneurial success.” Its expanding product line includes “shave butter,” post-shave moisturizer, and wet wipes for (ahem) the other cheeks. This new product, “One Wipe Charlies,” spawned another madcap video featuring lots of scatological humor, antics in toilet stalls, and a bear doing, well, what it does in the woods. It’s creatively fun, and tailor-made to the audience—but also serious marketing.
“the key to Dollar Shave Club’s appeal is not so much its online prowess but the fact that it built a powerful brand in four years.”
Knowing Your AudienceHere’s how Dollar Shave Club’s CMO Andrew Weber describes the brand: “For so long, for a lot of the spaces talking to men, it was like you had to choose—you were either going to be very highbrow, slightly unapproachable, extremely aspirational, but really, largely unattainable as a brand—or you were going to approach men as Neanderthals. I think those tones, as our brand I think proves, don’t really work. The way to reach guys nowadays, and to have that authentic feel, is to be relatable, allow guys to put themselves in your shoes as a brand, as opposed to talking at them or talking above them.” Weber then expanded, pointing out that it’s the video that both launched and maintains the brand—first on social media and then on television.
Dollar Shave Club is one of many brands successfully blending disruptive new digital marketing technologies with the old-school 4Ps. Product (goods to solve problems for male grooming), place (delivered to your door), promotion (those crazy ads and more), and the key point that existing razor suppliers missed—price. Dollar Shave Club’s broadcast TV ads openly mock the incumbents’ give-away-the-razor-but-profit-on-the-blades model, particularly the locked cabinets in pharmacies that may keep expensive blades away from shop-lifters but make it difficult for customers to get what they want.

140 • Comprehensive Business Review Concepts and Cases with Capstone® Business Simulation
4Ps Go DigitalWhile the 4Ps are a concept from the 1960s, as Managing Director of Accenture Interactive Marek Rucinski remarks, those old 4Ps still apply in the new digital space. Rucinski explains:
“Execution of the four Ps is linked to the orchestration across the technology, creative and strategy . . . As digital redefines marketing, close links with sales and branding functions remain. But digital is increasingly also the driving force behind customer service, user and customer experience, and large elements of IT, PR, product development and more.”
Digital opportunities and technologies have put marketing at the center of the business decision-making mix more than ever before.
Mini Case Studies • 141
Production: Can Tesla Achieve Economies of Scale and Keep Its Promise?With more than 350,000 preorders for its first mass market car, the Tesla Model 3 Sedan, Tesla Motors will need to boost production to 500,000 cars by 2018. That’s ten times the 50,000 cars it produced in 2015.
The presale numbers would seem extraordinary, but Tesla has been “extraordinary” from the beginning, fueled by the vision of CEO Elon Musk and a cultural determination to revolutionize the car industry.
Electric Vehicles Make a ComebackElectric vehicles were popular in the late 19th and early 20th centuries until Henry Ford began mass-producing gasoline-fueled cars with internal combustion engines. It took high oil prices, environmental concerns, and advances in battery technology in the late 20th century to bring electric cars back into the mainstream.
Now, with these changes in the market, the major car companies including Ford, GM, BMW, Toyota, Honda, and Nissan have released electric or electric/gasoline hybrid cars to accommodate for these changes. Yet these new innovations were conservatively tied to existing models, attempting to retrofit and revise existing models to a newer format. On the other hand, in 2013, Tesla, a small automotive start-up from California, began not only winning several design awards but also proving a profitable model for electric cars that might challenge the traditional car companies. Tesla opened a new market segment—luxury electric cars with a longer battery life and longer range that were designed to excite discerning motorists and sold through its own stores, not dealerships. It wasn’t offering the battery version of a gas-powered car with fewer extras, but a new sought-after trend in upscale motoring.
Tesla Making Good on Affordable Car PromiseWhen Tesla made its first profit in 2013, Elon Musk said his company’s goal had always been to mass-produce fully electric cars at a price affordable to the average consumer and would do it “within five years.” Musk was standing by his product life cycle strategy—entering at the high end where customers will pay more and then driving down costs and building volume.
Improving battery technology leading to increase in driving range will lower costs in coming years. Additionally, suppliers have begun demonstrating that they can revamp their own production and reduce the cost of parts leading to more efficient manufacturing. Indeed, Tesla claims it is steadily cutting the number of worker hours necessary to build each car in lieu of robotic automation and more efficient design processes. Tesla isn’t stopping there either, as they expand their overall capacity, by pumping money into a Gigafactory and additional production capacity in order to be ready to fill orders with significantly higher volume than before. Altogether, these factors strongly tip future balance of the market in Tesla’s favor.
“Musk was standing by his product life-cycle strategy—entering at the high end where customers will pay more and then driving down costs and building
volume.”
Challenges AheadThe traditional car-making giants, however, are not sitting idly by while Tesla is muscling into their space. Improved battery technology itself is replicable, plus they already have experience in mass manufacturing. Recognizing the value of experience, Tesla hired a long-time Audi executive to lead its vehicle production team—a departure from the company’s practice of hiring from the technology and energy industries.

142 • Comprehensive Business Review Concepts and Cases with Capstone® Business Simulation
Perhaps Tesla’s biggest advantage is the strong support it enjoys from its investors. By mid-2016, Tesla’s market cap was $32 billion with sales of just over 50,000 vehicles in 2015. GM’s market cap was $50 billion, less than twice Tesla’s, and it sold 9.8 million cars. As 247wallst.com said, “Something is wrong with this picture.”
Forbes calls Tesla’s share price “a cult-like valuation,” and critics suggest that without generous US government loans and subsidies that the company has received, it may not survive.
Tesla’s performance in the next few years will prove whether the beliefs of the Tesla faithful are well-founded or whether the challenge of economies of scale for mass market vehicles was too tough for the new market entrant.
Mini Case Studies • 143
Finance: Why the Rules Are the RulesAccording to the Organic Trade Association, sales of organic food are steadily growing since 2012. Americans spent $43.3 billion on organic products in 2015.
One company riding that wave is Hains Celestial Group that sells organic food and personal care products through distributors to thousands of retailers. For the first half of 2016, Hains Celestial saw its share price increase by 32%.Then, in August, it lost $1.3 billion from its market value overnight, after announcing profit targets would not be met for the fiscal year to June 30 and year-end results would be delayed. All because of accounting.
Is It the Market or the Reporting?Some commentators speculated Hains’ problems may flag a softening in the market for consumer organics. Others said the loss of value was a temporary setback, making it a good time to buy Hains Celestial shares. Whatever the final fallout, a company growing strongly and selling some of the hottest products in the food industry hit a roadblock because of accounting anomalies—and it is far from the first.
The problem stemmed from the timing of Hains’ revenue reporting. When the company ships product to a distributor, it books the revenue. Distributors receive concessions that Hains applies according to a formula, rewarding them for high volumes sold in shorter periods. “Since Hain recognizes revenue before the goods are sold, it needs to make an estimate of how big those concessions will be,” said Fortune. According to the Wall Street Journal, “It is reviewing whether revenue associated with the concessions should continue to be reported when products are shipped to distributors or recorded when the distributors sell them to retailers.” Perhaps, more worrying is the company’s admission that it needs “to assess its internal controls over financial reporting.”
Some Scope for FlexibilityForbes pointed to another organic food company, Annie’s, that faced similar problems because of accounting irregularities in 2014 but recovered quickly and was bought by General Mills soon after.
While there is some scope for individual companies and industries to incorporate unique aspects of their businesses in their financial reporting, the rules of accounting—laid out in GAAP—are very strict. Clear rules mean that stakeholders—including shareholders, potential buyers, and even governments—can make consistent evaluations over time and between different companies.
“It is no longer sufficient merely to comply with accounting rules so that there is no technical breach; to restore confidence in the markets, investors also want companies to respect the spirit of the standards.”
Investors Require Valid Information“Investors do not like to be misled by fraudulent or dishonest managers who are economical with the truth or bend it to their advantage,” warns Jenny Rayner in Managing Reputational Risk: Curbing Threats, Leveraging Opportunities (Wiley, September 11, 2003). “It is no longer sufficient merely to comply with accounting rules so that there is no technical breach; to restore confidence in the markets, investors also want companies to respect the spirit of the standards.”
$

144 • Comprehensive Business Review Concepts and Cases with Capstone® Business Simulation
After the accounting and audit scandals that bankrupted Enron and WorldCom in the early 2000s, new legislation in the US, the Sarbanes–Oxley Act, increased penalties for destroying, altering, or fabricating records in federal investigations or for attempting to defraud shareholders. The act also increased the accountability of auditing firms to remain unbiased and independent of their clients. That makes it more difficult for fraud to go unpunished, but as Hains Celestial discovered (to its detriment), any accounting irregularities can have serious implications in the marketplace.

Concepts and Context Capstone beyond the numbers • 145
Part 4
Concepts and Context: Capstone beyond the Numbers
146 • Comprehensive Business Review Concepts and Cases with Capstone® Business Simulation
Capstone Case Study 1: We’re Moving!Capsim has developed five “mini case studies,” based on current business news stories, in order to help expand classroom. Scenario: The board decides to relocate your corporate head office.
The chairman of the board of your corporation is from another state and is a prominent citizen and respected leader of the business community there. She is well-connected in government and cultural community circles. Recent legislative changes in her home state delivered a more favorable taxation environment for business than in your company’s current jurisdiction. The chairman is also very close to the newly elected mayor of the capital city in her state. She is in a strong position to sponsor negotiations, on behalf of the company, for an economically advantageous relocation of head office operations to the capital city.
Your current location is in a regional center, without an international airport. Several board members—and staff who travel frequently to client and supplier sites—have complained about how much it costs, in time and money, to get into and out of town. The company was founded at that location, however, and has deep roots in the community. Staff have children in local schools, elderly relatives nearby or in local care facilities, and they belong to sporting and social clubs. Senior managers are known and respected in business and legislative circles. There is a relatively benign relationship between management and the unions on site. It’s a badge of honor to work for your company in this community. However, it has been tough to attract the right caliber of applicants for recent vacancies in senior executive roles and, being away from a financial and commercial center, it is difficult to establish a national and potentially international brand.
The chairman has drafted a proposal for the board to move head office operations to capitalize on benefits she can negotiate on behalf of the business and to reap the benefits of a major city location. She believes state and local governments can offer:
• More favorable state corporate tax regime, including tax credits for job creation, R&D, and qualified facilities;
• Lower sales tax;
• Expedited approvals, licensing, permits, etc.;
• Access to civic and business partners;
• Customized job training;
• Export assistance; and
• Deals on telecommunication infrastructure and utilities.
Plus, location in a capital city offers:
• A major international airport hub, facilitating travel for board members, management, and staff maintaining relationships with customers and suppliers;
• Proximity to some major customers’ HQs;
• Adequate office space and a wide variety of housing options; and
• Quality schools, universities, hospitals, and medical facilities.
The day before the board meeting, a junior administrative assistant—subbing for the senior administrator who was on sick leave—was asked to print off a set of board papers for a member of the board who’d arrived in town without a copy.

Concepts and Context Capstone beyond the numbers • 147
She left the relocation proposal document on her desk while she made herself a cup of coffee. An assistant marketing manager walked by and saw the proposal on her desk and read it. He took the news back to his boss, and although his boss asked him not to mention it to anyone, he told a friend from the R&D department—someone he trusted—during lunchtime. Both the young staff members were excited by the prospect of moving to a major state capital.
By the morning of the board meeting, the office, the R&D facility, and the plant were abuzz with rumors ranging from the true—that the board would consider a proposal to move the head office interstate—to the fanciful—that the head office was moving interstate as a precursor to closing the plant and relocating production offshore, the entire company would be moved, the move was due to a personality clash between the CEO and the head of production, the head office was moving away so it could attack the union from afar, and more.
When the CEO entered the board meeting, he was aware of staff anxiety over the outcome of the chairman’s proposal. There was discussion in the meeting over how the information leaked to the organization, and the CEO suffered the board’s displeasure over sloppy processes.
The board decided to move the head office as soon as possible. The vote was to secure the benefits. The chairman of the board was in a position to negotiate with long-term contractual agreements that would provide maximum stability and financial benefit to the corporation. The board asked the CEO to prepare a report for the next meeting outlining his plans to achieve the move with minimum disruption.
Your AssignmentYou are the CEO.
Your immediate tasks are to:• Prepare a stakeholder impact statement based on your current round Capsim report and your strategy selection—just a
broad overview at this stage outlining areas for further research,
• Prepare an announcement to staff to clear up rumors and outline a future timeline, and
• Prepare an announcement for the media that targets the concerns of those you consider to be your primary stakeholders in this scenario.
148 • Comprehensive Business Review Concepts and Cases with Capstone® Business Simulation
Capstone Case Study 2: Give Me a High-End ProductScenarioThe new CEO demands that the company introduce a new high-end product.
From: Tom Harkness, CEOTo: George Tsang; Jake Thompson; Adrienne Lindquist; Lesley Jones. Dear, all,First, it’s been great getting to know you all over the past two weeks. Starting any new job is a challenge, and I want to thank you for your support and for making both Marjorie and me feel very welcome.
Before I joined the company, as you would all expect, I did my homework. One of the “thought bubbles” I had, as I evaluated market opportunities and our own apparent strengths, was that we need to introduce a new high-end product. Pronto.
You have been with this company much longer than me, of course, so this is the perfect time for us to harness two valuable perspectives—your long-term knowledge of the company and the market and my fresh eyes on the issues. I have chosen you four as my cross-functional project team for this endeavor.
I am committed to introducing a new high-end product. However, I need you to provide your own analysis, so we can fine-tune the proposal and develop an implementation plan. We’ll put those excellent project management skills you have impressed me with into action. This also gives me a great chance, early in my tenure, to see you all working as a team and producing something I’m convinced will increase profit over the medium term.
If you have any questions, please feel free to ask—the door is always open—and I look forward to seeing your report in, say, two weeks.
Sincerely, Tom
P.S. I want the product to have a knock-me-dead name. Let’s see what you can come up with.
From: George Tsang, Marketing VP To: The project team
I’m sure you’ve all just got this email too. Apart from the whole idea of a “knock-me-dead name” in a business-to-business market, I have several concerns about this proposal. We have set our strategy based on customer response, market analysis—we’ve been doing our homework. For years! This is shooting from the hip I believe.
When can we get together to discuss?George
From: Adrienne Lindquist, Director of Research & Development To: The project team
I’m free any time, George. Two weeks is no time at all to get this done, and while every minute of that
Concepts and Context Capstone beyond the numbers • 149
time is already accounted for in my case, I suppose I’ll have to squeeze more out of the week for whatever analysis we need.
I don’t think we should start from a position of “what the boss wants the boss gets” however. Let’s make sure we can all agree on the position—whether it’s to support him or make the case against—and get the proof to back ourselves up. I can tell you all that it’s impossible to put another development project into the schedule without additional resources.Adrienne
From: Jake Thompson, Senior Production Manager To: The project team
I’m with you there, Adrienne. We would need another production line as well. That’s going to take a year to commission and build—plus we’re tight on space. I’ll need more workers. We can’t throw too many robots at a high-end product—the design for manufacturability gets too expensive and, besides, it would take too much time. If by “medium term” he means five years, we might do it. But I’ll bet he’s not talking five years.
Name the time and date—except for Wednesday mornings when we have our production meetings.
From: George Tsang, Marketing VP To: The project team
And not Monday afternoon, please, that’s when I do my marketing all-in with head office and regional staff.Thanks,George
From: Lesley Jones, Assistant Finance Director To: The project team
I suppose we should have expected something like this from a new CEO. But he could hardly have picked a worse time to toss this at us, right as I’m wrapping up the end of third quarter results. Sure, end of financial year would have been worse, but this doesn’t show a lot of understanding. Look guys, I’m really under the hammer here. Would you be willing to kick this off with an early meeting, say 7 a.m.? It’s really difficult for me to be away from the desk during business hours. We’re collating a lot of information with so few hands—and they’re juniors at that, which means I need to keep a close eye on them.Please let me know.
Your AssignmentYou are the project team receiving this assignment to prepare a report on introducing a new high-end product as directed by the new CEO. Depending on your company’s current strategy and position, you may, as a team, decide to support Mr. Harkness’s decision or oppose it, but you’ll need to back up your choice with a clear argument. Use your current Capsim report and relate your argument directly to your selected strategy.At your first meeting (which was, ugh, at 7 a.m. the following Monday!) your team decided the first steps would be:
• A SWOT analysis and
• A break-even analysis for the new product.
• Oh, and of course, that knock-me-dead name!

150 • Comprehensive Business Review Concepts and Cases with Capstone® Business Simulation
Capstone Case Study 3: Porter’s Five ForcesScenarioIt’s lunch time at the head office. Director of Human Resources Chris Franklin is sharing a table with Marketing VP George Tsang. Chris has a group of MBA students arriving for their summer internship in a few weeks, but there’s a problem:
Chris Franklin: The summer interns arrive in a week, George, and none of the departments seem to have meaningful projects for them to work on. This is a very smart group of students—really impressive. I don’t want them just sitting around, doing busy work like data entry—or making coffee! We have a commitment to supporting business education, and I want their time with us to be valuable.
George Tsang: To be honest, Chris, I don’t have much for them to do either. Our current campaign is in maintenance mode, and we don’t plan to call for agency pitches on the new product launch until September. That puts me in the same boat as the other departments—with very little work for an intern.
Chris: Maybe we should bring someone in to give them barista training . . .
George: or . . . our Strategic Plan Update meeting is scheduled for August. Why not have them work on something for that?
Chris: What, the catering?
George: No, no, I’m thinking big! That’s what we do in marketing, you know . . . The whole management team is looking at the strategic plan, right? Why not get a new perspective? If these students are as bright as you say, they could offer some intriguing insight into the business. Maybe a new idea or two.
Chris: You’re right! We could give them a lot of information on the business and, say, ask them to do a SWOT analysis, for example. It’s been a while since we had fresh eyes look us over; we may be missing some opportunities. Or some threats. I like it! Thanks George, I’ll put the proposal to the CEO this afternoon.
Your AssignmentYou are on the team of interns, hired by Chris Franklin, for your summer assignment with a company that manufactures electronic sensors. You have been given substantial information on the company—and its competitors—via an industry report, the Capstone Courier.
You decide to base your report on the Strategic Plan Update meeting on something you have studied at university: Porter’s five forces. Look at where and how the five forces apply pressure on this electronic sensor business:
1. Competitive rivalry—you’ll find a wealth of information on products, production planning, margins, and more.
2. Bargaining power of suppliers—how do AP policies affect a company’s relationship with suppliers? And TQM initiatives? (If these are active in your simulation.)

Concepts and Context Capstone beyond the numbers • 151
3. Bargaining power of buyers—you can see customers’ criteria for buying sensors in the different market segments and calculate how their demands will change. How will the company meet those demands?
4. Threat of new entrants—any competitor can launch a new product at any time. Can you see what is coming onto the market and work out which segment it will launch into?
5. Threat of substitute products or services—this force isn’t operating in the simulation. However, in this exercise, you’re not confined by the rules of the game. Can you imagine how this force could impact the business?
Given your analysis, propose at least one idea that might make the company more profitable and/or less vulnerable to its competition. Your suggestion does not need to be something achievable within the strict confines of your simulation, but it does need to harness one of Porter’s five forces.

152 • Comprehensive Business Review Concepts and Cases with Capstone® Business Simulation
Capstone Case Study 4: Bring in the BotsScenarioThe production department is about to maximize automation on the low end.
From: Jake Thompson, Senior Production Manager To: The management team
Hi, y’all,We are in celebratory mode here in production management. The CEO’s given me the go ahead to get the automation on our low-end product line as high as we can take it, in as short a time as possible. Obviously, I’m relying on the finance team to come up with the appropriate level of investment over the next few years. It’s not going to happen overnight—unfortunately! The existing line has maintenance problems, plus there’s a lot of staff to manage over the two shifts.Some of them have been with us a long time, and, of course, they know better than the management team how to run the place! Once we bring in the bots, so many of my day-to-day irritations will go away.Feel free to come by and share a celebratory cup of coffee—I know you’ve heard me argue this issue in management meetings for some time, so you’ll understand how happy I am.Jake
From: Chris Franklin, Director of Human Resources To: Jake Thompson Whoa, careful Jake.
Some people might call your “day-to-day irritations” by another name—employees. Congratulations on the automation outcome, but this issue is going to be very sensitive once news gets out. I know you respect your people, and your email is the result of being excited by your win, but take it easy, cowboy!Chris
From: Jake Thompson, Senior Production Manager To: Chris Franklin
Wow, sorry, Chris. I guess I was so carried away over the business implications—we can get the product out more efficiently for a lower price—that I wasn’t thinking about what’s going to happen between now and then. Of course, I know it’s going to be tough. There are a lot of breadwinners on the low-end line. Can we catch up for a chat about how to handle this?Jake
Your AssignmentYou are the human resources director, Chris Franklin. When you see the full report on the automation project, you understand there will be 100 people to lay off this year and another 75 next year. However, some higher-skilled positions will also become available as the factory automates.
Your company is an important employer in your regional center. Jobs on the low-end line represent something that’s now rare in your town—secure work for people with modest skills. There will be redundancies, reassignments, early retirements, etc. for you to manage once the layoffs begin. Right now, however, your job is to prepare a communication plan for your CEO to manage the dissemination of information.

Concepts and Context Capstone beyond the numbers • 153
Please provide a report for your CEO including:• A list with all relevant stakeholders.
• The suggested communication channel or channels to reach the stakeholder groups (e.g., email, individual face-to-face meetings, group meetings, local media, personal letters, etc.).
• The key messages you need to communicate to each audience.
• Ideas for retaining or retraining employees: Can you work with a local community college, access or design online training, or support a community project by providing an employee for a certain period?
154 • Comprehensive Business Review Concepts and Cases with Capstone® Business Simulation
Capstone Case Study 5: Surviving a DownturnScenarioTom Harkness, your company’s CEO, is at the MEMS & Sensors Industry Group Leaders’ Roundtable meeting in Washington, DC. He emails his executive team saying he wants a meeting at 5 p.m. today and he will attend via Skype.
Thank you all for being punctual. I’ve called this special management meeting because we need to make some big changes. Fast. We have all known the tough decisions are upon us, but the figures I saw this morning—presented by an economist in the research team at MSIG—along with the conversations I have had with others at this meeting in DC has convinced me we can’t delay.
We all know unemployment numbers are rising and two more quarters of negative growth will put us in recession. The severity of the impact of this downturn, however, is something—well, to be honest, something I was hoping not to have to confront. Some of our major customers are in real trouble and others seem to be hanging on by their fingernails. We’re going to seriously feel the pinch—but I’m determined our business is going to survive this. We need to start planning and implementing changes immediately.
Electronic sensors aren’t going away, and I’m confident that demand will pick up again, but the company that emerges from this downturn may be different than the company we have now. We should not be afraid of the change, but we cannot wait for changes to happen to us.
I want us to evaluate selling off one of our lines as a first step. And I need a unanimous recommendation from you all on which one. What are the marketing implications? Which product can we liquidate with the least damage? Given inventories, staffing, production investment, and so forth, which line can we lose with the least disruption and loss of revenue? Give me the numbers and the rationale.
This first step must be done now. We’ll take the pain as quickly as possible. There will be repercussions from this—the lost jobs, most importantly—and I want you to make recommendations about how we communicate that to the community as part of the planning process.Any questions?
Your AssignmentYou are part of the executive team. You need to look at your production lines and choose one to liquidate. Using all the information available to you in the Capstone Courier, your understanding of the current market, and your company strategy, select the production line that would be most appropriate for closure. In addition, propose how the CEO could deliver the bad news of job losses to the community in the best way and what his key message should be.

Projects for Capstone Teams Created by William J. Ritchie, PhD • 155
Part 5
Projects for Capstone Teams Created by William J. Ritchie, PhD
156 • Comprehensive Business Review Concepts and Cases with Capstone® Business Simulation
TOP MANAGEMENT TEAM FORMATION
IntroductionProjects for Capstone Business Simulation Teams have been designed with the following objectives in mind:
1. To provide instructors and students with a single-source reference for classroom-tested Capstone simulation projects.
2. To provide opportunities to illustrate profound managerial concepts with minimal preparation. (Many projects require only 15 minutes of class time, providing opportunity for insertion into any classroom schedule.)
3. To illustrate the relationships between team Capstone experiences and strategic management in practice.
4. To illustrate how various management research tools are used in the corporate setting.
The workbook is divided into six sections (I–VI). Each section contains a number of projects that are related to the topic of interest.
• Section I: Top Management Team Formation
• Section II: Environmental Scanning
• Section III: Strategy Formulation
• Section IV: Strategy Implementation
• Section V: Evaluation and Control
• Section VI: Supplemental Material
Projects for Capstone Teams Created by William J. Ritchie, PhD • 157
Project 1
. . . Be sure you know the condition of your flocks, give careful attention to your herds; for riches do not endure forever, and a crown is not secure for all generations . . .(Solomon, 950 BC)
Strategy Perspectives
Purpose: Illustrate the manifold perspectives by which strategy has been viewed by researchers and managers.
Activity: Using your school’s library links to ABI Inform/Proquest or Google Scholar, download a copy of Henry Mintzberg’s article entitled “The Strategy Concept I: Five Ps for Strategy.” The article can be found in California Management Review (1987), Volume 30, Issue 1, pp. 11–24.
Summarize in a sentence or two each of the following perspectives of strategy:
Plan:
Ploy:
Pattern:
Position:
Perspective:
1. Which perspective discussed by Mintzberg most closely represents your view of strategy? Why?
2. At this point in the simulation exercise, which view most closely represents the view of your management team?
3. Reflecting on your experience with the Capsim rounds, write a brief description of how each of the five Ps relates to your Capsim company management. For example, consider how strategic “patterns” might have emerged that might differ from your original “plan” or how your strategy provides your team with “perspective.”
158 • Comprehensive Business Review Concepts and Cases with Capstone® Business Simulation
Project 2 We must beat iron while it is hot, but we may polish it at leisure.(John Dryden, 1697)
My Contribution to the Team
Purpose: Provide each team member with an opportunity to affirm his/her own level of contribution to the team.
Activity: The statements below describe specific individual behaviors that lead to overall team participation in the simulation. Read each statement and confirm your agreement by placing your initials in the space provided. Your signature is required at the end of the document.
1. I am willing to cooperate with others. _______
2. I have “pulled my own weight” in the simulation game. _______
3. I will be well-prepared to discuss simulation content. _______
4. I will contribute to team simulation decision-making. _______
5. I attend all team meetings on time. _______
6. I will be respectful and considerate of other teammates’ ideas. _______
7. I will make every effort to lead and not dominate team decision-making. _______
8. I will work hard to be knowledgeable in ALL areas of the simulation. _______
Signature: ____________________________________________________ Date: __________________________
Team Member Witness: _________________________________________________________
Projects for Capstone Teams Created by William J. Ritchie, PhD • 159
Project 3Doing the right things right
Effective Team Characteristics
Purpose: Enhance overall understanding of the characteristics of effective teams.
Activity: In their book The Wisdom of Teams, Katzenbach and Smith (2003) outline “six team basics” that are necessary for team performance. Review these principles. Then meet with your team, and in your own words, explain how each of these six principles are beneficial to your Capsim company performance.
1. Small number of team members (e.g., three to six team members):
____________________________________________________________________________________________________
____________________________________________________________________________________________________
2. Complementary skills (e.g., diversity of skills among members):
____________________________________________________________________________________________________
____________________________________________________________________________________________________
3. Common purpose (e.g., team goals):
____________________________________________________________________________________________________
____________________________________________________________________________________________________
4. Common set of performance goals (e.g., key performance indicators):
____________________________________________________________________________________________________
____________________________________________________________________________________________________
5. Commonly agreed upon working approach (e.g., how tasks will be implemented):
____________________________________________________________________________________________________
____________________________________________________________________________________________________
6. Mutual accountability (e.g., developing mechanisms to hold teammates accountable to accomplish their assigned tasks):
____________________________________________________________________________________________________
____________________________________________________________________________________________________
(Source: Katzenback, Jon R., and Douglas K. Smith. 2002. The Wisdom of Teams. New York: Harper Collins Publishers.)Available on Amazon.com and at most bookstores.

160 • Comprehensive Business Review Concepts and Cases with Capstone® Business Simulation
Project 4 I am extraordinarily patient, provided I get my own way in the end.(Margaret Thatcher, 1989)
. . . do nothing out of selfish ambition or vain conceit, but in humility consider others better than yourselves . . .(Paul of Tarsus, Communications with Teams in Philippi, 61 AD)
Team Formation
Purpose: Gain a greater understanding of team member decision-making personality preferences to accelerate the learning curve among team members. Illustrate the usefulness of using personality instruments in team formation.
Activity: Review the “decision-making” dimensions of the Myers-Briggs Type Indicator® (MBTI®) by referencing a management textbook or visiting www.personalitypathways.com. Determine the various decision-making preferences of each of your team members related to the Sensing (S), Intuition (N), Thinking (T), and Feeling (F) dimensions. These MBTI dimensions are specifically related to how individuals make decisions. Researchers recommend a balance of decision-making types on a team.
Respond to the following statements and discuss with your team:
1. Record the composition of your team in the following tables:
Sensing/Intuition
Student Name Preference
Thinking/Feeling
Student Name Preference

Projects for Capstone Teams Created by William J. Ritchie, PhD • 161
2. Describe the composition of your team. Is there a balance of preferences? Is there any deficiency in the preferences of the team members?
3. What will you do as a team to compensate for the lack of balance on your team?
4. The decision-making literature suggests that the “ideal” sequence for solving problems is as follows: 1. Define the problem (Sensing), 2. Consider alternative courses of action (Intuition), 3. Select a course of action (Thinking), and 4. Consider implications of actions (Feeling). If you were to rely on the strengths (by MBTI type) of your team members to solve a problem, whom would you consult for each of the steps mentioned above?
5. What are some of the possible consequences of the lack of balance on your team?
Observations and Notes:
162 • Comprehensive Business Review Concepts and Cases with Capstone® Business Simulation
Project 5
Our patience will achieve more than our force.(Edmund Burke, Reflections the Revolution in France, 1790)
Time Horizon Preferences
Purpose: Illustrate how a team member’s perspective of time may influence the type (short-term or long-term) of strategy they prefer. Achieve balance between long-term and short-term perspectives on the Capsim team.
Activity: Consider your approach to the simulation game while you read each of the statements below. Place one “X” mark on a single point along each continuum that best describes where you feel most comfortable. Sum the total score for all four statements and compare your results with other team members.
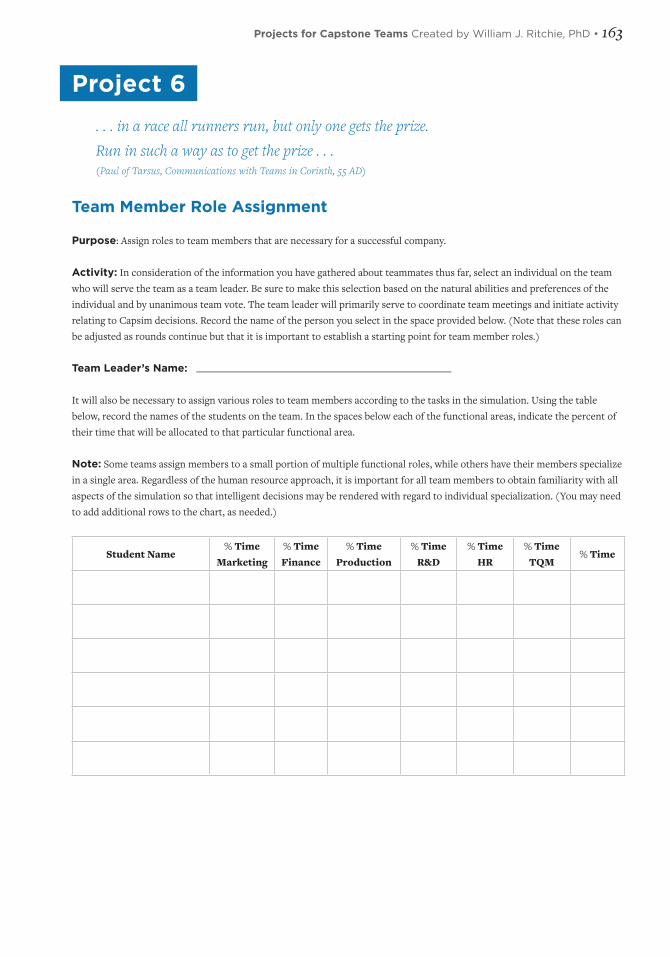
Projects for Capstone Teams Created by William J. Ritchie, PhD • 163
Project 6. . . in a race all runners run, but only one gets the prize.Run in such a way as to get the prize . . .(Paul of Tarsus, Communications with Teams in Corinth, 55 AD)
Team Member Role Assignment
Purpose: Assign roles to team members that are necessary for a successful company.
Activity: In consideration of the information you have gathered about teammates thus far, select an individual on the team who will serve the team as a team leader. Be sure to make this selection based on the natural abilities and preferences of the individual and by unanimous team vote. The team leader will primarily serve to coordinate team meetings and initiate activity relating to Capsim decisions. Record the name of the person you select in the space provided below. (Note that these roles can be adjusted as rounds continue but that it is important to establish a starting point for team member roles.)
Team Leader’s Name: ___________________________________________________
It will also be necessary to assign various roles to team members according to the tasks in the simulation. Using the table below, record the names of the students on the team. In the spaces below each of the functional areas, indicate the percent of their time that will be allocated to that particular functional area.
Note: Some teams assign members to a small portion of multiple functional roles, while others have their members specialize in a single area. Regardless of the human resource approach, it is important for all team members to obtain familiarity with all aspects of the simulation so that intelligent decisions may be rendered with regard to individual specialization. (You may need to add additional rows to the chart, as needed.)
Student Name% Time
Marketing% TimeFinance
% TimeProduction
% TimeR&D
% TimeHR
% TimeTQM
% Time

164 • Comprehensive Business Review Concepts and Cases with Capstone® Business Simulation
Project 7My View of Teams
Purpose: Explore variation in team members’ view of “teams.”
Activity: Some business tasks are too large for a single person to accomplish. The formation of teams can be an effective way to accomplish more complex problems. However, in order to maximize team performance, extra effort must be given to understanding other team members’ perspectives. Answer the questions below, and then discuss your answers with your teammates.
1. Why are teams often the preferred form for work accomplishment?
2. How can knowledge of teamwork help you in your personal life?
3. List three reasons why you or a team member may not like working with teams.
4. List some specific ways in which you will overcome the reasons you or a team member may not like working with teams.
5. Why is a team the preferred method of managing the Capsim company?

Projects for Capstone Teams Created by William J. Ritchie, PhD • 165
Project 8He knows the universe and does not know himself.(Jean de La Fontaine)
Biases in Decision-Making
Purpose: Illustrate potential team member bias in the selection of key performance indicators (KPIs).
Activity: Each individual team member is to review the latest round of your team’s performance information in the Capstone simulation. Read the following scenario and answer the question individually.
Question to be answered individuallyScenario: One of your instructors approaches you on campus and says:
“You are now familiar with several means to evaluate company performance. For example, companies use return on assets, stakeholders’ opinions, profit, etc. In your opinion, if you had to choose only one measure to evaluate the performance of your Capsim company, what is the single most important measure you would look at as a manager to determine whether your company was high performing or low performing?”
Write the definition of your selected measure here: _____________________________________________________
_____________________________________________________________________________________________________________
After you have answered the question mentioned above, record the answers of your teammates in the table below and answer the questions that follow.
Name Major Primary Performance Measure

166 • Comprehensive Business Review Concepts and Cases with Capstone® Business Simulation
1. What similarities do you observe among your team members’ answers?
2. What rationale can you give for the differences that exist? (e.g., background training)
3. Discuss with your team the varying views of performance, and identify three potential problems that this may create in managing your Capsim company. How does this knowledge change the way you view performance measurement in general?

Projects for Capstone Teams Created by William J. Ritchie, PhD • 167
ENVIRONMENTAL SCANNING
Project 9Time is that wherein there is opportunity, and opportunity is that wherein there is no great time.(Hippocrates, 460–357 BC)
It is not good to have zeal without knowledge, nor to be hasty and miss the way.(Solomon, 1000 BC)
External Environment Analysis
Purpose: Gain an understanding of applying environmental scanning to the simulation.
Activity: Review a mainstream strategic management text related to external environmental forces. The external environment of your company can be divided into the task environment (industry) and the societal environment (long-term trends such as technology, political/legal, socio-cultural, and economic forces). Identify opportunities and threats in each of these forces and record them in the tables below.
Table 1
Long-Term Forces
Domain Threat Opportunity Level of Importance
Technological
Socio-cultural
Political/Legal
Economic
Table 2
Porter’s Five Forces Model
Domain Degree of Threat (High, Medium, Low)
Bargaining power of buyers
Bargaining power of suppliers
Threat of new entrants
Substitute products
Rivalry among competing firms
Discuss the information in the tables above with your teammates and determine which forces are most relevant for your company. In the space below, craft a summary of where you believe the key opportunities exist in your industry.

168 • Comprehensive Business Review Concepts and Cases with Capstone® Business Simulation
Project 10In skating over thin ice, our safety is in our speed.(Ralph Waldo Emerson, 1841)
Plans fail for lack of counsel, but with many advisers they succeed.(Solomon, 950 BC)
Competitor Analysis Role Assignment
Purpose: Determine how competitor analysis will be undertaken by your team.
Activity: Successful Capsim companies have a process for evaluating their competition. It is best to assign specific roles to individuals to perform this task. Record in the table below the person or persons who will monitor the moves of your competition. Possible options include the following:
a. Full-time role of single team member is to monitor all markets and competitor moves.
b. Each person on the team is assigned a product segment to monitor.
c. Each person on the team is assigned another company to analyze.
d. A creative combination of the above.
Competitor Analysis
Market Andrews Baldwin Chester Digby Erie Ferris
Low-end
Traditional
High-end
Performance
Size

Projects for Capstone Teams Created by William J. Ritchie, PhD • 169
Project 11Make plans by seeking advice; if you wage war, obtain guidance. The plans of the diligent lead to profit as surely as haste leads to poverty.(Solomon, 950 BC)
Competitor Strategy Assessment
Purpose: Illustrate the practice of competitor analysis.
Activity: Review the Capstone simulation strategies (e.g., cost versus differentiation). Then review the Capstone Courier from the latest round and complete the following chart. Place an “X” in the markets where you believe a competitor is pursuing a differentiation strategy and an “O” in markets where you believe competitors pursue a cost strategy.
Market Andrews Baldwin Chester Digby Erie Ferris
Low-end
Traditional
Performance
High-end
Size
X = Differentiation O = Cost
1. Discuss with your team members how you might improve competitor analysis.
2. Given the information in this analysis, is your company’s current strategy appropriate?
3. How might you adapt your current strategy given the information in this analysis?
170 • Comprehensive Business Review Concepts and Cases with Capstone® Business Simulation
STRATEGY FORMULATION
Project 12Iron rusts from disuse; stagnant water loses its purity and in cold weather becomes frozen; even so does inaction sap the vigor of the mind.(Leonardo da Vinci, 1452–1519)
. . . therefore, I do not run like a man running aimlessly. I do not fight like a man beating the air . . .(Paul of Tarsus, Communications with Teams in Corinth, 55 AD)
Business Strategy Formulation
Purpose: Develop a business strategy.
Activity: Review Porter’s generic competitive strategies in your strategic management textbook and the Capsim website and discuss the following questions with your team.
According to Porter, there are two generally recognized competitive strategies. What are they?
Within these two strategies, there are two generally recognized means of approaching a given market. What are they?
Considering that there is a “product life cycle” within the simulation, what two strategies are possible with a product life cycle focus?
Discuss the various generic strategies with your team and determine a course of action for the competition rounds.
In a few sentences, articulate your company’s business-level strategy.

Projects for Capstone Teams Created by William J. Ritchie, PhD • 171
Project 13Half the money I spend on advertising is wasted, and the trouble is I don’t know which half.(Lord Leverhulme, 1851–1925)
Portfolio Strategy and the BCG Matrix
Purpose: Develop a corporate level strategy.
Activity: Using a strategy textbook or internet resources, review the basic assumptions of the Boston Consulting Group Matrix. Using the diagram below, label each axis on the graph with appropriate grow rates (See the Capstone Courier for the five market growth rates. Pick equal increments from 1% to 20%) and relative competitive position (product market share divided by the largest other competitor). Label the range for relative competitive position (left to right) from 10 to 0.1. Plot your company’s products in each of the four quadrants.
Relative Competitive Position
Growth Rate
20%
10%
10x 1.5 0.1

172 • Comprehensive Business Review Concepts and Cases with Capstone® Business Simulation
Questions for consideration:1. Assign the labels (Star, Cow,? , Dog) to each of the four quadrants.
2. In which quadrants do the majority of your products exist? Is there a relationship between the positioning of these products in the Matrix and the number of rounds that have been completed? Explain.
3. Based on this analysis, are there any products in your portfolio that should receive more/fewer resources? Explain.
4. Share your BCG Matrix with the others in the class. How does the placement of your company’s products compare with other companies in your industry?
5. Craft a corporate strategy that more accurately reflects your findings from this analysis.

Projects for Capstone Teams Created by William J. Ritchie, PhD • 173
Project 14. . . Now the body is not made up of one part but of many. If the foot should say, “Because I am not a hand, I do not belong to the body,” it would not for that reason cease to be part of the body. And if the ear should say, “Because I am not an eye, I do not belong to the body,” it would not for that reason cease to be part of the body. If the whole body were an eye, where would the sense of hearing be? If the whole body were an ear, where would the sense of smell be? . . . the eye cannot say to the hand, “I do not need you!” And the head cannot say to the feet, “I don’t need you!” . . . If one part suffers, every part suffers with it; if one part is honored, every part rejoices with it . . .(Paul of Tarsus, Communications with Teams in Corinth, 52–53 AD)
Functional Roles and Team Cohesion
Purpose: Evaluate individual team member perceptions of roles.
Individually: Consider the following primary functional areas of your company (R&D, Production, Finance, and Marketing). In the space below, draw a series of concentric circles that are representative of your perception of the importance of each of the functional areas on your team. Use only three sizes of circles—small, medium, and large. For example, if you feel that finance is more important to your firm’s management than marketing, you might put a larger outer circle (for finance) and a smaller (medium or small) circle in the center for marketing. Allow the circles to overlap each other for functional areas on your team that you believe are equal in importance. Be sure to label each of the concentric circles.
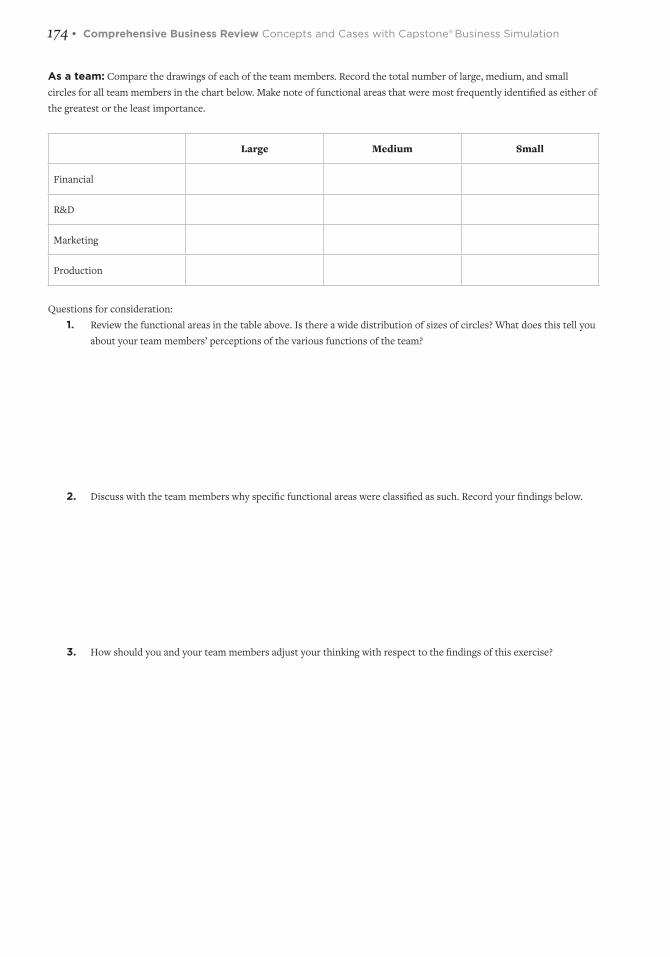
174 • Comprehensive Business Review Concepts and Cases with Capstone® Business Simulation
As a team: Compare the drawings of each of the team members. Record the total number of large, medium, and small circles for all team members in the chart below. Make note of functional areas that were most frequently identified as either of the greatest or the least importance.
Large Medium Small
Financial
R&D
Marketing
Production
Questions for consideration:1. Review the functional areas in the table above. Is there a wide distribution of sizes of circles? What does this tell you
about your team members’ perceptions of the various functions of the team?
2. Discuss with the team members why specific functional areas were classified as such. Record your findings below.
3. How should you and your team members adjust your thinking with respect to the findings of this exercise?
Projects for Capstone Teams Created by William J. Ritchie, PhD • 175
Project 15Listen to advice and accept instruction, and in the end you will be wise.(Solomon, 1000 BC)
We must learn to live together as brothers or perish together as fools.(Martin Luther King Jr., 1964)
Functional Strategy Formulation
Purpose: Develop a functional level strategy.
Develop a functional strategy in each of the following areas that supports your business strategy.
R&D:
Production:
HR/Labor:
Finance/Accounting:
Marketing:

176 • Comprehensive Business Review Concepts and Cases with Capstone® Business Simulation
Discussion with team:
1. Is the functional strategy specific enough to guide the team toward specific decisions?
2. Does the strategy in each of the functional areas clearly support the business and corporate strategies?
3. Have you “counted the cost” of the functional strategies? What are the opportunity costs of the selected course of action for each functional area?
4. What has been the overall benefit for your team in articulating a functional strategy?
5. Are the members of your team willing to work diligently within their functional areas and support the business and corporate strategies?
Projects for Capstone Teams Created by William J. Ritchie, PhD • 177
STRATEGY IMPLEMENTATION
Project 16Good order is the foundation of all good things.(Edmund Burke, 1790)
Identifying Your Company Structure
Purpose: Construct an organizational chart of your Capstone company.
Activity: (Working individually) Using a simple circles-and-sticks diagram, draw a model that reflects the structure for your Capstone simulation team in the space below. Be sure to include the names of the individuals on the team as well as their roles (functions) on the team. After you have completed your diagram, meet with other team members and compare structures. Agree upon the most accurate representation of your team structure and draw this structure in the second space provided below.
My view of our company structure:
Our agreed upon team structure:

178 • Comprehensive Business Review Concepts and Cases with Capstone® Business Simulation
Project 17Organizational Culture Assessment
Purpose: Illustrate how culture is measured in organizations as well as the impact of organizational culture on company performance outcomes, corporate mergers, and team dynamics.
Activity: Answer the pre-exercise questions below. Complete the survey instrument on the next page with your team (as a whole) in mind. Do not consult with other team members as you complete the survey.
1. Assume that you were permitted to acquire and integrate another team’s operations into your current company. What team would you acquire? Record the name of the team here: ___________________________________________________
2. Explain your reasoning for your selection of the team you identified in question one.
Note to the instructor: The recommended background reading for this project is:Ritchie, W. J., C. J. Fornaciari, S. A. Drew, and D. Marlin. 2012. “Team Culture and Business Strategy Simulation Performance.” Journal of Management Education, 37(5), pp. 601–622.
To prevent biasing of survey results, it is best that students do not review the article mentioned above prior to survey administration. I recommend administering the survey instrument after at least five rounds of play to allow for team cultures and Balanced Scorecard metrics to be established. If the students undertake a large number of practice rounds (as a team) prior to the “official” class competition, this can also serve as a suitable culture measurement opportunity. In this case, you might consider testing culture again later in the competition rounds to compare culture change following any interventions (e.g., organization development/change activities).
For best results in the team score comparisons, I recommend that you sum the individual team member scores (as opposed to calculating the team averages). This approach typically provides greater variance in team scores, often enhancing the classroom illustrations. To do this, you will need to determine the most common team size in the class and normalize all terms to this size (to ensure that the aggregate score for one team is calculated similarly across teams). For example, if the dominant team size in class is five members, you will need to adjust a team of six members down to five members by removing one member’s score. Likewise, with smaller teams, you will need to “add” a team member score. To do this, I generally add or subtract the team averages for each of the four culture dimensions to arrive at the target number of team members.
The following table can be replicated on the chalkboard or whiteboard for ease of team culture presentation. I generally have the students come to the whiteboard and complete this table as scores are calculated in class. Note that the column “Class Ranking” is simply the rank order of the team’s Balanced Scorecard score. The rank order typically provides a stark contrast of teams that are ranked either #1 or #2.
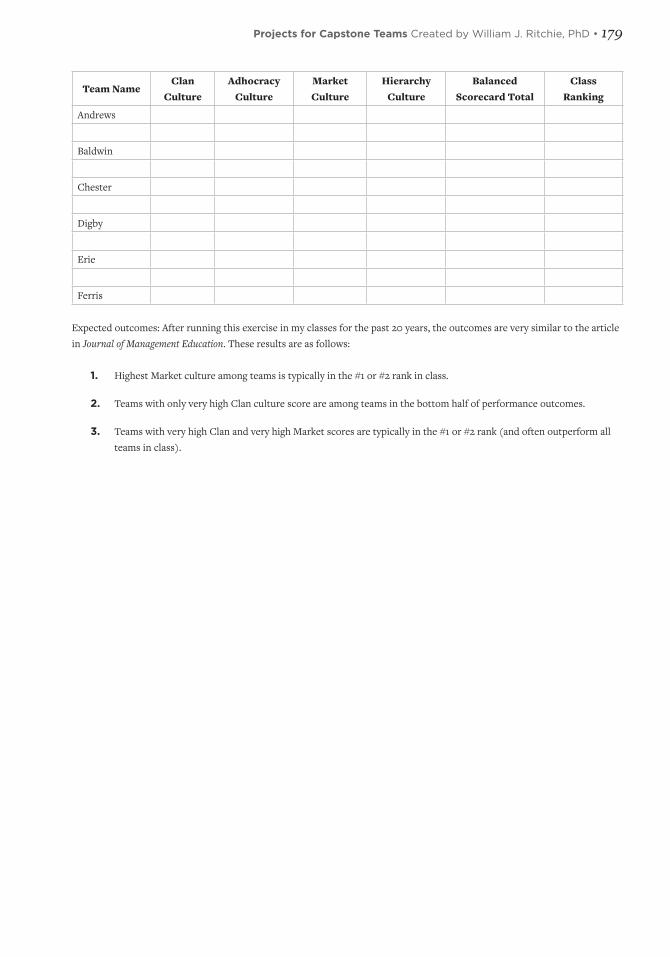
Projects for Capstone Teams Created by William J. Ritchie, PhD • 179
Team NameClan
CultureAdhocracy
CultureMarketCulture
Hierarchy Culture
Balanced Scorecard Total
ClassRanking
Andrews
Baldwin
Chester
Digby
Erie
Ferris Expected outcomes: After running this exercise in my classes for the past 20 years, the outcomes are very similar to the article in Journal of Management Education. These results are as follows:
1. Highest Market culture among teams is typically in the #1 or #2 rank in class.
2. Teams with only very high Clan culture score are among teams in the bottom half of performance outcomes.
3. Teams with very high Clan and very high Market scores are typically in the #1 or #2 rank (and often outperform all teams in class).

180 • Comprehensive Business Review Concepts and Cases with Capstone® Business Simulation
Directions: The items below describe characteristics of various organizations (teams). Please indicate the degree to which the characteristics are similar to the characteristics of your organization (team).
Most Similar
Neutral Least Similar
1The organization is a very personal place. It is like an extended family. People seem to share a lot of themselves.
5 4 3 2 1
2The organization is a very dynamic and entrepreneurial place. People are willing to stick their necks out and take risks.
5 4 3 2 1
3The organization is very results oriented. A major concern is with getting the job done. People are very competitive and achievement oriented.
5 4 3 2 1
4 The organization is a very controlled and structured place. Formal procedures generally govern what people do.
5 4 3 2 1
5The leadership in the organization is generally considered to exemplify mentoring, facilitating, or nurturing.
5 4 3 2 1
6 The leadership in the organization is generally considered to exemplify entrepreneurship, innovating, or risk taking.
5 4 3 2 1
7The leadership in the organization is generally considered to exemplify a no-nonsense, aggressive, results-oriented focus.
5 4 3 2 1
8The leadership in the organization is generally considered to exemplify coordinating, organizing, or smooth-running efficiency.
5 4 3 2 1
9The management style in the organization is characterized by teamwork, consensus, and participation.
5 4 3 2 1
10The management style in the organization is characterized by individual risk-taking, innovation, freedom, and uniqueness.
5 4 3 2 1
11The management style in the organization is characterized by hard-driving competitiveness, high demands, and achievement.
5 4 3 2 1
12The management style in the organization is characterized by security of employment, conformity, predictability, and stability in relationships.
5 4 3 2 1
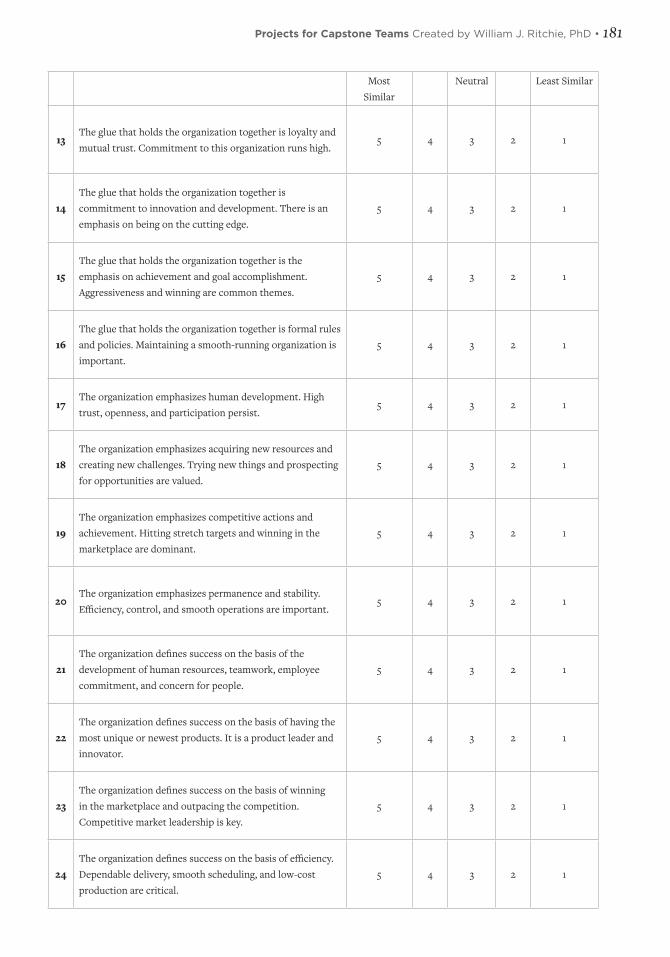
Projects for Capstone Teams Created by William J. Ritchie, PhD • 181
Most Similar
Neutral Least Similar
13The glue that holds the organization together is loyalty and mutual trust. Commitment to this organization runs high.
5 4 3 2 1
14The glue that holds the organization together is commitment to innovation and development. There is an emphasis on being on the cutting edge.
5 4 3 2 1
15The glue that holds the organization together is the emphasis on achievement and goal accomplishment. Aggressiveness and winning are common themes.
5 4 3 2 1
16The glue that holds the organization together is formal rules and policies. Maintaining a smooth-running organization is important.
5 4 3 2 1
17The organization emphasizes human development. High trust, openness, and participation persist.
5 4 3 2 1
18The organization emphasizes acquiring new resources and creating new challenges. Trying new things and prospecting for opportunities are valued.
5 4 3 2 1
19The organization emphasizes competitive actions and achievement. Hitting stretch targets and winning in the marketplace are dominant.
5 4 3 2 1
20The organization emphasizes permanence and stability.Efficiency, control, and smooth operations are important.
5 4 3 2 1
21The organization defines success on the basis of the development of human resources, teamwork, employee commitment, and concern for people.
5 4 3 2 1
22The organization defines success on the basis of having the most unique or newest products. It is a product leader and innovator.
5 4 3 2 1
23The organization defines success on the basis of winning in the marketplace and outpacing the competition. Competitive market leadership is key.
5 4 3 2 1
24The organization defines success on the basis of efficiency. Dependable delivery, smooth scheduling, and low-cost production are critical.
5 4 3 2 1

182 • Comprehensive Business Review Concepts and Cases with Capstone® Business Simulation
Organizational Culture Worksheet
Directions: Record your individual scores for each of the questionnaire items in the table below.
Clan Adhocracy
Item # Score Item # Score
1 2
5 6
9 10
13 14
17 18
21 22
Total Total
Market Hierarchy
Item # Score Item # Score
3 4
7 8
11 12
15 16
19 20
23 24
Total Total
In the spaces below, record the total score for your team for each of the four organizational culture dimensions.(Note: Your instructor will tell you how many individuals to count in computing the total score. It is important that all teams sum the same number of individual scores so that meaningful comparisons can be made between teams.)Number of team members present:
Team Totals
Clan
Adhocracy
Market
Hierarchy
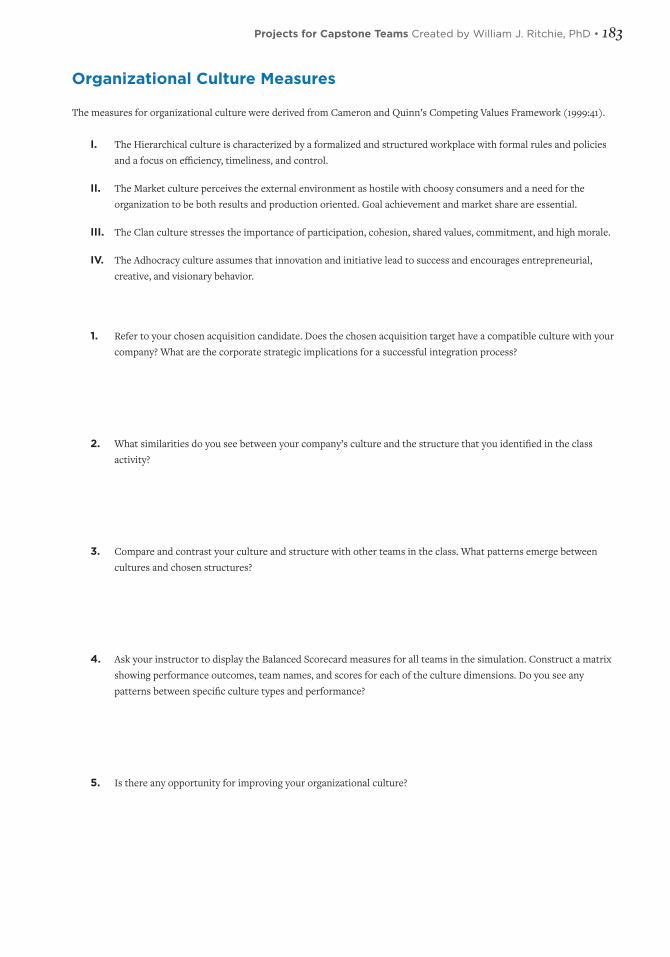
Projects for Capstone Teams Created by William J. Ritchie, PhD • 183
Organizational Culture Measures
The measures for organizational culture were derived from Cameron and Quinn’s Competing Values Framework (1999:41).
I. The Hierarchical culture is characterized by a formalized and structured workplace with formal rules and policies and a focus on efficiency, timeliness, and control.
II. The Market culture perceives the external environment as hostile with choosy consumers and a need for the organization to be both results and production oriented. Goal achievement and market share are essential.
III. The Clan culture stresses the importance of participation, cohesion, shared values, commitment, and high morale.
IV. The Adhocracy culture assumes that innovation and initiative lead to success and encourages entrepreneurial, creative, and visionary behavior.
1. Refer to your chosen acquisition candidate. Does the chosen acquisition target have a compatible culture with your company? What are the corporate strategic implications for a successful integration process?
2. What similarities do you see between your company’s culture and the structure that you identified in the class activity?
3. Compare and contrast your culture and structure with other teams in the class. What patterns emerge between cultures and chosen structures?
4. Ask your instructor to display the Balanced Scorecard measures for all teams in the simulation. Construct a matrix showing performance outcomes, team names, and scores for each of the culture dimensions. Do you see any patterns between specific culture types and performance?
5. Is there any opportunity for improving your organizational culture?

184 • Comprehensive Business Review Concepts and Cases with Capstone® Business Simulation
Project 18A fool vents all his feelings, But a wise man holds them back.Whoever has no rule over his own spirit is like a city broken down, without walls.(Solomon, 1000 BC)
Individual Culture Preference
Purpose: To illustrate the importance and influence of cultural orientation on organizations. Three of Hofstede’s culture dimensions are measured: Collectivism, Uncertainty Avoidance, and Power Distance.
Activity: This survey is to be completed on an individual basis. Think about your own, personal preferences when responding to the statements in the items below. Record your responses in the table on the next page.

Projects for Capstone Teams Created by William J. Ritchie, PhD • 185
Culture Preference
Strongly Agree
Agree Neutral Disagree Strongly Disagree
11Individuals may be expected to give up their goals in order to benefit group success.
5 4 3 2 1
12Managers should make most decisions without consulting subordinates.
5 4 3 2 1
13It is frequently necessary for a manager to use authority and power when dealing with subordinates.
5 4 3 2 1
14 Managers should seldom ask for the opinions of employees. 5 4 3 2 1
15Managers should avoid off-the-job social contacts with employees.
5 4 3 2 1
16 Employees should not disagree with management decisions. 5 4 3 2 1
17Managers should not delegate important tasks to employees.
5 4 3 2 1
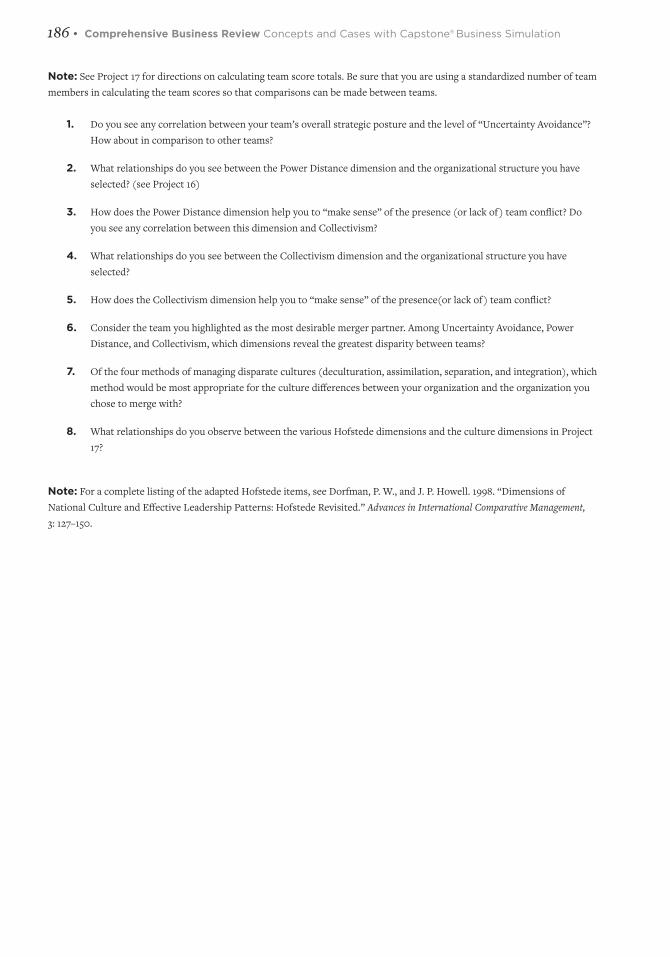
186 • Comprehensive Business Review Concepts and Cases with Capstone® Business Simulation
Note: See Project 17 for directions on calculating team score totals. Be sure that you are using a standardized number of team members in calculating the team scores so that comparisons can be made between teams.
1. Do you see any correlation between your team’s overall strategic posture and the level of “Uncertainty Avoidance”? How about in comparison to other teams?
2. What relationships do you see between the Power Distance dimension and the organizational structure you have selected? (see Project 16)
3. How does the Power Distance dimension help you to “make sense” of the presence (or lack of) team conflict? Do you see any correlation between this dimension and Collectivism?
4. What relationships do you see between the Collectivism dimension and the organizational structure you have selected?
5. How does the Collectivism dimension help you to “make sense” of the presence(or lack of) team conflict?
6. Consider the team you highlighted as the most desirable merger partner. Among Uncertainty Avoidance, Power Distance, and Collectivism, which dimensions reveal the greatest disparity between teams?
7. Of the four methods of managing disparate cultures (deculturation, assimilation, separation, and integration), which method would be most appropriate for the culture differences between your organization and the organization you chose to merge with?
8. What relationships do you observe between the various Hofstede dimensions and the culture dimensions in Project 17?
Note: For a complete listing of the adapted Hofstede items, see Dorfman, P. W., and J. P. Howell. 1998. “Dimensions of National Culture and Effective Leadership Patterns: Hofstede Revisited.” Advances in International Comparative Management, 3: 127–150.

Projects for Capstone Teams Created by William J. Ritchie, PhD • 187
EVALUATION AND CONTROL
Project 19Welcome to the Annual Sensor Industry Consortium “Best Practices”
Held on the campus of: ________________________________________________
Schedule of Events:Welcome, Introductions
Andrews Company: 5 minutes
Baldwin Company: 5 minutes
Chester Company: 5 minutes
Digby Company: 5 minutes
Erie Company: 5 minutes
Ferris Company: 5 minutes
Q&A: 15 minutes, time permitting
The purpose of the Sensor Industry Consortium is to facilitate communication among industry manufacturers in an effort to improve the industry’s overall image and competitiveness in the global marketplace. Prepare a brief discussion covering each of the points below. The Capstone Courier results will be available for your use during your presentation. Presentation must be completed within the allotted five minutes.
1. Evaluation of competitor performance: Identify one key issue with each of the competing firms in the sensor industry (e.g., lacking performance, efficiency) and suggest a solution for correction.
2. Communication of “best practices” by your company: Describe three items that your company is doing well and explain why.
3. Identify three things that you would have done differently given the opportunity to start the practice rounds over again.
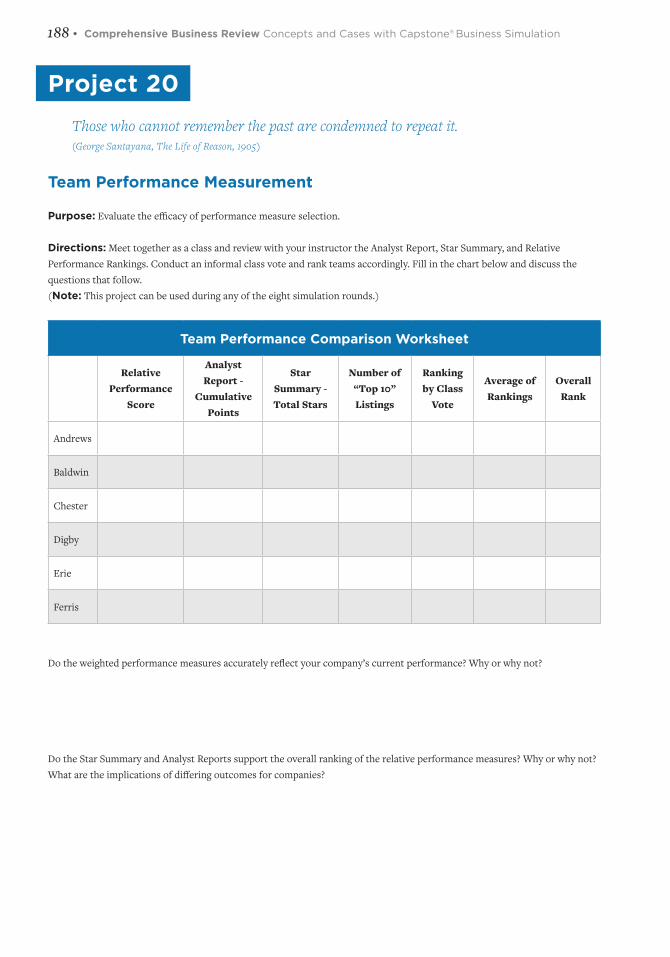
188 • Comprehensive Business Review Concepts and Cases with Capstone® Business Simulation
Project 20Those who cannot remember the past are condemned to repeat it.(George Santayana, The Life of Reason, 1905)
Team Performance Measurement
Purpose: Evaluate the efficacy of performance measure selection.
Directions: Meet together as a class and review with your instructor the Analyst Report, Star Summary, and Relative Performance Rankings. Conduct an informal class vote and rank teams accordingly. Fill in the chart below and discuss the questions that follow.(Note: This project can be used during any of the eight simulation rounds.)
Team Performance Comparison Worksheet
Relative Performance
Score
Analyst Report -
Cumulative Points
Star Summary - Total Stars
Number of “Top 10” Listings
Ranking by Class
Vote
Average of Rankings
Overall Rank
Andrews
Baldwin
Chester
Digby
Erie
Ferris
Do the weighted performance measures accurately reflect your company’s current performance? Why or why not?
Do the Star Summary and Analyst Reports support the overall ranking of the relative performance measures? Why or why not? What are the implications of differing outcomes for companies?

Projects for Capstone Teams Created by William J. Ritchie, PhD • 189
Do the measures accurately reflect the “future potential” for your company’s performance? Why or why not?
If you could reset the weights and measures, how would you change your measures?
Describe one situation where your company utilized “benchmarking” during the simulation?
What are some benefits and limitations to benchmarking?

190 • Comprehensive Business Review Concepts and Cases with Capstone® Business Simulation
Project 21Performance Measurement Issues
Purpose: To understand basic issues associated with measuring performance.
Directions: Consider all the previous rounds that you have completed. Answer the following questions with your team.
1. What are some of the benefits of using financial performance measures?
2. What are some of the difficulties with using financial performance measures?
3. What are some specific ways in which financial performance measures can be manipulated?
4. What are some problems with using more qualitative measures of performance?
5. Can qualitative measures be manipulated?
6. How might you construct a Balanced Scorecard measure of your own firm?
7. What are some practical difficulties with implementing the Balanced Scorecard approach?
The following list includes critical success measures identified by teams who have competed in the simulation during past semesters. Add additional measures to the list and rank the measures in order of what you believe to be their level of importance in predicting team performance in the future.
_____ Knowledge of game mechanics
_____ Team communication
_____ Strategy selection
_____ Success measure selection
_____
_____
_____
_____
_____
_____

Projects for Capstone Teams Created by William J. Ritchie, PhD • 191
Project 22As iron sharpens iron, so one man sharpens another.The way of a fool seems right to him, but a wise man listens to advice.(Solomon, 1000 BC)
Simulation Debrief
Purpose: Evaluation of learning outcomes in the class.
Discuss how you felt about the simulation at the beginning of the semester.
Discuss how the feelings about the simulation changed over the course of the semester.
What was the most difficult simulation issue you faced during the semester?
Discuss how the performance (year to year) of your competitors in the industry impacted your motivation to perform in the Simulation.
What was the most difficult aspect of working with your team this semester?
List one characteristic that you have learned about yourself in the context of working with a team this semester?
If you could change one aspect of the way in which you treated team members this semester, what would you change?
Describe the type of personality that you feel is the most difficult for you to work with?
On a scale of 1 to 10, how would you rank your team’s level of “cohesiveness”?

192 • Comprehensive Business Review Concepts and Cases with Capstone® Business Simulation
PRESENTATION EVALUATION FORMS
Appendix ASimulation Presentation Content Evaluation
Criteria Low 0–3 Medium 4–6 High 7–10 Total
Initial strategy pursued
Little clarity to explanation of strategy.
A strategy is discernable from description.
Clearly articulated, codified strategy.
Explanation of key decisions to accomplish strategy
Team demonstrated weak understanding of game decisions necessary to accomplish desired strategy.
Team demonstrated knowledge of game decisions necessary to accomplish desired strategy.
Team demonstrated mastry of game decisions necessary to accomplish strategy.
Overview of performance and key operating outcomes
Lack of clarity in explanation of operations and performance outcomes.
Team demonstrated knowledge of operating outcomes, clearly articulated an understanding of performance outcomes.
Demonstrated mastry of understanding of performance/operating outcomes.
Team dynamics Lack of explanation/understanding of team interactions with no assessment of cohesiveness.
Description of team interactions using value judgments, either positive or negative relating to cohesiveness.
Description of team interactions using class models such as Hofstede, Cameron & Quinn, Myers Briggs.
Team structure No mention of team structure.
Brief description of structure.
Graphic of structure with a logical explanation of rationale behind chosen structure.
Key competitors Mention of key competitors only.
Mention of key competitors and some explanation of a rubric for identifying competitors.
Mention of key competitors and detail analysis of competitors such as market share, and other rivalry factors.
Jolts to strategy No mention of jolts. Mention of one or two jolts.
Mention of multiple industry jolts to strategy and reactions.
Lessons learned Few lessons with little relevance mentioned.
Two or three lessons mentioned.
Multilple lessons with mention of how they could have improved overall performance.
Total
Additional Comments:

Projects for Capstone Teams Created by William J. Ritchie, PhD • 193
PRESENTATION EVALUATION FORMS
Appendix ASimulation Presentation Content Evaluation
Criteria Low 0–3 Medium 4–6 High 7–10 Total
Initial strategy pursued
Little clarity to explanation of strategy.
A strategy is discernable from description.
Clearly articulated, codified strategy.
Explanation of key decisions to accomplish strategy
Team demonstrated weak understanding of game decisions necessary to accomplish desired strategy.
Team demonstrated knowledge of game decisions necessary to accomplish desired strategy.
Team demonstrated mastry of game decisions necessary to accomplish strategy.
Overview of performance and key operating outcomes
Lack of clarity in explanation of operations and performance outcomes.
Team demonstrated knowledge of operating outcomes, clearly articulated an understanding of performance outcomes.
Demonstrated mastry of understanding of performance/operating outcomes.
Team dynamics Lack of explanation/understanding of team interactions with no assessment of cohesiveness.
Description of team interactions using value judgments, either positive or negative relating to cohesiveness.
Description of team interactions using class models such as Hofstede, Cameron & Quinn, Myers Briggs.
Team structure No mention of team structure.
Brief description of structure.
Graphic of structure with a logical explanation of rationale behind chosen structure.
Key competitors Mention of key competitors only.
Mention of key competitors and some explanation of a rubric for identifying competitors.
Mention of key competitors and detail analysis of competitors such as market share, and other rivalry factors.
Jolts to strategy No mention of jolts. Mention of one or two jolts.
Mention of multiple industry jolts to strategy and reactions.
Lessons learned Few lessons with little relevance mentioned.
Two or three lessons mentioned.
Multilple lessons with mention of how they could have improved overall performance.
Total
Additional Comments:
Appendix B
Strategy Presentation Evaluation
Team Name: ______________________________________________________________________________________________
Criteria Low 0–3 Medium 4–6 High 7–10 Total
Organization
Audience cannot understand presentation because there is no sequence of information.
Team presents information in logical sequence that audience can follow.
Team presents information in logical, interesting sequence that audience can follow.
Content
Team does not have grasp of information; team cannot answer questions about subject.
Team is at ease with content but fails to elaborate.
Team demonstrates full knowledge with explanations and elaboration.
Quality of visuals Team used no visuals.Team occasionally used visuals that support text and presentation.
Team used role play or other creative means to reinforce screen text and presentation.
Voice quality and pace
Team mumbles, incorrectly pronounces terms, and speaks too quietly for teams in the back of class to hear.
Team’s voice is clear. Team pronounces most words correctly.
Team used a clear voice and correct, precise pronunciation of terms enhanced presentation.
Body language (of presenter)
No movement or descriptive gestures.
Very little movement or descriptive gestures.
Movements seemed fluid and helped the audience visualize.
Body language (of other team members during presentation)
Distracting, poor posture, and not focused on speaker.
Not distracting from presentation.
Enhanced overall presentation by focusing on speaker and affirmative gestures.
Total

194 • Comprehensive Business Review Concepts and Cases with Capstone® Business Simulation
Appendix C
Positive and Negative Team Attributes
There are a wide variety of factors that impact the success of teams. The statements below were collected from various Capstone teams. Place a check next to the statements that your team is experiencing. Add any additional statements that may be appropriate. Devise a plan to address the negative items.
Positive: Ɍ Worked through ALL tutorials on Capsim.com
Ɍ Completed the individual practice rounds as well as team practice rounds
Ɍ Always notified team of changes in decisions
Ɍ Team assigned a team coordinator
Ɍ Communication with team members
Ɍ Shared different views of case issues
Ɍ Mutually agreed upon meeting times
Ɍ Listened to the diversity of opinions from different majors on the team
Ɍ Enthusiasm about projects
Ɍ Personalities of team members balance each other
Ɍ Overall team cohesion
Ɍ Retention of some form of guiding strategy throughout the game
Ɍ Investment in fixed assets and new products early in game
Negative: Ɍ No goals timeline and assignment of duties
Ɍ Waited until last minute to assemble the final decisions
Ɍ Geographic distance between team members and no plan of communication
Ɍ Some team members positioned the team as a low priority
Ɍ “Lone Ranger” team members
Ɍ Lack of team diversity
Ɍ Only a minority of team members performed most of the work
Ɍ Meeting times were a low priority
Ɍ Not able to segment work among team members
Ɍ Slow email turnaround from team members