compressed n atural gas feasibility study
TRANSCRIPT

FINAL REPORT March 15, 2016
Compressed Natural Gas
Feasibility Study
Capital Area Transit
4104 Poole Rd, Raleigh, NC 27610
1

GoRaleigh Transit - Compressed Natural Gas Feasibility Study
TITLE SECTION
Executive Summary 1
Introduction 2
Background 3
A. Vehicle Capital Costs
B. Facility Retrofit Analysis
C. Fueling Station Analysis
D. Diesel Fuel and Natural Gas Cost
E. CNG Diesel Gallon Equivalent (DGE) Cost
F. Raleigh Public Utility Biomethane Production
G. CNG Training and Maintenance
H. Environmental Impacts
Findings
4
A. Project Costs and Savings
B. Cash Flow / Net Present Values
Conclusion 5
Appendix: 6
Estimates of Probable Cost, CNG Station and Facility Upgrades
Fleet Replacement and Financial Analysis Scenarios
Proposed layout For CNG Compound and Fuel Island Improvements
2

Section 1
Executive Summary
3

Section 1 - Executive Summary
WENDEL | GoRaleigh Transit CNG Feasibility Study
Raleigh, North Carolina Section 1 - 1
Wendel was hired to provide a compressed natural gas (CNG) feasibility study for GoRaleigh
Transit. GoRaleigh has an interest in moving the current and a potentially expanding fixed
route fleet from B5 biodiesel to CNG operations. The study provides an overview of the
environmental benefits and the upfront and long term financial impacts of upgrading
maintenance and fueling facilities and transitioning the fleet to CNG operations.
The decision to purchase compressed natural gas (CNG) transit vehicles can be based on a
variety of financial, environmental, and political issues. A number of issues are reviewed in
this report including the examination of:
1. Added Costs of Purchasing CNG vehicles
2. Potential Costs for Retrofitting Facilities
3. Construction and Operating Costs of a CNG Fueling Station
4. Fuel Cost Savings of CNG versus B5 Biodiesel
5. Training and Maintenance Requirements for CNG Vehicles
6. Environmental Impacts of Utilizing CNG Vehicles
7. Financial Analysis and Feasibility of the Overall CNG Project
Conversion of the GoRaleigh transit fleet to CNG operations provides positive environmental
benefits and cost savings. The cost effectiveness will vary over the long term and is
dependent on fuel prices and the number of replacement and potential expansion vehicles
purchased for dedicated CNG operations.
The estimated upfront costs required to implement the CNG program include:
Maintenance Facility Retrofits and Upgrades - $283,872
New CNG Fueling Station and Fuel Island Upgrades - $4,707,538
The 20 year projected fuel savings operating buses on CNG versus B5 Biodiesel:
$54,370,095
Prior to 2008, CNG prices tracked consistently with crude oil prices. However, the relative
price of CNG effectively “decoupled” and began to trade independently from crude oil prices
beginning in mid-2008. The acknowledgement of vast national gas resources, new and
effective means of gas extraction, and large available domestic supply have helped in
holding CNG prices stable in the face of volatile prices in crude oil markets. Together with a
4

Section 1 - Executive Summary
WENDEL | GoRaleigh Transit CNG Feasibility Study
Raleigh, North Carolina Section 1 - 2
growing trend to reduce dependence on foreign oil and sustainability initiatives that support
environmental protection and stewardship, the popularity of CNG as an alternative fuel
source for transportation continues to gain momentum. Based upon recent projections
through 2040, the U.S. EIA projects natural gas prices will continue to remain less expensive
than gasoline or diesel fuel. Despite the current low retail gasoline and diesel prices in the
United States, CNG’s projected price stability and lower escalation of cost has the potential
to further increase the savings demonstrated in this analysis.
The study examines the potential fuel cost savings of using natural gas as compared to
equivalent biodiesel operations over a twenty (20) year period of financial analysis.
Separate cost benefit scenarios are presented for regular fleet replacement and potential
expansion for the Wake County plan. During the 2018-2037 period of the feasibility study,
the analysis evaluates the cost effectiveness of GoRaleigh Transit investing in CNG vehicles,
necessary CNG facility upgrades, and the cost of a new CNG fueling station.
During the 20 year period of the study and based on the cost benefit scenarios:
The amount of B5 biodiesel estimated to be displaced by CNG fuel is:
o 11,968,600 gallons for the 79 buses from the current fleet
o 16,201,900 gallons for the 92 local service expansion buses
o 5,273,600 gallons for the 32 Bus Rapid Transit (BRT) expansion buses
The accumulated differential fuel cost savings of operating CNG versus B5 biodiesel is
estimated to be:
o $19,789,905 replacing 79 buses from the current fleet from 2018-2028
o $25,957,854 implementing 92 local service expansion buses from 2018-2025
o $8,622,336 implementing 32 BRT expansion buses starting in 2022
The initial increased cost of purchasing CNG buses is estimated to be:
o $3,634,000 for the 79 buses from the current fleet
o $4,232,000 for the 92 local service expansion buses
o $1,472,000 for the 32 BRT expansion buses
Based on the cost savings of CNG fuel versus B5 biodiesel, the initial simple payback
period on the $46,000 increased capital cost of a CNG bus is estimated to be 3 years
and 9 months.
5

Section 1 - Executive Summary
WENDEL | GoRaleigh Transit CNG Feasibility Study
Raleigh, North Carolina Section 1 - 3
The recommended CNG fueling station compressor systems are considered to meet the
anticipated CNG usage required for conversion of the current fleet as well as expansion of
the fleet up to a total of 200 vehicles. Facility upgrade requirements for CNG vehicle
operations and maintenance are examined. Estimates of probable cost are provided for the
proposed CNG station, fueling island upgrades, and facility upgrades.
Carrying out all of the recommended fueling and facility upgrade options, and dedicating all
planned future transit bus purchases to CNG operations during the period of 2018 through
2037 provides an internal rate of return of 17.6% and net present value savings of
$23,815,603 when compared to equivalent B5 biodiesel operations. Examining the
separate components of the conversion to CNG individually provides:
An internal rate of return of 8.5% and net present value savings of $5,580,764
when comparing 79 CNG buses from the current fleet with equivalent B5 biodiesel
operations
An internal rate of return of 11.4% and net present value savings of $8,953,946
when comparing 92 local service expansion buses with equivalent B5 biodiesel
operations
An internal rate of return of 13.9% and net present value savings of $13,483,943
when comparing both the 92 local service and 32 Bus Rapid Transit (BRT) or a total
of 124 expansion buses with equivalent B5 biodiesel operations.
Natural gas is one of the cleanest burning of all fossil fuels. The positive environmental
aspects of conversion to CNG are substantial. Each heavy duty CNG transit bus operated on
CNG eliminates an average of 10,300 gallons of B5 biodiesel annually. Replacing this with
natural gas, the net impact is an annual reduction of 20 metric tons of Carbon Dioxide (CO2)
per bus. Over the life of the 20 year study period, dedicating all planned future transit bus
purchases to CNG operations results in displacement of 33,444,100 gallons of B5 biodiesel
resulting in a net Greenhouse Gas Emissions reduction of 64,760 metric tons of CO2.
The annual reduction of 64,760 metric tons of CO2 is equivalent to the annual greenhouse
gas emissions (GHGE’s) from 23,211 tons of waste sent to the landfill, the CO2 emissions
from 69,559,613 pounds of coal burned, the electricity use for 8,908 homes for a year, or
the carbon sequestered by 1,660,513 tree seedlings grown for 10 years.
6

Section 2
Introduction
7

Section 2 - Introduction
WENDEL | GoRaleigh Transit CNG Feasibility Study
Raleigh, North Carolina Section 2 - 1
GoRaleigh Transit is exploring the utilization of Compressed Natural Gas (CNG) vehicles for
city bus operations. This report examines a variety of issues involved in transitioning the
heavy duty transit vehicle fleet from B5 biodiesel to CNG. The study primarily focuses on the
financial impacts of purchasing new replacement CNG buses for the current fixed route fleet
and for the potential expanded transit fleet that may be purchased as a result of a Wake
County transportation sales tax initiative. The feasibility of transitioning the light duty
paratransit fleet to CNG is not included in this report. The primary vehicle financial impacts
are with the added cost of the CNG engines, fuel systems, and storage tanks. Changes in
maintenance practices and suggested CNG training requirements are included.
Some of the initial up front capital investments in CNG can be sizable, but in most cases can
be considered a one-time expense. If you’re building a costly fueling station such as that for
CNG, this cost can be amortized or depreciated into the price of the fuel. This report
provides the opinions of probable cost of a potential fueling station and examination of
current and future projected fuel costs. Requirements and opinions of probable cost for
recommended CNG facility upgrades are provided for the maintenance facility at 4104 Poole
Road.
It is important to bear in mind when reading this report that the net present value of
estimated annual cash flows and investment internal rates of return figures used are net
differences in operating biodiesel vehicles compared to CNG vehicles. Included are the
extra incremental capital investments in new CNG vehicles, facility improvements, and a
new fueling station. Since CNG costs vary by region, this analysis focused on North Carolina.
Environmental impacts of CO2 for CNG versus B5biodiesel are also analyzed.
8

Section 3
Background
9

Section 3 - Background
WENDEL | GoRaleigh Transit CNG Feasibility Study
Raleigh, North Carolina Section 3 - 1
A number of issues need to be addressed when transitioning a fleet from traditional fuels to
compressed natural gas. The following areas were addressed in the study:
A. Added Vehicle Capital Cost for CNG
B. Costs for Retrofitting Facilities
C. CNG Fueling Station Analysis
D. Diesel Fuel and Natural Gas Costs
E. CNG Diesel Gallon Equivalent (DGE) Cost
F. Training and Maintenance Requirements
G. Environmental Impacts of CO2 Utilizing CNG vehicles
A. Vehicle Capital Costs
The GoRaleigh transit fixed route fleet is comprised of approximately 100 fixed route buses.
The fleet consists primarily of 40 foot diesel buses and also includes 3 – 2008 diesel hybrid
electric buses. Because of the substantial additional costs of vehicle storage tanks and fuel
systems, good candidate vehicles for CNG operations should have long replacement cycles
along with high annual mileage and/or high annual fuel usage to achieve satisfactory return
on investment through differential fuel savings. Where public fueling is not available,
substantial added fueling infrastructure costs further challenge the case for adequate
payback on the upfront investments. More than 40 GoRaleigh vehicles consume between
11,000 – 13,000 gallons of diesel annually. Overall the GoRaleigh transit service fleet
conservatively averages 10,300 gallons of diesel fuel use per bus annually. Because of the
level of fuel consumption, the system’s large transit vehicle fleet is an excellent candidate
for CNG operations.
For the purposes of the financial scenario, Table I lists the fleet schedule used for 1) the
current transit fleet replacements, 2) the projected expansion schedule for additional local
bus service, 3) the projected 32 bus expansion for the Western Boulevard, New Bern
Avenue, Capital Boulevard, and Wilmington Street Bus Rapid Transit Corridors.
10

Section 3 - Background
WENDEL | GoRaleigh Transit CNG Feasibility Study
Raleigh, North Carolina Section 3 - 2
Table I. Fleet Replacement and Expansion Projections
Fiscal Year Regular Fleet Expansion Fleet Bus Rapid
Transit
2018 1 17
2019 15
2020 18 13
2021 19 12
2022 9 32
2023 7 10
2024 2 8
2025 8
2026 21
2027
2028 11
The price differential for a new Gillig CNG bus with a 155 diesel gallon equivalent (DGE) CNG
tank system and a Cummins ISL-G natural gas engine is estimated to be $46,000 for the
purpose of this study. This configuration is dedicated CNG operation. Cost figures were
verified through a comparison of bid sources including the current GoRaleigh bus supplier
Gillig Corporation of California.
The financial scenario period of the study extends to 2037. With an assumed bus lifecycle
of 12 years, additional CNG vehicles upcharge costs are allocated in 2029 through 2037 for
assumed future replacements of the CNG buses listed in Table I.
11

Section 3 - Background
WENDEL | GoRaleigh Transit CNG Feasibility Study
Raleigh, North Carolina Section 3 - 3
B. Facility Retrofit Analysis
Evaluating the cost to retrofit existing
buildings where CNG vehicles may be
maintained and stored is an important
element of the study. This section of
the report provides our code review
analysis, design options and opinion of
cost for the building system upgrades
required and recommended for CNG
vehicles. The facilities were evaluated
to determine if the current HVAC
systems meet the ventilation
requirement of the building code. The
Heating, Ventilating and Air Conditioning (HVAC) systems were evaluated concerning the
potential exposure to CNG vehicles along with the associated electrical upgrades required.
Three facilities were identified by city staff for examination for CNG operations. The
Maintenance Garage, Fueling Area, and Bush Wash facility all located at 4104 Poole Road
were examined. No retrofit should be required for the bus wash facility.
1. Maintenance Facility
The existing maintenance garage has very few items that need to be modified to become
compliant for servicing CNG vehicles. It is understood that this garage will provide ‘major
maintenance’ as defined by NFPA 30A. Major maintenance is a building or portions of a
building where major repairs, such as engine overhauls, painting, body and fender work, and
repairs that require draining of the motor vehicle fuel tank, are performed on motor vehicles
including associated floor space used for offices, break rooms, parts rooms, etc.
The existing ventilation/exhaust system consists of four (4), 16,000 cfm, roof mounted
exhaust fans that are interconnected with louvers along the walls. Currently the louvers
open and the exhaust fans run when the building is between heating and cooling. There is
also an override switch to engage this system if the space needs to be exhausted for
Looking down the center of the maintenance
garage; fully heated and cooled with a
geothermal system.
12

Section 3 - Background
WENDEL | GoRaleigh Transit CNG Feasibility Study
Raleigh, North Carolina Section 3 - 4
whatever reason. We recommend maintaining these two options and integrating in a gas
detection system as well, so if methane was detected in the space, the louvers will open and
the exhaust fans will start.
The existing exhaust fans do not meet the intent of the code for use with CNG, and the fans
themselves are not suitable for a flammable gas. This requires replacing the four (4)
exhaust fans with aluminum, up-blast style exhaust fans with explosion proof motors located
outside of the airstream. These fans will be sized to provide 1 CFM of exhaust air per 12
cubic feet of room area. This is the minimum requirement per NFPA 52 to purge methane
from the space. This will decrease the overall amount of air being exhausted so there will be
no electrical impact on the system.
The duct stub penetrating through the roof currently drops to a distance of 24” below the
deck. For methane applications the requirement is to exhaust within the top 18” of the
space, so the existing duct stubs will be removed and should be re-worked to exhaust from a
point nearly flush with the bottom side of the roof deck.
A gas detection system will be required throughout the existing maintenance garage to
monitor and detect methane levels within the top 18” of the space. This system will be
interlocked with an emergency exhaust system so upon detection of a predetermined level
of methane, the louvers open, exhaust fans start and the space is purged. Additionally, the
rooftop units supplying air to this space will shut down.
The existing light fixtures were investigated and found to be vented, so rising gas cannot be
trapped within the fixture housing, making the fixtures code compliant. All conduit passing
through the top 18 inches of the space was verified to already have seal-off fittings to meet
the intent of the code for CNG.
According to architectural plans, the existing wall between the repair bays and front office
suite calls for a one hour rated fire wall with all penetrations appearing to be properly fire-
rated. Wendel recommends this wall be a 2-hour rated assembly. Wendel investigated the
makeup of the precast panel walls with manufacturer Tindal Corporation. Based on the
13

Section 3 - Background
WENDEL | GoRaleigh Transit CNG Feasibility Study
Raleigh, North Carolina Section 3 - 5
actual construction of the pre-cast concrete wall, it was verified the wall already has the
make-up of a two-hour rated fire wall. The same issue exists with the current precast
concrete wall between the maintenance repair bays, 2nd floor parts storage mezzanine, and
mechanical room. Based on the actual construction of the pre-cast concrete wall, it was
verified that this wall also already has the make-up of a two-hour rated fire wall. There is a
need to seal all of the ductwork and conduit penetrations with 2-hour fire stopping and
sealing on this wall. The caulking used between all the precast panel joints on both walls
will need to be investigated. There may be a need to remove and reinstall new caulking if it
is not found to have at least a two hour fire rating.
It is also recommended to install a two-hour fire rated partition between the maintenance
repair bays and the corridor leading to the back maintenance offices, parts room, and
locker/break room. This will eliminate the need to classify this portion of the building. A
double door large enough to fit a forklift through could be installed in this location to not
limit the day to day operations of the facility.
Maintenance Garage Upgrades – Cost Estimate
The opinion of probable cost for retrofitting the Maintenance Garage is estimated to be
$283,872. A detailed cost estimate is attached to this report. The major cost components
are:
a. Mechanical Modifications - $ 22,100
b. Hazardous Gas Detection System - $167,500
c. Electrical Modifications - $4,315
d. Architectural Modifications - $27,860
e. Contingency and Project Soft Costs - $62,097
14

Section 3 - Background
WENDEL | GoRaleigh Transit CNG Feasibility Study
Raleigh, North Carolina Section 3 - 6
2. Current Fueling Canopy and Extension
There are two existing fueling lanes used for diesel fueling of the fleet. There is an unused,
third fueling lane with provision to expand. The canopy extending from the fueling building
currently covers all three fueling lanes. Based on the drawings and site drainage, it is
apparent that provisions were made to add a fourth fueling lane and extend the canopy to
cover all four lanes.
The approach for CNG fueling
will be to initially provide a total
of two (2) CNG dispensers. One
dispenser would be installed on
the unused third lane and the
second would be installed on a
new fourth fueling lane. Both
lanes will require raised
concrete islands for the CNG
dispensers. Utilities would be
extended to serve the
equipment located here. This
will allow all fueling operations
to occur within the same area, and will not have any impact on the current flow of traffic and
operations around the site. Additional equipment such as fare vaults and fluid reels are
included in the estimates and would be installed at fueling lanes 3 and 4 to mimic what is
currently existing in lanes 1 and 2. Wendel recommends extending the overhead canopy to
cover all four fueling lanes and provide vents in the end of the canopy to ensure natural gas
would never be trapped up at the roof. As the diesel fleet is phased out, diesel fuel
dispensers on lanes one and two would be replaced with additional CNG dispensers.
Because natural gas is being dispensed under the canopy, the top 18 inches under the
canopy are classified as Class 1 Division 2 (explosion proof) for all electrical installations.
The existing raceway system serving the pendant mounted lighting will need to be reworked
down so it is located outside of the classified 18 inches.
Existing fueling lanes 1 and 2, closest to building,
used for diesel fueling. The 3rd lane will be fitted
out, a 4th lane created, and the canopy extended.
Lanes 3 and 4 will be used for CNG fueling.
15

Section 3 - Background
WENDEL | GoRaleigh Transit CNG Feasibility Study
Raleigh, North Carolina Section 3 - 7
The layout of the site is already designed to handle an additional two future fueling lanes
and trench drains are already in place to handle this expansion. In order to support the
additional canopy, three new steel columns and concrete footings would be added. Each
column will be protected with two steel bollards with HDPE sleeves. The canopy extension is
approximately 20’ wide by 93’-6” long. It is recommended to have the same basic structure
consisting of steel girders and sloped open web joists. Metal fascia would be extended
around the new canopy to match the existing. The metal roof deck would be tied into the
existing along with 2” of tapered polyisocyanurate insulation and a TPO membrane roof.
Two additional PVC downspouts would need to be added at the end columns and tied into
the existing underground drainage system. All of the steel to include columns, girders, joists
and metal deck would be painted to match the existing.
Although, not part of the CNG fueling needs, it was mentioned that the breezeway between
the fuel office and server room at the center of the fueling complex building is having a wind-
tunnel effect. With the CNG station location proposed, it is recommended as a part of this
project that a CMU wall be placed along with a 3 foot by 7 foot man door installed on the
end of the breezeway nearest the proposed new CNG station compound. The costs for the
breezeway improvement, canopy extension and other improvements are included in cost
estimates for the overall fueling station project.
C. CNG Fueling Station
According to the US Energy Information Annual Energy Outlook, natural gas used for
transportation equates to less than 1% of total natural gas consumed. This percentage is
expected to increase in the coming years based on the reasonable price of natural gas fuel
compared to the historically higher price of petroleum based fuels. The biggest challenge to
natural gas use for transportation overall is fleets cannot convert their vehicles without a
place to fuel, and fueling stations require significant upfront capital investments. In order
for natural gas vehicles to be feasible for transit operations, fuel must be readily available
and convenient. An offsite station would not feasibly service this transit fleet.
16

Section 3 - Background
WENDEL | GoRaleigh Transit CNG Feasibility Study
Raleigh, North Carolina Section 3 - 8
1. Fueling Station Type
An analysis of fueling requirements
was conducted for full implementation
of the current fleet replacement and
the two fleet expansion plans identified
in this study. There a typically two
types of CNG stations, time-fill and fast-
fill (see diagrams right). The main
structural differences between the two
systems are the amount of storage
capacity available and the size of the
compressor(s). These factors
determine the amount of fuel
dispensed and time it takes for CNG
to be delivered. Drivers filling up at a
fast-fill station experience similar fill
times to a conventional fueling
station. Because of the equipment
requirements for more rapid fueling,
fast-fill is also a more expensive option to implement. The option of a time-fill CNG station
was examined and found to not be feasible. This is primarily due to the daily fueling
requirements and operational logistics including probing, cleaning, fluid checks and other
necessary end of day service requirements occurring at the fueling islands. Based on these
transit operating characteristics, space constraints, and fueling requirements, a fast-fill
station is the best option.
2. Fueling Station Requirements & Location
The CNG fleet would be largely procured over the next 8-10 years. With this short timeframe
it is most cost effective to purchase up front the CNG refueling infrastructure to
accommodate much of the future phase in of transit vehicles. The station requirements for
this study are based on the fleet replacement and expansion schedules referenced earlier in
17

Section 3 - Background
WENDEL | GoRaleigh Transit CNG Feasibility Study
Raleigh, North Carolina Section 3 - 9
this report. This includes initially adding 38 replacement and potentially 57 expansion
transit coaches during the first four fiscal years of 2018-2021. Provided improvements are
made in increased gas pressure and flow rates, the station compressors initially proposed
are sized to handle this as well as the majority of future growth over the next several fiscal
years.
3. CNG Compressor Compound
Several areas on the site were investigated for the potential installation of a compressor
compound. As different areas were evaluated, it became clear there was one location on the
site that was more appealing than all others. There is an area approximately 75’x75’ located
directly north of the fuel building and west of the dumpster area, which has a close proximity
to the existing fueling lanes. This area currently provides four (4) parking spaces for broken-
down buses. This location offers the least impact to the existing parking, bus flow and
operations on the site. According to maintenance staff, this bus staging can be easily
relocated to accommodate the new station.
The mechanical equipment
within the station would
initially consist of a
manually regenerated single
vessel natural gas dryer,
three (3) 400 HP natural
gas compressors, a bank of
three (3) stacked 37’
storage vessels, buffer fill
panel and de-fueling panel.
With proper maintenance, this equipment has an expected life of approximately 20 years.
The intent of the design is to size and install compressor equipment that meets a minimum
demand for the next 5 to 10 years of anticipated CNG usage. Based on the currently
available 25 psi gas pressures, the proposed station design can accommodate a demand of
125 – 135 CNG buses over 7 hours of fueling. Two of the proposed compressors can
Proposed location for CNG station.
18

Section 3 - Background
WENDEL | GoRaleigh Transit CNG Feasibility Study
Raleigh, North Carolina Section 3 - 10
provide an eight minute fill per bus, filling one after another for the entire fleet, on two
separate dispensers. Based on the information we received, the current fueling process
takes anywhere from 8 to 11 minutes to complete by the time the bus is fueled, fare box
emptied, fluids topped off, etc. The third compressor is initially redundant to ensure the
station is fully operational in the event a compressor is down for maintenance, but would
offer the required additional capacity for a faster fill when all compressors are up and
running, as well as additional vehicle fueling capacity on a third or fourth dispenser.
As the fleet grows and is expanded, it can be expected that there will be additional time
demands and higher operating costs associated with the time necessary to fuel a larger fleet
of buses. However, modern CNG station equipment when properly designed can provide
refueling times comparable to those experienced dispensing diesel fuel. Therefore the cost
increases would be neutral whether operating the fleet on diesel or CNG.
A new gas service would need to be brought in from the southeast corner of the site and
routed along the south side for approximately 450’, and then north to the new compound
location. The concrete lot would be saw cut and trenched as required to accommodate the
new gas pipe installation. The piping would emerge from below grade and a meter set
assembly with a regulator would be located along the north wall of the fuel building at the
west corner. PSNC Energy is the gas provider currently looking at the options of providing the
gas supply from the existing pipe at the street, which will allow the station to receive
approximately 25psi of gas pressure. The second option PSNC is looking into is extending a
pipe from the nearest transmission line to provide a higher pressure and volume to the
station. PSNC is evaluating the cost of the installation and anticipated gas usage over the
next 10 years. Based on anticipated usage they will provide an additional cost, if any, to
bring in the larger supply. The current system with lower 25psi gas pressure results in
larger, more expensive equipment. If significantly higher gas pressures are not obtained, a
fourth compressor may be required in later years as the fleet expands beyond 135 vehicles.
The current estimated equipment cost for one compressor is $475,000. The initial CNG
station cost estimates are based on three compressors initially with the assumption of the
current 25psi gas pressure available. All of these variables would need to be determined
prior to the actual final design of the CNG station compressor requirements.
19

Section 3 - Background
WENDEL | GoRaleigh Transit CNG Feasibility Study
Raleigh, North Carolina Section 3 - 11
The electrical equipment for the CNG fueling compound and fueling dispensing under the
canopy consists of a pad mounted utility transformer that will supply a service rated 2500A
integrated switchboard consisting of metering, main circuit breaker, 480V distribution
section, generator connections with conductor terminal hookups, along with integrated
45kVA dry-type transformer and 208Y/120V distribution, all installed in weather proof NEMA
3R enclosure. The generator and main circuit breakers would be interlocked to allow for
manual generator transfer. The existing pad-mounted 500kVA transformer presently
located near the fueling station site will be replaced by Duke Energy with a 2500kVA
transformer with 480Y/277V secondary. This transformer will pick up the existing load of
the maintenance building, as well as the additional load of the CNG fueling equipment.
There would be means to bring a temporary generator on site and connect into the electrical
system to provide temporary power to the compound if the utility power was interrupted and
an emergency backup generator is not provided in the final design.
The addition of an emergency backup generator should be considered for the project.
A 500 kW generator to operate only one compressor is estimated to add $150,000 in
equipment costs. A 1500 kW generator enabling operations of the entire system during a
power outage is recommended. A 1500 kW generator is estimated to add $375,000 in
equipment costs to the project and insures that the critical vehicle fueling operations are not
disrupted in emergency situations. The current site generator, immediately adjacent to the
proposed CNG compressor compound, is already dedicated to critical life safety operations
and cannot be used for the new CNG station.
Emergency Shutdown Device (ESD) stations would be provided within the compound at the
south entrance, through the fuel building and at two locations near the north side of the
compound where you enter through the bollards. The entire compound would be protected
by bollards along the perimeter on the two exposed sides, north and west. The existing
concrete lot would be saw cut and removed at the locations of the compressors. Structurally
designed inertia block foundations would be installed to mount the compressors.
The site layout for the CNG compound and fuel Island improvements is depicted on the
following page. This layout is preliminary in nature and would be subject to final design
20

Section 3 - Background
WENDEL | GoRaleigh Transit CNG Feasibility Study
Raleigh, North Carolina Section 3 - 12
requirements and approvals. In the event a fourth compressor and permanent backup
generator system is added there would also need to be adjustments made to the site layout.
CNG Station and Fueling Island Upgrades – Cost Estimate
The opinion of probable cost for the CNG Station and Fueling Island upgrades and expansion
is estimated to be $4,707,538. The detailed cost estimate is attached to this report. The
major cost components are:
a. CNG Compressor* Compound - $ 2,219,150
b. Fast Fill Station and Fueling Islands - $558,700
c. Fueling Systems Electrical - $614,758
d. Contingency and Project Soft Costs - $1,314,930
* Fourth Compressor Add Option; Equipment Only $475,000
Preliminary Layout of CNG Compound and Fuel Island Improvements
21

Section 3 - Background
WENDEL | GoRaleigh Transit CNG Feasibility Study
Raleigh, North Carolina Section 3 - 13
D. Diesel Fuel and Natural Gas Costs
Estimating future diesel prices for 2018 is highly uncertain. North Carolina recently reduced
fuel tax rates from 37.5 cents per gallon to 36 cents per gallon for the period April 1, 2015
through December 31, 2015. The United States federal excise tax is 24.4 cents per gallon
for diesel fuel. The transit system does not pay fuel taxes. In an effort to reduce America’s
dependence on foreign oil, reduce urban emissions and reduce greenhouse gases, the
federal government offers a number of tax incentives to encourage the use of natural gas
vehicles including a 50-cent tax credit per gasoline gallon equivalent (GGE) of compressed
natural gas (CNG). The credit went into effect October 1, 2006 and originally expired
December 31, 2009. Congress has extended this credit several times. The most recent
extension of this incentive occurred on December 18, 2015 when this provision was
included in the Consolidated Appropriations Act, 2016 (PL 114-113, H.R. 2029). This law
extends the incentive for 2016 and retroactively for 2015. Although not a part of this
financial analysis, if this provision continues to be extended, substantial addition savings in
annual fuel costs would be realized.
For the purposes of financial analysis we have used the projection from the U.S. Energy
Information Administration (EIA) latest Short-Term Energy Outlook published in January
2016. Based on this report the diesel fuel retail price averaged $2.71 a gallon in 2015, is
projected to average $2.29 a gallon in 2016, and $2.59 gallon in 2017. We have used
what should be a very conservative fuel benchmark of $2.50 per gallon starting in 2018 for
the financial comparison to CNG fuel.
According to the U.S. Energy Information Administration (EIA), of the 2,300 trillion cubic feet
of technically recoverable natural gas resources are estimated to be in the U.S., almost a
quarter is held in shale rock formations. With the development of shale gas extraction
techniques, the verified U.S. natural gas useable reserves have increased and the resulting
impact has been more stable natural gas prices than that of oil based fuels such as diesel
and gasoline.
The last Annual Energy Outlook 2015 (AEO2015) prepared by the U.S. Energy Information
Administration (EIA) was released in April 2015. The EIA projected that the inflation rate, as
measured by growth in the Consumer Price Index (CPI), averages 2.0% from 2013 to 2040
22
Section 3 - Background
WENDEL | GoRaleigh Transit CNG Feasibility Study
Raleigh, North Carolina Section 3 - 14
in the Reference case, compared with the actual average annual CPI inflation rate of 2.9%
from 1983 to 2013. A number of scenarios are presented for future fuel cost projections
with the EIA’s normal reference case projecting average annual increases of 2.6% for
gasoline and diesel. Although it is difficult to judge among the differing EIA scenarios, we
have applied a reasonable 2% annual inflation rate to the $2.50 baseline for the B5
biodiesel prices in the financial payback scenario. A 2% annual inflation rate results in a
fiscal year 2037 projected price of $3.64 a gallon for diesel fuel.
The AEO2015 also presented a variety of scenarios for future natural gas prices. The EIA
projections vary among a number of scenarios with a 2% annual increase in prices in the
reference case. The current New York Mercantile Exchange (NYMEX) gas futures for March
2016 project natural gas prices in the $2.059 ($.30/DGE) per dekatherm to a high of
$4.296 ($.62/DGE) in March 2028. In the EIA High Oil and Gas Resource case, natural gas
production continues to increase and the Henry Hub natural gas spot price falls from $3.14
per dekatherm in 2015 to $3.12 per dekatherm in 2020 before rising to $4.38 per
dekatherm in 2040. Natural gas prices have remained consistently low and stable since
2008. Based on current indicators it is reasonable to assume relatively flat natural gas
prices through 2018 and slightly increased prices for the 2018 to 2037 timeframe of this
feasibility analysis. With natural gas representing only 43% of the price for a diesel gallon
equivalent of CNG, we have applied a .75% overall annual inflation rate to the $1.40/DGE
2018 baseline initial DGE CNG price in the financial payback scenario. A .75% annual
inflation rate results in a fiscal year 2037 projected CNG DGE price of $1.59. The following
section details the other cost components in the DGE component price.
E. CNG Diesel Gallon Equivalent (DGE) Cost
Gasoline and diesel fuel are dispensed and sold on a liquid gallon basis. Compressed
natural gas as a transportation fuel is sold on a gasoline gallon equivalent (GGE) basis.
There is not an adopted standard for the dispensing of a diesel gallon equivalent (DGE). On
a liquid gallon basis, diesel fuel has a higher energy content per gallon than unleaded
gasoline. Natural gas as a commodity is priced on dekatherm (DTH) basis or a unit of energy
equal to 10 therms or one million British thermal units (MMBtu). There is 1000 cubic feet in
23

Section 3 - Background
WENDEL | GoRaleigh Transit CNG Feasibility Study
Raleigh, North Carolina Section 3 - 15
a dekatherm. A GGE of compressed natural gas is equal to 126.67 cubic feet of natural gas.
A DGE of compressed natural gas is equal to 143.94 cubic feet. To more accurately reflect
the cost comparison of the fuels, we have used a buildup approach to the cost per DGE of
the CNG fuel. The DGE cost is based on natural gas cost, CNG equipment maintenance
reserve, drying and compression cost and capital recovery.
The following Table II depicts the breakdown of the estimated fiscal year 2018 initial
baseline built-up CNG cost per GGE for the financial scenarios.
Table II. CNG Cost Breakdown per DGE
Component DGE Percentage
1. Natural Gas $0.60 43%
2. Maintenance Reserve $0.25 18%
3. Drying and Compression $0.20 14%
4. Capital Recovery $0.35 25%
Total Cost $1.40 100.0%
1. Natural Gas Cost
The latest published North Carolina Natural Gas price (EIA Release Date:
1/29/2016 gas price update) for industrial companies (based on volume used)
was $5.57 per 1,000 cubic feet (dekatherm) for October 2015 or a DGE price of
$0.80. The prior 12 month average was $6.15. The local gas supplier PSNC has
a “Large Quantity General Service – 145 Rate Schedule” that would apply to the
proposed level of gas usage. That rate for January 2016 is equivalent to
approximately $3.40 per dekatherm or DGE price of $0.49. This price is a firm
rate for uninterrupted gas service. The average natural gas spot price at the
benchmark Henry Hub for December 2015 of $1.93 per million British thermal
units (MMBtu) was the lowest monthly average since March 1999. EIA's latest
Short-Term Energy Outlook (STEO) published in January 2016 expects natural gas
prices to rise, averaging $2.65/MMBtu in 2016 and $3.22/MMBtu in 2017. If
GoRaleigh worked with gas marketers to lock in all or a portion of future
24

Section 3 - Background
WENDEL | GoRaleigh Transit CNG Feasibility Study
Raleigh, North Carolina Section 3 - 16
commodity pricing, the city should be able to achieve a rate near $.60 per DGE
beginning in fiscal year 2018.
2. Maintenance Reserve
The CNG fueling facility maintenance costs typically are based upon a gallon
equivalent cost. Industry average maintenance costs run anywhere from $0.20
to $0.30 per gallon depending on the size and complexity of the station. This
cost allocation covers the annual maintenance recommended by the
manufacturer as well as the periodic overhauls of the compressors. Typical costs
for the size station proposed in this study are estimated to be $0.25 per gallon. It
should be noted that this is not an annual expenditure but a maintenance reserve
fund that would be set aside to fund periodic and future equipment maintenance.
A vehicle consuming 10,300 GGE of CNG would be allocated an equivalent of
$2,575 per year.
3. Drying and Compression
Drying and compression typically includes the energy costs to run the station,
primarily electric. It is estimated that this cost should be in the $.20 per GGE
range for this size station. This is an overall industry average based on local
utility rates in the Raleigh metropolitan area. Operating the time-fill station in the
evening hours at off peak rates should help lower energy costs.
4. Capital Recovery
The amortized cost of equipment and cost of capital is factored into the per gallon
price at a rate of $.35 per gallon. Transit Authorities may sometimes assume no
cost of capital as those costs would be recovered as a part of the overall savings.
A private company using capital market debt could use a figure as high as $.50
per gallon equivalent.
25

Section 3 - Background
WENDEL | GoRaleigh Transit CNG Feasibility Study
Raleigh, North Carolina Section 3 - 17
F. Raleigh Public Utility Biomethane Production
The Raleigh Public Utility may implement an anaerobic digestion program to recover bio-gas.
Excluding water vapor, about half of the recovered gas is generally methane and most of the
rest is carbon dioxide, with small amounts of nitrogen, oxygen, and hydrogen, and variable
trace amounts of hydrogen sulfide and siloxanes. It is similar in nature but not the same as
pipeline natural gas which is generally composed of 95% or higher methane content.
In order to be a usable product for bus operations, the bio-gas would need to be refined.
Cummins Westport does have standard fuel quality requirements that can be found online
at the following link, http://www.cumminswestport.com/fuel-quality-calculator. Any refined
biomethane gas used in the ISL-G natural gas engine used in transit buses would need to
meet the minimum requirements based on this model or it could potentially impact engine
warranties.
There has also been discussion of trucking the product to the Poole Road Transit Operations
and Maintenance facility. It would seem this may not be feasible from the standpoint of
planned fueling station infrastructure or normal bus fueling operations. The use of
recovered gas from an anaerobic digestion program and the gases delivery and dispensing
would need additional study and investigation to identify potential impacts with gas quality
issues and current operations at the facility.
An optimum scenario would be to have the Public Utility introduce the refined biogases into
PSNC Energy’s existing distribution system while meeting PSNC’s established “Biomethane
Gas Quality Specification” requirements. This would eliminate any gas quality concerns for
either the GoRaleigh transit system or the Public Utility and still allow for the contracting of
fuel between the entities.
26

Section 3 - Background
WENDEL | GoRaleigh Transit CNG Feasibility Study
Raleigh, North Carolina Section 3 - 18
G. CNG Training and Maintenance Requirements
Like conventional vehicles, CNG vehicles require proper maintenance. It is important to have
trained technicians to properly maintain and service CNG vehicles. Because of the unique
aspects of high pressure gas, the specialized equipment and the best practices required
when transitioning to the CNG fuel source, additional training in the area of CNG fuel storage
and fuel systems is recommended. Original equipment manufacturers generally fully back
the vehicles they produce with standard warranties, adequate parts inventory, and trained
technicians available to assist you as needed. As CNG vehicles are introduced into the fleet,
additional targeted CNG engine diagnostic and maintenance training will be a benefit to on-
going operations. Overall training regimens for CNG vehicles should be continuous and on-
going. It is recommended that continuing education and training programs be developed to
reinforce any new standard operating procedures and safety requirements necessary for
CNG vehicles.
1. Specialized CNG Training
A variety of training resources are available for compressed natural gas vehicles.
An important consideration and a vital part of fleet safety is ensuring the integrity
of CNG storage and fuel systems. The National Highway Transportation Safety
Administration (NHTSA) requires all on-board CNG storage cylinders manufactured
after March 1995 be visually inspected every three years or 36,000 miles
whichever comes first. In addition, cylinders should be inspected following any
accident. It would be recommended that you initially designate an adequate
number of maintenance employees to work on CNG storage and fuel systems and
have those employees receive CNG Fuel System Inspector training before or
immediately after vehicles arrive and are put in service. The time required for this
would generally be a one and a half to two day class and a certification exam. As a
longer term strategy the consideration of modifying or adopting a new job
classification such as “Fuel System Specialist” for vehicle inspections and/or a
“Fueling System Technician” with training focused on maintaining the fueling
station compression and dispensing equipment could be considered. Course
27

Section 3 - Background
WENDEL | GoRaleigh Transit CNG Feasibility Study
Raleigh, North Carolina Section 3 - 19
information and training center information can be found through the Clean
Vehicle Education Foundation. Additional sources of information can also be
found online or through networking with peer systems who have operated CNG
transit fleets.
2. Vehicle Maintenance
Costs associated with a heavy duty dedicated CNG engine versus an equivalent
diesel engine has narrowed. Although there is not good published data, it is
generally accepted that the cost of maintaining a CNG engine is slightly higher
than a pre-2010 diesel engine. The costs are similar however when compared to a
post 2010 diesel engine and the increased maintenance requirements due to the
2010 EPA requirements. At the time of this study, there is not a large amount of
additional reliable cost data to validate true maintenance costs of CNG versus
diesel engines. Many published articles suggest little or no cost difference when
coupled with good maintenance practices. We found no reliable data published
for transit operations and have projected no additional costs for CNG vehicle
maintenance in the feasibility cost model.
Dedicated natural gas engines in medium and heavy-duty diesel powered vehicles
change from compression ignition to spark-ignition. Overall, maintenance for the
ISL-G Cummins dedicated natural gas engine is similar to that of diesel engines,
but there are a few key differences. Spark plugs will need to be replaced per the
original equipment manufacturers recommended maintenance schedules. Motor
oil specifically formulated for natural gas engines is required. If diesel engine oil is
used, valve torching, piston scuffing and reduction in spark plug life will occur. For
the ISL G, valve adjustment must be performed at intervals recommended by the
engine manufacturer. This is an important step in achieving longer engine life.
Because the ISL-G does not require a Diesel Particulate Filter (DPF) or Selective
Catalytic Reduction (SCR) systems, operators do not need to perform re-
generations, and Diesel Exhaust Fluid (DEF) is not required. The fleet should save
money by eliminating diesel emissions fluid, and diesel particulate filters and the
regeneration issues sometimes accompanying the system with idling and low
vehicles speeds. In the longer term, newer CNG engines have reduced
28

Section 3 - Background
WENDEL | GoRaleigh Transit CNG Feasibility Study
Raleigh, North Carolina Section 3 - 20
maintenance requirements over their predecessors. In the case of the heavy duty
transit vehicle, Cummins generally provides on-site training as required for
mechanics maintaining the ISL-G engine that would be utilized in the buses.
3. CNG Station Maintenance and Training
Like any other equipment, CNG station equipment requires preventive and
corrective maintenance. Regular station maintenance will help prevent larger
costs in the future. The station manufacturer will provide a comprehensive
inspection and preventive maintenance program for the station equipment. The
maintenance may be performed by facilities staff or be contracted to a third-party
service provider. Although generally included, it is recommended that the transit
system require the CNG station manufacturer provide on-site training on
equipment to designated facilities staff, mechanic(s) or fueling system
technician(s) that will include all maintenance and operations requirements for the
station. Designated staff should work with a station trainer during initial station
start up to understand all the required maintenance and operations requirements.
After a station has been successfully in operation a few months, it is also
recommended that the same staff receive training on EPA, MPCA, and local rules
and regulations. Training consisting of 3-5 days of classroom and technical
training on compressor and fueling station system maintenance (if available) at
the compressor manufacturing plant or training center is also encouraged. If the
transit system wants this included in the procurement, it can be required at the
time the specifications are issued for a station.
H. Environmental Impacts
Natural gas is one of the cleanest burning of all fossil fuels. The positive environmental
aspects of conversion to CNG are substantial. The carbon dioxide (CO2) emission
coefficients of different fuels can be found on the U.S. Energy Information website:
http://www.eia.gov/environment/emissions/co2_vol_mass.cfm
The following a comparison of fuels relevant to this feasibility study. Because GoRaleigh
utilizes biodiesel, the CO2 environmental statements presented in this study are based on a
29

Section 3 - Background
WENDEL | GoRaleigh Transit CNG Feasibility Study
Raleigh, North Carolina Section 3 - 21
comparison of CNG to B5 biodiesel as opposed to ultra-low sulfur diesel fuel. The following
are the carbon dioxide emission coefficients by differing fuel types.
Carbon Dioxide Emission Coefficients
Natural Gas = 119.9 pounds per 1000 cubic feet (dekatherm)
Natural Gas = 15.2 pounds per GGE
Gasoline = 19.6 pounds per gallon
Natural Gas = 17.3 pounds per DGE
Diesel Fuel = 22.4 pounds per gallon (ultra-low sulfur)
Biodiesel* = 21.56 pounds per gallon (B5)
* According to the U.S. Department of Energy, Alternative Fuels Data Center, using biodiesel
reduces greenhouse gas emissions (GHGE’s) because carbon dioxide released from
biodiesel combustion is offset by the carbon dioxide absorbed while growing the soybeans or
other feedstock. Using B20 reduces carbon dioxide emissions by 15%.
A gasoline gallon equivalent (GGE) is 126.67 cubic feet of natural gas. A diesel gallon
equivalent (DGE) is 143.94 cubic feet of natural gas. A metric ton is 2,200 pounds. Each
gallon of gasoline replaced with CNG represents a 4.4 pound or 22% reduction in
greenhouse gas emissions. Each gallon of B5 biodiesel replaced with CNG represents a
4.26 pound or 20% reduction in greenhouse gas emissions (GHGE’s).
Each heavy duty CNG transit bus operated on CNG is projected to eliminate the use of
10,300 gallons of B5 biodiesel annually. Replacing this with natural gas, the net impact is
an annual reduction of 20 metric tons of CO2 per bus. The annual reduction of 20 metric
tons of CO2 is equivalent to the annual greenhouse gas emissions (GHGE’s) from 7.2 tons of
waste sent to the landfill, the CO2 emissions from 21,484 pounds of coal burned, the
electricity use for 2.8 homes for a year, or the carbon sequestered by 513 tree seedlings
grown for 10 years.
Over the life of the 20 year study period, dedicating all planned future transit bus purchases
to CNG operations results in displacement of 33,444,100 gallons of B5 biodiesel resulting
in a net Greenhouse Gas Emissions reduction of 64,760 metric tons of CO2.
30

Section 4
Findings
31

Section 4 - Findings
WENDEL | GoRaleigh Transit CNG Feasibility Study
Raleigh, North Carolina Section 4 - 1
A life cycle analysis provides an economic analysis of the proposed capital investments that
are expected in order to provide CNG vehicles while recognizing the change in operating
costs of both the facilities and fleet. The long term financial analysis of return on
investment supports the capital outlays necessary to retrofit facilities, procure CNG fueled
vehicles as outlined in the study, and build fueling station infrastructure. It is recommended
that the transit system construct a station on site. The most feasible location for a CNG
station for operations as detailed in the study is adjacent to current fueling operations.
The financial feasibility of the switch to CNG is feasible beginning in 2018 when considering
both current fleet and expand fleet considerations. If the expansion plans are not carried
out, the switch to CNG would be feasible beginning in 2020 and beyond as larger numbers
of vehicles begin being replaced.
A. Project Costs and Savings
The following tables highlight additional costs (red) and resulting cost saving items related to
the CNG items in the report.
Table III.
Category
Fuel Savings
Utilizing CNG vs.
B5 biodiesel
Increased Bus Costs
for CNG Engine, Fuel
System, Tanks
20 Year
Net Savings
After CNG Bus
Upcharge
Overall CNG Program $54,370,095 ($12,446,833) *$41,923,262
Regular Fleet Replacements $19,789,905 ($4,454,333) $15,335,572
Local Service Fleet Expansion $25,957,854 ($6,029,833) $20,480,021
BRT Service Fleet Expansion $8,622,336 ($1,962,667) $6,107,669
* Does Not Include Facility or CNG Fueling System Cost Estimates Listed Below.
Category Equipment and
Construction
Contingency and
Project Soft Costs Total Estimate
Maintenance Facility
Retrofits and Upgrades ($221,775) ($62,097) ($283,872)
CNG Fueling Station and Fuel
Island Upgrades ($3,392,608) ($1,314,930) ($4,707,538)
32

Section 4 - Findings
WENDEL | GoRaleigh Transit CNG Feasibility Study
Raleigh, North Carolina Section 4 - 2
B. Cash Flow / Net Present Values
The annual cash flows are calculated as the net of capital outlays, increased vehicle costs,
vehicle maintenance costs and projected fuel savings. The net present value (NPV) of a
project is determined by the summation of all annual cost savings (inflow cash) and all
annual debts (outflow cash) over the life of the project stated in current dollars.
The total annual expenditure (savings & costs) is brought back to a present worth using a
discount rate and is shown in the Cash Flows tables, which can found in the Appendix at the
end of this study. A discount rate is defined as, "The rate of return required by an investor to
accept the risks of a certain investment.” This rate typically includes the inflation cost of
money and the potential "risk-free" investment an owner could make. This rate differs based
on the individual owner, their standard practice, and their tolerance for risk. Traditionally,
this rate is typically greater than inflation. For the purpose of this analysis, a rate of 2.5% is
assumed.
The internal rate of return calculation is used for a series of cash flows represented by the
numbers in values. These cash flows do not have to be even, and may be negative or
positive based on net expenditures versus revenues. Cash flows must occur at regular
intervals, such as annually in our case. The internal rate of return (IRR) is the interest rate
received for an investment consisting of payments (negative values) and income (positive
values) that occur at regular periods.
The project cash flow analysis scenarios include estimated capital outlays for the increased
cost of CNG buses, facility upgrades to the maintenance building, construction of a new fast-
fill CNG station with fueling island upgrade and expansion and projected fuel savings. A full
CNG implementation of the current fleet as well as all planned expansion of new local and
bus rapid transit services provides a net total project savings of $36,931,852 with overall
positive cash flows beginning in year nine. Assuming a discount rate of 2.5% generates a
NPV savings of $23,815,603 and an IRR of 17.6%.
The Appendix contains the fleet replacement schedules, fuel cost projections, and the
separate cash flow analysis spreadsheets for a variety of scenarios presented in this report.
33

Section 5
Conclusion
34

Section 5 - Conclusion
WENDEL | GoRaleigh Transit CNG Feasibility Study
Raleigh, North Carolina Section 5 - 1
The move to begin transitioning the transit fleet to compressed natural gas (CNG) makes
sense and warrants consideration as an economic as well as environmental enhancement
to vehicle use in transit operations. The recommended strategy would be to buy new CNG
transit buses as the older buses are replaced and the transit fleet is expanded.
The reliability of new heavy duty CNG transit buses has continued to improve. The
introduction of new CNG engines, improved technology, and more reliable storage and
dispensing systems has improved the operations and maintenance experience in all
climates.
With an initially well designed maintenance building, the required retrofits and cost for the
maintenance facility upgrades are not extensive compared to many other transit projects.
The business case analysis in this study comparing operations with CNG to B5 biodiesel
provides positive fuel cost savings and reduced greenhouse gas emissions and the ability to
yield a short term payback of higher vehicle purchase costs in under four years. Should
diesel prices escalate further than in the financial comparisons the cost savings could
increase substantially.
Should a decision be made to move ahead, strategic discussion with stakeholders and
partners including the natural gas and electric providers should be undertaken early to
make certain infrastructure is adequately planned. A dedicated, on-site, fast-fill CNG fueling
system is preferred and with the nine month to one year timeframe required to order and
construct a CNG station, caution should be taken to ensure that fueling station
infrastructure is operational when heavy duty CNG transit buses are received and placed
into service.
35

Section 6
Appendix
36

Project Title: GoRaleigh CNG Feasibility Study Project No.: 479301Estimate: FUELING STATION CONSTRUCTION SUMMARY Revision Date: 3/11/16Location: Raleigh, NC Orig. Date: 01/21/16Owner: GoRaleigh Transit Estimated by: CBCFile Name: GoRaleigh Cost Estimate.xlsx Checked by: JTW
Approved by: JPH
ITEM ESTIMATED UNIT PRICE
NO. DESCRIPTION QUANTITY UNIT MAT.& LAB.
CNG COMPRESSOR COMPOUND
Equipment, Installation and Construction Total Sub Total 2,219,150 - FALSE
FAST FILL STATION AND CANOPY
Equipment, Installation and Construction Total Sub Total 558,700 -
FUELING ELECTRICAL WORK
Equipment and Construction Total Sub Total 614,758 -
3,392,608
10.0% Contingency 339,260.79 9.0% Design 305,334.71 5.0% CM Fee 169,630.39
365,000.00 1.5% Permit/Testing and Inspection Allowance 50,889.12 2.5% Bonds/Insurance Allowance 84,815.20
1,314,930
TOTAL ESTIMATE 4,707,538$
ADDITIONAL PROJECT CHARGES
FUELING STATION CONSTRUCTION SUMMARY TOTAL
OPINION OF PROBABLE COST WORKSHEET
This estimate is a total design and construction estimate
ESTIMATED
AMOUNT
General Conditions - $50K Pre-construction + $315K T&M General Conditions for 7 month field duration (or +/- $45k/month)
Confidential 3/10/2016 Page 137

Project Title: GoRaleigh CNG Feasibility Study Project No.: 479301Estimate: CNG FACILITY - FUELING Revision Date: 3/11/16Location: Raleigh, NC Orig. Date: 01/21/16Owner: GoRaleigh Transit Estimated by: CBCFile Name: GoRaleigh Cost Estimate.xlsx Checked by: JTW
Approved by: JPH
ITEM ESTIMATED UNIT PRICE
NO. DESCRIPTION QUANTITY UNIT MAT.& LAB.
CNG Compressor Compound (79' x 30' Area)
Natural Gas Service: 620' 4" pipe + Tap by PSNC 1 ea - - Compressor Package (400HP NG300E 790 scfm) 3 ea 475,000.00 1,425,000.00 Single Vessel Dryer with Manual Regen 1 ea 135,000.00 135,000.00 Storage Vessels (37' Tubes) 1 ea 120,000.00 120,000.00 Starter Panel 1 ea 120,000.00 120,000.00 Site Control Panel 1 ea 35,000.00 35,000.00 Priority Panel 1 ea 85,000.00 85,000.00 Excavate additional 2' at each compressor 55 cy 50.00 2,750.00 (3) Concrete inertia blocks; (10 x 24.5 x 2.5) 68 cy 400.00 27,200.00 Storage cylinder foundation 3 cy 400.00 1,200.00 Bollards 38 ea 1,000.00 38,000.00 Compound Installation 1 ls 200,000.00 200,000.00 Equipment Freight 1 ea 30,000.00 30,000.00
Sub Total 2,219,150
Fast Fill Station and Fueling Islands
CNG High Flow Transit Dispenser 2 ea 40,000.00 80,000.00 Additional Tubing & Valves 1 ls 15,000.00 15,000.00 Bollards 8 ea 1,000.00 8,000.00 Sawcut concrete 1 ls 1,500.00 1,500.00 Trenching including backfill 500 lf 20.00 10,000.00 12" concrete paving w #4 @16' oc ew 1,000 sf 18.00 18,000.00 Hose Reels 1 ea 6,500.00 6,500.00 Fare Box Vault 2 ea 30,000.00 60,000.00 Card Reader 2 ea 10,000.00 20,000.00 Vacuum System 2 ea 10,000.00 20,000.00 Dispenser Pad/curb @ 3 x 90 x 6" 2 ea 10,000.00 20,000.00 Signage/Pavement Markings 1 ls 2,500.00 2,500.00 Equipment Freight 1 ea 5,000.00 5,000.00 Fast Fill Installation 1 ls 180,000.00 180,000.00 Canopy Extension 20' x 93.5' 1,870 sf 50.00 93,500.00 Canopy - Concrete Paving Repair 1,870 sf 10.00 18,700.00
Sub Total 558,700
Fueling Systems Electrical
Electrical Utility Fee 1 ls 15,000.00 15,000.00 2500A Electrical Service Feeder (Underground PVC sch. 40) 30 ft 580.70 17,421.00 2500A Outdoor Switchgear - Service Rated, NEMA 3R. 1 ls 127,000.00 127,000.00
Includes generator connection and 208V distribution. 600A feeders for compressors (Underground RGS) 225 lf 202.65 45,596.25 100A feeder for dryer (Underground GRS) 75 lf 63.30 4,747.50 20A Dispensing Equipment Branch Circuit (Underground RGS) 375 lf 16.84 6,313.13 Electrical Trenching and Backfilling 705 lf 3.40 2,397.00 CNG Equipment Final Connections 8 ea 1,800.00 14,400.00 Reworking Lighting Branch wiring under canopy 250 lf 16.84 4,210.00 ESD Loop Wiring 225 lf 11.88 2,673.00 1,500 kW Emergncy Backup Generator 1 ea 375,000.00 375,000.00
Sub Total 614,758
3,392,608$
OPINION OF PROBABLE COST WORKSHEET
ESTIMATED
AMOUNT
CNG FACILITY - FUELING TOTAL
Confidential 3/10/2016 Page 238

Project Title: GoRaleigh CNG Feasibility Study Project No.: 479301Estimate: CNG FACILITY - MAINTENANCE SHOP Revision Date: 3/11/16Location: Raleigh, NC Orig. Date: 01/21/16Owner: GoRaleigh Transit Estimated by: CBCFile Name: GoRaleigh Cost Estimate.xlsx Checked by: JTW
Approved by: JPH
ITEM ESTIMATED UNIT PRICE
NO. DESCRIPTION QUANTITY UNIT MAT.& LAB.
MAINTENANCE SHOP MODIFICATIONS - MECHANICAL
Rooftop Exhaust Fan 4 ea 4,150.00 16,600.00 Ductwork/ Ductwork modifications 1 ls 2,500.00 2,500.00 HVAC Controls System modification 1 ea 3,000.00 3,000.00
Sub Total 22,100
MAINTENANCE SHOP - HAZARDOUS GAS DETECTION
Methane Detection System with automatic calibration 1 ls 167,500.00 167,500.00 Sub Total 167,500
MAINTENANCE SHOP - ELECTRICAL
Conduit and control wire from Gas detection to HVAC controls 200 lf 7.60 1,520.00 20A Branch Circuit for Gas System Controler 90 lf 8.84 795.15 Mechanical Equipment Connections (Disconnect & Reconnect) 4 ea 500.00 2,000.00
Sub Total 4,315
MAINTENANCE SHOP MODIFICATIONS - ARCHITECTURAL
Paint touch-up 360 SF 2.00 720.00 CMU - 2 hour rated 180 SF 23.00 4,140.00 Misc sealling of wall penetrations at utilities 10 ea 2,000.00 20,000.00 2hr fire rated man doors 3 ea 1,000.00 3,000.00
Sub Total 27,860
Project Sub Total 221,775
10.0% Contingency 22,178 9.0% Design 19,960 5.0% CM Fee 11,089 1.5% Permit/Testing and Inspection Allowance 3,327 2.5% Bonds/Insurance Allowance 5,544
62,097
283,872$
OPINION OF PROBABLE COST WORKSHEET
ESTIMATED
AMOUNT
CNG FACILITY - MAINTENANCE SHOP TOTAL
ADDITIONAL PROJECT CHARGES
Confidential 3/10/2016 Page 339

FY In
Service
Current
Buses
CNG
Upcharge
Diesel
Gallons
Cumulative
Gallons
* Diesel
$/Gal
# NG
$/DGE
Spread /
Savings
Expansion
Buses
CNG
Upcharge
Diesel
Gallons
Cumulative
Gallons
* Diesel
$/Gal
# NG
$/DGE
Spread /
Savings
2018 1 46,000$ 10,300 10,300 2.50 1.40 1.10 17 782,000$ 175,100 175,100 2.50 1.40 1.10
2019 -$ - 10,300 2.55 1.41 1.14 15 690,000$ 154,500 329,600 2.55 1.41 1.14
2020 18 828,000$ 185,400 195,700 2.60 1.42 1.18 13 598,000$ 133,900 463,500 2.60 1.42 1.18
2021 19 874,000$ 195,700 391,400 2.65 1.43 1.22 12 552,000$ 123,600 587,100 2.65 1.43 1.22
2022 -$ - 391,400 2.70 1.44 1.26 41 1,886,000$ 422,300 1,009,400 2.70 1.44 1.26
2023 7 322,000$ 72,100 463,500 2.75 1.45 1.30 10 460,000$ 103,000 1,112,400 2.75 1.45 1.30
2024 2 92,000$ 20,600 484,100 2.81 1.46 1.35 8 368,000$ 82,400 1,194,800 2.81 1.46 1.35
2025 -$ - 484,100 2.87 1.47 1.40 8 368,000$ 82,400 1,277,200 2.87 1.47 1.40
2026 21 966,000$ 216,300 700,400 2.93 1.48 1.45 -$ - 1,277,200 2.93 1.48 1.45
2027 -$ - 700,400 2.99 1.49 1.50 -$ - 1,277,200 2.99 1.49 1.50
2028 11 421,667$ 113,300 813,700 3.05 1.50 1.55 -$ - 1,277,200 3.05 1.50 1.55
2029 -$ - 813,700 3.11 1.51 1.60 -$ - 1,277,200 3.11 1.51 1.60
2030 1 30,667$ - 813,700 3.17 1.52 1.65 17 521,333$ - 1,277,200 3.17 1.52 1.65
2031 -$ - 813,700 3.23 1.53 1.70 15 402,500$ - 1,277,200 3.23 1.53 1.70
2032 18 414,000$ - 813,700 3.29 1.54 1.75 13 299,000$ - 1,277,200 3.29 1.54 1.75
2033 19 364,167$ - 813,700 3.36 1.55 1.81 12 230,000$ - 1,277,200 3.36 1.55 1.81
2034 -$ - 813,700 3.43 1.56 1.87 41 628,667$ - 1,277,200 3.43 1.56 1.87
2035 7 80,500$ - 813,700 3.50 1.57 1.93 10 115,000$ - 1,277,200 3.50 1.57 1.93
2036 2 15,333$ - 813,700 3.57 1.58 1.99 8 61,333$ - 1,277,200 3.57 1.58 1.99
2037 -$ - 813,700 3.64 1.59 2.05 8 30,667$ - 1,277,200 3.64 1.59 2.05
TOTALS 4,454,333$ 813,700 11,968,600 7,992,500$ 1,277,200 21,475,500
Baseline Diesel 2.500$ * Increases 2% Annually CNG Vehicle Upcharge 46,000$ Note: 32 BRT Buses
CNG DGE 143.94 CF/Dkth 1.400$ # Increases .75% Annually Average Annual Fuel Per Vehicle 10,300
Go Raleigh Transit - Fixed Route Vehicle
Fleet Replacement, Expansion, and Fuel Cost Projections
Fleet and Fuel Projections 40

GoRaleigh Transit
Current and Expanded Services Combined
Detailed Project Cash Flow
A1 A2 A B C D = A + B + C E F G H = E + F + G I = D + H
0 $0 $0 $0 $0 $0 $0 $0 $0 $0 $0 $01 $463,500 $259,560 -$203,940 $0 $0 -$203,940 $828,000 $283,872 $4,707,538 $5,819,410 -$5,615,4702 $866,745 $479,259 -$387,486 $0 $0 -$387,486 $690,000 $0 $0 $690,000 -$302,5143 $1,713,920 $936,064 -$777,856 $0 $0 -$777,856 $1,426,000 $0 $0 $1,426,000 -$648,1444 $2,593,025 $1,399,255 -$1,193,770 $0 $0 -$1,193,770 $1,426,000 $0 $0 $1,426,000 -$232,2305 $3,782,160 $2,017,152 -$1,765,008 $0 $0 -$1,765,008 $1,886,000 $0 $0 $1,886,000 -$120,9926 $4,333,725 $2,285,055 -$2,048,670 $0 $0 -$2,048,670 $782,000 $0 $0 $782,000 $1,266,6707 $4,717,709 $2,451,194 -$2,266,515 $0 $0 -$2,266,515 $460,000 $0 $0 $460,000 $1,806,5158 $5,054,931 $2,589,111 -$2,465,820 $0 $0 -$2,465,820 $368,000 $0 $0 $368,000 $2,097,8209 $5,794,368 $2,926,848 -$2,867,520 $0 $0 -$2,867,520 $966,000 $0 $0 $966,000 $1,901,52010 $5,913,024 $2,946,624 -$2,966,400 $0 $0 -$2,966,400 $0 $0 $0 $0 $2,966,40011 $6,377,245 $3,136,350 -$3,240,895 $0 $0 -$3,240,895 $421,667 $0 $0 $421,667 $2,819,22812 $6,502,699 $3,157,259 -$3,345,440 $0 $0 -$3,345,440 $0 $0 $0 $0 $3,345,44013 $6,628,153 $3,178,168 -$3,449,985 $0 $0 -$3,449,985 $552,000 $0 $0 $552,000 $2,897,98514 $6,753,607 $3,199,077 -$3,554,530 $0 $0 -$3,554,530 $402,500 $0 $0 $402,500 $3,152,03015 $6,879,061 $3,219,986 -$3,659,075 $0 $0 -$3,659,075 $713,000 $0 $0 $713,000 $2,946,07516 $7,025,424 $3,240,895 -$3,784,529 $0 $0 -$3,784,529 $594,167 $0 $0 $594,167 $3,190,36217 $7,171,787 $3,261,804 -$3,909,983 $0 $0 -$3,909,983 $628,667 $0 $0 $628,667 $3,281,31618 $7,318,150 $3,282,713 -$4,035,437 $0 $0 -$4,035,437 $195,500 $0 $0 $195,500 $3,839,93719 $7,464,513 $3,303,622 -$4,160,891 $0 $0 -$4,160,891 $76,667 $0 $0 $76,667 $4,084,22420 $7,610,876 $3,324,531 -$4,286,345 $0 $0 -$4,286,345 $30,667 $0 $0 $30,667 $4,255,678
Totals $104,964,622 $50,594,527 -$54,370,095 $0 $0 -$54,370,095 $12,446,833 $283,872 $4,707,538 $17,438,243 $36,931,852
(1) Differential between diesel fuel increasing 2.0% and NG .75% annually. Internal Rate of Return: 17.6%(6)
Net Present Value $23,815,603(2) No Costs associated with the differential maintenance between CNG and Diesel vehicles. (6) Assumes Discount Rate of 2.5%(3) Incremental cost for purchasing CNG buses versus Diesel. (4) Cost for Upgrading Maintenance Facility.(5) Costs for constructing CNG Fueling Station and Fuel Island Upgrades.
Year(1)
Annual Fuel
Costs Diesel
(1)Annual Fuel
Costs CNG
(1)Annual Fuel
Cost Savings
(2)Annual Fleet
Maintenance
Costs
Total Capital
Expenditures
Net Annual Cash
Flow
(2)Annual
Facility
Maintenance
Costs
Total Change In
Operational
Expenditures
(3)Incremental
CNG Fleet
Expenditures
(4)Garage
Renovation
Expenditure
(5)Fueling
Facility
Expenditure
Detailed Cash Flow - Combined 41

GoRaleigh Transit
Current Service Fleet Replacement
Detailed Project Cash Flow
A1 A2 A B C D = A + B + C E F G H = E + F + G I = D + H
0 $0 $0 $0 $0 $0 $0 $0 $0 $0 $0 $01 $25,750 $14,420 -$11,330 $0 $0 -$11,330 $46,000 $283,872 $4,707,538 $5,037,410 -$5,026,0802 $26,265 $14,523 -$11,742 $0 $0 -$11,742 $0 $0 $0 $0 $11,7423 $508,820 $277,894 -$230,926 $0 $0 -$230,926 $828,000 $0 $0 $828,000 -$597,0744 $1,037,210 $559,702 -$477,508 $0 $0 -$477,508 $874,000 $0 $0 $874,000 -$396,4925 $1,056,780 $563,616 -$493,164 $0 $0 -$493,164 $0 $0 $0 $0 $493,1646 $1,274,625 $672,075 -$602,550 $0 $0 -$602,550 $322,000 $0 $0 $322,000 $280,5507 $1,360,321 $706,786 -$653,535 $0 $0 -$653,535 $92,000 $0 $0 $92,000 $561,5358 $1,389,367 $711,627 -$677,740 $0 $0 -$677,740 $0 $0 $0 $0 $677,7409 $2,052,172 $1,036,592 -$1,015,580 $0 $0 -$1,015,580 $966,000 $0 $0 $966,000 $49,58010 $2,094,196 $1,043,596 -$1,050,600 $0 $0 -$1,050,600 $0 $0 $0 $0 $1,050,60011 $2,481,785 $1,220,550 -$1,261,235 $0 $0 -$1,261,235 $421,667 $0 $0 $421,667 $839,56812 $2,530,607 $1,228,687 -$1,301,920 $0 $0 -$1,301,920 $0 $0 $0 $0 $1,301,92013 $2,579,429 $1,236,824 -$1,342,605 $0 $0 -$1,342,605 $30,667 $0 $0 $30,667 $1,311,93814 $2,628,251 $1,244,961 -$1,383,290 $0 $0 -$1,383,290 $0 $0 $0 $0 $1,383,29015 $2,677,073 $1,253,098 -$1,423,975 $0 $0 -$1,423,975 $414,000 $0 $0 $414,000 $1,009,97516 $2,734,032 $1,261,235 -$1,472,797 $0 $0 -$1,472,797 $364,167 $0 $0 $364,167 $1,108,63017 $2,790,991 $1,269,372 -$1,521,619 $0 $0 -$1,521,619 $0 $0 $0 $0 $1,521,61918 $2,847,950 $1,277,509 -$1,570,441 $0 $0 -$1,570,441 $80,500 $0 $0 $80,500 $1,489,94119 $2,904,909 $1,285,646 -$1,619,263 $0 $0 -$1,619,263 $15,333 $0 $0 $15,333 $1,603,93020 $2,961,868 $1,293,783 -$1,668,085 $0 $0 -$1,668,085 $0 $0 $0 $0 $1,668,085
Totals $37,962,401 $18,172,496 -$19,789,905 $0 $0 -$19,789,905 $4,454,333 $283,872 $4,707,538 $9,445,743 $10,344,162
(1) Differential between diesel fuel increasing 2.0% and NG .75% annually. Internal Rate of Return: 8.5%(6)
Net Present Value $5,580,764(2) No Costs associated with the differential maintenance between CNG and Diesel vehicles. (6) Assumes Discount Rate of 2.5%(3) Incremental cost for purchasing CNG buses versus Diesel. (4) Cost for Upgrading Maintenance Facility.(5) Costs for constructing CNG Fueling Station and Fuel Island Upgrades.
Net Annual Cash
FlowYear
(1)Annual Fuel
Costs Diesel
(1)Annual Fuel
Costs CNG
(1)Annual Fuel
Cost Savings
(2)Annual Fleet
Maintenance
Costs
(2)Annual
Facility
Maintenance
Costs
Total Change In
Operational
Expenditures
(3)Incremental
CNG Fleet
Expenditures
(4)Garage
Renovation
Expenditure
(5)Fueling
Facility
Expenditure
Total Capital
Expenditures
Detailed Cash Flow-Current 42

GoRaleigh Transit
Local and BRT Expanded Service Fleet
Detailed Project Cash Flow
A1 A2 A B C D = A + B + C E F G H = E + F + G I = D + H
0 $0 $0 $0 $0 $0 $0 $0 $0 $0 $0 $01 $437,750 $245,140 -$192,610 $0 $0 -$192,610 $782,000 $283,872 $4,707,538 $5,773,410 -$5,580,8002 $840,480 $464,736 -$375,744 $0 $0 -$375,744 $690,000 $0 $0 $690,000 -$314,2563 $1,205,100 $658,170 -$546,930 $0 $0 -$546,930 $598,000 $0 $0 $598,000 -$51,0704 $1,555,815 $839,553 -$716,262 $0 $0 -$716,262 $552,000 $0 $0 $552,000 $164,2625 $2,725,380 $1,453,536 -$1,271,844 $0 $0 -$1,271,844 $1,886,000 $0 $0 $1,886,000 -$614,1566 $3,059,100 $1,612,980 -$1,446,120 $0 $0 -$1,446,120 $460,000 $0 $0 $460,000 $986,1207 $3,357,388 $1,744,408 -$1,612,980 $0 $0 -$1,612,980 $368,000 $0 $0 $368,000 $1,244,9808 $3,665,564 $1,877,484 -$1,788,080 $0 $0 -$1,788,080 $368,000 $0 $0 $368,000 $1,420,0809 $3,742,196 $1,890,256 -$1,851,940 $0 $0 -$1,851,940 $0 $0 $0 $0 $1,851,94010 $3,818,828 $1,903,028 -$1,915,800 $0 $0 -$1,915,800 $0 $0 $0 $0 $1,915,80011 $3,895,460 $1,915,800 -$1,979,660 $0 $0 -$1,979,660 $0 $0 $0 $0 $1,979,66012 $3,972,092 $1,928,572 -$2,043,520 $0 $0 -$2,043,520 $0 $0 $0 $0 $2,043,52013 $4,048,724 $1,941,344 -$2,107,380 $0 $0 -$2,107,380 $521,333 $0 $0 $521,333 $1,586,04714 $4,125,356 $1,954,116 -$2,171,240 $0 $0 -$2,171,240 $402,500 $0 $0 $402,500 $1,768,74015 $4,201,988 $1,966,888 -$2,235,100 $0 $0 -$2,235,100 $299,000 $0 $0 $299,000 $1,936,10016 $4,291,392 $1,979,660 -$2,311,732 $0 $0 -$2,311,732 $230,000 $0 $0 $230,000 $2,081,73217 $4,380,796 $1,992,432 -$2,388,364 $0 $0 -$2,388,364 $628,667 $0 $0 $628,667 $1,759,69718 $4,470,200 $2,005,204 -$2,464,996 $0 $0 -$2,464,996 $115,000 $0 $0 $115,000 $2,349,99619 $4,559,604 $2,017,976 -$2,541,628 $0 $0 -$2,541,628 $61,333 $0 $0 $61,333 $2,480,29520 $4,649,008 $2,030,748 -$2,618,260 $0 $0 -$2,618,260 $30,667 $0 $0 $30,667 $2,587,593
Totals $67,002,221 $32,422,031 -$34,580,190 $0 $0 -$34,580,190 $7,992,500 $283,872 $4,707,538 $12,983,910 $21,596,280
(1) Differential between diesel fuel increasing 2.0% and NG .75% annually. Internal Rate of Return: 13.9%(6)
Net Present Value $13,483,943(2) No Costs associated with the differential maintenance between CNG and Diesel vehicles. (6) Assumes Discount Rate of 2.5%(3) Incremental cost for purchasing CNG buses versus Diesel. (4) Cost for Upgrading Maintenance Facility.(5) Costs for constructing CNG Fueling Station and Fuel Island Upgrades.
Net Annual Cash
FlowYear
(1)Annual Fuel
Costs Diesel
(1)Annual Fuel
Costs CNG
(1)Annual Fuel
Cost Savings
(2)Annual Fleet
Maintenance
Costs
(2)Annual
Facility
Maintenance
Costs
Total Change In
Operational
Expenditures
(3)Incremental
CNG Fleet
Expenditures
(4)Garage
Renovation
Expenditure
(5)Fueling
Facility
Expenditure
Total Capital
Expenditures
Detailed Cash Flow-Expansion 43

GoRaleigh Transit
Local Service Expanded Fleet
Detailed Project Cash Flow
A1 A2 A B C D = A + B + C E F G H = E + F + G I = D + H
0 $0 $0 $0 $0 $0 $0 $0 $0 $0 $0 $01 $437,750 $245,140 -$192,610 $0 $0 -$192,610 $782,000 $283,872 $4,707,538 $5,773,410 -$5,580,8002 $840,480 $464,736 -$375,744 $0 $0 -$375,744 $690,000 $0 $0 $690,000 -$314,2563 $1,205,100 $658,170 -$546,930 $0 $0 -$546,930 $598,000 $0 $0 $598,000 -$51,0704 $1,555,815 $839,553 -$716,262 $0 $0 -$716,262 $552,000 $0 $0 $552,000 $164,2625 $1,835,460 $978,912 -$856,548 $0 $0 -$856,548 $414,000 $0 $0 $414,000 $442,5486 $2,152,700 $1,135,060 -$1,017,640 $0 $0 -$1,017,640 $460,000 $0 $0 $460,000 $557,6407 $2,431,212 $1,263,192 -$1,168,020 $0 $0 -$1,168,020 $368,000 $0 $0 $368,000 $800,0208 $2,719,612 $1,392,972 -$1,326,640 $0 $0 -$1,326,640 $368,000 $0 $0 $368,000 $958,6409 $2,776,468 $1,402,448 -$1,374,020 $0 $0 -$1,374,020 $0 $0 $0 $0 $1,374,02010 $2,833,324 $1,411,924 -$1,421,400 $0 $0 -$1,421,400 $0 $0 $0 $0 $1,421,40011 $2,890,180 $1,421,400 -$1,468,780 $0 $0 -$1,468,780 $0 $0 $0 $0 $1,468,78012 $2,947,036 $1,430,876 -$1,516,160 $0 $0 -$1,516,160 $0 $0 $0 $0 $1,516,16013 $3,003,892 $1,440,352 -$1,563,540 $0 $0 -$1,563,540 $521,333 $0 $0 $521,333 $1,042,20714 $3,060,748 $1,449,828 -$1,610,920 $0 $0 -$1,610,920 $402,500 $0 $0 $402,500 $1,208,42015 $3,117,604 $1,459,304 -$1,658,300 $0 $0 -$1,658,300 $299,000 $0 $0 $299,000 $1,359,30016 $3,183,936 $1,468,780 -$1,715,156 $0 $0 -$1,715,156 $230,000 $0 $0 $230,000 $1,485,15617 $3,250,268 $1,478,256 -$1,772,012 $0 $0 -$1,772,012 $138,000 $0 $0 $138,000 $1,634,01218 $3,316,600 $1,487,732 -$1,828,868 $0 $0 -$1,828,868 $115,000 $0 $0 $115,000 $1,713,86819 $3,382,932 $1,497,208 -$1,885,724 $0 $0 -$1,885,724 $61,333 $0 $0 $61,333 $1,824,39120 $3,449,264 $1,506,684 -$1,942,580 $0 $0 -$1,942,580 $30,667 $0 $0 $30,667 $1,911,913
Totals $50,390,381 $24,432,527 -$25,957,854 $0 $0 -$25,957,854 $6,029,833 $283,872 $4,707,538 $11,021,243 $14,936,611
(1) Differential between diesel fuel increasing 2.0% and NG .75% annually. Internal Rate of Return: 11.4%(6)
Net Present Value $8,953,946(2) No Costs associated with the differential maintenance between CNG and Diesel vehicles. (6) Assumes Discount Rate of 2.5%(3) Incremental cost for purchasing CNG buses versus Diesel. NO BRT Buses Included. Note: 32 BRT Buses Not Included(4) Cost for Upgrading Maintenance Facility.(5) Costs for constructing CNG Fueling Station and Fuel Island Upgrades.
Total Change In
Operational
Expenditures
(3)Incremental
CNG Fleet
Expenditures
(4)Garage
Renovation
Expenditure
(5)Fueling
Facility
Expenditure
Total Capital
Expenditures
Net Annual Cash
FlowYear
(1)Annual Fuel
Costs Diesel
(1)Annual Fuel
Costs CNG
(1)Annual Fuel
Cost Savings
(2)Annual Fleet
Maintenance
Costs
(2)Annual
Facility
Maintenance
Costs
Detailed Cash Flow-Exp; No BRT 44

COMPRESSED NATURAL GAS(CNG) VEHICLE FUELING
STATION EXTENSION
PRINT2/3/2016
PROGRESS
FEASIBILITY STUDY
CONCEPTUAL SITE PLAN NOTES:
C-1
CONCEPTUAL SITE PLAN
1CONCEPTUAL SITE PLAN
Centerpointe Corporate Park375 Essjay Road, Suite 200
Williamsville, NY 14221www.wendelcompanies.com
p:716.688.0766 f:716.625.6825
LOCATION MAP
POOLE ROAD
BUS
WAY
GoRALEIGHTRANSIT
OPERATIONSFACILITY
PROJECT AREA
45
ARCHITECTURE
ENGINEERING
PLANNING
ENERGY EFFICIENCY
CONSTRUCTION MANAGEMENT
111 Washington Avenue North
Suite 300, Minneapolis, MN 55401
P: 612.332.1401 w: wendelcompanies.com
Minnesota
New York
Virginia
Arizona
West Virginia
Washington, DC
46

DRAFT REPORT January 13, 2017
Compressed Natural Gas
Supplement to Feasibility Study
Capital Area Transit
4104 Poole Rd, Raleigh, NC 27610
47

GoRaleigh Transit - CNG Feasibility Study – Supplement
TITLE SECTION
Executive Summary 1
Updated Financial Data 2
Transit Bus Technology Review 3
Appendix 4
Fleet Replacement and Financial Analysis Scenarios
48

Section 1
Executive Summary
49

Section 1 - Executive Summary
WENDEL | GoRaleigh Transit CNG Feasibility Study – 2017 Supplement
Raleigh, North Carolina Section 1 - 1
Wendel was originally hired to provide a compressed natural gas (CNG) feasibility study for
GoRaleigh Transit. That study was completed on March 15, 2016 with a formal
presentation to the Raleigh Transit Authority Board on August 11, 2016.
The purpose of this update is to provide two supplemental pieces of information to the
original report. Part #1 provides recalculated financials based on the latest 2017 United
States Energy Information Administration (EIA) Annual Energy Outlook data released January
5, 2017. The original report analyzed a 20 year horizon beginning in 2018 with a 100%
fleet implementation. This supplement report expands the scenarios from 20 to 25 year
horizons, recalculates findings using EIA Reference, High Oil High Price, and Low Oil Price
cases with financial scenarios based on 100%, 75%, and 50% CNG fleet implementations.
Part #2 provides narrative comparisons for the current state of technology for operating
Clean Diesel, Hybrid Diesel-Electric, CNG, Battery Electric, and Hydrogen Fuel Cell Battery
Electric transit buses.
The original report financials used a 2018 baseline of $2.50 per diesel gallon and a 2%
annual inflation rate resulting in a projected diesel price of $3.64 in 2037. The natural gas
diesel gallon equivalent (DGE) baseline was $1.40 and .75% overall annual inflation rate
resulting in a projected CNG DGE price of $1.59 in 2037.
The updated financial scenarios use the 2017 EIA Diesel and CNG/DGE price ranges listed
in Table S1.
Table S1. - 2017 EIA Diesel and CNG/DGE Fuel Projections
Category Reference Case High Oil Price Low Oil Price
2018 – Diesel $3.02 $4.55 $2.72
2042 – Diesel $6.95 $11.78 $3.96
2018 – CNG/DGE $2.57 $2.60 $2.62
2042 – CNG/DGE $4.34 $4.24 $3.83
The updated supplement financials use EIA projected pricing based on diesel fuel for on-
road use which include Federal and State taxes while excluding county and local taxes.
50
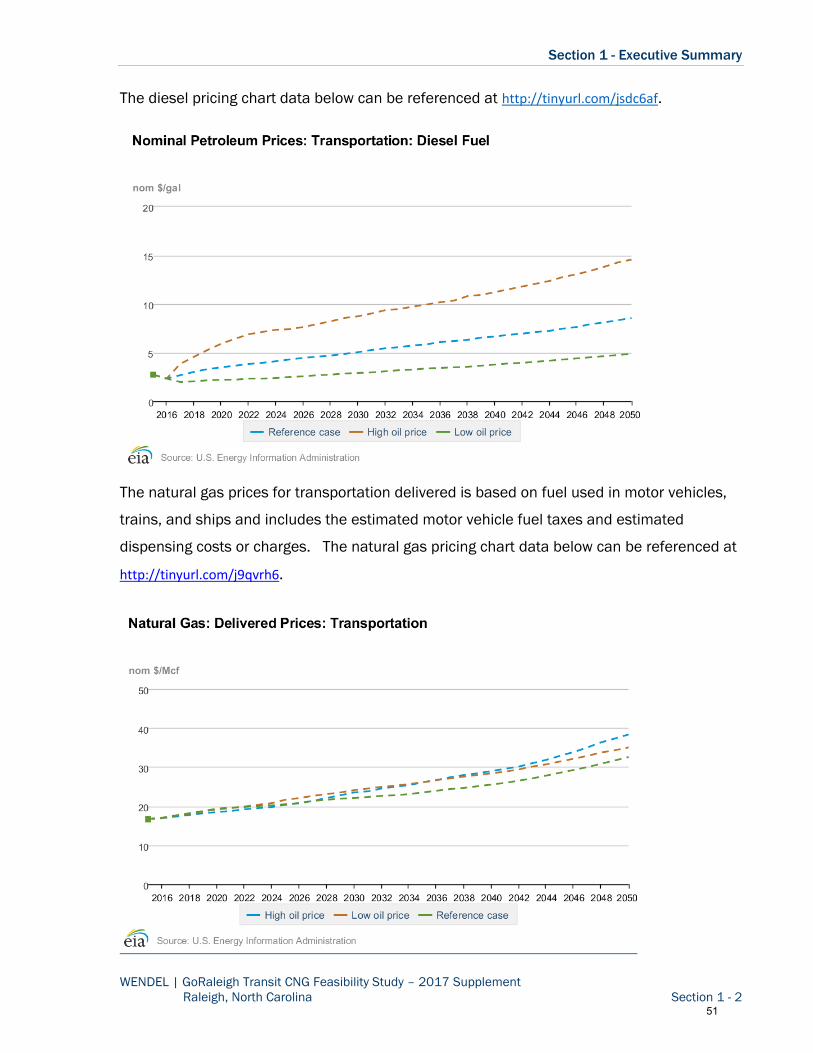
Section 1 - Executive Summary
WENDEL | GoRaleigh Transit CNG Feasibility Study – 2017 Supplement
Raleigh, North Carolina Section 1 - 2
The diesel pricing chart data below can be referenced at http://tinyurl.com/jsdc6af.
The natural gas prices for transportation delivered is based on fuel used in motor vehicles,
trains, and ships and includes the estimated motor vehicle fuel taxes and estimated
dispensing costs or charges. The natural gas pricing chart data below can be referenced at
http://tinyurl.com/j9qvrh6.
51

Section 1 - Executive Summary
WENDEL | GoRaleigh Transit CNG Feasibility Study – 2017 Supplement
Raleigh, North Carolina Section 1 - 3
In the original report natural gas pricing was based on GoRaleigh owning a private CNG
station. Natural gas pricing was based on purchasing at industrial rates plus adding station
component costs for maintenance reserve, drying, compression and capital recovery.
Although the EIA data includes taxes, marketing, etc. taxes would not be charged to
GoRaleigh on fuels, and costs for marketing and profit margins would reflect reduced costs
with direct purchasing. However, the updated financial scenarios still do provide a
consistent analysis based on published data where both fuel sources are priced on market
based economics. It should also be noted that as illustrated in Table S1. 2017 EIA Diesel
and CNG/DGE Fuel Projections, long term natural gas prices continue to be very stable in
comparison to diesel which continues to have wide pricing variations in the differing case
scenarios in the EIA update.
The original report financial data was based on 100% CNG fleet implementation. The fuel
cost savings figures did not take into consideration the approximate $5,000,000 estimated
one time cost of the new CNG station and required maintenance and fueling facility
upgrades.
The 20 year fuel cost savings were projected in the original report were as follows:
o $19,789,905 replacing 79 buses from the current fleet from 2018-2028
o $25,957,854 implementing 92 local service expansion buses from 2018-2025
o $8,622,336 implementing 32 BRT expansion buses starting in 2022
The tables in Section 2 – Updated Financial Data illustrate the 25 year savings based on the
differing EIA cases and corresponding levels of CNG fleet implementation.
52

Section 2
Updated Financial Data
53

Section 2 – Updated Financial Data
WENDEL | GoRaleigh Transit CNG Feasibility Study – 2017 Supplement
Raleigh, North Carolina Section 2 - 1
Table S2a. - 2017 EIA Reference Case
Category Fuel Savings Increased Bus Costs 25 Year
Net Savings
100% CNG Program $81,053,106 ($16,337,667) $64,715,439
Regular Fleet Replacements $30,371,933 ($5,968,500) $24,403,433
Local Service Fleet Expansion $37,764,140 ($7,793,167) $29,970,973
BRT Service Fleet Expansion $12,917,033 ($2,576,000) $10,341,033
75% CNG Fleet $61,508,920 ($12,400,833) $49,108,087
Regular Fleet Replacements $23,094,318 ($4,542,500) $18,551,818
Local Service Fleet Expansion $28,726,827 ($5,926,333) $22,800,494
BRT Service Fleet Expansion $9,687,775 ($1,932,000) $7,755,775
50% CNG Program $42,327,709 ($8,536,833) $33,790,876
Regular Fleet Replacements $16,144,120 ($3,174,000) $12,970,120
Local Service Fleet Expansion $19,725,072 ($4,074,833) $15,650,239
BRT Service Fleet Expansion $6,458,516 ($1,288,000) $5,170,516
54

Section 2 – Updated Financial Data
WENDEL | GoRaleigh Transit CNG Feasibility Study – 2017 Supplement
Raleigh, North Carolina Section 2 - 2
Table S2b. - 2017 EIA High Oil Price Case
Category Fuel Savings Increased Bus Costs 25 Year
Net Savings
100% CNG Program $246,635,322 ($16,337,667) $230,297,655
Regular Fleet Replacements $91,919,349 ($5,968,500) $85,950,849
Local Service Fleet Expansion $115,472,120 ($7,793,167) $107,678,953
BRT Service Fleet Expansion $39,248,853 ($2,576,000) $36,672,853
75% CNG Fleet $187,170,566 ($12,400,833) $174,769,733
Regular Fleet Replacements $69,901,562 ($4,542,500) $65,359,062
Local Service Fleet Expansion $87,832,363 ($5,926,333) $81,906,030
BRT Service Fleet Expansion $29,436,640 ($1,932,000) $27,504,640
50% CNG Program $42,327,709 ($8,536,833) $33,790,876
Regular Fleet Replacements $16,144,120 ($3,174,000) $12,970,120
Local Service Fleet Expansion $19,725,072 ($4,074,833) $15,650,239
BRT Service Fleet Expansion $6,458,516 ($1,288,000) $5,170,516
55

Section 2 – Updated Financial Data
WENDEL | GoRaleigh Transit CNG Feasibility Study – 2017 Supplement
Raleigh, North Carolina Section 2 - 3
Table S2c. - 2017 EIA Low Oil Price Case*
Category Fuel Savings Increased Bus Costs 25 Year
Net Savings
100% CNG Program ($9,065,487) ($16,337,667) ($25,403,154)
Regular Fleet Replacements ($2,982,423) ($5,968,500) ($8,950,923)
Local Service Fleet Expansion ($4,678,836) ($7,793,167) ($12,472,003)
BRT Service Fleet Expansion ($1,404,228) ($2,576,000) ($3,980,228)
75% CNG Fleet ($6,886,240) ($12,400,833) ($19,287,073)
Regular Fleet Replacements ($2,278,403) ($4,542,500) ($6,820,903)
Local Service Fleet Expansion ($3,554,666) ($5,926,333) ($9,480,999)
BRT Service Fleet Expansion ($1,053,171) ($1,932,000) ($2,985,171)
50% CNG Program ($4,744,171) ($8,536,833) ($13,281,004)
Regular Fleet Replacements ($1,587,296) ($3,174,000) ($4,761,296)
Local Service Fleet Expansion ($2,454,761) ($4,074,833) ($6,529,594)
BRT Service Fleet Expansion ($702,114) ($1,288,000) ($1,990,114)
* 2017 EIA Low Oil Price Case Results in Additional Costs and NO fuel savings in all scenarios.
56

Section 3
Transit Bus Technology Review
57

Transit Bus Technology Review
WENDEL | GoRaleigh Transit CNG Feasibility Study – 2017 Supplement
Raleigh, North Carolina Section 3 - 1
With the increasing awareness of greenhouse gas (GHG) emissions and transportation with
alternative fuels, the variety of transit vehicles propulsion choices continue to attract
attention. The capital and operating costs of using differing vehicles for public transit can be
challenging to evaluate as buses vary significantly in terms of costs, performance and
maintenance requirements. Certain routes and segments of transit systems may or may not
be ideal when considering the differing bus operating conditions and environments. The
comprehensive assessment framework and data gathering process needed to objectively
evaluate differing bus implementations is not provided in this technology review.
The intention of this information is to provide a high level comparison of the differing pricing
and technologies based on available data for differing bus types listed. Ultimately fleet
procurement decisions won’t dictate purchasing one type versus another but will consider a
wide range of factors including service and maintenance requirements other direct and
indirect impacts on the environment. Challenges with up front capital funding are also
impacted by the differing vehicle costs of hydrogen fuel cell, battery electric, CNG, hybrid
diesel-electric, and clean diesel transit buses.
The following table is a summary of vehicle capital cost and relative miles per diesel gallon
equivalent performance data using a clean diesel transit bus as a baseline. Fueling or
charging infrastructure and differences in maintenance and other operating costs unrelated
to fuel source are not evaluted.
58

Transit Bus Technology Review
WENDEL | GoRaleigh Transit CNG Feasibility Study – 2017 Supplement
Raleigh, North Carolina Section 3 - 2
Table S3. – Transit Bus Comparisons
Category Hydrogen
Fuel Cell
Battery
Electric CNG
Hybrid Diesel
Electric
Clean
Diesel
Typical Price Per
Unit $1.8-$2.5M $850,000 $510,000 $684,000 $464,000
Incremental Cost
over Diesel $1.3 - 2.0M $386,000 $46,000 $220,000 n/a
Annual Incremental
Vehicle Cost $10K - $16K $32,167 $3,833 $18,333 $0
kWh per Mile / MPG 4.91 - 7.09 1.72 - 1.92 4.00 5.25 4.50
59

Section 4
Appendix
60

Appendix
EIA 2017 REFERENCE CASE FINANCIAL SCENARIOS
61

FY In
Service
Current
Buses
CNG
Upcharge
Diesel
Gallons
Cumulative
Gallons
* Diesel
$/Gal
# NG
$/DGE
Spread /
Savings
Expansion
Buses CNG Upcharge
Diesel
Gallons
Cumulative
Gallons
* Diesel
$/Gal
# NG
$/DGE
Spread /
Savings
2018 1 46,000$ 10,300 10,300 3.02 2.57 0.45 17 782,000$ 175,100 175,100 3.02 2.57 0.45
2019 -$ - 10,300 3.28 2.61 0.66 15 690,000$ 154,500 329,600 3.28 2.61 0.66
2020 18 828,000$ 185,400 195,700 3.47 2.67 0.80 13 598,000$ 133,900 463,500 3.47 2.67 0.80
2021 19 874,000$ 195,700 391,400 3.64 2.71 0.92 12 552,000$ 123,600 587,100 3.64 2.71 0.92
2022 -$ - 391,400 3.83 2.76 1.07 41 1,886,000$ 422,300 1,009,400 3.83 2.76 1.07
2023 7 322,000$ 72,100 463,500 3.97 2.81 1.16 10 460,000$ 103,000 1,112,400 3.97 2.81 1.16
2024 2 92,000$ 20,600 484,100 4.09 2.86 1.23 8 368,000$ 82,400 1,194,800 4.09 2.86 1.23
2025 -$ - 484,100 4.28 2.93 1.35 8 368,000$ 82,400 1,277,200 4.28 2.93 1.35
2026 21 966,000$ 216,300 700,400 4.44 3.00 1.43 -$ - 1,277,200 4.44 3.00 1.43
2027 -$ - 700,400 4.59 3.08 1.51 -$ - 1,277,200 4.59 3.08 1.51
2028 11 506,000$ 113,300 813,700 4.71 3.19 1.51 -$ - 1,277,200 4.71 3.19 1.51
2029 -$ - 813,700 4.86 3.29 1.57 -$ - 1,277,200 4.86 3.29 1.57
2030 1 46,000$ - 813,700 5.06 3.38 1.67 17 782,000$ - 1,277,200 5.06 3.38 1.67
2031 -$ - 813,700 5.24 3.43 1.81 15 690,000$ - 1,277,200 5.24 3.43 1.81
2032 18 759,000$ - 813,700 5.44 3.53 1.91 13 548,167$ - 1,277,200 5.44 3.53 1.91
2033 19 728,333$ - 813,700 5.55 3.59 1.96 12 460,000$ - 1,277,200 5.55 3.59 1.96
2034 -$ - 813,700 5.72 3.66 2.05 41 1,414,500$ - 1,277,200 5.72 3.66 2.05
2035 7 214,667$ - 813,700 5.86 3.77 2.09 10 306,667$ - 1,277,200 5.86 3.77 2.09
2036 2 53,667$ - 813,700 6.07 3.86 2.22 8 214,667$ - 1,277,200 6.07 3.86 2.22
2037 -$ - 813,700 6.19 3.95 2.24 8 184,000$ - 1,277,200 6.19 3.95 2.24
2038 21 402,500$ - 813,700 6.33 4.03 2.30 -$ - 1,277,200 6.33 4.03 2.30
2039 -$ - 813,700 6.52 4.10 2.41 -$ - 1,277,200 6.52 4.10 2.41
2040 11 126,500$ - 813,700 6.68 4.17 2.51 -$ - 1,277,200 6.68 4.17 2.51
2041 -$ - 813,700 6.82 4.25 2.57 -$ - 1,277,200 6.82 4.25 2.57
2042 1 3,833$ - 813,700 6.95 4.34 2.61 17 65,167$ - 1,277,200 6.95 4.34 2.61
TOTALS 5,968,500$ 813,700 16,037,100 10,369,167$ 1,277,200 27,861,500
* EIA 2017 Reference Case Nominal Petroleum Prices Transportation Diesel Fuel CNG Vehicle Upcharge 46,000$ Note: 32 BRT Buses
# EIA 2017 Reference Case Natural Gas Delivered Prices Transportation Average Annual Fuel Per Vehicle 10,300
Go Raleigh Transit - Fixed Route Vehicle
100% CNG Fleet Replacement, Expansion, and Fuel Cost Projections
Fleet and Fuel Projections 62
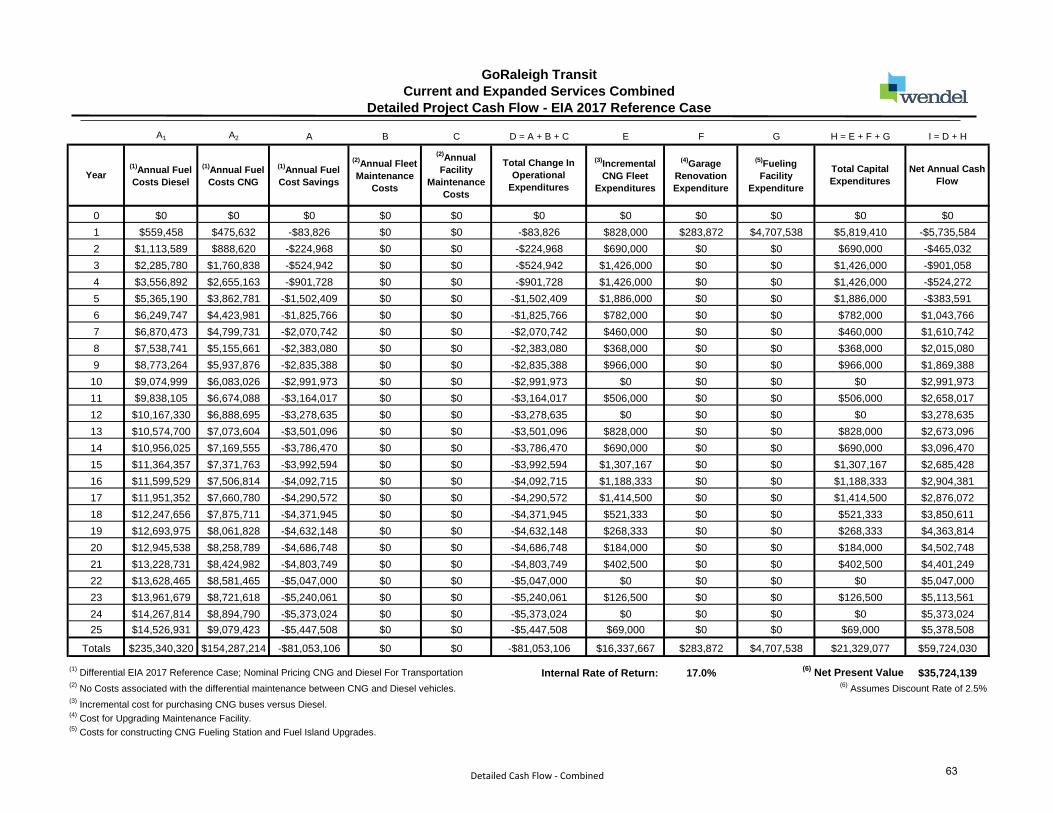
GoRaleigh Transit
Current and Expanded Services Combined
Detailed Project Cash Flow - EIA 2017 Reference Case
A1 A2 A B C D = A + B + C E F G H = E + F + G I = D + H
0 $0 $0 $0 $0 $0 $0 $0 $0 $0 $0 $0
1 $559,458 $475,632 -$83,826 $0 $0 -$83,826 $828,000 $283,872 $4,707,538 $5,819,410 -$5,735,584
2 $1,113,589 $888,620 -$224,968 $0 $0 -$224,968 $690,000 $0 $0 $690,000 -$465,032
3 $2,285,780 $1,760,838 -$524,942 $0 $0 -$524,942 $1,426,000 $0 $0 $1,426,000 -$901,058
4 $3,556,892 $2,655,163 -$901,728 $0 $0 -$901,728 $1,426,000 $0 $0 $1,426,000 -$524,272
5 $5,365,190 $3,862,781 -$1,502,409 $0 $0 -$1,502,409 $1,886,000 $0 $0 $1,886,000 -$383,591
6 $6,249,747 $4,423,981 -$1,825,766 $0 $0 -$1,825,766 $782,000 $0 $0 $782,000 $1,043,766
7 $6,870,473 $4,799,731 -$2,070,742 $0 $0 -$2,070,742 $460,000 $0 $0 $460,000 $1,610,742
8 $7,538,741 $5,155,661 -$2,383,080 $0 $0 -$2,383,080 $368,000 $0 $0 $368,000 $2,015,080
9 $8,773,264 $5,937,876 -$2,835,388 $0 $0 -$2,835,388 $966,000 $0 $0 $966,000 $1,869,388
10 $9,074,999 $6,083,026 -$2,991,973 $0 $0 -$2,991,973 $0 $0 $0 $0 $2,991,973
11 $9,838,105 $6,674,088 -$3,164,017 $0 $0 -$3,164,017 $506,000 $0 $0 $506,000 $2,658,017
12 $10,167,330 $6,888,695 -$3,278,635 $0 $0 -$3,278,635 $0 $0 $0 $0 $3,278,635
13 $10,574,700 $7,073,604 -$3,501,096 $0 $0 -$3,501,096 $828,000 $0 $0 $828,000 $2,673,096
14 $10,956,025 $7,169,555 -$3,786,470 $0 $0 -$3,786,470 $690,000 $0 $0 $690,000 $3,096,470
15 $11,364,357 $7,371,763 -$3,992,594 $0 $0 -$3,992,594 $1,307,167 $0 $0 $1,307,167 $2,685,428
16 $11,599,529 $7,506,814 -$4,092,715 $0 $0 -$4,092,715 $1,188,333 $0 $0 $1,188,333 $2,904,381
17 $11,951,352 $7,660,780 -$4,290,572 $0 $0 -$4,290,572 $1,414,500 $0 $0 $1,414,500 $2,876,072
18 $12,247,656 $7,875,711 -$4,371,945 $0 $0 -$4,371,945 $521,333 $0 $0 $521,333 $3,850,611
19 $12,693,975 $8,061,828 -$4,632,148 $0 $0 -$4,632,148 $268,333 $0 $0 $268,333 $4,363,814
20 $12,945,538 $8,258,789 -$4,686,748 $0 $0 -$4,686,748 $184,000 $0 $0 $184,000 $4,502,748
21 $13,228,731 $8,424,982 -$4,803,749 $0 $0 -$4,803,749 $402,500 $0 $0 $402,500 $4,401,249
22 $13,628,465 $8,581,465 -$5,047,000 $0 $0 -$5,047,000 $0 $0 $0 $0 $5,047,000
23 $13,961,679 $8,721,618 -$5,240,061 $0 $0 -$5,240,061 $126,500 $0 $0 $126,500 $5,113,561
24 $14,267,814 $8,894,790 -$5,373,024 $0 $0 -$5,373,024 $0 $0 $0 $0 $5,373,024
25 $14,526,931 $9,079,423 -$5,447,508 $0 $0 -$5,447,508 $69,000 $0 $0 $69,000 $5,378,508
Totals $235,340,320 $154,287,214 -$81,053,106 $0 $0 -$81,053,106 $16,337,667 $283,872 $4,707,538 $21,329,077 $59,724,030
(1) Differential EIA 2017 Reference Case; Nominal Pricing CNG and Diesel For Transportation Internal Rate of Return: 17.0%
(6) Net Present Value $35,724,139
(2) No Costs associated with the differential maintenance between CNG and Diesel vehicles.
(6) Assumes Discount Rate of 2.5%
(3) Incremental cost for purchasing CNG buses versus Diesel.
(4) Cost for Upgrading Maintenance Facility.
(5) Costs for constructing CNG Fueling Station and Fuel Island Upgrades.
Total Capital
Expenditures
Net Annual Cash
Flow
(2)Annual
Facility
Maintenance
Costs
Total Change In
Operational
Expenditures
(3)Incremental
CNG Fleet
Expenditures
(4)Garage
Renovation
Expenditure
(5)Fueling
Facility
Expenditure
Year(1)
Annual Fuel
Costs Diesel
(1)Annual Fuel
Costs CNG
(1)Annual Fuel
Cost Savings
(2)Annual Fleet
Maintenance
Costs
Detailed Cash Flow - Combined 63

GoRaleigh Transit
Current Service Fleet Replacement
Detailed Project Cash Flow - EIA 2017 Reference Case
A1 A2 A B C D = A + B + C E F G H = E + F + G I = D + H
0 $0 $0 $0 $0 $0 $0 $0 $0 $0 $0 $0
1 $31,081 $26,424 -$4,657 $0 $0 -$4,657 $46,000 $283,872 $4,707,538 $5,037,410 -$5,032,753
2 $33,745 $26,928 -$6,817 $0 $0 -$6,817 $0 $0 $0 $0 $6,817
3 $678,591 $522,749 -$155,842 $0 $0 -$155,842 $828,000 $0 $0 $828,000 -$672,158
4 $1,422,757 $1,062,065 -$360,691 $0 $0 -$360,691 $874,000 $0 $0 $874,000 -$513,309
5 $1,499,097 $1,079,306 -$419,791 $0 $0 -$419,791 $0 $0 $0 $0 $419,791
6 $1,838,161 $1,301,171 -$536,990 $0 $0 -$536,990 $322,000 $0 $0 $322,000 $214,990
7 $1,981,057 $1,383,972 -$597,085 $0 $0 -$597,085 $92,000 $0 $0 $92,000 $505,085
8 $2,072,052 $1,417,053 -$654,999 $0 $0 -$654,999 $0 $0 $0 $0 $654,999
9 $3,107,198 $2,102,998 -$1,004,200 $0 $0 -$1,004,200 $966,000 $0 $0 $966,000 $38,200
10 $3,214,062 $2,154,405 -$1,059,657 $0 $0 -$1,059,657 $0 $0 $0 $0 $1,059,657
11 $3,828,622 $2,597,305 -$1,231,317 $0 $0 -$1,231,317 $506,000 $0 $0 $506,000 $725,317
12 $3,956,744 $2,680,822 -$1,275,922 $0 $0 -$1,275,922 $0 $0 $0 $0 $1,275,922
13 $4,115,277 $2,752,782 -$1,362,495 $0 $0 -$1,362,495 $46,000 $0 $0 $46,000 $1,316,495
14 $4,263,675 $2,790,122 -$1,473,553 $0 $0 -$1,473,553 $0 $0 $0 $0 $1,473,553
15 $4,422,582 $2,868,814 -$1,553,768 $0 $0 -$1,553,768 $759,000 $0 $0 $759,000 $794,768
16 $4,514,102 $2,921,371 -$1,592,731 $0 $0 -$1,592,731 $728,333 $0 $0 $728,333 $864,398
17 $4,651,019 $2,981,289 -$1,669,730 $0 $0 -$1,669,730 $0 $0 $0 $0 $1,669,730
18 $4,766,329 $3,064,932 -$1,701,397 $0 $0 -$1,701,397 $214,667 $0 $0 $214,667 $1,486,731
19 $4,940,020 $3,137,361 -$1,802,658 $0 $0 -$1,802,658 $53,667 $0 $0 $53,667 $1,748,992
20 $5,037,919 $3,214,012 -$1,823,907 $0 $0 -$1,823,907 $0 $0 $0 $0 $1,823,907
21 $5,148,127 $3,278,688 -$1,869,439 $0 $0 -$1,869,439 $402,500 $0 $0 $402,500 $1,466,939
22 $5,303,688 $3,339,585 -$1,964,104 $0 $0 -$1,964,104 $0 $0 $0 $0 $1,964,104
23 $5,433,363 $3,394,127 -$2,039,236 $0 $0 -$2,039,236 $126,500 $0 $0 $126,500 $1,912,736
24 $5,552,499 $3,461,519 -$2,090,980 $0 $0 -$2,090,980 $0 $0 $0 $0 $2,090,980
25 $5,653,338 $3,533,371 -$2,119,966 $0 $0 -$2,119,966 $3,833 $0 $0 $3,833 $2,116,133
Totals $87,465,105 $57,093,172 -$30,371,933 $0 $0 -$30,371,933 $5,968,500 $283,872 $4,707,538 $10,959,910 $19,412,023
(1) Differential EIA 2017 Reference Case; Nominal Pricing CNG and Diesel For Transportation Internal Rate of Return: 10.0%
(6) Net Present Value $10,408,221
(2) No Costs associated with the differential maintenance between CNG and Diesel vehicles.
(6) Assumes Discount Rate of 2.5%
(3) Incremental cost for purchasing CNG buses versus Diesel.
(4) Cost for Upgrading Maintenance Facility.
(5) Costs for constructing CNG Fueling Station and Fuel Island Upgrades.
Net Annual Cash
FlowYear
(1)Annual Fuel
Costs Diesel
(1)Annual Fuel
Costs CNG
(1)Annual Fuel
Cost Savings
(2)Annual Fleet
Maintenance
Costs
(2)Annual
Facility
Maintenance
Costs
Total Change In
Operational
Expenditures
(3)Incremental
CNG Fleet
Expenditures
(4)Garage
Renovation
Expenditure
(5)Fueling
Facility
Expenditure
Total Capital
Expenditures
Detailed Cash Flow-Current 64

GoRaleigh Transit
Local and BRT Expanded Service Fleet
Detailed Project Cash Flow - EIA 2017 Reference Case
A1 A2 A B C D = A + B + C E F G H = E + F + G I = D + H
0 $0 $0 $0 $0 $0 $0 $0 $0 $0 $0 $0
1 $528,377 $449,208 -$79,169 $0 $0 -$79,169 $782,000 $283,872 $4,707,538 $5,773,410 -$5,694,241
2 $1,079,843 $861,692 -$218,151 $0 $0 -$218,151 $690,000 $0 $0 $690,000 -$471,849
3 $1,607,189 $1,238,089 -$369,100 $0 $0 -$369,100 $598,000 $0 $0 $598,000 -$228,900
4 $2,134,135 $1,593,098 -$541,037 $0 $0 -$541,037 $552,000 $0 $0 $552,000 -$10,963
5 $3,866,093 $2,783,475 -$1,082,618 $0 $0 -$1,082,618 $1,886,000 $0 $0 $1,886,000 -$803,382
6 $4,411,586 $3,122,810 -$1,288,776 $0 $0 -$1,288,776 $460,000 $0 $0 $460,000 $828,776
7 $4,889,417 $3,415,760 -$1,473,657 $0 $0 -$1,473,657 $368,000 $0 $0 $368,000 $1,105,657
8 $5,466,689 $3,738,608 -$1,728,082 $0 $0 -$1,728,082 $368,000 $0 $0 $368,000 $1,360,082
9 $5,666,067 $3,834,878 -$1,831,188 $0 $0 -$1,831,188 $0 $0 $0 $0 $1,831,188
10 $5,860,937 $3,928,621 -$1,932,316 $0 $0 -$1,932,316 $0 $0 $0 $0 $1,932,316
11 $6,009,483 $4,076,783 -$1,932,700 $0 $0 -$1,932,700 $0 $0 $0 $0 $1,932,700
12 $6,210,586 $4,207,873 -$2,002,713 $0 $0 -$2,002,713 $0 $0 $0 $0 $2,002,713
13 $6,459,422 $4,320,822 -$2,138,600 $0 $0 -$2,138,600 $782,000 $0 $0 $782,000 $1,356,600
14 $6,692,350 $4,379,433 -$2,312,918 $0 $0 -$2,312,918 $690,000 $0 $0 $690,000 $1,622,918
15 $6,941,775 $4,502,949 -$2,438,826 $0 $0 -$2,438,826 $548,167 $0 $0 $548,167 $1,890,659
16 $7,085,427 $4,585,443 -$2,499,983 $0 $0 -$2,499,983 $460,000 $0 $0 $460,000 $2,039,983
17 $7,300,333 $4,679,491 -$2,620,842 $0 $0 -$2,620,842 $1,414,500 $0 $0 $1,414,500 $1,206,342
18 $7,481,327 $4,810,779 -$2,670,548 $0 $0 -$2,670,548 $306,667 $0 $0 $306,667 $2,363,881
19 $7,753,955 $4,924,466 -$2,829,489 $0 $0 -$2,829,489 $214,667 $0 $0 $214,667 $2,614,823
20 $7,907,619 $5,044,778 -$2,862,841 $0 $0 -$2,862,841 $184,000 $0 $0 $184,000 $2,678,841
21 $8,080,604 $5,146,295 -$2,934,310 $0 $0 -$2,934,310 $0 $0 $0 $0 $2,934,310
22 $8,324,777 $5,241,880 -$3,082,897 $0 $0 -$3,082,897 $0 $0 $0 $0 $3,082,897
23 $8,528,317 $5,327,491 -$3,200,826 $0 $0 -$3,200,826 $0 $0 $0 $0 $3,200,826
24 $8,715,315 $5,433,271 -$3,282,044 $0 $0 -$3,282,044 $0 $0 $0 $0 $3,282,044
25 $8,873,593 $5,546,051 -$3,327,542 $0 $0 -$3,327,542 $65,167 $0 $0 $65,167 $3,262,375
Totals $147,875,216 $97,194,042 -$50,681,173 $0 $0 -$50,681,173 $10,369,167 $283,872 $4,707,538 $15,360,577 $35,320,597
(1) Differential EIA 2017 Reference Case; Nominal Pricing CNG and Diesel For Transportation Internal Rate of Return: 13.8%
(6) Net Present Value $20,565,022
(2) No Costs associated with the differential maintenance between CNG and Diesel vehicles.
(6) Assumes Discount Rate of 2.5%
(3) Incremental cost for purchasing CNG buses versus Diesel.
(4) Cost for Upgrading Maintenance Facility.
(5) Costs for constructing CNG Fueling Station and Fuel Island Upgrades.
Net Annual Cash
FlowYear
(1)Annual Fuel
Costs Diesel
(1)Annual Fuel
Costs CNG
(1)Annual Fuel
Cost Savings
(2)Annual Fleet
Maintenance
Costs
(2)Annual
Facility
Maintenance
Costs
Total Change In
Operational
Expenditures
(3)Incremental
CNG Fleet
Expenditures
(4)Garage
Renovation
Expenditure
(5)Fueling
Facility
Expenditure
Total Capital
Expenditures
Detailed Cash Flow-Expansion 65

GoRaleigh Transit
Local Service Expanded Fleet
Detailed Project Cash Flow - EIA 2017 Reference Case
A1 A2 A B C D = A + B + C E F G H = E + F + G I = D + H
0 $0 $0 $0 $0 $0 $0 $0 $0 $0 $0 $0
1 $528,377 $449,208 -$79,169 $0 $0 -$79,169 $782,000 $283,872 $4,707,538 $5,773,410 -$5,694,241
2 $1,079,843 $861,692 -$218,151 $0 $0 -$218,151 $690,000 $0 $0 $690,000 -$471,849
3 $1,607,189 $1,238,089 -$369,100 $0 $0 -$369,100 $598,000 $0 $0 $598,000 -$228,900
4 $2,134,135 $1,593,098 -$541,037 $0 $0 -$541,037 $552,000 $0 $0 $552,000 -$10,963
5 $2,603,695 $1,874,585 -$729,110 $0 $0 -$729,110 $414,000 $0 $0 $414,000 $315,110
6 $3,104,449 $2,197,533 -$906,916 $0 $0 -$906,916 $460,000 $0 $0 $460,000 $446,916
7 $3,540,612 $2,473,481 -$1,067,131 $0 $0 -$1,067,131 $368,000 $0 $0 $368,000 $699,131
8 $4,055,931 $2,773,806 -$1,282,125 $0 $0 -$1,282,125 $368,000 $0 $0 $368,000 $914,125
9 $4,203,856 $2,845,232 -$1,358,624 $0 $0 -$1,358,624 $0 $0 $0 $0 $1,358,624
10 $4,348,437 $2,914,783 -$1,433,654 $0 $0 -$1,433,654 $0 $0 $0 $0 $1,433,654
11 $4,458,648 $3,024,710 -$1,433,939 $0 $0 -$1,433,939 $0 $0 $0 $0 $1,433,939
12 $4,607,854 $3,121,970 -$1,485,884 $0 $0 -$1,485,884 $0 $0 $0 $0 $1,485,884
13 $4,792,475 $3,205,771 -$1,586,703 $0 $0 -$1,586,703 $782,000 $0 $0 $782,000 $804,703
14 $4,965,292 $3,249,256 -$1,716,036 $0 $0 -$1,716,036 $690,000 $0 $0 $690,000 $1,026,036
15 $5,150,349 $3,340,897 -$1,809,452 $0 $0 -$1,809,452 $548,167 $0 $0 $548,167 $1,261,285
16 $5,256,929 $3,402,103 -$1,854,826 $0 $0 -$1,854,826 $460,000 $0 $0 $460,000 $1,394,826
17 $5,416,376 $3,471,881 -$1,944,496 $0 $0 -$1,944,496 $310,500 $0 $0 $310,500 $1,633,996
18 $5,550,662 $3,569,288 -$1,981,374 $0 $0 -$1,981,374 $306,667 $0 $0 $306,667 $1,674,707
19 $5,752,935 $3,653,636 -$2,099,298 $0 $0 -$2,099,298 $214,667 $0 $0 $214,667 $1,884,632
20 $5,866,943 $3,742,900 -$2,124,044 $0 $0 -$2,124,044 $184,000 $0 $0 $184,000 $1,940,044
21 $5,995,287 $3,818,219 -$2,177,068 $0 $0 -$2,177,068 $0 $0 $0 $0 $2,177,068
22 $6,176,447 $3,889,137 -$2,287,310 $0 $0 -$2,287,310 $0 $0 $0 $0 $2,287,310
23 $6,327,461 $3,952,655 -$2,374,806 $0 $0 -$2,374,806 $0 $0 $0 $0 $2,374,806
23 $6,466,202 $4,031,137 -$2,435,065 $0 $0 -$2,435,065 $0 $0 $0 $0 $2,435,065
25 $6,583,634 $4,114,812 -$2,468,822 $0 $0 -$2,468,822 $65,167 $0 $0 $65,167 $2,403,655
Totals $110,574,018 $72,809,878 -$37,764,140 $0 $0 -$37,764,140 $7,793,167 $283,872 $4,707,538 $12,784,577 $24,979,564
(1) Differential EIA 2017 Reference Case; Nominal Pricing CNG and Diesel For Transportation Internal Rate of Return: 11.7%
(6) Net Present Value $14,073,311
(2) No Costs associated with the differential maintenance between CNG and Diesel vehicles.
(6) Assumes Discount Rate of 2.5%
(3) Incremental cost for purchasing CNG buses versus Diesel. NO BRT Buses Included. Note: 32 BRT Buses Not Included
(4) Cost for Upgrading Maintenance Facility.
(5) Costs for constructing CNG Fueling Station and Fuel Island Upgrades.
Net Annual Cash
FlowYear
(1)Annual Fuel
Costs Diesel
(1)Annual Fuel
Costs CNG
(1)Annual Fuel
Cost Savings
(2)Annual Fleet
Maintenance
Costs
(2)Annual
Facility
Maintenance
Costs
Total Change In
Operational
Expenditures
(3)Incremental
CNG Fleet
Expenditures
(4)Garage
Renovation
Expenditure
(5)Fueling
Facility
Expenditure
Total Capital
Expenditures
Detailed Cash Flow-Exp; No BRT 66
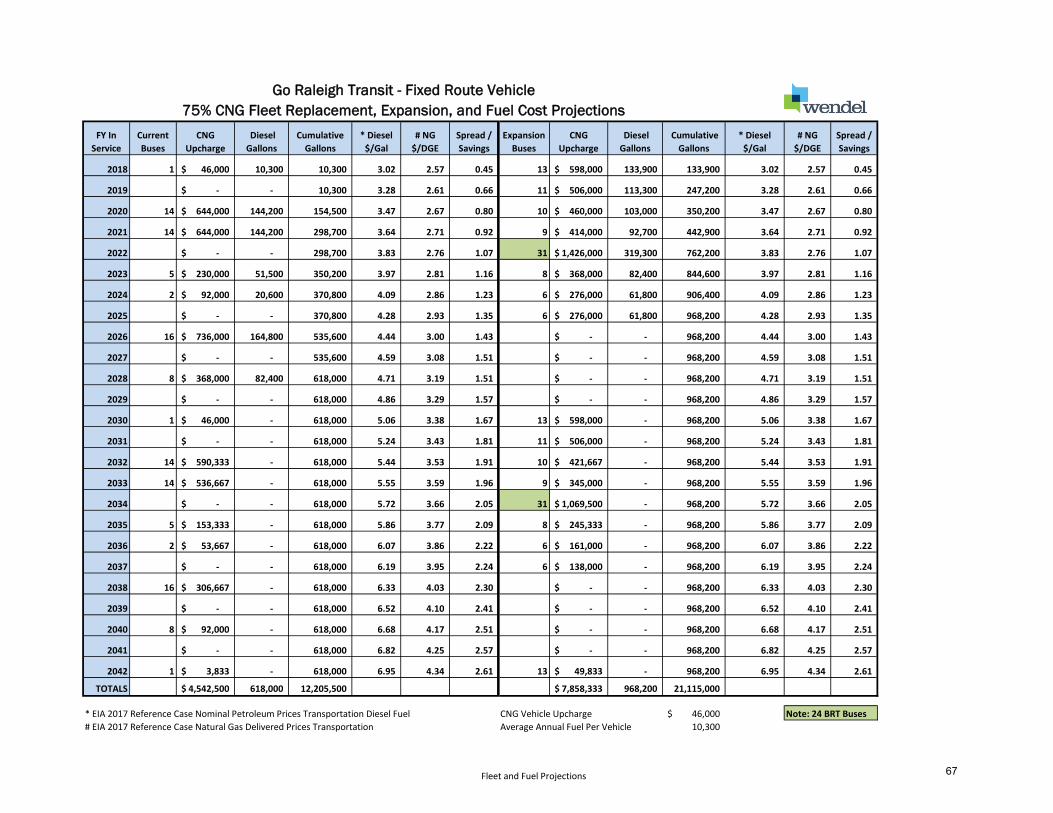
FY In
Service
Current
Buses
CNG
Upcharge
Diesel
Gallons
Cumulative
Gallons
* Diesel
$/Gal
# NG
$/DGE
Spread /
Savings
Expansion
Buses
CNG
Upcharge
Diesel
Gallons
Cumulative
Gallons
* Diesel
$/Gal
# NG
$/DGE
Spread /
Savings
2018 1 46,000$ 10,300 10,300 3.02 2.57 0.45 13 598,000$ 133,900 133,900 3.02 2.57 0.45
2019 -$ - 10,300 3.28 2.61 0.66 11 506,000$ 113,300 247,200 3.28 2.61 0.66
2020 14 644,000$ 144,200 154,500 3.47 2.67 0.80 10 460,000$ 103,000 350,200 3.47 2.67 0.80
2021 14 644,000$ 144,200 298,700 3.64 2.71 0.92 9 414,000$ 92,700 442,900 3.64 2.71 0.92
2022 -$ - 298,700 3.83 2.76 1.07 31 1,426,000$ 319,300 762,200 3.83 2.76 1.07
2023 5 230,000$ 51,500 350,200 3.97 2.81 1.16 8 368,000$ 82,400 844,600 3.97 2.81 1.16
2024 2 92,000$ 20,600 370,800 4.09 2.86 1.23 6 276,000$ 61,800 906,400 4.09 2.86 1.23
2025 -$ - 370,800 4.28 2.93 1.35 6 276,000$ 61,800 968,200 4.28 2.93 1.35
2026 16 736,000$ 164,800 535,600 4.44 3.00 1.43 -$ - 968,200 4.44 3.00 1.43
2027 -$ - 535,600 4.59 3.08 1.51 -$ - 968,200 4.59 3.08 1.51
2028 8 368,000$ 82,400 618,000 4.71 3.19 1.51 -$ - 968,200 4.71 3.19 1.51
2029 -$ - 618,000 4.86 3.29 1.57 -$ - 968,200 4.86 3.29 1.57
2030 1 46,000$ - 618,000 5.06 3.38 1.67 13 598,000$ - 968,200 5.06 3.38 1.67
2031 -$ - 618,000 5.24 3.43 1.81 11 506,000$ - 968,200 5.24 3.43 1.81
2032 14 590,333$ - 618,000 5.44 3.53 1.91 10 421,667$ - 968,200 5.44 3.53 1.91
2033 14 536,667$ - 618,000 5.55 3.59 1.96 9 345,000$ - 968,200 5.55 3.59 1.96
2034 -$ - 618,000 5.72 3.66 2.05 31 1,069,500$ - 968,200 5.72 3.66 2.05
2035 5 153,333$ - 618,000 5.86 3.77 2.09 8 245,333$ - 968,200 5.86 3.77 2.09
2036 2 53,667$ - 618,000 6.07 3.86 2.22 6 161,000$ - 968,200 6.07 3.86 2.22
2037 -$ - 618,000 6.19 3.95 2.24 6 138,000$ - 968,200 6.19 3.95 2.24
2038 16 306,667$ - 618,000 6.33 4.03 2.30 -$ - 968,200 6.33 4.03 2.30
2039 -$ - 618,000 6.52 4.10 2.41 -$ - 968,200 6.52 4.10 2.41
2040 8 92,000$ - 618,000 6.68 4.17 2.51 -$ - 968,200 6.68 4.17 2.51
2041 -$ - 618,000 6.82 4.25 2.57 -$ - 968,200 6.82 4.25 2.57
2042 1 3,833$ - 618,000 6.95 4.34 2.61 13 49,833$ - 968,200 6.95 4.34 2.61
TOTALS 4,542,500$ 618,000 12,205,500 7,858,333$ 968,200 21,115,000
* EIA 2017 Reference Case Nominal Petroleum Prices Transportation Diesel Fuel CNG Vehicle Upcharge 46,000$ Note: 24 BRT Buses
# EIA 2017 Reference Case Natural Gas Delivered Prices Transportation Average Annual Fuel Per Vehicle 10,300
Go Raleigh Transit - Fixed Route Vehicle
75% CNG Fleet Replacement, Expansion, and Fuel Cost Projections
Fleet and Fuel Projections 67

GoRaleigh Transit
75% CNG Fleet; Current and Expanded Services Combined
Detailed Project Cash Flow - EIA 2017 Reference Case
A1 A2 A B C D = A + B + C E F G H = E + F + G I = D + H
0 $0 $0 $0 $0 $0 $0 $0 $0 $0 $0 $0
1 $435,134 $369,936 -$65,198 $0 $0 -$65,198 $644,000 $283,872 $4,707,538 $5,635,410 -$5,570,212
2 $843,628 $673,197 -$170,431 $0 $0 -$170,431 $506,000 $0 $0 $506,000 -$335,569
3 $1,750,050 $1,348,141 -$401,909 $0 $0 -$401,909 $1,104,000 $0 $0 $1,104,000 -$702,091
4 $2,695,749 $2,012,334 -$683,415 $0 $0 -$683,415 $1,058,000 $0 $0 $1,058,000 -$374,585
5 $4,063,342 $2,925,489 -$1,137,854 $0 $0 -$1,137,854 $1,426,000 $0 $0 $1,426,000 -$288,146
6 $4,738,370 $3,354,129 -$1,384,241 $0 $0 -$1,384,241 $598,000 $0 $0 $598,000 $786,241
7 $5,226,618 $3,651,329 -$1,575,289 $0 $0 -$1,575,289 $368,000 $0 $0 $368,000 $1,207,289
8 $5,731,207 $3,919,508 -$1,811,699 $0 $0 -$1,811,699 $276,000 $0 $0 $276,000 $1,535,699
9 $6,671,337 $4,515,260 -$2,156,077 $0 $0 -$2,156,077 $736,000 $0 $0 $736,000 $1,420,077
10 $6,900,780 $4,625,634 -$2,275,146 $0 $0 -$2,275,146 $0 $0 $0 $0 $2,275,146
11 $7,463,390 $5,063,101 -$2,400,288 $0 $0 -$2,400,288 $368,000 $0 $0 $368,000 $2,032,288
12 $7,713,147 $5,225,906 -$2,487,240 $0 $0 -$2,487,240 $0 $0 $0 $0 $2,487,240
13 $8,022,186 $5,366,182 -$2,656,004 $0 $0 -$2,656,004 $644,000 $0 $0 $644,000 $2,012,004
14 $8,311,468 $5,438,973 -$2,872,495 $0 $0 -$2,872,495 $506,000 $0 $0 $506,000 $2,366,495
15 $8,621,237 $5,592,372 -$3,028,865 $0 $0 -$3,028,865 $1,012,000 $0 $0 $1,012,000 $2,016,865
16 $8,799,643 $5,694,825 -$3,104,818 $0 $0 -$3,104,818 $881,667 $0 $0 $881,667 $2,223,151
17 $9,066,543 $5,811,626 -$3,254,917 $0 $0 -$3,254,917 $1,069,500 $0 $0 $1,069,500 $2,185,417
18 $9,291,325 $5,974,677 -$3,316,648 $0 $0 -$3,316,648 $398,667 $0 $0 $398,667 $2,917,981
19 $9,629,912 $6,115,869 -$3,514,043 $0 $0 -$3,514,043 $214,667 $0 $0 $214,667 $3,299,376
20 $9,820,753 $6,265,288 -$3,555,464 $0 $0 -$3,555,464 $138,000 $0 $0 $138,000 $3,417,464
21 $10,035,589 $6,391,366 -$3,644,223 $0 $0 -$3,644,223 $306,667 $0 $0 $306,667 $3,337,557
22 $10,338,836 $6,510,077 -$3,828,759 $0 $0 -$3,828,759 $0 $0 $0 $0 $3,828,759
23 $10,591,619 $6,616,400 -$3,975,219 $0 $0 -$3,975,219 $92,000 $0 $0 $92,000 $3,883,219
24 $10,823,859 $6,747,772 -$4,076,087 $0 $0 -$4,076,087 $0 $0 $0 $0 $4,076,087
25 $11,020,431 $6,887,838 -$4,132,593 $0 $0 -$4,132,593 $53,667 $0 $0 $53,667 $4,078,926
Totals $178,606,151 $117,097,231 -$61,508,920 $0 $0 -$61,508,920 $12,400,833 $283,872 $4,707,538 $17,392,243 $44,116,676
(1) Differential EIA 2017 Reference Case; Nominal Pricing CNG and Diesel For Transportation Internal Rate of Return: 15.1%
(6) Net Present Value $25,964,468
(2) No Costs associated with the differential maintenance between CNG and Diesel vehicles.
(6) Assumes Discount Rate of 2.5%
(3) Incremental cost for purchasing CNG buses versus Diesel.
(4) Cost for Upgrading Maintenance Facility.
(5) Costs for constructing CNG Fueling Station and Fuel Island Upgrades.
Total Capital
Expenditures
Net Annual Cash
Flow
(2)Annual
Facility
Maintenance
Costs
Total Change In
Operational
Expenditures
(3)Incremental
CNG Fleet
Expenditures
(4)Garage
Renovation
Expenditure
(5)Fueling
Facility
Expenditure
Year(1)
Annual Fuel
Costs Diesel
(1)Annual Fuel
Costs CNG
(1)Annual Fuel
Cost Savings
(2)Annual Fleet
Maintenance
Costs
Detailed Cash Flow - Combined 68

GoRaleigh Transit
Current Service 75% CNG Fleet Replacement
Detailed Project Cash Flow - EIA 2017 Reference Case
A1 A2 A B C D = A + B + C E F G H = E + F + G I = D + H
0 $0 $0 $0 $0 $0 $0 $0 $0 $0 $0 $0
1 $31,081 $26,424 -$4,657 $0 $0 -$4,657 $46,000 $283,872 $4,707,538 $5,037,410 -$5,032,753
2 $33,745 $26,928 -$6,817 $0 $0 -$6,817 $0 $0 $0 $0 $6,817
3 $535,730 $412,696 -$123,033 $0 $0 -$123,033 $644,000 $0 $0 $644,000 -$520,967
4 $1,085,788 $810,523 -$275,264 $0 $0 -$275,264 $644,000 $0 $0 $644,000 -$368,736
5 $1,144,048 $823,681 -$320,367 $0 $0 -$320,367 $0 $0 $0 $0 $320,367
6 $1,388,833 $983,107 -$405,726 $0 $0 -$405,726 $230,000 $0 $0 $230,000 $175,726
7 $1,517,405 $1,060,063 -$457,342 $0 $0 -$457,342 $92,000 $0 $0 $92,000 $365,342
8 $1,587,103 $1,085,402 -$501,701 $0 $0 -$501,701 $0 $0 $0 $0 $501,701
9 $2,376,092 $1,608,175 -$767,918 $0 $0 -$767,918 $736,000 $0 $0 $736,000 $31,918
10 $2,457,812 $1,647,486 -$810,326 $0 $0 -$810,326 $0 $0 $0 $0 $810,326
11 $2,907,814 $1,972,637 -$935,177 $0 $0 -$935,177 $368,000 $0 $0 $368,000 $567,177
12 $3,005,122 $2,036,067 -$969,055 $0 $0 -$969,055 $0 $0 $0 $0 $969,055
13 $3,125,527 $2,090,720 -$1,034,807 $0 $0 -$1,034,807 $46,000 $0 $0 $46,000 $988,807
14 $3,238,234 $2,119,080 -$1,119,154 $0 $0 -$1,119,154 $0 $0 $0 $0 $1,119,154
15 $3,358,923 $2,178,846 -$1,180,077 $0 $0 -$1,180,077 $590,333 $0 $0 $590,333 $589,744
16 $3,428,432 $2,218,763 -$1,209,669 $0 $0 -$1,209,669 $536,667 $0 $0 $536,667 $673,003
17 $3,532,419 $2,264,270 -$1,268,149 $0 $0 -$1,268,149 $0 $0 $0 $0 $1,268,149
18 $3,619,997 $2,327,796 -$1,292,200 $0 $0 -$1,292,200 $153,333 $0 $0 $153,333 $1,138,867
19 $3,751,914 $2,382,806 -$1,369,108 $0 $0 -$1,369,108 $53,667 $0 $0 $53,667 $1,315,441
20 $3,826,267 $2,441,021 -$1,385,246 $0 $0 -$1,385,246 $0 $0 $0 $0 $1,385,246
21 $3,909,970 $2,490,143 -$1,419,827 $0 $0 -$1,419,827 $306,667 $0 $0 $306,667 $1,113,161
22 $4,028,118 $2,536,394 -$1,491,724 $0 $0 -$1,491,724 $0 $0 $0 $0 $1,491,724
23 $4,126,605 $2,577,818 -$1,548,787 $0 $0 -$1,548,787 $92,000 $0 $0 $92,000 $1,456,787
24 $4,217,088 $2,629,002 -$1,588,086 $0 $0 -$1,588,086 $0 $0 $0 $0 $1,588,086
25 $4,293,674 $2,683,573 -$1,610,101 $0 $0 -$1,610,101 $3,833 $0 $0 $3,833 $1,606,268
Totals $66,527,742 $43,433,424 -$23,094,318 $0 $0 -$23,094,318 $4,542,500 $283,872 $4,707,538 $9,533,910 $13,560,408
(1) Differential EIA 2017 Reference Case; Nominal Pricing CNG and Diesel For Transportation Internal Rate of Return: 8.1%
(6) Net Present Value $6,775,454
(2) No Costs associated with the differential maintenance between CNG and Diesel vehicles.
(6) Assumes Discount Rate of 2.5%
(3) Incremental cost for purchasing CNG buses versus Diesel.
(4) Cost for Upgrading Maintenance Facility.
(5) Costs for constructing CNG Fueling Station and Fuel Island Upgrades.
Net Annual Cash
FlowYear
(1)Annual Fuel
Costs Diesel
(1)Annual Fuel
Costs CNG
(1)Annual Fuel
Cost Savings
(2)Annual Fleet
Maintenance
Costs
(2)Annual
Facility
Maintenance
Costs
Total Change In
Operational
Expenditures
(3)Incremental
CNG Fleet
Expenditures
(4)Garage
Renovation
Expenditure
(5)Fueling
Facility
Expenditure
Total Capital
Expenditures
Detailed Cash Flow-Current 69

GoRaleigh Transit
Local and BRT; 75% CNG Expanded Service Fleet
Detailed Project Cash Flow - EIA 2017 Reference Case
A1 A2 A B C D = A + B + C E F G H = E + F + G I = D + H
0 $0 $0 $0 $0 $0 $0 $0 $0 $0 $0 $0
1 $404,053 $343,512 -$60,541 $0 $0 -$60,541 $598,000 $283,872 $4,707,538 $5,589,410 -$5,528,869
2 $809,883 $646,269 -$163,613 $0 $0 -$163,613 $506,000 $0 $0 $506,000 -$342,387
3 $1,214,321 $935,445 -$278,876 $0 $0 -$278,876 $460,000 $0 $0 $460,000 -$181,124
4 $1,609,961 $1,201,811 -$408,151 $0 $0 -$408,151 $414,000 $0 $0 $414,000 -$5,849
5 $2,919,295 $2,101,807 -$817,487 $0 $0 -$817,487 $1,426,000 $0 $0 $1,426,000 -$608,513
6 $3,349,537 $2,371,022 -$978,515 $0 $0 -$978,515 $368,000 $0 $0 $368,000 $610,515
7 $3,709,213 $2,591,266 -$1,117,947 $0 $0 -$1,117,947 $276,000 $0 $0 $276,000 $841,947
8 $4,144,103 $2,834,106 -$1,309,997 $0 $0 -$1,309,997 $276,000 $0 $0 $276,000 $1,033,997
9 $4,295,244 $2,907,085 -$1,388,159 $0 $0 -$1,388,159 $0 $0 $0 $0 $1,388,159
10 $4,442,968 $2,978,148 -$1,464,820 $0 $0 -$1,464,820 $0 $0 $0 $0 $1,464,820
11 $4,555,576 $3,090,464 -$1,465,111 $0 $0 -$1,465,111 $0 $0 $0 $0 $1,465,111
12 $4,708,025 $3,189,839 -$1,518,185 $0 $0 -$1,518,185 $0 $0 $0 $0 $1,518,185
13 $4,896,659 $3,275,462 -$1,621,197 $0 $0 -$1,621,197 $598,000 $0 $0 $598,000 $1,023,197
14 $5,073,233 $3,319,892 -$1,753,341 $0 $0 -$1,753,341 $506,000 $0 $0 $506,000 $1,247,341
15 $5,262,313 $3,413,526 -$1,848,788 $0 $0 -$1,848,788 $421,667 $0 $0 $421,667 $1,427,121
16 $5,371,211 $3,476,062 -$1,895,149 $0 $0 -$1,895,149 $345,000 $0 $0 $345,000 $1,550,149
17 $5,534,124 $3,547,356 -$1,986,768 $0 $0 -$1,986,768 $1,069,500 $0 $0 $1,069,500 $917,268
18 $5,671,328 $3,646,881 -$2,024,447 $0 $0 -$2,024,447 $245,333 $0 $0 $245,333 $1,779,114
19 $5,877,998 $3,733,063 -$2,144,935 $0 $0 -$2,144,935 $161,000 $0 $0 $161,000 $1,983,935
20 $5,994,485 $3,824,267 -$2,170,218 $0 $0 -$2,170,218 $138,000 $0 $0 $138,000 $2,032,218
21 $6,125,619 $3,901,223 -$2,224,396 $0 $0 -$2,224,396 $0 $0 $0 $0 $2,224,396
22 $6,310,718 $3,973,683 -$2,337,035 $0 $0 -$2,337,035 $0 $0 $0 $0 $2,337,035
23 $6,465,014 $4,038,582 -$2,426,432 $0 $0 -$2,426,432 $0 $0 $0 $0 $2,426,432
24 $6,606,771 $4,118,770 -$2,488,001 $0 $0 -$2,488,001 $0 $0 $0 $0 $2,488,001
25 $6,726,756 $4,204,265 -$2,522,492 $0 $0 -$2,522,492 $49,833 $0 $0 $49,833 $2,472,658
Totals $112,078,409 $73,663,807 -$38,414,601 $0 $0 -$38,414,601 $7,858,333 $283,872 $4,707,538 $12,849,743 $25,564,858
(1) Differential EIA 2017 Reference Case; Nominal Pricing CNG and Diesel For Transportation Internal Rate of Return: 11.8%
(6) Net Present Value $14,438,118
(2) No Costs associated with the differential maintenance between CNG and Diesel vehicles.
(6) Assumes Discount Rate of 2.5%
(3) Incremental cost for purchasing CNG buses versus Diesel.
(4) Cost for Upgrading Maintenance Facility.
(5) Costs for constructing CNG Fueling Station and Fuel Island Upgrades.
Net Annual Cash
FlowYear
(1)Annual Fuel
Costs Diesel
(1)Annual Fuel
Costs CNG
(1)Annual Fuel
Cost Savings
(2)Annual Fleet
Maintenance
Costs
(2)Annual
Facility
Maintenance
Costs
Total Change In
Operational
Expenditures
(3)Incremental
CNG Fleet
Expenditures
(4)Garage
Renovation
Expenditure
(5)Fueling
Facility
Expenditure
Total Capital
Expenditures
Detailed Cash Flow-Expansion 70

GoRaleigh Transit
Local Service; 75% CNG Expanded Fleet
Detailed Project Cash Flow - EIA 2017 Reference Case
A1 A2 A B C D = A + B + C E F G H = E + F + G I = D + H
0 $0 $0 $0 $0 $0 $0 $0 $0 $0 $0 $0
1 $404,053 $343,512 -$60,541 $0 $0 -$60,541 $598,000 $283,872 $4,707,538 $5,589,410 -$5,528,869
2 $809,883 $646,269 -$163,613 $0 $0 -$163,613 $506,000 $0 $0 $506,000 -$342,387
3 $1,214,321 $935,445 -$278,876 $0 $0 -$278,876 $460,000 $0 $0 $460,000 -$181,124
4 $1,609,961 $1,201,811 -$408,151 $0 $0 -$408,151 $414,000 $0 $0 $414,000 -$5,849
5 $1,972,496 $1,420,140 -$552,356 $0 $0 -$552,356 $322,000 $0 $0 $322,000 $230,356
6 $2,369,185 $1,677,065 -$692,120 $0 $0 -$692,120 $368,000 $0 $0 $368,000 $324,120
7 $2,697,609 $1,884,557 -$813,052 $0 $0 -$813,052 $276,000 $0 $0 $276,000 $537,052
8 $3,086,034 $2,110,504 -$975,530 $0 $0 -$975,530 $276,000 $0 $0 $276,000 $699,530
9 $3,198,586 $2,164,851 -$1,033,735 $0 $0 -$1,033,735 $0 $0 $0 $0 $1,033,735
10 $3,308,593 $2,217,770 -$1,090,824 $0 $0 -$1,090,824 $0 $0 $0 $0 $1,090,824
11 $3,392,450 $2,301,410 -$1,091,040 $0 $0 -$1,091,040 $0 $0 $0 $0 $1,091,040
12 $3,505,976 $2,375,412 -$1,130,564 $0 $0 -$1,130,564 $0 $0 $0 $0 $1,130,564
13 $3,646,448 $2,439,174 -$1,207,274 $0 $0 -$1,207,274 $598,000 $0 $0 $598,000 $609,274
14 $3,777,940 $2,472,260 -$1,305,679 $0 $0 -$1,305,679 $506,000 $0 $0 $506,000 $799,679
15 $3,918,744 $2,541,987 -$1,376,757 $0 $0 -$1,376,757 $421,667 $0 $0 $421,667 $955,090
16 $3,999,838 $2,588,557 -$1,411,281 $0 $0 -$1,411,281 $345,000 $0 $0 $345,000 $1,066,281
17 $4,121,156 $2,641,648 -$1,479,508 $0 $0 -$1,479,508 $241,500 $0 $0 $241,500 $1,238,008
18 $4,223,330 $2,715,762 -$1,507,567 $0 $0 -$1,507,567 $245,333 $0 $0 $245,333 $1,262,234
19 $4,377,233 $2,779,941 -$1,597,292 $0 $0 -$1,597,292 $161,000 $0 $0 $161,000 $1,436,292
20 $4,463,978 $2,847,858 -$1,616,120 $0 $0 -$1,616,120 $138,000 $0 $0 $138,000 $1,478,120
21 $4,561,631 $2,905,166 -$1,656,465 $0 $0 -$1,656,465 $0 $0 $0 $0 $1,656,465
22 $4,699,471 $2,959,126 -$1,740,345 $0 $0 -$1,740,345 $0 $0 $0 $0 $1,740,345
23 $4,814,372 $3,007,455 -$1,806,918 $0 $0 -$1,806,918 $0 $0 $0 $0 $1,806,918
23 $4,919,936 $3,067,169 -$1,852,767 $0 $0 -$1,852,767 $0 $0 $0 $0 $1,852,767
25 $5,009,287 $3,130,835 -$1,878,451 $0 $0 -$1,878,451 $49,833 $0 $0 $49,833 $1,828,618
Totals $84,102,511 $55,375,684 -$28,726,827 $0 $0 -$28,726,827 $5,926,333 $283,872 $4,707,538 $10,917,743 $17,809,083
(1) Differential EIA 2017 Reference Case; Nominal Pricing CNG and Diesel For Transportation Internal Rate of Return: 9.8%
(6) Net Present Value $9,569,335
(2) No Costs associated with the differential maintenance between CNG and Diesel vehicles.
(6) Assumes Discount Rate of 2.5%
(3) Incremental cost for purchasing CNG buses versus Diesel. NO BRT Buses Included. Note: 24 BRT Buses Not Included
(4) Cost for Upgrading Maintenance Facility.
(5) Costs for constructing CNG Fueling Station and Fuel Island Upgrades.
Net Annual Cash
FlowYear
(1)Annual Fuel
Costs Diesel
(1)Annual Fuel
Costs CNG
(1)Annual Fuel
Cost Savings
(2)Annual Fleet
Maintenance
Costs
(2)Annual
Facility
Maintenance
Costs
Total Change In
Operational
Expenditures
(3)Incremental
CNG Fleet
Expenditures
(4)Garage
Renovation
Expenditure
(5)Fueling
Facility
Expenditure
Total Capital
Expenditures
Detailed Cash Flow-Exp; No BRT 71

FY In
Service
Current
Buses
CNG
Upcharge
Diesel
Gallons
Cumulative
Gallons
* Diesel
$/Gal
# NG
$/DGE
Spread /
Savings
Expansion
Buses
CNG
Upcharge
Diesel
Gallons
Cumulative
Gallons
* Diesel
$/Gal
# NG
$/DGE
Spread /
Savings
2018 1 46,000$ 10,300 10,300 3.02 2.57 0.45 9 414,000$ 92,700 92,700 3.02 2.57 0.45
2019 -$ - 10,300 3.28 2.61 0.66 8 368,000$ 82,400 175,100 3.28 2.61 0.66
2020 9 414,000$ 92,700 103,000 3.47 2.67 0.80 7 322,000$ 72,100 247,200 3.47 2.67 0.80
2021 10 460,000$ 103,000 206,000 3.64 2.71 0.92 6 276,000$ 61,800 309,000 3.64 2.71 0.92
2022 -$ - 206,000 3.83 2.76 1.07 21 966,000$ 216,300 525,300 3.83 2.76 1.07
2023 4 184,000$ 41,200 247,200 3.97 2.81 1.16 5 230,000$ 51,500 576,800 3.97 2.81 1.16
2024 1 46,000$ 10,300 257,500 4.09 2.86 1.23 4 184,000$ 41,200 618,000 4.09 2.86 1.23
2025 -$ - 257,500 4.28 2.93 1.35 4 184,000$ 41,200 659,200 4.28 2.93 1.35
2026 11 506,000$ 113,300 370,800 4.44 3.00 1.43 -$ - 659,200 4.44 3.00 1.43
2027 -$ - 370,800 4.59 3.08 1.51 -$ - 659,200 4.59 3.08 1.51
2028 6 276,000$ 61,800 432,600 4.71 3.19 1.51 -$ - 659,200 4.71 3.19 1.51
2029 -$ - 432,600 4.86 3.29 1.57 -$ - 659,200 4.86 3.29 1.57
2030 1 46,000$ - 432,600 5.06 3.38 1.67 9 414,000$ - 659,200 5.06 3.38 1.67
2031 -$ - 432,600 5.24 3.43 1.81 8 368,000$ - 659,200 5.24 3.43 1.81
2032 9 379,500$ - 432,600 5.44 3.53 1.91 7 295,167$ - 659,200 5.44 3.53 1.91
2033 10 383,333$ - 432,600 5.55 3.59 1.96 6 230,000$ - 659,200 5.55 3.59 1.96
2034 -$ - 432,600 5.72 3.66 2.05 21 724,500$ - 659,200 5.72 3.66 2.05
2035 4 122,667$ - 432,600 5.86 3.77 2.09 5 153,333$ - 659,200 5.86 3.77 2.09
2036 1 26,833$ - 432,600 6.07 3.86 2.22 4 107,333$ - 659,200 6.07 3.86 2.22
2037 -$ - 432,600 6.19 3.95 2.24 4 92,000$ - 659,200 6.19 3.95 2.24
2038 11 210,833$ - 432,600 6.33 4.03 2.30 -$ - 659,200 6.33 4.03 2.30
2039 -$ - 432,600 6.52 4.10 2.41 -$ - 659,200 6.52 4.10 2.41
2040 6 69,000$ - 432,600 6.68 4.17 2.51 -$ - 659,200 6.68 4.17 2.51
2041 -$ - 432,600 6.82 4.25 2.57 -$ - 659,200 6.82 4.25 2.57
2042 1 3,833$ - 432,600 6.95 4.34 2.61 9 34,500$ - 659,200 6.95 4.34 2.61
TOTALS 3,174,000$ 432,600 8,528,400 5,362,833$ 659,200 14,409,700
* EIA 2017 Reference Case Nominal Petroleum Prices Transportation Diesel Fuel CNG Vehicle Upcharge 46,000$ Note: 16 BRT Buses
# EIA 2017 Reference Case Natural Gas Delivered Prices Transportation Average Annual Fuel Per Vehicle 10,300
Go Raleigh Transit - Fixed Route Vehicle
50% CNG Fleet Replacement, Expansion, and Fuel Cost Projections
Fleet and Fuel Projections 72

GoRaleigh Transit
50% CNG Fleet; Current and Expanded Services Combined
Detailed Project Cash Flow - EIA 2017 Reference Case
A1 A2 A B C D = A + B + C E F G H = E + F + G I = D + H
0 $0 $0 $0 $0 $0 $0 $0 $0 $0 $0 $0
1 $310,810 $264,240 -$46,570 $0 $0 -$46,570 $460,000 $283,872 $4,707,538 $5,451,410 -$5,404,840
2 $607,412 $484,702 -$122,710 $0 $0 -$122,710 $368,000 $0 $0 $368,000 -$245,290
3 $1,214,321 $935,445 -$278,876 $0 $0 -$278,876 $736,000 $0 $0 $736,000 -$457,124
4 $1,872,048 $1,397,454 -$474,594 $0 $0 -$474,594 $736,000 $0 $0 $736,000 -$261,406
5 $2,800,945 $2,016,599 -$784,346 $0 $0 -$784,346 $966,000 $0 $0 $966,000 -$181,654
6 $3,267,841 $2,313,193 -$954,649 $0 $0 -$954,649 $414,000 $0 $0 $414,000 $540,649
7 $3,582,762 $2,502,927 -$1,079,835 $0 $0 -$1,079,835 $230,000 $0 $0 $230,000 $849,835
8 $3,923,672 $2,683,356 -$1,240,317 $0 $0 -$1,240,317 $184,000 $0 $0 $184,000 $1,056,317
9 $4,569,409 $3,092,644 -$1,476,765 $0 $0 -$1,476,765 $506,000 $0 $0 $506,000 $970,765
10 $4,726,562 $3,168,242 -$1,558,319 $0 $0 -$1,558,319 $0 $0 $0 $0 $1,558,319
11 $5,137,138 $3,484,992 -$1,652,147 $0 $0 -$1,652,147 $276,000 $0 $0 $276,000 $1,376,147
12 $5,309,049 $3,597,053 -$1,711,996 $0 $0 -$1,711,996 $0 $0 $0 $0 $1,711,996
13 $5,521,764 $3,693,606 -$1,828,158 $0 $0 -$1,828,158 $460,000 $0 $0 $460,000 $1,368,158
14 $5,720,880 $3,743,708 -$1,977,172 $0 $0 -$1,977,172 $368,000 $0 $0 $368,000 $1,609,172
15 $5,934,098 $3,849,295 -$2,084,803 $0 $0 -$2,084,803 $674,667 $0 $0 $674,667 $1,410,136
16 $6,056,897 $3,919,814 -$2,137,083 $0 $0 -$2,137,083 $613,333 $0 $0 $613,333 $1,523,749
17 $6,240,608 $4,000,210 -$2,240,397 $0 $0 -$2,240,397 $724,500 $0 $0 $724,500 $1,515,897
18 $6,395,328 $4,112,440 -$2,282,887 $0 $0 -$2,282,887 $276,000 $0 $0 $276,000 $2,006,887
19 $6,628,381 $4,209,624 -$2,418,757 $0 $0 -$2,418,757 $134,167 $0 $0 $134,167 $2,284,590
20 $6,759,739 $4,312,471 -$2,447,268 $0 $0 -$2,447,268 $92,000 $0 $0 $92,000 $2,355,268
21 $6,907,613 $4,399,252 -$2,508,361 $0 $0 -$2,508,361 $210,833 $0 $0 $210,833 $2,297,528
22 $7,116,341 $4,480,962 -$2,635,379 $0 $0 -$2,635,379 $0 $0 $0 $0 $2,635,379
23 $7,290,335 $4,554,146 -$2,736,190 $0 $0 -$2,736,190 $69,000 $0 $0 $69,000 $2,667,190
24 $7,450,189 $4,644,570 -$2,805,618 $0 $0 -$2,805,618 $0 $0 $0 $0 $2,805,618
25 $7,585,491 $4,740,979 -$2,844,512 $0 $0 -$2,844,512 $38,333 $0 $0 $38,333 $2,806,178
Totals $122,929,634 $80,601,925 -$42,327,709 $0 $0 -$42,327,709 $8,536,833 $283,872 $4,707,538 $13,528,243 $28,799,465
(1) Differential EIA 2017 Reference Case; Nominal Pricing CNG and Diesel For Transportation Internal Rate of Return: 12.4%
(6) Net Present Value $16,382,491
(2) No Costs associated with the differential maintenance between CNG and Diesel vehicles.
(6) Assumes Discount Rate of 2.5%
(3) Incremental cost for purchasing CNG buses versus Diesel.
(4) Cost for Upgrading Maintenance Facility.
(5) Costs for constructing CNG Fueling Station and Fuel Island Upgrades.
Total Capital
Expenditures
Net Annual Cash
Flow
(2)Annual
Facility
Maintenance
Costs
Total Change In
Operational
Expenditures
(3)Incremental
CNG Fleet
Expenditures
(4)Garage
Renovation
Expenditure
(5)Fueling
Facility
Expenditure
Year(1)
Annual Fuel
Costs Diesel
(1)Annual Fuel
Costs CNG
(1)Annual Fuel
Cost Savings
(2)Annual Fleet
Maintenance
Costs
Detailed Cash Flow - Combined 73
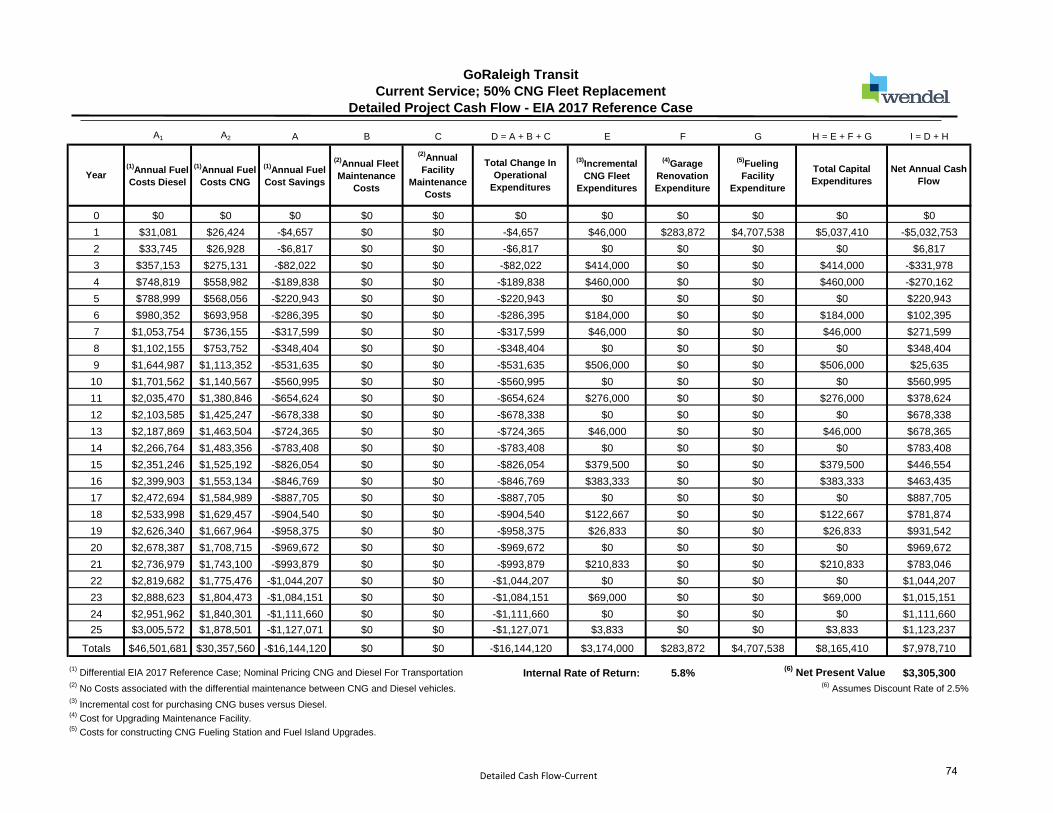
GoRaleigh Transit
Current Service; 50% CNG Fleet Replacement
Detailed Project Cash Flow - EIA 2017 Reference Case
A1 A2 A B C D = A + B + C E F G H = E + F + G I = D + H
0 $0 $0 $0 $0 $0 $0 $0 $0 $0 $0 $0
1 $31,081 $26,424 -$4,657 $0 $0 -$4,657 $46,000 $283,872 $4,707,538 $5,037,410 -$5,032,753
2 $33,745 $26,928 -$6,817 $0 $0 -$6,817 $0 $0 $0 $0 $6,817
3 $357,153 $275,131 -$82,022 $0 $0 -$82,022 $414,000 $0 $0 $414,000 -$331,978
4 $748,819 $558,982 -$189,838 $0 $0 -$189,838 $460,000 $0 $0 $460,000 -$270,162
5 $788,999 $568,056 -$220,943 $0 $0 -$220,943 $0 $0 $0 $0 $220,943
6 $980,352 $693,958 -$286,395 $0 $0 -$286,395 $184,000 $0 $0 $184,000 $102,395
7 $1,053,754 $736,155 -$317,599 $0 $0 -$317,599 $46,000 $0 $0 $46,000 $271,599
8 $1,102,155 $753,752 -$348,404 $0 $0 -$348,404 $0 $0 $0 $0 $348,404
9 $1,644,987 $1,113,352 -$531,635 $0 $0 -$531,635 $506,000 $0 $0 $506,000 $25,635
10 $1,701,562 $1,140,567 -$560,995 $0 $0 -$560,995 $0 $0 $0 $0 $560,995
11 $2,035,470 $1,380,846 -$654,624 $0 $0 -$654,624 $276,000 $0 $0 $276,000 $378,624
12 $2,103,585 $1,425,247 -$678,338 $0 $0 -$678,338 $0 $0 $0 $0 $678,338
13 $2,187,869 $1,463,504 -$724,365 $0 $0 -$724,365 $46,000 $0 $0 $46,000 $678,365
14 $2,266,764 $1,483,356 -$783,408 $0 $0 -$783,408 $0 $0 $0 $0 $783,408
15 $2,351,246 $1,525,192 -$826,054 $0 $0 -$826,054 $379,500 $0 $0 $379,500 $446,554
16 $2,399,903 $1,553,134 -$846,769 $0 $0 -$846,769 $383,333 $0 $0 $383,333 $463,435
17 $2,472,694 $1,584,989 -$887,705 $0 $0 -$887,705 $0 $0 $0 $0 $887,705
18 $2,533,998 $1,629,457 -$904,540 $0 $0 -$904,540 $122,667 $0 $0 $122,667 $781,874
19 $2,626,340 $1,667,964 -$958,375 $0 $0 -$958,375 $26,833 $0 $0 $26,833 $931,542
20 $2,678,387 $1,708,715 -$969,672 $0 $0 -$969,672 $0 $0 $0 $0 $969,672
21 $2,736,979 $1,743,100 -$993,879 $0 $0 -$993,879 $210,833 $0 $0 $210,833 $783,046
22 $2,819,682 $1,775,476 -$1,044,207 $0 $0 -$1,044,207 $0 $0 $0 $0 $1,044,207
23 $2,888,623 $1,804,473 -$1,084,151 $0 $0 -$1,084,151 $69,000 $0 $0 $69,000 $1,015,151
24 $2,951,962 $1,840,301 -$1,111,660 $0 $0 -$1,111,660 $0 $0 $0 $0 $1,111,660
25 $3,005,572 $1,878,501 -$1,127,071 $0 $0 -$1,127,071 $3,833 $0 $0 $3,833 $1,123,237
Totals $46,501,681 $30,357,560 -$16,144,120 $0 $0 -$16,144,120 $3,174,000 $283,872 $4,707,538 $8,165,410 $7,978,710
(1) Differential EIA 2017 Reference Case; Nominal Pricing CNG and Diesel For Transportation Internal Rate of Return: 5.8%
(6) Net Present Value $3,305,300
(2) No Costs associated with the differential maintenance between CNG and Diesel vehicles.
(6) Assumes Discount Rate of 2.5%
(3) Incremental cost for purchasing CNG buses versus Diesel.
(4) Cost for Upgrading Maintenance Facility.
(5) Costs for constructing CNG Fueling Station and Fuel Island Upgrades.
Net Annual Cash
FlowYear
(1)Annual Fuel
Costs Diesel
(1)Annual Fuel
Costs CNG
(1)Annual Fuel
Cost Savings
(2)Annual Fleet
Maintenance
Costs
(2)Annual
Facility
Maintenance
Costs
Total Change In
Operational
Expenditures
(3)Incremental
CNG Fleet
Expenditures
(4)Garage
Renovation
Expenditure
(5)Fueling
Facility
Expenditure
Total Capital
Expenditures
Detailed Cash Flow-Current 74

GoRaleigh Transit
Local and BRT; 50% CNG Expanded Service Fleet
Detailed Project Cash Flow - EIA 2017 Reference Case
A1 A2 A B C D = A + B + C E F G H = E + F + G I = D + H
0 $0 $0 $0 $0 $0 $0 $0 $0 $0 $0 $0
1 $279,729 $237,816 -$41,913 $0 $0 -$41,913 $414,000 $283,872 $4,707,538 $5,405,410 -$5,363,497
2 $573,667 $457,774 -$115,893 $0 $0 -$115,893 $368,000 $0 $0 $368,000 -$252,107
3 $857,167 $660,314 -$196,853 $0 $0 -$196,853 $322,000 $0 $0 $322,000 -$125,147
4 $1,123,229 $838,473 -$284,756 $0 $0 -$284,756 $276,000 $0 $0 $276,000 $8,756
5 $2,011,946 $1,448,543 -$563,403 $0 $0 -$563,403 $966,000 $0 $0 $966,000 -$402,597
6 $2,287,489 $1,619,235 -$668,254 $0 $0 -$668,254 $230,000 $0 $0 $230,000 $438,254
7 $2,529,009 $1,766,772 -$762,236 $0 $0 -$762,236 $184,000 $0 $0 $184,000 $578,236
8 $2,821,517 $1,929,604 -$891,913 $0 $0 -$891,913 $184,000 $0 $0 $184,000 $707,913
9 $2,924,421 $1,979,292 -$945,129 $0 $0 -$945,129 $0 $0 $0 $0 $945,129
10 $3,025,000 $2,027,675 -$997,324 $0 $0 -$997,324 $0 $0 $0 $0 $997,324
11 $3,101,668 $2,104,146 -$997,522 $0 $0 -$997,522 $0 $0 $0 $0 $997,522
12 $3,205,463 $2,171,805 -$1,033,658 $0 $0 -$1,033,658 $0 $0 $0 $0 $1,033,658
13 $3,333,895 $2,230,102 -$1,103,794 $0 $0 -$1,103,794 $414,000 $0 $0 $414,000 $689,794
14 $3,454,116 $2,260,352 -$1,193,764 $0 $0 -$1,193,764 $368,000 $0 $0 $368,000 $825,764
15 $3,582,852 $2,324,103 -$1,258,749 $0 $0 -$1,258,749 $295,167 $0 $0 $295,167 $963,582
16 $3,656,994 $2,366,680 -$1,290,314 $0 $0 -$1,290,314 $230,000 $0 $0 $230,000 $1,060,314
17 $3,767,914 $2,415,221 -$1,352,693 $0 $0 -$1,352,693 $724,500 $0 $0 $724,500 $628,193
18 $3,861,330 $2,482,983 -$1,378,347 $0 $0 -$1,378,347 $153,333 $0 $0 $153,333 $1,225,014
19 $4,002,041 $2,541,660 -$1,460,382 $0 $0 -$1,460,382 $107,333 $0 $0 $107,333 $1,353,048
20 $4,081,352 $2,603,756 -$1,477,596 $0 $0 -$1,477,596 $92,000 $0 $0 $92,000 $1,385,596
21 $4,170,634 $2,656,152 -$1,514,482 $0 $0 -$1,514,482 $0 $0 $0 $0 $1,514,482
22 $4,296,659 $2,705,487 -$1,591,172 $0 $0 -$1,591,172 $0 $0 $0 $0 $1,591,172
23 $4,401,712 $2,749,673 -$1,652,039 $0 $0 -$1,652,039 $0 $0 $0 $0 $1,652,039
24 $4,498,227 $2,804,269 -$1,693,958 $0 $0 -$1,693,958 $0 $0 $0 $0 $1,693,958
25 $4,579,919 $2,862,478 -$1,717,441 $0 $0 -$1,717,441 $34,500 $0 $0 $34,500 $1,682,941
Totals $76,427,953 $50,244,365 -$26,183,588 $0 $0 -$26,183,588 $5,362,833 $283,872 $4,707,538 $10,354,243 $15,829,345
(1) Differential EIA 2017 Reference Case; Nominal Pricing CNG and Diesel For Transportation Internal Rate of Return: 9.2%
(6) Net Present Value $8,326,295
(2) No Costs associated with the differential maintenance between CNG and Diesel vehicles.
(6) Assumes Discount Rate of 2.5%
(3) Incremental cost for purchasing CNG buses versus Diesel.
(4) Cost for Upgrading Maintenance Facility.
(5) Costs for constructing CNG Fueling Station and Fuel Island Upgrades.
Net Annual Cash
FlowYear
(1)Annual Fuel
Costs Diesel
(1)Annual Fuel
Costs CNG
(1)Annual Fuel
Cost Savings
(2)Annual Fleet
Maintenance
Costs
(2)Annual
Facility
Maintenance
Costs
Total Change In
Operational
Expenditures
(3)Incremental
CNG Fleet
Expenditures
(4)Garage
Renovation
Expenditure
(5)Fueling
Facility
Expenditure
Total Capital
Expenditures
Detailed Cash Flow-Expansion 75

GoRaleigh Transit
Local Service; 50% CNG Expanded Fleet
Detailed Project Cash Flow - EIA 2017 Reference Case
A1 A2 A B C D = A + B + C E F G H = E + F + G I = D + H
0 $0 $0 $0 $0 $0 $0 $0 $0 $0 $0 $0
1 $279,729 $237,816 -$41,913 $0 $0 -$41,913 $414,000 $283,872 $4,707,538 $5,405,410 -$5,363,497
2 $573,667 $457,774 -$115,893 $0 $0 -$115,893 $368,000 $0 $0 $368,000 -$252,107
3 $857,167 $660,314 -$196,853 $0 $0 -$196,853 $322,000 $0 $0 $322,000 -$125,147
4 $1,123,229 $838,473 -$284,756 $0 $0 -$284,756 $276,000 $0 $0 $276,000 $8,756
5 $1,380,747 $994,098 -$386,649 $0 $0 -$386,649 $230,000 $0 $0 $230,000 $156,649
6 $1,633,921 $1,156,596 -$477,324 $0 $0 -$477,324 $230,000 $0 $0 $230,000 $247,324
7 $1,854,606 $1,295,633 -$558,973 $0 $0 -$558,973 $184,000 $0 $0 $184,000 $374,973
8 $2,116,138 $1,447,203 -$668,935 $0 $0 -$668,935 $184,000 $0 $0 $184,000 $484,935
9 $2,193,316 $1,484,469 -$708,847 $0 $0 -$708,847 $0 $0 $0 $0 $708,847
10 $2,268,750 $1,520,756 -$747,993 $0 $0 -$747,993 $0 $0 $0 $0 $747,993
11 $2,326,251 $1,578,110 -$748,142 $0 $0 -$748,142 $0 $0 $0 $0 $748,142
12 $2,404,098 $1,628,854 -$775,244 $0 $0 -$775,244 $0 $0 $0 $0 $775,244
13 $2,500,422 $1,672,576 -$827,845 $0 $0 -$827,845 $414,000 $0 $0 $414,000 $413,845
14 $2,590,587 $1,695,264 -$895,323 $0 $0 -$895,323 $368,000 $0 $0 $368,000 $527,323
15 $2,687,139 $1,743,077 -$944,062 $0 $0 -$944,062 $295,167 $0 $0 $295,167 $648,895
16 $2,742,746 $1,775,010 -$967,735 $0 $0 -$967,735 $230,000 $0 $0 $230,000 $737,735
17 $2,825,936 $1,811,416 -$1,014,520 $0 $0 -$1,014,520 $172,500 $0 $0 $172,500 $842,020
18 $2,895,997 $1,862,237 -$1,033,760 $0 $0 -$1,033,760 $153,333 $0 $0 $153,333 $880,427
19 $3,001,531 $1,906,245 -$1,095,286 $0 $0 -$1,095,286 $107,333 $0 $0 $107,333 $987,953
20 $3,061,014 $1,952,817 -$1,108,197 $0 $0 -$1,108,197 $92,000 $0 $0 $92,000 $1,016,197
21 $3,127,976 $1,992,114 -$1,135,862 $0 $0 -$1,135,862 $0 $0 $0 $0 $1,135,862
22 $3,222,494 $2,029,115 -$1,193,379 $0 $0 -$1,193,379 $0 $0 $0 $0 $1,193,379
23 $3,301,284 $2,062,255 -$1,239,029 $0 $0 -$1,239,029 $0 $0 $0 $0 $1,239,029
23 $3,373,670 $2,103,202 -$1,270,469 $0 $0 -$1,270,469 $0 $0 $0 $0 $1,270,469
25 $3,434,939 $2,146,859 -$1,288,081 $0 $0 -$1,288,081 $34,500 $0 $0 $34,500 $1,253,581
Totals $57,777,354 $38,052,282 -$19,725,072 $0 $0 -$19,725,072 $4,074,833 $283,872 $4,707,538 $9,066,243 $10,658,828
(1) Differential EIA 2017 Reference Case; Nominal Pricing CNG and Diesel For Transportation Internal Rate of Return: 7.2%
(6) Net Present Value $5,080,440
(2) No Costs associated with the differential maintenance between CNG and Diesel vehicles.
(6) Assumes Discount Rate of 2.5%
(3) Incremental cost for purchasing CNG buses versus Diesel. NO BRT Buses Included. Note: 16 BRT Buses Not Included
(4) Cost for Upgrading Maintenance Facility.
(5) Costs for constructing CNG Fueling Station and Fuel Island Upgrades.
Net Annual Cash
FlowYear
(1)Annual Fuel
Costs Diesel
(1)Annual Fuel
Costs CNG
(1)Annual Fuel
Cost Savings
(2)Annual Fleet
Maintenance
Costs
(2)Annual
Facility
Maintenance
Costs
Total Change In
Operational
Expenditures
(3)Incremental
CNG Fleet
Expenditures
(4)Garage
Renovation
Expenditure
(5)Fueling
Facility
Expenditure
Total Capital
Expenditures
Detailed Cash Flow-Exp; No BRT 76

Appendix
EIA 2017 HIGH OIL PRICE CASE FINANCIAL SCENARIOS
77
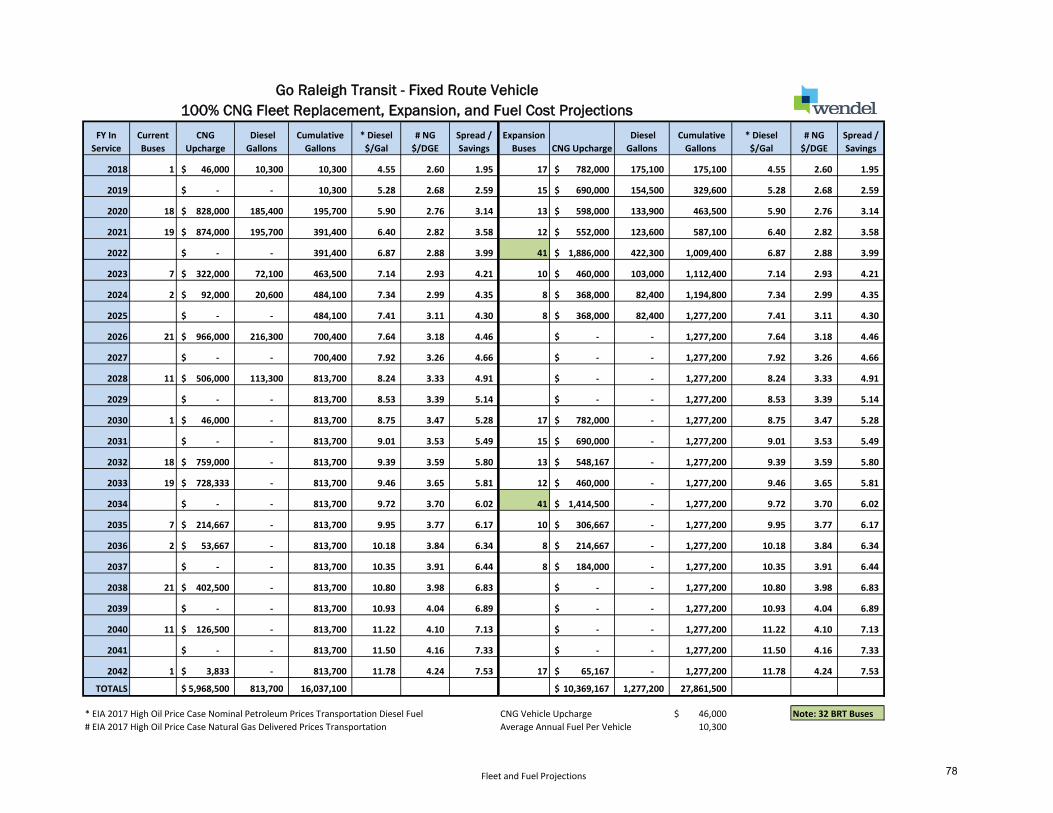
FY In
Service
Current
Buses
CNG
Upcharge
Diesel
Gallons
Cumulative
Gallons
* Diesel
$/Gal
# NG
$/DGE
Spread /
Savings
Expansion
Buses CNG Upcharge
Diesel
Gallons
Cumulative
Gallons
* Diesel
$/Gal
# NG
$/DGE
Spread /
Savings
2018 1 46,000$ 10,300 10,300 4.55 2.60 1.95 17 782,000$ 175,100 175,100 4.55 2.60 1.95
2019 -$ - 10,300 5.28 2.68 2.59 15 690,000$ 154,500 329,600 5.28 2.68 2.59
2020 18 828,000$ 185,400 195,700 5.90 2.76 3.14 13 598,000$ 133,900 463,500 5.90 2.76 3.14
2021 19 874,000$ 195,700 391,400 6.40 2.82 3.58 12 552,000$ 123,600 587,100 6.40 2.82 3.58
2022 -$ - 391,400 6.87 2.88 3.99 41 1,886,000$ 422,300 1,009,400 6.87 2.88 3.99
2023 7 322,000$ 72,100 463,500 7.14 2.93 4.21 10 460,000$ 103,000 1,112,400 7.14 2.93 4.21
2024 2 92,000$ 20,600 484,100 7.34 2.99 4.35 8 368,000$ 82,400 1,194,800 7.34 2.99 4.35
2025 -$ - 484,100 7.41 3.11 4.30 8 368,000$ 82,400 1,277,200 7.41 3.11 4.30
2026 21 966,000$ 216,300 700,400 7.64 3.18 4.46 -$ - 1,277,200 7.64 3.18 4.46
2027 -$ - 700,400 7.92 3.26 4.66 -$ - 1,277,200 7.92 3.26 4.66
2028 11 506,000$ 113,300 813,700 8.24 3.33 4.91 -$ - 1,277,200 8.24 3.33 4.91
2029 -$ - 813,700 8.53 3.39 5.14 -$ - 1,277,200 8.53 3.39 5.14
2030 1 46,000$ - 813,700 8.75 3.47 5.28 17 782,000$ - 1,277,200 8.75 3.47 5.28
2031 -$ - 813,700 9.01 3.53 5.49 15 690,000$ - 1,277,200 9.01 3.53 5.49
2032 18 759,000$ - 813,700 9.39 3.59 5.80 13 548,167$ - 1,277,200 9.39 3.59 5.80
2033 19 728,333$ - 813,700 9.46 3.65 5.81 12 460,000$ - 1,277,200 9.46 3.65 5.81
2034 -$ - 813,700 9.72 3.70 6.02 41 1,414,500$ - 1,277,200 9.72 3.70 6.02
2035 7 214,667$ - 813,700 9.95 3.77 6.17 10 306,667$ - 1,277,200 9.95 3.77 6.17
2036 2 53,667$ - 813,700 10.18 3.84 6.34 8 214,667$ - 1,277,200 10.18 3.84 6.34
2037 -$ - 813,700 10.35 3.91 6.44 8 184,000$ - 1,277,200 10.35 3.91 6.44
2038 21 402,500$ - 813,700 10.80 3.98 6.83 -$ - 1,277,200 10.80 3.98 6.83
2039 -$ - 813,700 10.93 4.04 6.89 -$ - 1,277,200 10.93 4.04 6.89
2040 11 126,500$ - 813,700 11.22 4.10 7.13 -$ - 1,277,200 11.22 4.10 7.13
2041 -$ - 813,700 11.50 4.16 7.33 -$ - 1,277,200 11.50 4.16 7.33
2042 1 3,833$ - 813,700 11.78 4.24 7.53 17 65,167$ - 1,277,200 11.78 4.24 7.53
TOTALS 5,968,500$ 813,700 16,037,100 10,369,167$ 1,277,200 27,861,500
* EIA 2017 High Oil Price Case Nominal Petroleum Prices Transportation Diesel Fuel CNG Vehicle Upcharge 46,000$ Note: 32 BRT Buses
# EIA 2017 High Oil Price Case Natural Gas Delivered Prices Transportation Average Annual Fuel Per Vehicle 10,300
Go Raleigh Transit - Fixed Route Vehicle
100% CNG Fleet Replacement, Expansion, and Fuel Cost Projections
Fleet and Fuel Projections 78

GoRaleigh Transit
Current and Expanded Services Combined
Detailed Project Cash Flow - EIA 2017 High Oil Price Case
A1 A2 A B C D = A + B + C E F G H = E + F + G I = D + H
0 $0 $0 $0 $0 $0 $0 $0 $0 $0 $0 $0
1 $843,933 $482,876 -$361,057 $0 $0 -$361,057 $828,000 $283,872 $4,707,538 $5,819,410 -$5,458,353
2 $1,793,432 $911,802 -$881,630 $0 $0 -$881,630 $690,000 $0 $0 $690,000 $191,630
3 $3,886,166 $1,817,433 -$2,068,733 $0 $0 -$2,068,733 $1,426,000 $0 $0 $1,426,000 $642,733
4 $6,261,148 $2,756,940 -$3,504,208 $0 $0 -$3,504,208 $1,426,000 $0 $0 $1,426,000 $2,078,208
5 $9,624,430 $4,029,203 -$5,595,227 $0 $0 -$5,595,227 $1,886,000 $0 $0 $1,886,000 $3,709,227
6 $11,248,320 $4,618,893 -$6,629,427 $0 $0 -$6,629,427 $782,000 $0 $0 $782,000 $5,847,427
7 $12,328,723 $5,026,355 -$7,302,368 $0 $0 -$7,302,368 $460,000 $0 $0 $460,000 $6,842,368
8 $13,051,539 $5,477,629 -$7,573,911 $0 $0 -$7,573,911 $368,000 $0 $0 $368,000 $7,205,911
9 $15,099,180 $6,286,997 -$8,812,183 $0 $0 -$8,812,183 $966,000 $0 $0 $966,000 $7,846,183
10 $15,663,343 $6,446,121 -$9,217,222 $0 $0 -$9,217,222 $0 $0 $0 $0 $9,217,222
11 $17,223,174 $6,952,923 -$10,270,251 $0 $0 -$10,270,251 $506,000 $0 $0 $506,000 $9,764,251
12 $17,836,571 $7,093,378 -$10,743,193 $0 $0 -$10,743,193 $0 $0 $0 $0 $10,743,193
13 $18,297,629 $7,250,578 -$11,047,051 $0 $0 -$11,047,051 $828,000 $0 $0 $828,000 $10,219,051
14 $18,848,397 $7,379,643 -$11,468,754 $0 $0 -$11,468,754 $690,000 $0 $0 $690,000 $10,778,754
15 $19,632,947 $7,509,574 -$12,123,373 $0 $0 -$12,123,373 $1,307,167 $0 $0 $1,307,167 $10,816,206
16 $19,785,024 $7,626,902 -$12,158,123 $0 $0 -$12,158,123 $1,188,333 $0 $0 $1,188,333 $10,969,789
17 $20,316,600 $7,736,509 -$12,580,091 $0 $0 -$12,580,091 $1,414,500 $0 $0 $1,414,500 $11,165,591
18 $20,794,467 $7,889,100 -$12,905,367 $0 $0 -$12,905,367 $521,333 $0 $0 $521,333 $12,384,033
19 $21,285,521 $8,030,016 -$13,255,505 $0 $0 -$13,255,505 $268,333 $0 $0 $268,333 $12,987,171
20 $21,647,504 $8,177,571 -$13,469,933 $0 $0 -$13,469,933 $184,000 $0 $0 $184,000 $13,285,933
21 $22,585,187 $8,313,196 -$14,271,991 $0 $0 -$14,271,991 $402,500 $0 $0 $402,500 $13,869,491
22 $22,857,085 $8,441,371 -$14,415,714 $0 $0 -$14,415,714 $0 $0 $0 $0 $14,415,714
23 $23,465,773 $8,565,992 -$14,899,782 $0 $0 -$14,899,782 $126,500 $0 $0 $126,500 $14,773,282
24 $24,034,969 $8,705,642 -$15,329,327 $0 $0 -$15,329,327 $0 $0 $0 $0 $15,329,327
25 $24,621,035 $8,870,131 -$15,750,904 $0 $0 -$15,750,904 $69,000 $0 $0 $69,000 $15,681,904
Totals $403,032,097 $156,396,775 -$246,635,322 $0 $0 -$246,635,322 $16,337,667 $283,872 $4,707,538 $21,329,077 $225,306,246
(1) Differential EIA 2017 High Oil Price Case; Nominal Pricing CNG and Diesel For Transportation Internal Rate of Return: 46.0%
(6) Net Present Value $145,938,932
(2) No Costs associated with the differential maintenance between CNG and Diesel vehicles.
(6) Assumes Discount Rate of 2.5%
(3) Incremental cost for purchasing CNG buses versus Diesel.
(4) Cost for Upgrading Maintenance Facility.
(5) Costs for constructing CNG Fueling Station and Fuel Island Upgrades.
Total Capital
Expenditures
Net Annual Cash
Flow
(2)Annual
Facility
Maintenance
Costs
Total Change In
Operational
Expenditures
(3)Incremental
CNG Fleet
Expenditures
(4)Garage
Renovation
Expenditure
(5)Fueling
Facility
Expenditure
Year(1)
Annual Fuel
Costs Diesel
(1)Annual Fuel
Costs CNG
(1)Annual Fuel
Cost Savings
(2)Annual Fleet
Maintenance
Costs
Detailed Cash Flow - Combined 79
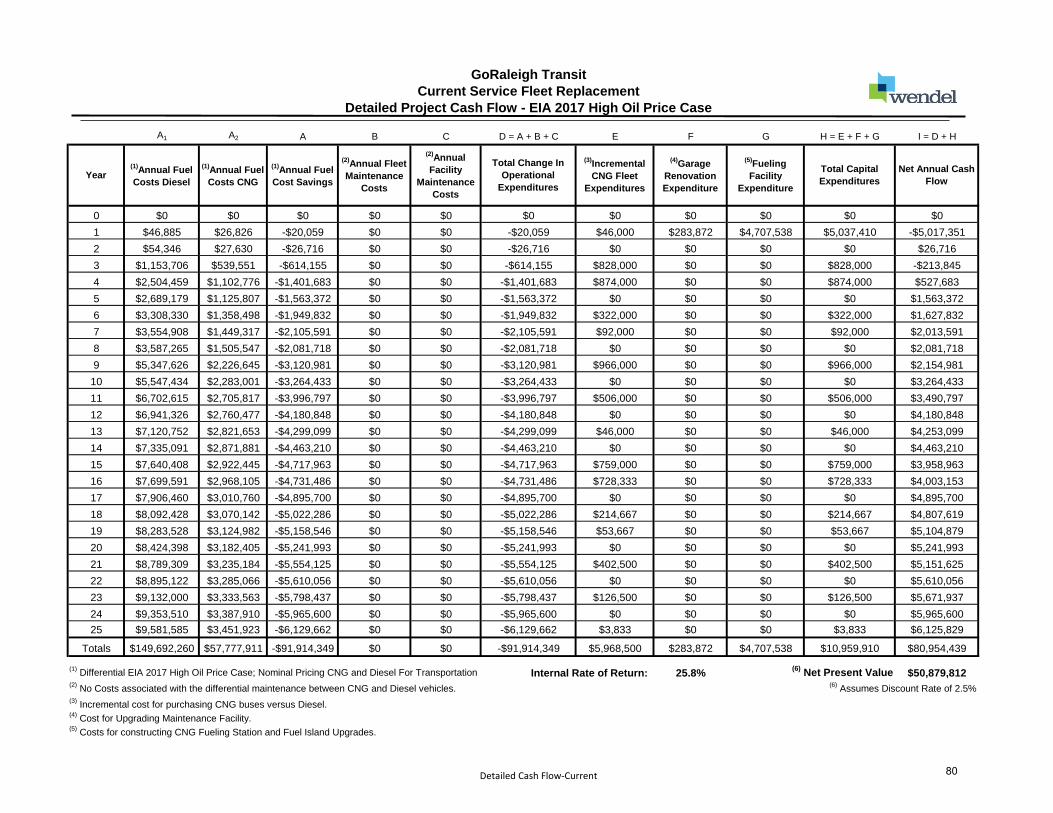
GoRaleigh Transit
Current Service Fleet Replacement
Detailed Project Cash Flow - EIA 2017 High Oil Price Case
A1 A2 A B C D = A + B + C E F G H = E + F + G I = D + H
0 $0 $0 $0 $0 $0 $0 $0 $0 $0 $0 $0
1 $46,885 $26,826 -$20,059 $0 $0 -$20,059 $46,000 $283,872 $4,707,538 $5,037,410 -$5,017,351
2 $54,346 $27,630 -$26,716 $0 $0 -$26,716 $0 $0 $0 $0 $26,716
3 $1,153,706 $539,551 -$614,155 $0 $0 -$614,155 $828,000 $0 $0 $828,000 -$213,845
4 $2,504,459 $1,102,776 -$1,401,683 $0 $0 -$1,401,683 $874,000 $0 $0 $874,000 $527,683
5 $2,689,179 $1,125,807 -$1,563,372 $0 $0 -$1,563,372 $0 $0 $0 $0 $1,563,372
6 $3,308,330 $1,358,498 -$1,949,832 $0 $0 -$1,949,832 $322,000 $0 $0 $322,000 $1,627,832
7 $3,554,908 $1,449,317 -$2,105,591 $0 $0 -$2,105,591 $92,000 $0 $0 $92,000 $2,013,591
8 $3,587,265 $1,505,547 -$2,081,718 $0 $0 -$2,081,718 $0 $0 $0 $0 $2,081,718
9 $5,347,626 $2,226,645 -$3,120,981 $0 $0 -$3,120,981 $966,000 $0 $0 $966,000 $2,154,981
10 $5,547,434 $2,283,001 -$3,264,433 $0 $0 -$3,264,433 $0 $0 $0 $0 $3,264,433
11 $6,702,615 $2,705,817 -$3,996,797 $0 $0 -$3,996,797 $506,000 $0 $0 $506,000 $3,490,797
12 $6,941,326 $2,760,477 -$4,180,848 $0 $0 -$4,180,848 $0 $0 $0 $0 $4,180,848
13 $7,120,752 $2,821,653 -$4,299,099 $0 $0 -$4,299,099 $46,000 $0 $0 $46,000 $4,253,099
14 $7,335,091 $2,871,881 -$4,463,210 $0 $0 -$4,463,210 $0 $0 $0 $0 $4,463,210
15 $7,640,408 $2,922,445 -$4,717,963 $0 $0 -$4,717,963 $759,000 $0 $0 $759,000 $3,958,963
16 $7,699,591 $2,968,105 -$4,731,486 $0 $0 -$4,731,486 $728,333 $0 $0 $728,333 $4,003,153
17 $7,906,460 $3,010,760 -$4,895,700 $0 $0 -$4,895,700 $0 $0 $0 $0 $4,895,700
18 $8,092,428 $3,070,142 -$5,022,286 $0 $0 -$5,022,286 $214,667 $0 $0 $214,667 $4,807,619
19 $8,283,528 $3,124,982 -$5,158,546 $0 $0 -$5,158,546 $53,667 $0 $0 $53,667 $5,104,879
20 $8,424,398 $3,182,405 -$5,241,993 $0 $0 -$5,241,993 $0 $0 $0 $0 $5,241,993
21 $8,789,309 $3,235,184 -$5,554,125 $0 $0 -$5,554,125 $402,500 $0 $0 $402,500 $5,151,625
22 $8,895,122 $3,285,066 -$5,610,056 $0 $0 -$5,610,056 $0 $0 $0 $0 $5,610,056
23 $9,132,000 $3,333,563 -$5,798,437 $0 $0 -$5,798,437 $126,500 $0 $0 $126,500 $5,671,937
24 $9,353,510 $3,387,910 -$5,965,600 $0 $0 -$5,965,600 $0 $0 $0 $0 $5,965,600
25 $9,581,585 $3,451,923 -$6,129,662 $0 $0 -$6,129,662 $3,833 $0 $0 $3,833 $6,125,829
Totals $149,692,260 $57,777,911 -$91,914,349 $0 $0 -$91,914,349 $5,968,500 $283,872 $4,707,538 $10,959,910 $80,954,439
(1) Differential EIA 2017 High Oil Price Case; Nominal Pricing CNG and Diesel For Transportation Internal Rate of Return: 25.8%
(6) Net Present Value $50,879,812
(2) No Costs associated with the differential maintenance between CNG and Diesel vehicles.
(6) Assumes Discount Rate of 2.5%
(3) Incremental cost for purchasing CNG buses versus Diesel.
(4) Cost for Upgrading Maintenance Facility.
(5) Costs for constructing CNG Fueling Station and Fuel Island Upgrades.
Net Annual Cash
FlowYear
(1)Annual Fuel
Costs Diesel
(1)Annual Fuel
Costs CNG
(1)Annual Fuel
Cost Savings
(2)Annual Fleet
Maintenance
Costs
(2)Annual
Facility
Maintenance
Costs
Total Change In
Operational
Expenditures
(3)Incremental
CNG Fleet
Expenditures
(4)Garage
Renovation
Expenditure
(5)Fueling
Facility
Expenditure
Total Capital
Expenditures
Detailed Cash Flow-Current 80

GoRaleigh Transit
Local and BRT Expanded Service Fleet
Detailed Project Cash Flow - EIA 2017 High Oil Price Case
A1 A2 A B C D = A + B + C E F G H = E + F + G I = D + H
0 $0 $0 $0 $0 $0 $0 $0 $0 $0 $0 $0
1 $797,047 $456,049 -$340,998 $0 $0 -$340,998 $782,000 $283,872 $4,707,538 $5,773,410 -$5,432,412
2 $1,739,085 $884,171 -$854,914 $0 $0 -$854,914 $690,000 $0 $0 $690,000 $164,914
3 $2,732,460 $1,277,883 -$1,454,578 $0 $0 -$1,454,578 $598,000 $0 $0 $598,000 $856,578
4 $3,756,689 $1,654,164 -$2,102,525 $0 $0 -$2,102,525 $552,000 $0 $0 $552,000 $1,550,525
5 $6,935,251 $2,903,396 -$4,031,855 $0 $0 -$4,031,855 $1,886,000 $0 $0 $1,886,000 $2,145,855
6 $7,939,991 $3,260,395 -$4,679,596 $0 $0 -$4,679,596 $460,000 $0 $0 $460,000 $4,219,596
7 $8,773,815 $3,577,038 -$5,196,777 $0 $0 -$5,196,777 $368,000 $0 $0 $368,000 $4,828,777
8 $9,464,274 $3,972,082 -$5,492,192 $0 $0 -$5,492,192 $368,000 $0 $0 $368,000 $5,124,192
9 $9,751,554 $4,060,352 -$5,691,201 $0 $0 -$5,691,201 $0 $0 $0 $0 $5,691,201
10 $10,115,909 $4,163,120 -$5,952,789 $0 $0 -$5,952,789 $0 $0 $0 $0 $5,952,789
11 $10,520,560 $4,247,106 -$6,273,454 $0 $0 -$6,273,454 $0 $0 $0 $0 $6,273,454
12 $10,895,245 $4,332,901 -$6,562,344 $0 $0 -$6,562,344 $0 $0 $0 $0 $6,562,344
13 $11,176,877 $4,428,924 -$6,747,953 $0 $0 -$6,747,953 $782,000 $0 $0 $782,000 $5,965,953
14 $11,513,307 $4,507,762 -$7,005,544 $0 $0 -$7,005,544 $690,000 $0 $0 $690,000 $6,315,544
15 $11,992,539 $4,587,129 -$7,405,410 $0 $0 -$7,405,410 $548,167 $0 $0 $548,167 $6,857,243
16 $12,085,433 $4,658,797 -$7,426,636 $0 $0 -$7,426,636 $460,000 $0 $0 $460,000 $6,966,636
17 $12,410,140 $4,725,750 -$7,684,390 $0 $0 -$7,684,390 $1,414,500 $0 $0 $1,414,500 $6,269,890
18 $12,702,039 $4,818,958 -$7,883,081 $0 $0 -$7,883,081 $306,667 $0 $0 $306,667 $7,576,414
19 $13,001,993 $4,905,035 -$8,096,959 $0 $0 -$8,096,959 $214,667 $0 $0 $214,667 $7,882,292
20 $13,223,106 $4,995,167 -$8,227,939 $0 $0 -$8,227,939 $184,000 $0 $0 $184,000 $8,043,939
21 $13,795,878 $5,078,011 -$8,717,867 $0 $0 -$8,717,867 $0 $0 $0 $0 $8,717,867
22 $13,961,963 $5,156,306 -$8,805,658 $0 $0 -$8,805,658 $0 $0 $0 $0 $8,805,658
23 $14,333,773 $5,232,428 -$9,101,345 $0 $0 -$9,101,345 $0 $0 $0 $0 $9,101,345
24 $14,681,459 $5,317,732 -$9,363,727 $0 $0 -$9,363,727 $0 $0 $0 $0 $9,363,727
25 $15,039,450 $5,418,208 -$9,621,242 $0 $0 -$9,621,242 $65,167 $0 $0 $65,167 $9,556,075
Totals $253,339,837 $98,618,864 -$154,720,974 $0 $0 -$154,720,974 $10,369,167 $283,872 $4,707,538 $15,360,577 $139,360,397
(1) Differential EIA 2017 High Oil Price Case; Nominal Pricing CNG and Diesel For Transportation Internal Rate of Return: 38.4%
(6) Net Present Value $90,308,225
(2) No Costs associated with the differential maintenance between CNG and Diesel vehicles.
(6) Assumes Discount Rate of 2.5%
(3) Incremental cost for purchasing CNG buses versus Diesel.
(4) Cost for Upgrading Maintenance Facility.
(5) Costs for constructing CNG Fueling Station and Fuel Island Upgrades.
Net Annual Cash
FlowYear
(1)Annual Fuel
Costs Diesel
(1)Annual Fuel
Costs CNG
(1)Annual Fuel
Cost Savings
(2)Annual Fleet
Maintenance
Costs
(2)Annual
Facility
Maintenance
Costs
Total Change In
Operational
Expenditures
(3)Incremental
CNG Fleet
Expenditures
(4)Garage
Renovation
Expenditure
(5)Fueling
Facility
Expenditure
Total Capital
Expenditures
Detailed Cash Flow-Expansion 81

GoRaleigh Transit
Local Service Expanded Fleet
Detailed Project Cash Flow - EIA 2017 High Oil Price Case
A1 A2 A B C D = A + B + C E F G H = E + F + G I = D + H
0 $0 $0 $0 $0 $0 $0 $0 $0 $0 $0 $0
1 $797,047 $456,049 -$340,998 $0 $0 -$340,998 $782,000 $283,872 $4,707,538 $5,773,410 -$5,432,412
2 $1,739,085 $884,171 -$854,914 $0 $0 -$854,914 $690,000 $0 $0 $690,000 $164,914
3 $2,732,460 $1,277,883 -$1,454,578 $0 $0 -$1,454,578 $598,000 $0 $0 $598,000 $856,578
4 $3,756,689 $1,654,164 -$2,102,525 $0 $0 -$2,102,525 $552,000 $0 $0 $552,000 $1,550,525
5 $4,670,679 $1,955,349 -$2,715,331 $0 $0 -$2,715,331 $414,000 $0 $0 $414,000 $2,301,331
6 $5,587,401 $2,294,352 -$3,293,049 $0 $0 -$3,293,049 $460,000 $0 $0 $460,000 $2,833,049
7 $6,353,453 $2,590,269 -$3,763,184 $0 $0 -$3,763,184 $368,000 $0 $0 $368,000 $3,395,184
8 $7,021,881 $2,947,028 -$4,074,852 $0 $0 -$4,074,852 $368,000 $0 $0 $368,000 $3,706,852
9 $7,235,024 $3,012,519 -$4,222,504 $0 $0 -$4,222,504 $0 $0 $0 $0 $4,222,504
10 $7,505,352 $3,088,766 -$4,416,586 $0 $0 -$4,416,586 $0 $0 $0 $0 $4,416,586
11 $7,805,576 $3,151,079 -$4,654,498 $0 $0 -$4,654,498 $0 $0 $0 $0 $4,654,498
12 $8,083,569 $3,214,733 -$4,868,836 $0 $0 -$4,868,836 $0 $0 $0 $0 $4,868,836
13 $8,292,522 $3,285,976 -$5,006,545 $0 $0 -$5,006,545 $782,000 $0 $0 $782,000 $4,224,545
14 $8,542,131 $3,344,469 -$5,197,662 $0 $0 -$5,197,662 $690,000 $0 $0 $690,000 $4,507,662
15 $8,897,690 $3,403,354 -$5,494,336 $0 $0 -$5,494,336 $548,167 $0 $0 $548,167 $4,946,170
16 $8,966,612 $3,456,527 -$5,510,085 $0 $0 -$5,510,085 $460,000 $0 $0 $460,000 $5,050,085
17 $9,207,523 $3,506,201 -$5,701,322 $0 $0 -$5,701,322 $310,500 $0 $0 $310,500 $5,390,822
18 $9,424,093 $3,575,356 -$5,848,738 $0 $0 -$5,848,738 $306,667 $0 $0 $306,667 $5,542,071
19 $9,646,640 $3,639,219 -$6,007,421 $0 $0 -$6,007,421 $214,667 $0 $0 $214,667 $5,792,754
20 $9,810,691 $3,706,091 -$6,104,600 $0 $0 -$6,104,600 $184,000 $0 $0 $184,000 $5,920,600
21 $10,235,651 $3,767,557 -$6,468,095 $0 $0 -$6,468,095 $0 $0 $0 $0 $6,468,095
22 $10,358,876 $3,825,646 -$6,533,230 $0 $0 -$6,533,230 $0 $0 $0 $0 $6,533,230
23 $10,634,735 $3,882,124 -$6,752,610 $0 $0 -$6,752,610 $0 $0 $0 $0 $6,752,610
23 $10,892,695 $3,945,414 -$6,947,281 $0 $0 -$6,947,281 $0 $0 $0 $0 $6,947,281
25 $11,158,302 $4,019,961 -$7,138,341 $0 $0 -$7,138,341 $65,167 $0 $0 $65,167 $7,073,174
Totals $189,356,378 $73,884,257 -$115,472,120 $0 $0 -$115,472,120 $7,793,167 $283,872 $4,707,538 $12,784,577 $102,687,544
(1) Differential EIA 2017 High Oil Price Case; Nominal Pricing CNG and Diesel For Transportation Internal Rate of Return: 33.9%
(6) Net Present Value $66,307,553
(2) No Costs associated with the differential maintenance between CNG and Diesel vehicles.
(6) Assumes Discount Rate of 2.5%
(3) Incremental cost for purchasing CNG buses versus Diesel. NO BRT Buses Included. Note: 32 BRT Buses Not Included
(4) Cost for Upgrading Maintenance Facility.
(5) Costs for constructing CNG Fueling Station and Fuel Island Upgrades.
Net Annual Cash
FlowYear
(1)Annual Fuel
Costs Diesel
(1)Annual Fuel
Costs CNG
(1)Annual Fuel
Cost Savings
(2)Annual Fleet
Maintenance
Costs
(2)Annual
Facility
Maintenance
Costs
Total Change In
Operational
Expenditures
(3)Incremental
CNG Fleet
Expenditures
(4)Garage
Renovation
Expenditure
(5)Fueling
Facility
Expenditure
Total Capital
Expenditures
Detailed Cash Flow-Exp; No BRT 82

FY In
Service
Current
Buses
CNG
Upcharge
Diesel
Gallons
Cumulative
Gallons
* Diesel
$/Gal
# NG
$/DGE
Spread /
Savings
Expansion
Buses
CNG
Upcharge
Diesel
Gallons
Cumulative
Gallons
* Diesel
$/Gal
# NG
$/DGE
Spread /
Savings
2018 1 46,000$ 10,300 10,300 4.55 2.60 1.95 13 598,000$ 133,900 133,900 4.55 2.60 1.95
2019 -$ - 10,300 5.28 2.68 2.59 11 506,000$ 113,300 247,200 5.28 2.68 2.59
2020 14 644,000$ 144,200 154,500 5.90 2.76 3.14 10 460,000$ 103,000 350,200 5.90 2.76 3.14
2021 14 644,000$ 144,200 298,700 6.40 2.82 3.58 9 414,000$ 92,700 442,900 6.40 2.82 3.58
2022 -$ - 298,700 6.87 2.88 3.99 31 1,426,000$ 319,300 762,200 6.87 2.88 3.99
2023 5 230,000$ 51,500 350,200 7.14 2.93 4.21 8 368,000$ 82,400 844,600 7.14 2.93 4.21
2024 2 92,000$ 20,600 370,800 7.34 2.99 4.35 6 276,000$ 61,800 906,400 7.34 2.99 4.35
2025 -$ - 370,800 7.41 3.11 4.30 6 276,000$ 61,800 968,200 7.41 3.11 4.30
2026 16 736,000$ 164,800 535,600 7.64 3.18 4.46 -$ - 968,200 7.64 3.18 4.46
2027 -$ - 535,600 7.92 3.26 4.66 -$ - 968,200 7.92 3.26 4.66
2028 8 368,000$ 82,400 618,000 8.24 3.33 4.91 -$ - 968,200 8.24 3.33 4.91
2029 -$ - 618,000 8.53 3.39 5.14 -$ - 968,200 8.53 3.39 5.14
2030 1 46,000$ - 618,000 8.75 3.47 5.28 13 598,000$ - 968,200 8.75 3.47 5.28
2031 -$ - 618,000 9.01 3.53 5.49 11 506,000$ - 968,200 9.01 3.53 5.49
2032 14 590,333$ - 618,000 9.39 3.59 5.80 10 421,667$ - 968,200 9.39 3.59 5.80
2033 14 536,667$ - 618,000 9.46 3.65 5.81 9 345,000$ - 968,200 9.46 3.65 5.81
2034 -$ - 618,000 9.72 3.70 6.02 31 1,069,500$ - 968,200 9.72 3.70 6.02
2035 5 153,333$ - 618,000 9.95 3.77 6.17 8 245,333$ - 968,200 9.95 3.77 6.17
2036 2 53,667$ - 618,000 10.18 3.84 6.34 6 161,000$ - 968,200 10.18 3.84 6.34
2037 -$ - 618,000 10.35 3.91 6.44 6 138,000$ - 968,200 10.35 3.91 6.44
2038 16 306,667$ - 618,000 10.80 3.98 6.83 -$ - 968,200 10.80 3.98 6.83
2039 -$ - 618,000 10.93 4.04 6.89 -$ - 968,200 10.93 4.04 6.89
2040 8 92,000$ - 618,000 11.22 4.10 7.13 -$ - 968,200 11.22 4.10 7.13
2041 -$ - 618,000 11.50 4.16 7.33 -$ - 968,200 11.50 4.16 7.33
2042 1 3,833$ - 618,000 11.78 4.24 7.53 13 49,833$ - 968,200 11.78 4.24 7.53
TOTALS 4,542,500$ 618,000 12,205,500 7,858,333$ 968,200 21,115,000
* EIA 2017 High Oil Price Case Nominal Petroleum Prices Transportation Diesel Fuel CNG Vehicle Upcharge 46,000$ Note: 24 BRT Buses
# EIA 2017 High Oil Price Case Natural Gas Delivered Prices Transportation Average Annual Fuel Per Vehicle 10,300
Go Raleigh Transit - Fixed Route Vehicle
75% CNG Fleet Replacement, Expansion, and Fuel Cost Projections
Fleet and Fuel Projections 83

GoRaleigh Transit
75% CNG Fleet; Current and Expanded Services Combined
Detailed Project Cash Flow - EIA 2017 High Oil Price Case
A1 A2 A B C D = A + B + C E F G H = E + F + G I = D + H
0 $0 $0 $0 $0 $0 $0 $0 $0 $0 $0 $0
1 $656,392 $375,570 -$280,822 $0 $0 -$280,822 $644,000 $283,872 $4,707,538 $5,635,410 -$5,354,588
2 $1,358,660 $690,759 -$667,902 $0 $0 -$667,902 $506,000 $0 $0 $506,000 $161,902
3 $2,975,346 $1,391,472 -$1,583,873 $0 $0 -$1,583,873 $1,104,000 $0 $0 $1,104,000 $479,873
4 $4,745,291 $2,089,470 -$2,655,821 $0 $0 -$2,655,821 $1,058,000 $0 $0 $1,058,000 $1,597,821
5 $7,289,091 $3,051,529 -$4,237,562 $0 $0 -$4,237,562 $1,426,000 $0 $0 $1,426,000 $2,811,562
6 $8,528,138 $3,501,906 -$5,026,232 $0 $0 -$5,026,232 $598,000 $0 $0 $598,000 $4,428,232
7 $9,378,906 $3,823,730 -$5,555,176 $0 $0 -$5,555,176 $368,000 $0 $0 $368,000 $5,187,176
8 $9,922,223 $4,164,279 -$5,757,944 $0 $0 -$5,757,944 $276,000 $0 $0 $276,000 $5,481,944
9 $11,481,668 $4,780,737 -$6,700,931 $0 $0 -$6,700,931 $736,000 $0 $0 $736,000 $5,964,931
10 $11,910,667 $4,901,738 -$7,008,929 $0 $0 -$7,008,929 $0 $0 $0 $0 $7,008,929
11 $13,065,856 $5,274,632 -$7,791,225 $0 $0 -$7,791,225 $368,000 $0 $0 $368,000 $7,423,225
12 $13,531,192 $5,381,183 -$8,150,008 $0 $0 -$8,150,008 $0 $0 $0 $0 $8,150,008
13 $13,880,960 $5,500,438 -$8,380,522 $0 $0 -$8,380,522 $644,000 $0 $0 $644,000 $7,736,522
14 $14,298,784 $5,598,350 -$8,700,434 $0 $0 -$8,700,434 $506,000 $0 $0 $506,000 $8,194,434
15 $14,893,960 $5,696,918 -$9,197,041 $0 $0 -$9,197,041 $1,012,000 $0 $0 $1,012,000 $8,185,041
16 $15,009,329 $5,785,925 -$9,223,403 $0 $0 -$9,223,403 $881,667 $0 $0 $881,667 $8,341,737
17 $15,412,593 $5,869,076 -$9,543,517 $0 $0 -$9,543,517 $1,069,500 $0 $0 $1,069,500 $8,474,017
18 $15,775,113 $5,984,835 -$9,790,278 $0 $0 -$9,790,278 $398,667 $0 $0 $398,667 $9,391,612
19 $16,147,637 $6,091,736 -$10,055,900 $0 $0 -$10,055,900 $214,667 $0 $0 $214,667 $9,841,233
20 $16,422,244 $6,203,675 -$10,218,570 $0 $0 -$10,218,570 $138,000 $0 $0 $138,000 $10,080,570
21 $17,133,590 $6,306,562 -$10,827,028 $0 $0 -$10,827,028 $306,667 $0 $0 $306,667 $10,520,361
22 $17,339,858 $6,403,799 -$10,936,059 $0 $0 -$10,936,059 $0 $0 $0 $0 $10,936,059
23 $17,801,621 $6,498,338 -$11,303,283 $0 $0 -$11,303,283 $92,000 $0 $0 $92,000 $11,211,283
24 $18,233,425 $6,604,280 -$11,629,144 $0 $0 -$11,629,144 $0 $0 $0 $0 $11,629,144
25 $18,678,027 $6,729,065 -$11,948,962 $0 $0 -$11,948,962 $53,667 $0 $0 $53,667 $11,895,295
Totals $305,870,569 $118,700,004 -$187,170,566 $0 $0 -$187,170,566 $12,400,833 $283,872 $4,707,538 $17,392,243 $169,778,322
(1) Differential EIA 2017 High Oil Price Case; Nominal Pricing CNG and Diesel For Transportation Internal Rate of Return: 40.3%
(6) Net Present Value $109,614,635
(2) No Costs associated with the differential maintenance between CNG and Diesel vehicles.
(6) Assumes Discount Rate of 2.5%
(3) Incremental cost for purchasing CNG buses versus Diesel.
(4) Cost for Upgrading Maintenance Facility.
(5) Costs for constructing CNG Fueling Station and Fuel Island Upgrades.
Total Capital
Expenditures
Net Annual Cash
Flow
(2)Annual
Facility
Maintenance
Costs
Total Change In
Operational
Expenditures
(3)Incremental
CNG Fleet
Expenditures
(4)Garage
Renovation
Expenditure
(5)Fueling
Facility
Expenditure
Year(1)
Annual Fuel
Costs Diesel
(1)Annual Fuel
Costs CNG
(1)Annual Fuel
Cost Savings
(2)Annual Fleet
Maintenance
Costs
Detailed Cash Flow - Combined 84

GoRaleigh Transit
Current Service 75% CNG Fleet Replacement
Detailed Project Cash Flow - EIA 2017 High Oil Price Case
A1 A2 A B C D = A + B + C E F G H = E + F + G I = D + H
0 $0 $0 $0 $0 $0 $0 $0 $0 $0 $0 $0
1 $46,885 $26,826 -$20,059 $0 $0 -$20,059 $46,000 $283,872 $4,707,538 $5,037,410 -$5,017,351
2 $54,346 $27,630 -$26,716 $0 $0 -$26,716 $0 $0 $0 $0 $26,716
3 $910,820 $425,961 -$484,859 $0 $0 -$484,859 $644,000 $0 $0 $644,000 -$159,141
4 $1,911,298 $841,592 -$1,069,706 $0 $0 -$1,069,706 $644,000 $0 $0 $644,000 $425,706
5 $2,052,268 $859,168 -$1,193,100 $0 $0 -$1,193,100 $0 $0 $0 $0 $1,193,100
6 $2,499,627 $1,026,421 -$1,473,206 $0 $0 -$1,473,206 $230,000 $0 $0 $230,000 $1,243,206
7 $2,722,908 $1,110,115 -$1,612,793 $0 $0 -$1,612,793 $92,000 $0 $0 $92,000 $1,520,793
8 $2,747,693 $1,153,185 -$1,594,507 $0 $0 -$1,594,507 $0 $0 $0 $0 $1,594,507
9 $4,089,361 $1,702,728 -$2,386,633 $0 $0 -$2,386,633 $736,000 $0 $0 $736,000 $1,650,633
10 $4,242,156 $1,745,825 -$2,496,331 $0 $0 -$2,496,331 $0 $0 $0 $0 $2,496,331
11 $5,090,593 $2,055,051 -$3,035,542 $0 $0 -$3,035,542 $368,000 $0 $0 $368,000 $2,667,542
12 $5,271,893 $2,096,565 -$3,175,328 $0 $0 -$3,175,328 $0 $0 $0 $0 $3,175,328
13 $5,408,166 $2,143,028 -$3,265,138 $0 $0 -$3,265,138 $46,000 $0 $0 $46,000 $3,219,138
14 $5,570,955 $2,181,175 -$3,389,779 $0 $0 -$3,389,779 $0 $0 $0 $0 $3,389,779
15 $5,802,841 $2,219,579 -$3,583,263 $0 $0 -$3,583,263 $590,333 $0 $0 $590,333 $2,992,930
16 $5,847,790 $2,254,257 -$3,593,534 $0 $0 -$3,593,534 $536,667 $0 $0 $536,667 $3,056,867
17 $6,004,906 $2,286,653 -$3,718,253 $0 $0 -$3,718,253 $0 $0 $0 $0 $3,718,253
18 $6,146,148 $2,331,754 -$3,814,394 $0 $0 -$3,814,394 $153,333 $0 $0 $153,333 $3,661,061
19 $6,291,287 $2,373,404 -$3,917,883 $0 $0 -$3,917,883 $53,667 $0 $0 $53,667 $3,864,216
20 $6,398,277 $2,417,016 -$3,981,261 $0 $0 -$3,981,261 $0 $0 $0 $0 $3,981,261
21 $6,675,425 $2,457,102 -$4,218,323 $0 $0 -$4,218,323 $306,667 $0 $0 $306,667 $3,911,656
22 $6,755,789 $2,494,987 -$4,260,802 $0 $0 -$4,260,802 $0 $0 $0 $0 $4,260,802
23 $6,935,697 $2,531,820 -$4,403,876 $0 $0 -$4,403,876 $92,000 $0 $0 $92,000 $4,311,876
24 $7,103,932 $2,573,096 -$4,530,835 $0 $0 -$4,530,835 $0 $0 $0 $0 $4,530,835
25 $7,277,153 $2,621,714 -$4,655,440 $0 $0 -$4,655,440 $3,833 $0 $0 $3,833 $4,651,606
Totals $113,858,214 $43,956,652 -$69,901,562 $0 $0 -$69,901,562 $4,542,500 $283,872 $4,707,538 $9,533,910 $60,367,652
(1) Differential EIA 2017 High Oil Price Case; Nominal Pricing CNG and Diesel For Transportation Internal Rate of Return: 22.3%
(6) Net Present Value $37,568,858
(2) No Costs associated with the differential maintenance between CNG and Diesel vehicles.
(6) Assumes Discount Rate of 2.5%
(3) Incremental cost for purchasing CNG buses versus Diesel.
(4) Cost for Upgrading Maintenance Facility.
(5) Costs for constructing CNG Fueling Station and Fuel Island Upgrades.
Net Annual Cash
FlowYear
(1)Annual Fuel
Costs Diesel
(1)Annual Fuel
Costs CNG
(1)Annual Fuel
Cost Savings
(2)Annual Fleet
Maintenance
Costs
(2)Annual
Facility
Maintenance
Costs
Total Change In
Operational
Expenditures
(3)Incremental
CNG Fleet
Expenditures
(4)Garage
Renovation
Expenditure
(5)Fueling
Facility
Expenditure
Total Capital
Expenditures
Detailed Cash Flow-Current 85

GoRaleigh Transit
Local and BRT; 75% CNG Expanded Service Fleet
Detailed Project Cash Flow - EIA 2017 High Oil Price Case
A1 A2 A B C D = A + B + C E F G H = E + F + G I = D + H
0 $0 $0 $0 $0 $0 $0 $0 $0 $0 $0 $0
1 $609,507 $348,744 -$260,763 $0 $0 -$260,763 $598,000 $283,872 $4,707,538 $5,589,410 -$5,328,647
2 $1,304,314 $663,128 -$641,185 $0 $0 -$641,185 $506,000 $0 $0 $506,000 $135,185
3 $2,064,526 $965,511 -$1,099,014 $0 $0 -$1,099,014 $460,000 $0 $0 $460,000 $639,014
4 $2,833,993 $1,247,878 -$1,586,115 $0 $0 -$1,586,115 $414,000 $0 $0 $414,000 $1,172,115
5 $5,236,822 $2,192,360 -$3,044,462 $0 $0 -$3,044,462 $1,426,000 $0 $0 $1,426,000 $1,618,462
6 $6,028,512 $2,475,485 -$3,553,026 $0 $0 -$3,553,026 $368,000 $0 $0 $368,000 $3,185,026
7 $6,655,998 $2,713,615 -$3,942,383 $0 $0 -$3,942,383 $276,000 $0 $0 $276,000 $3,666,383
8 $7,174,530 $3,011,094 -$4,163,436 $0 $0 -$4,163,436 $276,000 $0 $0 $276,000 $3,887,436
9 $7,392,307 $3,078,009 -$4,314,298 $0 $0 -$4,314,298 $0 $0 $0 $0 $4,314,298
10 $7,668,512 $3,155,914 -$4,512,598 $0 $0 -$4,512,598 $0 $0 $0 $0 $4,512,598
11 $7,975,263 $3,219,580 -$4,755,683 $0 $0 -$4,755,683 $0 $0 $0 $0 $4,755,683
12 $8,259,299 $3,284,618 -$4,974,680 $0 $0 -$4,974,680 $0 $0 $0 $0 $4,974,680
13 $8,472,794 $3,357,410 -$5,115,383 $0 $0 -$5,115,383 $598,000 $0 $0 $598,000 $4,517,383
14 $8,727,829 $3,417,175 -$5,310,654 $0 $0 -$5,310,654 $506,000 $0 $0 $506,000 $4,804,654
15 $9,091,118 $3,477,340 -$5,613,778 $0 $0 -$5,613,778 $421,667 $0 $0 $421,667 $5,192,112
16 $9,161,538 $3,531,669 -$5,629,870 $0 $0 -$5,629,870 $345,000 $0 $0 $345,000 $5,284,870
17 $9,407,687 $3,582,423 -$5,825,264 $0 $0 -$5,825,264 $1,069,500 $0 $0 $1,069,500 $4,755,764
18 $9,628,965 $3,653,081 -$5,975,884 $0 $0 -$5,975,884 $245,333 $0 $0 $245,333 $5,730,551
19 $9,856,350 $3,718,333 -$6,138,017 $0 $0 -$6,138,017 $161,000 $0 $0 $161,000 $5,977,017
20 $10,023,967 $3,786,659 -$6,237,309 $0 $0 -$6,237,309 $138,000 $0 $0 $138,000 $6,099,309
21 $10,458,165 $3,849,460 -$6,608,705 $0 $0 -$6,608,705 $0 $0 $0 $0 $6,608,705
22 $10,584,069 $3,908,812 -$6,675,257 $0 $0 -$6,675,257 $0 $0 $0 $0 $6,675,257
23 $10,865,925 $3,966,518 -$6,899,406 $0 $0 -$6,899,406 $0 $0 $0 $0 $6,899,406
24 $11,129,493 $4,031,184 -$7,098,309 $0 $0 -$7,098,309 $0 $0 $0 $0 $7,098,309
25 $11,400,874 $4,107,351 -$7,293,522 $0 $0 -$7,293,522 $49,833 $0 $0 $49,833 $7,243,689
Totals $192,012,356 $74,743,352 -$117,269,004 $0 $0 -$117,269,004 $7,858,333 $283,872 $4,707,538 $12,849,743 $104,419,260
(1) Differential EIA 2017 High Oil Price Case; Nominal Pricing CNG and Diesel For Transportation Internal Rate of Return: 33.2%
(6) Net Present Value $67,294,882
(2) No Costs associated with the differential maintenance between CNG and Diesel vehicles.
(6) Assumes Discount Rate of 2.5%
(3) Incremental cost for purchasing CNG buses versus Diesel.
(4) Cost for Upgrading Maintenance Facility.
(5) Costs for constructing CNG Fueling Station and Fuel Island Upgrades.
Net Annual Cash
FlowYear
(1)Annual Fuel
Costs Diesel
(1)Annual Fuel
Costs CNG
(1)Annual Fuel
Cost Savings
(2)Annual Fleet
Maintenance
Costs
(2)Annual
Facility
Maintenance
Costs
Total Change In
Operational
Expenditures
(3)Incremental
CNG Fleet
Expenditures
(4)Garage
Renovation
Expenditure
(5)Fueling
Facility
Expenditure
Total Capital
Expenditures
Detailed Cash Flow-Expansion 86

GoRaleigh Transit
Local Service; 75% CNG Expanded Fleet
Detailed Project Cash Flow - EIA 2017 High Oil Price Case
A1 A2 A B C D = A + B + C E F G H = E + F + G I = D + H
0 $0 $0 $0 $0 $0 $0 $0 $0 $0 $0 $0
1 $609,507 $348,744 -$260,763 $0 $0 -$260,763 $598,000 $283,872 $4,707,538 $5,589,410 -$5,328,647
2 $1,304,314 $663,128 -$641,185 $0 $0 -$641,185 $506,000 $0 $0 $506,000 $135,185
3 $2,064,526 $965,511 -$1,099,014 $0 $0 -$1,099,014 $460,000 $0 $0 $460,000 $639,014
4 $2,833,993 $1,247,878 -$1,586,115 $0 $0 -$1,586,115 $414,000 $0 $0 $414,000 $1,172,115
5 $3,538,394 $1,481,325 -$2,057,069 $0 $0 -$2,057,069 $322,000 $0 $0 $322,000 $1,735,069
6 $4,264,069 $1,750,953 -$2,513,116 $0 $0 -$2,513,116 $368,000 $0 $0 $368,000 $2,145,116
7 $4,840,726 $1,973,538 -$2,867,188 $0 $0 -$2,867,188 $276,000 $0 $0 $276,000 $2,591,188
8 $5,342,735 $2,242,304 -$3,100,431 $0 $0 -$3,100,431 $276,000 $0 $0 $276,000 $2,824,431
9 $5,504,909 $2,292,134 -$3,212,775 $0 $0 -$3,212,775 $0 $0 $0 $0 $3,212,775
10 $5,710,594 $2,350,148 -$3,360,446 $0 $0 -$3,360,446 $0 $0 $0 $0 $3,360,446
11 $5,939,026 $2,397,560 -$3,541,466 $0 $0 -$3,541,466 $0 $0 $0 $0 $3,541,466
12 $6,150,542 $2,445,992 -$3,704,549 $0 $0 -$3,704,549 $0 $0 $0 $0 $3,704,549
13 $6,309,527 $2,500,199 -$3,809,328 $0 $0 -$3,809,328 $598,000 $0 $0 $598,000 $3,211,328
14 $6,499,447 $2,544,705 -$3,954,743 $0 $0 -$3,954,743 $506,000 $0 $0 $506,000 $3,448,743
15 $6,769,982 $2,589,508 -$4,180,473 $0 $0 -$4,180,473 $421,667 $0 $0 $421,667 $3,758,807
16 $6,822,422 $2,629,966 -$4,192,456 $0 $0 -$4,192,456 $345,000 $0 $0 $345,000 $3,847,456
17 $7,005,724 $2,667,762 -$4,337,962 $0 $0 -$4,337,962 $241,500 $0 $0 $241,500 $4,096,462
18 $7,170,506 $2,720,379 -$4,450,126 $0 $0 -$4,450,126 $245,333 $0 $0 $245,333 $4,204,793
19 $7,339,835 $2,768,971 -$4,570,864 $0 $0 -$4,570,864 $161,000 $0 $0 $161,000 $4,409,864
20 $7,464,656 $2,819,852 -$4,644,804 $0 $0 -$4,644,804 $138,000 $0 $0 $138,000 $4,506,804
21 $7,787,995 $2,866,619 -$4,921,376 $0 $0 -$4,921,376 $0 $0 $0 $0 $4,921,376
22 $7,881,754 $2,910,818 -$4,970,936 $0 $0 -$4,970,936 $0 $0 $0 $0 $4,970,936
23 $8,091,646 $2,953,790 -$5,137,856 $0 $0 -$5,137,856 $0 $0 $0 $0 $5,137,856
23 $8,287,920 $3,001,945 -$5,285,975 $0 $0 -$5,285,975 $0 $0 $0 $0 $5,285,975
25 $8,490,012 $3,058,666 -$5,431,346 $0 $0 -$5,431,346 $49,833 $0 $0 $49,833 $5,381,513
Totals $144,024,761 $56,192,397 -$87,832,363 $0 $0 -$87,832,363 $5,926,333 $283,872 $4,707,538 $10,917,743 $76,914,620
(1) Differential EIA 2017 High Oil Price Case; Nominal Pricing CNG and Diesel For Transportation Internal Rate of Return: 29.0%
(6) Net Present Value $49,294,378
(2) No Costs associated with the differential maintenance between CNG and Diesel vehicles.
(6) Assumes Discount Rate of 2.5%
(3) Incremental cost for purchasing CNG buses versus Diesel. NO BRT Buses Included. Note: 24 BRT Buses Not Included
(4) Cost for Upgrading Maintenance Facility.
(5) Costs for constructing CNG Fueling Station and Fuel Island Upgrades.
Net Annual Cash
FlowYear
(1)Annual Fuel
Costs Diesel
(1)Annual Fuel
Costs CNG
(1)Annual Fuel
Cost Savings
(2)Annual Fleet
Maintenance
Costs
(2)Annual
Facility
Maintenance
Costs
Total Change In
Operational
Expenditures
(3)Incremental
CNG Fleet
Expenditures
(4)Garage
Renovation
Expenditure
(5)Fueling
Facility
Expenditure
Total Capital
Expenditures
Detailed Cash Flow-Exp; No BRT 87

FY In
Service
Current
Buses
CNG
Upcharge
Diesel
Gallons
Cumulative
Gallons
* Diesel
$/Gal
# NG
$/DGE
Spread /
Savings
Expansion
Buses
CNG
Upcharge
Diesel
Gallons
Cumulative
Gallons
* Diesel
$/Gal
# NG
$/DGE
Spread /
Savings
2018 1 46,000$ 10,300 10,300 4.55 2.60 1.95 9 414,000$ 92,700 92,700 4.55 2.60 1.95
2019 -$ - 10,300 5.28 2.68 2.59 8 368,000$ 82,400 175,100 5.28 2.68 2.59
2020 9 414,000$ 92,700 103,000 5.90 2.76 3.14 7 322,000$ 72,100 247,200 5.90 2.76 3.14
2021 10 460,000$ 103,000 206,000 6.40 2.82 3.58 6 276,000$ 61,800 309,000 6.40 2.82 3.58
2022 -$ - 206,000 6.87 2.88 3.99 21 966,000$ 216,300 525,300 6.87 2.88 3.99
2023 4 184,000$ 41,200 247,200 7.14 2.93 4.21 5 230,000$ 51,500 576,800 7.14 2.93 4.21
2024 1 46,000$ 10,300 257,500 7.34 2.99 4.35 4 184,000$ 41,200 618,000 7.34 2.99 4.35
2025 -$ - 257,500 7.41 3.11 4.30 4 184,000$ 41,200 659,200 7.41 3.11 4.30
2026 11 506,000$ 113,300 370,800 7.64 3.18 4.46 -$ - 659,200 7.64 3.18 4.46
2027 -$ - 370,800 7.92 3.26 4.66 -$ - 659,200 7.92 3.26 4.66
2028 6 276,000$ 61,800 432,600 8.24 3.33 4.91 -$ - 659,200 8.24 3.33 4.91
2029 -$ - 432,600 8.53 3.39 5.14 -$ - 659,200 8.53 3.39 5.14
2030 1 46,000$ - 432,600 8.75 3.47 5.28 9 414,000$ - 659,200 8.75 3.47 5.28
2031 -$ - 432,600 9.01 3.53 5.49 8 368,000$ - 659,200 9.01 3.53 5.49
2032 9 379,500$ - 432,600 9.39 3.59 5.80 7 295,167$ - 659,200 9.39 3.59 5.80
2033 10 383,333$ - 432,600 9.46 3.65 5.81 6 230,000$ - 659,200 9.46 3.65 5.81
2034 -$ - 432,600 9.72 3.70 6.02 21 724,500$ - 659,200 9.72 3.70 6.02
2035 4 122,667$ - 432,600 9.95 3.77 6.17 5 153,333$ - 659,200 9.95 3.77 6.17
2036 1 26,833$ - 432,600 10.18 3.84 6.34 4 107,333$ - 659,200 10.18 3.84 6.34
2037 -$ - 432,600 10.35 3.91 6.44 4 92,000$ - 659,200 10.35 3.91 6.44
2038 11 210,833$ - 432,600 10.80 3.98 6.83 -$ - 659,200 10.80 3.98 6.83
2039 -$ - 432,600 10.93 4.04 6.89 -$ - 659,200 10.93 4.04 6.89
2040 6 69,000$ - 432,600 11.22 4.10 7.13 -$ - 659,200 11.22 4.10 7.13
2041 -$ - 432,600 11.50 4.16 7.33 -$ - 659,200 11.50 4.16 7.33
2042 1 3,833$ - 432,600 11.78 4.24 7.53 9 34,500$ - 659,200 11.78 4.24 7.53
TOTALS 3,174,000$ 432,600 8,528,400 5,362,833$ 659,200 14,409,700
* EIA 2017 High Oil Price Case Nominal Petroleum Prices Transportation Diesel Fuel CNG Vehicle Upcharge 46,000$ Note: 16 BRT Buses
# EIA 2017 High Oil Price Case Natural Gas Delivered Prices Transportation Average Annual Fuel Per Vehicle 10,300
Go Raleigh Transit - Fixed Route Vehicle
50% CNG Fleet Replacement, Expansion, and Fuel Cost Projections
Fleet and Fuel Projections 88

GoRaleigh Transit
50% CNG Fleet; Current and Expanded Services Combined
Detailed Project Cash Flow - EIA 2017 High Oil Price Case
A1 A2 A B C D = A + B + C E F G H = E + F + G I = D + H
0 $0 $0 $0 $0 $0 $0 $0 $0 $0 $0 $0
1 $468,851 $268,264 -$200,587 $0 $0 -$200,587 $460,000 $283,872 $4,707,538 $5,451,410 -$5,250,823
2 $978,235 $497,346 -$480,889 $0 $0 -$480,889 $368,000 $0 $0 $368,000 $112,889
3 $2,064,526 $965,511 -$1,099,014 $0 $0 -$1,099,014 $736,000 $0 $0 $736,000 $363,014
4 $3,295,341 $1,451,021 -$1,844,320 $0 $0 -$1,844,320 $736,000 $0 $0 $736,000 $1,108,320
5 $5,024,519 $2,103,481 -$2,921,038 $0 $0 -$2,921,038 $966,000 $0 $0 $966,000 $1,955,038
6 $5,881,475 $2,415,107 -$3,466,367 $0 $0 -$3,466,367 $414,000 $0 $0 $414,000 $3,052,367
7 $6,429,089 $2,621,105 -$3,807,983 $0 $0 -$3,807,983 $230,000 $0 $0 $230,000 $3,577,983
8 $6,792,907 $2,850,930 -$3,941,977 $0 $0 -$3,941,977 $184,000 $0 $0 $184,000 $3,757,977
9 $7,864,156 $3,274,478 -$4,589,678 $0 $0 -$4,589,678 $506,000 $0 $0 $506,000 $4,083,678
10 $8,157,991 $3,357,355 -$4,800,637 $0 $0 -$4,800,637 $0 $0 $0 $0 $4,800,637
11 $8,993,382 $3,630,591 -$5,362,791 $0 $0 -$5,362,791 $276,000 $0 $0 $276,000 $5,086,791
12 $9,313,677 $3,703,931 -$5,609,746 $0 $0 -$5,609,746 $0 $0 $0 $0 $5,609,746
13 $9,554,427 $3,786,016 -$5,768,411 $0 $0 -$5,768,411 $460,000 $0 $0 $460,000 $5,308,411
14 $9,842,020 $3,853,410 -$5,988,610 $0 $0 -$5,988,610 $368,000 $0 $0 $368,000 $5,620,610
15 $10,251,686 $3,921,255 -$6,330,431 $0 $0 -$6,330,431 $674,667 $0 $0 $674,667 $5,655,764
16 $10,331,096 $3,982,520 -$6,348,576 $0 $0 -$6,348,576 $613,333 $0 $0 $613,333 $5,735,243
17 $10,608,668 $4,039,754 -$6,568,914 $0 $0 -$6,568,914 $724,500 $0 $0 $724,500 $5,844,414
18 $10,858,194 $4,119,432 -$6,738,763 $0 $0 -$6,738,763 $276,000 $0 $0 $276,000 $6,462,763
19 $11,114,607 $4,193,013 -$6,921,594 $0 $0 -$6,921,594 $134,167 $0 $0 $134,167 $6,787,427
20 $11,303,623 $4,270,062 -$7,033,561 $0 $0 -$7,033,561 $92,000 $0 $0 $92,000 $6,941,561
21 $11,793,250 $4,340,880 -$7,452,370 $0 $0 -$7,452,370 $210,833 $0 $0 $210,833 $7,241,536
22 $11,935,227 $4,407,810 -$7,527,417 $0 $0 -$7,527,417 $0 $0 $0 $0 $7,527,417
23 $12,253,064 $4,472,882 -$7,780,182 $0 $0 -$7,780,182 $69,000 $0 $0 $69,000 $7,711,182
24 $12,550,279 $4,545,803 -$8,004,476 $0 $0 -$8,004,476 $0 $0 $0 $0 $8,004,476
25 $12,856,304 $4,631,694 -$8,224,610 $0 $0 -$8,224,610 $38,333 $0 $0 $38,333 $8,186,277
Totals $210,516,595 $81,703,652 -$128,812,943 $0 $0 -$128,812,943 $8,536,833 $283,872 $4,707,538 $13,528,243 $115,284,700
(1) Differential EIA 2017 High Oil Price Case; Nominal Pricing CNG and Diesel For Transportation Internal Rate of Return: 33.4%
(6) Net Present Value $73,958,198
(2) No Costs associated with the differential maintenance between CNG and Diesel vehicles.
(6) Assumes Discount Rate of 2.5%
(3) Incremental cost for purchasing CNG buses versus Diesel.
(4) Cost for Upgrading Maintenance Facility.
(5) Costs for constructing CNG Fueling Station and Fuel Island Upgrades.
Total Capital
Expenditures
Net Annual Cash
Flow
(2)Annual
Facility
Maintenance
Costs
Total Change In
Operational
Expenditures
(3)Incremental
CNG Fleet
Expenditures
(4)Garage
Renovation
Expenditure
(5)Fueling
Facility
Expenditure
Year(1)
Annual Fuel
Costs Diesel
(1)Annual Fuel
Costs CNG
(1)Annual Fuel
Cost Savings
(2)Annual Fleet
Maintenance
Costs
Detailed Cash Flow - Combined 89

GoRaleigh Transit
Current Service; 50% CNG Fleet Replacement
Detailed Project Cash Flow - EIA 2017 High Oil Price Case
A1 A2 A B C D = A + B + C E F G H = E + F + G I = D + H
0 $0 $0 $0 $0 $0 $0 $0 $0 $0 $0 $0
1 $46,885 $26,826 -$20,059 $0 $0 -$20,059 $46,000 $283,872 $4,707,538 $5,037,410 -$5,017,351
2 $54,346 $27,630 -$26,716 $0 $0 -$26,716 $0 $0 $0 $0 $26,716
3 $607,213 $283,974 -$323,239 $0 $0 -$323,239 $414,000 $0 $0 $414,000 -$90,761
4 $1,318,136 $580,408 -$737,728 $0 $0 -$737,728 $460,000 $0 $0 $460,000 $277,728
5 $1,415,357 $592,530 -$822,828 $0 $0 -$822,828 $0 $0 $0 $0 $822,828
6 $1,764,442 $724,532 -$1,039,910 $0 $0 -$1,039,910 $184,000 $0 $0 $184,000 $855,910
7 $1,890,909 $770,913 -$1,119,995 $0 $0 -$1,119,995 $46,000 $0 $0 $46,000 $1,073,995
8 $1,908,120 $800,823 -$1,107,297 $0 $0 -$1,107,297 $0 $0 $0 $0 $1,107,297
9 $2,831,096 $1,178,812 -$1,652,284 $0 $0 -$1,652,284 $506,000 $0 $0 $506,000 $1,146,284
10 $2,936,877 $1,208,648 -$1,728,229 $0 $0 -$1,728,229 $0 $0 $0 $0 $1,728,229
11 $3,563,415 $1,438,536 -$2,124,879 $0 $0 -$2,124,879 $276,000 $0 $0 $276,000 $1,848,879
12 $3,690,325 $1,467,595 -$2,222,730 $0 $0 -$2,222,730 $0 $0 $0 $0 $2,222,730
13 $3,785,716 $1,500,119 -$2,285,597 $0 $0 -$2,285,597 $46,000 $0 $0 $46,000 $2,239,597
14 $3,899,668 $1,526,823 -$2,372,846 $0 $0 -$2,372,846 $0 $0 $0 $0 $2,372,846
15 $4,061,989 $1,553,705 -$2,508,284 $0 $0 -$2,508,284 $379,500 $0 $0 $379,500 $2,128,784
16 $4,093,453 $1,577,980 -$2,515,474 $0 $0 -$2,515,474 $383,333 $0 $0 $383,333 $2,132,140
17 $4,203,434 $1,600,657 -$2,602,777 $0 $0 -$2,602,777 $0 $0 $0 $0 $2,602,777
18 $4,302,303 $1,632,228 -$2,670,076 $0 $0 -$2,670,076 $122,667 $0 $0 $122,667 $2,547,409
19 $4,403,901 $1,661,383 -$2,742,518 $0 $0 -$2,742,518 $26,833 $0 $0 $26,833 $2,715,685
20 $4,478,794 $1,691,911 -$2,786,883 $0 $0 -$2,786,883 $0 $0 $0 $0 $2,786,883
21 $4,672,797 $1,719,971 -$2,952,826 $0 $0 -$2,952,826 $210,833 $0 $0 $210,833 $2,741,992
22 $4,729,052 $1,746,491 -$2,982,561 $0 $0 -$2,982,561 $0 $0 $0 $0 $2,982,561
23 $4,854,988 $1,772,274 -$3,082,713 $0 $0 -$3,082,713 $69,000 $0 $0 $69,000 $3,013,713
24 $4,972,752 $1,801,167 -$3,171,585 $0 $0 -$3,171,585 $0 $0 $0 $0 $3,171,585
25 $5,094,007 $1,835,200 -$3,258,808 $0 $0 -$3,258,808 $3,833 $0 $0 $3,833 $3,254,974
Totals $79,579,979 $30,721,137 -$48,858,842 $0 $0 -$48,858,842 $3,174,000 $283,872 $4,707,538 $8,165,410 $40,693,432
(1) Differential EIA 2017 High Oil Price Case; Nominal Pricing CNG and Diesel For Transportation Internal Rate of Return: 18.1%
(6) Net Present Value $24,820,189
(2) No Costs associated with the differential maintenance between CNG and Diesel vehicles.
(6) Assumes Discount Rate of 2.5%
(3) Incremental cost for purchasing CNG buses versus Diesel.
(4) Cost for Upgrading Maintenance Facility.
(5) Costs for constructing CNG Fueling Station and Fuel Island Upgrades.
Net Annual Cash
FlowYear
(1)Annual Fuel
Costs Diesel
(1)Annual Fuel
Costs CNG
(1)Annual Fuel
Cost Savings
(2)Annual Fleet
Maintenance
Costs
(2)Annual
Facility
Maintenance
Costs
Total Change In
Operational
Expenditures
(3)Incremental
CNG Fleet
Expenditures
(4)Garage
Renovation
Expenditure
(5)Fueling
Facility
Expenditure
Total Capital
Expenditures
Detailed Cash Flow-Current 90

GoRaleigh Transit
Local and BRT; 50% CNG Expanded Service Fleet
Detailed Project Cash Flow - EIA 2017 High Oil Price Case
A1 A2 A B C D = A + B + C E F G H = E + F + G I = D + H
0 $0 $0 $0 $0 $0 $0 $0 $0 $0 $0 $0
1 $421,966 $241,438 -$180,528 $0 $0 -$180,528 $414,000 $283,872 $4,707,538 $5,405,410 -$5,224,882
2 $923,889 $469,716 -$454,173 $0 $0 -$454,173 $368,000 $0 $0 $368,000 $86,173
3 $1,457,312 $681,537 -$775,775 $0 $0 -$775,775 $322,000 $0 $0 $322,000 $453,775
4 $1,977,204 $870,612 -$1,106,592 $0 $0 -$1,106,592 $276,000 $0 $0 $276,000 $830,592
5 $3,609,161 $1,510,951 -$2,098,210 $0 $0 -$2,098,210 $966,000 $0 $0 $966,000 $1,132,210
6 $4,117,032 $1,690,575 -$2,426,457 $0 $0 -$2,426,457 $230,000 $0 $0 $230,000 $2,196,457
7 $4,538,180 $1,850,192 -$2,687,988 $0 $0 -$2,687,988 $184,000 $0 $0 $184,000 $2,503,988
8 $4,884,787 $2,050,107 -$2,834,680 $0 $0 -$2,834,680 $184,000 $0 $0 $184,000 $2,650,680
9 $5,033,060 $2,095,666 -$2,937,394 $0 $0 -$2,937,394 $0 $0 $0 $0 $2,937,394
10 $5,221,114 $2,148,707 -$3,072,407 $0 $0 -$3,072,407 $0 $0 $0 $0 $3,072,407
11 $5,429,966 $2,192,055 -$3,237,912 $0 $0 -$3,237,912 $0 $0 $0 $0 $3,237,912
12 $5,623,352 $2,236,336 -$3,387,016 $0 $0 -$3,387,016 $0 $0 $0 $0 $3,387,016
13 $5,768,711 $2,285,896 -$3,482,814 $0 $0 -$3,482,814 $414,000 $0 $0 $414,000 $3,068,814
14 $5,942,352 $2,326,587 -$3,615,765 $0 $0 -$3,615,765 $368,000 $0 $0 $368,000 $3,247,765
15 $6,189,697 $2,367,550 -$3,822,147 $0 $0 -$3,822,147 $295,167 $0 $0 $295,167 $3,526,980
16 $6,237,643 $2,404,540 -$3,833,103 $0 $0 -$3,833,103 $230,000 $0 $0 $230,000 $3,603,103
17 $6,405,233 $2,439,097 -$3,966,137 $0 $0 -$3,966,137 $724,500 $0 $0 $724,500 $3,241,637
18 $6,555,891 $2,487,204 -$4,068,687 $0 $0 -$4,068,687 $153,333 $0 $0 $153,333 $3,915,354
19 $6,710,706 $2,531,631 -$4,179,075 $0 $0 -$4,179,075 $107,333 $0 $0 $107,333 $4,071,742
20 $6,824,829 $2,578,151 -$4,246,678 $0 $0 -$4,246,678 $92,000 $0 $0 $92,000 $4,154,678
21 $7,120,453 $2,620,909 -$4,499,544 $0 $0 -$4,499,544 $0 $0 $0 $0 $4,499,544
22 $7,206,175 $2,661,319 -$4,544,856 $0 $0 -$4,544,856 $0 $0 $0 $0 $4,544,856
23 $7,398,076 $2,700,608 -$4,697,468 $0 $0 -$4,697,468 $0 $0 $0 $0 $4,697,468
24 $7,577,527 $2,744,636 -$4,832,891 $0 $0 -$4,832,891 $0 $0 $0 $0 $4,832,891
25 $7,762,297 $2,796,495 -$4,965,802 $0 $0 -$4,965,802 $34,500 $0 $0 $34,500 $4,931,302
Totals $130,936,616 $50,982,515 -$79,954,101 $0 $0 -$79,954,101 $5,362,833 $283,872 $4,707,538 $10,354,243 $69,599,858
(1) Differential EIA 2017 High Oil Price Case; Nominal Pricing CNG and Diesel For Transportation Internal Rate of Return: 26.9%
(6) Net Present Value $44,387,113
(2) No Costs associated with the differential maintenance between CNG and Diesel vehicles.
(6) Assumes Discount Rate of 2.5%
(3) Incremental cost for purchasing CNG buses versus Diesel.
(4) Cost for Upgrading Maintenance Facility.
(5) Costs for constructing CNG Fueling Station and Fuel Island Upgrades.
Net Annual Cash
FlowYear
(1)Annual Fuel
Costs Diesel
(1)Annual Fuel
Costs CNG
(1)Annual Fuel
Cost Savings
(2)Annual Fleet
Maintenance
Costs
(2)Annual
Facility
Maintenance
Costs
Total Change In
Operational
Expenditures
(3)Incremental
CNG Fleet
Expenditures
(4)Garage
Renovation
Expenditure
(5)Fueling
Facility
Expenditure
Total Capital
Expenditures
Detailed Cash Flow-Expansion 91

GoRaleigh Transit
Local Service; 50% CNG Expanded Fleet
Detailed Project Cash Flow - EIA 2017 High Oil Price Case
A1 A2 A B C D = A + B + C E F G H = E + F + G I = D + H
0 $0 $0 $0 $0 $0 $0 $0 $0 $0 $0 $0
1 $421,966 $241,438 -$180,528 $0 $0 -$180,528 $414,000 $283,872 $4,707,538 $5,405,410 -$5,224,882
2 $923,889 $469,716 -$454,173 $0 $0 -$454,173 $368,000 $0 $0 $368,000 $86,173
3 $1,457,312 $681,537 -$775,775 $0 $0 -$775,775 $322,000 $0 $0 $322,000 $453,775
4 $1,977,204 $870,612 -$1,106,592 $0 $0 -$1,106,592 $276,000 $0 $0 $276,000 $830,592
5 $2,476,875 $1,036,927 -$1,439,948 $0 $0 -$1,439,948 $230,000 $0 $0 $230,000 $1,209,948
6 $2,940,737 $1,207,554 -$1,733,184 $0 $0 -$1,733,184 $230,000 $0 $0 $230,000 $1,503,184
7 $3,327,999 $1,356,808 -$1,971,191 $0 $0 -$1,971,191 $184,000 $0 $0 $184,000 $1,787,191
8 $3,663,590 $1,537,580 -$2,126,010 $0 $0 -$2,126,010 $184,000 $0 $0 $184,000 $1,942,010
9 $3,774,795 $1,571,749 -$2,203,046 $0 $0 -$2,203,046 $0 $0 $0 $0 $2,203,046
10 $3,915,836 $1,611,530 -$2,304,306 $0 $0 -$2,304,306 $0 $0 $0 $0 $2,304,306
11 $4,072,475 $1,644,041 -$2,428,434 $0 $0 -$2,428,434 $0 $0 $0 $0 $2,428,434
12 $4,217,514 $1,677,252 -$2,540,262 $0 $0 -$2,540,262 $0 $0 $0 $0 $2,540,262
13 $4,326,533 $1,714,422 -$2,612,111 $0 $0 -$2,612,111 $414,000 $0 $0 $414,000 $2,198,111
14 $4,456,764 $1,744,940 -$2,711,824 $0 $0 -$2,711,824 $368,000 $0 $0 $368,000 $2,343,824
15 $4,642,273 $1,775,663 -$2,866,610 $0 $0 -$2,866,610 $295,167 $0 $0 $295,167 $2,571,444
16 $4,678,232 $1,803,405 -$2,874,827 $0 $0 -$2,874,827 $230,000 $0 $0 $230,000 $2,644,827
17 $4,803,925 $1,829,322 -$2,974,603 $0 $0 -$2,974,603 $172,500 $0 $0 $172,500 $2,802,103
18 $4,916,918 $1,865,403 -$3,051,515 $0 $0 -$3,051,515 $153,333 $0 $0 $153,333 $2,898,182
19 $5,033,030 $1,898,723 -$3,134,307 $0 $0 -$3,134,307 $107,333 $0 $0 $107,333 $3,026,973
20 $5,118,622 $1,933,613 -$3,185,009 $0 $0 -$3,185,009 $92,000 $0 $0 $92,000 $3,093,009
21 $5,340,340 $1,965,682 -$3,374,658 $0 $0 -$3,374,658 $0 $0 $0 $0 $3,374,658
22 $5,404,631 $1,995,989 -$3,408,642 $0 $0 -$3,408,642 $0 $0 $0 $0 $3,408,642
23 $5,548,557 $2,025,456 -$3,523,101 $0 $0 -$3,523,101 $0 $0 $0 $0 $3,523,101
23 $5,683,145 $2,058,477 -$3,624,668 $0 $0 -$3,624,668 $0 $0 $0 $0 $3,624,668
25 $5,821,723 $2,097,371 -$3,724,352 $0 $0 -$3,724,352 $34,500 $0 $0 $34,500 $3,689,852
Totals $98,944,886 $38,615,212 -$60,329,674 $0 $0 -$60,329,674 $4,074,833 $283,872 $4,707,538 $9,066,243 $51,263,431
(1) Differential EIA 2017 High Oil Price Case; Nominal Pricing CNG and Diesel For Transportation Internal Rate of Return: 23.2%
(6) Net Present Value $32,386,777
(2) No Costs associated with the differential maintenance between CNG and Diesel vehicles.
(6) Assumes Discount Rate of 2.5%
(3) Incremental cost for purchasing CNG buses versus Diesel. NO BRT Buses Included. Note: 16 BRT Buses Not Included
(4) Cost for Upgrading Maintenance Facility.
(5) Costs for constructing CNG Fueling Station and Fuel Island Upgrades.
Net Annual Cash
FlowYear
(1)Annual Fuel
Costs Diesel
(1)Annual Fuel
Costs CNG
(1)Annual Fuel
Cost Savings
(2)Annual Fleet
Maintenance
Costs
(2)Annual
Facility
Maintenance
Costs
Total Change In
Operational
Expenditures
(3)Incremental
CNG Fleet
Expenditures
(4)Garage
Renovation
Expenditure
(5)Fueling
Facility
Expenditure
Total Capital
Expenditures
Detailed Cash Flow-Exp; No BRT 92

Appendix
EIA 2017 LOW OIL PRICE CASE FINANCIAL SCENARIOS
93

FY In
Service
Current
Buses
CNG
Upcharge
Diesel
Gallons
Cumulative
Gallons
* Diesel
$/Gal
# NG
$/DGE
Spread /
Savings
Expansion
Buses CNG Upcharge
Diesel
Gallons
Cumulative
Gallons
* Diesel
$/Gal
# NG
$/DGE
Spread /
Savings
2018 1 46,000$ 10,300 10,300 2.06 2.63 (0.56) 17 782,000$ 175,100 175,100 2.06 2.63 (0.56)
2019 -$ - 10,300 2.13 2.71 (0.58) 15 690,000$ 154,500 329,600 2.13 2.71 (0.58)
2020 18 828,000$ 185,400 195,700 2.18 2.79 (0.61) 13 598,000$ 133,900 463,500 2.18 2.79 (0.61)
2021 19 874,000$ 195,700 391,400 2.23 2.83 (0.60) 12 552,000$ 123,600 587,100 2.23 2.83 (0.60)
2022 -$ - 391,400 2.30 2.86 (0.56) 41 1,886,000$ 422,300 1,009,400 2.30 2.86 (0.56)
2023 7 322,000$ 72,100 463,500 2.34 2.89 (0.54) 10 460,000$ 103,000 1,112,400 2.34 2.89 (0.54)
2024 2 92,000$ 20,600 484,100 2.40 2.92 (0.52) 8 368,000$ 82,400 1,194,800 2.40 2.92 (0.52)
2025 -$ - 484,100 2.49 2.96 (0.47) 8 368,000$ 82,400 1,277,200 2.49 2.96 (0.47)
2026 21 966,000$ 216,300 700,400 2.57 2.99 (0.42) -$ - 1,277,200 2.57 2.99 (0.42)
2027 -$ - 700,400 2.66 3.09 (0.43) -$ - 1,277,200 2.66 3.09 (0.43)
2028 11 506,000$ 113,300 813,700 2.74 3.12 (0.37) -$ - 1,277,200 2.74 3.12 (0.37)
2029 -$ - 813,700 2.81 3.15 (0.34) -$ - 1,277,200 2.81 3.15 (0.34)
2030 1 46,000$ - 813,700 2.92 3.18 (0.27) 17 782,000$ - 1,277,200 2.92 3.18 (0.27)
2031 -$ - 813,700 2.98 3.23 (0.25) 15 690,000$ - 1,277,200 2.98 3.23 (0.25)
2032 18 759,000$ - 813,700 3.07 3.26 (0.19) 13 548,167$ - 1,277,200 3.07 3.26 (0.19)
2033 19 728,333$ - 813,700 3.16 3.29 (0.13) 12 460,000$ - 1,277,200 3.16 3.29 (0.13)
2034 -$ - 813,700 3.26 3.34 (0.07) 41 1,414,500$ - 1,277,200 3.26 3.34 (0.07)
2035 7 214,667$ - 813,700 3.34 3.40 (0.06) 10 306,667$ - 1,277,200 3.34 3.40 (0.06)
2036 2 53,667$ - 813,700 3.41 3.45 (0.04) 8 214,667$ - 1,277,200 3.41 3.45 (0.04)
2037 -$ - 813,700 3.47 3.51 (0.04) 8 184,000$ - 1,277,200 3.47 3.51 (0.04)
2038 21 402,500$ - 813,700 3.56 3.56 0.00 -$ - 1,277,200 3.56 3.56 0.00
2039 -$ - 813,700 3.68 3.62 0.05 -$ - 1,277,200 3.68 3.62 0.05
2040 11 126,500$ - 813,700 3.77 3.68 0.09 -$ - 1,277,200 3.77 3.68 0.09
2041 -$ - 813,700 3.89 3.74 0.15 -$ - 1,277,200 3.89 3.74 0.15
2042 1 3,833$ - 813,700 3.96 3.83 0.14 17 65,167$ - 1,277,200 3.96 3.83 0.14
TOTALS 5,968,500$ 813,700 16,037,100 10,369,167$ 1,277,200 27,861,500
* EIA 2017 Low Oil Price Case Nominal Petroleum Prices Transportation Diesel Fuel CNG Vehicle Upcharge 46,000$ Note: 32 BRT Buses
# EIA 2017 Low Oil Price Case Natural Gas Delivered Prices Transportation Average Annual Fuel Per Vehicle 10,300
Go Raleigh Transit - Fixed Route Vehicle
100% CNG Fleet Replacement, Expansion, and Fuel Cost Projections
Fleet and Fuel Projections 94

GoRaleigh Transit
Current and Expanded Services Combined
Detailed Project Cash Flow - EIA 2017 Low Oil Price Case
A1 A2 A B C D = A + B + C E F G H = E + F + G I = D + H
0 $0 $0 $0 $0 $0 $0 $0 $0 $0 $0 $0
1 $382,266 $486,831 $104,565 $0 $0 $104,565 $828,000 $283,872 $4,707,538 $5,819,410 -$5,923,975
2 $723,256 $921,969 $198,713 $0 $0 $198,713 $690,000 $0 $0 $690,000 -$888,713
3 $1,440,157 $1,840,485 $400,329 $0 $0 $400,329 $1,426,000 $0 $0 $1,426,000 -$1,826,329
4 $2,182,961 $2,770,038 $587,077 $0 $0 $587,077 $1,426,000 $0 $0 $1,426,000 -$2,013,077
5 $3,215,158 $4,004,906 $789,747 $0 $0 $789,747 $1,886,000 $0 $0 $1,886,000 -$2,675,747
6 $3,693,596 $4,550,746 $857,150 $0 $0 $857,150 $782,000 $0 $0 $782,000 -$1,639,150
7 $4,028,396 $4,901,998 $873,602 $0 $0 $873,602 $460,000 $0 $0 $460,000 -$1,333,602
8 $4,385,242 $5,205,108 $819,866 $0 $0 $819,866 $368,000 $0 $0 $368,000 -$1,187,866
9 $5,082,723 $5,912,507 $829,785 $0 $0 $829,785 $966,000 $0 $0 $966,000 -$1,795,785
10 $5,252,476 $6,103,227 $850,751 $0 $0 $850,751 $0 $0 $0 $0 -$850,751
11 $5,736,363 $6,516,391 $780,028 $0 $0 $780,028 $506,000 $0 $0 $506,000 -$1,286,028
12 $5,881,689 $6,590,113 $708,424 $0 $0 $708,424 $0 $0 $0 $0 -$708,424
13 $6,096,456 $6,656,093 $559,637 $0 $0 $559,637 $828,000 $0 $0 $828,000 -$1,387,637
14 $6,226,157 $6,747,542 $521,386 $0 $0 $521,386 $690,000 $0 $0 $690,000 -$1,211,386
15 $6,425,062 $6,823,216 $398,154 $0 $0 $398,154 $1,307,167 $0 $0 $1,307,167 -$1,705,321
16 $6,605,076 $6,880,610 $275,534 $0 $0 $275,534 $1,188,333 $0 $0 $1,188,333 -$1,463,868
17 $6,821,256 $6,974,805 $153,549 $0 $0 $153,549 $1,414,500 $0 $0 $1,414,500 -$1,568,049
18 $6,990,663 $7,107,688 $117,025 $0 $0 $117,025 $521,333 $0 $0 $521,333 -$638,358
19 $7,130,548 $7,213,646 $83,098 $0 $0 $83,098 $268,333 $0 $0 $268,333 -$351,431
20 $7,256,023 $7,331,572 $75,549 $0 $0 $75,549 $184,000 $0 $0 $184,000 -$259,549
21 $7,448,003 $7,446,045 -$1,959 $0 $0 -$1,959 $402,500 $0 $0 $402,500 -$400,541
22 $7,689,289 $7,574,556 -$114,733 $0 $0 -$114,733 $0 $0 $0 $0 $114,733
23 $7,882,534 $7,688,091 -$194,443 $0 $0 -$194,443 $126,500 $0 $0 $126,500 $67,943
24 $8,143,547 $7,826,694 -$316,853 $0 $0 -$316,853 $0 $0 $0 $0 $316,853
25 $8,289,231 $7,998,737 -$290,494 $0 $0 -$290,494 $69,000 $0 $0 $69,000 $221,494
Totals $135,008,128 $144,073,615 $9,065,487 $0 $0 $9,065,487 $16,337,667 $283,872 $4,707,538 $21,329,077 -$30,394,563
(1) Differential EIA 2017 Low Oil Price Case; Nominal Pricing CNG and Diesel For Transportation Internal Rate of Return: 0.0%
(6) Net Present Value -$24,696,551
(2) No Costs associated with the differential maintenance between CNG and Diesel vehicles.
(6) Assumes Discount Rate of 2.5%
(3) Incremental cost for purchasing CNG buses versus Diesel.
(4) Cost for Upgrading Maintenance Facility.
(5) Costs for constructing CNG Fueling Station and Fuel Island Upgrades.
Total Capital
Expenditures
Net Annual Cash
Flow
(2)Annual
Facility
Maintenance
Costs
Total Change In
Operational
Expenditures
(3)Incremental
CNG Fleet
Expenditures
(4)Garage
Renovation
Expenditure
(5)Fueling
Facility
Expenditure
Year(1)
Annual Fuel
Costs Diesel
(1)Annual Fuel
Costs CNG
(1)Annual Fuel
Cost Savings
(2)Annual Fleet
Maintenance
Costs
Detailed Cash Flow - Combined 95

GoRaleigh Transit
Current Service Fleet Replacement
Detailed Project Cash Flow - EIA 2017 Low Oil Price Case
A1 A2 A B C D = A + B + C E F G H = E + F + G I = D + H
0 $0 $0 $0 $0 $0 $0 $0 $0 $0 $0 $0
1 $21,237 $27,046 $5,809 $0 $0 $5,809 $46,000 $283,872 $4,707,538 $5,037,410 -$5,043,219
2 $21,917 $27,938 $6,022 $0 $0 $6,022 $0 $0 $0 $0 -$6,022
3 $427,547 $546,394 $118,848 $0 $0 $118,848 $828,000 $0 $0 $828,000 -$946,848
4 $873,184 $1,108,015 $234,831 $0 $0 $234,831 $874,000 $0 $0 $874,000 -$1,108,831
5 $898,353 $1,119,018 $220,665 $0 $0 $220,665 $0 $0 $0 $0 -$220,665
6 $1,086,352 $1,338,455 $252,103 $0 $0 $252,103 $322,000 $0 $0 $322,000 -$574,103
7 $1,161,562 $1,413,460 $251,897 $0 $0 $251,897 $92,000 $0 $0 $92,000 -$343,897
8 $1,205,301 $1,430,644 $225,343 $0 $0 $225,343 $0 $0 $0 $0 -$225,343
9 $1,800,131 $2,094,013 $293,882 $0 $0 $293,882 $966,000 $0 $0 $966,000 -$1,259,882
10 $1,860,252 $2,161,559 $301,308 $0 $0 $301,308 $0 $0 $0 $0 -$301,308
11 $2,232,378 $2,535,936 $303,558 $0 $0 $303,558 $506,000 $0 $0 $506,000 -$809,558
12 $2,288,933 $2,564,625 $275,692 $0 $0 $275,692 $0 $0 $0 $0 -$275,692
13 $2,372,512 $2,590,302 $217,790 $0 $0 $217,790 $46,000 $0 $0 $46,000 -$263,790
14 $2,422,987 $2,625,891 $202,904 $0 $0 $202,904 $0 $0 $0 $0 -$202,904
15 $2,500,394 $2,655,340 $154,947 $0 $0 $154,947 $759,000 $0 $0 $759,000 -$913,947
16 $2,570,448 $2,677,676 $107,228 $0 $0 $107,228 $728,333 $0 $0 $728,333 -$835,561
17 $2,654,577 $2,714,333 $59,756 $0 $0 $59,756 $0 $0 $0 $0 -$59,756
18 $2,720,504 $2,766,046 $45,542 $0 $0 $45,542 $214,667 $0 $0 $214,667 -$260,208
19 $2,774,942 $2,807,281 $32,339 $0 $0 $32,339 $53,667 $0 $0 $53,667 -$86,005
20 $2,823,773 $2,853,173 $29,401 $0 $0 $29,401 $0 $0 $0 $0 -$29,401
21 $2,898,484 $2,897,722 -$762 $0 $0 -$762 $402,500 $0 $0 $402,500 -$401,738
22 $2,992,383 $2,947,734 -$44,650 $0 $0 -$44,650 $0 $0 $0 $0 $44,650
23 $3,067,587 $2,991,917 -$75,670 $0 $0 -$75,670 $126,500 $0 $0 $126,500 -$50,830
24 $3,169,164 $3,045,856 -$123,307 $0 $0 -$123,307 $0 $0 $0 $0 $123,307
25 $3,225,858 $3,112,809 -$113,049 $0 $0 -$113,049 $3,833 $0 $0 $3,833 $109,216
Totals $50,070,761 $53,053,184 $2,982,423 $0 $0 $2,982,423 $5,968,500 $283,872 $4,707,538 $10,959,910 -$13,942,333
(1) Differential EIA 2017 Low Oil Price Case; Nominal Pricing CNG and Diesel For Transportation Internal Rate of Return: 0.0%
(6) Net Present Value -$11,670,203
(2) No Costs associated with the differential maintenance between CNG and Diesel vehicles.
(6) Assumes Discount Rate of 2.5%
(3) Incremental cost for purchasing CNG buses versus Diesel.
(4) Cost for Upgrading Maintenance Facility.
(5) Costs for constructing CNG Fueling Station and Fuel Island Upgrades.
Net Annual Cash
FlowYear
(1)Annual Fuel
Costs Diesel
(1)Annual Fuel
Costs CNG
(1)Annual Fuel
Cost Savings
(2)Annual Fleet
Maintenance
Costs
(2)Annual
Facility
Maintenance
Costs
Total Change In
Operational
Expenditures
(3)Incremental
CNG Fleet
Expenditures
(4)Garage
Renovation
Expenditure
(5)Fueling
Facility
Expenditure
Total Capital
Expenditures
Detailed Cash Flow-Current 96

GoRaleigh Transit
Local and BRT Expanded Service Fleet
Detailed Project Cash Flow - EIA 2017 Low Oil Price Case
A1 A2 A B C D = A + B + C E F G H = E + F + G I = D + H
0 $0 $0 $0 $0 $0 $0 $0 $0 $0 $0 $0
1 $361,029 $459,785 $98,755 $0 $0 $98,755 $782,000 $283,872 $4,707,538 $5,773,410 -$5,872,165
2 $701,339 $894,030 $192,692 $0 $0 $192,692 $690,000 $0 $0 $690,000 -$882,692
3 $1,012,610 $1,294,091 $281,481 $0 $0 $281,481 $598,000 $0 $0 $598,000 -$879,481
4 $1,309,777 $1,662,023 $352,246 $0 $0 $352,246 $552,000 $0 $0 $552,000 -$904,246
5 $2,316,805 $2,885,888 $569,083 $0 $0 $569,083 $1,886,000 $0 $0 $1,886,000 -$2,455,083
6 $2,607,244 $3,212,291 $605,047 $0 $0 $605,047 $460,000 $0 $0 $460,000 -$1,065,047
7 $2,866,834 $3,488,538 $621,704 $0 $0 $621,704 $368,000 $0 $0 $368,000 -$989,704
8 $3,179,942 $3,774,465 $594,523 $0 $0 $594,523 $368,000 $0 $0 $368,000 -$962,523
9 $3,282,592 $3,818,494 $535,903 $0 $0 $535,903 $0 $0 $0 $0 -$535,903
10 $3,392,224 $3,941,667 $549,443 $0 $0 $549,443 $0 $0 $0 $0 -$549,443
11 $3,503,985 $3,980,456 $476,470 $0 $0 $476,470 $0 $0 $0 $0 -$476,470
12 $3,592,756 $4,025,488 $432,732 $0 $0 $432,732 $0 $0 $0 $0 -$432,732
13 $3,723,944 $4,065,791 $341,847 $0 $0 $341,847 $782,000 $0 $0 $782,000 -$1,123,847
14 $3,803,170 $4,121,651 $318,482 $0 $0 $318,482 $690,000 $0 $0 $690,000 -$1,008,482
15 $3,924,668 $4,167,876 $243,207 $0 $0 $243,207 $548,167 $0 $0 $548,167 -$791,374
16 $4,034,628 $4,202,934 $168,307 $0 $0 $168,307 $460,000 $0 $0 $460,000 -$628,307
17 $4,166,679 $4,260,472 $93,793 $0 $0 $93,793 $1,414,500 $0 $0 $1,414,500 -$1,508,293
18 $4,270,159 $4,341,642 $71,483 $0 $0 $71,483 $306,667 $0 $0 $306,667 -$378,150
19 $4,355,606 $4,406,365 $50,759 $0 $0 $50,759 $214,667 $0 $0 $214,667 -$265,426
20 $4,432,251 $4,478,399 $46,148 $0 $0 $46,148 $184,000 $0 $0 $184,000 -$230,148
21 $4,549,519 $4,548,323 -$1,196 $0 $0 -$1,196 $0 $0 $0 $0 $1,196
22 $4,696,906 $4,626,823 -$70,083 $0 $0 -$70,083 $0 $0 $0 $0 $70,083
23 $4,814,947 $4,696,174 -$118,773 $0 $0 -$118,773 $0 $0 $0 $0 $118,773
24 $4,974,384 $4,780,838 -$193,546 $0 $0 -$193,546 $0 $0 $0 $0 $193,546
25 $5,063,373 $4,885,928 -$177,444 $0 $0 -$177,444 $65,167 $0 $0 $65,167 $112,278
Totals $84,937,368 $91,020,431 $6,083,064 $0 $0 $6,083,064 $10,369,167 $283,872 $4,707,538 $15,360,577 -$21,443,640
(1) Differential EIA 2017 Low Oil Price Case; Nominal Pricing CNG and Diesel For Transportation Internal Rate of Return: 0.0%
(6) Net Present Value -$17,777,244
(2) No Costs associated with the differential maintenance between CNG and Diesel vehicles.
(6) Assumes Discount Rate of 2.5%
(3) Incremental cost for purchasing CNG buses versus Diesel.
(4) Cost for Upgrading Maintenance Facility.
(5) Costs for constructing CNG Fueling Station and Fuel Island Upgrades.
Net Annual Cash
FlowYear
(1)Annual Fuel
Costs Diesel
(1)Annual Fuel
Costs CNG
(1)Annual Fuel
Cost Savings
(2)Annual Fleet
Maintenance
Costs
(2)Annual
Facility
Maintenance
Costs
Total Change In
Operational
Expenditures
(3)Incremental
CNG Fleet
Expenditures
(4)Garage
Renovation
Expenditure
(5)Fueling
Facility
Expenditure
Total Capital
Expenditures
Detailed Cash Flow-Expansion 97
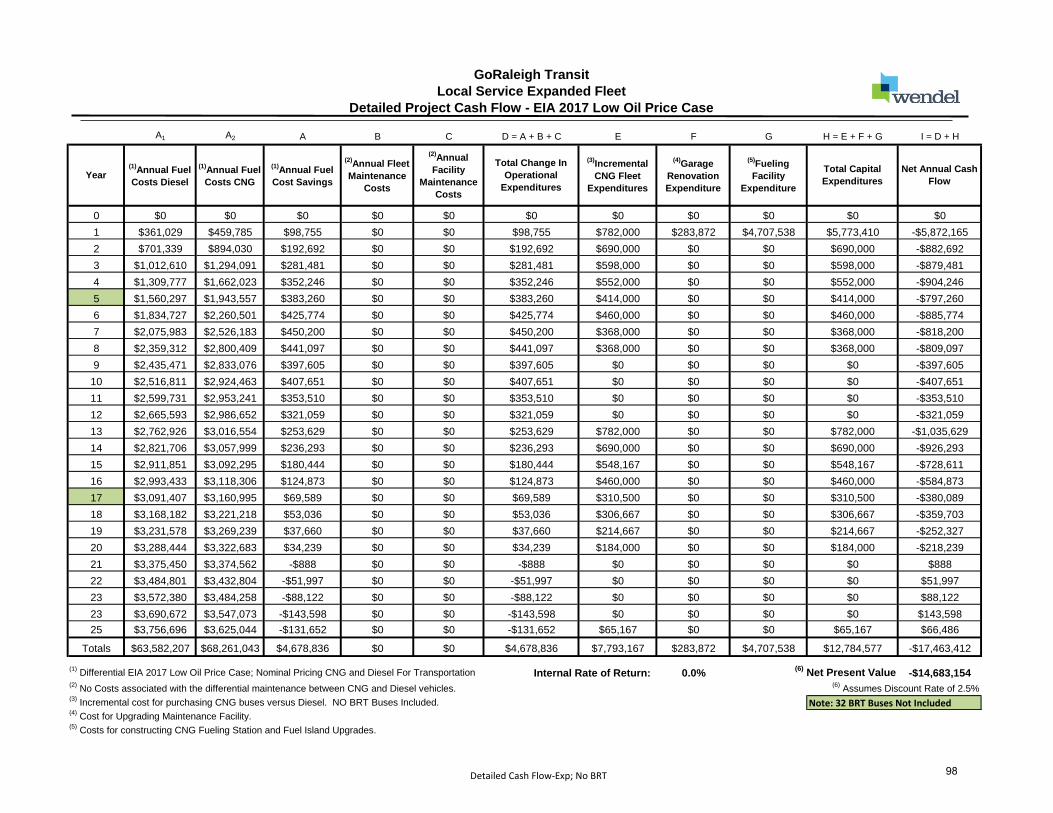
GoRaleigh Transit
Local Service Expanded Fleet
Detailed Project Cash Flow - EIA 2017 Low Oil Price Case
A1 A2 A B C D = A + B + C E F G H = E + F + G I = D + H
0 $0 $0 $0 $0 $0 $0 $0 $0 $0 $0 $0
1 $361,029 $459,785 $98,755 $0 $0 $98,755 $782,000 $283,872 $4,707,538 $5,773,410 -$5,872,165
2 $701,339 $894,030 $192,692 $0 $0 $192,692 $690,000 $0 $0 $690,000 -$882,692
3 $1,012,610 $1,294,091 $281,481 $0 $0 $281,481 $598,000 $0 $0 $598,000 -$879,481
4 $1,309,777 $1,662,023 $352,246 $0 $0 $352,246 $552,000 $0 $0 $552,000 -$904,246
5 $1,560,297 $1,943,557 $383,260 $0 $0 $383,260 $414,000 $0 $0 $414,000 -$797,260
6 $1,834,727 $2,260,501 $425,774 $0 $0 $425,774 $460,000 $0 $0 $460,000 -$885,774
7 $2,075,983 $2,526,183 $450,200 $0 $0 $450,200 $368,000 $0 $0 $368,000 -$818,200
8 $2,359,312 $2,800,409 $441,097 $0 $0 $441,097 $368,000 $0 $0 $368,000 -$809,097
9 $2,435,471 $2,833,076 $397,605 $0 $0 $397,605 $0 $0 $0 $0 -$397,605
10 $2,516,811 $2,924,463 $407,651 $0 $0 $407,651 $0 $0 $0 $0 -$407,651
11 $2,599,731 $2,953,241 $353,510 $0 $0 $353,510 $0 $0 $0 $0 -$353,510
12 $2,665,593 $2,986,652 $321,059 $0 $0 $321,059 $0 $0 $0 $0 -$321,059
13 $2,762,926 $3,016,554 $253,629 $0 $0 $253,629 $782,000 $0 $0 $782,000 -$1,035,629
14 $2,821,706 $3,057,999 $236,293 $0 $0 $236,293 $690,000 $0 $0 $690,000 -$926,293
15 $2,911,851 $3,092,295 $180,444 $0 $0 $180,444 $548,167 $0 $0 $548,167 -$728,611
16 $2,993,433 $3,118,306 $124,873 $0 $0 $124,873 $460,000 $0 $0 $460,000 -$584,873
17 $3,091,407 $3,160,995 $69,589 $0 $0 $69,589 $310,500 $0 $0 $310,500 -$380,089
18 $3,168,182 $3,221,218 $53,036 $0 $0 $53,036 $306,667 $0 $0 $306,667 -$359,703
19 $3,231,578 $3,269,239 $37,660 $0 $0 $37,660 $214,667 $0 $0 $214,667 -$252,327
20 $3,288,444 $3,322,683 $34,239 $0 $0 $34,239 $184,000 $0 $0 $184,000 -$218,239
21 $3,375,450 $3,374,562 -$888 $0 $0 -$888 $0 $0 $0 $0 $888
22 $3,484,801 $3,432,804 -$51,997 $0 $0 -$51,997 $0 $0 $0 $0 $51,997
23 $3,572,380 $3,484,258 -$88,122 $0 $0 -$88,122 $0 $0 $0 $0 $88,122
23 $3,690,672 $3,547,073 -$143,598 $0 $0 -$143,598 $0 $0 $0 $0 $143,598
25 $3,756,696 $3,625,044 -$131,652 $0 $0 -$131,652 $65,167 $0 $0 $65,167 $66,486
Totals $63,582,207 $68,261,043 $4,678,836 $0 $0 $4,678,836 $7,793,167 $283,872 $4,707,538 $12,784,577 -$17,463,412
(1) Differential EIA 2017 Low Oil Price Case; Nominal Pricing CNG and Diesel For Transportation Internal Rate of Return: 0.0%
(6) Net Present Value -$14,683,154
(2) No Costs associated with the differential maintenance between CNG and Diesel vehicles.
(6) Assumes Discount Rate of 2.5%
(3) Incremental cost for purchasing CNG buses versus Diesel. NO BRT Buses Included. Note: 32 BRT Buses Not Included
(4) Cost for Upgrading Maintenance Facility.
(5) Costs for constructing CNG Fueling Station and Fuel Island Upgrades.
Net Annual Cash
FlowYear
(1)Annual Fuel
Costs Diesel
(1)Annual Fuel
Costs CNG
(1)Annual Fuel
Cost Savings
(2)Annual Fleet
Maintenance
Costs
(2)Annual
Facility
Maintenance
Costs
Total Change In
Operational
Expenditures
(3)Incremental
CNG Fleet
Expenditures
(4)Garage
Renovation
Expenditure
(5)Fueling
Facility
Expenditure
Total Capital
Expenditures
Detailed Cash Flow-Exp; No BRT 98

FY In
Service
Current
Buses
CNG
Upcharge
Diesel
Gallons
Cumulative
Gallons
* Diesel
$/Gal
# NG
$/DGE
Spread /
Savings
Expansion
Buses
CNG
Upcharge
Diesel
Gallons
Cumulative
Gallons
* Diesel
$/Gal
# NG
$/DGE
Spread /
Savings
2018 1 46,000$ 10,300 10,300 2.06 2.63 (0.56) 13 598,000$ 133,900 133,900 2.06 2.63 (0.56)
2019 -$ - 10,300 2.13 2.71 (0.58) 11 506,000$ 113,300 247,200 2.13 2.71 (0.58)
2020 14 644,000$ 144,200 154,500 2.18 2.79 (0.61) 10 460,000$ 103,000 350,200 2.18 2.79 (0.61)
2021 14 644,000$ 144,200 298,700 2.23 2.83 (0.60) 9 414,000$ 92,700 442,900 2.23 2.83 (0.60)
2022 -$ - 298,700 2.30 2.86 (0.56) 31 1,426,000$ 319,300 762,200 2.30 2.86 (0.56)
2023 5 230,000$ 51,500 350,200 2.34 2.89 (0.54) 8 368,000$ 82,400 844,600 2.34 2.89 (0.54)
2024 2 92,000$ 20,600 370,800 2.40 2.92 (0.52) 6 276,000$ 61,800 906,400 2.40 2.92 (0.52)
2025 -$ - 370,800 2.49 2.96 (0.47) 6 276,000$ 61,800 968,200 2.49 2.96 (0.47)
2026 16 736,000$ 164,800 535,600 2.57 2.99 (0.42) -$ - 968,200 2.57 2.99 (0.42)
2027 -$ - 535,600 2.66 3.09 (0.43) -$ - 968,200 2.66 3.09 (0.43)
2028 8 368,000$ 82,400 618,000 2.74 3.12 (0.37) -$ - 968,200 2.74 3.12 (0.37)
2029 -$ - 618,000 2.81 3.15 (0.34) -$ - 968,200 2.81 3.15 (0.34)
2030 1 46,000$ - 618,000 2.92 3.18 (0.27) 13 598,000$ - 968,200 2.92 3.18 (0.27)
2031 -$ - 618,000 2.98 3.23 (0.25) 11 506,000$ - 968,200 2.98 3.23 (0.25)
2032 14 590,333$ - 618,000 3.07 3.26 (0.19) 10 421,667$ - 968,200 3.07 3.26 (0.19)
2033 14 536,667$ - 618,000 3.16 3.29 (0.13) 9 345,000$ - 968,200 3.16 3.29 (0.13)
2034 -$ - 618,000 3.26 3.34 (0.07) 31 1,069,500$ - 968,200 3.26 3.34 (0.07)
2035 5 153,333$ - 618,000 3.34 3.40 (0.06) 8 245,333$ - 968,200 3.34 3.40 (0.06)
2036 2 53,667$ - 618,000 3.41 3.45 (0.04) 6 161,000$ - 968,200 3.41 3.45 (0.04)
2037 -$ - 618,000 3.47 3.51 (0.04) 6 138,000$ - 968,200 3.47 3.51 (0.04)
2038 16 306,667$ - 618,000 3.56 3.56 0.00 -$ - 968,200 3.56 3.56 0.00
2039 -$ - 618,000 3.68 3.62 0.05 -$ - 968,200 3.68 3.62 0.05
2040 8 92,000$ - 618,000 3.77 3.68 0.09 -$ - 968,200 3.77 3.68 0.09
2041 -$ - 618,000 3.89 3.74 0.15 -$ - 968,200 3.89 3.74 0.15
2042 1 3,833$ - 618,000 3.96 3.83 0.14 13 49,833$ - 968,200 3.96 3.83 0.14
TOTALS 4,542,500$ 618,000 12,205,500 7,858,333$ 968,200 21,115,000
* EIA 2017 Low Oil Price Case Nominal Petroleum Prices Transportation Diesel Fuel CNG Vehicle Upcharge 46,000$ Note: 24 BRT Buses
# EIA 2017 Low Oil Price Case Natural Gas Delivered Prices Transportation Average Annual Fuel Per Vehicle 10,300
Go Raleigh Transit - Fixed Route Vehicle
75% CNG Fleet Replacement, Expansion, and Fuel Cost Projections
Fleet and Fuel Projections 99

GoRaleigh Transit
75% CNG Fleet; Current and Expanded Services Combined
Detailed Project Cash Flow - EIA 2017 Low Oil Price Case
A1 A2 A B C D = A + B + C E F G H = E + F + G I = D + H
0 $0 $0 $0 $0 $0 $0 $0 $0 $0 $0 $0
1 $297,318 $378,646 $81,328 $0 $0 $81,328 $644,000 $283,872 $4,707,538 $5,635,410 -$5,716,738
2 $547,921 $698,461 $150,540 $0 $0 $150,540 $506,000 $0 $0 $506,000 -$656,540
3 $1,102,620 $1,409,122 $306,502 $0 $0 $306,502 $1,104,000 $0 $0 $1,104,000 -$1,410,502
4 $1,654,455 $2,099,397 $444,942 $0 $0 $444,942 $1,058,000 $0 $0 $1,058,000 -$1,502,942
5 $2,435,010 $3,033,127 $598,118 $0 $0 $598,118 $1,426,000 $0 $0 $1,426,000 -$2,024,118
6 $2,800,373 $3,450,239 $649,865 $0 $0 $649,865 $598,000 $0 $0 $598,000 -$1,247,865
7 $3,064,547 $3,729,127 $664,580 $0 $0 $664,580 $368,000 $0 $0 $368,000 -$1,032,580
8 $3,333,810 $3,957,100 $623,290 $0 $0 $623,290 $276,000 $0 $0 $276,000 -$899,290
9 $3,864,987 $4,495,969 $630,982 $0 $0 $630,982 $736,000 $0 $0 $736,000 -$1,366,982
10 $3,994,070 $4,640,995 $646,925 $0 $0 $646,925 $0 $0 $0 $0 -$646,925
11 $4,351,724 $4,943,469 $591,746 $0 $0 $591,746 $368,000 $0 $0 $368,000 -$959,746
12 $4,461,971 $4,999,396 $537,425 $0 $0 $537,425 $0 $0 $0 $0 -$537,425
13 $4,624,898 $5,049,450 $424,552 $0 $0 $424,552 $644,000 $0 $0 $644,000 -$1,068,552
14 $4,723,291 $5,118,825 $395,534 $0 $0 $395,534 $506,000 $0 $0 $506,000 -$901,534
15 $4,874,185 $5,176,233 $302,048 $0 $0 $302,048 $1,012,000 $0 $0 $1,012,000 -$1,314,048
16 $5,010,747 $5,219,773 $209,026 $0 $0 $209,026 $881,667 $0 $0 $881,667 -$1,090,693
17 $5,174,746 $5,291,231 $116,485 $0 $0 $116,485 $1,069,500 $0 $0 $1,069,500 -$1,185,985
18 $5,303,261 $5,392,039 $88,778 $0 $0 $88,778 $398,667 $0 $0 $398,667 -$487,444
19 $5,409,381 $5,472,421 $63,040 $0 $0 $63,040 $214,667 $0 $0 $214,667 -$277,706
20 $5,504,569 $5,561,882 $57,313 $0 $0 $57,313 $138,000 $0 $0 $138,000 -$195,313
21 $5,650,209 $5,648,724 -$1,486 $0 $0 -$1,486 $306,667 $0 $0 $306,667 -$305,181
22 $5,833,254 $5,746,215 -$87,038 $0 $0 -$87,038 $0 $0 $0 $0 $87,038
23 $5,979,853 $5,832,345 -$147,508 $0 $0 -$147,508 $92,000 $0 $0 $92,000 $55,508
24 $6,177,864 $5,937,492 -$240,371 $0 $0 -$240,371 $0 $0 $0 $0 $240,371
25 $6,288,382 $6,068,008 -$220,374 $0 $0 -$220,374 $53,667 $0 $0 $53,667 $166,708
Totals $102,463,447 $109,349,687 $6,886,240 $0 $0 $6,886,240 $12,400,833 $283,872 $4,707,538 $17,392,243 -$24,278,484
(1) Differential EIA 2017 Low Oil Price Case; Nominal Pricing CNG and Diesel For Transportation Internal Rate of Return: 0.0%
(6) Net Present Value -$19,895,986
(2) No Costs associated with the differential maintenance between CNG and Diesel vehicles.
(6) Assumes Discount Rate of 2.5%
(3) Incremental cost for purchasing CNG buses versus Diesel.
(4) Cost for Upgrading Maintenance Facility.
(5) Costs for constructing CNG Fueling Station and Fuel Island Upgrades.
Year(1)
Annual Fuel
Costs Diesel
(1)Annual Fuel
Costs CNG
(1)Annual Fuel
Cost Savings
(2)Annual Fleet
Maintenance
Costs
Total Capital
Expenditures
Net Annual Cash
Flow
(2)Annual
Facility
Maintenance
Costs
Total Change In
Operational
Expenditures
(3)Incremental
CNG Fleet
Expenditures
(4)Garage
Renovation
Expenditure
(5)Fueling
Facility
Expenditure
Detailed Cash Flow - Combined 100

GoRaleigh Transit
Current Service 75% CNG Fleet Replacement
Detailed Project Cash Flow - EIA 2017 Low Oil Price Case
A1 A2 A B C D = A + B + C E F G H = E + F + G I = D + H
0 $0 $0 $0 $0 $0 $0 $0 $0 $0 $0 $0
1 $21,237 $27,046 $5,809 $0 $0 $5,809 $46,000 $283,872 $4,707,538 $5,037,410 -$5,043,219
2 $21,917 $27,938 $6,022 $0 $0 $6,022 $0 $0 $0 $0 -$6,022
3 $337,537 $431,364 $93,827 $0 $0 $93,827 $644,000 $0 $0 $644,000 -$737,827
4 $666,378 $845,590 $179,213 $0 $0 $179,213 $644,000 $0 $0 $644,000 -$823,213
5 $685,585 $853,987 $168,402 $0 $0 $168,402 $0 $0 $0 $0 -$168,402
6 $820,799 $1,011,277 $190,478 $0 $0 $190,478 $230,000 $0 $0 $230,000 -$420,478
7 $889,707 $1,082,650 $192,943 $0 $0 $192,943 $92,000 $0 $0 $92,000 -$284,943
8 $923,209 $1,095,812 $172,603 $0 $0 $172,603 $0 $0 $0 $0 -$172,603
9 $1,376,571 $1,601,304 $224,733 $0 $0 $224,733 $736,000 $0 $0 $736,000 -$960,733
10 $1,422,546 $1,652,957 $230,412 $0 $0 $230,412 $0 $0 $0 $0 -$230,412
11 $1,695,477 $1,926,027 $230,550 $0 $0 $230,550 $368,000 $0 $0 $368,000 -$598,550
12 $1,738,430 $1,947,817 $209,386 $0 $0 $209,386 $0 $0 $0 $0 -$209,386
13 $1,801,908 $1,967,318 $165,410 $0 $0 $165,410 $46,000 $0 $0 $46,000 -$211,410
14 $1,840,243 $1,994,347 $154,104 $0 $0 $154,104 $0 $0 $0 $0 -$154,104
15 $1,899,033 $2,016,714 $117,681 $0 $0 $117,681 $590,333 $0 $0 $590,333 -$708,014
16 $1,952,239 $2,033,678 $81,439 $0 $0 $81,439 $536,667 $0 $0 $536,667 -$618,105
17 $2,016,135 $2,061,519 $45,384 $0 $0 $45,384 $0 $0 $0 $0 -$45,384
18 $2,066,206 $2,100,794 $34,589 $0 $0 $34,589 $153,333 $0 $0 $153,333 -$187,922
19 $2,107,551 $2,132,112 $24,561 $0 $0 $24,561 $53,667 $0 $0 $53,667 -$78,228
20 $2,144,637 $2,166,967 $22,330 $0 $0 $22,330 $0 $0 $0 $0 -$22,330
21 $2,201,380 $2,200,801 -$579 $0 $0 -$579 $306,667 $0 $0 $306,667 -$306,088
22 $2,272,696 $2,238,785 -$33,911 $0 $0 -$33,911 $0 $0 $0 $0 $33,911
23 $2,329,813 $2,272,342 -$57,471 $0 $0 -$57,471 $92,000 $0 $0 $92,000 -$34,529
24 $2,406,960 $2,313,309 -$93,651 $0 $0 -$93,651 $0 $0 $0 $0 $93,651
25 $2,450,019 $2,364,159 -$85,860 $0 $0 -$85,860 $3,833 $0 $0 $3,833 $82,027
Totals $38,088,213 $40,366,616 $2,278,403 $0 $0 $2,278,403 $4,542,500 $283,872 $4,707,538 $9,533,910 -$11,812,313
(1) Differential EIA 2017 Low Oil Price Case; Nominal Pricing CNG and Diesel For Transportation Internal Rate of Return: 0.0%
(6) Net Present Value -$10,026,783
(2) No Costs associated with the differential maintenance between CNG and Diesel vehicles.
(6) Assumes Discount Rate of 2.5%
(3) Incremental cost for purchasing CNG buses versus Diesel.
(4) Cost for Upgrading Maintenance Facility.
(5) Costs for constructing CNG Fueling Station and Fuel Island Upgrades.
Net Annual Cash
FlowYear
(1)Annual Fuel
Costs Diesel
(1)Annual Fuel
Costs CNG
(1)Annual Fuel
Cost Savings
(2)Annual Fleet
Maintenance
Costs
(2)Annual
Facility
Maintenance
Costs
Total Change In
Operational
Expenditures
(3)Incremental
CNG Fleet
Expenditures
(4)Garage
Renovation
Expenditure
(5)Fueling
Facility
Expenditure
Total Capital
Expenditures
Detailed Cash Flow-Current 101

GoRaleigh Transit
Local and BRT; 75% CNG Expanded Service Fleet
Detailed Project Cash Flow - EIA 2017 Low Oil Price Case
A1 A2 A B C D = A + B + C E F G H = E + F + G I = D + H
0 $0 $0 $0 $0 $0 $0 $0 $0 $0 $0 $0
1 $276,081 $351,600 $75,519 $0 $0 $75,519 $598,000 $283,872 $4,707,538 $5,589,410 -$5,664,929
2 $526,004 $670,523 $144,519 $0 $0 $144,519 $506,000 $0 $0 $506,000 -$650,519
3 $765,083 $977,758 $212,675 $0 $0 $212,675 $460,000 $0 $0 $460,000 -$672,675
4 $988,077 $1,253,807 $265,729 $0 $0 $265,729 $414,000 $0 $0 $414,000 -$679,729
5 $1,749,424 $2,179,140 $429,716 $0 $0 $429,716 $1,426,000 $0 $0 $1,426,000 -$1,855,716
6 $1,979,574 $2,438,962 $459,387 $0 $0 $459,387 $368,000 $0 $0 $368,000 -$827,387
7 $2,174,840 $2,646,477 $471,638 $0 $0 $471,638 $276,000 $0 $0 $276,000 -$747,638
8 $2,410,601 $2,861,288 $450,687 $0 $0 $450,687 $276,000 $0 $0 $276,000 -$726,687
9 $2,488,416 $2,894,665 $406,249 $0 $0 $406,249 $0 $0 $0 $0 -$406,249
10 $2,571,525 $2,988,038 $416,513 $0 $0 $416,513 $0 $0 $0 $0 -$416,513
11 $2,656,247 $3,017,442 $361,195 $0 $0 $361,195 $0 $0 $0 $0 -$361,195
12 $2,723,541 $3,051,579 $328,039 $0 $0 $328,039 $0 $0 $0 $0 -$328,039
13 $2,822,989 $3,082,132 $259,142 $0 $0 $259,142 $598,000 $0 $0 $598,000 -$857,142
14 $2,883,048 $3,124,478 $241,430 $0 $0 $241,430 $506,000 $0 $0 $506,000 -$747,430
15 $2,975,152 $3,159,519 $184,367 $0 $0 $184,367 $421,667 $0 $0 $421,667 -$606,034
16 $3,058,508 $3,186,095 $127,587 $0 $0 $127,587 $345,000 $0 $0 $345,000 -$472,587
17 $3,158,611 $3,229,713 $71,102 $0 $0 $71,102 $1,069,500 $0 $0 $1,069,500 -$1,140,602
18 $3,237,056 $3,291,245 $54,189 $0 $0 $54,189 $245,333 $0 $0 $245,333 -$299,522
19 $3,301,830 $3,340,309 $38,479 $0 $0 $38,479 $161,000 $0 $0 $161,000 -$199,479
20 $3,359,932 $3,394,915 $34,983 $0 $0 $34,983 $138,000 $0 $0 $138,000 -$172,983
21 $3,448,829 $3,447,922 -$907 $0 $0 -$907 $0 $0 $0 $0 $907
22 $3,560,557 $3,507,430 -$53,127 $0 $0 -$53,127 $0 $0 $0 $0 $53,127
23 $3,650,040 $3,560,003 -$90,038 $0 $0 -$90,038 $0 $0 $0 $0 $90,038
24 $3,770,904 $3,624,184 -$146,720 $0 $0 -$146,720 $0 $0 $0 $0 $146,720
25 $3,838,363 $3,703,849 -$134,514 $0 $0 -$134,514 $49,833 $0 $0 $49,833 $84,681
Totals $64,375,234 $68,983,071 $4,607,837 $0 $0 $4,607,837 $7,858,333 $283,872 $4,707,538 $12,849,743 -$17,457,581
(1) Differential EIA 2017 Low Oil Price Case; Nominal Pricing CNG and Diesel For Transportation Internal Rate of Return: 0.0%
(6) Net Present Value -$14,620,099
(2) No Costs associated with the differential maintenance between CNG and Diesel vehicles.
(6) Assumes Discount Rate of 2.5%
(3) Incremental cost for purchasing CNG buses versus Diesel.
(4) Cost for Upgrading Maintenance Facility.
(5) Costs for constructing CNG Fueling Station and Fuel Island Upgrades.
Net Annual Cash
FlowYear
(1)Annual Fuel
Costs Diesel
(1)Annual Fuel
Costs CNG
(1)Annual Fuel
Cost Savings
(2)Annual Fleet
Maintenance
Costs
(2)Annual
Facility
Maintenance
Costs
Total Change In
Operational
Expenditures
(3)Incremental
CNG Fleet
Expenditures
(4)Garage
Renovation
Expenditure
(5)Fueling
Facility
Expenditure
Total Capital
Expenditures
Detailed Cash Flow-Expansion 102

GoRaleigh Transit
Local Service; 75% CNG Expanded Fleet
Detailed Project Cash Flow - EIA 2017 Low Oil Price Case
A1 A2 A B C D = A + B + C E F G H = E + F + G I = D + H
0 $0 $0 $0 $0 $0 $0 $0 $0 $0 $0 $0
1 $276,081 $351,600 $75,519 $0 $0 $75,519 $598,000 $283,872 $4,707,538 $5,589,410 -$5,664,929
2 $526,004 $670,523 $144,519 $0 $0 $144,519 $506,000 $0 $0 $506,000 -$650,519
3 $765,083 $977,758 $212,675 $0 $0 $212,675 $460,000 $0 $0 $460,000 -$672,675
4 $988,077 $1,253,807 $265,729 $0 $0 $265,729 $414,000 $0 $0 $414,000 -$679,729
5 $1,182,043 $1,472,392 $290,348 $0 $0 $290,348 $322,000 $0 $0 $322,000 -$612,348
6 $1,400,187 $1,725,119 $324,933 $0 $0 $324,933 $368,000 $0 $0 $368,000 -$692,933
7 $1,581,702 $1,924,711 $343,009 $0 $0 $343,009 $276,000 $0 $0 $276,000 -$619,009
8 $1,795,128 $2,130,746 $335,618 $0 $0 $335,618 $276,000 $0 $0 $276,000 -$611,618
9 $1,853,076 $2,155,602 $302,526 $0 $0 $302,526 $0 $0 $0 $0 -$302,526
10 $1,914,965 $2,225,135 $310,170 $0 $0 $310,170 $0 $0 $0 $0 -$310,170
11 $1,978,056 $2,247,032 $268,975 $0 $0 $268,975 $0 $0 $0 $0 -$268,975
12 $2,028,169 $2,272,453 $244,284 $0 $0 $244,284 $0 $0 $0 $0 -$244,284
13 $2,102,226 $2,295,204 $192,978 $0 $0 $192,978 $598,000 $0 $0 $598,000 -$790,978
14 $2,146,951 $2,326,739 $179,788 $0 $0 $179,788 $506,000 $0 $0 $506,000 -$685,788
15 $2,215,539 $2,352,833 $137,295 $0 $0 $137,295 $421,667 $0 $0 $421,667 -$558,961
16 $2,277,612 $2,372,624 $95,012 $0 $0 $95,012 $345,000 $0 $0 $345,000 -$440,012
17 $2,352,157 $2,405,105 $52,948 $0 $0 $52,948 $241,500 $0 $0 $241,500 -$294,448
18 $2,410,573 $2,450,927 $40,353 $0 $0 $40,353 $245,333 $0 $0 $245,333 -$285,687
19 $2,458,810 $2,487,464 $28,654 $0 $0 $28,654 $161,000 $0 $0 $161,000 -$189,654
20 $2,502,077 $2,528,128 $26,051 $0 $0 $26,051 $138,000 $0 $0 $138,000 -$164,051
21 $2,568,277 $2,567,602 -$675 $0 $0 -$675 $0 $0 $0 $0 $675
22 $2,651,479 $2,611,916 -$39,563 $0 $0 -$39,563 $0 $0 $0 $0 $39,563
23 $2,718,115 $2,651,066 -$67,049 $0 $0 -$67,049 $0 $0 $0 $0 $67,049
23 $2,808,120 $2,698,860 -$109,260 $0 $0 -$109,260 $0 $0 $0 $0 $109,260
25 $2,858,355 $2,758,185 -$100,170 $0 $0 -$100,170 $49,833 $0 $0 $49,833 $50,337
Totals $48,358,863 $51,913,530 $3,554,666 $0 $0 $3,554,666 $5,926,333 $283,872 $4,707,538 $10,917,743 -$14,472,410
(1) Differential EIA 2017 Low Oil Price Case; Nominal Pricing CNG and Diesel For Transportation Internal Rate of Return: 0.0%
(6) Net Present Value -$12,299,531
(2) No Costs associated with the differential maintenance between CNG and Diesel vehicles.
(6) Assumes Discount Rate of 2.5%
(3) Incremental cost for purchasing CNG buses versus Diesel. NO BRT Buses Included. Note: 24 BRT Buses Not Included
(4) Cost for Upgrading Maintenance Facility.
(5) Costs for constructing CNG Fueling Station and Fuel Island Upgrades.
Net Annual Cash
FlowYear
(1)Annual Fuel
Costs Diesel
(1)Annual Fuel
Costs CNG
(1)Annual Fuel
Cost Savings
(2)Annual Fleet
Maintenance
Costs
(2)Annual
Facility
Maintenance
Costs
Total Change In
Operational
Expenditures
(3)Incremental
CNG Fleet
Expenditures
(4)Garage
Renovation
Expenditure
(5)Fueling
Facility
Expenditure
Total Capital
Expenditures
Detailed Cash Flow-Exp; No BRT 103

FY In
Service
Current
Buses
CNG
Upcharge
Diesel
Gallons
Cumulative
Gallons
* Diesel
$/Gal
# NG
$/DGE
Spread /
Savings
Expansion
Buses
CNG
Upcharge
Diesel
Gallons
Cumulative
Gallons
* Diesel
$/Gal
# NG
$/DGE
Spread /
Savings
2018 1 46,000$ 10,300 10,300 2.06 2.63 (0.56) 9 414,000$ 92,700 92,700 2.06 2.63 (0.56)
2019 -$ - 10,300 2.13 2.71 (0.58) 8 368,000$ 82,400 175,100 2.13 2.71 (0.58)
2020 9 414,000$ 92,700 103,000 2.18 2.79 (0.61) 7 322,000$ 72,100 247,200 2.18 2.79 (0.61)
2021 10 460,000$ 103,000 206,000 2.23 2.83 (0.60) 6 276,000$ 61,800 309,000 2.23 2.83 (0.60)
2022 -$ - 206,000 2.30 2.86 (0.56) 21 966,000$ 216,300 525,300 2.30 2.86 (0.56)
2023 4 184,000$ 41,200 247,200 2.34 2.89 (0.54) 5 230,000$ 51,500 576,800 2.34 2.89 (0.54)
2024 1 46,000$ 10,300 257,500 2.40 2.92 (0.52) 4 184,000$ 41,200 618,000 2.40 2.92 (0.52)
2025 -$ - 257,500 2.49 2.96 (0.47) 4 184,000$ 41,200 659,200 2.49 2.96 (0.47)
2026 11 506,000$ 113,300 370,800 2.57 2.99 (0.42) -$ - 659,200 2.57 2.99 (0.42)
2027 -$ - 370,800 2.66 3.09 (0.43) -$ - 659,200 2.66 3.09 (0.43)
2028 6 276,000$ 61,800 432,600 2.74 3.12 (0.37) -$ - 659,200 2.74 3.12 (0.37)
2029 -$ - 432,600 2.81 3.15 (0.34) -$ - 659,200 2.81 3.15 (0.34)
2030 1 46,000$ - 432,600 2.92 3.18 (0.27) 9 414,000$ - 659,200 2.92 3.18 (0.27)
2031 -$ - 432,600 2.98 3.23 (0.25) 8 368,000$ - 659,200 2.98 3.23 (0.25)
2032 9 379,500$ - 432,600 3.07 3.26 (0.19) 7 295,167$ - 659,200 3.07 3.26 (0.19)
2033 10 383,333$ - 432,600 3.16 3.29 (0.13) 6 230,000$ - 659,200 3.16 3.29 (0.13)
2034 -$ - 432,600 3.26 3.34 (0.07) 21 724,500$ - 659,200 3.26 3.34 (0.07)
2035 4 122,667$ - 432,600 3.34 3.40 (0.06) 5 153,333$ - 659,200 3.34 3.40 (0.06)
2036 1 26,833$ - 432,600 3.41 3.45 (0.04) 4 107,333$ - 659,200 3.41 3.45 (0.04)
2037 -$ - 432,600 3.47 3.51 (0.04) 4 92,000$ - 659,200 3.47 3.51 (0.04)
2038 11 210,833$ - 432,600 3.56 3.56 0.00 -$ - 659,200 3.56 3.56 0.00
2039 -$ - 432,600 3.68 3.62 0.05 -$ - 659,200 3.68 3.62 0.05
2040 6 69,000$ - 432,600 3.77 3.68 0.09 -$ - 659,200 3.77 3.68 0.09
2041 -$ - 432,600 3.89 3.74 0.15 -$ - 659,200 3.89 3.74 0.15
2042 1 3,833$ - 432,600 3.96 3.83 0.14 9 34,500$ - 659,200 3.96 3.83 0.14
TOTALS 3,174,000$ 432,600 8,528,400 5,362,833$ 659,200 14,409,700
* EIA 2017 Low Oil Price Case Nominal Petroleum Prices Transportation Diesel Fuel CNG Vehicle Upcharge 46,000$ Note: 16 BRT Buses
# EIA 2017 Low Oil Price Case Natural Gas Delivered Prices Transportation Average Annual Fuel Per Vehicle 10,300
Go Raleigh Transit - Fixed Route Vehicle
50% CNG Fleet Replacement, Expansion, and Fuel Cost Projections
Fleet and Fuel Projections 104

GoRaleigh Transit
50% CNG Fleet; Current and Expanded Services Combined
Detailed Project Cash Flow - EIA 2017 Low Oil Price Case
A1 A2 A B C D = A + B + C E F G H = E + F + G I = D + H
0 $0 $0 $0 $0 $0 $0 $0 $0 $0 $0 $0
1 $212,370 $270,462 $58,091 $0 $0 $58,091 $460,000 $283,872 $4,707,538 $5,451,410 -$5,509,501
2 $394,503 $502,892 $108,389 $0 $0 $108,389 $368,000 $0 $0 $368,000 -$476,389
3 $765,083 $977,758 $212,675 $0 $0 $212,675 $736,000 $0 $0 $736,000 -$948,675
4 $1,148,927 $1,457,915 $308,988 $0 $0 $308,988 $736,000 $0 $0 $736,000 -$1,044,988
5 $1,678,502 $2,090,796 $412,295 $0 $0 $412,295 $966,000 $0 $0 $966,000 -$1,378,295
6 $1,931,292 $2,379,475 $448,183 $0 $0 $448,183 $414,000 $0 $0 $414,000 -$862,183
7 $2,100,697 $2,556,257 $455,559 $0 $0 $455,559 $230,000 $0 $0 $230,000 -$685,559
8 $2,282,378 $2,709,092 $426,714 $0 $0 $426,714 $184,000 $0 $0 $184,000 -$610,714
9 $2,647,251 $3,079,431 $432,179 $0 $0 $432,179 $506,000 $0 $0 $506,000 -$938,179
10 $2,735,665 $3,178,764 $443,099 $0 $0 $443,099 $0 $0 $0 $0 -$443,099
11 $2,995,342 $3,402,648 $407,305 $0 $0 $407,305 $276,000 $0 $0 $276,000 -$683,305
12 $3,071,227 $3,441,143 $369,916 $0 $0 $369,916 $0 $0 $0 $0 -$369,916
13 $3,183,371 $3,475,595 $292,224 $0 $0 $292,224 $460,000 $0 $0 $460,000 -$752,224
14 $3,251,097 $3,523,347 $272,251 $0 $0 $272,251 $368,000 $0 $0 $368,000 -$640,251
15 $3,354,958 $3,562,862 $207,903 $0 $0 $207,903 $674,667 $0 $0 $674,667 -$882,570
16 $3,448,956 $3,592,831 $143,875 $0 $0 $143,875 $613,333 $0 $0 $613,333 -$757,208
17 $3,561,838 $3,642,016 $80,178 $0 $0 $80,178 $724,500 $0 $0 $724,500 -$804,678
18 $3,650,297 $3,711,404 $61,107 $0 $0 $61,107 $276,000 $0 $0 $276,000 -$337,107
19 $3,723,340 $3,766,731 $43,391 $0 $0 $43,391 $134,167 $0 $0 $134,167 -$177,558
20 $3,788,859 $3,828,309 $39,449 $0 $0 $39,449 $92,000 $0 $0 $92,000 -$131,449
21 $3,889,105 $3,888,082 -$1,023 $0 $0 -$1,023 $210,833 $0 $0 $210,833 -$209,811
22 $4,015,097 $3,955,187 -$59,910 $0 $0 -$59,910 $0 $0 $0 $0 $59,910
23 $4,116,003 $4,014,471 -$101,532 $0 $0 -$101,532 $69,000 $0 $0 $69,000 $32,532
24 $4,252,296 $4,086,845 -$165,450 $0 $0 -$165,450 $0 $0 $0 $0 $165,450
25 $4,328,367 $4,176,681 -$151,686 $0 $0 -$151,686 $38,333 $0 $0 $38,333 $113,353
Totals $70,526,821 $75,270,992 $4,744,171 $0 $0 $4,744,171 $8,536,833 $283,872 $4,707,538 $13,528,243 -$18,272,414
(1) Differential EIA 2017 Low Oil Price Case; Nominal Pricing CNG and Diesel For Transportation Internal Rate of Return: 0.0%
(6) Net Present Value -$15,183,068
(2) No Costs associated with the differential maintenance between CNG and Diesel vehicles.
(6) Assumes Discount Rate of 2.5%
(3) Incremental cost for purchasing CNG buses versus Diesel.
(4) Cost for Upgrading Maintenance Facility.
(5) Costs for constructing CNG Fueling Station and Fuel Island Upgrades.
Total Capital
Expenditures
Net Annual Cash
Flow
(2)Annual
Facility
Maintenance
Costs
Total Change In
Operational
Expenditures
(3)Incremental
CNG Fleet
Expenditures
(4)Garage
Renovation
Expenditure
(5)Fueling
Facility
Expenditure
Year(1)
Annual Fuel
Costs Diesel
(1)Annual Fuel
Costs CNG
(1)Annual Fuel
Cost Savings
(2)Annual Fleet
Maintenance
Costs
Detailed Cash Flow - Combined 105

GoRaleigh Transit
Current Service; 50% CNG Fleet Replacement
Detailed Project Cash Flow - EIA 2017 Low Oil Price Case
A1 A2 A B C D = A + B + C E F G H = E + F + G I = D + H
0 $0 $0 $0 $0 $0 $0 $0 $0 $0 $0 $0
1 $21,237 $27,046 $5,809 $0 $0 $5,809 $46,000 $283,872 $4,707,538 $5,037,410 -$5,043,219
2 $21,917 $27,938 $6,022 $0 $0 $6,022 $0 $0 $0 $0 -$6,022
3 $225,025 $287,576 $62,551 $0 $0 $62,551 $414,000 $0 $0 $414,000 -$476,551
4 $459,571 $583,166 $123,595 $0 $0 $123,595 $460,000 $0 $0 $460,000 -$583,595
5 $472,817 $588,957 $116,139 $0 $0 $116,139 $0 $0 $0 $0 -$116,139
6 $579,388 $713,842 $134,455 $0 $0 $134,455 $184,000 $0 $0 $184,000 -$318,455
7 $617,852 $751,840 $133,988 $0 $0 $133,988 $46,000 $0 $0 $46,000 -$179,988
8 $641,117 $760,981 $119,863 $0 $0 $119,863 $0 $0 $0 $0 -$119,863
9 $953,011 $1,108,595 $155,585 $0 $0 $155,585 $506,000 $0 $0 $506,000 -$661,585
10 $984,839 $1,144,355 $159,516 $0 $0 $159,516 $0 $0 $0 $0 -$159,516
11 $1,186,834 $1,348,219 $161,385 $0 $0 $161,385 $276,000 $0 $0 $276,000 -$437,385
12 $1,216,901 $1,363,472 $146,570 $0 $0 $146,570 $0 $0 $0 $0 -$146,570
13 $1,261,336 $1,377,123 $115,787 $0 $0 $115,787 $46,000 $0 $0 $46,000 -$161,787
14 $1,288,170 $1,396,043 $107,873 $0 $0 $107,873 $0 $0 $0 $0 -$107,873
15 $1,329,323 $1,411,700 $82,377 $0 $0 $82,377 $379,500 $0 $0 $379,500 -$461,877
16 $1,366,567 $1,423,575 $57,007 $0 $0 $57,007 $383,333 $0 $0 $383,333 -$440,340
17 $1,411,294 $1,443,063 $31,769 $0 $0 $31,769 $0 $0 $0 $0 -$31,769
18 $1,446,344 $1,470,556 $24,212 $0 $0 $24,212 $122,667 $0 $0 $122,667 -$146,879
19 $1,475,286 $1,492,478 $17,193 $0 $0 $17,193 $26,833 $0 $0 $26,833 -$44,026
20 $1,501,246 $1,516,877 $15,631 $0 $0 $15,631 $0 $0 $0 $0 -$15,631
21 $1,540,966 $1,540,561 -$405 $0 $0 -$405 $210,833 $0 $0 $210,833 -$210,428
22 $1,590,887 $1,567,150 -$23,738 $0 $0 -$23,738 $0 $0 $0 $0 $23,738
23 $1,630,869 $1,590,640 -$40,230 $0 $0 -$40,230 $69,000 $0 $0 $69,000 -$28,770
24 $1,684,872 $1,619,316 -$65,556 $0 $0 -$65,556 $0 $0 $0 $0 $65,556
25 $1,715,013 $1,654,911 -$60,102 $0 $0 -$60,102 $3,833 $0 $0 $3,833 $56,269
Totals $26,622,683 $28,209,979 $1,587,296 $0 $0 $1,587,296 $3,174,000 $283,872 $4,707,538 $8,165,410 -$9,752,706
(1) Differential EIA 2017 Low Oil Price Case; Nominal Pricing CNG and Diesel For Transportation Internal Rate of Return: 0.0%
(6) Net Present Value -$8,432,686
(2) No Costs associated with the differential maintenance between CNG and Diesel vehicles.
(6) Assumes Discount Rate of 2.5%
(3) Incremental cost for purchasing CNG buses versus Diesel.
(4) Cost for Upgrading Maintenance Facility.
(5) Costs for constructing CNG Fueling Station and Fuel Island Upgrades.
Net Annual Cash
FlowYear
(1)Annual Fuel
Costs Diesel
(1)Annual Fuel
Costs CNG
(1)Annual Fuel
Cost Savings
(2)Annual Fleet
Maintenance
Costs
(2)Annual
Facility
Maintenance
Costs
Total Change In
Operational
Expenditures
(3)Incremental
CNG Fleet
Expenditures
(4)Garage
Renovation
Expenditure
(5)Fueling
Facility
Expenditure
Total Capital
Expenditures
Detailed Cash Flow-Current 106

GoRaleigh Transit
Local and BRT; 50% CNG Expanded Service Fleet
Detailed Project Cash Flow - EIA 2017 Low Oil Price Case
A1 A2 A B C D = A + B + C E F G H = E + F + G I = D + H
0 $0 $0 $0 $0 $0 $0 $0 $0 $0 $0 $0
1 $191,133 $243,415 $52,282 $0 $0 $52,282 $414,000 $283,872 $4,707,538 $5,405,410 -$5,457,692
2 $372,586 $474,954 $102,367 $0 $0 $102,367 $368,000 $0 $0 $368,000 -$470,367
3 $540,059 $690,182 $150,123 $0 $0 $150,123 $322,000 $0 $0 $322,000 -$472,123
4 $689,356 $874,749 $185,393 $0 $0 $185,393 $276,000 $0 $0 $276,000 -$461,393
5 $1,205,684 $1,501,840 $296,155 $0 $0 $296,155 $966,000 $0 $0 $966,000 -$1,262,155
6 $1,351,904 $1,665,632 $313,728 $0 $0 $313,728 $230,000 $0 $0 $230,000 -$543,728
7 $1,482,845 $1,804,416 $321,571 $0 $0 $321,571 $184,000 $0 $0 $184,000 -$505,571
8 $1,641,260 $1,948,111 $306,850 $0 $0 $306,850 $184,000 $0 $0 $184,000 -$490,850
9 $1,694,241 $1,970,836 $276,595 $0 $0 $276,595 $0 $0 $0 $0 -$276,595
10 $1,750,825 $2,034,409 $283,584 $0 $0 $283,584 $0 $0 $0 $0 -$283,584
11 $1,808,509 $2,054,429 $245,920 $0 $0 $245,920 $0 $0 $0 $0 -$245,920
12 $1,854,326 $2,077,671 $223,345 $0 $0 $223,345 $0 $0 $0 $0 -$223,345
13 $1,922,035 $2,098,473 $176,437 $0 $0 $176,437 $414,000 $0 $0 $414,000 -$590,437
14 $1,962,926 $2,127,304 $164,378 $0 $0 $164,378 $368,000 $0 $0 $368,000 -$532,378
15 $2,025,635 $2,151,162 $125,526 $0 $0 $125,526 $295,167 $0 $0 $295,167 -$420,693
16 $2,082,388 $2,169,256 $86,868 $0 $0 $86,868 $230,000 $0 $0 $230,000 -$316,868
17 $2,150,544 $2,198,953 $48,410 $0 $0 $48,410 $724,500 $0 $0 $724,500 -$772,910
18 $2,203,953 $2,240,847 $36,895 $0 $0 $36,895 $153,333 $0 $0 $153,333 -$190,228
19 $2,248,055 $2,274,253 $26,198 $0 $0 $26,198 $107,333 $0 $0 $107,333 -$133,532
20 $2,287,613 $2,311,432 $23,818 $0 $0 $23,818 $92,000 $0 $0 $92,000 -$115,818
21 $2,348,139 $2,347,521 -$617 $0 $0 -$617 $0 $0 $0 $0 $617
22 $2,424,209 $2,388,037 -$36,172 $0 $0 -$36,172 $0 $0 $0 $0 $36,172
23 $2,485,134 $2,423,832 -$61,302 $0 $0 -$61,302 $0 $0 $0 $0 $61,302
24 $2,567,424 $2,467,529 -$99,895 $0 $0 -$99,895 $0 $0 $0 $0 $99,895
25 $2,613,354 $2,521,769 -$91,584 $0 $0 -$91,584 $34,500 $0 $0 $34,500 $57,084
Totals $43,904,138 $47,061,013 $3,156,875 $0 $0 $3,156,875 $5,362,833 $283,872 $4,707,538 $10,354,243 -$13,511,118
(1) Differential EIA 2017 Low Oil Price Case; Nominal Pricing CNG and Diesel For Transportation Internal Rate of Return: 0.0%
(6) Net Present Value -$11,501,277
(2) No Costs associated with the differential maintenance between CNG and Diesel vehicles.
(6) Assumes Discount Rate of 2.5%
(3) Incremental cost for purchasing CNG buses versus Diesel.
(4) Cost for Upgrading Maintenance Facility.
(5) Costs for constructing CNG Fueling Station and Fuel Island Upgrades.
Net Annual Cash
FlowYear
(1)Annual Fuel
Costs Diesel
(1)Annual Fuel
Costs CNG
(1)Annual Fuel
Cost Savings
(2)Annual Fleet
Maintenance
Costs
(2)Annual
Facility
Maintenance
Costs
Total Change In
Operational
Expenditures
(3)Incremental
CNG Fleet
Expenditures
(4)Garage
Renovation
Expenditure
(5)Fueling
Facility
Expenditure
Total Capital
Expenditures
Detailed Cash Flow-Expansion 107

GoRaleigh Transit
Local Service; 50% CNG Expanded Fleet
Detailed Project Cash Flow - EIA 2017 Low Oil Price Case
A1 A2 A B C D = A + B + C E F G H = E + F + G I = D + H
0 $0 $0 $0 $0 $0 $0 $0 $0 $0 $0 $0
1 $191,133 $243,415 $52,282 $0 $0 $52,282 $414,000 $283,872 $4,707,538 $5,405,410 -$5,457,692
2 $372,586 $474,954 $102,367 $0 $0 $102,367 $368,000 $0 $0 $368,000 -$470,367
3 $540,059 $690,182 $150,123 $0 $0 $150,123 $322,000 $0 $0 $322,000 -$472,123
4 $689,356 $874,749 $185,393 $0 $0 $185,393 $276,000 $0 $0 $276,000 -$461,393
5 $827,430 $1,030,674 $203,244 $0 $0 $203,244 $230,000 $0 $0 $230,000 -$433,244
6 $965,646 $1,189,737 $224,091 $0 $0 $224,091 $230,000 $0 $0 $230,000 -$454,091
7 $1,087,420 $1,323,239 $235,819 $0 $0 $235,819 $184,000 $0 $0 $184,000 -$419,819
8 $1,230,945 $1,461,083 $230,138 $0 $0 $230,138 $184,000 $0 $0 $184,000 -$414,138
9 $1,270,681 $1,478,127 $207,446 $0 $0 $207,446 $0 $0 $0 $0 -$207,446
10 $1,313,119 $1,525,807 $212,688 $0 $0 $212,688 $0 $0 $0 $0 -$212,688
11 $1,356,381 $1,540,822 $184,440 $0 $0 $184,440 $0 $0 $0 $0 -$184,440
12 $1,390,744 $1,558,253 $167,509 $0 $0 $167,509 $0 $0 $0 $0 -$167,509
13 $1,441,527 $1,573,854 $132,328 $0 $0 $132,328 $414,000 $0 $0 $414,000 -$546,328
14 $1,472,195 $1,595,478 $123,283 $0 $0 $123,283 $368,000 $0 $0 $368,000 -$491,283
15 $1,519,226 $1,613,371 $94,145 $0 $0 $94,145 $295,167 $0 $0 $295,167 -$389,311
16 $1,561,791 $1,626,942 $65,151 $0 $0 $65,151 $230,000 $0 $0 $230,000 -$295,151
17 $1,612,908 $1,649,215 $36,307 $0 $0 $36,307 $172,500 $0 $0 $172,500 -$208,807
18 $1,652,965 $1,680,636 $27,671 $0 $0 $27,671 $153,333 $0 $0 $153,333 -$181,004
19 $1,686,041 $1,705,690 $19,649 $0 $0 $19,649 $107,333 $0 $0 $107,333 -$126,982
20 $1,715,710 $1,733,574 $17,864 $0 $0 $17,864 $92,000 $0 $0 $92,000 -$109,864
21 $1,761,104 $1,760,641 -$463 $0 $0 -$463 $0 $0 $0 $0 $463
22 $1,818,157 $1,791,028 -$27,129 $0 $0 -$27,129 $0 $0 $0 $0 $27,129
23 $1,863,850 $1,817,874 -$45,977 $0 $0 -$45,977 $0 $0 $0 $0 $45,977
23 $1,925,568 $1,850,647 -$74,921 $0 $0 -$74,921 $0 $0 $0 $0 $74,921
25 $1,960,015 $1,891,327 -$68,688 $0 $0 -$68,688 $34,500 $0 $0 $34,500 $34,188
Totals $33,226,558 $35,681,319 $2,454,761 $0 $0 $2,454,761 $4,074,833 $283,872 $4,707,538 $9,066,243 -$11,521,004
(1) Differential EIA 2017 Low Oil Price Case; Nominal Pricing CNG and Diesel For Transportation Internal Rate of Return: 0.0%
(6) Net Present Value -$9,954,232
(2) No Costs associated with the differential maintenance between CNG and Diesel vehicles.
(6) Assumes Discount Rate of 2.5%
(3) Incremental cost for purchasing CNG buses versus Diesel. NO BRT Buses Included. Note: 16 BRT Buses Not Included
(4) Cost for Upgrading Maintenance Facility.
(5) Costs for constructing CNG Fueling Station and Fuel Island Upgrades.
Net Annual Cash
FlowYear
(1)Annual Fuel
Costs Diesel
(1)Annual Fuel
Costs CNG
(1)Annual Fuel
Cost Savings
(2)Annual Fleet
Maintenance
Costs
(2)Annual
Facility
Maintenance
Costs
Total Change In
Operational
Expenditures
(3)Incremental
CNG Fleet
Expenditures
(4)Garage
Renovation
Expenditure
(5)Fueling
Facility
Expenditure
Total Capital
Expenditures
Detailed Cash Flow-Exp; No BRT 108

FINAL REPORT SUPPLEMENT February 14, 2017
Compressed Natural Gas
Supplement to Feasibility Study
Capital Area Transit
4104 Poole Rd, Raleigh, NC 27610
109

GoRaleigh Transit - CNG Feasibility Study – Supplement
TITLE SECTION
Executive Summary 1
Updated Financial Data 2
Transit Bus Technology Review 3
Appendix 4
Fleet Replacement and Financial Analysis Scenarios
110

Section 1
Executive Summary
111

Section 1
WENDEL | GoRaleigh Transit CNG Feasibility Study – 2017 Supplement
Raleigh, North Carolina Section 1 - 1
Wendel was originally hired to provide a compressed natural gas (CNG) feasibility study for
GoRaleigh Transit. That study was completed on March 15, 2016 with a formal
presentation to the Raleigh Transit Authority Board on August 11, 2016.
The purpose of this update is to provide two supplemental pieces of information to the
original report. Sections 1 and 2 provide updates and recalculated financial projections
based on the latest 2017 United States Energy Information Administration (EIA) Annual
Energy Outlook data released January 5, 2017. The original report analyzed a 20 year
horizon beginning in 2018 with a 100% fleet implementation. This supplement report
expands the scenarios from 20 to 25 year horizons, recalculates findings using EIA
Reference, High Oil High Price, and Low Oil Price cases with financial scenarios based on
100%, 75%, and 50% CNG fleet implementations. Table S1 illustrates the original 100%
fleet replacement and expansion schedules and the additional 75% and 50% fleet
projections used in the updated financial scenarios.
Table S1. – 100%, 75%, & 50% Fleet Replacement and Expansion Projections
Fiscal Year Regular Fleet
100% 75% 50%
Expansion Fleet
100% 75% 50%
Bus Rapid Transit
100% 75% 50%
2018 1 1 1 17 13 9
2019 15 11 8
2020 18 14 9 13 10 7
2021 19 14 10 12 9 6
2022 9 7 5 32 24 16
2023 7 5 4 10 8 5
2024 2 2 1 8 6 4
2025 8 6 4
2026 21 16 11
2027
2028 11 8 6
Section 3 provides narrative comparisons for the current state of technology for operating
clean diesel, hybrid electric, compressed natural gas, battery electric, and fuel cell electric
transit buses.
112

Section 1
WENDEL | GoRaleigh Transit CNG Feasibility Study – 2017 Supplement
Raleigh, North Carolina Section 1 - 2
The original report financials used a 2018 baseline of $2.50 per diesel gallon and a 2%
annual inflation rate resulting in a projected diesel price of $3.64 in 2037. The natural gas
diesel gallon equivalent (DGE) baseline was $1.40 and .75% overall annual inflation rate
resulting in a projected CNG DGE price of $1.59 in 2037.
The updated financial scenarios use the 2017 EIA Diesel and CNG/DGE price ranges listed
in Table S2.
Table S2. - 2017 EIA Diesel and CNG/DGE Fuel Projections
Category Reference Case High Oil Price Low Oil Price
2018 – Diesel $3.02 $4.55 $2.06
2042 – Diesel $6.95 $11.78 $3.96
2018 – CNG/DGE $2.57 $2.60 $2.63
2042 – CNG/DGE $4.34 $4.24 $3.83
The updated supplement financials use EIA projected pricing based on diesel fuel for on-
road use which include Federal and State taxes while excluding county and local taxes.
The diesel pricing chart data below can be referenced at http://tinyurl.com/jsdc6af.
113

Section 1
WENDEL | GoRaleigh Transit CNG Feasibility Study – 2017 Supplement
Raleigh, North Carolina Section 1 - 3
The natural gas prices for transportation delivered is based on fuel used in motor vehicles,
trains, and ships and includes the estimated motor vehicle fuel taxes and estimated
dispensing costs or charges. The natural gas pricing chart data below can be referenced at
http://tinyurl.com/j9qvrh6.
In the original report natural gas pricing was based on GoRaleigh owning a private CNG
station. Natural gas pricing was based on purchasing at industrial rates plus adding station
component costs for maintenance reserve, drying, compression and capital recovery.
Although the EIA data includes taxes, marketing, etc. taxes would not be charged to
GoRaleigh on fuels, and costs for marketing and profit margins would reflect reduced costs
with direct purchasing. However, the updated financial scenarios still do provide a
consistent analysis based on published data where both fuel sources are priced on market
based economics. It should also be noted that as illustrated in Table S1. 2017 EIA Diesel
and CNG/DGE Fuel Projections, long term natural gas prices continue to be very stable in
comparison to diesel which continues to have wide pricing variations in the differing case
scenarios in the EIA update.
The original report financial data was based on 100% CNG fleet implementation. The fuel
cost savings figures did not take into consideration the approximate $5,000,000 estimated
114

Section 1
WENDEL | GoRaleigh Transit CNG Feasibility Study – 2017 Supplement
Raleigh, North Carolina Section 1 - 4
one time cost of the new CNG station and required maintenance and fueling facility
upgrades.
The 20 year fuel cost savings were projected in the original report were as follows:
o $19,789,905 replacing 79 buses from the current fleet from 2018-2028
o $25,957,854 implementing 92 local service expansion buses from 2018-2025
o $8,622,336 implementing 32 BRT expansion buses starting in 2022
The tables in Section 2 – Updated Financial Data illustrate the 25 year savings based on the
differing EIA cases and corresponding levels of CNG fleet implementation. Both the EIA
Reference Case and High Oil Price Cases provide substantial positive fuel cost savings
including after for 100%, 75%, or 50% CNG fleet implementation even after deducting for
the additional cost of CNG buses. The EIA Low Oil Price Case scenario does not generate
any cost savings.
The added vehicle upcharge for replacing 75% of the current fleet with CNG over 25 years is
$4.5M. The 25 year fuel cost savings after CNG upcharges generates the following savings
for each scenario:
o EIA Reference Case; $18.551,818
o EIA High Oil Price Case; $65,359,062
o EIA Low Oil Price Case; ($6,820,903)*
* 2017 EIA Low Oil Price Case results in additional costs and no fuel savings. In Table S2
EIA Low Price Case, diesel ranges from $2.06 – $3.96 per gallon and CNG ranges from
$2.63 – $3.83 per DGE. The breakeven point, where added fuel cost savings equal added
vehicle expenditures, is a net positive change of $0.56 in fuel costs between diesel and CNG
each year.
115

Section 2
Updated Financial Data
116

Section 2 – Updated Financial Data
WENDEL | GoRaleigh Transit CNG Feasibility Study – 2017 Supplement
Raleigh, North Carolina Section 2 - 1
Table S3a. - 2017 EIA Reference Case
Category Fuel Savings Increased Bus Costs 25 Year
Net Savings
100% CNG Program $81,053,106 ($16,337,667) $64,715,439
Regular Fleet Replacements $30,371,933 ($5,968,500) $24,403,433
Local Service Fleet Expansion $37,764,140 ($7,793,167) $29,970,973
BRT Service Fleet Expansion $12,917,033 ($2,576,000) $10,341,033
75% CNG Fleet $61,508,920 ($12,400,833) $49,108,087
Regular Fleet Replacements $23,094,318 ($4,542,500) $18,551,818
Local Service Fleet Expansion $28,726,827 ($5,926,333) $22,800,494
BRT Service Fleet Expansion $9,687,775 ($1,932,000) $7,755,775
50% CNG Program $42,327,709 ($8,536,833) $33,790,876
Regular Fleet Replacements $16,144,120 ($3,174,000) $12,970,120
Local Service Fleet Expansion $19,725,072 ($4,074,833) $15,650,239
BRT Service Fleet Expansion $6,458,516 ($1,288,000) $5,170,516
117
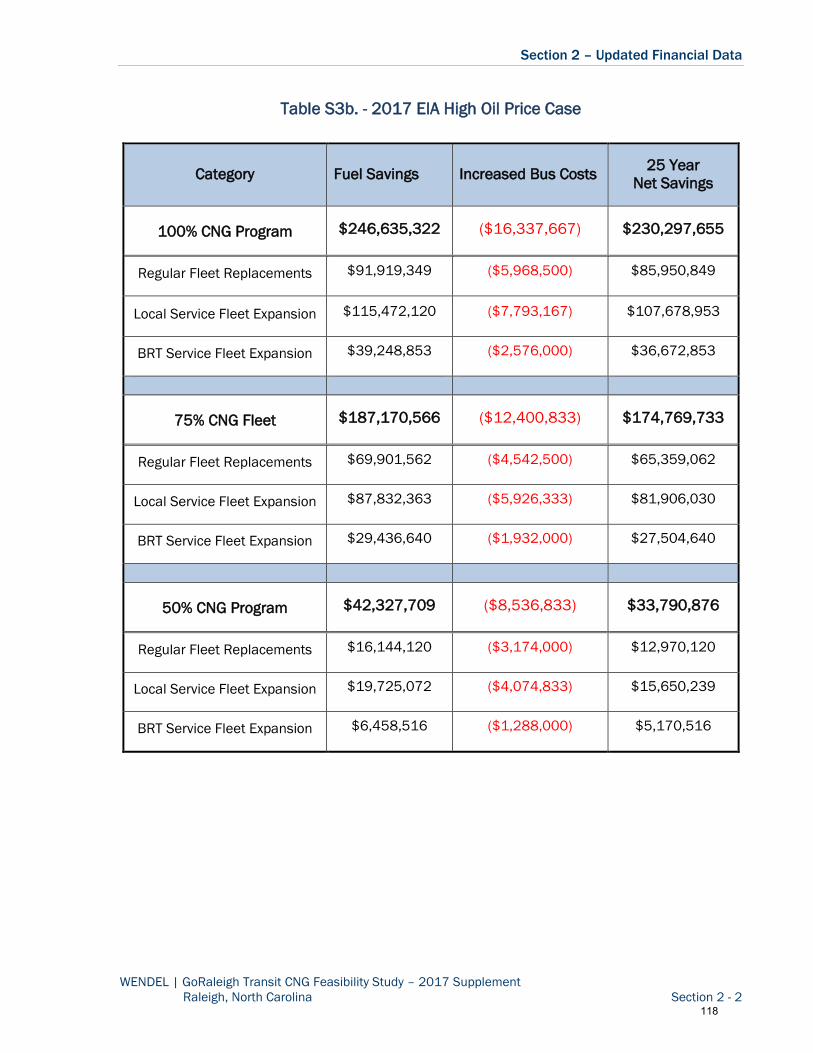
Section 2 – Updated Financial Data
WENDEL | GoRaleigh Transit CNG Feasibility Study – 2017 Supplement
Raleigh, North Carolina Section 2 - 2
Table S3b. - 2017 EIA High Oil Price Case
Category Fuel Savings Increased Bus Costs 25 Year
Net Savings
100% CNG Program $246,635,322 ($16,337,667) $230,297,655
Regular Fleet Replacements $91,919,349 ($5,968,500) $85,950,849
Local Service Fleet Expansion $115,472,120 ($7,793,167) $107,678,953
BRT Service Fleet Expansion $39,248,853 ($2,576,000) $36,672,853
75% CNG Fleet $187,170,566 ($12,400,833) $174,769,733
Regular Fleet Replacements $69,901,562 ($4,542,500) $65,359,062
Local Service Fleet Expansion $87,832,363 ($5,926,333) $81,906,030
BRT Service Fleet Expansion $29,436,640 ($1,932,000) $27,504,640
50% CNG Program $42,327,709 ($8,536,833) $33,790,876
Regular Fleet Replacements $16,144,120 ($3,174,000) $12,970,120
Local Service Fleet Expansion $19,725,072 ($4,074,833) $15,650,239
BRT Service Fleet Expansion $6,458,516 ($1,288,000) $5,170,516
118

Section 2 – Updated Financial Data
WENDEL | GoRaleigh Transit CNG Feasibility Study – 2017 Supplement
Raleigh, North Carolina Section 2 - 3
Table S3c. - 2017 EIA Low Oil Price Case*
Category Fuel Savings Increased Bus Costs 25 Year
Net Savings
100% CNG Program ($9,065,487) ($16,337,667) ($25,403,154)
Regular Fleet Replacements ($2,982,423) ($5,968,500) ($8,950,923)
Local Service Fleet Expansion ($4,678,836) ($7,793,167) ($12,472,003)
BRT Service Fleet Expansion ($1,404,228) ($2,576,000) ($3,980,228)
75% CNG Fleet ($6,886,240) ($12,400,833) ($19,287,073)
Regular Fleet Replacements ($2,278,403) ($4,542,500) ($6,820,903)
Local Service Fleet Expansion ($3,554,666) ($5,926,333) ($9,480,999)
BRT Service Fleet Expansion ($1,053,171) ($1,932,000) ($2,985,171)
50% CNG Program ($4,744,171) ($8,536,833) ($13,281,004)
Regular Fleet Replacements ($1,587,296) ($3,174,000) ($4,761,296)
Local Service Fleet Expansion ($2,454,761) ($4,074,833) ($6,529,594)
BRT Service Fleet Expansion ($702,114) ($1,288,000) ($1,990,114)
* 2017 EIA Low Oil Price Case Results in Additional Costs and NO fuel savings in all scenarios.
119

Section 3
Transit Bus Technology Review
120

Section 3
WENDEL | GoRaleigh Transit CNG Feasibility Study – 2017 Supplement
Raleigh, North Carolina Section 3 - 1
With the increasing awareness of greenhouse gas (GHG) emissions and transportation with
alternative fuels, the variety of transit vehicles propulsion choices continue to attract
attention. The capital and operating costs of using differing vehicles for public transit can be
challenging to evaluate as buses vary significantly in terms of costs, performance and
maintenance requirements. Certain routes and segments of transit systems may or may not
be ideal when considering the differing bus operating conditions and environments. The
comprehensive assessment framework and data gathering process needed to objectively
evaluate differing bus implementations is not provided in this technology review.
The intention of this information is to provide a high level comparison of the differing pricing
and technologies based on available data for differing bus types listed. Ultimately fleet
procurement decisions won’t dictate purchasing one type versus another but will consider a
wide range of factors including service and maintenance requirements other direct and
indirect impacts on the environment. Challenges with up front capital funding are also
impacted by the differing vehicle costs of fuel cell electric, battery electric, CNG, hybrid
electric, and clean diesel transit buses.
The following is a summary of current technology offerings for 40 foot transit coaches and
reflections on keys points of the differing technologies. In some cases limited data is
available, particularly with battery electric and fuel cell electric buses.
Clean Diesel Bus
Emission standards of 2007, 2010, and 2014 greenhouse gas (GHG) and fuel efficiency
standards have led to several technological changes in diesel engine clean air requirements
significantly raising capital costs for new buses. This also translates to additional ongoing
costs in maintenance requirements. Current technology highlights:
Diesel Particulate Filters (DPF) – Physically filter engine exhaust of particulate matter.
Exhaust Gas Recirculation (EGR) – Recirculates engine’s exhaust gas into engine’s
intake system reducing NOx emissions.
Selective Catalytic Reduction (SCR) – Uses mixture of urea and water (also known as
Diesel Exhaust Fluid (DEF)) to remove NOx from emissions.
121

Section 3
WENDEL | GoRaleigh Transit CNG Feasibility Study – 2017 Supplement
Raleigh, North Carolina Section 3 - 2
Clean Diesel Bus Summary
Mature technology, reliable performance, and good range and fuel efficiency. Fueling
and fuel distribution systems in place and reliable. Current engines meet EPA emissions
standards; however, future emissions standards will continue to add cost and
complexity. Long term diesel fuel prices are projected to remain unstable with the
majority of oil from non-domestic sources.
Hybrid Electric Bus (HEB)
Hybrid technology by definition relies on two or more sources of drive power and is
combined with a rechargeable energy storage system. In a hybrid electric bus (HEB) the two
sources of power are typically electricity and a diesel internal combustion engine.
Hybrids also leverage technologies such as regenerative braking, which captures and stores
energy generated during the braking process. Hybrid buses typically are configured in
parallel (the most common) or series drivetrains. Current technology highlights:
Parallel Hybrid Systems - Parallel systems have both the electrical motor and the
internal combustion engine connected to the transmission and each can transfer
mechanical power to the wheels to move the vehicle forward. A parallel hybrid system
is designed to power the bus using the electric motor at low speeds (e.g., stop and go
traffic) and using the internal combustion engine when a higher level of performance
is required.
122

Section 3
WENDEL | GoRaleigh Transit CNG Feasibility Study – 2017 Supplement
Raleigh, North Carolina Section 3 - 3
Series Hybrid Systems - Series hybrid system buses are propelled exclusively by an
electric motor(s). The internal combustion engine drives a generator which either
charges the batteries or drives the electric motor. Since the internal combustion
engine is not connected to the wheels, it can operate at a consistent and optimum
(efficient) rate.
Hybrid Electric Bus (HEB) Summary
Mature technology with performance and actual fuel economy highly dependent on route
characteristics and operating environments. The more frequent stop and go low speed
operating environment the better the results. Fuel economy for hybrid-electric buses
varies from state to state and among transit operations; however, data points to the fuel
economy of hybrid-electric generally ranging from 10-30 percent or more fuel efficient
than conventional clean diesel transit buses. Although hybrid technology is very mature
and offers lower tailpipe emissions than standard clean diesel; vehicle capital costs are
significantly higher and fuel cost savings do not generally recoup the added cost over the
12 year life of the bus. Hybrid electric buses also have higher maintenance costs with
the additional complexity of controls, electric motor/transmission configurations, and
battery packs included in hybrids.
123
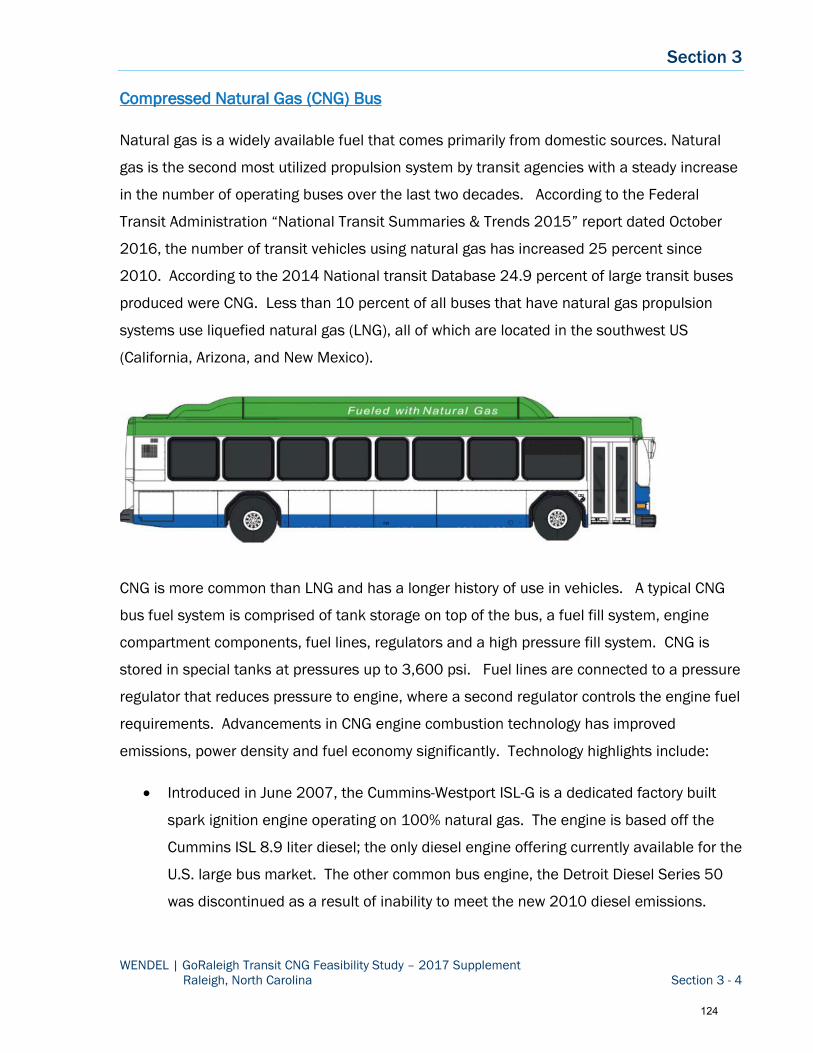
Section 3
WENDEL | GoRaleigh Transit CNG Feasibility Study – 2017 Supplement
Raleigh, North Carolina Section 3 - 4
Compressed Natural Gas (CNG) Bus
Natural gas is a widely available fuel that comes primarily from domestic sources. Natural
gas is the second most utilized propulsion system by transit agencies with a steady increase
in the number of operating buses over the last two decades. According to the Federal
Transit Administration “National Transit Summaries & Trends 2015” report dated October
2016, the number of transit vehicles using natural gas has increased 25 percent since
2010. According to the 2014 National transit Database 24.9 percent of large transit buses
produced were CNG. Less than 10 percent of all buses that have natural gas propulsion
systems use liquefied natural gas (LNG), all of which are located in the southwest US
(California, Arizona, and New Mexico).
CNG is more common than LNG and has a longer history of use in vehicles. A typical CNG
bus fuel system is comprised of tank storage on top of the bus, a fuel fill system, engine
compartment components, fuel lines, regulators and a high pressure fill system. CNG is
stored in special tanks at pressures up to 3,600 psi. Fuel lines are connected to a pressure
regulator that reduces pressure to engine, where a second regulator controls the engine fuel
requirements. Advancements in CNG engine combustion technology has improved
emissions, power density and fuel economy significantly. Technology highlights include:
Introduced in June 2007, the Cummins-Westport ISL-G is a dedicated factory built
spark ignition engine operating on 100% natural gas. The engine is based off the
Cummins ISL 8.9 liter diesel; the only diesel engine offering currently available for the
U.S. large bus market. The other common bus engine, the Detroit Diesel Series 50
was discontinued as a result of inability to meet the new 2010 diesel emissions.
124

Section 3
WENDEL | GoRaleigh Transit CNG Feasibility Study – 2017 Supplement
Raleigh, North Carolina Section 3 - 5
ISL-G meets current U.S. Environmental Protection Agency (EPA) and California Air
Resources Board (ARB) emissions standards, as well as EPA greenhouse gas (GHG)
and U.S. Department of Transportation (DOT) fuel-consumption regulations.
ISL-G uses Stoichiometric cooled Exhaust Gas Recirculation (SEGR) combustion,
leveraging Cummins proven EGR technology to create a high performance natural
gas engine.
ISL-G combustion technology uses a Three-Way Catalyst (TWC) after-treatment.
TWC’s are effective, simple, passive devices, packaged as part of the muffler. They
provide consistent emissions control performance, and are maintenance-free.
ISL G does not require active after-treatment such as a Diesel Particulate Filter (DPF)
or Selective Catalytic Reduction (SCR).
The newest Cummins-Westport ISL-G Near Zero (NZ) NOx natural gas engine went
into full production in late 2016 and is the first mid-range engine in North America to
receive emission certifications from both the U.S. Environmental Protection Agency
(EPA) and Air Resources Board (ARB) in California for meeting the 0.02 grams per
brake horsepower-hour (g/bhp-hr) optional Near Zero NOx Emissions standards for
medium-duty truck, urban bus, school bus, and refuse applications.
ISL-G NZ exhaust emissions are 90% lower than the current EPA NOx limit of 0.2
g/bhp-hr. California ARB has defined this certified Near Zero emissions level of 0.02
g/bhp-hr NOx as equivalent to a 100% battery truck using electricity from a modern
combined cycle natural gas power plant.
The ISL G NZ meets the 2017 EPA greenhouse gas emission requirements with a 9%
GHG reduction from the current ISL G.
Compressed Natural Gas (CNG) Bus Summary
Mature technology with reliable performance comparable to diesel. CNG buses are
typically heavier than diesel buses and fuel economy of the ISL-G spark ignition engine
will be 10-15% lower than a high compression ISL diesel engine. Vehicle maintenance
requirements are different but not generally more costly. Long term natural gas prices
are projected to remain stable for years with the majority of gas from domestic sources.
High pressure gas public fueling systems are not generally in place and require
125

Section 3
WENDEL | GoRaleigh Transit CNG Feasibility Study – 2017 Supplement
Raleigh, North Carolina Section 3 - 6
significant long term agency capital investments and higher on-going operating
expenses. Added CNG vehicle and station operating costs can be offset by the lower
cost of natural gas fuel.
Battery Electric Bus (BEB)
This list is not exhaustive and in no particular order but the primary electric bus
manufacturers in the United States are Proterra, BYD America (subsidiary of BYD of China)
Ebus, Gillig LLC, New Flyer, Nova and Complete Coach Works (CCW) retrofitter of standard
diesel buses to battery electric propulsion.
Battery Electric Bus
Depicted with On Route
Fast Charging Stand
Propulsion and regenerative braking systems are reliable and in many cases an extension of
existing mature hybrid technologies. A variety of heating and air-conditioning and other
accessories for bus operations are readily available. Electric bus manufacturers generally
claim lower maintenance costs, however limited data is available for a 12 year lifecycle
maintenance cost and miles between road call comparisons to traditional internal
combustion engine operations.
An important cost component consideration of electric bus operations is electric grid peak
demand charges. Peak demand or time of use charges are levied in some manner by nearly
all electric utilities in order to recover their capital costs and are calculated based on the
maximum amount of electrical power (in kW) the electric transit bus draws from the grid
during a charging event. Demand charges can have a significant impact on a customer
electricity bill and should be given careful consideration when comparing operating costs.
126

Section 3
WENDEL | GoRaleigh Transit CNG Feasibility Study – 2017 Supplement
Raleigh, North Carolina Section 3 - 7
The U.S. Department of Transportation, Federal Transit Administration “Peak Demand
Charges and Electric Transit Buses” white paper published 10-1-2014 notes that battery
electric buses show a clear advantage when no demand charges are included. When
demand charges are included, fuel costs can range from $0.06 to $0.24 per mile for
overnight charging and from $0.23 to $0.90 for on-route charging. Demand charges have
an even greater impact with small deployments when they cannot be spread over a number
of vehicles.
A variety of battery configurations and battery types with varying chemistries and energy
densities are represented. Key battery characteristics are the range (distance) traveled on a
full charge, time required to recharge, and total lifetime charging cycles. Route operating
requirements also impact feasibility and battery configurations. Battery technology is
continually evolving and changing while manufacturing processes continue to improve
reliability and reduce costs.
The two primary ways of recharging electric buses are on-route opportunity charging, where
the batteries are recharged while the vehicle is at a stop or layover or by overnight charging
where the batteries are recharged when the vehicle is not in operation. Some of the
advantages and disadvantages of each technology implementation include:
Advantages of on-route charging
o Smaller battery size reduces vehicle weight and increases efficiency
o Multiple short versus one long interruption for charging
o Less or smaller battery pack cheaper and easier service and replace
Disadvantages of on-route charging
o Dedicated routes with less vehicle flexibility
o Increased cost of demand charges and more complex charging stations
o More complex connection to electrical grid
o Buses cannot operate when power grid is down
Advantages of off-route charging
o Vehicle flexibility for route assignments
o Decreased cost of demand charges and route charging stations
127

Section 3
WENDEL | GoRaleigh Transit CNG Feasibility Study – 2017 Supplement
Raleigh, North Carolina Section 3 - 8
o Less complex connection to electrical grid and less potential grid upgrades
o No route interruptions for charging
Disadvantages of on-route charging
o Larger battery size increases vehicle weight and decreases efficiency
o Impacts to grid charging multiple buses at the same time/location
o Accessibility for vehicle maintenance during charging
o Increased charging times
Battery Electric Bus Summary
Electric bus technology is continuing to improve and mature. Vehicle operating range
and reliability continue to improve with advancements in battery and control technology.
One major challenge is addressing demand charges and time of use charges that affect
electricity cost. Significantly higher capital costs, operating requirement limitations, and
charging infrastructure are also important considerations in determining the feasibility of
implementing electric buses in the public transit fleet.
The National Renewable Energy Laboratory (NREL) introduced a guideline for assessing
the technology readiness level (TRL) for fuel cell electric buses (FCEBs). This guideline
was developed using a Technology Readiness Assessment Guide3 published by DOE in
September 2011. Although the guideline was developed for FCEBs, the same basic
concept applies to any advanced technology buses including BEBs. The following
graphic is a representation of the development process developed for FCEBs.
Technology advancements typically experience challenges and issues that need to be
resolved before full deployment. At this point in the development, it would be
128

Section 3
WENDEL | GoRaleigh Transit CNG Feasibility Study – 2017 Supplement
Raleigh, North Carolina Section 3 - 9
reasonable to state that BEBs are not fully commercial products and can be considered
to be in the technology demonstration/commissioning phase.
The capital costs for BEBs are currently higher than that of conventional technology,
although BEB costs have dropped over the last few years as orders for the buses have
increased. The increase in orders allows the manufacturers to take advantage of
economies of scale to reduce the production costs. Considerable attention is focused on
the benefits of reduced maintenance costs, however, more accurate comparisons with
internal combustion engines and hybrid systems will only become available over time as
long term life cycle cost data for batteries, electric drive propulsion, advanced control
systems, and accessories are tracked and reported. Another challenge is training
operators and maintenance staff in the differences between BEBs and conventional
buses. Operating costs for BEBs are currently low because the buses are all under
warranty and the original equipment manufacturers are handling much of the repair
costs. Once these buses pass the warranty period and transit staff takes over the repair
work, operating costs can be expected to increase.
Fuel Cell Electric Bus (FCEB)
For a number of years the Federal Transit Administration (FTA) has funded programs that
develop zero emission buses for demonstrations in transit agencies. The National Fuel Cell
Bus Program (NFCBP) is a multiyear, cost-share research program established in 2006 for
developing and demonstrating commercially viable fuel cell technology for transit buses.
Beyond the NFCBP, the FTA has also funded fuel cell bus research at several universities
and transit agencies around the country. The state of California funds technology
development and demonstration programs that include FCEB projects. Both the California
Energy Commission (CEC) and the California Air Resources Board (CARB) have funded
demonstrations of FCEBs. More information on FCEBs can be obtained through the NREL in
a recent report “Fuel Cell Buses in U.S. Transit Fleets: Current Status 2016” published in
November 2016.
129

Section 3
WENDEL | GoRaleigh Transit CNG Feasibility Study – 2017 Supplement
Raleigh, North Carolina Section 3 - 10
In an FCEB the bus operates identically to a battery electric bus with the batteries recharged
by a fuel cell. FCEBs continue to show higher fuel
economy compared to diesel buses in similar service.
As FCEB performance continues to improve; however,
there are still challenges to overcome to make the
technology commercially viable including parts supply,
bus range, staff training and maintenance
requirements, bus capital costs, and hydrogen fueling
infrastructure.
Fuel Cell Electric Bus (FCEB) Summary
FCEB technology continues to show progress toward meeting technical targets for
increasing reliability and durability while also reducing costs. At this point in the
development of FCEB technology, costs are still high. The Department of Energy (DOE)
and FTA previously set a 2016 target for a capital cost of $1 million per bus with an
ultimate target of $600,000 per bus. In 2010 a FCEB cost as much as $2.5 million.
More recent orders for FCEBs have had an average cost of $1.8 million per bus. Capital
costs should continue to decrease with larger orders of buses. Although the industry
projects an order for 40 buses could result in costs closer to $1 million each, there are
still significant challenges to overcome to make the technology commercially viable.
130

Section 3
WENDEL | GoRaleigh Transit CNG Feasibility Study – 2017 Supplement
Raleigh, North Carolina Section 3 - 11
The following table is a final comparative summary of estimated vehicle capital cost and
miles per diesel gallon equivalent performance data using a clean diesel transit bus as a
baseline. Fueling or charging infrastructure and differences in maintenance and other
operating costs unrelated to fuel source are not evaluated.
Table S4. – Transit Bus Comparisons
Category Fuel Cell
Electric
Battery
Electric CNG Hybrid Electric Clean Diesel
Typical Price Per Unit $1.8-$2.5M $850,000 $510,000 $684,000 $464,000
Incremental Cost
over Diesel $1.3 - 2.0M $386,000 $46,000 $220,000 n/a
Annual Incremental
Vehicle Cost $10K - $16K $32,167 $3,833 $18,333 $0
MPG – Diesel
Gallon Equivalent 4.91 - 7.09 *17.48 4.50 5.25 4.50
* January 2016 NREL report: “Foothill Transit Battery Electric Bus Demonstration Results” for 12 Proterra
BEBs in operation for 401,244 miles from April 2014 to July 2015. Average fuel economy of 2.15
kWh/mile. Does not include any costs for potential demand or time of use charges from electric utility.
131

Section 4
Appendix
132

ARCHITECTURE
ENGINEERING
PLANNING
ENERGY EFFICIENCY
CONSTRUCTION MANAGEMENT
111 Washington Avenue North
Suite 300, Minneapolis, MN 55401
P: 612.332.1401 w: wendelcompanies.com
Minnesota
New York
Virginia
Arizona
West Virginia
Washington, DC
133