compression creep and dynamic viscoelastic studies of
TRANSCRIPT

Compression creep and dynamic viscoelastic studies of binarysodium and lithium silicate glasses around deformationtemperature
Naoyuki KITAMURA³
National Institute of Advanced Industrial Science and Technology, 1–8–31 Midorigaoka, Ikeda, Osaka 563–8577, Japan
Uniaxial-compression creep test and dynamic viscoelastic measurement were performed on binary sodium- and lithium-silicateglasses at around their deformation temperature. The derived creep function was converted into a relaxation modulus using theLaplace transformation and its inversion. Shear relaxation modulus G(t) was expressed by a 1-term Maxwell model for both glasssystems. In the sodium system, the viscous term in the model decreased with increasing modifying oxide. In contrast, the lithiumsystem showed a higher value in the elastic term and a lower value in the viscous term than the sodium system. The storage elasticmodulus E¤(½) observed in the dynamic measurement started to decrease at the glass transition temperatures, and complicatedfluctuation of the modulus was observed at around the deformation temperatures for frequencies larger than a few Hz. Thedecrease in the modulus at the transition temperature has been suggested to originate from slipping between silicate clusterswhich were separated by non-bridging oxygen with the modifying cations similar to polymer materials. The master curve of theloss elastic modulus E¤¤(½) showed unique frequency dependence in all sodium-silicate glasses, while the data at high frequenciesat around the deformation temperature deviated from the curve. This suggested that slipping between silicate clusters is the mainprocess of structural relaxation, and anomalies in the dynamic modulus at around the deformation temperature could be relatedto other relaxation. The E¤(½) of the lithium-silicate glass showed similar temperature dependence and the master curve of E¤¤(½)had a narrower frequency distribution. The contribution to E¤¤(½) below 10¹2Hz was smaller than in the sodium system. Thislack of slow relaxation was well consistent with the comparably lower viscous term of G(t) in the Maxwell model. Injection testinginto a narrow pore showed a faster saturation of the injected volume for the lithium-silicate glass.©2017 The Ceramic Society of Japan. All rights reserved.
Key-words : Viscoelastic property, Uniaxial compression creep test, Dynamic viscoelastic measurement, Sodium silicate glass,Lithium silicate glass
[Received March 7, 2017; Accepted June 22, 2017]
1. Introduction
Mold pressing of glasses has been used in the past half centuryas the fabrication process of optical components, such as precisionlenses for digital still cameras and pick-up devices, micro-lenses,gratings, and prisms. Recently, this technique has been expandingto form sub-wavelength periodic structures on the surface of glasscomponents for a generation of new functions such as diffraction,antireflection, and retardation.1)4) In many cases, injection withhigh aspect ratio and precise transfer of mold shape are importantproblems that remain unsolved. For example, Kitamura et al.4)
reported thermal nano-imprinting of a two-dimensional periodicstructure with 300 nm pitch on high-refractive index phosphateglasses. The imprinted round shape was quite different from theoriginal cone shape of the mold. They5) also reported differencesin the transferability of a one-dimensional periodic structure ontwo kinds of phosphate glasses when pressed under pressure-timeconditions at the same viscosity. Moreover, in the general mold-ing process of optical lenses, sink marks of elements also havesimilar problems. The difficulty of molding relates strongly to themechanical and thermal properties of glass materials. In particular,the viscoelastic nature of the glass is most important for achievinga precise transfer of the shape of the mold and injection with highaspect ratio in thermal molding processes.
Viscoelastic properties such as internal friction,6),7) delayedelasticity up to glass transition temperature,8) and stress relaxa-tion9) have been extensively studied in silicate systems from halfa century ago. For example, Forry6) and Rötger7) reported thattwo structural relaxations due to diffusion alkali ions and mov-ing non-bridging oxygen were found at around ¹5050°C and150300°C for binary alkali silicate glasses from internal frictionmeasurement. Argon8) reported that the delayed elasticity of asoda-lime-silica glass is explained by a molecular arrangementmechanism with a distribution of activation energies. Crichtonet al.9) attempted to explain the stress relaxation of soda limeglass at high temperature by multiple Maxwell type modelshaving some relaxation time. Although the viscoelastic nature ataround the deformation temperature is very important for thermalmolding processes, as mentioned above, much less work hasbeen reported on this property.In the present study, the viscoelastic measurements of basic
binary sodium and lithium silicate glasses were performed byuniaxial compression creep tests and dynamic viscoelastic mea-surement. The effect of modifying the oxide and difference in thekind of modifying cation on the viscoelastic nature are discussedbased on an injection test into a narrow pore.
2. Experimental procedure
Na2OxSiO2 (x = 2, 3, and 4 in molar ratio) and Li2O2SiO2
glasses were prepared by a conventional melt-quench method.Na2CO3 (99%, Wako Chemicals), Li2CO3 (99%, KojundoChemicals, 99%), and SiO2 (99.99%, Nitchitsu) were used as
³ Corresponding author: N. Kitamura; E-mail: [email protected]
‡ Preface for this article: DOI http://doi.org/10.2109/jcersj2.125.P10-1
Journal of the Ceramic Society of Japan 125 [10] 721-727 2017 Full paper
©2017 The Ceramic Society of Japan
DOI http://doi.org/10.2109/jcersj2.17045
721
starting materials. A 200 g melt was poured onto a graphite plateand annealed at the glass transition temperature for several hoursand cooled to room temperature for 10 h. The annealed glasssample was cut into cylinders of diameter 8mm and height 8mmfor the creep test, a square pillar of dimensions 4 © 4 © 15mmfor thermal mechanical analysis, and also into plates of dimen-sions 10 © 50 © 1.5mm for dynamic viscoelastic measurement(see below). Surfaces of samples were finished using abrasivepowder with a grading of #1500. Cylinder samples of diameter8mm and height 5mm were also prepared for an injection testinto a narrow pore on the mold. Both sides of the cylinder werepolished to optical grade for the injection test.The glass transition temperature Tg and deformation temper-
ature At were determined by thermal mechanical analysis (TMA/SS-6300, Seiko Instruments) under conditions of a load of 100mN and a heating rate of 5 °C/min. The density μ of the samplewas measured by Archimedes method with distilled water withan error of less than «1 kg/m3.A uniaxial compression creep test was performed by using a
precision pressing machine (GMP-311V, Toshiba Machine) with-in a time span of about 8000 s. After reaching the test tempera-ture, a load of 420N was applied to a glass cylinder in a nitrogenatmosphere. Deformation of the sample height was recorded toan accuracy of 1.0¯m. The period of the recording was variedfrom 5 © 10¹3 to 1 s depending on the degree of deformationrate. Measurements were carried out at around the deformationtemperature.Ultrasonic velocities of longitudinal vL and transverse vT waves
were measured at room temperature by an ultrasonic pulse-echo method. A 10MHz longitudinal transducer and a 5MHztransverse transducer were used with a pulse transmitter/receiver(DPR300, JSR Ultrasonics). The cylinder sample for the creep testwas used for this ultrasonic measurement. Instantaneous shearmodulus G0, Poisson’s ratio ¯, instantaneous elastic modulus E0,and bulk modulus K0 were determined from both the velocitiesand the density of the sample as follows:
G0 ¼ μv2T ; ð1Þ
¯ ¼ 1
2
ðv2L � 2v2T Þðv2L � v2T Þ
; ð2Þ
E0 ¼ 2ð1þ ¯ÞG0; ð3ÞK0 ¼
E0
3ð1� 2¯Þ : ð4ÞThe details of the measurement and calculation of elastic
moduli are described elsewhere.10),11) These values were used forthe calculation of the creep function and the relaxation modulusin the analysis of the creep test.Dynamic viscoelastic measurement was performed by using a
viscoelasticy measuring instrument (DMS-6300, Seiko Instru-ments). The center of the beam sample, where the sample wasfixed, was modulated at thirteen different frequencies f : 0.01,0.02, 0,05, 0.1, 0.2, 0.5, 1, 2, 5, 10, 20, 50, and 100Hz.The recorded time histories of strain and stress were convertedto storage elastic modulus EB(½) and loss elastic modulusEBB(½),12),13) where ½ is angular frequency and ½ = 2³f.Measurements were carried out from room temperature to aroundthe deformation temperature with a heating rate of 0.3 °C/min.Injection tests were carried out by using the precision pressing
machine mentioned above. A flat glassy carbon mold (GC20SS,Tokai Carbon) and a glassy carbon mold having a narrow pore ofdiameter 200¯m and depth 700¯m were placed on the pressingarms. A cylinder sample was pressed by these molds with a loadof 1.5 kN under vacuum conditions at the temperature at which
the viscosity © of the sample becomes log© = 11.9. The injectedvolume was calculated from the surface shape which was ob-served by using a laser microscope (VK-8710, Keyence). Timedependence of the injected volume was recorded up to 600 s.Temperature dependence of the volume also measured at a fewtemperatures with a constant pressing period of 30 s.
3. Results
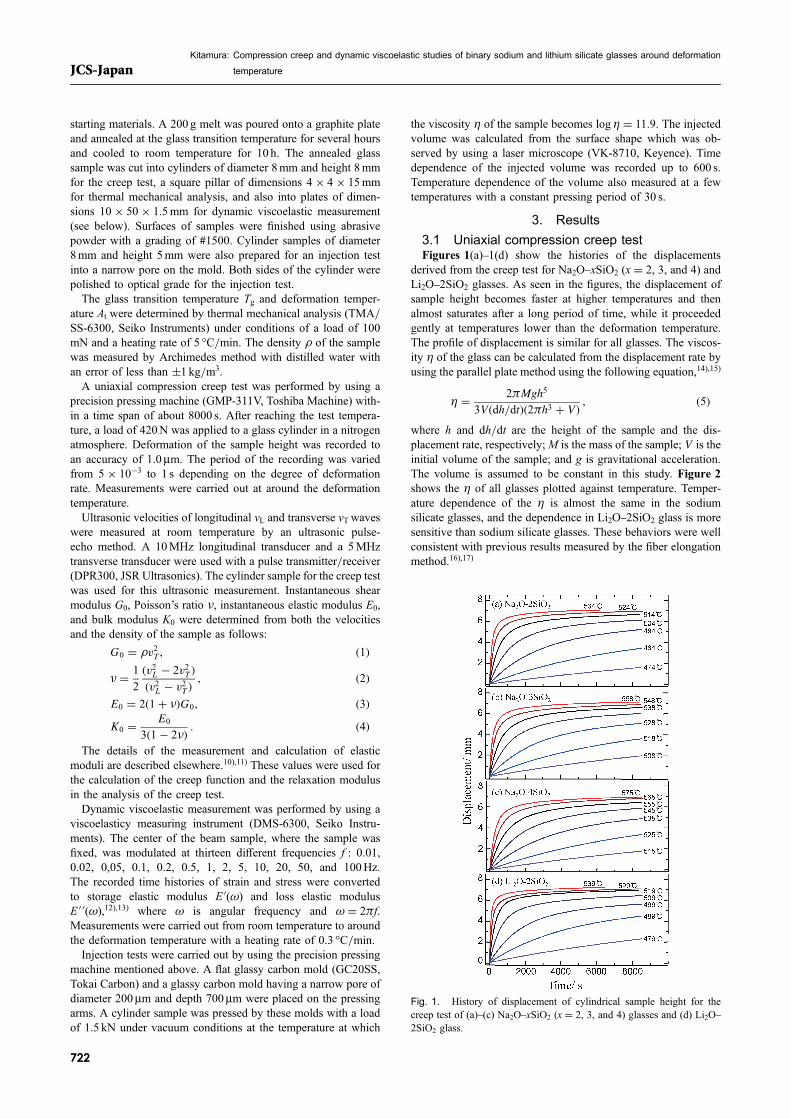
3.1 Uniaxial compression creep testFigures 1(a)1(d) show the histories of the displacements
derived from the creep test for Na2OxSiO2 (x = 2, 3, and 4) andLi2O2SiO2 glasses. As seen in the figures, the displacement ofsample height becomes faster at higher temperatures and thenalmost saturates after a long period of time, while it proceededgently at temperatures lower than the deformation temperature.The profile of displacement is similar for all glasses. The viscos-ity © of the glass can be calculated from the displacement rate byusing the parallel plate method using the following equation,14),15)
© ¼ 2³Mgh5
3V ðdh=dtÞð2³h3 þ V Þ ; ð5Þ
where h and dh/dt are the height of the sample and the dis-placement rate, respectively;M is the mass of the sample; V is theinitial volume of the sample; and g is gravitational acceleration.The volume is assumed to be constant in this study. Figure 2shows the © of all glasses plotted against temperature. Temper-ature dependence of the © is almost the same in the sodiumsilicate glasses, and the dependence in Li2O2SiO2 glass is moresensitive than sodium silicate glasses. These behaviors were wellconsistent with previous results measured by the fiber elongationmethod.16),17)
Fig. 1. History of displacement of cylindrical sample height for thecreep test of (a)(c) Na2OxSiO2 (x = 2, 3, and 4) glasses and (d) Li2O2SiO2 glass.
Kitamura: Compression creep and dynamic viscoelastic studies of binary sodium and lithium silicate glasses around deformation
temperatureJCS-Japan
722

3.2 Physical properties and mechanical prop-erties measured by the ultrasonic pulse-echomethod
The glass transition temperature Tg and deformation tem-perature At of the glass samples are listed on the left side ofTable 1 along with the density μ. The longitudinal and transversevelocities vL and vT at room temperature are listed in the middleof the table. The instantaneous shear modulus G0, Poisson’s ratio¯, instantaneous elastic modulus E0, and bulk modulus K0 arealso listed in the right columns in the table. The E0 and G0 forsodium system decrease with increasing Na2O content. Thevalues for Li2O2SiO2 glass are larger than those for sodiumsilicate glasses.
3.3 Dynamic viscoelastic measurementThe temperature dependence of the storage elastic modulus
EB(½) and loss elastic modulus EBB(½) are shown in Figs. 3(a)3(d) for Na2OxSiO2 (x = 2, 3, and 4) and Li2O2SiO2 glasses,respectively. Five frequencies, f = 0.01, 0.1, 1, 10, and 100Hz,are chosen as representative frequencies. Vertical lines indicatethe Tg and At for each glass. As seen in the figures, EB(½) starts todecrease and EBB(½) starts to increase slightly below the Tg, andsome fluctuation is observed at around At for only frequencieshigher than 1Hz. Figure 4 shows the EBB(½) curve for f = 1Hzbelow 400°C. A broad bump is observed at around 150300°C inEBB(½) of the sodium system, while it is not clear in the lithiumsystem. The frequency dependence of the storage elastic modulusEB(½) and loss elastic modulus EBB(½) are shown in Figs. 5(a)5(d) for Na2OxSiO2 (x = 2, 3, and 4) and Li2O2SiO2 glasses,respectively. Graphs on the left and right sides show EB(½) andEBB(½), respectively. The EB(½) is almost flat at low temperaturesand high frequencies, but decreases in the low frequency region.This decreasing tendency becomes remarkable at higher tempera-tures. Moreover, the decrease in EB(½) with increasing tempera-
Fig. 2. Temperature dependence of viscosity for Na2OxSiO2 (x = 2, 3,and 4) and Li2O2SiO2 glasses. The horizontal line indicates log© = 10.5for defining the reference temperature Tr of the master curve.
Table 1. Glass transition (Tg) and deformation (At) temperatures, density (μ) of Na2OxSiO2 (x = 2, 3, and 4) and Li2O2SiO2 glasses.Right columns represent ultrasonic wave velocities of longitudinal and transverse waves (vL and vT), instantaneous elastic moduli E0,instantaneous shear moduli G0, Poisson’s ratio ¯ and bulk modulus K0 calculated from the velocities at room temperature
SampleTg°C
At
°Cμ
kg/m3
vL vT E0
GPaG0
GPa¯
K0
GPa© 103m/s
Na2O2SiO2 459 514 2504 5.349 3.075 59.34 23.68 0.253 40.08Na2O3SiO2 472 538 2428 5.375 3.140 59.41 23.94 0.241 38.22Na2O4SiO2 489 555 2386 5.391 3.244 61.07 25.11 0.216 35.86
Li2O2SiO2 475 519 2350 6.278 3.693 79.02 32.05 0.235 49.88
Fig. 3. Temperature dependence of storage elastic modulus EB(½)[closed circles], loss elastic modulus EBB(½) [open circles], and tan ¤[closed triangles] of (a)(c) Na2OxSiO2 (x = 2, 3, and 4) glasses and(d) Li2O2SiO2 glass from 300°C to around the deformation tempera-ture. The data for modulation frequencies of 0.01, 0.1, 1, 10, and 100Hzare selected as representative examples. Vertical thin solid lines representthe glass transition Tg and deformation At temperatures as listed inTable 1.
Fig. 4. Loss elastic modulus EBB(½) of Na2O2SiO2 glass (frequency =1Hz) for the low temperature range.
Journal of the Ceramic Society of Japan 125 [10] 721-727 2017 JCS-Japan
723

ture is more remarkable in Li2O2SiO2 glass than sodium silicateglasses. EB(½) curves for Li2O2SiO2 glass shows an irregulardecrease only at 536 and 545°C, whereas EBB(½) shows almostthe same profile for sodium silicate glasses and has a broad peakat higher temperatures at a glance. Crystallization of the samplewas observed after measurement of Li2O2SiO2 glass.
3.4 Injection testA small round bump was formed on the glass surface after the
injection test. Figure 6 shows the dependence of the injectedvolume on pressing time for all glasses. The volume increasesmonotonically with pressing time and follows the same trajectoryfor Na2OxSiO2 (x = 2, 3, and 4) glasses. In contrast, the volumefor Li2O2SiO2 glass tends to be suppressed on the pressing for600 s, although all cylinder samples showed almost the same
height after pressing for each time as expected from macroscopicviscosity. However, the macroscopic viscosity © is expected tovary with temperature as shown in Fig. 2 for the test of constantpressing time. The injected volume, therefore, was plotted againstthe macroscopic © in Fig. 7. As seen in the figure, the volumeincreases acceleratingly with decreasing © for Na2OxSiO2 (x =2, 3, and 4) glasses, while it increases linearly for Li2O2SiO2
glass.
4. Discussion
4.1 Uniaxial compression creep testAs seen in Figs. 1(a)1(d), the displacements of the sample
exceed 50% of the initial height, so that true stress was intro-duced according to Arai’s method18) to avoid an estimation errorof the creep function J(t) due to large deformation. In the present
Fig. 5. Frequency dependence of (left side) storage elastic modulus EB(½) and (right side) loss elastic modulus EBB(½) of(a)(c) Na2OxSiO2 (x = 2, 3, and 4) glasses and (d) Li2O2SiO2 glass at several temperatures around the deformationtemperature (Table 1).
Fig. 6. Dependence of injected volume on pressing time (30, 60, 180,and 600 s) for Na2OxSiO2 (x = 2, 3, and 4) and Li2O2SiO2 glasses. Thecylindrical sample was pressed under a load of 1.5 kN at the temperaturewhere the viscosity © becomes log© = 11.9.
Fig. 7. Dependence of injected volume on the macroscopic viscosity ©of Na2OxSiO2 (x = 2, 3, and 4) and Li2O2SiO2 glasses. The cylindricalsample was pressed under a load of 1.5 kN for 30 s.
Kitamura: Compression creep and dynamic viscoelastic studies of binary sodium and lithium silicate glasses around deformation
temperatureJCS-Japan
724

study, the creep function J(t) was fitted by a 10-term powerfunction,
JðtÞ ¼ 1
E0
þX10i¼1
aiti; ð6Þ
for a conventional calculation of the shear relaxation modulusG(t) on the inverse Laplace transformation.19) In Eq. (6), t is thetime, and ai is the regression coefficient of the i-th term. Theinstantaneous creep function J0 at t = 0 was assumed by a recip-rocal Young’s modulus 1/E0. The G(t) of Na2O2SiO2 glass esti-mated by inverse Laplace transformation is shown in Fig. 8(a).Similar curves are obtained for Na2O3SiO2 and 4SiO2 glassesas seen in Figs. 8(b) and 8(c). The profile of G(t) is also similarfor Li2O2SiO2 glass [see Fig. 8(d)], but the temperature shift islarger than the sodium silicate system. As seen in these figures,taking logarithmic time for the horizontal axis, the relaxationmodulus at each temperature has almost the same profile, namelythe relaxation rate changes with temperature according to thetimetemperature superposition principle.20) Shift factor ln¡T
was obtained by superimposing the G(t) curve at each temper-ature onto a curve at the deformation temperature At. Figure 9shows the ln¡T plotted against the reciprocal of temperatureT. The factor obeys 1/T linearly well, that is, the activationenergy ¦H of structural relaxation can be estimated by usingNarayanaswamy’s equation, which is based on the Arrheniustype relationship as follows,21)
ln¡TðT Þ ¼�H
R
1
At
� 1
T
� �; ð7Þ
where R is the molar gas constant, 8.314 JK¹1mol¹1. The activa-tion energies ¦H estimated from the slope of the curve are441, 424, 417, and 449 Jmol¹1 for Na2OxSiO2 (x = 2, 3, and 4)and Li2O2SiO2 glasses, respectively. The energy decreases withdecreasing Na2O content for the sodium system, while Li2O2SiO2 glass shows higher energy than the sodium system. Inanalogy to polymer materials, slipping between network clustersseparated by modifying cations at non-bridging oxygen mightbe the main structural relaxation for inorganic glass.22) The in-crease in activation energy with Na2O content seems to contradictthe decrease in cluster size. Therefore, the concept of free vol-ume23),24) or variation in configurational entropy25) is expectedto relate to the increase in energy as discussed by Perez et al.26)
even though the mechanism is not still clear.The G(t) curve generally obeys the classical Maxwell model18)
which is composed of a linear combination of a spring (elasticterm) and a dashpot (viscous term). We therefore attempted to fitthe master curve of G(t) for all glasses to a 2-term Maxwell modelas shown in the schematic diagram in Fig. 10, where Gi, ©i (i = 1and 2) are the elastic and viscous terms, respectively, and G¨ isthe elastic term at the infinite limit. Relaxation time was calculatedby ¸i = Gi/©i. The model was fitted to the experimental G(t)curves by the least square method. It should be noted that theelastic and viscous term depend on the temperature. In order tocompare the compositional dependence among glass samples, wefixed the temperature at which the macroscopic © became log© =10.5 as the reference temperature Tr of the G(t) master curve. TheTr of each glass sample is listed in the right column of Table 2. Asa result of fitting, the parameters G1 and G2, ©1 and ©2 convergedrespectively to the same values. This implies the structural relaxa-tion can be described by a single model within the present tem-perature and time regions. The estimated elastic G1 and viscous ©1
terms and G¨ are listed in Table 2 against the ¸1. As seen in theresults, theG1 of the Li2O2SiO2 glass is larger than that of Na2OxSiO2 glasses. A similar tendency is found in the instantaneouselastic and shear moduli. These are consistent with the decrease incovalent character of the glass, which can be estimated by Sun’s
Fig. 9. Relationship between the shift factor ln¡T and reciprocal oftemperature T for Na2OxSiO2 (x = 2, 3, and 4) and Li2O2SiO2 glasses.
Fig. 8. Time dependence of shear relaxation moduli G(t) of (a)(c)Na2OxSiO2 (x = 2, 3, and 4) glasses and (d) Li2O2SiO2 glass.
Fig. 10. Schematic illustration of the two-term Maxwell model for therelaxation modulus.
Journal of the Ceramic Society of Japan 125 [10] 721-727 2017 JCS-Japan
725

report,27) although the composition dependence of the G1 is notseen in the sodium system. However, the ¸1 of Li2O2SiO2 glassis shorter than that of Na2O2SiO2 glass. Even though the molarconcentrations of glass modifying oxides are the same, it is foundthe structural relaxation at the temperature, which might be due toslipping between glass network clusters, easily proceeds in thelithium silicate glass.
4.2 Dynamic viscoelastic measurementFigure 4 shows the broad contour of the stored elasticity
EBB(½) found in the region around 150300°C for the sodiumsystem. Since it has a wide temperature region, this indicates apresence of some structural relaxation, which may have a widedistribution of activation energy. The change in magnitude, how-ever, is quite small. Forry6) and Rötger7) observed two peaks dueto energy loss by internal friction measurement in binary silicateglasses. A peak from ¹50 to 50°C was attributed to diffusionof alkali ions.28) Another peak was located around 150250°C.Coenen29) suggested the energy loss peak, which was found inthe region, originates from the motion of non-bridging oxygens.Taylor28) also suggested the possibility of proton motion as theorigin of this peak. Moreover, the higher temperature peak ininternal friction was not remarkable for the lithium silicateglass.30) This is similar to the present result in Li2O2SiO2 glass.The region at higher temperatures is consistent with the presentbroad contour in the EBB(½) curve, though the origin of the peakis still controversial and macroscopic large deformation is notexpected to occur by these mechanisms.In the high temperature region above 400°C, EB(½) starts
to decrease around the glass transition temperature as seen inFigs. 3(a)3(c). The degree of drop at Tg tends to increase withincreasing Na2O concentration. As mentioned above, structuralrelaxation is expected due to slipping between network clustersaround non-bridging oxygens terminated by modifying cations.Therefore, a decrease in covalent characteristic around the non-bridging oxygens should lead to a rapid decrease in the elasticityEB(½) at Tg. Complex fluctuations are also observed in EB(½) andEBB(½) at vibration frequencies above 1Hz. Since this regioncorresponds to that of super-cooled liquid state, the network clus-ters are expected to break down into smaller sizes. The energyfor breaking down the network is expected to vary, resultingin complex fluctuations. Thus subdivision of the network isexpected to grow complicatedly in frequency with increasingtemperature above Tg. At the temperature where the bond breakdown occurs, elastic properties do not obey the time (frequency)temperature superposition principle. Koide et al.13) introducedln¡T both in the horizontal and vertical axes to make a mastercurve. A ln¡T in the vertical axis may be reasonable, because
relaxations due to diffusion of alkali ions and motion of non-bridging oxygens continuously exist even at high temperatures,and because thermal expansion may affect the shift of elasticmodulus. The EB(½) and EBB(½) curves were superposed onto acurve at the glass transition temperature by using the usual hori-zontal and vertical ln¡T. Figures 11(a)11(d) show the mastercurves of EB(½) and EBB(½) for Na2OxSiO2 (x = 2, 3 and 4) andLi2O2SiO2 glasses. As seen in the figures, the EB(½) and EBB(½)curves for sodium silicate glasses show almost the same profile.This suggests that the mechanism of structural relaxation, that is,distribution of structural relaxation time is independent of theNa2O content. Some departures from the curve are observed onthe higher frequency side of the EBB(½) curves. These departurescorrespond to complex fluctuations around the deformationtemperature which is observed to have temperature dependence(Fig. 3) only at high frequencies as expected from the abovediscussion. Moreover, other departures in the lower frequencyregion are observed only in the EBB(½) curve of Li2O2SiO2
glass. These data correspond to the results at high temperatures.As seen in Fig. 3(d), the EB(½) and EBB(½) values are scatteredat high temperatures above 550°C. These departures at lowerfrequencies are deduced to be due to crystallization. Eliminatingsome anomalous departures, therefore, the broad profile in theEBB(½) is expected to be strongly related to structural relaxationdue to slipping among the network clusters. In contrast, Li2O2SiO2 glass shows a similar profile in the EBB(½) master curve.However, the low frequency side below around 10¹2Hz in theprofile is missing compared to the sodium silicate glasses as seenin Fig. 11(d). This indicates that structural relaxation of Li2O2SiO2 glass is expected to proceed faster than sodium silicateglasses. The faster relaxation is in good agreement with theshorter relaxation time found in the analysis of G(t). The fasterrelaxation is also well consistent with the shorter ¸1 of about 30 s(Table 2) for the lithium silicate glass.
4.3 Injection testAs seen in both Figs. 6 and 7, Na2OxSiO2 (x = 2, 3, and 4)
glasses shows almost the same behavior on the injected volumeagainst pressing time and viscosity. This is consistent with theseglasses having the same frequency dependence as seen in theEB(½) and EBB(½) master curves. The loss elastic modulus extendsto lower frequencies than 10¹2 Hz and has long relaxation times:75, 178, and 268 s (Table 2) for Na2OxSiO2 (x = 2, 3, and 4)glasses, respectively. Therefore, deformation is not expected inthe sodium silicate glasses in a short period of the injection testexcept 600 s. In contrast, the injection seems to proceed faster inLi2O2SiO2 glass than sodium silicate glasses. The EBB(½) curveof Li2O2SiO2 glass does not have the structural relaxation partbelow 10¹2 Hz and also has a shorter relaxation time of 29 s inthe Maxwell model (Table 2), that is, faster relaxation than 100 sorder relaxation. It is deduced that the lack of slow relaxationcorresponds well with the faster injection in longer pressingperiods above 30 s for Li2O2SiO2 glass.
5. Summary
Uniaxial compression creep test was performed at aroundthe deformation temperature and dynamic viscoelastic measure-ment was performed up to the temperature on binary Na2OxSiO2 (x = 2, 3, and 4) and Li2O2SiO2 glasses. Shear relaxationmodulus G(t) was expressed by a 1-term Maxwell model for boththe glass systems. Relaxation time for structural deformation wascompared for all glasses at the temperature Tr where the macro-scopic viscosity © becomes log© = 10.5. The relaxation time
Table 2. Optimized parameters, elastic term G1, viscous term ©1, relaxa-tion time ¸1, and G¨ for Na2OxSiO2 (x = 2, 3, and 4) and Li2O2SiO2
glasses. The master curve of relaxation shear moduli G(t) was analyzedusing a two-term Maxwell model (Fig. 10). However, the parameters G1
and G2, ©1 and ©2 converged to the same values. The reference tem-peratures for the master curve Tr, at which the macroscopic viscosity ©becomes log© = 10.5, are also listed in the right column
SampleG1
GPalog©1
log(dPa·s)¸1sec
G¨
MPaTr°C
Na2O2SiO2 23.0 12.2 75 337 504Na2O3SiO2 24.3 12.6 178 368 529Na2O4SiO2 22.4 12.8 268 481 550
Li2O2SiO2 31.5 12.0 29 264 519
Kitamura: Compression creep and dynamic viscoelastic studies of binary sodium and lithium silicate glasses around deformation
temperatureJCS-Japan
726

¸1 increased with decreasing Na2O content, which correspondsto decreasing size of network cluster units. In contrast, the ¸1 ofLi2O2SiO2 glass was about one-third of that of Na2O2SiO2
glass. The master curve of the loss elastic modulus EBB(½)showed unique frequency contours in all sodium silicate glasses,while the EBB(½) of lithium silicate showed a remarkable decreasein the low frequency side of the contour. This lack of slow relaxa-tion was well consistent with the comparably lower viscous term©1 in the Maxwell model found in the creep test, which indi-cated easier slipping relaxation than the sodium system. Injectiontesting into a narrow pore showed faster saturation of the injectedvolume for the lithium silicate glass. This also supported the lackof the slower relaxation process in the lithium system.
Acknowledgement This work was carried out as a study ofCSTI, SIP Project (Development of Advanced Glass ProcessingTechnologies).
References1) T. Tamura, M. Umetani, K. Yamada, Y. Tanaka, K. Kintaka, H.
Kasa and J. Nishii, Appl. Phys. Express, 3, 112501 (2010).2) T. Mori, K. Hasegawa, T. Hatano, H. Kasa, K. Kintaka and J.
Nishii, Jpn. J. Appl. Phys., 47, 47464750 (2008).3) N. Yamashita, T. Suetsugu, T. Einishi, K. Fukumi, N. Kitamura
and J. Nishii, Phys. Chem. Glasses, 50, 257261 (2009).4) N. Kitamura, K. Fukumi, J. Nakamura, T. Hidaka, T. Ikeda, H.
Hashima and J. Nishii, J. Nonlinear Opt. Phys., 19, 753759(2010).
5) N. Kitamura, K. Fukumi, K. Kintaka and T. Akai, Key Eng.Mat., 702, 96100 (2016).
6) K. E. Forry, J. Am. Ceram. Soc., 40, 9094 (1957).7) H. Rötger, Glastech. Ber., 31, 5460 (1958).8) A. S. Argon, J. Appl. Phys., 39, 40804086 (1968).9) S. N. Crichton and S. M. Rekhson, J. Non-Cryst. Solids, 142,
133147 (1992).
10) J. Krautkramer and H. Krautkramer, “Ultrasonic Testing ofMaterials”, 4th Fully Revised Edition, Springer-Verlag, Berlin(1990) pp. 167221.
11) A. Kato, M. Nagao, A. Sakuda, A. Hayashi and M.Tatsumisago, J. Ceram. Soc. Jpn., 122, 552555 (2014).
12) M. L. Williams, R. F. Landel and J. D. Ferry, J. Am. Chem.Soc., 77, 37013707 (1955).
13) M. Koide, M. Hada and K. Matsushita, J. Ceram. Soc. Jpn.,114, 643647 (2006).
14) A. N. Gent, Br. J. Appl. Phys., 11, 8587 (1960).15) E. H. Fontana, Ceram. Bull., 49, 594597 (1970).16) J. P. Poole, J. Am. Ceram. Soc., 32, 230233 (1949).17) J. P. Poole and M. Gensamer, J. Am. Ceram. Soc., 32, 220229
(1949).18) M. Arai, Y. Kato and T. Kodera, J. Therm. Stresses, 32, 1235
1255 (2009).19) T. Hosono, “Fast Laplace Transform by Basic”, Kyoritsu
Shuppan (1984) [in Japanese].20) R. Li, Mat. Sci. Eng. A-Struct., 278, 3645 (2000).21) O. S. Narayanaswamy, J. Am. Ceram. Soc., 54, 491498
(1971).22) M. Imaoka and S. Suzuki, Yogyo-Kyokai-shi, 90, 440447
(1982) [in Japanese].23) J. D. Ferry, “Viscoelastic properties of polymers”, John Wiley,
London (1970).24) M. H. Cohen and D. Turnbull, J. Chem. Phys., 31, 11641169
(1959).25) G. Adam and J. H. Gibbs, J. Chem. Phys., 43, 139146 (1965).26) J. Perez, B. Duperray and D. Lefevre, J. Non-Cryst. Solids, 44,
113136 (1981).27) K. H. Sun, J. Am. Ceram. Soc., 30, 277281 (1947).28) T. D. Taylor and G. E. Rindone, J. Non-Cryst. Solids, 14, 157
164 (1974).29) M. Coenen, “Physics of Non-Crystalline Solids”, North-
Holland, Amsterdam (1965) p. 444.30) J. Shelby and D. E. Day, J. Am. Ceram. Soc., 52, 169173
(1969).
Fig. 11. Master curves of (left side) storage elastic modulus EB(½) and (right side) loss elastic modulus EBB(½) of (a)(c)Na2OxSiO2 (x = 2, 3, and 4) glasses and (d) Li2O2SiO2 glass at each glass transition temperature (Table 1) as a standardtemperature. The curves were obtained by the time-temperature superposition principle using data shown in Fig. 5.
Journal of the Ceramic Society of Japan 125 [10] 721-727 2017 JCS-Japan
727